Embed Size (px)
Citation preview

University of Calgary
PRISM: University of Calgary's Digital Repository
Graduate Studies The Vault: Electronic Theses and Dissertations
2014-01-29
Development and Validation of the Quality of Trauma
Care Patient-Reported Experience Measure
Bobrovitz, Niklas
Bobrovitz, N. (2014). Development and Validation of the Quality of Trauma Care Patient-Reported
Experience Measure (Unpublished master's thesis). University of Calgary, Calgary, AB.
doi:10.11575/PRISM/25649
http://hdl.handle.net/11023/1322
master thesis
University of Calgary graduate students retain copyright ownership and moral rights for their
thesis. You may use this material in any way that is permitted by the Copyright Act or through
licensing that has been assigned to the document. For uses that are not allowable under
copyright legislation or licensing, you are required to seek permission.
Downloaded from PRISM: https://prism.ucalgary.ca
!
UNIVERSITY OF CALGARY
Development and Validation of the Quality of Trauma Care
Patient-Reported Experience Measure
by
Niklas Bobrovitz
A THESIS
SUBMITTED TO THE FACULTY OF GRADUATE STUDIES
IN PARTIAL FULFILMENT OF THE REQUIREMENTS FOR THE
DEGREE OF MASTER OF SCIENCE
DEPARTMENT OF COMMUNITY HEALTH SCIENCES
CALGARY, ALBERTA
JANUARY, 2014
© Niklas Bobrovitz 2014

!ii!
Abstract
To deliver patient-centered injury care, patient perspectives must be incorporated into quality
measurement and improvement. Therefore, the purpose of this thesis was to develop and validate
a measure of patient experience for use as a quality improvement tool in injury care.
A draft survey measure of patient injury care experience was revised using cognitive interviews
with 30 injury patients/surrogates. A multi-site prospective cohort study of 400
patients/surrogates was conducted and provided evidence of the measure's validity, reliability,
and feasibility of implementation. Analysis of responses to the free-text items on the measure
indicated that qualitative data obtained from open-ended items may be a valuable supplement to
the quantitative component of the measure.
The results of this thesis show that the Quality of Trauma Care Patient-Reported Experience
Measure (QTAC-PREM) is valid and reliable and could be used as a tool to guide quality
improvement efforts.

!iii!
Acknowledgements
I would like to thank my supervisory committee (Dr. Tom Stelfox, Dr. Maria Santana, Dr. John
Kortbeek, and Dr. Theresa Kline) for all their guidance and support during my graduate studies.
I want to bring attention to the support and efforts of the following people:
Jamie Boyd and Dr. Mauricio Ferri for volunteering their time to act as reviewers/coders for the
completion of the qualitative study;
Dr. Kevin Martin, Theresa Pasquotti, Dr. Sandy Widder, and Heather Allen for recruiting
patients in Lethbridge and Edmonton;
Sue-Ann Nodder, Rachel Burton, Christine Vis, and the staff on Unit 44 at Foothills Medical
Centre for supporting the study and helping me recruit patients;
Michelle Meracdo for providing patient data from the trauma registry;
Dr. Peter Faris for providing guidance on statistical analysis.
I also want to thank Alberta Innovates Health Solutions, the Health Quality Council of Alberta,
and the International Society for Quality of Life Research for providing funding to support my
research.
Finally, I want to thank my mum (Jennifer), dad (Gary), and sister (Tasha) for supporting me
through thick and thin.

!iv!
Table of Contents
Abstract............................................................................................................................................ii
Acknowledgements........................................................................................................................iii
Table of Contents............................................................................................................................iv
List of Tables................................................................................................................................viii
List of Figures and Illustrations.......................................................................................................x
List of Symbols, Abbreviations, Nomenclatures............................................................................xi
Chapter 1: Overview......................................................................................................................1
Chapter 2: Background and Problem..........................................................................................2
2.1 Burden of Injury ............................................................................................................2
2.2 Quality of Injury Care....................................................................................................2
2.3 Defining Quality of Care...............................................................................................3
2.4 Measurement and Quality Improvement.......................................................................4
2.5 The Patient Perspective: a Gap in Trauma Quality of Care
Measurement and Improvement....................................................................................4
2.6 Measuring Patient Experiences in Healthcare...............................................................6
2.7 Overall Objective: Close the Gap in Trauma Quality of
Care Measurement and Improvement.............................................................................7
2.8 Conceptual Framework..................................................................................................8
Chapter 3: Foundational Work (Pre-Graduate) ........................................................................9
Chapter 4: Design of Master's Thesis Projects.........................................................................11
Chapter 5: The Use of Cognitive Interviews to Revise the Quality of Trauma Care
Patient- Reported Experience Measure (Sub-Study 1) ...........................................................12

!v!
5.1 Background..................................................................................................................12
5.2 Methods........................................................................................................................13
5.2.1 Purpose of the Cognitive Interview Guide....................................................14
5.2.2 Recruitment and Data Collection..................................................................15
5.3 Results..........................................................................................................................17
5.3.1 The Six Broad Issues Identified....................................................................19
5.4 Discussion ...................................................................................................................34
5.5 Limitations...................................................................................................................36
5.6 Conclusions..................................................................................................................36
Chapter 6: Quantitative Validation of the Quality of Trauma Care Patient-Reported
Experience Measure (Sub-Study 2) ...........................................................................................37
6.1 Background..................................................................................................................37
6.2 Specific Objectives .....................................................................................................38
6.3 Methods/Design...........................................................................................................38
6.3.1 Recruitment and Data Collection .................................................................39
6.3.2 Sample size...................................................................................................41
6.3.3 Data Analysis................................................................................................41
!!!!!!!!!!!!!!!!!!!!!!!!!!!!!!!!!!!!!!!6.3.3.1 Psychometric assessments...............................................................41
6.3.3.2 Summary Scoring.............................................................................48
6.3.3.3 Acute Care and Post-Acute Care Global Rating Comparison.........49
6.4 Results..........................................................................................................................50
! ! 6.4.1 Psychometric Assessments...........................................................................53
6.4.2 Summary Scores...........................................................................................66
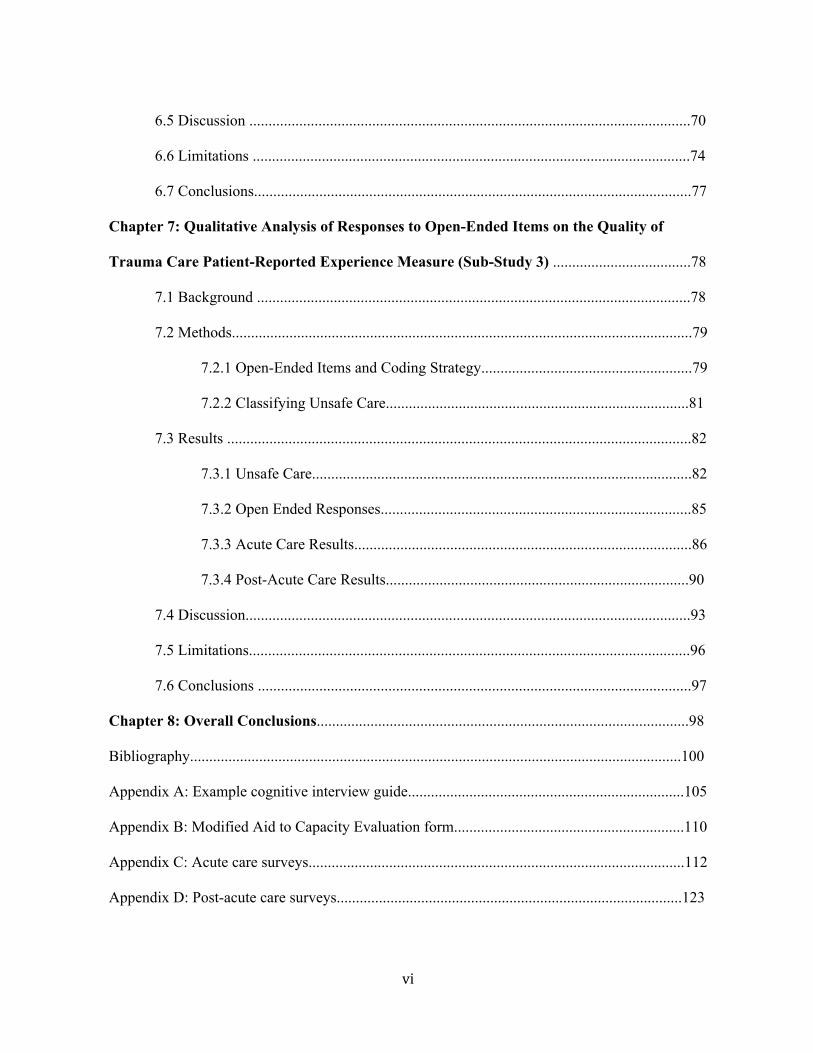
!vi!
6.5 Discussion ...................................................................................................................70
6.6 Limitations ..................................................................................................................74
6.7 Conclusions..................................................................................................................77
Chapter 7: Qualitative Analysis of Responses to Open-Ended Items on the Quality of
Trauma Care Patient-Reported Experience Measure (Sub-Study 3) ....................................78
7.1 Background .................................................................................................................78
7.2 Methods........................................................................................................................79
7.2.1 Open-Ended Items and Coding Strategy.......................................................79
7.2.2 Classifying Unsafe Care...............................................................................81
7.3 Results .........................................................................................................................82
7.3.1 Unsafe Care...................................................................................................82
7.3.2 Open Ended Responses.................................................................................85
7.3.3 Acute Care Results........................................................................................86
7.3.4 Post-Acute Care Results...............................................................................90
7.4 Discussion....................................................................................................................93
7.5 Limitations...................................................................................................................96
7.6 Conclusions .................................................................................................................97
Chapter 8: Overall Conclusions.................................................................................................98
Bibliography................................................................................................................................100
Appendix A: Example cognitive interview guide........................................................................105
Appendix B: Modified Aid to Capacity Evaluation form............................................................110
Appendix C: Acute care surveys..................................................................................................112
Appendix D: Post-acute care surveys..........................................................................................123
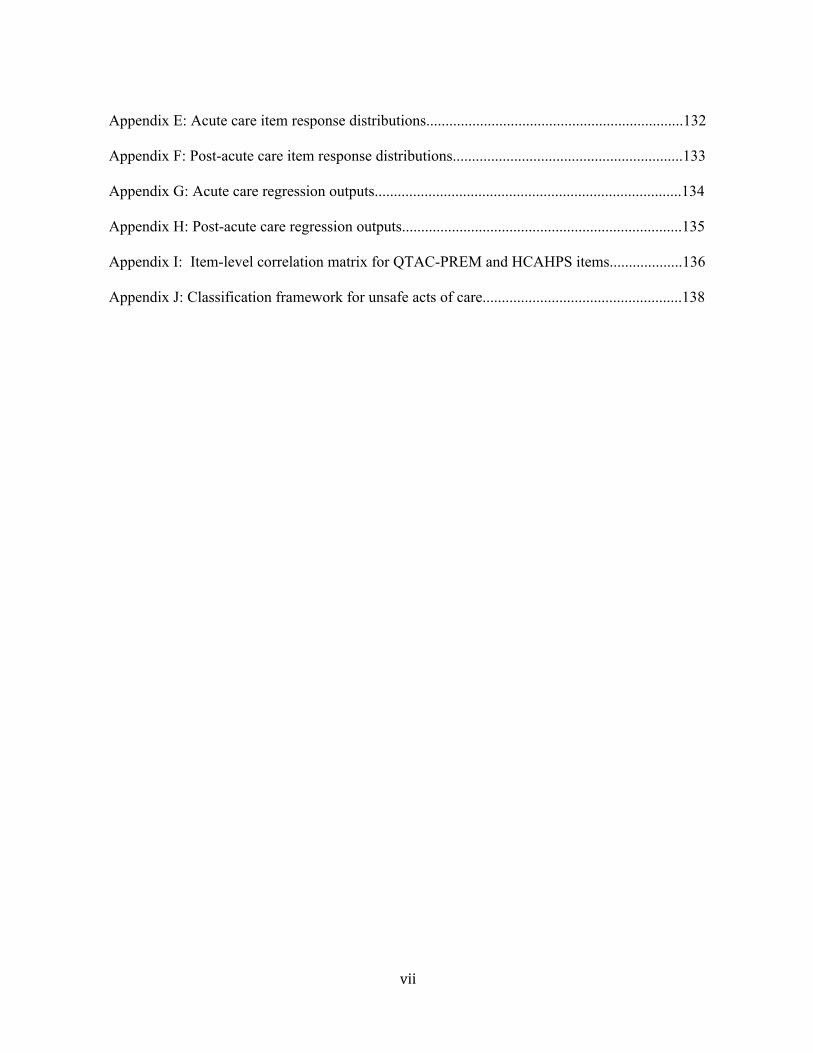
!vii!
Appendix E: Acute care item response distributions...................................................................132
Appendix F: Post-acute care item response distributions............................................................133
Appendix G: Acute care regression outputs................................................................................134
Appendix H: Post-acute care regression outputs.........................................................................135
Appendix I: Item-level correlation matrix for QTAC-PREM and HCAHPS items...................136
Appendix J: Classification framework for unsafe acts of care....................................................138

!viii!
List of Tables
Table 1. Conceptual Framework for Classifying a Measure of Patient Experiences
with Injury Care...............................................................................................................................8
Table 2. Cognitive interview participant characteristics................................................................18
Table 3. Items that participants did not have the information to answer.......................................23
Table 4. Items that had ambiguous terminology or were inconsistently interpreted.....................24
Table 5. Items that did not measure the intended construct...........................................................27!
Table 6. Items that included assumptions about healthcare processes..........................................28
Table 7. Items measuring non-priority aspects of care..................................................................29!
Table 8. Items with redundant content and those that overlapped with
content on the HCAHPS survey....................................................................................................30
Table 9. Additional content identified as relevant for injury patients...........................................31
Table 10. Prospective cohort study participant characteristics......................................................52
Table 11. Acute care summary of results of psychometric analyses.............................................54
Table 12. Post-acute care summary of results of psychometric analyses......................................55!
Table 13. Results of the acute care factor analysis........................................................................57
Table 14. Result of the post-acute care factor analysis..................................................................58
Table 15. Internal consistency for survey domains and each overall measure..............................59
Table 16. Acute care item-to-domain correlations and domain/item to global correlations.........61
Table 17. Post-acute care item-to-domain score correlations and domain/item
to global correlations......................................................................................................................62
Table 18. Acute care test-retest reliability estimates.....................................................................64
Table 19. Post-acute care test-retest reliability estimates..............................................................65

!ix!
Table 20. Spearman correlation coefficients between QTAC and HCAHPS
domains/stand alone items.............................................................................................................66
Table 21. Acute care item and domain summary scores...............................................................68
Table 22. Post-acute care item and domain summary scores........................................................69
Table 23. Description of the 61 unsafe acts of care perceived by participants..............................84
Table 24. Description of outcomes of the 61 unsafe acts of care perceived by participants........85
Table 25. Themes commented on by more than 25% of acute care participants and major
subthemes.......................................................................................................................................87
Table 26. Themes commented on by more than 25% of post-acute care participants and major
subthemes.......................................................................................................................................91!

!x!
List of Figures and Illustrations
Figure 1. Participant enrollment and study flow............................................................................51
!xi!
List of Symbols, Abbreviations, Nomenclatures
QTAC-PREM: Quality of Trauma Care Patient-Reported Experience Measure
ACE: Aid to capacity evaluation
ISS: Injury severity score
HCAHPS: Hospital Consumer Assessment of Healthcare Providers and Systems
ICC: Intraclass correlation coefficient
!
Chapter 1: Overview
Patient experience is a crucial component of the quality of injury care. To deliver injury care that
meets the needs of patients we must understand their experiences with care. Currently, there are
no valid and reliable tools to obtain patient experiences or patient derived assessments of injury
care (1-4).
The research work described in this thesis dissertation is part of an ongoing effort to develop a
valid and reliable measure of patient experiences with injury care. The ultimate goal is to
produce a measurement tool for use in quality improvement.
This thesis contains three sequentially completed projects;
1. Refinement of a draft measure using cognitive interviewing in preparation for survey validity
and reliability testing;
2. Quantitative assessment of the measure's validity, reliability, and feasibility of
implementation;
3. Qualitative assessment of participant responses to open-ended questions about their injury care
experiences to assess the feasibility and value of including a qualitative component on the final
survey tool.
!2!
Chapter 2: Background and Problem
2.1 Burden of Injury
Injury is one of the leading causes of morbidity and mortality in most countries around the world.
Globally, injuries affect 700 million people each year, including 30 million North Americans and
two million Canadians, and result in nearly five million deaths (5). Injuries are the leading cause
of quality years of life lost and preventable morbidity and mortality in North America (5, 6) due
to the fact they occur most often in young, working-age males (age 15 to 44). In Canada, injuries
are the leading cause of death for all people under 44 years of age (7). In addition to the burden
of death and morbidity, there is also a large financial burden associated with injury. Direct and
indirect medical costs due to injury in Canada totaled $12.7 billion dollars in 1998 (7).
2.2 Quality of Injury Care
Although the healthcare system provides injury patients with vital treatment, assessments of the
quality of injury care demonstrate that care often fails to meet established standards (8) and the
best treatments may not always be used (8). Studies show up to half of all critically injured
patients do not receive recommended care (9), adverse events are common (10), and injury care
may not meet the needs of all patients. For example, patients with traumatic brain injuries, as
well as their families, report deficits in information provided by health care professionals (10-
13). This suggests that the quality and outcomes of injury care may benefit from evidence-based
quality improvement.
While current evaluations of care are cause for concern, there may be additional quality issues
that have not yet been identified. To date, assessments of injury care have primarily focused only
!3!
on a portion of the 'quality picture'. Most measures of injury care quality have targeted the
clinical effectiveness and timeliness of care in the pre-hospital and hospital setting (4). However,
quality in healthcare is composed of more than clinical effectiveness and timeliness.
2.3 Defining Quality of Care
The Institute of Medicine (IOM) broadly defines quality of care as “the degree to which health
services for individuals and populations increase the likelihood of desired health outcomes and
are consistent with current professional knowledge” (8). Further, the IOM identifies six specific
characteristics of high-quality healthcare which can be used to evaluate the quality of care: safe
(avoiding injuries to patients from the care that is intended to help them); effective (providing
services based on scientific knowledge to all who could benefit, and refraining from providing
services to those not likely to benefit); patient-centered (providing care that is respectful of and
responsive to individual patient preferences, needs, and values); timely (reducing waits and
sometimes harmful delays for both those who receive and those who give care); efficient
(avoiding waste, including waste of equipment, supplies, ideas and energy); and equitable
(providing care that does not vary in quality because of personal characteristics such as gender,
ethnicity, geographic location, and socioeconomic status). These characteristics or 'dimensions'
are operational, tangible components that represent the broad construct "quality of care".
Although many quality of care definitions of have been offered, most identify similar dimensions
(8, 14, 15). The IOM has identified their six characteristics as key aims for quality improvement
(8) and suggests that health systems that make gains in these areas will better meet patient needs.
Therefore, high-quality injury care means excellence in all key dimensions of quality.
!4!
2.4 Measurement and Quality Improvement
Quality improvement can be defined as an ongoing process to achieve care that is safe, effective,
patient-centered, timely, efficient, and equitable. A pre-requisite to quality improvement is valid
and reliable information on the key dimensions of quality. Quality of care measures can be used
to identify problem areas, to aid in tailoring interventions to correct care issues, and to track
subsequent gains. For example, The American College of Surgeons Committee on Trauma has
designed comprehensive Performance Improvement and Patient Safety Programs that aim to
standardize practice and improve clinical outcomes (safe, effective, efficient) (16). Without valid
and reliable data to track changes in key metrics (e.g. risk adjusted percentage of patients with
abdominal compartment syndrome), before and after implementation of new strategies to
improve care (e.g. numbering crystalloid bags as part of standard protocols for resuscitation),
these programs would be ineffective. The availability of quality indicators measuring clinical
effectiveness, safety, and efficiency has enable their success. Unfortunately, tools to measure
other key dimensions of injury care quality, particularly patient-centeredness, are lacking. This is
a barrier to achieving the delivery of high-quality injury care.
2.5 The Patient Perspective: a Gap in Trauma Quality of Care Measurement and
Improvement
Instruments to measure patient experiences or obtain patient-derived assessments of care have
been developed in select areas of healthcare. For example, the Consumer Assessment of
Healthcare Providers and Systems Surveys (CAHPS) program (of the U.S. Agency for
Healthcare Research and Quality) has developed valid and reliable measures of patient
experiences with ambulatory (primary care, home care) and in-hospital medical-surgical
!5!
(excluding injury) care (HCAHPS) (17). These consumer-assessment of care measures have been
used extensively in the United States and have been successfully used to identify deficits in care
delivery and support quality improvement (18-20). For example, a study of eight collaborative
medical groups focused on patient-centered care in Minnesota successfully used a modified
CAHPS survey measure to identify opportunities for care improvement, develop quality
improvement interventions, and produce measurable improvements in patient experience (18,
20).
Despite the central importance of patient perspectives of care and the demonstrable value of
patient-centered measures, to date there has been limited progress in incorporating patient
perspectives into quality measurement in injury care. Only a few instruments have been
developed for assessing patients’ experiences or satisfaction with injury services.
Most of the studies measuring patient perspectives of quality in injury care have used non-
validated measures to assess patient perspectives of specific interventions or injury treatments
(21-23). However, some studies have used validated non-injury specific surveys. For example,
the Hospital Version of the CAHPS has been used in a randomized controlled trial of orthopedic
trauma patients as the primary outcome measure assessing a communication based intervention
to improve overall in-patient experience (24). A small number of reliable and valid injury
focused measures exist, but were developed for only specific patient populations (e.g. head
injured patients) and specific injury care services (e.g. rehabilitation services) (22, 23, 25). For
example, surveys of traumatic brain injured patients and their families have highlighted deficits
in care related to information and follow-up (12, 13). While this is an important start to
measuring patient experiences with injury care, assessments of the broader population of injured

!6!
patients are needed. Currently, there are no published measures designed to capture the overall
healthcare experiences of patients with major injuries and as a result, it is not possible to
comprehensively evaluate the quality of care provided to injured patients (3). The need for a
robust patient experience measure for injury care has been identified in the literature (3).
2.6 Measuring Patient Experiences in Healthcare
A common method for capturing the patient perspective is survey based measures (26). Survey
measures are relatively easy to administer, can be inexpensive, and data can be obtained from
large samples fairly quickly. Surveys can be self-complete (mail-out or on-site administration) or
interview based (telephone interview or in-person). Surveys that participants self-complete have
the added advantage of allowing respondents time to provide their assessment of care when it is
convenient for them to do so, and grants respondents time to think about the questions they are
asked.
Survey items measuring patient experiences consist of a description of an event and an
evaluation of how frequently the event occurred (e.g. report: did you receive written discharge
instructions?) or a patient evaluation of an aspect of care (e.g. evaluation/rating: were your
discharge instructions easy to understand?) (26, 27). Patient experience is distinct from patient
satisfaction and may be more useful for the purposes of quality improvement in healthcare (28).
Although satisfaction is a type of patient evaluation (e.g. how satisfied were you with your
discharge instructions?), being satisfied with care does not imply that all aspects of care were
delivered successfully (28). Studies show that patients will identify problems in their care but
still report being 'satisfied'. Patient experience questions are often more detailed than satisfaction

!7!
questions and target specific, actionable aspects of care, which lend themselves well to quality
improvement.
A key challenge to developing a valid and useful patient experience measure is to identify
healthcare events that are important to patients and relevant to patients’ perceptions of the quality
of care. Patients identify multiple factors when describing the 'quality' of care (29). Although
similar broad domains of care are consistently identified by different patient groups, there is
variation between patient populations in the specific events and aspects of care most relevant to
their perceptions of quality (30). Therefore, surveys designed for specific conditions and patients
are necessary as general instruments may not be specific enough to pinpoint areas for quality
improvement.
2.7 Overall Objective: Close the Gap in Trauma Quality of Care Measurement and
Improvement
The research work described in this thesis dissertation is part of an ongoing effort to develop the
first valid and reliable measure of patient experiences with overall injury care. The specific
objective of my Master's thesis was to revise a draft version of the survey and assess the revised
measure's validity, reliability, and feasibility of implementation. The ultimate goal is to produce a
measure that could be feasibly used in local quality assessments, for comparisons of injury care
quality between trauma centres, and as an outcome measure in studies of injury care.
The tool could then be used to guide quality improvement efforts.

!8!
2.8 Conceptual Framework
The measure of patient experiences produced in this thesis can be conceptualized using a
framework which merges the Institute of Medicine's six aims for quality improvement (8) (six
dimensions of quality) and the components of a modern trauma system (Table 1). The measure
could be considered an assessment of the patient-centeredness of care at the pre-hospital,
hospital, post-hospital and secondary prevention components of care.
Table 1. Conceptual Framework for Classifying a Measure of Patient Experiences with Injury Care Institute of Medicine Six Aims for Quality Improvement
(Six Dimensions of Quality) Trauma System
Components
Safe Effective Patient -Centered Timely Efficient Equitable
Pre-Hospitals X Hospital X
Post-Hospital X Secondary Prevention
X

!9!
Chapter 3: Foundational Work (Pre-Graduate)
I completed foundational work as part of my undergraduate thesis to generate a draft version of
the survey. Items for the survey were developed using a two-step approach that included a
structured literature search and focus groups with key trauma stakeholders (patients, family
members, trauma care providers). The draft survey was split into two parts and included a 46-
item acute care component and a 27-item post-acute care component. The survey was pre-tested
and subsequently pilot tested at a level 1 trauma centre (Foothills Medical Centre). The acute
survey was offered to 105 in-patients of which 81 self-completed the paper based survey (77%).
The post-acute survey was offered to 60 outpatients via telephone interview 1-7 months post-
discharge and 53 completed the interview (88%). Item scores were tabulated with descriptive
statistics. Responses to the items were correlated to the overall ratings of care using spearman
correlation coefficients as an indicator of construct validity. Open-ended questions at the end of
the survey were analyzed using thematic analysis. Comments on the survey content, instructions,
and response scales were encouraged and recorded by the research coordinator and first author
(NB). Key lessons from this development and pilot phase were that: (1) measuring patient
experience was feasible; (2) enrolling bereaved family members was not feasible using the same
strategy as for the surviving trauma population; (3) there was significant variation in scores for
several items, which suggests those areas could be targeted for improvement; (4) several items
demonstrated low correlations with the overall ratings of care and needed to be revised or
eliminated; (5) several items showed moderate to high correlations with the overall ratings of
care indicating some construct validity; (6) some participants expressed confusion over the
wording of several items indicating they needed to be revised or eliminated; (7) some
participants suggested the response scale should be changed throughout the survey; (8)

!10!
qualitative results helped corroborate survey content, helped to clarify variations in scores for
items, and identified new content that could be added to the survey in the form of close-ended
items.
The results of this work were published in the Journal of Trauma (1) and informed the design of
my Master's thesis.

!11!
Chapter 4: Design of Master's Thesis Projects
My Master's thesis was informed by the pilot study and designed to consist of three parts:
1. Refinement of the preliminary version of the survey measure using cognitive interviewing
in preparation for a multi-centre validation study;
2. Quantitative assessment of measure validity, reliability, and feasibility of
implementation in multiple trauma centres;
3. Qualitative assessment of participant responses to open-ended questions about their injury
care experiences to assess the feasibility and value of including a qualitative component
on the final survey tool.
These three "sub-studies" are presented sequentially in Chapters 5, 6, and 7.
All three studies received approval from the Conjoint Health Research Ethics Board at the
University of Calgary (ethics I.D.: E-23535, E-24364).
!12!
Chapter 5: The Use of Cognitive Interviews to Revise the Quality of Trauma Care Patient-
Reported Experience Measure (Sub-Study 1)
5.1 Background
Patient experience is a crucial component of the quality of care. However, efforts to incorporate
patient perceptions into quality assessments in injury care have been limited (4). Therefore, we
developed and pilot-tested the first survey to measure patient experiences with overall injury care
(1).
The pilot-test revealed several issues requiring further investigation before large scale validity
and reliability testing could be completed. These issues included: confusion over the wording of
some items, participants expressing difficulty to answer certain items, and suggestions that the
response scale should be changed. In addition, a select number of items were flagged for possible
deletion due to limited content validity.
Survey development is a multi-step process. Surveys often undergo several rounds of pre-testing,
pilot-testing, and revision to identity problems with survey items, response scales, and
instructions. There are several methods available for pre-testing including focus groups and
expert evaluations of content validity and clinical sensibility (31). However, cognitive testing has
become a common method of survey pre-testing in the health sciences and has been used in the
development of many well-validated surveys including a survey to identify patients suffering
from gastro-oesophageal disease (32, 33), a survey measuring public understanding of asthma
and its management (34), and several of the CAHPS survey measures including those targeting

!13!
Medicare recipients' understanding of their health plan (35, 36) and patient experiences with
hospital care (35, 37).
Cognitive testing is a combination of cognitive psychology and survey theory. Fundamentally,
participants’ cognitive processes are explored through interviews during (concurrent) or shortly
after (retrospective) the completion of the draft survey measure. The purpose is to identify
components of a survey that may elicit response error by understanding how participants
perceive and interpret items, instructions, and response options, and how they recall information
and formulate their answers to items (31). It is recommended that cognitive interviewing be a
part of the survey development process in combination with other methods of validity and
reliability testing to produce the best results.
Therefore, I opted to use cognitive interviews to revise my survey measure entitled the "Quality
of Trauma Care Patient-Reported Experience Measure" (QTAC-PREM) in preparation for multi-
centre validity and reliability testing. The objective of this study was to conduct cognitive
testing of my survey through interviews with injured patients and family members of
injured patients, and use the results to refine the survey into a parsimonious set of items
that function as intended.
5.2 Methods
Cognitive interviews are semi-structured and use pre-written guides to help elicit information
from participants. In concurrent interviewing, the interviewer is present while the participant
completes the survey. Participants are asked to read each item aloud, verbalize their
!14!
interpretation of the item and response option wording, and explain the cognitive processes they
go through to answer the item. The interviewer may ask about interpretations of specific words
or instructions, the type of information recalled to answer an item, and can ask further follow-up
questions about any issues identified during survey completion. In retrospective interviewing, the
participant completes the measure on his or her own and the interviewer asks questions post-hoc.
5.2.1 Purpose of the Cognitive Interview Guide
I wanted to ensure that survey items were clear, unambiguous, and interpreted similarly by
different respondents; that respondents had the ability to provide an answer to each item; that
response options were grammatically and logically appropriate for the items; and that
instructions were clear and enabled respondents to successfully complete the surveys (acute and
post-acute). I also wanted to explore content validity and assess redundancy of the survey items
with an existing survey of patient experience with general hospital care (HCAHPS). Therefore, I
developed cognitive interview guides to meet the following specific objectives:
1. to identify participants’ perceptions and interpretation of item wording;
2. to identify if participants were able to recall the information necessary to provide answers to
the items;
3. to identify items that participants had difficulty answering and the reasons the items did not
function as intended;
4. to identify the response options participants prefer to use to answer the global item;
5. to assess the clarity and comprehensiveness of survey instructions;
6. to identify items on the survey that participants felt addressed non-priority aspects of care
(those not affecting their overall perception of the quality of care);

!15!
7. to identify key elements in injury care that were not included on the survey;
8. to identify redundant items;
9. to identify items that overlap in content with items on the Hospital Version of the Consumer
Assessment of Healthcare Providers and Systems Survey (HCAHPS) to help direct the
development of an injury specific tool.
One key revision occurred prior to the first round of cognitive interviewing; I replaced the two
original response scales (five-point poor-excellent and five-point completely satisfied-very
dissatisfied). In pilot testing many participants commented that they would prefer different
response options. Some suggested the scales over-represented positive responses (three positive,
two negative), that many items didn't grammatically and logically match the poor-excellent
responses, and that the five-point global rating scale (satisfied-very dissatisfied) did not provide
enough granularity for the global rating item. I chose to use three scales in their place: yes/no
scale, a four-point frequency scale (never, sometimes, usually, always), and a 0-10 global rating
scale. These scales were selected given their successful implementation on the HCAHPS survey
(38). All original items were re-worded to accommodate the new response options and therefore
may not match the original survey items published (1). Items phrased to match the new response
scales underwent cognitive testing. Preference for the global response scale was also tested.
5.2.2 Recruitment and Data Collection
The sample was obtained from two sources. First, I approached consecutive in-patients (or their
family members) 18 years of age or older admitted to hospital with a primary injury diagnosis
and who had been in-hospital for at least three days. I offered participation to either the acute

!16!
care or post-acute care component. Second, I approached discharged patients convened for a
focus group study on patient-centered injury care. These patients were 18 years of age or older
who had been admitted to Foothills Medical Centre for a critical injury within the 12 months
prior to the launch of my study. Members of their family and family members of non-survivors
were also eligible for enrollment. I offered them participation to the post-acute care component.
Acute care items were tested using in-person interviews in-hospital with injured patients and
family members of injured patients at a level 1 Canadian trauma centre. All participants were
given the paper-based self-complete survey. Post-acute care items were tested via telephone
interviews with injured patients and family members of injured patients. Most interviews
occurred five to six weeks after patient discharge however, a sub-set of patients (recruited from
the focus groups) completed the interview two to twelve months post-discharge. I aimed to have
half of the participants undergo concurrent questioning during survey completion and half to
undergo retrospective questioning after survey completion.
There was no pre-defined sample size. I sampled patients and family members and serially
revised the survey until there was consistency in item interpretation among multiple participants,
and no participants could identify major problems with items, instructions, response options, or
survey content. The interview guide was revised after each round of testing to reflect changes in
the survey and to further explore issues that arose in previous testing rounds. The first round
interview guide is provided as an example in Appendix A.
!17!
5.3 Results
The acute care survey was tested in three rounds with ten injured patients and ten family
members of injured patients while the post-acute care survey was tested in two rounds with seven
injured patients and three family members. Participant characteristics are described in Table 2.
Participants were primarily male (82%) with major injuries (73%) (median injury severity
score=17, IQR=13-23). Surrogate participants (family members) were primarily female (69%)
and patients’ wives (38%). Table 3 to Table 8 describes the item level results of the cognitive
interviews. Of the 43 items tested, 24 items were revised and 19 items were eliminated. I
identified six issues with items during the interview process that guided revisions to the
measures.

!18!
Table 2. Cognitive interview participant characteristics Participant Characteristics n=30
Patients n=17 Male 82% Age, median years (IQR) 43 (28, 55) Ethnicity Caucasian 67% Asian/East Indian 23% Aboriginal/First Nations 10% Education High school or less 34% Some college or more 66% Residence Alberta 90% Urban 80% Mechanism of injury Motor vehicle 43% Fall 37% Assault 20% Self-rated health at time of survey completion Poor, fair, or good 60% Very good or excellent 40% ISS<12 27% ISS>12 ISS, median (IQR)
73% 17 (13, 23)
Surgery during hospital stay 40% Intensive care unit admission during hospital stay 20% Surrogate Characteristics n=13 Male 31% Relationship to patient Wife 38% Brother 23% Mother 23%

!
5.3.1 Six Broad Issues Identified
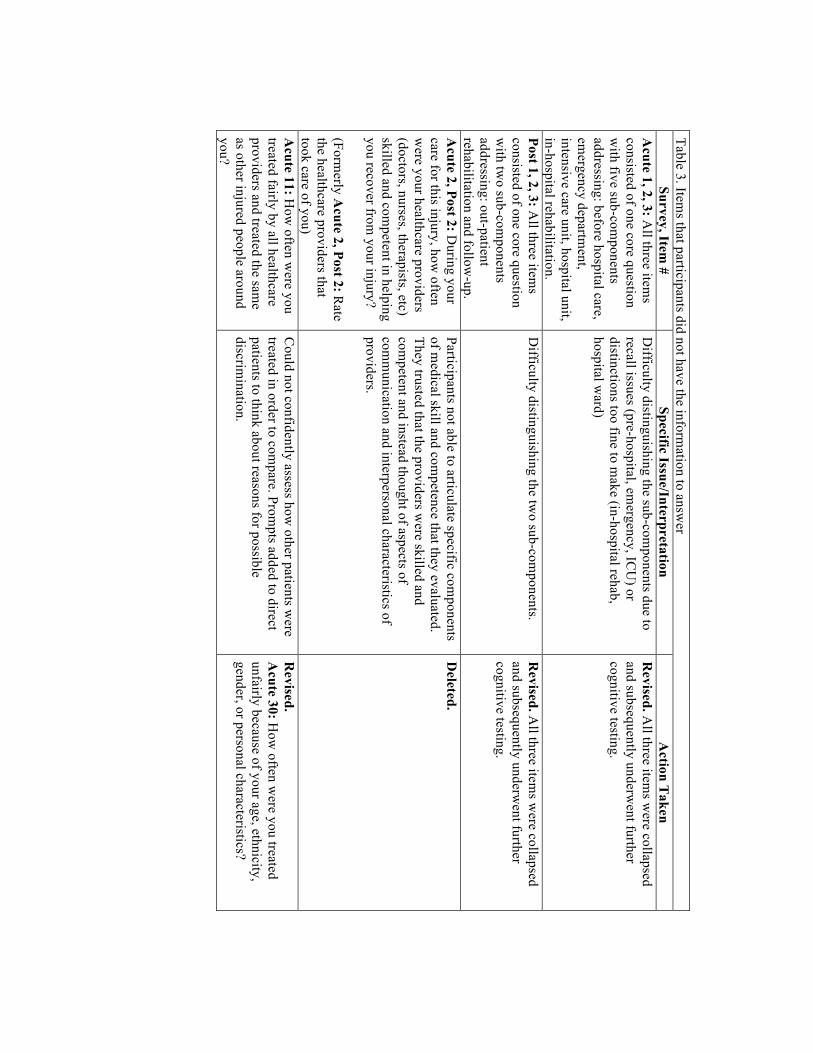
Participants did not have the information to answer items
There were nine items that participants did not have the information to answer (Table 3).
Participants had difficulty answering items that differentiated the phases of care due to recall
issues (pre-hospital, emergency department, intensive care unit) or because the distinctions were
too fine to make (in-hospital rehabilitation, hospital ward). Participants could not identify
specific medical skills to evaluate provider competence. Participants trusted that care givers were
skilled and competent and instead evaluated the staff's communication skills and interpersonal
characteristics. Also, participants could not assess if they had been treated unfairly compared to
others because they were unaware of the treatment other patients received.
Items contained ambiguous terminology or were inconsistently interpreted
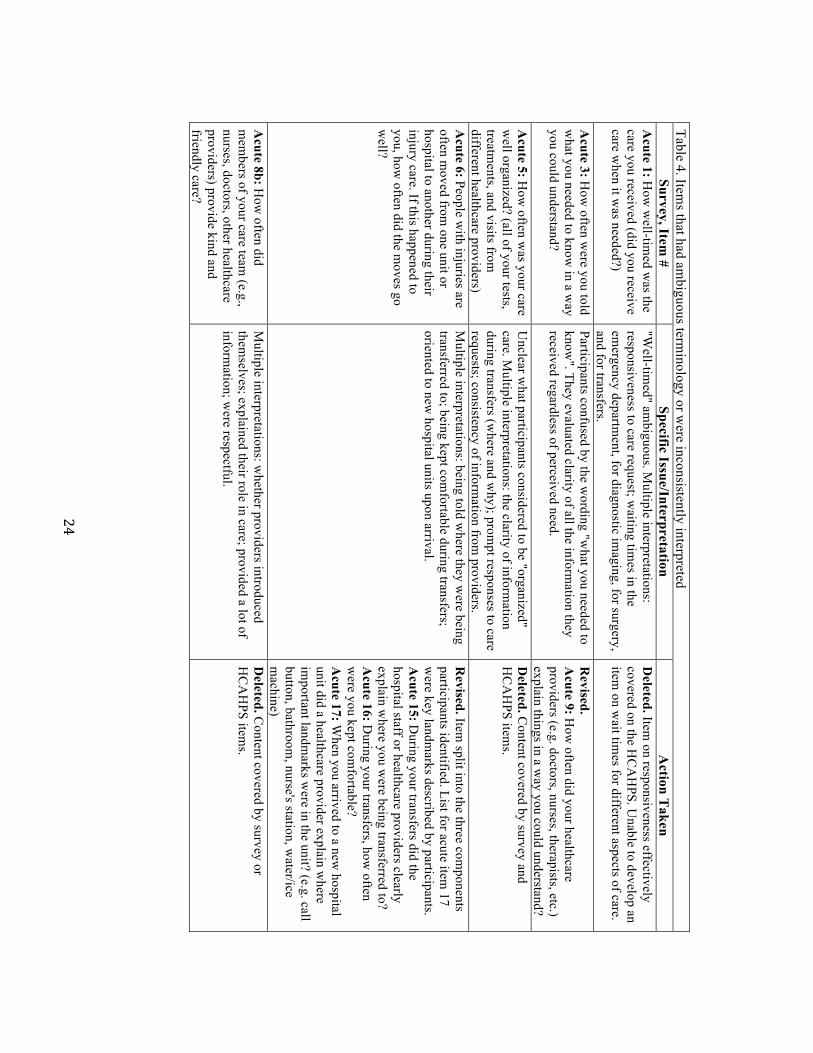
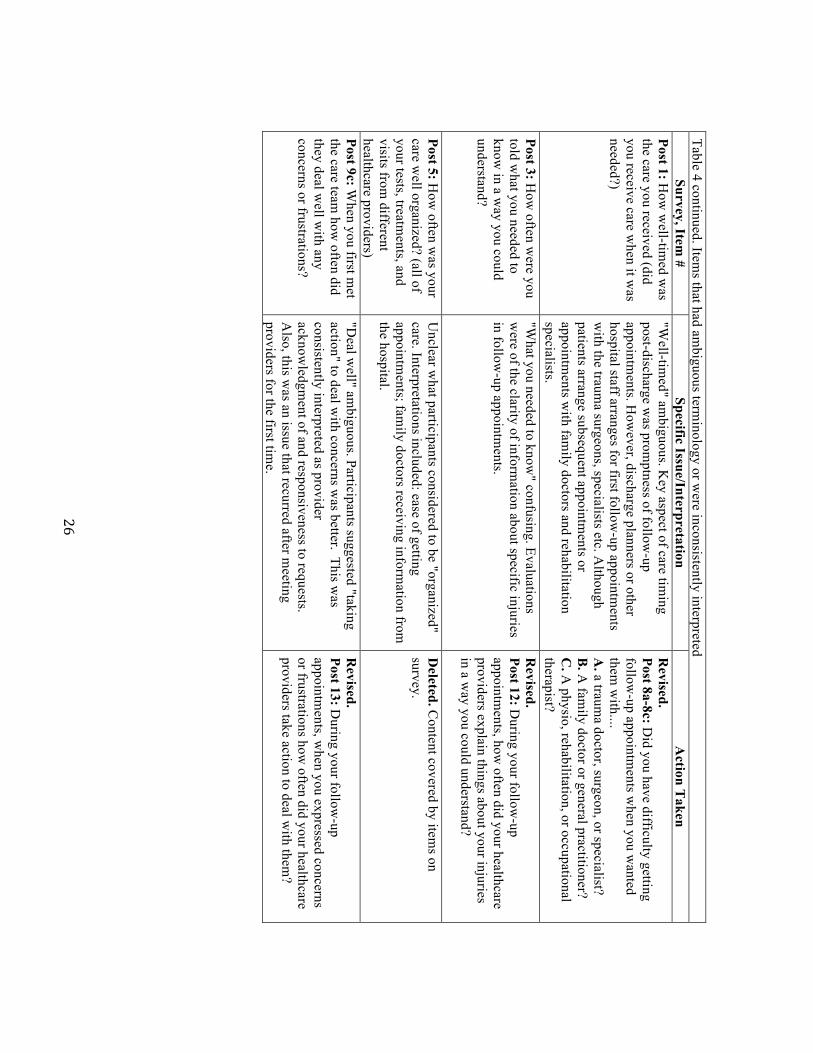
Thirteen items contained ambiguous language or were inconsistently interpreted (Table 4).
Descriptions of care being "well-timed", "organized", and "kind and friendly" were ambiguous
and interpreted in multiple ways. Often, the common interpretations of the items overlapped with
content captured elsewhere on the survey or the HCAHPS survey and the original items were
deleted. For example, when asked how "organized" acute care was, participants most commonly
evaluated the clarity of information during transfers (where and why); speed of responses to care
requests; and the consistency of information from providers. Each of those three issues was
already addressed by an individual item. In some cases, ambiguous items were replaced by
several focused items. For example, a transfer item about being "moved-well" was replaced by
three items that targeted the elements of a "good" transfer: information about where the patient
was being transferred to; being kept comfortable during transfers; being oriented to new hospital

!20!
units upon arrival. Some items required slight revision to increase clarity and consistency of
interpretation. For example, participants were confused by the phrase "deal well with concerns"
in an item meant to inquire about respecting and responding to patient requests. The phrase was
replaced with "take action to deal with concerns", which prompted assessments of whether
providers acknowledged and responded in some way to patient requests. Three items about
hygiene, dignity, and religious needs being "treated well" were grammatically and logically
confusing. The phrasing was revised for clarity and to appropriately match the subject:
maintained personal hygiene; considered dignity; respected religious preferences.
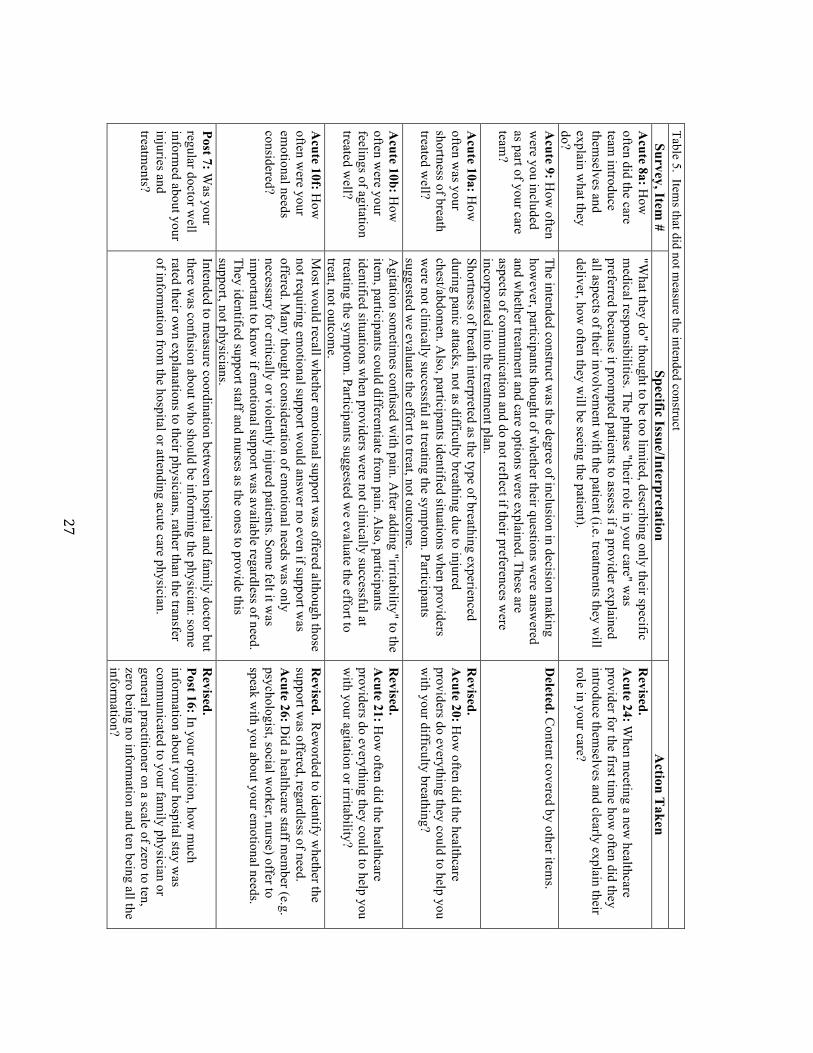
Items did not measure the intended construct
Six items did not measure intended constructs (Table 5). In some instances, participants only
evaluated a portion of the intended construct. For example, an item asking if providers
"explained what they do" prompted recall only of discussions in which providers explained the
treatments they were going to deliver and not of other aspects of their involvement with patients
(e.g. how frequently they would check on the patient, if they had authority to make final
treatment decisions). Phrasing the item as "[did the providers]...clearly explain their role in your
care" obtained assessments of the full construct. Two items about symptom relief were not
measuring the intended symptom. The phrase "shortness of breath" prompted patients to think
about hyperventilating rather than difficulty breathing associated with chest/abdominal injuries.
The phrase "difficulty breathing" was incorporated. An item on "agitation" was confused with
pain, however, adding the term "irritability" helped to isolate the construct. Additionally,
participants identified situations where providers gave a great effort to treat their difficulty
breathing, agitation/irritability, or pain but were not successful at alleviating the symptom. They

!21!
suggested that these symptoms may not always be amenable to treatment and that the effort to
treat should be the focus of evaluation. Those items were changed from "how often was your
[pain] treated well" to "how often did providers do everything they could to help with [pain]".
Some participants did not assess the intended construct if they felt the item was not applicable to
them. For example, an item on how often "emotional needs were considered" did not measure the
intended construct for participants that felt they had no emotional needs. Most would recall
whether emotional support was offered although those not needing/wanting emotional support
would answer "no" even if the support was offered. Some thought consideration of emotional
needs was only necessary for critically or injured patients or those subjected to violence.
However, many felt it was important to know if emotional support was available regardless of
need. The item was revised to assess whether or not a staff member offered to speak to patients
about their emotional needs.
Items included assumptions about healthcare processes
Four items included invalid assumptions about what occurs during the recovery process
(Table 6). Two items asked whether patients "got the information they needed" about how
injuries would affect their lives, recovery timelines, and what would be involved in recovery.
Patients primarily answered "no" because they felt the detail of information was inadequate.
However, providers are often not able to give exact information about how injuries will affect a
person's life, how long it will take to recover, and what will be involved in recovery. While it
may be unreasonable to expect precise information about recovery, it is important for patients to
get some information. Therefore, the item was reframed to assess whether the providers
discussed how injuries "might affect" a patient and how long it "might" take to recover. Another

!22!
item was revised to assess whether patients were told "how they should care for their injuries
after leaving the hospital" rather than "what would be involved in recovery".
Items measuring non-priority aspects of injury care
Eight items on the post-acute survey were identified as non-priority for injury care patients
(Table 7). Items regarding the nature of interactions with providers during follow-up
appointments (kind and friendly; providers introducing themselves; treated fairly; considering
emotional needs, dignity, respect, personal preferences, religious needs) had little value for
patients. During post-acute care, patients usually have short interactions with follow-up
providers and participants suggested that their key priorities during these interactions were to
obtain information and advance the recovery process. The deleted items did not align with these
priorities.
Items were redundant or overlapped with items on the HCAHPS survey
Six items were found to be redundant with other content on the QTAC-PREM or on the
HCAHPS survey (Table 8). Items on anxiety, personal preferences, respecting the patient, and
hospital cleanliness were redundant with other items on the QTAC-PREM or the HCAHPS and
were deleted. The single pain item overlapped with two-validated pain items on the HCAHPS.
However, pain is a key issue for injury patients and the QTAC-PREM should have the capability
of being administered without supplemental surveys. The QTAC-PREM item was replaced with
the HCAHPS items due to participants' preferences.
!
Table 3. Item
s that participants did not have the information to answ
er Survey, Item
# Specific Issue/Interpretation
Action T
aken A
cute 1, 2, 3: All three item
s consisted of one core question w
ith five sub-components
addressing: before hospital care, em
ergency department,
intensive care unit, hospital unit, in-hospital rehabilitation.
Difficulty distinguishing the sub-com
ponents due to recall issues (pre-hospital, em
ergency, ICU
) or distinctions too fine to m
ake (in-hospital rehab, hospital w
ard)
Revised. A
ll three items w
ere collapsed and subsequently underw
ent further cognitive testing.
Post 1, 2, 3: All three item
s consisted of one core question w
ith two sub-com
ponents addressing: out-patient rehabilitation and follow
-up.
Difficulty distinguishing the tw
o sub-components.
Revised. A
ll three items w
ere collapsed and subsequently underw
ent further cognitive testing.
Acute 2, Post 2: D
uring your care for this injury, how
often w
ere your healthcare providers (doctors, nurses, therapists, etc) skilled and com
petent in helping you recover from
your injury? (Form
erly Acute 2, Post 2: R
ate the healthcare providers that took care of you)
Participants not able to articulate specific components
of medical skill and com
petence that they evaluated. They trusted that the providers w
ere skilled and com
petent and instead thought of aspects of com
munication and interpersonal characteristics of
providers.
Deleted.
Acute 11: H
ow often w
ere you treated fairly by all healthcare providers and treated the sam
e as other injured people around you?
Could not confidently assess how
other patients were
treated in order to compare. Prom
pts added to direct patients to think about reasons for possible discrim
ination.
Revised.
Acute 30: H
ow often w
ere you treated unfairly because of your age, ethnicity, gender, or personal characteristics?
!24!
Table 4. Item
s that had ambiguous term
inology or were inconsistently interpreted
Survey, Item #
Specific Issue/Interpretation A
ction Taken
Acute 1: H
ow w
ell-timed w
as the care you received (did you receive care w
hen it was needed?)
"Well-tim
ed" ambiguous. M
ultiple interpretations: responsiveness to care request; w
aiting times in the
emergency departm
ent, for diagnostic imaging, for surgery,
and for transfers.
Deleted. Item
on responsiveness effectively covered on the H
CA
HPS. U
nable to develop an item
on wait tim
es for different aspects of care.
Acute 3: H
ow often w
ere you told w
hat you needed to know in a w
ay you could understand?
Participants confused by the wording "w
hat you needed to know
". They evaluated clarity of all the information they
received regardless of perceived need.
Revised.
Acute 9: H
ow often did your healthcare
providers (e.g. doctors, nurses, therapists, etc.) explain things in a w
ay you could understand? A
cute 5: How
often was your care
well organized? (all of your tests,
treatments, and visits from
different healthcare providers)
Unclear w
hat participants considered to be "organized" care. M
ultiple interpretations: the clarity of information
during transfers (where and w
hy); prompt responses to care
requests; consistency of information from
providers.
Deleted. C
ontent covered by survey and H
CA
HPS item
s.
Acute 6: People w
ith injuries are often m
oved from one unit or
hospital to another during their injury care. If this happened to you, how
often did the moves go
well?
Multiple interpretations: being told w
here they were being
transferred to; being kept comfortable during transfers;
oriented to new hospital units upon arrival.
Revised. Item
split into the three components
participants identified. List for acute item 17
were key landm
arks described by participants. A
cute 15: During your transfers did the
hospital staff or healthcare providers clearly explain w
here you were being transferred to?
Acute 16: D
uring your transfers, how often
were you kept com
fortable? A
cute 17: When you arrived to a new
hospital unit did a healthcare provider explain w
here im
portant landmarks w
ere in the unit? (e.g. call button, bathroom
, nurse's station, water/ice
machine)
Acute 8b: H
ow often did
mem
bers of your care team (e.g.,
nurses, doctors, other healthcare providers) provide kind and friendly care?
Multiple interpretations: w
hether providers introduced them
selves; explained their role in care; provided a lot of inform
ation; were respectful.
Deleted. C
ontent covered by survey or H
CA
HPS item
s.

!25!
Table 4 continued. Item
s that had ambiguous term
inology or were inconsistently interpreted
Survey, Item #
Specific Issue/Interpretation A
ction Taken
Acute 8c: H
ow often did the
care team deal w
ell with your
concerns or frustrations?
"Deal w
ell" ambiguous. "Taking action to deal w
ith concerns" consistently interpreted as acknow
ledgment of and responsiveness to requests.
Revised.
Acute 25: W
hen you expressed concerns or frustrations about your care how
often did your healthcare provider take action to deal w
ith them?
Acute 10e: H
ow often w
as your personal hygiene treated w
ell? H
ygiene being "treated well" nonsensical and
ambiguous. Som
e participants gave answers even though
only family helped w
ith hygiene. Explored overlap with
HC
AH
PS item on help getting to the bathroom
and using a bedpan. Patients suggested that getting to the bathroom
wasn’t the only aspect of hygiene. "H
ygiene" included: frequency of show
ers/sponge baths; cleaning defecation and excoriation.
Revised. Providers that help to m
aintain hygiene listed to direct participants to think of the care provided by staff, not fam
ily. A
cute 23: How
often did your nurses or other hospital staff help you m
aintain your personal hygiene?
Acute 10h: H
ow often w
as your dignity treated w
ell? D
ignity being "treated well" nonsensical and am
biguous. Participants did distinguish dignity from
being treated kindly. They consistency identified being physically covered up and not being exposed.
Revised.
Acute 27: H
ow often w
as your dignity considered by the healthcare providers?
Acute 10j: H
ow often w
ere your cultural, religious, and spiritual needs treated w
ell?
Needs being "treated w
ell" nonsensical and ambiguous.
Participants indicated the key issue was respecting
preferences rather than considering or accomm
odating needs. R
especting preferences prompted participants to
think about providing access to spiritual staff and not discrim
inating based on preferences.
Revised.
Acute 29: H
ow often w
ere your cultural, religious, or spiritual preferences respected by the healthcare staff and religious or spiritual staff?
!26!
Table 4 continued. Items that had am
biguous terminology or w
ere inconsistently interpreted Survey, Item
# Specific Issue/Interpretation
Action T
aken Post 1: H
ow w
ell-timed w
as the care you received (did you receive care w
hen it was
needed?)
"Well-tim
ed" ambiguous. K
ey aspect of care timing
post-discharge was prom
ptness of follow-up
appointments. H
owever, discharge planners or other
hospital staff arranges for first follow-up appointm
ents w
ith the trauma surgeons, specialists etc. A
lthough patients arrange subsequent appointm
ents or appointm
ents with fam
ily doctors and rehabilitation specialists.
Revised.
Post 8a-8c: Did you have difficulty getting
follow-up appointm
ents when you w
anted them
with....
A. a traum
a doctor, surgeon, or specialist? B
. A fam
ily doctor or general practitioner? C
. A physio, rehabilitation, or occupational
therapist? Post 3: H
ow often w
ere you told w
hat you needed to know
in a way you could
understand?
"What you needed to know
" confusing. Evaluations w
ere of the clarity of information about specific injuries
in follow-up appointm
ents.
Revised.
Post 12: During your follow
-up appointm
ents, how often did your healthcare
providers explain things about your injuries in a w
ay you could understand?
Post 5: How
often was your
care well organized? (all of
your tests, treatments, and
visits from different
healthcare providers)
Unclear w
hat participants considered to be "organized" care. Interpretations included: ease of getting appointm
ents; family doctors receiving inform
ation from
the hospital.
Deleted. C
ontent covered by items on
survey.
Post 9c: When you first m
et the care team
how often did
they deal well w
ith any concerns or frustrations?
"Deal w
ell" ambiguous. Participants suggested "taking
action" to deal with concerns w
as better. This was
consistently interpreted as provider acknow
ledgment of and responsiveness to requests.
Also, this w
as an issue that recurred after meeting
providers for the first time.
Revised.
Post 13: During your follow
-up appointm
ents, when you expressed concerns
or frustrations how often did your healthcare
providers take action to deal with them
?
!27!
Table 5. Item
s that did not measure the intended construct
Survey, Item #
Specific Issue/Interpretation A
ction Taken
Acute 8a: H
ow
often did the care team
introduce them
selves and explain w
hat they do?
"What they do" thought to be too lim
ited, describing only their specific m
edical responsibilities. The phrase "their role in your care" was
preferred because it prompted patients to assess if a provider explained
all aspects of their involvement w
ith the patient (i.e. treatments they w
ill deliver, how
often they will be seeing the patient).
Revised.
Acute 24: W
hen meeting a new
healthcare provider for the first tim
e how often did they
introduce themselves and clearly explain their
role in your care?
Acute 9: H
ow often
were you included
as part of your care team
?
The intended construct was the degree of inclusion in decision m
aking how
ever, participants thought of whether their questions w
ere answered
and whether treatm
ent and care options were explained. These are
aspects of comm
unication and do not reflect if their preferences were
incorporated into the treatment plan.
Deleted. C
ontent covered by other items.
Acute 10a: H
ow
often was your
shortness of breath treated w
ell?
Shortness of breath interpreted as the type of breathing experienced during panic attacks, not as difficulty breathing due to injured chest/abdom
en. Also, participants identified situations w
hen providers w
ere not clinically successful at treating the symptom
. Participants suggested w
e evaluate the effort to treat, not outcome.
Revised.
Acute 20: H
ow often did the healthcare
providers do everything they could to help you w
ith your difficulty breathing?
Acute 10b: H
ow
often were your
feelings of agitation treated w
ell?
Agitation som
etimes confused w
ith pain. After adding "irritability" to the
item, participants could differentiate from
pain. Also, participants
identified situations when providers w
ere not clinically successful at treating the sym
ptom. Participants suggested w
e evaluate the effort to treat, not outcom
e.
Revised.
Acute 21: H
ow often did the healthcare
providers do everything they could to help you w
ith your agitation or irritability?
Acute 10f: H
ow
often were your
emotional needs
considered?
Most w
ould recall whether em
otional support was offered although those
not requiring emotional support w
ould answer no even if support w
as offered. M
any thought consideration of emotional needs w
as only necessary for critically or violently injured patients. Som
e felt it was
important to know
if emotional support w
as available regardless of need. They identified support staff and nurses as the ones to provide this support, not physicians.
Revised. R
eworded to identify w
hether the support w
as offered, regardless of need. A
cute 26: Did a healthcare staff m
ember (e.g.
psychologist, social worker, nurse) offer to
speak with you about your em
otional needs.
Post 7: Was your
regular doctor well
informed about your
injuries and treatm
ents?
Intended to measure coordination betw
een hospital and family doctor but
there was confusion about w
ho should be informing the physician: som
e rated their ow
n explanations to their physicians, rather than the transfer of inform
ation from the hospital or attending acute care physician.
Revised.
Post 16: In your opinion, how m
uch inform
ation about your hospital stay was
comm
unicated to your family physician or
general practitioner on a scale of zero to ten, zero being no inform
ation and ten being all the inform
ation?

!28!
Table 6. Item
s that included assumptions about healthcare processes
Survey, Item #
Specific Issue/Interpretation A
ction Taken
Acute 7a: D
id you get the inform
ation you needed in a w
ay you could understand about how
the injuries m
ight affect your life?
Providers often do not know how
a patient's injuries could affect them
after they leave the hospital. H
owever, participants said providers w
ould discuss it even if they couldn't give exact details. Item
too long.
Revised.
Acute 11: D
id your healthcare discuss how the injuries
might affect you after you leave the hospital?
Acute 7b: D
id you get the inform
ation you needed in a w
ay you could understand about how
long it would
take you to feel better and w
hat would be involved in
recovery?
Providers often cannot give an exact timefram
e for recovery or know
exactly what w
ill be involved in recovery. H
owever, participants valued an
approximate tim
eframe and som
e discussion about how
to care for injuries post-discharge. Item too
long and double barreled: addressing recovery tim
eline and activities.
Revised. Item
split into two com
ponents. A
cute 12: Did your healthcare providers provide
instructions on how you should care for your injuries
after you leave the hospital? A
cute 13: Did your healthcare providers discuss how
long it m
ight take you to recovered from your injuries?
Post 7b: Did you get the
information you needed in
a way you could understand
about how long it w
ould take you to feel better and w
hat would be involved in
recovery?
At the tim
e of follow-up providers still m
ay not be able to give an exact tim
eframe for recovery.
Approxim
ate timeline still im
portant. "What w
ould be involved in recovery" often interpreted solely as physical restrictions on activities. H
owever, w
e w
anted a broader item assessing inform
ation about recovery. Item
too long and double barreled: addressing recovery tim
eline and activities.
Revised. Item
split into two com
ponents. Post 9: D
uring your follow-up appointm
ents, did your healthcare providers explain the next steps in your recovery from
injury for example, activities you should
or should not do, necessary medications, tests and
treatments, or other follow
-up appointments?
Post 10: During your follow
-up appointments, did your
healthcare providers explain approximately how
long it w
ould take you to recover? Post 8b: D
id you get the inform
ation you needed in a w
ay you could understand about discharge and hom
ecare?
Assum
ptions about the services patients receive. All
should get discharge information but not all
necessarily get homecare inform
ation. Many had
difficulty recalling if verbal information w
as given prior to discharge.
Revised.
Post 2: Before leaving the hospital, did your hospital
healthcare providers give you written instructions on
how to care for your injuries after being discharged?

!29!
Table 7. Item
s measuring non-priority aspects of care
Survey, Item #
Specific Issue/Interpretation A
ction Taken
Post 9a: When you first m
et the care team
how often did they introduce them
selves and explain w
hat they do?
Not relevant because patients have already m
et m
ost of the follow-up providers (i.e. fam
ily doctor, surgeons from
acute care centre)
Deleted.
Post 9b: When you first m
et the care team
how often did they provide kind and friendly
care?
Not relevant because patients have already m
et m
ost of the follow-up providers. N
ot a crucial elem
ent of the recovery process. Support through inform
ation provision and encouragem
ent more relevant.
Deleted.
Post 10a-e: How
often were the follow
ing treated w
ell... A
. emotional needs?
B. respect?
C. dignity?
D. values and personal preferences for care?
E. cultural, religious, and spiritual needs?
Not im
portant during follow-up care w
hen interactions w
ith providers are brief and focused on steps needed to recover. A
lso, not gram
matically correct and nonsensical to
"treat" respect, dignity, values and personal preference, cultural needs.
Deleted.
Post 11: Were you treated fairly by all
healthcare providers and treated the same as
the other injured people around you?
Not im
portant during follow-up care w
hen interactions w
ith providers are brief and focused on steps needed to recover. A
lso, participants do not observe interactions betw
een providers and other patients and therefore had difficulty m
aking comparisons.
Deleted.

!30!
Table 8. Item
s with redundant content and those that overlapped w
ith content on the HC
AH
PS survey Survey, Item
# Specific Issue/Interpretation
Action T
aken A
cute 7a: Did you get the
information you needed in
a way you could understand
about your injuries?
Overlap w
ith item on clarity of inform
ation. U
nique interpretation of this item w
as whether
providers explained all of the patients' injuries. Participants evaluated w
hether providers explained w
hat was injured and anatom
ically how
it occurred.
Revised. R
efocused on the unique part of participants' interpretations. A
cute 10: Did your healthcare providers clearly
explain all your injuries to you in a way you could
understand?
Acute 10c: H
ow often w
ere your feelings of anxiety treated w
ell?
Participants interpreted anxiety the same as
agitation/irritability. Overlap w
ith item on
agitation/irritability.
Deleted.
Acute 10d: H
ow often w
as your pain treated w
ell? O
verlap with pain item
s on the HC
AH
PS survey. Item
s were com
pared and participants preferred the H
CA
HPS item
s. Pain m
anagement one of the m
ost important
components of the m
easure.
Revised. Tw
o well-validated pain item
s from the
HC
AH
PS survey were added to replace our single
pain item.
Acute 18: H
ow often w
as your pain well controlled?
Acute 19: H
ow often did the healthcare providers do
everything they could to help you with your pain?
Acute 10g: H
ow often
were you treated w
ith respect?
Overlap w
ith HC
AH
PS item about courtesy
and respect. D
eleted.
Acute 10i: H
ow often w
ere your values and personal preferences for care considered by the healthcare providers?
Overlap w
ith two item
s: “concerns and frustrations” and "cultural, religious, spiritual needs".
Deleted.
Acute 12: H
ow often w
as the hospital kept clean, com
fortable, and m
aintained?
Evaluations were m
ade of room cleanliness not
overall hospital cleanliness, suggesting overlap w
ith HC
AH
PS item on clean room
and bathroom
.
Deleted.

!31!
Table 9. A
dditional content identified as relevant for injury patients Survey, Item
# R
eason for Item G
eneration/Item R
evision (N
ew) A
cute 11: During your follow
-up appointm
ents, did you get all of the information that
you wanted from
the healthcare providers?
Most participants expressed receiving a lack of inform
ation during appointm
ents. This item w
as developed to assess the overall amount and
quality of information received during appointm
ents. (N
ew) A
cute 14: How
often was the inform
ation you received from
your various healthcare providers consistent?
Participants highlighted the importance of consistent inform
ation from
providers. They described distress associated with getting inconsistent
information because of the resulting confusion about w
hat was "correct"
and they took it as an indication of poor coordination. (N
ew) A
cute 22: When the healthcare providers
rolled you, turned you over in bed, or helped you get out of bed and m
ove around, how often did they do it
carefully?
In the pilot test prior to cognitive interviews and in the first round of
interviews participants com
plained about being moved forcefully, being
jerked, or jolted causing concern, distress and discomfort. Instances of
were this perceived as unsafe care.
(New
) Acute 28: H
ow often did you experience care
that was unsafe? (e.g. given the w
rong medication,
wrong test, w
rong treatment, etc.)
Added a safety question to obtain a quantitative evaluation of the num
ber of patients w
ho perceived unsafe events in-hospital.
(New
) Post 1: Where did you go after being
discharged from [H
ospital Nam
e]? N
ot all patients went hom
e after discharge. We added this item
to map
patient injury care and identify if there are different issues faced by patients on different care pathw
ays. (N
ew) Post 4: A
fter being discharged from the
hospital, did you have enough pain medication to
control your pain well?
Participants identified a gap in pain managem
ent after leaving hospital. A
lthough prescriptions are filled in-hospital prior to discharge, limited
mobility or difficulty getting appointm
ents with fam
ily doctor makes re-
filling prescriptions difficult. (N
ew) Post 3: D
id the written instructions you
received provide you with enough inform
ation to help you care for your injuries after being discharged?
The amount and quality of w
ritten discharge instructions important for
patients to know how
to care for their injuries at home.
(New
) Post 5: After being discharged from
the hospital, did you get all of the support services that you w
anted, for example hom
e care, social work, or
counseling?
Am
ount of support services, specifically home care, social w
ork, and psychological and psychiatric counseling, had been an issue for patients in pilot study and re-identified by cognitive interview
participants, especially by brain injured patients and those unable to im
mediately return to w
ork. !!

!32!
!!Table 9 continued. A
dditional content identified as relevant for injury patients Survey, Item
# R
eason for Item G
eneration/Item R
evision (N
ew) Post 6a-6c: Since being discharged from
the hospital, have you attended an appointm
ent to follow-up about your
injuries with....
A. a traum
a doctor, surgeon, or specialist? B
. A fam
ily doctor or general practitioner? C
. A physio, rehabilitation, or occupational therapist?
Used as screener item
to direct participants to applicable items.
Also, added to identify w
hich providers participants are evaluating in their aggregate answ
ers. General practitioner added because
some participants didn't have regular fam
ily physicians and attended w
alk in clinics for follow-up.
(New
) Post 7a-7c: A
re you scheduled for an appointment to follow
-up about your injuries w
ith... A
. a trauma doctor, surgeon, or specialist?
B. A
family doctor or general practitioner?
C. A
physio, rehabilitation, or occupational
Added to m
ap patient care.
(New
) Post 14: After being discharged from
the hospital, how
often was the inform
ation you received from your
different healthcare providers consistent?
Participants identified an issue with consistency of inform
ation from
different follow-up providers m
ost comm
only about what to
do during recovery including activities that could be tolerated and w
hether or not to attend physiotherapy. (N
ew) Post 15: Since being discharged from
the hospital, how
often have you experienced healthcare that was unsafe?
Added a safety question to obtain a quantitative evaluation of the
number of patients w
ho perceived unsafe events post-discharge. (N
ew) Post 17: H
ow w
ell were you guided through the
recovery process by your healthcare providers after being discharged from
the hospital on a scale of zero to ten, zero being poor guidance and ten being excellent guidance?
Many participants (especially those w
ith brain injuries) expressed a lack of guidance post-discharge. This item
developed to address that issue and get an overall rating of guidance. Participants evaluated: the am
ount and quality of information about recovery
and next steps; the ease of comm
unication access to providers; w
hether providers answered their questions during appointm
ents.
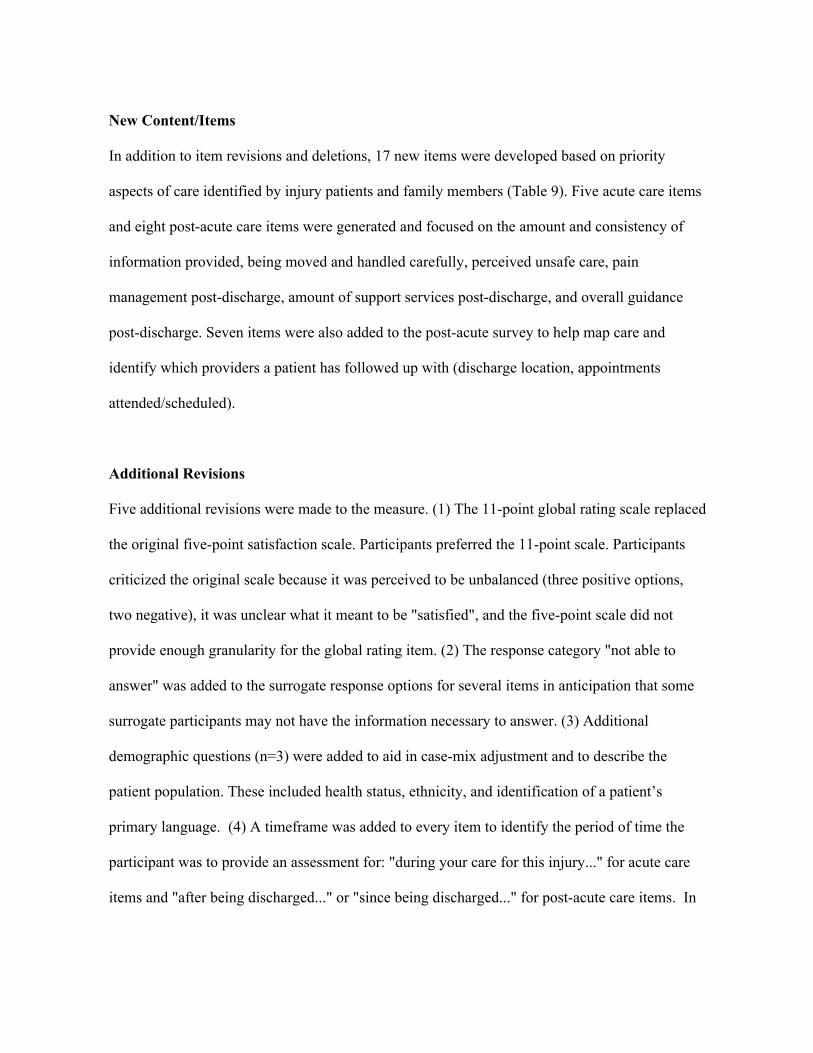
!
New Content/Items
In addition to item revisions and deletions, 17 new items were developed based on priority
aspects of care identified by injury patients and family members (Table 9). Five acute care items
and eight post-acute care items were generated and focused on the amount and consistency of
information provided, being moved and handled carefully, perceived unsafe care, pain
management post-discharge, amount of support services post-discharge, and overall guidance
post-discharge. Seven items were also added to the post-acute survey to help map care and
identify which providers a patient has followed up with (discharge location, appointments
attended/scheduled).
Additional Revisions
Five additional revisions were made to the measure. (1) The 11-point global rating scale replaced
the original five-point satisfaction scale. Participants preferred the 11-point scale. Participants
criticized the original scale because it was perceived to be unbalanced (three positive options,
two negative), it was unclear what it meant to be "satisfied", and the five-point scale did not
provide enough granularity for the global rating item. (2) The response category "not able to
answer" was added to the surrogate response options for several items in anticipation that some
surrogate participants may not have the information necessary to answer. (3) Additional
demographic questions (n=3) were added to aid in case-mix adjustment and to describe the
patient population. These included health status, ethnicity, and identification of a patient’s
primary language. (4) A timeframe was added to every item to identify the period of time the
participant was to provide an assessment for: "during your care for this injury..." for acute care
items and "after being discharged..." or "since being discharged..." for post-acute care items. In
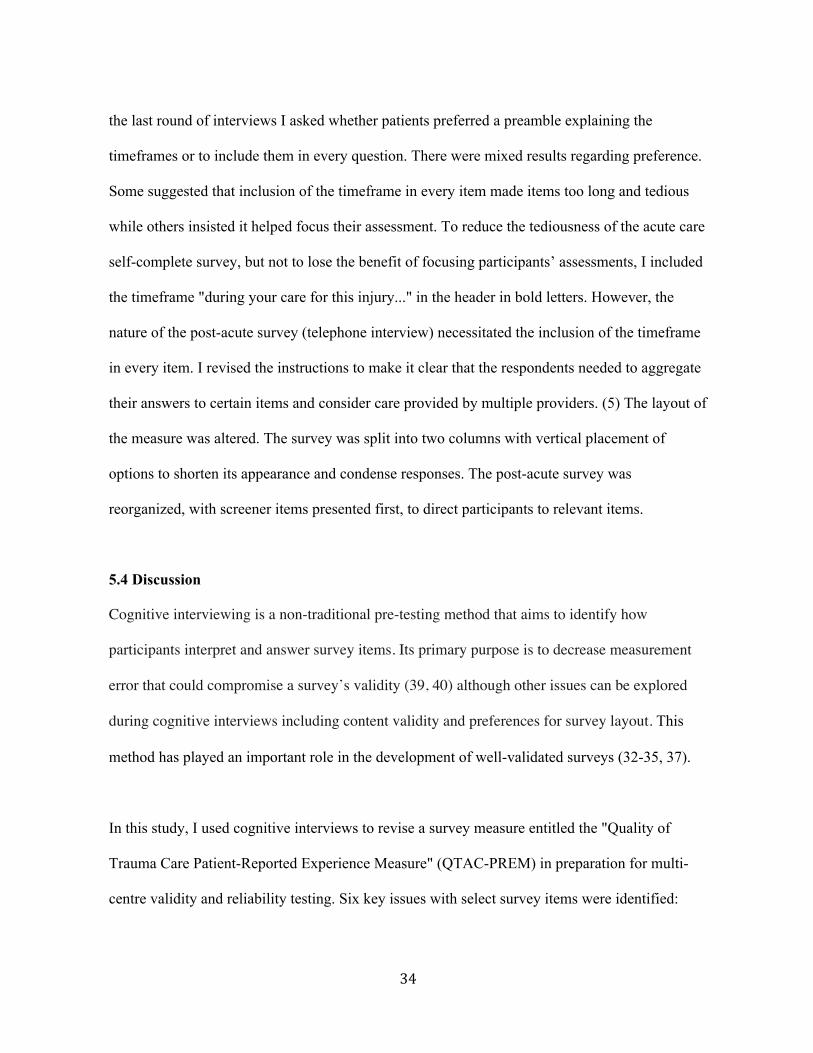
!34!
the last round of interviews I asked whether patients preferred a preamble explaining the
timeframes or to include them in every question. There were mixed results regarding preference.
Some suggested that inclusion of the timeframe in every item made items too long and tedious
while others insisted it helped focus their assessment. To reduce the tediousness of the acute care
self-complete survey, but not to lose the benefit of focusing participants’ assessments, I included
the timeframe "during your care for this injury..." in the header in bold letters. However, the
nature of the post-acute survey (telephone interview) necessitated the inclusion of the timeframe
in every item. I revised the instructions to make it clear that the respondents needed to aggregate
their answers to certain items and consider care provided by multiple providers. (5) The layout of
the measure was altered. The survey was split into two columns with vertical placement of
options to shorten its appearance and condense responses. The post-acute survey was
reorganized, with screener items presented first, to direct participants to relevant items.
5.4 Discussion
Cognitive interviewing is a non-traditional pre-testing method that aims to identify how
participants interpret and answer survey items. Its primary purpose is to decrease measurement
error that could compromise a survey’s validity (39, 40) although other issues can be explored
during cognitive interviews including content validity and preferences for survey layout. This
method has played an important role in the development of well-validated surveys (32-35, 37).
In this study, I used cognitive interviews to revise a survey measure entitled the "Quality of
Trauma Care Patient-Reported Experience Measure" (QTAC-PREM) in preparation for multi-
centre validity and reliability testing. Six key issues with select survey items were identified:

!35!
(1) participants did not have the information to answer items; (2) items contained ambiguous
terminology or were inconsistently interpreted; (3) items did not measure the intended
constructs; (4) items included assumptions about healthcare processes; (5) items measured non-
priority aspects of injury care; and (6) items were redundant or overlapped with items on the
HCAHPS survey. These results were used to revise survey items and response scales. During the
process of interviewing, new content important to injury patients' perceptions of care was
identified and added to the survey. Revisions were also made to the structure of the survey.
The results of this study are similar to those published in studies of other patient groups. For
example, the CAHPS II consortium (which included the American Institutes for Research,
Harvard Medical School, and RAND) conducted cognitive testing with a wide variety of
participants during development of a patient experience survey for general hospital care
(HCAHPS). The five broad issues with survey items that the authors identified closely match
those found in my study (37): redundant items, ambiguous language, inability to answer items
due to lack of knowledge, assumptions about what patients experience in care, and items not
measuring intended constructs. Housen et al. conducted cognitive interviews with residents of a
nursing home (41) to test a survey measure and found similar issues of item clarity, items based
on assumptions about services, items which required information residents did not have or could
not remember, and the need for a response scale with more options (increased granularity). These
broad types of issues are likely similar across different patient/participant groups.

!36!
5.5 Limitations
There are limitations to this study. The sample of participants was small and may not be
representative of the entire population to be surveyed. There may be item-related issues within
subgroups of the injury population that were not identified. However, sample sizes in studies
using cognitive interviewing are typically small and cognitive interviewing is not a method for
obtaining statistical estimates. Its aim is to identify potential sources of response error among the
type of participants that will be surveyed (40). I was able to identify issues common among the
participants in my study and which resonate with findings in other patient groups. Although the
sample size was small, participants were sampled until no further major issues with survey items
could be identified. Cognitive interviewing is not a stand-alone method of item evaluation but
rather, a step before large scale testing to increase the likelihood of developing valid and reliable
survey items.
5.6 Conclusions
In preparation for the multi-centre validation study I conducted cognitive interviews with 30
injured patients and family members of injured patients to identify problems with survey items,
instructions and response options, and to assess the survey's content validity. Based on the
results, survey content and layout were revised. I also identified six broad issues with survey
items and revised the items accordingly. Awareness of the issues identified in my study may help
guide other researchers seeking to develop new measures of patient healthcare experience.
!37!
Chapter 6: Quantitative Validation of the Quality of Trauma Care Patient-Reported
Experience Measure (Sub-Study 2)
6.1 Background
Many instruments have been developed for assessing patients’ experiences or satisfaction with
healthcare however, few have been developed using rigorous standards and only a small number
report evidence of validity and reliability (27). Often, these tools are used to map the quality of
care or to assess the impact of a new intervention, both of which have implications for efforts to
improve the quality of care. However, the lack of evidence regarding the validity and reliability
of these measurement tools may undermine the results of studies that use them.
A few rigorously developed measures to obtain patient assessments of injury care have been
published however, they were developed only for specific patient populations (e.g. head injured
patients) and specific injury care services (e.g. rehabilitation services) (22, 23, 25). While this is
an important start to measuring patient experiences with injury care, measurement tools are
needed to capture the overall healthcare experiences of injured patients (3).
The overarching goal of this thesis was to produce a measure of patient injury care experiences
that could be used to guide quality improvement efforts. Tools used for quality improvement
should be valid (measure what they intend to measure), reliable (obtain similar results under
consistent conditions), and easy to implement. Therefore, the objective of this study was to
quantitatively assess the QTAC-PREM's validity, reliability, and feasibility of
implementation in a prospective cohort of injury patients in multiple trauma centres.

!38!
6.2 Specific Objectives
Objective 1: To test the psychometric properties (construct validity, test-retest reliability, internal
consistency) and feasibility of implementation of the QTAC-PREM in multiple trauma centers in
Alberta.
The secondary objectives of this study were:
Objective 2: To assess the convergent/divergent validity of the measure with the Hospital
Consumer Assessment of Healthcare Providers and Systems (HCAHPS) survey.
Objective 3: To examine survey responses to identify variations in patient experiences of injury
care and to identify potential areas of care that could be improved.
6.3 Methods/Design
This was a prospective cohort study of consecutive adult (age >16 years) patients admitted to
hospital due to injury. Injury was defined as “the physical damage that results when a human
body is suddenly subjected to energy in amounts that exceed the threshold of physiological
tolerance” (42) resulting in admission to hospital.
The survey measure was implemented at three trauma centres in the province of Alberta:
Foothills Medical Centre (level 1), University of Alberta Hospital (level 1), Chinook Regional
Hospital (level 3). Research coordinators conducted daily screening of patients admitted for
traumatic injuries in conjunction with trauma program coordinators and charge nurses.

!39!
6.3.1 Recruitment and Data Collection
Participants were approached once discharge planning had been initiated (planned discharge
within three days). Eligible participants were those admitted to hospital with a primary injury
diagnosis. Patients without a permanent telephone number were excluded. Patients that were
unable to understand and consent to study procedures were not eligible to complete the survey
measure themselves (e.g. head injured, certified psychiatric patients). In cases of uncertainty,
patient capacity to provide informed consent was determined using a modified version of the Aid
to Capacity Evaluation form (ACE) (Appendix B) (43). If a patient was unable to provide
informed consent (e.g. head injury), a family member was invited to participate by completing
the survey measure as a surrogate. Family members of patients admitted due to injury were
eligible if they visited their injured relative at least once in hospital. Family members of patients
who died during their hospital stay were excluded. If a patient was able to provide informed
consent, but preferred that a family member participate (e.g. too tired, nauseated etc.) one of their
family members was offered participation.
One in-hospital acute care survey measure was administered per consenting patient/family. To
assess test-retest reliability, consecutive participants were !approached to re-complete the survey
measure at least 24 hours after completion of the initial survey. Patients whose stay in hospital
was extended beyond their initial expected discharge date were still eligible to re-complete the
survey.
To assess convergent and divergent validity with the HCAHPS measure consecutive patients
were approached to complete the HCAHPS measure concurrently with the QTAC-PREM.

!40!
Administration of the HCAHPS began after the sample size for test-retest was obtained because
assessing convergent/divergent validity was a secondary objective and I did not want to
overburden respondents.
Follow-up telephone surveys were attempted with all consenting patients/surrogates
approximately 8-12 weeks post-hospital discharge. The same participant (patient or surrogate)
that completed the in-hospital survey was required to complete the follow-up survey. Family
members of patients previously unable to provide consent in-hospital were asked about the
condition of their recovering relative. When deemed appropriate (i.e. capacity potentially
regained), patients were contacted to assess their capacity to consent (using the modified version
of the ACE tool (43) and discuss their willingness to continue participation in the study (agree to
have surrogate complete the follow-up survey). Participants were deemed non-responders if they
had not answered after being phoned a minimum of 5 times and a period of 14 weeks had passed
since discharge. To assess test-retest reliability of the post-acute care measure it was
re-administered via telephone interview to consecutive participants 7–10 days after the initial
completion until the required sample size was reached (n = 75).
Participant demographic and clinical information was collected using the survey, as well as from
the trauma registry, to describe the sample of participants.
The acute care survey (patient/surrogate) and post-acute care survey (patient/surrogate) are
presented in Appendix C and Appendix D, respectively.
!41!
6.3.2 Sample size
The sample size was based on ensuring precision for test- retest reliability. Previous validation
studies on similar populations found survey item correlation estimates to be in the range of 0.65
to 0.85 (44). A test-retest sample size of 75 with an intra-class correlation (ICC) of 0.75
corresponds to 95% CI width of +/- 0.10. I planned to conduct re-tests on 25% of participants
(for both the acute care and post-acute care surveys) and estimated that 25% of participants
would decline requests for re-tests. Therefore, a sample size of 400 participants was required.
6.3.3 Data Analysis
Feasibility of Implementation
I examined the survey response rate to determine if implementing the measure is feasible in
multiple trauma centres. Characteristics of participants that responded to the post-acute survey
and those that did not respond were compared using student's t-test and chi-square tests to assess
respondent bias. Age, sex, injury severity, education, ethnicity, and mechanism of injury were
compared. The significance level was set at p<0.01 to decrease the likelihood of a type 1 error in
the presence of multiple testing.
6.3.3.1 Psychometric Assessments
Visual summary tables of the psychometric analyses were developed to indicate whether each
analysis provided evidence that was supportive (+) or unsupportive (-) of a valid and reliable
tool. Criteria for 'supportive' and 'unsupportive' results are described in each section.
!42!
Defining Validity and Reliability
The classic definition of the validity of an instrument is the extent to which the instrument
measures what it intends to measure (45). Validation of an instrument is an ongoing process and
consists of the continual testing of hypotheses. Hypotheses are developed based on the
assumption that the instrument is measuring what it intends to. Therefore, successful testing of a
hypothesis provides evidence of validity. There are many different 'accepted' types of hypotheses
used in the validation process. For example, if a new instrument purports to measure the risk of
future lung cancer, one could hypothesize that the results obtained using the new instrument
would be similar to existing, validated instruments that purport to measure the risk of lung cancer
(convergent validity). One could also develop hypotheses based on predicting future outcomes
(predictive criterion validity). For example, one could conduct a prospective cohort study and
test the hypothesis that those receiving higher scores on the new measure of lung cancer risk at
the beginning of the study would be more likely to develop the disease by the two year follow-up
time point. The strength of statements about an instruments validity depend on the scope and
rigor of testing. Therefore, different approaches were used to assess validity in this study. Each
approach is described (beginning with exploratory factor analysis) and includes a short
hypothesis indicating what was expected assuming that the QTAC-PREM measures patient
experiences with injury care.
Reliability can be broadly defined as the stability of a instrument or set of items. Reliability can
be assessed by comparing scores of an instrument administered multiple times (test-retest),
completed by multiple raters (inter-rater reliability), or by examining the scores of sets of items
within an instrument that are intended to measure the same thing (internal consistency). Ideally,

!43!
minimal variability would be observed within individuals between time-points (test-retest), for
different raters assessing the same participant (inter-rater), and between purportedly similar items
(internal consistency). Test-retest reliability and internal consistency were assessed in this study
and descriptions of each are provided in sections below (Cronbach's alpha for internal
consistency, test-rest reliability).
Exploratory Factor Analysis
Exploratory factor analysis was conducted to identify groups of empirically related items that
describe the same latent factor or 'domain'. This is an assessment of construct validity because
items that purport to measure the same thing will group together. Also, combining multiple items
into a smaller number of domains can simplify the reporting and interpretation of survey data.
Factor analyses were conducted using the principal factor method with squared multiple
correlations as estimates of the initial communality values and oblique rotation (promax), which
allows factors to correlate with one another. The number of factors was determined by
considering whether the eigenvalues were greater than 1 (46), the amount of variation explained
by each factor, and the interpretability of the resulting factor matrix. Items were assigned to the
factor they had the highest loading on. Items with factor loadings less than 0.3 were not assigned
(47). A complete case factor analysis was attempted for both the acute and post-acute surveys.
To perform this analysis individual dichotomous and ordinal item scores were transformed to
linear values on the standard normal distribution. Items on perceived unsafe care were not
included in the factor analysis. These were selected to act as stand-alone items for the purpose of
reporting.
!44!
Preliminary analyses showed that the effective sample size was reduced due to responses of 'not
applicable' (N/A) to select items. Factor analysis requires complete cases and therefore, an
answer of N/A to even a single item excluded a participant from inclusion in the analysis. As a
result, select items were excluded from the factor analysis to increase the available sample size
and confidence in this assessment of construct validity. Exclusion of items was based on two
judgments: (1) high number of N/A responses; (2) the potential for the item to form part of a
domain created based on face validity with other items that were not included or did not load
(<0.3) in the factor analysis. Items not included in a domain category were dubbed "stand-alone
items".
Cronbach's Alpha for Internal Consistency
Internal consistency was assessed to determine whether items within domains and within an
entire survey were homogeneous. High internal consistency is desirable as it indicates that
summary scores (domain or total survey scores) are reflective of the individual item scores
(within domains or the entire survey). Internal consistency for each domain and each survey was
assessed using Cronbach's Alpha. Alpha values should ideally fall between 0.70 (good) and 0.90
(excellent) (45) although 0.50 has been identified as a minimum acceptable value (48). To
perform this analysis, item scores were transformed to linear values on the standard normal
distribution.
Item-to-Domain Correlations
Corrected item-to-domain correlation coefficients were calculated to assess the homogeneity of
the items within each domain. Item-to-domain correlations indicate the importance of an item to

!45!
its domain. There is no agreed upon minimum value indicating importance of an item but
common rules of thumb range from 0.2 (45) to 0.4 (49). I chose a value of 0.3 as an indication of
the value on an item to its domain. To perform this analysis, individual dichotomous and ordinal
item scores were transformed to linear values on the standard normal distribution. Pearson
product-moment correlations were used as they are recommended for this analysis (45). It is
suggested that point biserial correlations are used for dichotomous items however, given the mix
of ordinal and dichotomous scales, this computation could not be completed (45).
Correlations Between Domains/Items and the Global Rating Item
Correlations between each domain/item and the global rating item were calculated to assess
construct validity (domains/items should correlate highly with the global rating). A mean of the
item scores was calculated for each domain and used as the summary domain value. This was
done to use all available data and obtain a domain score even if one item within the domain
received a response of 'not applicable'. Pairwise Spearman's rank correlation coefficients were
used to correlate ordinal items and the global rating item. The Bonferroni correction was used to
account for multiple testing. Point biserial correlations were used to assess the relationship
between dichotomous items and the global scale. For these correlations, the global scale was
assumed to have a continuous underlying distribution and was treated as a continuous variable.
Correlations were assessed for significance at the p<0.001 level.
Intercorrelations Between Domains
Intercorrelations between domains/stand-alone items were calculated to determine if they were
measuring distinct aspects of care. If correlations were above 0.70, the domains/stand-alone

!46!
items were considered to be redundant. A mean of the item scores was calculated for each
domain and used as the summary domain value. Pairwise Spearman's rank correlation
coefficients were used for ordinal stand-alone item and domain-domain correlations. Point
biserial correlations were calculated for dichotomous and domain/ordinal correlations. In these
cases, ordinal variables were assumed to have an underlying continuous distribution. The
pairwise method was used to make full use of all available data.
Regressions
Multivariate ordinal regression was used on acute and post-acute surveys to determine if
domains and select items were individually associated with the global rating item after adjusting
for scores on all other domains/items. The hypothesis behind this assessment was that patient
experiences (quantified by the domains/items) highly relevant to patients' perceptions of injury
care quality should be significantly and independently associated with the global rating item
(overall evaluation of the quality of care).
Relationships between domains/stand-alone items and the global score were assessed. A linear
mean of the item scores was calculated for each subscale and used as the summary subscale
value. To simplify the regression, the stand-alone item on unsafe care (not included in a domain
category in acute or post-acute survey) was collapsed to indicate whether unsafe care was
experienced (never versus sometimes, usually, always) and treated as a dichotomous predictor.
Stand-alone items with 0-10 scales were treated as linear predictors. The 0–10 global rating
scales were treated as ordinal outcome data however, the scale was collapsed to a three level
outcome: high quality score (9-10), middle quality (7-8), low quality (0-6) (50). This

!47!
categorization was made due to the fact that, in many of the attempted analysis, the number of
observations per outcome level was too small and eliminated the possibility of checking the key
assumption of ordinal regression: the proportional odds assumption. This assumption states that
the estimates yielded from an ordinal regression are proportional across each level (cut) of the
ordinal outcome. If this assumption is not met, the estimates do not accurately represent the data
and ordinal regression cannot be used. The proportional odds assumption was assessed using the
post-hoc Brant test in STATA. The three level outcome was chosen as this was the
categorization method used for presenting summary scores (Chapter 6.3.3.2) and has been used
in similar studies of well-validated surveys which utilized similar Likert and ordinal type scales
(38).
Regressions using item level data (i.e. 23 acute item predictors, 16 post-acute item predictors)
were attempted however, there were consistent issues with testing the assumption of proportional
odds, likely as the result of the reduction in sample size due to participants answering 'not
applicable' to one or more items. Although some analysis was possible using sub-sets of items
and adjusting for others using summary domain scores, I wanted to avoid conducting multiple
tests and drawing conclusions based on many sets of regression data. Therefore, item level
regressions were not completed.
Test-Retest Reliability
Test-retest reliability was assessed for items with ordinal scales (never-sometimes-usually-
always) using intra-class correlation coefficients calculated with a two-way random effects
model assessing absolute agreement (51). These items were assumed to have continuous
!48!
underlying distributions. Test-retest reliability for items with dichotomous scales (yes/no) was
assessed using Cohen's Kappa coefficient. Items answered 'not applicable' were not included in
the analysis. This resulted in small variations in the number of observations used to calculate
estimates for each item. There is no agreed upon standard for values of test-retest reliability and
what is considered 'good' varies slightly according to disciplines and the focus of measurement.
A common rule of thumb for good test-retest reliability is 0.70 (45, 49). Given the reduction in
sample size for some items I selected the cut-off 0.65 to indicate adequate reliability.
Convergent/Divergent Validity with the HCAHPS
Convergent/divergent validity of the acute care survey with the HCAHPS survey was assessed
using pairwise Spearman correlations. A mean of the item scores was calculated for each domain
on the QTAC-PREM and HCAHPS and used as the summary domain value. The pairwise
method was used to make full use of all available data. Spearman coefficients were used given
the presence of single ordinal items not included in the QTAC-PREM domain categories and the
ordinal nature of the data from which domain means were calculated. QTAC-PREM
domains/stand-alone items were expected to have higher correlations with similar domains on
the HCAHPS survey and lower correlations with domains assessing different aspects of care.
HCAHPS survey domains have been validated in previous studies (52).
6.3.3.2 Summary Scoring
Summary scores were examined to indicate whether the QTAC-PREM could be used to identify
variations in the quality of care from the patient perspective and to identify potential areas of
care that could be improved. Summary scores for each item and domain were calculated using a
!49!
method developed by the publishers of the HCAHPS (53). The three QTAC-PREM response
scales (yes/no, never-sometimes-usually-always, 0-10 rating) were categorized into high quality
(most positive), middle quality, and low quality (least positive) scores. High quality scores were
the most positive and included the 'yes' option of the dichotomous scale, the 'always' option of
the frequency scale (or 'never' for the two negatively worded items on receiving unsafe care and
unfair treatment), and '9-10' on the global rating scale. Middle quality scores included 'usually'
on the frequency scale and '7-8' on the global rating scale. Low quality scores included 'no' on
the dichotomous scale, 'sometimes' and 'never' on the frequency scale, and '0-6' on the global
rating scale. These categorizations were developed to simplify the process of reporting survey
results (50). The percentage of high-, middle-, and low- quality responses were calculated for
each item. These were averaged to produce the percent of high-, middle-, and low- quality
responses for each domain. Items answered with N/A were not included in the calculation.
6.3.3.3 Acute Care and Post-Acute Care Global Rating Comparison
Scores of the single global rating items were compared for patients that completed both surveys
to assess differences in overall acute and post-acute care. I used ordinal regression using the
global scores as an ordinal outcome. The full outcome scale could not be used as the low number
of observations in several of the outcome categories precluded the assessment of the proportional
odds assumption. Therefore, the outcome was categorized into a three level outcome (high-,
middle-, and low- quality). Time of completion (acute = time 1, post-acute = time 2) was entered
as a predictor variable. Two potential covariates were entered into the model. Health status was
assessed on the acute and post-acute survey. The change in health status from time 1 to time 2
was entered as a covariate as it is possible that ratings on the post-acute survey may partially

!50!
reflect increases/decreases in health status. Health status has been shown to impact evaluations of
patient experiences (54). The length of time between completion of the acute and post-acute
survey was also entered as a covariate because time between survey completion and the last
healthcare encounter has been shown to influence patient evaluations of care (54). I anticipated
that some participants would have finished their follow-up care by the date of post-acute survey
completion while others would still be attending appointments. A significance level of p<0.05
was selected for this analysis.
6.4 Results
Feasibility of Implementation (Figure 1, Table 10)
Figure 2 shows the details of participant enrollment and study flow. Across the three study sites,
512 patients/surrogates were approached, of which 400 returned completed surveys (78%
response rate). Of the 400 acute participants, 350 agreed to the post-acute survey and 190
telephone interviews were completed (54% response rate). At the time of post-acute survey
completion 34% of participants had attended a follow-up with one provider, 36% with two
providers, and 30% with three providers. Eighty-five percent of participants had more follow-up
appointments scheduled.
Table 10 shows characteristics of participants in the study. Patients were primarily male (70%)
and injured in motor-vehicle collisions (43%). Injury severity data was only available for 144
patients (remainder to be abstracted). Of those 144, 56% had major injuries (injury severity
score>12) with a median ISS of 20 and an interquartile range (IQR)=16, 27. Five percent of
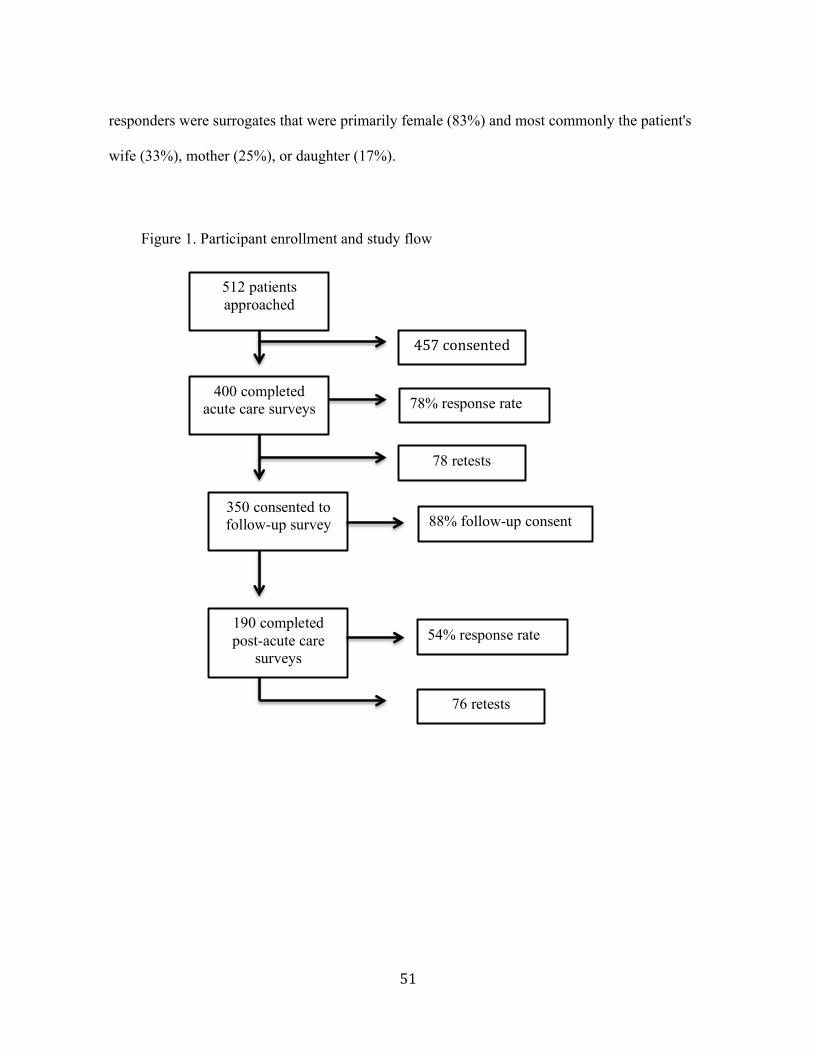
!51!
responders were surrogates that were primarily female (83%) and most commonly the patient's
wife (33%), mother (25%), or daughter (17%).
512 patients approached
400 completed acute care surveys
457!consented!
78% response rate
78 retests
350 consented to follow-up survey
190 completed post-acute care
surveys
88% follow-up consent
54% response rate
76 retests
Figure 1. Participant enrollment and study flow !

!52!
Table 10. Prospective cohort study participant characteristics Participant Characteristics [n=400]
Patients 95% (387) Male 70% Age, median years (IQR) 45 (27, 58) Ethnicity Caucasian 75% Asian/East Indian 9% Aboriginal/First Nations 7% Education High school or less 46% Some college or more 54% Residence Alberta 89% Urban 81% Mechanism of injury Motor vehicle 43% Fall 38% Assault 12% Acute care self rated health Poor, fair, or good 66% Very good or excellent 34% Post-Acute care self rated health Poor, fair, or good 74% Very good or excellent 23% Clinical Characteristics n=144 ISS<12 44% ISS>12 ISS, median (IQR)
56% 20 (16, 27)
Surgery during hospital staya 25% Intensive care unit admission during hospital staya 13% Hospital length of stay, median (IQR) b 8 (5, 17) Survey Information Days between acute and follow-up survey, median (full range) 83 (75, 90) Surrogates 5% (22) Female 83% Age, median years (IQR) 52 (36, 58) Relationship to patient Wife 33% Mother 25% Daughter 17% Education High school or less 38% Some college or more 62% aData for 144 Foothills patients currently available in the trauma registry. b200 foothills patients only.
!53!
Comparisons of post-acute responders versus non-responders showed no significant differences
in sex, injury severity, education, or ethnicity. However, there was a significant difference in age
(p=0.002) with older people more likely to respond to the post-acute survey. The mean age of
respondents was 48 (95%CI=46-51) compared to 40 for non-respondents (95%CI=36-43). There
was also a significant difference in the distribution of injury mechanism among post-acute
responders compared to non-responders (p=0.005). Patients that did not complete the post-acute
survey were more likely injured due to an assault (21% versus 5%).
Item level response distributions are shown for the acute survey in Appendix E and the post-
acute survey in Appendix F. Overall, there was very little missing data. There was variation in
the distributions of responses to each item. A select number of items received moderate to high
percentages of 'not applicable' responses (acute items: 20-helped with difficulty breathing,
21-helped with agitation, 29-religious preferences respected; post-acute items: 13-addressed
concerns, 14-information consistent, 5-received support services, 16-information sent to family
physicians or GP, 8b- difficulty getting appointments with family physician or GP, 8c-difficulty
getting appointments with physio, rehab, or occupational therapists).
6.4.1 Psychometric Assessments (Table 11, Table 12)
Table 11 and Table 12 show visual summaries of the psychometric analyses and indicate whether
the results were supportive (+) or unsupportive (-) of the validity and reliability of the tool.
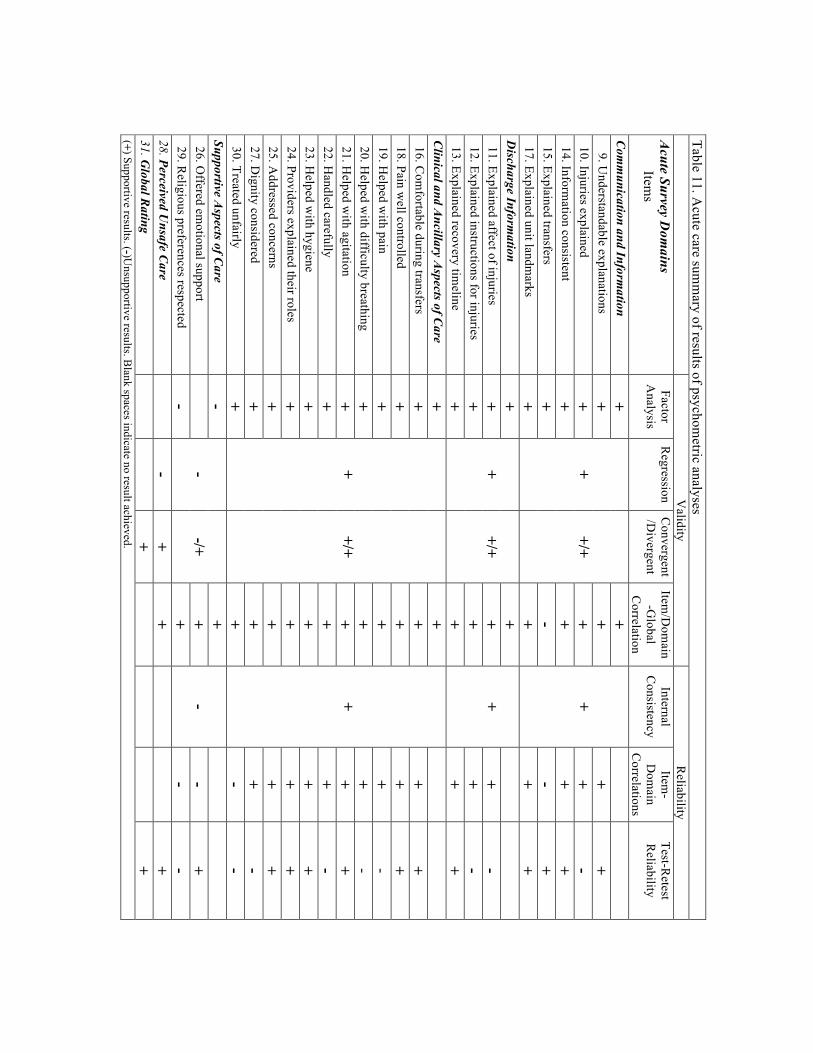
!
Table 11. Acute care sum
mary of results of psychom
etric analyses
Validity
Reliability
Acute Survey D
omains
Items
Factor A
nalysis R
egression C
onvergent/D
ivergent Item
/Dom
ain-G
lobal C
orrelation
Internal C
onsistency Item
-D
omain
Correlations
Test-Retest
Reliability
Com
munication and Inform
ation +
+
+/+
+ +
9. Understandable explanations
+ +
+ +
10. Injuries explained +
+ +
- 14. Inform
ation consistent +
+ +
+ 15. Explained transfers
+ -
- +
17. Explained unit landmarks
+ +
+ +
Discharge Inform
ation +
+
+/+ +
+
11. Explained affect of injuries
+ +
+ -
12. Explained instructions for injuries +
+ +
- 13. Explained recovery tim
eline +
+ +
+ C
linical and Ancillary A
spects of Care
+ +
+/+
+ +
16. Com
fortable during transfers +
+ +
+ 18. Pain w
ell controlled +
+ +
+ 19. H
elped with pain
+ +
+ -
20. Helped w
ith difficulty breathing +
+ +
- 21. H
elped with agitation
+ +
+ +
22. Handled carefully
+ +
+ -
23. Helped w
ith hygiene +
+ +
+ 24. Providers explained their roles
+ +
+ +
25. Addressed concerns
+ +
+ +
27. Dignity considered
+ +
+ -
30. Treated unfairly +
+ -
- Supportive A
spects of Care
- -
-/+ +
-
26. O
ffered emotional support
+
- +
29. Religious preferences respected
- +
- -
28. Perceived Unsafe C
are
- +
+
+
31. Global R
ating
+
+
(+) Supportive results. (-)Unsupportive results. B
lank spaces indicate no result achieved.

!55!
Table 12. Post-acute care summ
ary of results of psychometric analyses
V
alidity R
eliability
Post-Acute Survey D
omains
Items
Factor A
nalysis R
egression Item
/Dom
ain-G
lobal C
orrelation
Internal C
onsistency Item
-Dom
ain C
orrelations Test-R
etest R
eliability
Discharge Preparedness
+ -
+ -
2. Received w
ritten discharge instructions +
- -
+ 3. U
seful discharge instructions
-
+ 5. R
eceived support services +
+ -
+ C
omm
unication, Information, and G
uidance +
+
+ +
9. Explained next steps in recovery +
+ +
+ 10. R
ecovery timeline described
+ +
+ -
11. Received all inform
ation wanted
+ +
+ +
12. Understandable explanations
+ +
+ +
13. Addressed concerns
+ +
+ +
14. Information consistent
+ +
+ +
17. Guidance through post-discharge recovery
+ +
+ +
Appointm
ent Scheduling
-
- -
Difficulty getting appointm
ents with a...
8a. Trauma doctor, surgeon, or specialist
-
- +
8b. Family physician or general practitioner
-
- +
8c. Physio, rehab, or occupational therapist
- -
+ 4. Pain M
anagement
- -
-
+
15. Perceived unsafe care
-
-
16. Fam
ily Physician Informed
- +
+
+
18. Global rating
+
(+) Supportive results. (-)Unsupportive results. B
lank spaces indicate no result achieved.

!
Exploratory Factor Analysis (Table 13, Table 14)
A three factor solution was selected for the acute care factor analysis. The three factors had
unrotated eigenvalues of 6.7, 1.6, and 0.95. Although the third factor did not have an eigenvalue
greater than one, the three factor model was selected due to the amount of cumulative variance
accounted for (88%) and the interpretability of the results. One item was not included in the
analysis (religious preferences considered) because 55% of participants answered 'not
applicable'. A sample size of 97 was used in the analysis. Table 13 shows the domains (factors)
yielded from the analysis with corresponding items, their factor loadings, and their unique
variance not accounted by the common factors. The three domains obtained in the analysis were
labeled communication and information; discharge information; clinical and ancillary aspects of
care. Clinical and ancillary aspects of care appeared to describe clinical processes from the
patient perspective including the delivery of physical care (comfort, pain management) and
secondary issues relevant to clinical processes including being treated fairly, having concerns
addressed, and being able to identify members of the care team. Correlations between the rotated
factors were 0.23, 0.29, and 0.43, suggesting small to moderate overlap among the domains. The
domain 'supportive aspects of care' was created based on face validity using items that did not
load or were not included in the factor analysis.

!57!
Table 13. Results of the acute care factor analysisa. Acute Survey Domains Items
Factor Loadings Uniqueness of Error
Communication and Information 9. Understandable explanations 0.46 0.63 10. Injuries explained 0.74 0.49 14. Information consistent 0.48 0.53 15. Explained transfers 0.33 0.83 17. Explained unit landmarks 0.31 0.71 Discharge Information 11. Explained affect of injuries 0.72 0.42 12. Explained instructions to care for injuries 0.71 0.50 13. Explained recovery timeline 0.61 0.54 Clinical and Ancillary Aspects of Care 16. Comfortable during transfers 0.74 0.56 18. Pain well controlled 0.40 0.63 19. Helped with pain 0.49 0.44 20. Helped with difficulty breathing 0.74 0.44 21. Helped with agitation 0.76 0.28 22. Handled carefully 0.75 0.35 23. Helped with hygiene 0.74 0.45 24. Providers explained their roles 0.57 0.63 25. Addressed concerns 0.67 0.45 27. Dignity considered 0.69 0.33 30. Treated unfairly 0.40 0.71 Supportive Aspects of Careb (face validity) 26. Offered emotional support * 0.79 29. Religious preferences respected ** 28. Perceived Unsafe Care ** an=97. bDomain created based on face validity to accommodate item 26 and item 29. *Item did not load on any factor. **Item not included in the factor analysis.
A two factor solution was selected for the post-acute care factor analysis. The two factors had
unrotated eigenvalues of 2.5 and 0.70. Although the second factor did not have an eigenvalue
greater than one, the two factor model was selected due to the amount of cumulative variance
accounted for (97%) and the interpretability of the results. Three items on difficulties getting
follow-up appointments were excluded (8a-trauma doctor, surgeon, specialist; 8b-family
physician, general practitioner; 8c-physio, rehab, or occupational therapist). Two of the items
had almost zero variance (all answered 8b & 8c 'yes'), which caused a conformability error. All
three were excluded from the analysis to form a domain based on face validity: appointment

!58!
scheduling. Collinearity between item 2 and item 3 resulted in item 3 being dropped from the
analysis (fewer participants answered item 3; dropped to increase sample size). A sample size of
57 was used in the analysis. Table 14 shows the domains yielded from the analysis with
corresponding items, their factor loadings, and their unique variance not accounted for by the
common factors. The two domains obtained in the analysis were labeled discharge preparedness
and communication, information, and guidance. The correlation between the domains was 0.45.
Items on pain management and the amount of information transferred between the hospital and
the patient's family physician did not load on any factors.
Table 14. Result of the post-acute care factor analysisa. Post-Acute Survey Domains Items
Factor Loadings Uniqueness of Error
Discharge Preparedness 2. Received written discharge instructions 0.66 0.64 3. Useful discharge instructions ** ** 5. Received support services 0.53 0.74 Communication, Information, and Guidance 9. Explained next steps in recovery 0.49 0.61 10. Described recovery timeline 0.41 0.87 11. Received all information wanted 0.48 0.80 12. Understandable explanations 0.68 0.57 13. Addressed concerns 0.55 0.62 14. Information consistent 0.53 0.75 17. Guidance through post-discharge recovery 0.59 0.41 Appointment Schedulingb Difficulty getting appointments with a... 8a. Trauma doctor, surgeon, or specialist ** 8b. Family physician or general practitioner ** 8c. Physio, rehab, or occupational therapist ** 4. Pain Management * 0.97 15. Perceived Unsafe Care ** . 16. Family Physician Informed * 0.90 an=57. bDomain created based on face validity to accommodate item 8a, item 8b, and item 8c. *Item did not load on any factor. **Item not included in the factor analysis.
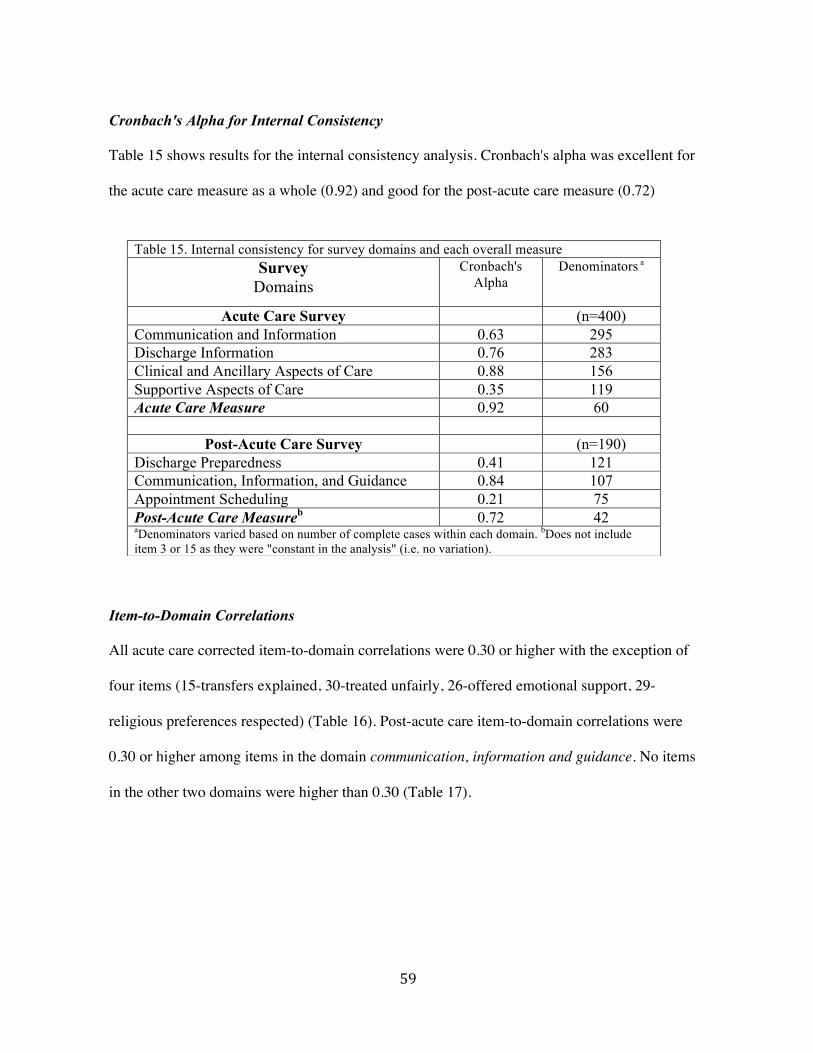
!59!
Cronbach's Alpha for Internal Consistency
Table 15 shows results for the internal consistency analysis. Cronbach's alpha was excellent for
the acute care measure as a whole (0.92) and good for the post-acute care measure (0.72)
Item-to-Domain Correlations
All acute care corrected item-to-domain correlations were 0.30 or higher with the exception of
four items (15-transfers explained, 30-treated unfairly, 26-offered emotional support, 29-
religious preferences respected) (Table 16). Post-acute care item-to-domain correlations were
0.30 or higher among items in the domain communication, information and guidance. No items
in the other two domains were higher than 0.30 (Table 17).
Table 15. Internal consistency for survey domains and each overall measure Survey
Domains Cronbach's
Alpha Denominators a
Acute Care Survey (n=400) Communication and Information 0.63 295 Discharge Information 0.76 283 Clinical and Ancillary Aspects of Care 0.88 156 Supportive Aspects of Care 0.35 119 Acute Care Measure 0.92 60
Post-Acute Care Survey (n=190) Discharge Preparedness 0.41 121 Communication, Information, and Guidance 0.84 107 Appointment Scheduling 0.21 75 Post-Acute Care Measureb 0.72 42 aDenominators varied based on number of complete cases within each domain. bDoes not include item 3 or 15 as they were "constant in the analysis" (i.e. no variation).

!60!
Correlations Between Domains/Items and the Global Item
All domains and items on the acute survey were significantly associated (p<0.001) with the
global item, with the exception of the item 'explained transfers' (Table 16). The majority of post-
acute items were significantly associated (p<0.001) with the global item however, non-
significant correlations were found for the domain (and items within) appointment scheduling,
and the items about pain management, perceived unsafe care, whether patients received
discharge instructions and useful discharge instructions (Table 17).
Intercorrelations Between Domains [not included in summary table]
Correlations among acute care domains and stand-alone items were moderate (0.09 - 0.59, most
above 0.30), while correlations among post-care care domains and stand-alone items were low to
moderate (0.00 - 0.35). None were redundant (>0.7).

!
Table 16. Acute care item-to-domain correlations and domain/item to global correlations Acute Survey Domains Items
Item-to-Domain Correlationa
Denominator (n=400)b
Domain/Item-to-Global
Correlation c Denominator (n=400)d
Communication and Information n=295 0.52* 9. Understandable explanations 0.48 0.46* 10. Injuries explained 0.41 0.34* 14. Information consistent 0.44 0.47* 15. Explained transfers 0.25 0.16 17. Explained unit landmarks 0.33 0.31* Discharge Information n=283 0.34* 11. Explained affect of injuries 0.68 0.35* 12. Explained instructions to care for injuries 0.59 0.29* 13. Explained recovery timeline 0.51 0.19* Clinical and Ancillary Aspects of Care n=156 0.67* 16. Comfortable during transfers 0.50 0.36* 18. Pain well controlled 0.48 0.50* 19. Helped with pain 0.65 0.51* 20. Helped with difficulty breathing 0.68 0.43* 21. Helped with agitation 0.73 0.57* 22. Handled carefully 0.72 0.44* 23. Helped with hygiene 0.57 0.40* 24. Providers explained their roles 0.52 0.44* 25. Addressed concerns 0.62 0.55* 27. Dignity considered 0.68 0.44* 30. Treated unfairly 0.29 0.28* Supportive Aspects of Care n=119 0.25* 26. Offered emotional support 0.21 0.23* 29. Religious preferences respected 0.21 0.25* 28. Perceived Unsafe Caree . 0.34* aPearson product-moment correlations corrected for overlap. bDenominators varied based on the number of complete cases within each domain/item. c Spearman correlations (including Bonferroni correction to account for multiple testing) and point biserial correlations. dDenominators varied from n=172 to n=399. eStand-alone item not included in a composite domain.*Significant at the p<0.001 level.

!
Table 17. Post-acute care item-to-domain score correlations and domain/item to global correlations Post-Acute Survey Domains Items
Item-to-Domain Correlationa
Denominator (n=190)b
Domain/Item-to-Global
Correlationc Denominator
(n=190) d Discharge Preparedness n=121 0.34* 2. Received written discharge instructions 0.25 0.24 3. Useful discharge instructionse . 0.15 5. Received support services 0.25 0.34* Communication, Information, and Guidance n=107 0.72* 9. Explained next steps in recovery 0.63 0.54* 10. Recovery timeline described 0.42 0.31* 11. Received all information wanted 0.59 0.49* 12. Understandable explanations 0.64 0.43* 13. Addressed concerns 0.57 0.45* 14. Information consistent 0.62 0.37* 17. Guidance through post-discharge recovery 0.76 0.78* Appointment Scheduling n=83 0.21 Difficulty getting appointments with a... 8a. Trauma doctor, surgeon, or specialist 0.16 0.17 8b. Family physician or general practitioner 0.15 0.14 8c. Physio, rehab, or occupational therapist 0.08 0.19 4. Pain Management f . 0.25 15. Perceived Unsafe Care e, f . 0.05 16. Family Physician Informed f . 0.44* aPearson product-moment correlations corrected for overlap. bDenominators varied based on the number of complete cases within each domain/item. cSpearman correlations (including Bonferroni correction to account for multiple testing) and point biserial correlations. dDenominators varied from n=118 to n=190. e Item not included in calculated correlations due non-variability. fStand-alone item not included in a composite domain. *Significant at the p<0.01 level.
Regressions
The acute care domain/stand-alone item regression included 367 observations. Thirty-three
participants either answered N/A to the item on 'unsafe care' or N/A to all items within a domain
and were therefore excluded from the analysis. Three of the acute care domains were
significantly associated with scores on the global rating item: communication and information
(p=0.006), discharge information (p=0.001), clinical and ancillary aspects of care (p<0.001).
!63!
The remaining domain supportive aspects of care (p=0.09) and the stand-alone item on 'unsafe
care' (p=0.112) did not have significant associations. The proportional odds assumption was met.
The post-acute care domain/stand-alone item regression included 107 observations. Eighty-three
participants either answered N/A to one of the stand-alone items or to all items within a domain
and were therefore excluded from the analysis. The composite domain communication,
information, and guidance (p<0.001) and stand-alone item 'family physician informed' (item 16)
(p=0.008) were significantly associated with scores on the global rating item. The two other
composite domains discharge preparedness (p=0.435) and appointment scheduling (p=0.109)
and the other two stand alone items 'perceived unsafe care' (p=0.809) and 'pain management'
(p=0.238) did not have significant associations. The proportional odds assumption was met.
Appendix G and Appendix H show outputs of the regressions for acute and post-acute care
surveys, respectively.
Test-Retest Reliability
Table 18 (acute) and Table 19 (post-acute) show estimates for test-retest reliability. On the acute
survey, estimates ranged from 0.42 to 0.88 with 61% of items achieving coefficients above 0.65.
On the post-acute survey, estimates ranged from 0.55 to 1.00 with 94% of items achieving
coefficients above 0.65. Global ratings on the acute (0.85) and post-acute survey (0.90) had
excellent reliability. The median acute retest interval was 2 days (IQR= 1, 3) with a total range of
1 to 14 days, while the median post-acute retest was 8 days (IQR=8, 12) with a total range of 4 to
30 days.
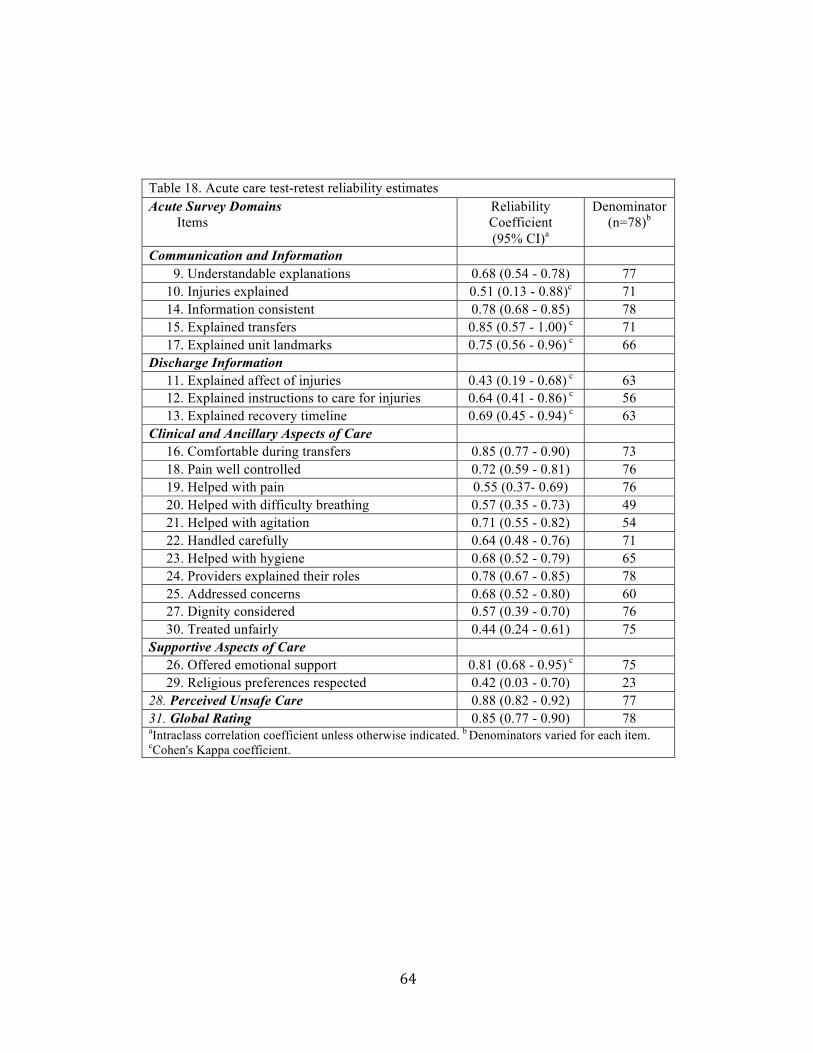
!64!
Table 18. Acute care test-retest reliability estimates Acute Survey Domains Items
Reliability Coefficient (95% CI)a
Denominator (n=78)b
Communication and Information 9. Understandable explanations 0.68 (0.54 - 0.78) 77 10. Injuries explained 0.51 (0.13 - 0.88)c 71 14. Information consistent 0.78 (0.68 - 0.85) 78 15. Explained transfers 0.85 (0.57 - 1.00) c 71 17. Explained unit landmarks 0.75 (0.56 - 0.96) c 66 Discharge Information 11. Explained affect of injuries 0.43 (0.19 - 0.68) c 63 12. Explained instructions to care for injuries 0.64 (0.41 - 0.86) c 56 13. Explained recovery timeline 0.69 (0.45 - 0.94) c 63 Clinical and Ancillary Aspects of Care 16. Comfortable during transfers 0.85 (0.77 - 0.90) 73 18. Pain well controlled 0.72 (0.59 - 0.81) 76 19. Helped with pain 0.55 (0.37- 0.69) 76 20. Helped with difficulty breathing 0.57 (0.35 - 0.73) 49 21. Helped with agitation 0.71 (0.55 - 0.82) 54 22. Handled carefully 0.64 (0.48 - 0.76) 71 23. Helped with hygiene 0.68 (0.52 - 0.79) 65 24. Providers explained their roles 0.78 (0.67 - 0.85) 78 25. Addressed concerns 0.68 (0.52 - 0.80) 60 27. Dignity considered 0.57 (0.39 - 0.70) 76 30. Treated unfairly 0.44 (0.24 - 0.61) 75 Supportive Aspects of Care 26. Offered emotional support 0.81 (0.68 - 0.95) c 75 29. Religious preferences respected 0.42 (0.03 - 0.70) 23 28. Perceived Unsafe Care 0.88 (0.82 - 0.92) 77 31. Global Rating 0.85 (0.77 - 0.90) 78 aIntraclass correlation coefficient unless otherwise indicated. b Denominators varied for each item. cCohen's Kappa coefficient.
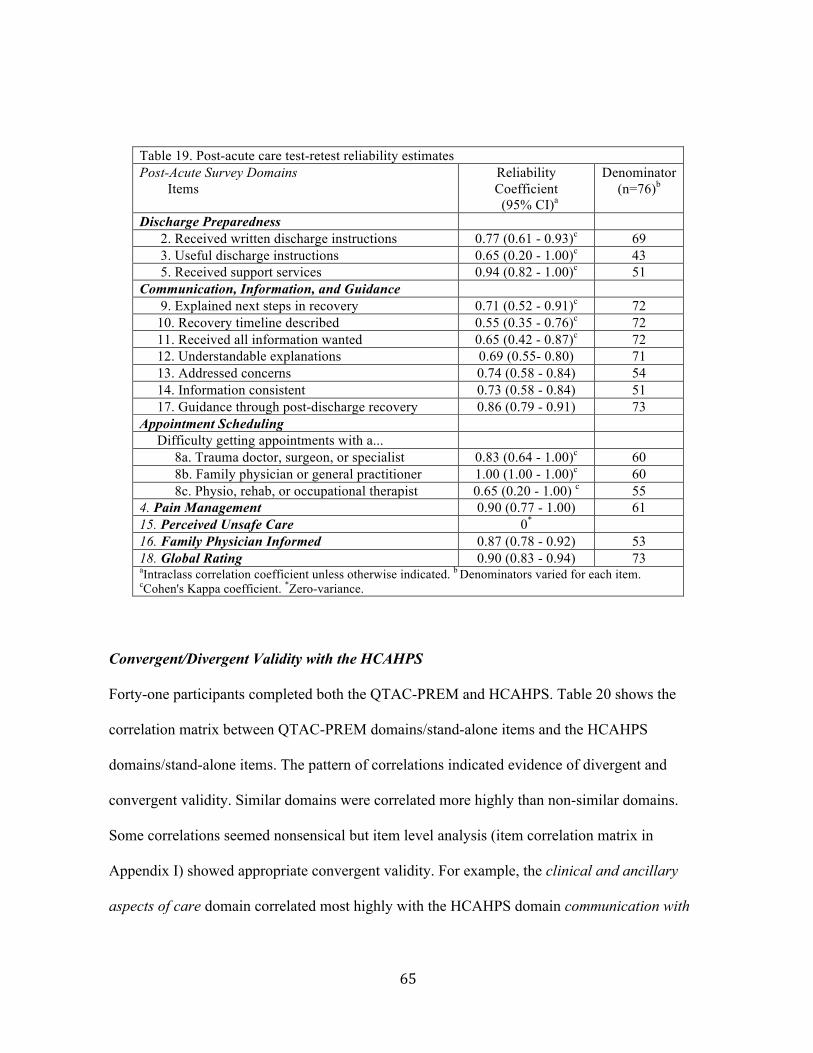
!65!
Table 19. Post-acute care test-retest reliability estimates Post-Acute Survey Domains Items
Reliability Coefficient (95% CI)a
Denominator (n=76)b
Discharge Preparedness 2. Received written discharge instructions 0.77 (0.61 - 0.93)c 69 3. Useful discharge instructions 0.65 (0.20 - 1.00)c 43 5. Received support services 0.94 (0.82 - 1.00)c 51 Communication, Information, and Guidance 9. Explained next steps in recovery 0.71 (0.52 - 0.91)c 72 10. Recovery timeline described 0.55 (0.35 - 0.76)c 72 11. Received all information wanted 0.65 (0.42 - 0.87)c 72 12. Understandable explanations 0.69 (0.55- 0.80) 71 13. Addressed concerns 0.74 (0.58 - 0.84) 54 14. Information consistent 0.73 (0.58 - 0.84) 51 17. Guidance through post-discharge recovery 0.86 (0.79 - 0.91) 73 Appointment Scheduling Difficulty getting appointments with a... 8a. Trauma doctor, surgeon, or specialist 0.83 (0.64 - 1.00)c 60 8b. Family physician or general practitioner 1.00 (1.00 - 1.00)c 60 8c. Physio, rehab, or occupational therapist 0.65 (0.20 - 1.00) c 55 4. Pain Management 0.90 (0.77 - 1.00) 61 15. Perceived Unsafe Care 0* 16. Family Physician Informed 0.87 (0.78 - 0.92) 53 18. Global Rating 0.90 (0.83 - 0.94) 73 aIntraclass correlation coefficient unless otherwise indicated. b Denominators varied for each item. cCohen's Kappa coefficient. *Zero-variance.
Convergent/Divergent Validity with the HCAHPS
Forty-one participants completed both the QTAC-PREM and HCAHPS. Table 20 shows the
correlation matrix between QTAC-PREM domains/stand-alone items and the HCAHPS
domains/stand-alone items. The pattern of correlations indicated evidence of divergent and
convergent validity. Similar domains were correlated more highly than non-similar domains.
Some correlations seemed nonsensical but item level analysis (item correlation matrix in
Appendix I) showed appropriate convergent validity. For example, the clinical and ancillary
aspects of care domain correlated most highly with the HCAHPS domain communication with
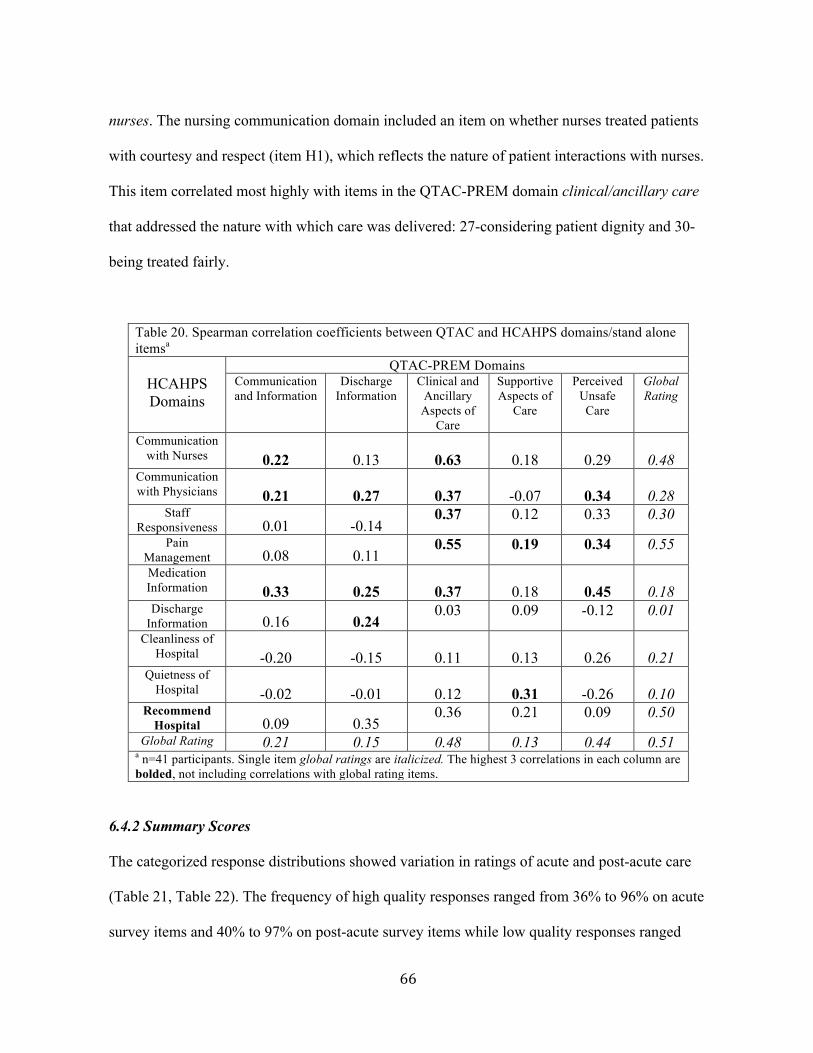
!66!
nurses. The nursing communication domain included an item on whether nurses treated patients
with courtesy and respect (item H1), which reflects the nature of patient interactions with nurses.
This item correlated most highly with items in the QTAC-PREM domain clinical/ancillary care
that addressed the nature with which care was delivered: 27-considering patient dignity and 30-
being treated fairly.
Table 20. Spearman correlation coefficients between QTAC and HCAHPS domains/stand alone itemsa
HCAHPS Domains
QTAC-PREM Domains Communication and Information
Discharge Information
Clinical and Ancillary Aspects of
Care
Supportive Aspects of
Care
Perceived Unsafe Care
Global Rating
Communication with Nurses 0.22 0.13
0.63
0.18
0.29
0.48
Communication with Physicians 0.21 0.27
0.37
-0.07
0.34
0.28
Staff Responsiveness 0.01 -0.14
0.37 0.12 0.33 0.30
Pain Management 0.08 0.11
0.55 0.19 0.34 0.55
Medication Information 0.33 0.25
0.37
0.18
0.45
0.18
Discharge Information 0.16 0.24
0.03 0.09 -0.12 0.01
Cleanliness of Hospital -0.20 -0.15
0.11
0.13
0.26
0.21
Quietness of Hospital -0.02 -0.01
0.12
0.31
-0.26
0.10
Recommend Hospital 0.09 0.35
0.36 0.21 0.09 0.50
Global Rating 0.21 0.15 0.48 0.13 0.44 0.51 a n=41 participants. Single item global ratings are italicized. The highest 3 correlations in each column are bolded, not including correlations with global rating items.
6.4.2 Summary Scores
The categorized response distributions showed variation in ratings of acute and post-acute care
(Table 21, Table 22). The frequency of high quality responses ranged from 36% to 96% on acute
survey items and 40% to 97% on post-acute survey items while low quality responses ranged

!67!
from 3% to 56% in acute care and 3% to 34% in post-acute care. The items receiving the most
high quality ratings in acute care were "injury explanations" (93%) and "transfer explanations"
(96%) while those receiving the most low quality ratings were "offered emotional support"
(56%) and "effect of injuries explained" (26%). Fourteen percent of participants reported
experiencing an unsafe act of care (Table 21). The items receiving the most high quality ratings
in post-acute care were "perceived unsafe care " (97%) and "getting appointment with physio,
rehab or occupational therapists" (96%) while those receiving the most low quality ratings were
"family physician informed" (34%) and "recovery timeline described" (33%).
Global Ratings of Acute Care Compared to Post-Acute Care
Among those completing both surveys, global ratings of the quality of acute injury care were
significantly higher than global ratings for post-acute care (top-box 62% vs. 46%, middle-box
28% vs. 36%, low-box 10% vs. 18%, p=0.02).

!68!
Table 21. Acute care item and domain summary scores Acute Care Domains Items
Summary Response Categories Denominatorb
(n=400) % Low Quality
% Middle Qualitya
% High Quality
Communication and Information 12 16 72 9. Understandable explanations 10 33 57 399 10. Injuries explained 7 0 93 379 14. Information consistent 17 47 36 396 15. Explained transfers 4 0 96 355 17. Explained unit landmarks 22 0 78 340 Discharge Information 22 0 78 11. Explained affect of injuries 26 0 74 350 12. Explained instructions to care for injuries 22 0 78
320
13. Explained recovery timeline 19 0 81 349 Clinical and Ancillary Aspects of Care 11 26 63 16. Comfortable during transfers 7 33 60 380 18. Pain well controlled 13 38 49 396 19. Helped with pain 7 25 68 397 20. Helped with difficulty breathing 6 15 79 250 21. Helped with agitation 18 34 48 292 22. Handled carefully 6 26 68 370 23. Helped with hygiene 19 30 51 360 24. Providers explained their roles 11 26 63 398 25. Addressed concerns 17 29 54 322 27. Dignity considered 12 26 62 390 30. Treated unfairly 3 6 91 395 Supportive Aspects of Care 37 5 58 26. Offered emotional support 56 0 44 381 29. Religious preferences respected 18 10 72 172 28. Perceived Unsafe Care 3 11 86 394 31. Global Rating 9 31 60 399 aSome items did not include a middle-quality option. bDenomintors vary as participants answering N/A or not able to answer were excluded.

!69!
Table 22. Post-acute care item and domain summary scores Post-Acute Domains Items
Summary Response Categories Denominatorb
(n=190) % Low Quality
% Middle Qualitya
% High Quality
Discharge Preparedness 14 0 83 2. Received written discharge instructions 26 0 74 180 3. Useful discharge instructions 9 0 91 133 5. Received support services 17 0 83 127 Communication, Information, and Guidance 21 15 64 9. Explained next steps in recovery 19 0 81 181 10. Recovery timeline described 33 0 67 181 11. Received all information wanted 19 0 81 182 12. Understandable explanations 16 23 61 181 13. Addressed concerns 19 21 60 146 14. Information consistent 17 28 55 126 17. Guidance through post-discharge recovery 23 37 40
189
Appointment Scheduling 7 0 93 Difficulty getting appointments with a... 8a. Trauma doctor, surgeon, or specialist 13 0 87 159 8b. Family physician or general practitioner 5 0 95 144 8c. Physio, rehab, or occupational therapist 4 0 96 118 4. Pain Management 20 0 80 164 15. Perceived unsafe care 3 0 97 179 16. Family Physician Informed 34 21 45 124 18. Global rating 18 36 46 188 aSome items did not include a middle-box option. bDenomintors vary as participants answering N/A or not able to answer were excluded.

!70!
6.5 Discussion
This prospective cohort study was conducted to assess the validity, reliability, and feasibility of
implementation of the QTAC-PREM in multiple trauma centres in Alberta. Four hundred injury
patients completed the acute care survey component and 190 completed the follow-up post-acute
care component. The survey was assessed for construct validity, test-retest reliability, internal
consistency, and convergent/divergent validity with an existing patient experience measure.
Survey results were also examined to determine if the tool could be used to identify variations in
patient quality of care evaluations.
The study results show that measuring patient injury care experiences is feasible in multiple
trauma centres. Seventy-eight percent of all patients/surrogates approached returned completed
acute care surveys and 54% of consenting participants completed post-acute surveys. Loss to
follow-up has been identified as a serious issue in trauma outcomes research and there is no
establish standard for which to compare (55). However, the follow-up rate in this study is
comparable (54% vs. 60%) to The National Study on Costs and Outcomes of Trauma
(56), a landmark trauma study which included follow-up telephone calls with patients at
3-months and 12-months post-discharge.
The results have provided evidence of validity and reliability for the majority of survey items.
Refer to Table 11 and Table 12 for summary results.
For the purpose of quality improvement, it is likely that item level data will be used as this is
more specific and actionable. However, factor analysis was conducted to provide insight into the
!71!
construct validity of items and to identify which items could be grouped into domains. Domain
level information can ease interpretation and reporting (50).
Although the factor analysis yielded five domains (three acute, two post-acute), based on the
host of analyses conducted, four domains have sufficient evidence to be reported in composite
scores (domains). The acute care survey includes three composite domains (communication and
information, clinical and ancillary aspects of care, discharge information) while the post-acute
survey includes one composite domain (communication, information, and guidance). Construct
validity for the items was provided by the factor analysis and item to global score correlations.
Also, each of these four domains was a strong predictor of the global rating of the quality of
injury care after accounting for scores on other items. The items in these domains showed
adequate internal consistency (Cronbach's Alpha) and nearly all were homogenous, without
being redundant.
The domain discharge preparedness was obtained through the factor analysis however, item
scores for this domain likely should be reported individually due to low internal consistency and
item-domain correlations. The domain was a predictor of the global rating in the regressions and
two items within the domain had significant (p<0.001) or near significant (p=0.0016)
correlations with the global score. These items will be retained. One item (item 3) may be
deleted due to limited evidence of validity.
The domains developed based on face validity (supportive aspects of care, appointment
scheduling) showed poor internal consistency and low item-domain correlations, which suggests

!72!
they do not measure similar constructs. The item on religious preferences (supportive aspects of
care) also showed low test-retest reliability and was only applicable to 55% of respondents.
Therefore, this item may be eliminated. Of the remaining items in these domains, only 'emotional
needs considered' had evidence of construct validity and it will be retained. The other three items
on 'difficulties getting appointments' are tagged for deletion.
The single items on 'perceived unsafe care' were left out of the acute and post-acute factor
analysis. The acute safety item had evidence of construct validity and test-retest reliability.
However, among complete cases, the post-acute safety item had no variability, which limited
analysis of this item. Overall, 3% of participants reported unsafe care in the post-discharge phase
and 14% reported an incident during acute care. These items will be published with the full-
length tool as they may be useful for trauma centres and researchers that seek to study the safety
of their care while including the patient perspective. A future study could assess concordance of
patient reports of unsafe care with other methods of safety incident detection to further validate
the items. There are very few published measures with close-ended items to elicit patient reports
of unsafe care (57).
Correlations among the acute care domains/stand-alone items were low to moderate, which
suggests they measure distinct aspects of care and are not redundant.
The majority of items on the surveys assessed in this study had adequate levels of test-retest
reliability. A few items on the acute survey did fall below the acceptable level selected a priori.
This may, in part, be due to the dynamic nature of acute care. The administration timeline for this

!73!
survey necessitated enrolling patients 1-2 days (or more) prior to discharge to allow the
opportunity for an in-hospital retest. Therefore, healthcare events could have occurred between
the first and second completion that influenced patient evaluations of their care and subsequently
the reliability estimates. However, if implemented as a quality improvement tool, administration
of the survey would occur at discharge, after all acute care had been received, and the underlying
constructs would be more stable. Despite this challenge, most items were found to be reliable.
Future studies may need to explore post-hospital administration of the acute care instrument to
re-evaluate test-retest reliability in a sub-set of acute care items that had lower reliability
coefficients in this study. The two items on the post-acute survey with low retest reliability are
candidates for deletion.
This is the first study to report validity and reliability for a measure developed to assess patient
experience with overall injury care. There are a small number of validated surveys used to assess
hospital experience (most notably the HCAHPS) however, they were developed to assess general
hospital care experiences. The acute care component of the QTAC-PREM also targets hospital
experience but was developed to focus on a collection of elements key for injury patients. A
secondary objective of this study addressed the convergent and divergent validity of the QTAC-
PREM with the HCAHPS. Overall, the correlation pattern of the acute care survey and the
HCAHPS suggested appropriate convergent and divergent validity. For the most part, similar
domains correlated more highly than non-similar domains. The magnitudes of the correlations
were primarily low to moderate (all less than 0.63, most less than 0.40), with high correlations

!74!
occurring only in the clinical and ancillary aspects of care domains. This suggests the surveys
are not redundant.
Another secondary objective of this study was to determine whether the QTAC-PREM could
operate to identify variations in patient ratings of care and identify areas of care that could be
improved. The response distributions and summary scores (high-, medium-, low- quality)
showed there is variation in injury patients' evaluations of care. The overall rating of post-acute
care was found to be significantly lower than acute care, suggesting lower quality of care after
discharge. The results suggest there may be opportunities to improve elements of in-hospital
clinical care including pain control, treatment of agitation, and addressing patient concerns
(responsiveness); the clarity and consistency of information in both acute and post-acute settings;
guidance through post-discharge recovery; and information sharing between the hospital and
patients' family physicians.
6.6 Limitations
This study has several limitations. First, the frequency of 'not applicable' responses to several
items introduced challenges in data analysis. Inclusion of this response in analysis yielded issues
with the interpretation of results. Although 'not applicable' is not missing data, it had to be
treated as such for analyses requiring complete cases. The main implications were for the factor
analysis and regressions. There is no agreed upon sample size necessary for factor analysis.
Suggestions for ratios of participants to items range from 3:1 to 10:1 and recommendations for
total sample sizes have ranged from 50 to 500 (47, 58). However, some studies have replicated
16 factor solutions with as few as 48 participants (original factor solution found with n=491)

!75!
(59). Examination of the magnitude of factor loadings (47), interpretability of findings, and
corroboration of other statistical methods provides support for the factor analysis results of this
study, despite lower sample sizes. The majority of items (62%) for the final five factors had
moderate (>0.5) to strong factor loadings (>0.7), the results were interpretable and the
Cronbach's alpha's for internal consistency and item-domain correlations ranged from adequate
to excellent. For the regressions, models attempting to incorporate all survey items (i.e. 23
predictor items for acute care survey) could not be built due to the low number of complete
cases. Adjustments for item scores were obtained using domain summary scores. The limitation
of this approach is that it provides a crude representation of individual item scores. However, this
was not the only assessment of construct validity and decisions to tag items for removal was not
based solely on this analysis. A second limitation was the respondent bias observed for the post-
acute survey. Assault victims and younger participants were less likely to complete the follow-up
telephone interview. Other studies have shown that age and mechanism of injury impact research
follow-up completion and attendance at clinical appointments (55, 60). Although this may affect
the generalizability of the post-acute survey, it should not affect the internal validity of the study.
A third limitation was that surrogates of patients who died as a result of their injuries were not
surveyed. Previous studies have shown that specialized sampling procedures may be necessary
for this population (1) and that components of care relevant to bereaved family members'
perceptions of hospital quality may differ from relatives of injury patients that live. Again, this
may impact the generalizability of the results but should not affect the study's internal validity.
Future studies could examine validation of a modified version of the QTAC-PREM in this
population. A fourth limitation is the possibility that common-method variance inflated the
associations between items/domains and the global rating. Common-method variance arises

!76!
when the method used to collect a predictor and outcome measure are the same. In this study,
both the items/domains (used as predictors) and the global rating (used as an outcome) were
collected on the same survey therefore, a proportion of the correlation may be due to the
common method of data collection. However, the methods used in this study are only one step in
the ongoing process of validation. Future studies could test predictive criterion validity utilizing
an outcome collected using different methods. For example, item/domain scores could be used to
predict subsequent healthcare utilization (30 day readmission, number/frequency of primary care
visits post-discharge) or health-related quality of life. A fifth limitation is the possibility that
patient ratings were influenced by social desirability bias, a common threat to measure validity
(61, 62). The completion of the measure in-hospital may have lead to increased social
desirability bias compared to mail-out survey measures. However, this issue had to be balanced
against the problem of recall and respondent bias, as well as feasibility. I selected in-hospital
administration to reduce recall bias and to improve response rates; studies show response rates
are often lower for mail-out surveys than on-site administration (62). The issue of social
desirability could be explored in future studies through comparison of results from in-hospital
and mail-out surveys. A fifth limitation is that the generalizability of the validity and reliability
of the tool to different types of health systems is unknown. However, this was a multi-centre
study of three Canadian trauma centres (two level 1 centres and one level 3 centre) and the
psychometric properties and operating characteristics of the survey likely generalize to similar
injury populations in similar health systems. Validation is an ongoing process and future studies
could aim to validate the survey in other population samples to increase the generalizability of
results.

!77!
6.7 Conclusions
The Quality of Trauma Care Patient-Reported Experience Measure (QTAC-PREM) is the first
measure developed to assess patient experiences with overall injury care. This study provides
evidence of the validity and reliability of the QTAC-PREM and suggests it is feasible to
implement in multiple trauma centres. This study also showed that the QTAC-PREM can be
used to identify variations in patient perceived quality of injury care. There are opportunities to
eliminate a small number of poorly performing items and create a more parsimonious tool. After
a small number of revisions, I hope this tool can be used for research and quality improvement in
injury care.
!78!
Chapter 7: Qualitative Analysis of Responses to Open-Ended Items on the Quality of
Trauma Care Patient-Reported Experience Measure (Sub-Study 3)
7.1 Background
Understanding the patient experience is necessary to deliver patient-centered care. Surveys with
close-ended items are a common method used to assess the patient experience (26). However,
qualitative data can be used to complement quantitative measures and may be useful for quality
improvement in healthcare (63). In free-text responses patients/family can describe important
elements of their experience without the constraints of pre-defined topics and response options.
While quantitative data may serve to flag instances of sub-optimal care, the detail and context
provided by qualitative data can yield additional insights to more thoroughly understand the
patient experience, to target patient defined gaps in care, and to shed light on possible
approaches to improve care for patients.
As described in Chapter 6 (sub-study 2), I conducted a study to measure patient experiences with
injury care using "The Quality of Trauma Care Patient-Reported Experience Measure (QTAC-
PREM)". The QTAC-PREM consists of two separately administered surveys (acute care, post-
acute care) with close-ended and open-ended questions. This sub-study focuses on the qualitative
results obtained from the open-ended questions. The objective of this study was to assess the
feasibility of obtaining data from open-ended questions on the QTAC-PREM and to gauge
the potential value of qualitative results in terms of their ability to supplement the
quantitative component and potentially contribute to guiding quality improvement efforts
in injury care.

!79!
7.2 Methods
This qualitative study was embedded in a prospective cohort study to measure patient
experiences with injury care in three trauma centres in Alberta (Foothills Medical Centre,
University of Alberta Hospital, Chinook Regional Hospital) using the QTAC-PREM.
For complete details of patient/surrogate enrollment refer to the Chapter 6.3 "Methods/Design".
7.2.1 Open-Ended Items and Coding Strategy
Both components (acute and post-acute) of the QTAC-PREM contained open-ended items to
elicit free-text responses from participants. The acute survey included four open ended items:
(1) 'What was the best aspect of the care you received?'; (2) 'What was the worst aspect of the
care you received?'; (3) 'Describe any care you received that was unsafe'; (4) 'Provide any
comments on how we can improve injury care for patients'. The post-acute survey included three
open ended items: (1) 'What was the best aspect of the follow-up care you received after being
discharged from the hospital?'; (2) 'What was the worst aspect of the follow-up care you received
after being discharged from the hospital?'; (3) 'What can we do to improve care for patients after
they are discharged from the hospital?'. Participant responses were analyzed using the methods
of thematic analysis. This method consists of assigning codes to summarize and describe free
text responses and subsequently grouping codes into overarching themes which accurately
reflected all main issues described in the original responses (64).
Participants' responses were imported verbatim into an excel spreadsheet and coded. A coding
framework was created to ensure inter-coder reliability and coding consistency. The framework
was serially revised to ensure that codes were capturing unique issues and that the themes

!80!
identified through the coding process were mutually exclusive and accurately described the data.
The constant comparative method was used to ensure reliability (65). The initial coding
framework was inductively developed by two reviewers (Niklas Bobrovitz, Dr. Mauricio Ferri)
using a sample of the data (n=75 acute care surveys, n=25 post-acute care surveys). The
reviewers independently coded the sample data and compared their list of codes and the coded
survey responses. The code lists were amalgamated and coding discrepancies were resolved
through discussion of precise definitions for each code and theme. Two reviewers (Niklas
Bobrovitz, Jamie Boyd) then re-tested the coding framework on a new sample of data (n=100
acute surveys, n=100 post-acute surveys), came to a consensus on codes for each response and
theme definition, and made final revisions to the framework. One reviewer (Niklas Bobrovitz)
then coded the remaining surveys. Codes were grouped into categories, which were then
grouped into broad themes. The categories act as subthemes as they represented the main issues
within each broad theme. They provide substance and granularity for each theme. For example,
"provider to provider communication" acts as a subtheme of "communication and information".
Participant responses that best characterize each theme/subtheme are presented in the results.
All codes included the distinction of "+positive" or "-negative". This ensured that all comments
were interpreted in the correct context. The frequency of each theme/subtheme was analyzed as
an indicator of their relative importance to patient injury care experiences. All responses were
coded but themes were de-duplicated for each respondent so that participants that repeated a
theme were only counted once. If a participant wrote a "+positive" and "-negative" comment
about the same theme both were counted. This approach avoided inflation of theme frequency

!81!
due to single participants writing multiple comments about the same theme, which would have
biased the assessment of a theme's relative importance.
7.2.2 Classifying Unsafe Care
Responses to the acute care question about unsafe care were coded separately, using a modified
version of a checklist for classifying patient adverse events. The checklist was developed by
Dr. Tom Stelfox and was originally based on criteria used in the Harvard Medical Practice Study
(66). The checklist was originally developed to determine the occurrence and classification of an
adverse event. I modified the framework to classify patient/family perceived unsafe acts of care.
The classification included the type of issue identified (e.g. drug related, operative) and the
outcome of the described safety incident.
Three modifications to the framework were made. First, the terms like "errors" and "injuries"
were replaced with the term "issues" to more accurately reflect the type of descriptions proffered
by participants. For example, "medical procedure-related injury" was modified to "medical
procedure-related issue" because a medical injury may not have occurred or could not be verified
based on the participant's description. Second, subcategories were added to the "supportive care
issues" category based on participant responses to more accurately classify the safety incidents
described. Third, the list of outcomes was expanded to include participant defined outcomes of
the perceived unsafe incident. The following outcomes were added: pain or discomfort, concern
or distress, and additional procedures. Participant described outcomes were captured to provide
insight into what patients/surrogates perceive to be unsafe. Appendix J contains the modified
framework for classifying patient/family perceived unsafe care.

!82!
Participant demographic and clinical information was collected using the survey, as well as from
the trauma registry, to describe the sample of participants.
7.3 Results
In total, 512 participants were approached, of which 400 consented (78%) and completed the
acute care survey. Of the 400 enrolled participants, 350 agreed to the follow-up survey and 190
completed the telephone interview (54%). Respondents were primarily male (70%) with a
median age of 45 years, and injured in motor-vehicle collisions (43%) (Table 10, Chapter 6.4).
See Chapter 6.4, Figure 1 for full details of participant enrollment and study flow.
7.3.1 Unsafe Care
Patient/Family Perceived Unsafe Care
Table 23 shows the classification of responses to the acute care safety question. Fifty-seven
participants (14%) described 61 unsafe acts of care, most commonly supportive care issues
(47%) including handling and moving of the patient, leaving the patient unattended
(e.g. bathroom, in bed) without access to the call button, and being given food the patient had
allergies to. Drug-related issues (25%) were second most common with incorrect medications
and poor reactions to medications most frequently described. The third most frequent unsafe care
described were medical procedure related issues (14%) with participants primarily identifying
instances of multiple/prolonged chest tube and intravenous catheter insertions that they perceived
to be a result of inadequate provider skill as well as poor explanations before procedures (x-
rays).
!83!
Table 24 shows outcomes of unsafe care described by participants. The majority of unsafe care
comments (70%) did not include an explicit description of outcome. Thirty percent of unsafe
care descriptions did include at least one explicit outcome. The most commonly described
outcome was pain or discomfort (23%), followed by concern or distress (7%), disability (5%),
and additional procedures (3%).

!
Table 23. Description of the 61 unsafe acts of care perceived by participants
Unsafe C
are Percent of Patients n=57
a
Exemplar Q
uotes
Supportive Care Issues:
nutrition problems, fluid-electrolyte-oxygen
saturation managem
ent, skin problems, excretory
problems, falls, call button not left in reach, contact
aggravating injured body region, cleanliness of room
.
47%
• Left in w
ashroom in a position from
which I could not reach call button.
• Received a m
eal with food I am
allergic to. • Turning m
e over with m
y neck brace. C2#. I felt I didn’t have any head
support when turned to m
y side. • IV
left on for too long causing excess fluid retention. • M
oving me w
hen I was in (too m
uch) pain.
Drug R
elated Issues: error in the m
ethod of use or dose, failure to recognize antagonistic or com
plementary drug-drug
interactions, inadequate monitoring of drug levels or
other inadequate follow-up, drug used
inappropriately, avoidable delay in treatment.
25%
• I got given the wrong pills tw
ice. They were pills that I got (w
eaned) off of and w
asn't taking anymore. I noticed before taking them
. • W
as given tylenol for pain and should not be taking tylenol due to liver problem
s.
Medical Procedure R
elated Issue: procedure inefficacious (failed to relieve sym
ptoms),
patient inadequately prepared before the procedure, avoidable delay in treatm
ent, inadequate monitoring
of patient after the procedure, provider practicing outside their area of expertise, inappropriate or outm
oded form of therapy used.
14%
• Needed second chest tube, the first w
as put in wrong.
• Resident m
issed a suture when he w
as about ready to remove m
y chest tube. • The x-ray tech w
as not very careful and did not explain procedures. • Poor IV
skills. • W
hen my chest drain w
as removed nurse seem
ed unsure of procedure; had no back-up and had 2 aborted attem
pts.
Diagnostic Issue: inappropriate or outm
oded diagnostic tests w
ere used, avoidable delay in treatm
ent.
5%
• Better (referral) if the doctor is unsure. W
ait and see was not the answ
er in m
y case- injury became m
uch worse than it needed to- internal bleeding.
Operative Issue: patient inadequately prepared
before operation, avoidable delay in treatment.
5%
• I didn't know I w
asn't supposed to move m
y spine and drink in the em
ergency/urgent care
Therapeutic Issue: delay in treatm
ent, unprepared for discharge.
3%
• Waiting so long for treatm
ent.
aSome participants described m
ultiple unsafe acts of care.

!
Table 24. Description of outcomes of the 61 unsafe acts of care perceived by participantsa
Outcomes of Unsafe Care
% of Unsafe Acts n=61b
Exemplar Quotes
Unclear 70% • Left in washroom in a position from which I could not reach call button.
Pain or discomfort 23% • Had to be on spine board for 24 hours- difficulty breathing and extreme discomfort. Necessary but very disagreeable.
Concern or distress 7% • The most traumatic off day was in Burn ICU after operation. Was left without call bell, suction and no pain button for quite sometime. I had to become distressed in order to get help.
Disability 5% • Better (referral) if the doctor is unsure. Wait and see was not the answer in my case- injury became much worse than it needed to- internal bleeding.
Additional procedures
3% • Needed second chest tube, the first was put in wrong.
aOnly those reported in the safety section, thereby classifying it as a patient defined unsafe act. bPercentages do not add up to 100 as multiple outcomes reported for 8 unsafe acts of care unsafe acts.
7.3.2 Open-Ended Responses
The majority of participants provided responses to the open-ended items about the best/worst
aspects of care and aspects of care to improve. On the de-duplication, there were 812 acute care
responses with nine themes and 22 subthemes, and 378 post-acute care responses with nine
themes and 16 subthemes. All comments were categorized into a subtheme and almost all
themes/subthemes included both positive and negative comments. Acute care and post-acute care
themes identified by more than 25% of participants are listed in Table 25 and Table 26,
respectively, with descriptions and exemplar quotes for the most common subthemes.

!86!
7.3.3 Acute Care Results
The three most frequently identified acute care themes were: (1) acute care providers; (2)
clinical care; and (3) communication and information (Table 25). (1) Acute care providers was
the most frequent theme overall and received the most positive comments. The majority of
positive comments were about either the providers' interpersonal characteristics and
professionalism, including their friendliness, approachability, and respect for the patient, or the
general quality of staff. For example, "nurses were amazing". (2) Clinical care was the second
most frequent theme and received the most negative comments. Most negative comments were
about physical comfort and included responses about pain management, patient
comfort/discomfort when being moved/handled by providers, and the frequency of care for
patient hygiene. (3) Communication and information was the third most common theme and
received primarily negative responses. The majority of comments were about information about
injuries, tests, and treatments which included participants' responses about having their questions
answered and receiving clear and frequent information on patient prognosis, test results, and
treatments.

!
Table 25. Them
es comm
ented on by more than 25%
of acute care participants and major subthem
es
Acute C
are Them
es A
cute Care Subthem
es Participants
Writing
Positive C
omm
ents (n=331)
Participants W
riting N
egative C
omm
ents (n=331)
Description
Exemplar V
erbatim Q
uotes: [P]= Positive
[N]= N
egative
Acute C
are Providers
75%
30%
Interpersonal characteristics &
professionalism
38%
11%
Characteristics exhibited
by healthcare staff when
interacting with patients or
family including
personability, disposition, professionalism
, friendliness, and approachability.
• [P] Kind staff, respectful and caring. C
ould tell they actually w
anted to help. • [P]A
ll staff mem
bers were very genuine and kind.
• [N] The residents w
eren't personable, they could work on
being more sensitive and bed-side m
anner.
Availability of
healthcare providers 12%
13%
A
bility to locate, identify, and access healthcare providers w
ithin a hospital unit as w
ell as provider responsiveness, visitation frequency, and provider to patient ratios.
• [P] The nurses are always checking if w
e are alright- if we
needed anything. They were there w
hen I needed them.
• [N]... there are so m
any caregivers/doctors, nurses, physio - som
etimes confusing to w
ho was in charge and w
ho has final authority.
• [N] M
ore staff, everyone too busy to help right away.
General com
ment
about the quality of staff
20%
2%
General com
ment about
the quality of nurses, physicians psychological care staff, social w
orkers, rehabilitation staff, param
edics or emergency
responders, or diagnostic im
aging staff.
• [P] The nurses were am
azing and took very good care of me.
• [P] This is a great trauma centre, w
e had great doctors. • [P] Social w
orkers were am
azing. • [P] Physio, O
T were excellent.
• [P] The taber ambulance attendants...w
ere excellent!
!
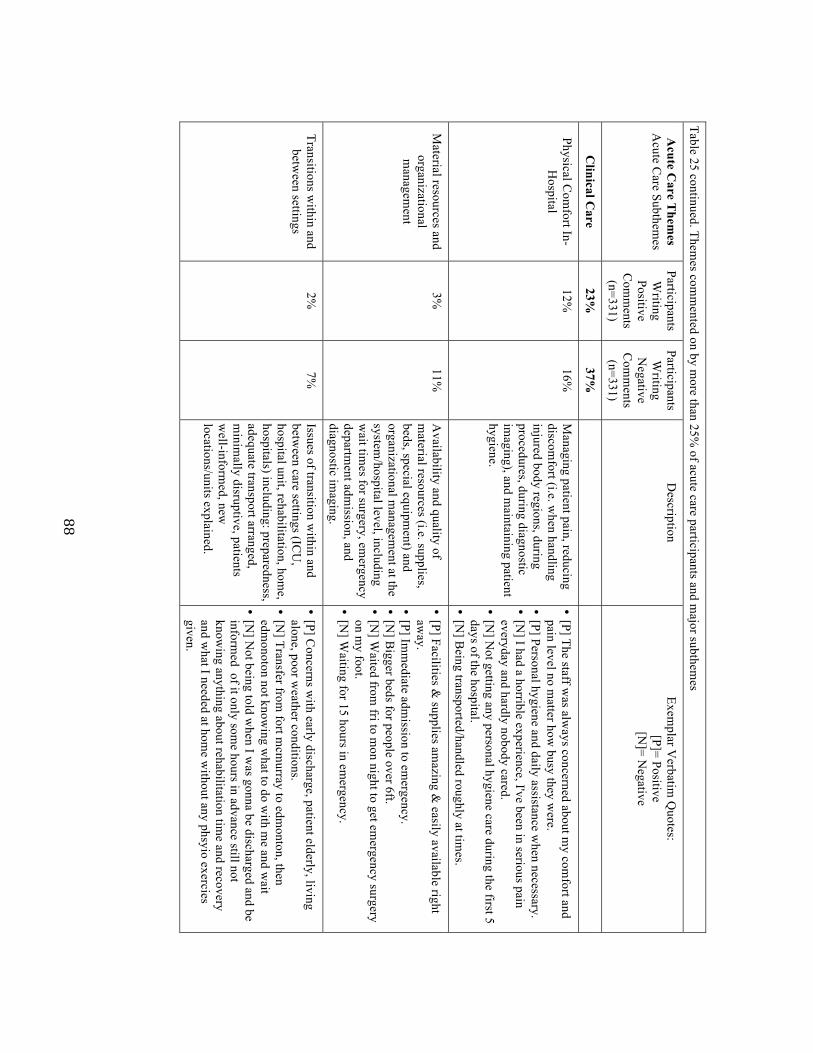
!88!
Table 25 continued. Themes com
mented on by m
ore than 25% of acute care participants and m
ajor subthemes
Acute C
are Them
es A
cute Care Subthem
es Participants
Writing
Positive C
omm
ents (n=331)
Participants W
riting N
egative C
omm
ents (n=331)
Description
Exemplar V
erbatim Q
uotes: [P]= Positive
[N]= N
egative
Clinical C
are 23%
37%
Physical Com
fort In-H
ospital 12%
16%
M
anaging patient pain, reducing discom
fort (i.e. when handling
injured body regions, during procedures, during diagnostic im
aging), and maintaining patient
hygiene.
• [P] The staff was alw
ays concerned about my com
fort and pain level no m
atter how busy they w
ere. • [P] Personal hygiene and daily assistance w
hen necessary. • [N
] I had a horrible experience, I've been in serious pain everyday and hardly nobody cared.
• [N] N
ot getting any personal hygiene care during the first 5 days of the hospital.
• [N] B
eing transported/handled roughly at times.
Material resources and
organizational m
anagement
3%
11%
Availability and quality of
material resources (i.e. supplies,
beds, special equipment) and
organizational managem
ent at the system
/hospital level, including w
ait times for surgery, em
ergency departm
ent admission, and
diagnostic imaging.
• [P] Facilities & supplies am
azing & easily available right
away.
• [P] Imm
ediate admission to em
ergency. • [N
] Bigger beds for people over 6ft.
• [N] W
aited from fri to m
on night to get emergency surgery
on my foot.
• [N] W
aiting for 15 hours in emergency.
Transitions within and
between settings
2%
7%
Issues of transition within and
between care settings (IC
U,
hospital unit, rehabilitation, home,
hospitals) including: preparedness, adequate transport arranged, m
inimally disruptive, patients
well-inform
ed, new
locations/units explained.
• [P] Concerns w
ith early discharge, patient elderly, living alone, poor w
eather conditions. • [N
] Transfer from fort m
cmurray to edm
onton, then edm
onoton not knowing w
hat to do with m
e and wait
• [N] N
ot being told when I w
as gonna be discharged and be inform
ed of it only some hours in advance still not
knowing anything about rehabilitation tim
e and recovery and w
hat I needed at home w
ithout any phsyio exercies given.
!!!

!89!
Table 25 continued. Themes com
mented on by m
ore than 25% of acute care participants and m
ajor subthemes
Acute C
are Them
es A
cute Care Subthem
es Participants
Writing
Positive C
omm
ents (n=331)
Participants W
riting N
egative C
omm
ents (n=331)
Description
Exemplar V
erbatim Q
uotes: [P]= Positive
[N]= N
egative
Com
munication and
Information
9%
21%
Information about
injuries, tests, and treatm
ents
9%
16%
Frequency, detail, and timeliness
of comm
unication between
providers and patients about patient prognosis, test results, and treatm
ents, including answ
ering patient questions.
• [P] Nurses w
ere exceptional in explaining meds,
pain managem
ent strategy. • [P] I w
as always consulted and encouraged to listen
to doctors rounds and they asked my opinion on m
y husbands care and procedures.
• [N]B
etter comm
unication with the patient- felt like
some details about his situation w
ere withheld
• [N]C
omm
unicate daily about what is happening-
who is ordering tests, w
hat is happening next.!
Provider to provider 0.3%
5%
The am
ount and timeliness of
information sharing and
comm
unication between
different healthcare providers (surgeons, nurses, physiotherapists, radiologists) and support staff (lab em
ployees) about patient treatm
ents, results of patient testing and im
aging, and patient preferences.
• [S] Everyone was on the sam
e page. • [W
] Have doctors check in w
ith nurses more often
so nurses have proper answers and care orders for
patients.! • [W
] Miscom
munication btw
nursing station and kitchen. I w
as on liquid diet longer than I was
supposed to.
!
7.3.4 Post-Acute Care Results
The three most frequently identified post-acute care themes were: (1) communication and
information; (2) appointments and services; and (3) follow-up care providers (Table 26).
(1) Communication and information was the most common theme overall. It received the highest
number of both positive and negative comments. The most frequent subtheme was the ease of
contacting follow-up providers which included comments about participants' ability to contact
providers for advice, to answer questions, or to inquire about future appointments. Positive
comments praised open lines of communication with providers to easily obtain information,
while negative comments highlighted the difficulty of getting in contact with physicians for
advice and recovery guidance. (2) Appointments and services was the second most common
theme with nearly equal amounts of positive and negative comments. The majority of comments
were about the availability, timing, and scheduling of services. Many praised the ease of getting
appointments and the frequency of follow-up while others suggested the interval between
appointments and between discharge and the first follow-up appointment or homecare visit was
too long. (3) Follow-up care providers was the third most common theme. The majority of
comments were positive and focused on healthcare providers' interpersonal characteristics and
professionalism or were general comments about the quality of follow-up care providers such as
surgeons, family physicians, rehabilitation therapists, and homecare nurses.

!
Table 26. Themes com
mented on by m
ore than 25% of post-acute care participants and m
ajor subthemes
Post-Acute C
are T
hemes
Post-Acute C
are Subthem
es
Participants W
riting Positive
Responses (n=180)
Participants W
riting N
egative R
esponses (n=180)
Description
Exemplar V
erbatim Q
uotes: [P]= Positive
[N]= N
egative
Com
munication and
Information
33%
31%
Ease of contacting follow
-up providers 22%
14%
A
bility to contact providers for advice, to answ
er questions, or to inquire about future appointm
ents.
• [P] Open lines of com
munication w
ith trauma surgeon. I
have her email and I have easy availability, can ask em
ail questions.
• [P] Any inform
ation I wanted I could find out easily.
• [N] The w
aiting, I was phoning all the tim
e and not getting any answ
er. • [N
] Be nice if there w
as a non-doctor patient advocate to explain things- som
eone more available than the doctors w
ho knew
your case and you could call to get some guidance.
Information about
injuries, prognosis, and the recovery
process
8%
10%
Quantity and clarity of inform
ation about injuries, prognosis, and next steps in recovery including restrictions on activities, activities to prom
ote healing, recovery tim
elines, and treatment availability
and options. Providers forthcoming
in offering this information and
willingness to answ
er all patient/fam
ily questions.
• [P] My head doctor has been explaining to m
e why m
y m
emory hasn't been great and she explained it exactly how
I understand it. She put it in laym
en's terms.
• [P] Family doctors said I w
ould need xrays and ultrasounds, letting m
e know w
hat I have to do • [N
] No one has contacted m
e at all, not my traum
a doc, no one to let m
e know w
hat to do, not sure if I can do physio, or anything. H
orrible feeling to feel left out in the wind.
• [N] I have an ongoing need for physio and exercise but I
don't know w
hat I should be doing. I need some direction
about to to do.
Provider to provider 3%
7%
The am
ount and timeliness of
information sharing and
comm
unication between healthcare
providers (discharging hospital, physicians, rehabilitation therapists) about patient needs, treatm
ents, and other recovery related issues.
• [P] Physio, family [doctor] and surgeon w
ere all close knit and very good com
munication betw
een them.
• [N] C
omm
unication among the hospital and com
munity
healthcare providers. • [N
]My fam
ily doctor should have had all my records and
looked over them before I got there.
!

!92!
!Table 26 continued. Them
es comm
ented on by more than 25%
of post-acute care participants and major subthem
es Post-A
cute Care
Them
es Subthem
es
Participants W
riting Positive
Com
ments
(n=180)
Participants W
riting N
egative C
omm
ents (n=180)
Description
Exemplar V
erbatim Q
uotes: [P]= Positive
[N]= N
egative
Appointm
ents and Services
31%
29%
Availability, tim
ing, and scheduling of
services
18%
12%
Frequency of follow-up appointm
ents and services, tim
eliness of appointments, and
flexibility of appointment scheduling.
• [P] I could easily get in to see my nurse practitioner
when I w
anted. • [P] I've also enjoyed being able to see the surgeon
monthly, w
ho explains my x-rays and progress and
confirmation that I'm
doing good. • [N
] Biggest thing is follow
up in better time. Instead
of 4 to 6 weeks - once a w
eek might be best.
• [N] W
aiting for the homecare nurses. Took a m
onth to get them
the paperwork and get an appointm
ent. I needed the hom
ecare help when I first got hom
e. A
mount and
thoroughness of follow
-up care
10%
11%
Quantity of follow
-up care appointments and
services in addition to quantity of time spent
with providers in follow
-up appointments.
• [P] My leg doctor: you w
ait for a while, but once
you get in he will spend as m
uch time as you w
ant w
ith him. Y
ou can ask all your questions. • [N
] I wait for 3 hours for m
y appointment - it w
as delayed and then just 5 m
ins she said 'ok you're fine'.
Post-Acute C
are Providers
27%
6%
General com
ment
about the quality of follow
-up care providers
13%
1%
General com
ment about the quality of follow
-up care providers including traum
a doctors, surgeons, specialists, fam
ily physicians, therapists, and hom
ecare nurses.
• [P] Surgeon follow-up w
as good. Supportive. • [P] I guess m
y family doctor has been pretty good.
• [P] The physical therapy has been very helpful. • [P] H
omecare support w
as good. Interpersonal
characteristics and professionalism
11%
1%
Characteristics exhibited by follow
-up providers w
hen interacting with patients or fam
ily including personability, disposition, professionalism
, and friendliness.
• [P] Dr. X
was very friendly and w
illing to listen. • [P] The hom
ecare nurses were very courteous.
• [N] I thought the doctor didn't really care

!
7.4 Discussion
The purpose of this study was to assess the feasibility of obtaining data from open-ended items
on the QTAC-PREM and assess the potential value of the results for supplementing the
quantitative component and contributing to quality improvement in injury care.
The response rates to the open-ended items and large volume of comments suggest it is feasible
to obtain data by including open-ended items on the QTAC-PREM. Eighty-three percent of all
acute care respondents (n=400 total) and 95% of post-acute care respondents (n=190 total)
provided at least one comment to an open-ended question.
A number of themes and subthemes were identified which suggests variation in injury care
experiences. However, three acute care themes (acute care providers, clinical care,
communication and information) and three post-acute care themes (post-acute care providers,
appointments and services, communication and information) were expressed by at least 25% of
participants. All of the most common themes and subthemes included positive and negative
comments, which indicates that participants identified them as the "best" aspects of care if they
were perceived to be high-quality and as the "worst" aspects of care if perceived to be low-
quality. Therefore, these themes may represent key elements that are important to patient
experiences with care. This type of information could be used to direct quality improvement
efforts to areas of care most relevant to patients.
The results of the qualitative component of the QTAC-PREM complement the findings from the
quantitative assessments presented in sub-study 2 (Chapter 6). The most frequent themes (and

!94!
subthemes) identified in this qualitative study mirror the core domains obtained from the factor
analysis: communication and information (including acute and post-acute information about
injuries, treatments, and prognosis) and clinical care in-hospital (including issues of physical
comfort). The qualitative data also highlighted additional key elements in patient experience
including the interpersonal characteristics of providers, availability of providers, ease of
contacting follow-up care providers, and the amount and thoroughness of care. These results
suggest that data from the open-ended items on the QTAC-PREM could serve to corroborate and
supplement the quantitative component.
The themes and subthemes found in this study resonate with the findings of other qualitative
studies of patient perceptions of care in trauma care and critical care (29, 67, 68), although few
studies have been conducted. For example, Gabbe et al. completed interviews with 120 trauma
patients to understand their experiences with care and target areas for improvement. The authors
showed that most patients identified a lack of information about prognosis, insufficient
explanations of treatment options, and conflicting information provided by clinicians. They also
identified problems with patient to provider interaction during ward rounds including the ability
to identify the providers. My study highlighted similar issues with infrequent and limited
information about injuries, patient prognosis, test results, and treatments, as well as provider to
provider communication issues resulting in inconsistent information and care for patients. The
ability to identify providers was also a key issue. Patients indicated that the large number of staff
and frequent turnover made it difficult to remember staff members' names and roles.

!95!
The post-acute themes in this study also echo findings from other studies (11, 67, 69, 70). For
example, the ability to contact providers for advice or to schedule follow-up, information about
physical limitations, the frequency of appointments, wait times in appointment waiting rooms,
and the duration of appointments have been key themes in studies of post-hospital injury care
and outpatient injury rehabilitation (67, 70).
The information obtained from the open-ended QTAC-PREM items about the best/worst aspects
of care, and aspects of care to improve, could be used to develop/reinforce simple strategies to
improve care. The following recommendations address some of the issues identified by patients
in this study. These recommendations can be considered examples of how including open-ended
items on the QTAC-PREM may help guide quality improvement efforts: (1) Ensure provider
name tags are visible and have providers repeatedly introduce themselves and explain their role
to patients; (2) in-unit communication systems like Vocera (71) could be utilized to increase
patient access to nurses as well as improve responsiveness to patient requests; (3) ensure patients
receive detailed written discharge instructions that outline what to expect in the immediate post-
discharge phase; (4) provide information at discharge and follow-up appointments about possible
activities patients can pursue on their own between appointments to aid in recovery;
(5) encourage patients to prepare written questions to bring to follow-up to maximize the use of
appointment time; (6) when possible, notify patients about delays and back-ups in follow-up
appointments.
The information obtained from the open-ended items about unsafe care may also be useful for
quality improvement. In this study, 14% of patients/surrogates reported a safety incident.
!96!
Although a small number of responses described potentially serious issues with care (future
studies could verify adverse events through medical chart review) most descriptions seemed
related to routine care that involved unexpected or prolonged pain or discomfort: "had to be on
spine board for 24 hours- difficulty breathing and extreme discomfort. Necessary but very
disagreeable."; "when my chest drain was removed nurse seemed unsure of procedure; had no
back-up and had 2 aborted attempts"; "chest pump was left in too long, after I expressed
discomfort". These results suggest there may be opportunities to reduce the number of perceived
safety incidents and improve the patient experience by informing patients well about the nature
of ward procedures (e.g. chest tube insertion/removal, dressing changes, moving/handling
patients) and the potential discomfort they may cause. This might help avoid unexpected pain
and distress that may, in some instances, drive patient perceptions of unsafe care.
7.5 Limitations
There are limitations to this study. First, although the response rates and volume and content of
comments support the feasibility of obtaining useful qualitative data with the QTAC-PREM,
there was a significant amount of effort required to analyze the data. Data entry and analysis was
time consuming and the process to develop the coding framework and ensure ongoing inter-
coder reliability was effort-intensive. However, the open-ended questions on the QTAC-PREM
have the potential to provide informative data for quality improvement. Periodic implementation
of the quantitative measure, with the qualitative component, may be worthwhile. Second, there
may be a non-response bias among those providing open-ended data. The items appear at the end
of the survey and participants are not obligated to provide free-text responses. Useable data may
come more frequently from patients more willing to share their experiences and complement or

!97!
criticize care. Also, it is possible that patients whose first language is not English may be less
able or likely to provide open-ended responses. Therefore, the qualitative data obtained may not
represent the experiences of all patients. These issues may limit the generalizability of the
themes/subthemes obtained from using the open-ended items. However, the open-ended items
can operate to supplement the quantitative responses among many of the patients that complete
the survey. Also, the results may provide useful information to improve care for some patients.
Future studies could explore translation of the survey into other languages. Third, although this
was a multi-centre study with a relatively large sample size, the generalizability of these results
to other countries and types of health systems is unclear. Implementation of this tool in other
health systems should be explored.
7.6 Conclusions
This was a multi-centre qualitative study of patient injury care experiences. To my knowledge,
this is the largest prospective qualitative study of injury patients' experiences with care and one
of the few studies to elicit open-ended reports of patient safety incidents in-hospital. Overall, the
study showed it was feasible to obtain data from open-ended items on the QTAC-PREM and the
qualitative results may be useful for identifying specific components of care that could be
improved.

!98!
Chapter 8: Overall Conclusions
Valid and reliable instruments to measure patient experience are needed for research and quality
improvement in injury care. Therefore, the purpose of this thesis was to refine a draft measure of
patient experience with injury care, to quantitatively assess its validity, reliability and the
feasibility of implementing it in multiple trauma centres, and to qualitatively assess the
feasibility and value of including open-ended items on the tool.
Cognitive interviews with 30 injury patients/surrogates guided revision and refinement of the
tool. A multi-site prospective cohort study of 400 patients/surrogates showed that implementing
the tool was feasible and provided evidence of validity and reliability for nearly all of the items
on the survey. In addition, the analysis showed that scores for many of the items could be
combined and reported as composite domain scores for ease of interpretation and reporting.
The qualitative component of the cohort study showed it was feasible to obtain qualitative data
using open-ended items on the survey, to identify common themes in patient experiences from
the qualitative data, and that the qualitative results may be used to supplement the quantitative
findings.
To my knowledge, the prospective cohort study conducted for this thesis is the largest mixed
methods study of patient experiences with injury care. This study provides evidence that the
Quality of Trauma Care Patient-Reported Experience Measure QTAC-PREM is a valid and
reliable tool. This measure could be used to guide quality improvement efforts by identifying
deficits in care from the patient perspective, informing interventions to correct care issues, and to
track subsequent improvements. The tool could be used in periodic local quality assessments, for
!99!
comparisons of injury care quality between trauma centres, and as an outcome measure in studies
of injury care.
The next step towards implementing the QTAC-PREM will be to complete minor revisions
informed by the quantitative assessment and then to disseminate the survey to trauma program
managers and administrators through peer review publication, conference presentations, and
direct contact. The ultimate goal of implementing this measure is to improve the quality of care
delivered to injured patients.

!100!
Bibliography
1.! Bobrovitz!N,!Santana!MJ,!Ball!CG,!Kortbeek!J,!Stelfox!HT.!The!development!and!testing!of!a!survey!to!measure!patient!and!family!experiences!with!injury!care.!J!Trauma!Acute!Care!Surg.![Research!Support,!NonRU.S.!Gov't].!2012!Nov;73(5):1332R9.!2.! Brohi!K,!Cole!E,!Hoffman!K.!Improving!outcomes!in!the!early!phases!after!major!trauma.!Curr!Opin!Crit!Care.![Research!Support,!NonRU.S.!Gov't!Review].!2011!Oct;17(5):515R9.!3.! Ardolino!A,!Sleat!G,!Willett!K.!Outcome!measurements!in!major!traumaRRresults!of!a!consensus!meeting.!Injury.![Consensus!Development!Conference!Practice!Guideline!Review].!2012!Oct;43(10):1662R6.!4.! Stelfox!HT,!BobranskaRArtiuch!B,!Nathens!A,!Straus!SE.!Quality!indicators!for!evaluating!trauma!care:!a!scoping!review.!Arch!Surg.![Research!Support,!NonRU.S.!Gov't!Review].!2010!Mar;145(3):286R95.!5.! Murray!CJ!LA.!Mortality!by!cause!for!eight!regions!of!the!world:!Global!Burden!of!Disease!Study.!Lancet!1997(349):1269R76.!6.! Murray!CJ!LA.!Global!health!statistics:!a!compendium!of!incidence,!prevalence!and!mortality!estimates!for!over!200!conditions.!.!Boston,!MA:!Harvard!School!of!Public!Health1996!1996.!7.! Canada!PHAo.!Public!Health!Agency!of!Canada:!Facts!on!Injury,!Injury!Section,!Health!Surveillance!and!Epidemiology!Division.!.!Government!of!Canada;!2012![cited!2013!July!15];!Available!from:!http://www.phacRaspc.gc.ca/injuryRbles/factsReng.php.!8.! Committee!on!Quality!of!Health!Care!in!America!IoM.!Crossing!the!Quality!Chasm:!A!New!Health!System!for!the!21st!Century.!.!Washington!DC2001.!9.! Rhodes!M!MR.!Trauma!performance!improvement!.!In:!Rivara!FP!CP,!Koepsell!TD,!Grossman!DC,!Maier!RV.,!editor.!Injury!Control.!Cambridge!Cambridge!University!Press;!2001.!p.!236–49.!10.! Davis!JW!HD,!McArdle!MS,!Mackersie!RC,!Shackford!SR,!Eastman!AB.!The!significance!of!critical!care!errors!in!causing!preventable!death!in!trauma!patients!in!trauma!system.!.!Journal!of!Trauma!and!Acute!Care!Surgery!1991(31):813R8.!11.! Keenan!A,!Joseph!L.!The!needs!of!family!members!of!severe!traumatic!brain!injured!patients!during!critical!and!acute!care:!a!qualitative!study.!Can!J!Neurosci!Nurs.![Research!Support,!NonRU.S.!Gov't].!2010;32(3):25R35.!12.! McMordie!WR!RK,!Barker!SL.!Consumer!satisfaction!with!services!provided!to!headRinjured!patients!and!their!families.!.!Brain!Injury.!1991(5):43R51.!13.! Thomsen!IV.!The!patient!with!severe!head!injury!and!his!family.!A!followRup!study!of!50!patients.!Scand!J!Rehabil!Med.!1974;6(4):180R3.!14.! World!Health!Organization.!Quality!of!care!:!a!process!for!making!strategic!choices!in!health!systems.!Geneva,!Switzerland2006.!15.! Health!Quality!Council!of!Alberta.!Alberta!Quality!Matrix!for!Health!User!Guide.!!2005![updated!Apr!5,!2012;!cited!2013!Dec!27];!Available!from:!http://www.hqca.ca/index.php?id=!229.!16.! Sarkar!B,!Brunsvold!ME,!CherryRBukoweic!JR,!Hemmila!MR,!Park!PK,!Raghavendran!K,!et!al.!American!College!of!Surgeons'!Committee!on!Trauma!Performance!Improvement!

!101!
and!Patient!Safety!program:!maximal!impact!in!a!mature!trauma!center.!J!Trauma.!2011!Nov;71(5):1447R53;!discussion!53R4.!17.! Quality!AfHRa.!Consumer!Assessment!of!Healthcare!Providers!and!Systems!(CAHPS)!Surveys!and!Guidance.!!![cited!2012!July];!25].!Available!from:!http://qualitymeasures.ahrq.gov/browse/byRorganizationRindiv.aspx?orgid=29.!18.! Davies!E,!Shaller!D,!EdgmanRLevitan!S,!Safran!DG,!Oftedahl!G,!Sakowski!J,!et!al.!Evaluating!the!use!of!a!modified!CAHPS!survey!to!support!improvements!in!patientRcentred!care:!lessons!from!a!quality!improvement!collaborative.!Health!Expect.![Evaluation!Studies!Research!Support,!N.I.H.,!Extramural!Research!Support,!NonRU.S.!Gov't].!2008!Jun;11(2):160R76.!19.! Draper!M,!Cohen!P,!Buchan!H.!Seeking!consumer!views:!what!use!are!results!of!hospital!patient!satisfaction!surveys?!Int!J!Qual!Health!Care.!2001!Dec;13(6):463R8.!20.! Gilles!RR!SS,!Casalino!L,!Robinson!JC,!Rundall!TG,!.!How!different!is!California?!A!comparison!of!US!physician!organizations.!Health!Affairs!Millwood![serial!on!the!Internet].!2003:!Available!from:!http://content.healthaffairs.org/content/early/2003/10/15/hlthaff.w3.492.citation!!21.! Nyberg!SM,!Waswick!W,!Wynn!T,!Keuter!K.!Midlevel!providers!in!a!Level!I!trauma!service:!experience!at!Wesley!Medical!Center.!J!Trauma.![Research!Support,!NonRU.S.!Gov't].!2007!Jul;63(1):128R34.!22.! Boulanger!B,!Kearney!P,!Ochoa!J,!Tsuei!B,!Sands!F.!Telemedicine:!a!solution!to!the!followup!of!rural!trauma!patients?!J!Am!Coll!Surg.![Evaluation!Studies].!2001!Apr;192(4):447R52.!23.! Fanta!K,!Cook!B,!Falcone!RA,!Jr.,!Rickets!C,!Schweer!L,!Brown!RL,!et!al.!Pediatric!trauma!nurse!practitioners!provide!excellent!care!with!superior!patient!satisfaction!for!injured!children.!J!Pediatr!Surg.![Randomized!Controlled!Trial].!2006!Jan;41(1):277R81.!24.! Morris!BJ,!Richards!JE,!Archer!KR,!Lasater!M,!Rabalais!D,!Sethi!MK,!et!al.!Improving!Patient!Satisfaction!in!the!Orthopaedic!Trauma!Population.!J!Orthop!Trauma.!2013!Oct!28.!25.! Swaine!BR,!Dutil!E,!Demers!L,!Gervais!M.!Evaluating!clients'!perceptions!of!the!quality!of!head!injury!rehabilitation!services:!development!and!validation!of!a!questionnaire.!Brain!Inj.![Research!Support,!NonRU.S.!Gov't!Validation!Studies].!2003!Jul;17(7):575R87.!26.! Castle!NG,!Brown!J,!Hepner!KA,!Hays!RD.!Review!of!the!literature!on!survey!instruments!used!to!collect!data!on!hospital!patients'!perceptions!of!care.!Health!Serv!Res.![Research!Support,!U.S.!Gov't,!P.H.S.!Review].!2005!Dec;40(6!Pt!2):1996R2017.!27.! Sitzia!J.!How!valid!and!reliable!are!patient!satisfaction!data?!An!analysis!of!195!studies.!Int!J!Qual!Health!Care.![MetaRAnalysis].!1999!Aug;11(4):319R28.!28.! Jenkinson!C,!Coulter!A,!Bruster!S,!Richards!N,!Chandola!T.!Patients'!experiences!and!satisfaction!with!health!care:!results!of!a!questionnaire!study!of!specific!aspects!of!care.!Qual!Saf!Health!Care.![Comparative!Study].!2002!Dec;11(4):335R9.!29.! Sofaer!S,!Crofton!C,!Goldstein!E,!Hoy!E,!Crabb!J.!What!do!consumers!want!to!know!about!the!quality!of!care!in!hospitals?!Health!Serv!Res.![Research!Support,!U.S.!Gov't,!P.H.S.].!2005!Dec;40(6!Pt!2):2018R36.!

!102!
30.! Boer!D!DD,!Rademakers!J.!Do!patient!experiences!on!priority!aspects!of!health!care!predict!their!global!rating!of!quality!of!care?!A!study!in!five!patient!groups.!.!Health!Expectations.!2010(13):285R97.!31.! Willis!GB.!Beyond!Cognitive!Testing.!!Cognitive!Interviewing.!Thousand!Oaks,!California:!Sage!2006.!p.!230R54.!32.! Shaw!MJ,!Beebe!TJ,!Adlis!SA,!Talley!NJ.!Reliability!and!validity!of!the!digestive!health!status!instrument!in!samples!of!community,!primary!care,!and!gastroenterology!patients.!Aliment!Pharmacol!Ther.![Research!Support,!NonRU.S.!Gov't!Validation!Studies].!2001!Jul;15(7):981R7.!33.! Shaw!MJ,!Talley!NJ,!Beebe!TJ,!Rockwood!T,!Carlsson!R,!Adlis!S,!et!al.!Initial!validation!of!a!diagnostic!questionnaire!for!gastroesophageal!reflux!disease.!Am!J!Gastroenterol.![Validation!Studies].!2001!Jan;96(1):52R7.!34.! Grant!EN,!TurnerRRoan!K,!Daugherty!SR,!Li!T,!Eckenfels!E,!Baier!C,!et!al.!Development!of!a!survey!of!asthma!knowledge,!attitudes,!and!perceptions:!the!Chicago!Community!Asthma!Survey.!Chicago!Asthma!Surveillance!Initiative!Project!Team.!Chest.![Research!Support,!NonRU.S.!Gov't].!1999!Oct;116(4!Suppl!1):178SR83S.!35.! HarrisRKojetin!LD,!Fowler!FJ,!Jr.,!Brown!JA,!Schnaier!JA,!Sweeny!SF.!The!use!of!cognitive!testing!to!develop!and!evaluate!CAHPS!1.0!core!survey!items.!Consumer!Assessment!of!Health!Plans!Study.!Med!Care.![Research!Support,!U.S.!Gov't,!P.H.S.].!1999!Mar;37(3!Suppl):MS10R21.!36.! Goldstein!E,!Fyock!J.!Reporting!of!CAHPS!quality!information!to!medicare!beneficiaries.!Health!Serv!Res.![Multicenter!Study!Research!Support,!U.S.!Gov't,!NonRP.H.S.].!2001!Jul;36(3):477R88.!37.! Levine!RE,!Fowler!FJ,!Jr.,!Brown!JA.!Role!of!cognitive!testing!in!the!development!of!the!CAHPS!Hospital!Survey.!Health!Serv!Res.![Research!Support,!U.S.!Gov't,!NonRP.H.S.!Research!Support,!U.S.!Gov't,!P.H.S.].!2005!Dec;40(6!Pt!2):2037R56.!38.! Jha!AK,!Orav!EJ,!Zheng!J,!Epstein!AM.!Patients'!perception!of!hospital!care!in!the!United!States.!N!Engl!J!Med.![Research!Support,!NonRU.S.!Gov't].!2008!Oct!30;359(18):1921R31.!39.! Collins!D.!Pretesting!survey!instruments:!an!overview!of!cognitive!methods.!Qual!Life!Res.![Review].!2003!May;12(3):229R38.!40.! Willis!GB.!Cognitive!interviewing:!a!tool!for!improving!questionnaire!design.!Thousand!Oaks,!CA:!Sage;!2005.!41.! Housen!P,!Shannon!GR,!Simon!B,!Edelen!MO,!Cadogan!MP,!Sohn!L,!et!al.!What!the!resident!meant!to!say:!use!of!cognitive!interviewing!techniques!to!develop!questionnaires!for!nursing!home!residents.!Gerontologist.![Research!Support,!U.S.!Gov't,!NonRP.H.S.!Research!Support,!U.S.!Gov't,!P.H.S.].!2008!Apr;48(2):158R69.!42.! Organization!WH.!International!statistical!classification!of!diseases!and!related!health!problems,!tenth!revision.!.!Geneva1992R1994.!43.! Etchells!E,!Darzins!P,!Silberfeld!M,!Singer!PA,!McKenny!J,!Naglie!G,!et!al.!Assessment!of!patient!capacity!to!consent!to!treatment.!J!Gen!Intern!Med.![Comparative!Study!Research!Support,!NonRU.S.!Gov't].!1999!Jan;14(1):27R34.!44.! Heyland!DK,!Tranmer!JE.!Measuring!family!satisfaction!with!care!in!the!intensive!care!unit:!the!development!of!a!questionnaire!and!preliminary!results.!J!Crit!Care.![Research!Support,!NonRU.S.!Gov't].!2001!Dec;16(4):142R9.!
!103!
45.! Streiner!DL!NG.!Health!Measurement!Scales:!a!practical!guide!to!their!development!and!use.!New!York:!Oxford!University!Press!Inc;!2008.!46.! Guttman!L.!Some!necessary!conditions!for!common!factor!analysis.!Psychometrika.!1954(19).!47.! Floyd!FJ!WK.!Factor!Analysis!in!the!Development!and!Refinement!of!Clinical!Assessment!Instruments.!Psychol!Assessment.!1995;7(3):286R99.!48.! Helmstadter!GC.!Principles!of!Psychological!Measurement!New!York:!AppletonRCenturyRCrofts;!1964.!49.! Nunnally!J!BI.!Psychometric!Theory.!3!ed:!McGrawRHill;!1994.!50.! McGee!J,!Kanouse!DE,!Sofaer!S,!Hargraves!JL,!Hoy!E,!Kleimann!S.!Making!survey!results!easy!to!report!to!consumers:!how!reporting!needs!guided!survey!design!in!CAHPS.!Consumer!Assessment!of!Health!Plans!Study.!Med!Care.!1999!Mar;37(3!Suppl):MS32R40.!51.! McGraw!KO!WS.!Forming!inferences!about!some!intraclass!correlation!coefficients.!Psychological!Methods.!1996;1(1):30R46.!52.! Keller!S,!O'Malley!AJ,!Hays!RD,!Matthew!RA,!Zaslavsky!AM,!Hepner!KA,!et!al.!Methods!used!to!streamline!the!CAHPS!Hospital!Survey.!Health!Serv!Res.![Research!Support,!NonRU.S.!Gov't!Research!Support,!U.S.!Gov't,!P.H.S.].!2005!Dec;40(6!Pt!2):2057R77.!53.! Centers!for!Medicare!&!Medicaid!Services.!Summary!Analyses.!!Baltimore,!MD:!Centers!for!Medicare!&!Medicaid!Services;!2013;!Available!from:!http://www.hcahpsonline.org.!54.! Bjertnaes!OA.!The!association!between!survey!timing!and!patientRreported!experiences!with!hospitals:!results!of!a!national!postal!survey.!BMC!Med!Res!Methodol.!2012;12:13.!55.! Leukhardt!WH,!Golob!JF,!McCoy!AM,!Fadlalla!AM,!Malangoni!MA,!Claridge!JA.!FollowRup!disparities!after!trauma:!a!real!problem!for!outcomes!research.!Am!J!Surg.![Research!Support,!N.I.H.,!Extramural].!2010!Mar;199(3):348R52;!discussion!53.!56.! MacKenzie!EJ,!Rivara!FP,!Jurkovich!GJ,!Nathens!AB,!Frey!KP,!Egleston!BL,!et!al.!A!national!evaluation!of!the!effect!of!traumaRcenter!care!on!mortality.!N!Engl!J!Med.![Comparative!Study!Research!Support,!N.I.H.,!Extramural!Research!Support,!U.S.!Gov't,!P.H.S.].!2006!Jan!26;354(4):366R78.!57.! Ward!JK,!Armitage!G.!Can!patients!report!patient!safety!incidents!in!a!hospital!setting?!A!systematic!review.!BMJ!Qual!Saf.![Research!Support,!NonRU.S.!Gov't!Review].!2012!Aug;21(8):685R99.!58.! Sapnas!KG,!Zeller!RA.!Minimizing!sample!size!when!using!exploratory!factor!analysis!for!measurement.!J!Nurs!Meas.![Evaluation!Studies].!2002!Fall;10(2):135R54.!59.! Cattell!R,!Eber!HW,!Tatsuoka!MM.!Handbook!for!the!Sixteen!Personality!Factor!Questionnaire.!Champaign!IL:!Institute!for!Personality!and!Ability!Testing;!1970.!60.! Langley!J,!Johnson!S,!Slatyer!M,!Skilbeck!CE,!Thomas!M.!Issues!of!loss!to!followRup!in!a!population!study!of!traumatic!brain!injury!(TBI)!followed!to!3!years!postRtrauma.!Brain!Inj.![Research!Support,!NonRU.S.!Gov't].!2010;24(7R8):939R47.!61.! de!Vries!H,!Elliott!MN,!Hepner!KA,!Keller!SD,!Hays!RD.!Equivalence!of!mail!and!telephone!responses!to!the!CAHPS!Hospital!Survey.!Health!Serv!Res.![Research!Support,!U.S.!Gov't,!P.H.S.].!2005!Dec;40(6!Pt!2):2120R39.!
!104!
62.! Gribble!RK,!Haupt!C.!Quantitative!and!qualitative!differences!between!handout!and!mailed!patient!satisfaction!surveys.!Med!Care.![Clinical!Trial!Comparative!Study!Randomized!Controlled!Trial].!2005!Mar;43(3):276R81.!63.! Kryworuchko!J,!Heyland!DK.!Using!family!satisfaction!data!to!improve!the!processes!of!care!in!ICU.!Intensive!Care!Med.![Comment!Editorial].!2009!Dec;35(12):2015R7.!64.! Boyatzis!RE.!Transforming!Qualitative!Information:!Thematic!Analysis!and!Code!Development.!Thousands!Oaks,!California:!Sage;!1998.!65.! Green!J!TN.!Qualitative!Methods!for!Health!Research.!2nd!ed.!London:!Sage;!2009.!66.! Brennan!TA,!Leape!LL,!Laird!NM,!Hebert!L,!Localio!AR,!Lawthers!AG,!et!al.!Incidence!of!adverse!events!and!negligence!in!hospitalized!patients.!Results!of!the!Harvard!Medical!Practice!Study!I.!N!Engl!J!Med.![Research!Support,!NonRU.S.!Gov't].!1991!Feb!7;324(6):370R6.!67.! Gabbe!BJ,!Sleney!JS,!Gosling!CM,!Wilson!K,!Hart!MJ,!Sutherland!AM,!et!al.!Patient!perspectives!of!care!in!a!regionalised!trauma!system:!lessons!from!the!Victorian!State!Trauma!System.!Med!J!Aust.![Research!Support,!NonRU.S.!Gov't].!2013!Feb!18;198(3):149R52.!68.! O'Brien!JA,!FothergillRBourbonnais!F.!The!experience!of!trauma!resuscitation!in!the!emergency!department:!themes!from!seven!patients.!J!Emerg!Nurs.!2004!Jun;30(3):216R24.!69.! MedinaRMirapeix!F,!OliveiraRSousa!S,!SobralRFerreira!M,!Del!BanoRAledo!ME,!EscolarRReina!P,!MontillaRHerrador!J,!et!al.!Continuity!of!rehabilitation!services!in!postRacute!care!from!the!ambulatory!outpatients'!perspective:!a!qualitative!study.!J!Rehabil!Med.![Research!Support,!NonRU.S.!Gov't].!2011!Jan;43(1):58R64.!70.! MedinaRMirapeix!F,!Del!BanoRAledo!ME,!OliveiraRSousa!SL,!EscolarRReina!P,!Collins!SM.!How!the!rehabilitation!environment!influences!patient!perception!of!service!quality:!a!qualitative!study.!Arch!Phys!Med!Rehabil.![Multicenter!Study!Research!Support,!NonRU.S.!Gov't].!2013!Jun;94(6):1112R7.!71.! Breslin!S,!Greskovich!W,!Turisco!F.!Wireless!technology!improves!nursing!workflow!and!communications.!Comput!Inform!Nurs.!2004!SepROct;22(5):275R81.!!

!
Appendix A: Example cognitive interview guide Cognitive)Interview)Guide0)Item)Clarity,)Item)Elimination)and)Layout)Acute)Care)!!Participant:!!Patient!!!!!!Family!Member!)Survey)Given:)Patient!!!!!Family!Member!!!!!!Acute!Care!!!!!!!PostRAcute!Care!!Method:!!!!Retrospective!Probing!!!!!!Introduction:!Dr.!Stelfox!and!I!will!be!conducting!a!study!on!the!quality!of!injury!care!in!three!trauma!centres!in!Alberta,!this!upcoming!summer.!We!will!be!giving!a!survey!to!injured!patients!and!their!family!members.!The!purpose!of!this!survey!is!to!get!patient!and!family!evaluations!of!the!quality!of!injury!care.!!!!I’m!coming!to!you!today!to!get!your!opinion!about!the!survey!and!get!your!help!to!make!the!survey!better!before!we!begin!our!bigger!study!this!summer.!!!!Our!main!purpose!is!to!test!this!survey!to!find!out:!!!
1) which!questions!are!difficult!to!understand!or!answer!2) which!questions!are!least!important!and!could!be!eliminated!!3) if!the!wording!and!format!of!the!survey!are!clear!!
!!We!are!interested!in!your!opinions!about!this!survey!and!any!problems!you!encounter!when!completing!the!survey!questions.!!I!didn’t!write!these!questions!so!don’t!worry!about!criticizing!them.!My!job!is!to!find!out!if!anything!is!wrong!with!them!and!how!to!make!the!survey!better.!!I!will!leave!you!a!copy!of!the!survey!for!you!to!complete.!If!any!questions!are!hard!to!understand,!hard!to!answer!or!don’t!make!sense,!please!circle!the!question!and!we!can!discuss!it!after!you!are!done!the!survey.!When!would!be!a!convenient!time!for!me!to!come!back!to!discuss!the!questions!with!you?!!!!!!!!!!!!!!!

!106!
After!returning:!!!1A.)Were)any)questions)difficult)to)answer)or)understand?)If)so,)which)ones?))• None!were!difficult!to!understand!!
!Why)was)question) ) difficult)to)answer?) )! ! ! ! ! ! ! ! ! ! ! ! !
! ! ! ! ! ! ! ! ! ! ! ! !
! ! ! ! ! ! ! ! ! ! ! ! ! !
!How)would)you)re0phrase)question)) in)your)own)words)to)make)it)easier)to)answer?)! ! ! ! ! ! ! ! ! ! ! ! !
! ! ! ! ! ! ! ! ! ! ! ! !
! ! ! ! ! ! ! ! ! ! ! ! ! !
!!1B.)Were)there)any)other)questions)that)were)difficult)to)answer)or)understand?)If)so,)which)ones?))! ! ! ! ! ! ! ! ! ! ! ! ! !
)Why)was)question) ) difficult)to)answer?) )! ! ! ! ! ! ! ! ! ! ! ! !
! ! ! ! ! ! ! ! ! ! ! ! !
! ! ! ! ! ! ! ! ! ! ! ! ! !
)How)would)you)re0phrase)question)) in)your)own)words)to)make)it)easier)to)answer?)! ! ! ! ! ! ! ! ! ! ! ! !
! ! ! ! ! ! ! ! ! ! ! ! !
! ! ! ! ! ! ! ! ! ! ! ! ! !
)1C.)Why)was)question) ) difficult)to)answer?) )! ! ! ! ! ! ! ! ! ! ! ! !
! ! ! ! ! ! ! ! ! ! ! ! !
! ! ! ! ! ! ! ! ! ! ! ! ! !
!How)would)you)re0phrase)question)) in)your)own)words)to)make)it)easier)to)answer?))! ! ! ! ! ! ! ! ! ! ! ! !
! ! ! ! ! ! ! ! ! ! ! ! !
! ! ! ! ! ! ! ! ! ! ! ! ! !

!107!
!!1D.)Why)was)question) ) difficult)to)answer?) )! ! ! ! ! ! ! ! ! ! ! ! !
! ! ! ! ! ! ! ! ! ! ! ! !
! ! ! ! ! ! ! ! ! ! ! ! ! !
!How)would)you)re0phrase)question)) in)your)own)words)to)make)it)easier)to)answer?)! ! ! ! ! ! ! ! ! ! ! ! !
! ! ! ! ! ! ! ! ! ! ! ! !
! ! ! ! ! ! ! ! ! ! ! ! ! !
)
2.)How)did)you)arrive)at)your)answer)for)question)8?)(What)did)you)think)about?))
! ! ! ! ! ! ! ! ! ! ! ! !
! ! ! ! ! ! ! ! ! ! ! ! ! !
!
3.)How)did)you)arrive)at)your)answer)for)question)10?)(What)did)you)think)about?))
! ! ! ! ! ! ! ! ! ! ! ! !
! ! ! ! ! ! ! ! ! ! ! ! ! !!
!
4.)What)is)the)concept)you)think)we)are)getting)at)with)question)10?))
! ! ! ! ! ! ! ! ! ! ! ! !
! ! ! ! ! ! ! ! ! ! ! ! ! !
)
5.)If)you)had)to)rephrase)question)10,)how)would)you)ask)that)question?))
! ! ! ! ! ! ! ! ! ! ! ! !
! ! ! ! ! ! ! ! ! ! ! ! ! !
6.)What)do)the)terms)skilled)and)competent)in)question)11)mean)to)you?)!
! ! ! ! ! ! ! ! ! ! ! ! !
! ! ! ! ! ! ! ! ! ! ! ! ! !
!
7.)How)did)you)arrive)at)your)answer)for)question)11?)(What)did)you)think)about?))
! ! ! ! ! ! ! ! ! ! ! ! !
! ! ! ! ! ! ! ! ! ! ! ! ! !
!

!108!
8.)What)did)you)think)about)when)answering)question)17?)(What)did)you)think)about?))
! ! ! ! ! ! ! ! ! ! ! ! !
! ! ! ! ! ! ! ! ! ! ! ! ! !
)
9.)If)you)had)to)make)question)17)more)specific,)how)would)you)phrase)it?))
! ! ! ! ! ! ! ! ! ! ! ! !
! ! ! ! ! ! ! ! ! ! ! ! ! !
!
10.)How)did)you)arrive)at)your)answer)for)questions)18?)(What)did)you)think)about?))
! ! ! ! ! ! ! ! ! ! ! ! !
! ! ! ! ! ! ! ! ! ! ! ! ! !
11.)How)did)you)arrive)at)your)answer)for)question)19?)(What)did)you)think)about?)))
! ! ! ! ! ! ! ! ! ! ! ! !
! ! ! ! ! ! ! ! ! ! ! ! ! !
!
12.)How)did)you)arrive)at)your)answer)for)question)24?))
! ! ! ! ! ! ! ! ! ! ! ! !
! ! ! ! ! ! ! ! ! ! ! ! ! !
)
13.)In)question)28)what)does)“dealing)with)your)concerns)and)frustrations’)mean)to)you?)(to)
get)more)specific)wording)for)the)question)))
! ! ! ! ! ! ! ! ! ! ! ! !
! ! ! ! ! ! ! ! ! ! ! ! ! !
!
14.)How)did)you)arrive)at)your)answer)for)question)35?)(What)did)you)think)about?))
! ! ! ! ! ! ! ! ! ! ! ! !
! ! ! ! ! ! ! ! ! ! ! ! ! !
!
15.)How)did)you)arrive)at)your)answer)for)question)36?)(What)did)you)think)about?)))
! ! ! ! ! ! ! ! ! ! ! ! !
! ! ! ! ! ! ! ! ! ! ! ! ! !
)
)

!109!
16.)Which)questions)do)you)think)are)not)relevant)or)not)important)enough)to)ask)about)on)this)survey?))! ! ! ! ! ! ! ! ! ! ! ! !
! ! ! ! ! ! ! ! ! ! ! ! !
! ! ! ! ! ! ! ! ! ! ! ! ! !
! !
!17.)If)you)had)to)make)this)survey)as)short)as)possible,)which)questions)would)you)eliminate?)(not)important)to)ask)about,)not)relevant)for)injury)care,)not)applicable)to)most)people))))• None!
)
18.)What)you)would)change)about)this)survey)to)make)it)easier)to)understand)and)complete?))! ! ! ! ! ! ! ! ! ! ! ! !
! ! ! ! ! ! ! ! ! ! ! ! !
! ! ! ! ! ! ! ! ! ! ! ! ! !
!
19.)Additional)Comments))
)
• Add!a!question!
• I!didn’t!know!who!to!ask!questions!to!!
• Who!do!I!find!out!information!from?!!
• It!is!important!to!know!who!to!ask!for!the!right!information!!
• Who!is!the!best!person!to!ask!a!question!!
• *not!information,!different!from!questions!12R15,!information!questions!were!good!
• But!who!do!I!ask!when!I!have!a!questions,!closest!question!was!question!28,!but!that!one!is!not!
specific!enough,!keep!28!in,!but!add!the!question!I!suggested!!
• Question!41!was!good,!I!added!my!comment!there!about!the!question!I!want!put!in!!
!
End!of!interview:!!
!
“That’s!the!end!of!the!interview.!Thank!you!so!much!for!participating.!Dr.!Stelfox!and!I!really!appreciate!your!help.!This!feedback!will!help!us!refine!the!survey!so!it!can!hopefully!be!used!to!improve!care!for!patients!and!their!family!members.”!!

!110!
Appendix B: Modified Aid to Capacity Evaluation form )
Modified)Aid)To)Capacity)Evaluation)(ACE)))Evaluation)of)patients’)ability)to)understand)and)consent)to)study)procedures.)
)Name)of)patient:)________________________________)Date:)_______________)Record)observations)that)support)your)score)in)each)domain,)including)exact)responses)of)the)patient.)Indicate)your)score)for)each)domain)with)a)check)mark.)Etchells E, Darzins P, Silberfeld M, et al. Assessment of patient capacity to consent to treatment. J Gen Intern Med 1999;14:27-34. !
1) Able)to)understand)their)medical)problem.))(Example!Questions:!What!problems!are!you!having!right!now?!Why!are!you!in!the!
hospital?)!!!
! ! ! ! ! ! ! ! ! ! ! ! !
! ! ! ! ! ! ! ! ! ! ! ! !
! ! ! ! ! ! ! ! ! ! ! ! ! !
))))))) )Yes!))))))) )Unsure!!!))))))) )No!!!
2) Able)to)understand)the)proposed)study.)(Example!Questions:!What!is!the!purpose!of!our!study?!What!would!you!have!to!do!to!be!involved?)!!
! ! ! ! ! ! ! ! ! ! ! ! !
! ! ! ! ! ! ! ! ! ! ! ! !
! ! ! ! ! ! ! ! ! ! ! ! ! !
))))))) )Yes!))))))) )Unsure!!!))))))) )No!!
3) Able)to)understand)the)option)of)refusing)to)participate))(Example!Questions:!Can!you!refuse!participating!in!the!study?!Could!you!stop!participating!in!the!study!at!any!time?)!!
! ! ! ! ! ! ! ! ! ! ! ! !
! ! ! ! ! ! ! ! ! ! ! ! !
! ! ! ! ! ! ! ! ! ! ! ! ! !
))))))) )Yes!))))))) )Unsure!!!))))))) )No!

!111!
4) Able)to)appreciate)the)reasonably)foreseeable)consequences)of)participating)in)the)study.)
(Example!Questions:!What!could!happen!to!you!if!you!participate?!How!could!participating!help!you?!How!could!participating!help!other!injury!patients?!Could!participating!cause!problems?)!!
! ! ! ! ! ! ! ! ! ! ! ! !
! ! ! ! ! ! ! ! ! ! ! ! !
! ! ! ! ! ! ! ! ! ! ! ! ! !
))))))) )Yes!))))))) )Unsure!!!))))))) )No!!
!
)Overall)Impression))Definitely)capable))Probably)capable))Probably)incapable))Definitely)incapable)
!INSTRUCTIONS!FOR!SCORING!1.!Domains!1R3!evaluate!whether!the!person!understands!their!current!medical!problem!and!the!proposed!study.!Domains!4!evaluates!whether!the!person!appreciates!the!potential!consequences!of!the!study.!!!2.!For!domains!1R4,!if!the!person!responds!appropriately!to!openRended!questions,!score!YES.!If!they!need!repeated!prompting!by!closedRended!questions,!score!UNSURE.!If!they!cannot!respond!appropriately!despite!repeated!prompting,!score!NO.!!!4.!Record!observations!which!support!your!score!in!each!domain,!including!exact!responses!of!the!patient.!!5.!Remember!that!people!are!presumed!capable.!Therefore,!for!your!overall!impression,!if!you!are!uncertain,!then!err!on!the!side!of!calling!a!person!capable.!!!6.)*If)a)person)scores)NO)on)any)of)the)4)domains)and)overall)impression)is)probably)incapable)or)definitely)incapable)then)DO)NOT)enroll)the)patient.)Instead,)enroll)a)family)member)that)is)present.))

!112!
Appendix C: Acute care surveys

!113!

!114!

!115!
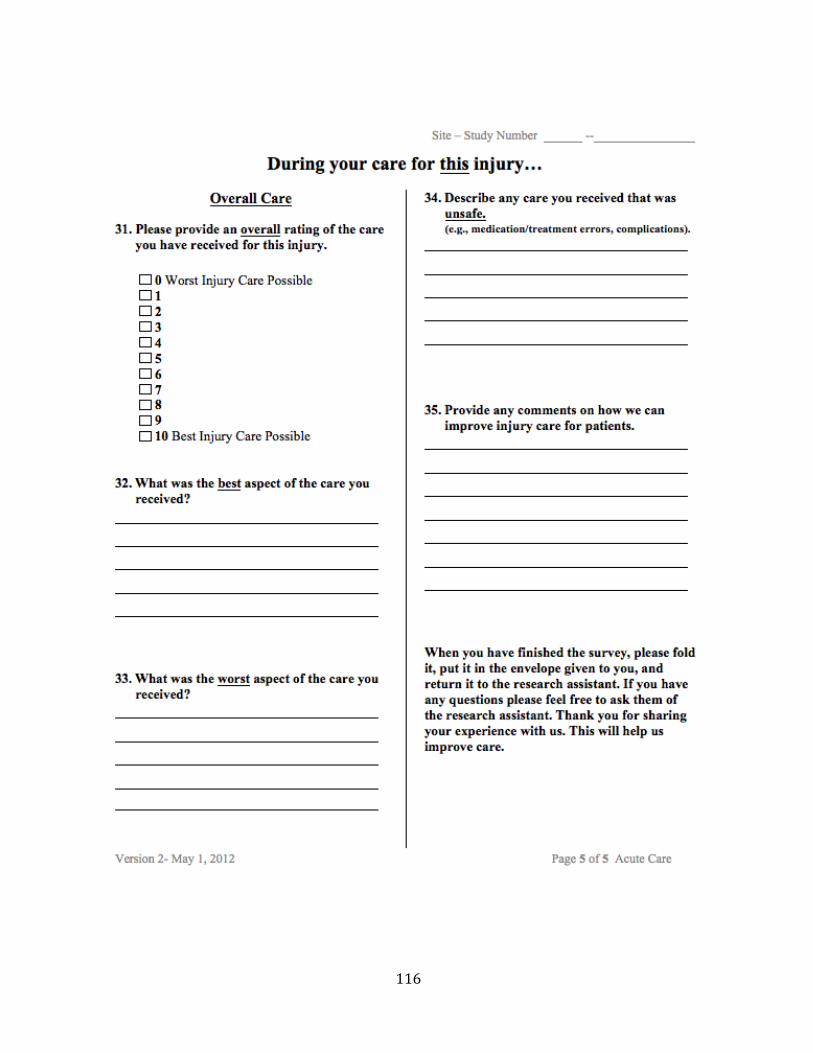
!116!
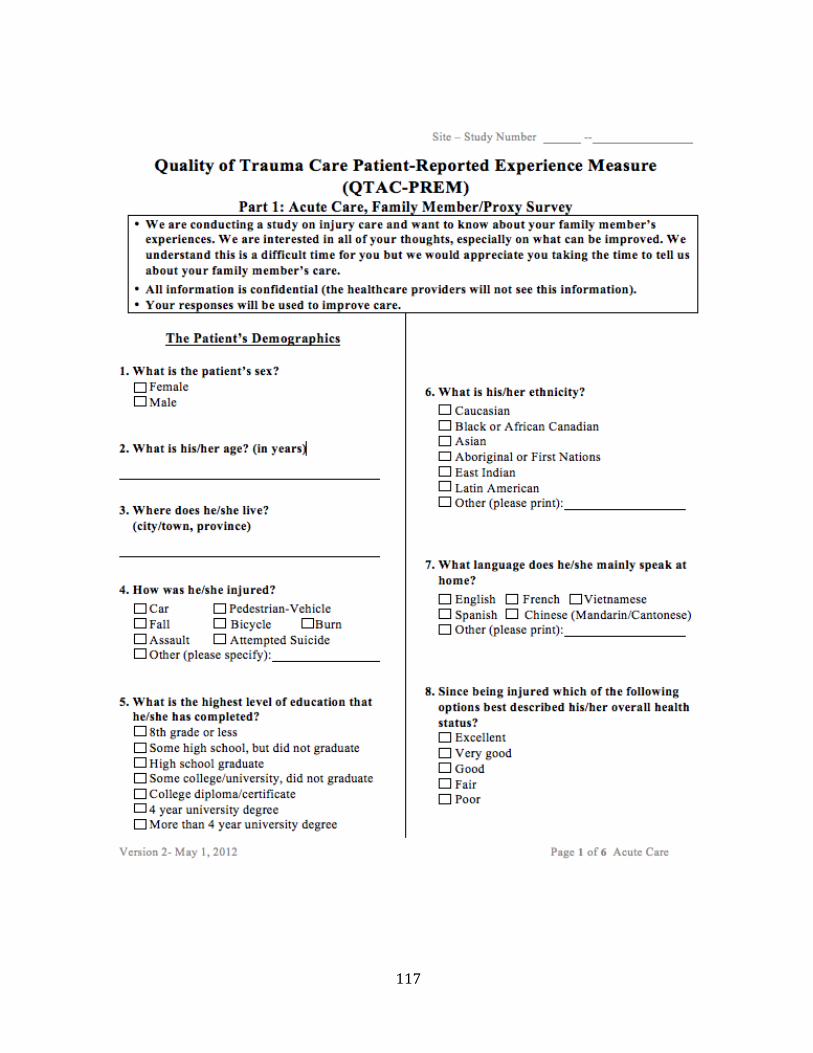
!117!

!118!

!119!

!120!

!121!

!122!

!123!
Appendix D: Post-acute care surveys

!124!

!125!
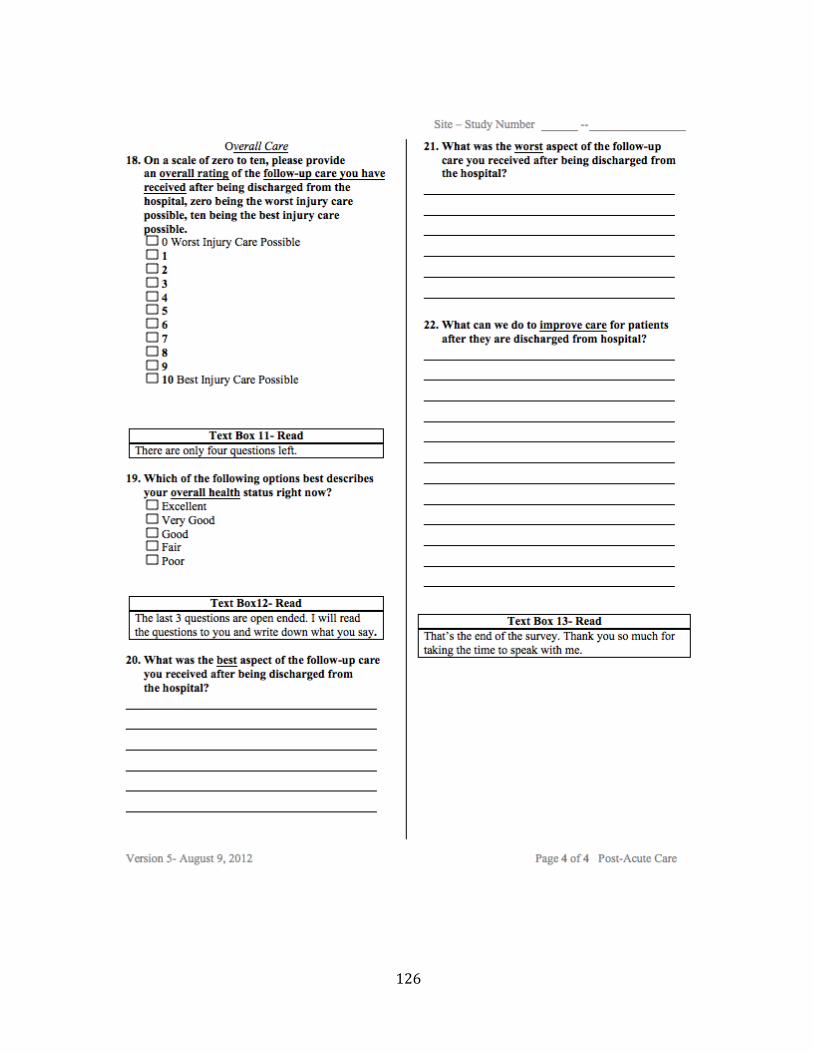
!126!

!127!
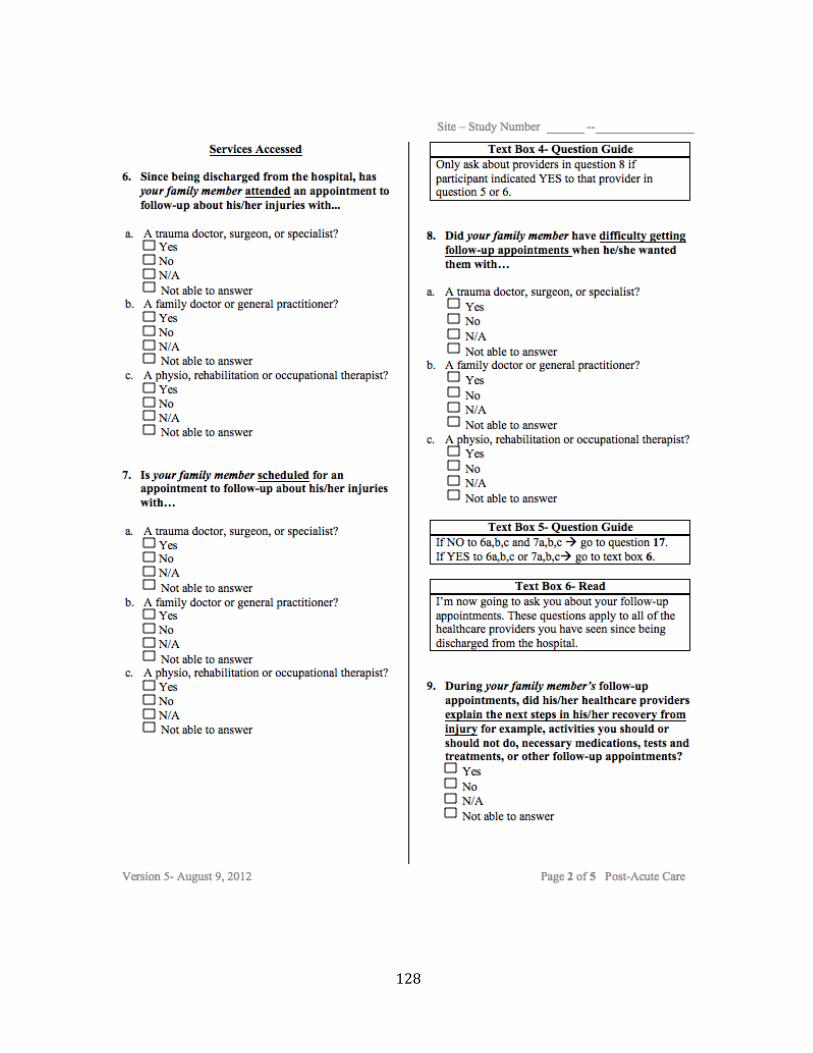
!128!
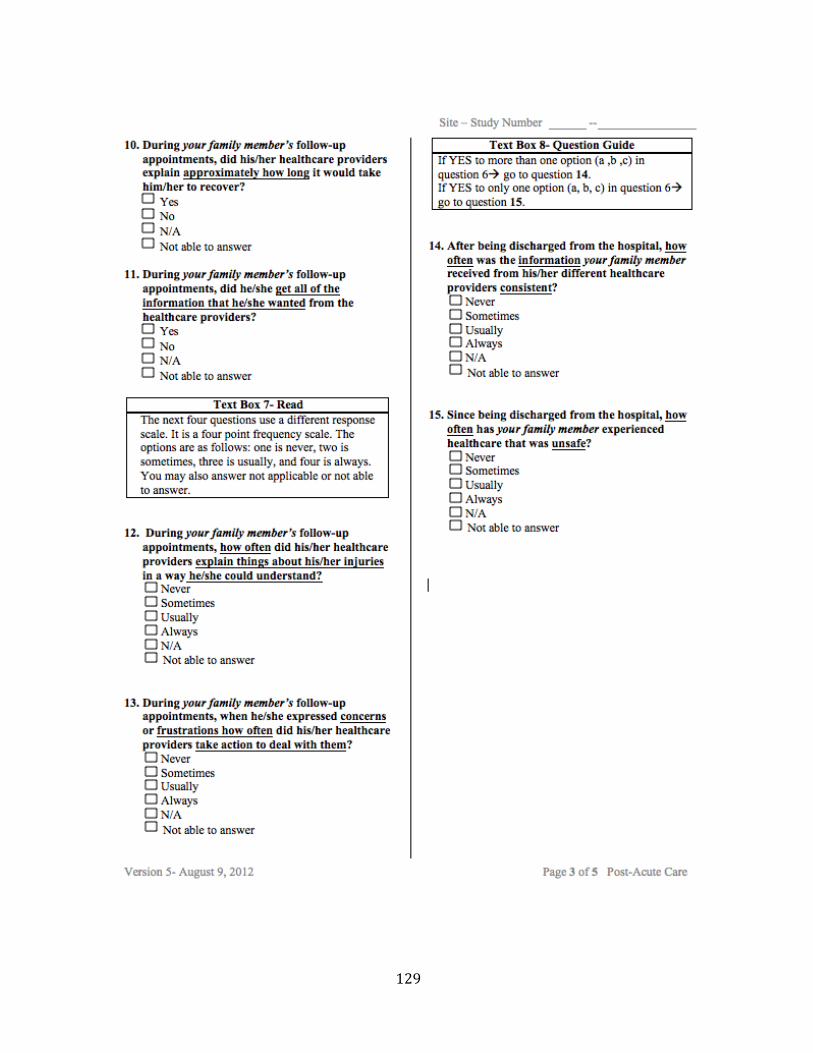
!129!

!130!
!131!
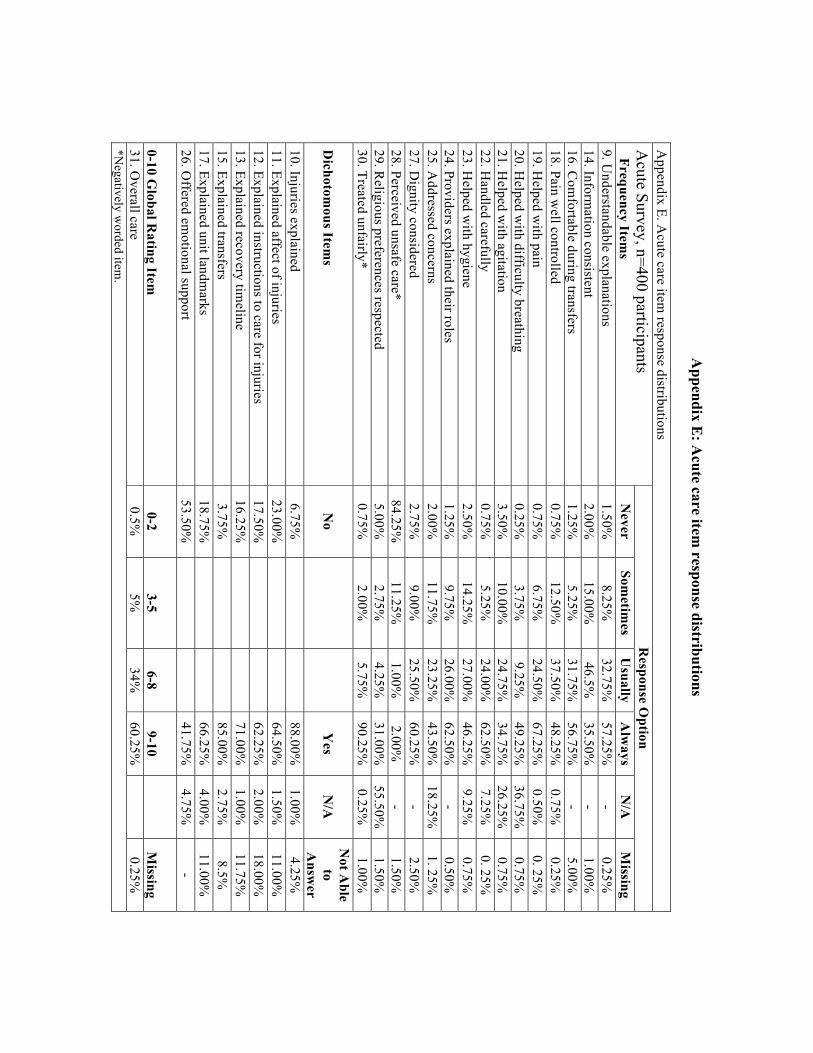
!
Appendix E
: Acute care item
response distributions
Appendix E. A
cute care item response distributions
Acute Survey, n=400 participants
Frequency Items
Response O
ption N
ever Som
etimes
Usually
Alw
ays N
/A
Missing
9. Understandable explanations
1.50%
8.25%
32.75%
57.25%
- 0.25%
14. Inform
ation consistent 2.00%
15.00%
46.5%
35.50%
-
1.00%
16. Com
fortable during transfers 1.25%
5.25%
31.75%
56.75%
-
5.00%
18. Pain well controlled
0.75%
12.50%
37.50%
48.25%
0.75%
0.25%
19. Helped w
ith pain 0.75%
6.75%
24.50%
67.25%
0.50%
0. 25%
20. H
elped with difficulty breathing
0.25%
3.75%
9.25%
49.25%
36.75%
0.75%
21. Helped w
ith agitation 3.50%
10.00%
24.75%
34.75%
26.25%
0.75%
22. H
andled carefully 0.75%
5.25%
24.00%
62.50%
7.25%
0. 25%
23. H
elped with hygiene
2.50%
14.25%
27.00%
46.25%
9.25%
0.75%
24. Providers explained their roles 1.25%
9.75%
26.00%
62.50%
-
0.50%
25. Addressed concerns
2.00%
11.75%
23.25%
43.50%
18.25%
1. 25%
27. Dignity considered
2.75%
9.00%
25.50%
60.25%
- 2.50%
28. Perceived unsafe care*
84.25%
11.25%
1.00%
2.00%
- 1.50%
29. R
eligious preferences respected 5.00%
2.75%
4.25%
31.00%
55.50%
1.50%
30. Treated unfairly*
0.75%
2.00%
5.75%
90.25%
0.25%
1.00%
Dichotom
ous Items
No
Y
es
N/A
N
ot Able
to A
nswer
10. Injuries explained 6.75%
88.00%
1.00%
4.25%
11. Explained affect of injuries
23.00%
64.50%
1.50%
11.00%
12. Explained instructions to care for injuries 17.50%
62.25%
2.00%
18.00%
13. Explained recovery tim
eline 16.25%
71.00%
1.00%
11.75%
15. Explained transfers
3.75%
85.00%
2.75%
8.5%
17. Explained unit landmarks
18.75%
66.25%
4.00%
11.00%
26. Offered em
otional support 53.50%
41.75%
4.75%
-
0-10 Global R
ating Item
0-2
3-5
6-8
9-10
Missing
31. Overall care
0.5%
5%
34%
60.25%
0.25%
*N
egatively worded item
.

!
Appendix F: Post-acute care item
response distributions
Appendix F. Post-acute care item
response distributions Post-A
cute Survey, n=190 participants Frequency Item
s
Response O
ption
Never
Som
etimes
U
sually
Alw
ays
N/A
Missing
12. Understandable explanations
3.7%
11.6%
22.1%
57.9%
4.7%
-
13. Addressed concerns
2.6%
12.1%
15.8%
46.3%
23.2%
-
14. Information consistent
2.6%
8.4%
19%
36.3%
33.7%
-
15. Perceived unsafe care* 97.0%
0
0 3.35%
-
-
Dichotom
ous Items
No
Yes
N/A
M
issing N
ot Able to
Answ
er 2. R
eceived written discharge instructions
24.2%
70.5%
2.1%
3.2%
- 3. D
ischarge instructions adequate 6.4%
64%
28%
1.6%
-
4. Enough pain medication to control pain w
ell 16.8%
69.5%
12.6%
0
1%
5. Received support services
11.6%
55.3%
33.2%
- -
Attended an appointm
ent with a...
6a. Traum
a doctor, surgeon, or specialist 24.2%
75.3%
0.5%
-
- 6b. Fam
ily physician or general practitioner 29.5%
69.5%
1%
-
- 6c. Physio, rehab, or occupational therapist
47.9%
50%
2%
- -
Scheduled for an appointment w
ith a...
7a. Trauma doctor, surgeon, or specialist
39%
60%
1%
- -
7b. Family physician or general practitioner
50.5%
47.9%
1.6%
- -
7c. Physio, rehab, or occupational therapist 34.7%
61.6%
2.6%
1%
-
Difficulty getting appointm
ents with a...
8a. Traum
a doctor, surgeon, or specialist 12.6%
71%
16.3%
-
- 8b. Fam
ily physician or general practitioner 4.7%
71.1%
24.2%
-
- 8c. Physio, rehab, or occupational therapist
2.6%
59%
38.4%
- -
9. Explained next steps in recovery 17.9%
77.4%
4.7%
-
- 10. D
escribed recovery timeline
31.6%
63.7%
4.5%
-
11. Received all inform
ation wanted
17.9%
77.9%
4.2%
-
0-10 Rating Item
s 0-2
3-5 6-8
9-10 N
/A
Missing
16. Inform
ation sent to family physician or G
P 15.3%
4.2%
16.3%
29.5%
32.1%
2.6%
17. Guidance through post-discharge recovery
4.7%
14.2%
41.1%
39.5%
- 0.5%
18. Overall care (G
lobal rating item)
4.2%
9%
40.5%
45.3%
0.5%
0.5%
*N
egatively worded item
.

!
Appendix G: Acute care regression outputs
Acute care regression Acute domain ologit acute_global per_comminfo per_dischinfo per_clinical per_support c_a28_cat Ordered logistic regression Number of obs = 367 LR chi2(5) = 229.82 Prob > chi2 = 0.0000 Log likelihood = -212.16677 Pseudo R2 = 0.3513 ------------------------------------------------------------------------------ acute_global | Coef. Std. Err. z P>|z| [95% Conf. Interval] -------------+---------------------------------------------------------------- per_comminfo | 2.175991 .7909663 2.75 0.006 .6257258 3.726257 per_dischi~o | 1.166439 .3542501 3.29 0.001 .4721212 1.860756 per_clinical | 9.649915 1.22609 7.87 0.000 7.246822 12.05301 per_support | .4998057 .2929362 1.71 0.088 -.0743387 1.07395 c_a28_cat | -.5758419 .3623178 -1.59 0.112 -1.285972 .1342878 -------------+---------------------------------------------------------------- /cut1 | 7.193754 .912225 5.405826 8.981682 /cut2 | 10.589 1.05827 8.514834 12.66318 ------------------------------------------------------------------------------ . brant Brant Test of Parallel Regression Assumption Variable | chi2 p>chi2 df -------------+-------------------------- All | 5.33 0.378 5 -------------+-------------------------- per_comminfo | 0.01 0.909 1 per_dischi~o | 0.08 0.784 1 per_clinical | 4.75 0.029 1 per_support | 0.13 0.714 1 c_a28_cat | 0.01 0.907 1 ---------------------------------------- A significant test statistic provides evidence that the parallel regression assumption has been violated.

!135!
Appendix H: Post-acute care regression outputs ologit postacute_global per_dischprepar per_postcomminfo per_postappointment cp_16 cp_15_cat cp_4 Ordered logistic regression Number of obs = 107 LR chi2(6) = 71.03 Prob > chi2 = 0.0000 Log likelihood = -73.625613 Pseudo R2 = 0.3254 ------------------------------------------------------------------------------ postacute_~l | Coef. Std. Err. z P>|z| [95% Conf. Interval] -------------+---------------------------------------------------------------- per_dischp~r | .5645677 .7233264 0.78 0.435 -.853126 1.982261 per_postco~o | 6.776698 1.377521 4.92 0.000 4.076806 9.47659 per_postap~t | 2.331561 1.453246 1.60 0.109 -.5167475 5.179871 cp_16 | .1580025 .059812 2.64 0.008 .0407732 .2752318 cp_15_cat | .3211641 1.326593 0.24 0.809 -2.278911 2.921239 cp_4 | .2232275 .189095 1.18 0.238 -.1473918 .5938468 -------------+---------------------------------------------------------------- /cut1 | 6.651931 1.629064 3.459025 9.844838 /cut2 | 9.98631 1.80879 6.441146 13.53147 ------------------------------------------------------------------------------ . brant Brant Test of Parallel Regression Assumption Variable | chi2 p>chi2 df -------------+-------------------------- All | 1.84 0.934 6 -------------+-------------------------- per_dischp~r | 0.16 0.692 1 per_postco~o | 0.00 0.960 1 per_postap~t | 0.14 0.707 1 cp_16 | 1.40 0.237 1 cp_15_cat | 0.01 0.905 1 cp_4 | 0.06 0.809 1 ---------------------------------------- A significant test statistic provides evidence that the parallel regression assumption has been violated.

!
Appendix I: Item
-level correlation matrix for Q
TA
C-PR
EM
and HC
AH
PS items
A
ppendix I. Spearman correlation coefficients betw
een QTA
C and H
CA
HPS item
s
HC
AH
PS Item
s
Q
TA
C-PR
EM
Items
Com
munication and Inform
ation
Discharge Inform
ation
Safety
T9 T10
T14 T15
T17 T11
T12 T13
T28
Nurse
Com
munication
H1
-0.15 -0.14
0.24 0.00
0.23 0.11
-0.07 0.01
0.38
H2
0.09 0.06
0.30 0.14
0.24 0.19
0.13 -0.07
0.03
H3
-0.04 -0.15
0.08 0.19
0.02 0.07
-0.07 0.02
0.06
Physician C
omm
unication H
5 -0.04
-0.15 0.08
-0.01 -0.10
0.07 0.05
-0.15 0.11
H6
-0.05 -0.15
0.15 0.05
0.05 0.09
0.00 -0.15
0.23
H7
0.16 0.31
0.54 0.12
0.10 0.32
0.53 0.13
0.47
Staff R
esponsiveness H
4 -0.01
-0.10 -0.03
-0.13 -0.16
-0.11 0.04
-0.08 0.17
H11
0.04 -0.01
0.14 0.00
-0.16 0.09
-0.14 -0.21
0.19
Pain M
anagement
H13
-0.13 -0.22
0.04 -0.03
0.11 0.16
0.06 0.00
0.26
H14
-0.01 -0.13
0.29 -0.03
0.07 0.21
0.15 0.23
0.37
Medication
Com
munication
H16
-0.06 0.09
0.24 0.25
0.27 0.13
0.33 0.12
0.11
H17
-0.26 0.05
0.12 0.32
0.32 0.14
0.25 0.33
0.00
Discharge
Information
H19
-0.06 -0.01
0.17 0.15
0.15 0.21
-0.09 0.04
-0.02
H20
0.00 -0.05
0.17 0.00
0.00 0.16
-0.15 0.13
0.07
Cleanliness of H
ospital H
8 -0.21
-0.17 0.07
-0.21 -0.21
-0.18 -0.19
0.08 0.26
Quietness of H
ospital H
9 -0.37
-0.20 0.09
0.07 0.08
0.03 0.01
-0.11 -0.26
Global R
ating H
21 0.02
0.13 0.29
-0.33 -0.33
0.33 0.37
0.27 0.09
Recom
mend
Hospital
H22
0.08 0.13
0.31 0.02
0.02 0.25
0.36 0.12
0.44

!137!
Appendix I. Spearm
an correlation coefficients between Q
TAC
and HC
AH
PS items
H
CA
HPS
Items
Q
TA
C-PR
EM
Items
Clinical and A
ncillary Aspects of C
are
Supportive A
spects of Care
Global
T16 T18
T19 T20
T21 T22
T23 T24
T25 T27
T30
T26 T29
T31
Nurse
Com
munication
H1
0.11 0.45
0.46 0.19
0.29 0.36
0.23 0.33
0.43 0.48
0.46 0.29
0.44 0.49
H2
0.30 0.37
0.43 0.08
0.48 0.47
0.12 0.33
0.59 0.42
0.40 0.03
0.25 0.43
H3
0.15 -0.11
-0.18 0.08
0.08 0.00
0.15 0.52
0.39 0.41
0.27 0.02
0.50 0.24
Physician C
omm
unication
H5
0.32 -0.11
-0.08 0.11
0.03 0.14
0.09 0.06
0.06 0.11
0.01 0.09
0.46 0.01
H6
0.30 0.06
0.10 0.01
0.09 0.25
0.21 0.32
0.24 0.25
0.06 -0.05
0.37 0.21
H7
0.38 0.10
0.14 0.14
0.41 0.44
0.05 0.10
0.28 0.31
0.30 -0.18
0.12 0.37
Staff R
esponsiveness
H4
-0.05 0.24
0.11 -0.24
0.02 0.02
0.14 0.10
0.17 0.32
-0.20 -0.07
-0.18 0.20
H11
0.08 0.33
0.33 0.00
0.09 0.26
0.13 0.30
0.30 0.41
0.15 0.12
0.14 0.23
Pain M
anagement
H13
0.10 0.48
0.24 -0.09
0.21 0.14
0.17 0.46
0.43 0.30
0.34 0.04
0.29 0.47
H14
-0.02 0.36
0.32 0.11
0.27 0.35
0.16 0.44
0.59 0.29
0.08 0.13
0.28 0.48
Medication
Com
munication
H16
0.08 0.08
0.11 0.02
0.01 -0.05
-0.13 0.08
0.11 0.05
0.30 -0.01
-0.10 0.03
H17
0.06 -0.09
0.03 0.16
0.00 -0.20
-0.04 -0.02
0.11 -0.18
0.13 0.08
0.13 0.01
Discharge
Information
H19
0.01 -0.22
0.00 0.16
0.24 0.16
0.35 0.27
-0.01 0.23
0.00 0.19
0.17 -0.02
H20
-0.20 -0.11
0.18 0.08
0.04 0.05
0.34 0.02
0.15 0.03
-0.10 0.16
0.25 -0.05
Cleanliness of H
ospital H
8 -0.02
0.03 0.00
-0.02 -0.17
-0.07 0.31
-0.04 0.21
0.25 -0.01
0.13 0.14
0.21
Quietness of H
ospital H
9 0.02
-0.04 0.09
-0.07 0.05
-0.13 0.11
0.17 0.10
0.04 0.20
0.30 0.04
0.10
Global R
ating H
21 0.11
0.15 0.20
0.08 0.37
0.23 0.28
0.06 0.17
0.26 0.08
0.22 -0.31
0.50
Recom
mend
Hospital
H22
0.25 0.24
0.41 0.18
0.45 0.31
-0.02 0.19
0.40 0.32
0.43 0.21
0.12 0.55

!
Appendix J: Classification framework for unsafe acts of care
Unsafe Care Classification
1. Diagnostic Issue: This category concerns wrong or delayed diagnosis. This is a
common sort of issue. It usually involves failure to employ appropriate tests or
delays in taking action regarding a diagnosis.
a. There was a failure to employ indicate test(s).
b. There was failure to act upon results of tests or findings.
c. Inappropriate or outmoded diagnostic tests were used.
d. There was a delay in diagnosis.
e. Physicians or other professionals were practicing outside their area of expertise.
2. Operative Issue: This category refers to any issue that was a result of an operation or that
occurred in the post-operative period.
a. The operation was inefficacious (failed to relive symptoms).
b. The patient was inadequately prepared before the operation.
c. Delay in treatment.
d. There was inadequate monitoring of the patient after the operation.
e. Physicians or other professionals were practicing outside their area of expertise.
f. Inappropriate or outmoded forms of therapy were used.
g. None of these apply.

!139!
3. Anesthesia-Related Issue: This category refers to any problems with anesthetic agents. While
anesthesia-related issues a
re operative issues, we want to discriminate between the operative complications caused by
surgeons and the anesthesia-related issues that are the results of matters under the control of an
anesthetist.
a. Intubation.
b. Anesthetic agent issue.
c. Equipment failure.
4. Medical Procedure-Related Issue: This category concerns the issues of procedures that do
not occur in the operating room. Examples of such issues are those related to chest tubes and
sutures. While these procedures may be performed by surgeons, they are considered non-
surgical, in that they do not occur in the operating room.
a. The procedure was inefficacious (failed to relive symptoms).
b. The patient was inadequately prepared before the procedure.
c. There was a delay in treatment.
d. There was inadequate monitoring of the patient after the procedure.
e. Physicians or other professionals were practicing outside their area of expertise.
f. Inappropriate or outmoded forms of therapy were used.
g. None of these apply.
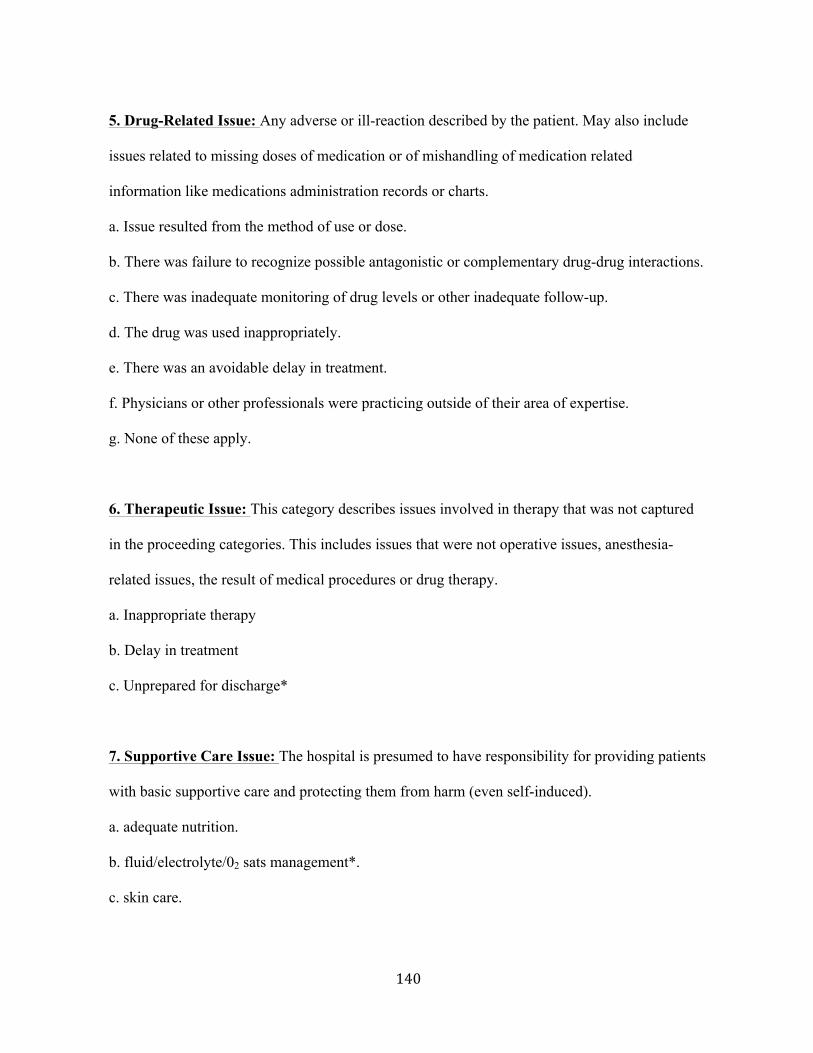
!140!
5. Drug-Related Issue: Any adverse or ill-reaction described by the patient. May also include
issues related to missing doses of medication or of mishandling of medication related
information like medications administration records or charts.
a. Issue resulted from the method of use or dose.
b. There was failure to recognize possible antagonistic or complementary drug-drug interactions.
c. There was inadequate monitoring of drug levels or other inadequate follow-up.
d. The drug was used inappropriately.
e. There was an avoidable delay in treatment.
f. Physicians or other professionals were practicing outside of their area of expertise.
g. None of these apply.
6. Therapeutic Issue: This category describes issues involved in therapy that was not captured
in the proceeding categories. This includes issues that were not operative issues, anesthesia-
related issues, the result of medical procedures or drug therapy.
a. Inappropriate therapy
b. Delay in treatment
c. Unprepared for discharge*
7. Supportive Care Issue: The hospital is presumed to have responsibility for providing patients
with basic supportive care and protecting them from harm (even self-induced).
a. adequate nutrition.
b. fluid/electrolyte/02 sats management*.
c. skin care.
!141!
d. management of excretory functions.
e. protection from falls.
f. inaccessibility of the call button*.
g. contact aggravating the injured body region.
h. cleanliness of the room or patient surroundings*.
Outcome of Issue
1. Disability
2. Prolonged hospital stay
3. Both 1 and 2
4. Pain or discomfort
5. Additional procedures
6. Concern or distress
7. Unclear
Multiple outcomes may be coded.