Embed Size (px)
DESCRIPTION
Development Group. Buddy Bernhard, Tarana Farhat , Ryan Lacey, Amy Lim, Sulaimon Paseda , Marshall Rogers- Mart í nez and Christine Sawyer. U SE IT Grand Challenge. 2011 - PowerPoint PPT Presentation
Citation preview

Development Group
Buddy Bernhard, Tarana Farhat, Ryan Lacey, Amy Lim, Sulaimon
Paseda, Marshall Rogers-Martínez and Christine Sawyer
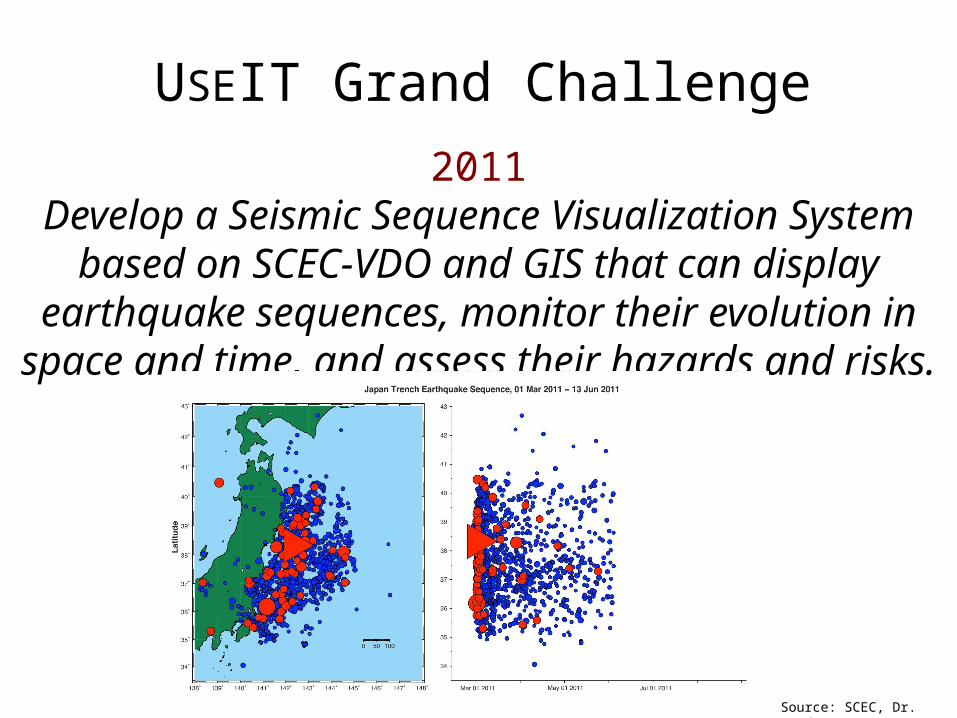
USEIT Grand Challenge2011
Develop a Seismic Sequence Visualization System based on SCEC-VDO and GIS that can display
earthquake sequences, monitor their evolution in space and time, and assess their hazards and risks.
Source: SCEC, Dr. Jordan, 2011

Development Goals from Grand Challenge
• Integration:– Develop a space-time visualization capability in
SCEC-VDO• Use radius coordinate to display time, rather than depth.
– GIS datasets as functional layers and overlays.• Capitalize on data teams collections of information.
• Enhanced surface imagery– Implementation of PNG files
• Allows for variable opacity.

Purpose
• GIS Layers– Present statistical information about a region visually to enhance understanding of earthquake risks by integrating statistical information with hazard information.
• Time-Space Display – Present earthquake sequences in 3 dimensions; time, longitude and latitude. Doing so allows us to understand earthquake sequence progression.
• Surface Imagery – Allows for adjustable transparency of images for enhanced understanding of topography in relation to sub-surface features.
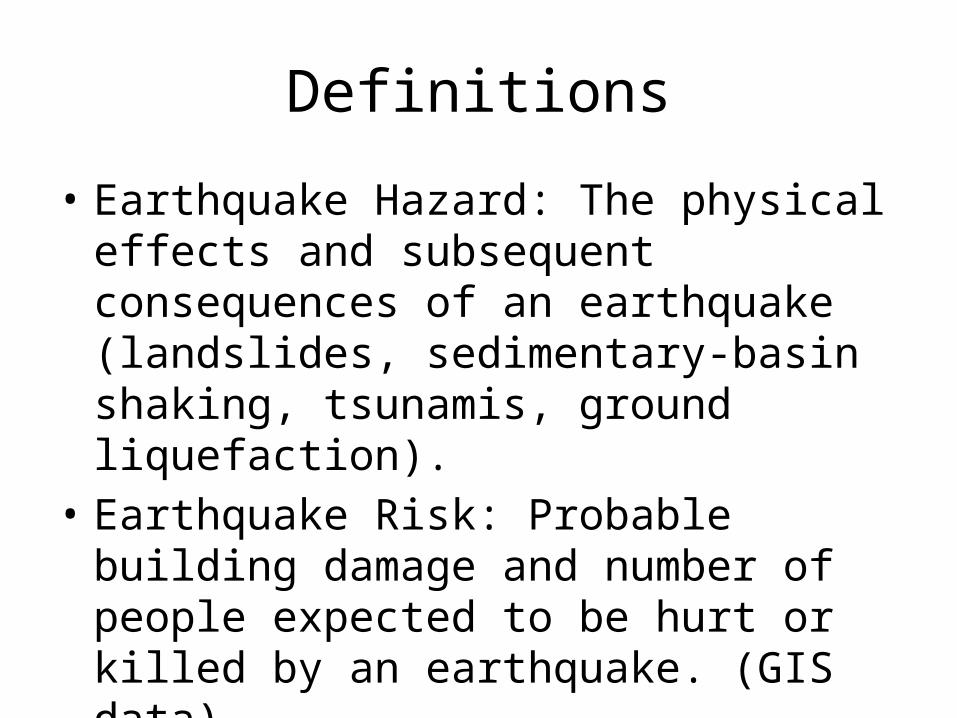
Definitions
• Earthquake Hazard: The physical effects and subsequent consequences of an earthquake (landslides, sedimentary-basin shaking, tsunamis, ground liquefaction).
• Earthquake Risk: Probable building damage and number of people expected to be hurt or killed by an earthquake. (GIS data)

Implementation – GIS Data in Java 3D
• Jenks Natural Breaks Optimization– Compute mean and obtain sum of squared
deviations of each point:•
– Determine binning boundaries from the standard deviations from each point to bin mean:•
– Compute the Goodness of Variance Fit:•

Implementation – GIS Data in Java 3D
• Move points between bins until the GVF can no longer be increased (GVF approaches one as SDCM gets smaller and SDAM gets larger).
• Assign bins different colors according to values (for population bins with higher density get darker colors, less density, lighter colors)

Implementation – Time-Space Plugin
• Obtain dates of all earthquakes and load into memory.
• Normalize the range of earthquake dates to lie within the range R, with
• Normalization Algorithm for each ith earthquake:

Implementation – Time-Space Plugin
• Take each where S corresponds to the height of the total sequence in space.– If S=250, then the earthquakes would be displayed
in a range from the surface (0km) to the height S (250km). The altitude of an individual quake is with respect to its time of occurrence in relation to the total time elapsed of the earthquake catalog it is contained within.

Implementation – Surface Imagery
• Imported topographic maps and converted them into PNG files which are compatible with VDO. – Images modified to fit within the existing political
boundaries of the software. – Images now allow for adjustable opacity for
simultaneous display of sub-surface features with surface map.

ExamplesGIS Layers implemented for the Tōhoku earthquake sequence, showing population density (purple) as well as locations of nuclear power plants (green).

Examples
Space-Time plot implemented for the Sumatra sequence, displaying the number of days since the beginning of the sequence (first foreshock).

Examples
Surface topography implemented with adjustable opacity to show California faults.