Embed Size (px)
Citation preview

Development Impact of Remittances
Sanket Mohapatra (with Dilip Ratha and Ani Silwal)Migration and Remittances Unit
World Bank
UNITAR-IOM-UNFPA Seminar – Migration and the MDGs
New York
September 2, 2010
Outline
A. Stylized facts on international migration
B. Development impact of international
migration and remittances
C. Remittance trends during global financial
crisis and outlook for 2010-11
D. Policy implications
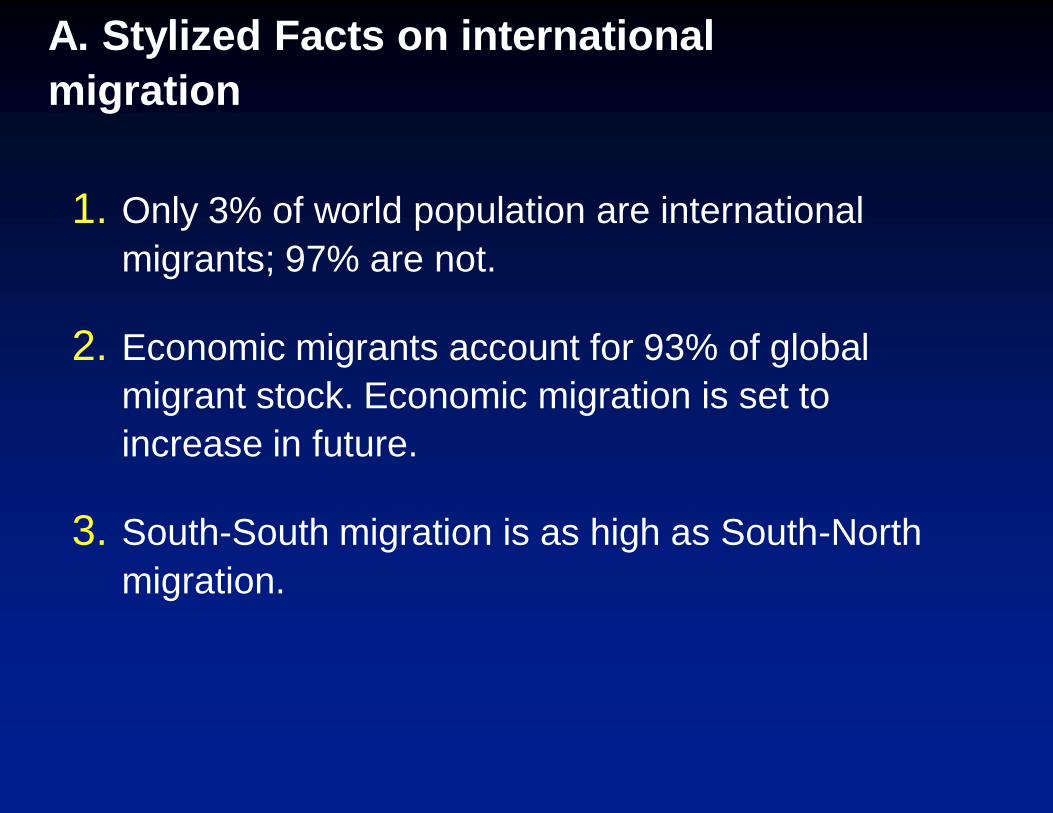
A. Stylized Facts on international
migration
1. Only 3% of world population are international
migrants; 97% are not.
2. Economic migrants account for 93% of global
migrant stock. Economic migration is set to
increase in future.
3. South-South migration is as high as South-North
migration.

South-South migration is almost as large as
South-North migration
South
43%
High-
income non-
OECD
14%
High-
income
OECD
43%
Source: Migration and Remittances Factbook 2011
Destination of migrants from the South
Outline
A. Stylized facts on international migration
B. Development impact of international
migration and remittances
B. Development impact of international migration
1. Migration benefits all parties – the migrants, the
destination country, and the origin country.

Migration benefits all parties
Global income gains of $356 billion from a 3% (14 million)
increase in labor force of industrial countries (GEP 2006)
Global income gains of $675 billion (Anderson and Winters,
2008)
“A conservative estimate of the welfare gain to a moderately
skilled worker… moving to the US is PPP$10,000 per worker,
per year…” (Clemens, Montenegro and Pritchett, 2008)
Dixon and Rimmer (2009) estimate that the difference between
the welfare effects for U.S. households of a tighter border policy
and a liberalized guest worker program with an visa charge is
about $260 billion a year

B. Development impact of international migration
1. Migration benefits all parties – the migrants, the
destination country, and the origin country.
2. Benefits to countries of origin are mostly through
remittances.

0
100
200
300
400
500
600
700
1991
1992
1993
1994
1995
1996
1997
1998
1999
2000
2001
2002
2003
2004
2005
2006
2007
2008
2009
$ billions
Private debt &
port. equity
FDI
ODA
Recorded
Remittances
Remittance flows to developing countries remained
resilient during the crisis

49 48
2220
1511 10 10 10 10
India
Chi
na
Mex
ico
Phi
lippi
nes
Franc
e
Ban
glades
h
Spa
in
Ger
man
y
Nig
eria
Bel
gium
Smaller countries are top recipients of remittances
as share of GDP
50
3831
28 27 26 25 24 22 20
Taj
ikista
n
Tonga
Mol
dova
Kyr
gyz Rep
.
Lesot
ho
Sam
oa
Leban
on
Guy
ana
Nep
al
Hon
duras
$ billions, 2009 % of GDP, 2008
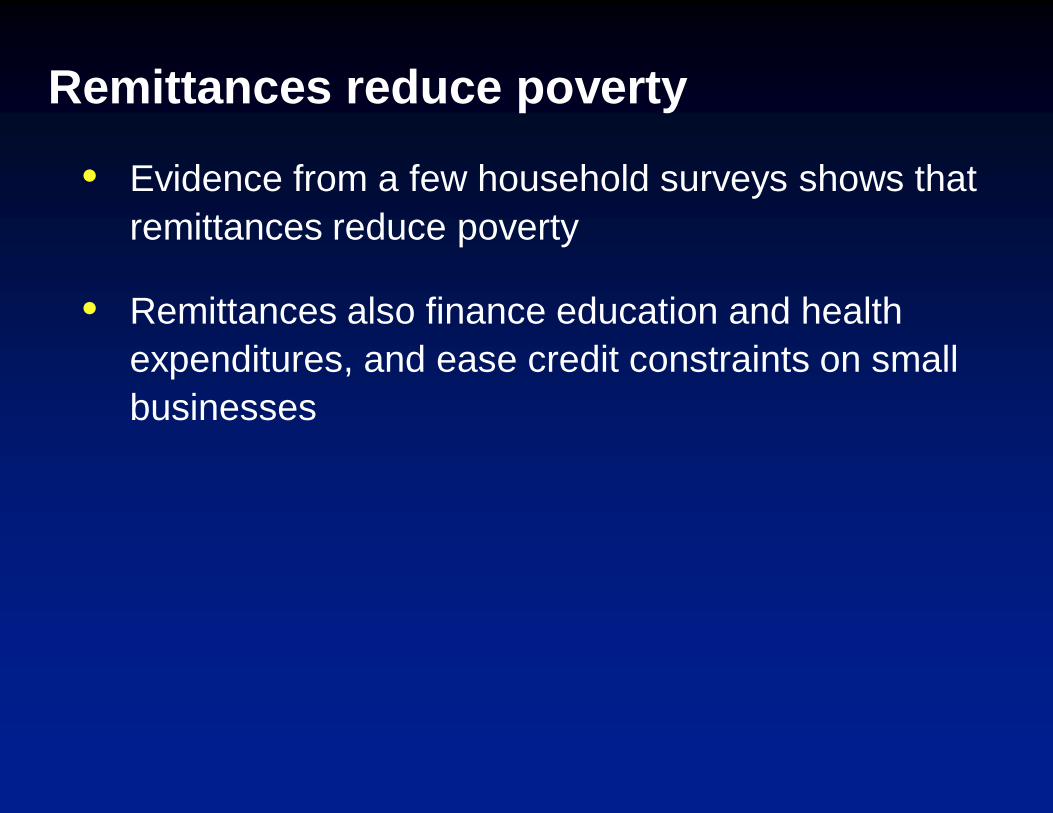
Remittances reduce poverty
Evidence from a few household surveys shows that
remittances reduce poverty
Remittances also finance education and health
expenditures, and ease credit constraints on small
businesses

Remittances reduce poverty: Nepal
23
42
32 31
15
20
25
30
35
40
45
% of household
receiving remittances
Poverty headcount rate
%
1995/6
2003/4
Source: World Bank, DFID, ADB Study 2006, Glinskaya and others 2006

Remittances help reduce poverty in Sri Lanka
0 0 1
1620
8
35
-1
-71 2 3 4 5 6 7 8 9 10
% of Sri Lankan households that moved up to a higher
income decile after receiving remittances, 1999-2000*
Income Decile

Remittances tend to rise following crisis,
natural disaster, or conflict
Remittances as % of private consumption
0.5
1.7
1.21.4
2.0 2.0
1.0
1.8
2.0
Indonesia Thailand Mexico
year before
year of crisis
year after

0
10
20
30
Mexico India Pakistan Bangladesh Philippines Nepal
Percent of GDP Remittances
Trade deficit
Remittances have partially or fully offset
trade deficits in some large recipients

0%
100%
200%
300%
Leba
non
Hai
ti
Nep
al
Jam
aica
Sud
an
Mol
dova
Pak
ista
n
El S
alva
dor
Rom
ania
Arm
enia
Including remittances
Excluding remittances
Remittances contribute to sovereign
creditworthiness
Debt as a percent of exports

Improving ratings
Remittances
(% of GDP,
2004)
Rating
excluding
remittances
Rating
including
remittances
Spread
reduction
(basis
pts)
Lebanon 14 B+ BB- 150
Haiti* 28 CCC B- 334
Nicaragua* 11 CCC+ B- 209
Uganda* 5 B- B 161
* Calculated using the benchmark model of Ratha, De and Mohapatra (2010)

Downside of remittances
Large remittance flows may lead to currency
appreciation and adverse effects on exports; but
sterilization of inflows may not be an appropriate
policy response
Remittances may create dependency
Remittance channels may be misused for money
laundering and financing of terror
Outline
A. Stylized facts on international migration
B. Development impact of international
migration and remittances
C. Remittance trends during global financial
crisis and outlook for 2010-11

Recent remittance trends
Remittances estimated to have declined by only 6%
in 2009, but expected to grow by 6.2% in 2010 and
7.1% in 2011
Risks to the outlook include jobless recovery,
currency movements, and rising protectionism

Outlook for remittance flows for 2009-11
$ billion 2008 2009 2010f 2011f
Developing countries 335.8 315.7 335.4 359.1East Asia and Pacific 86.1 85.7 94.1 102.7Europe and Central Asia 57.5 45.6 48.1 51.7Latin America and Caribbean 64.4 56.5 59.8 64.5Middle-East and North Africa 34.8 32.0 33.1 34.4South Asia 71.7 75.2 78.7 82.8Sub-Saharan Africa 21.3 20.7 21.6 22.9
Growth rate (%)
Developing countries 15.9% -6.0% 6.2% 7.1%East Asia and Pacific 20.7% -0.4% 9.8% 9.2%
Europe and Central Asia 13.3% -20.7% 5.4% 7.6%Latin America and Caribbean 2.1% -12.3% 5.7% 7.9%Middle-East and North Africa 9.8% -8.1% 3.6% 4.0%
South Asia 32.6% 4.9% 4.7% 5.2%Sub-Saharan Africa 14.1% -2.7% 4.4% 5.8%

-25
75
175
275
375
475
575
1991
1992
1993
1994
1995
1996
1997
1998
1999
2000
2001
2002
2003
2004
2005
2006
2007
2008
2009
$ billion
Pvt debt &
port.
equity
FDI
ODA
Recorded
Remittances
Remittances proved to be resilient compared to other
flows
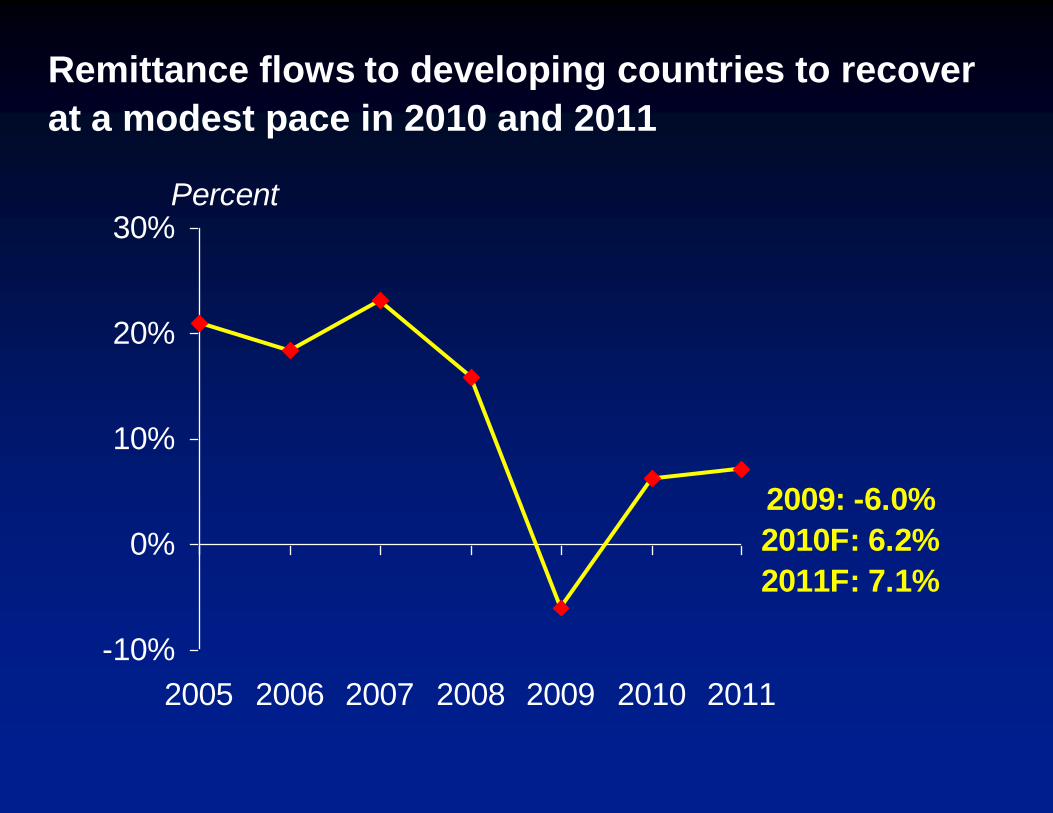
Remittance flows to developing countries to recover
at a modest pace in 2010 and 2011
-10%
0%
10%
20%
30%
2005 2006 2007 2008 2009 2010 2011
Percent
2009: -6.0%
2010F: 6.2%
2011F: 7.1%
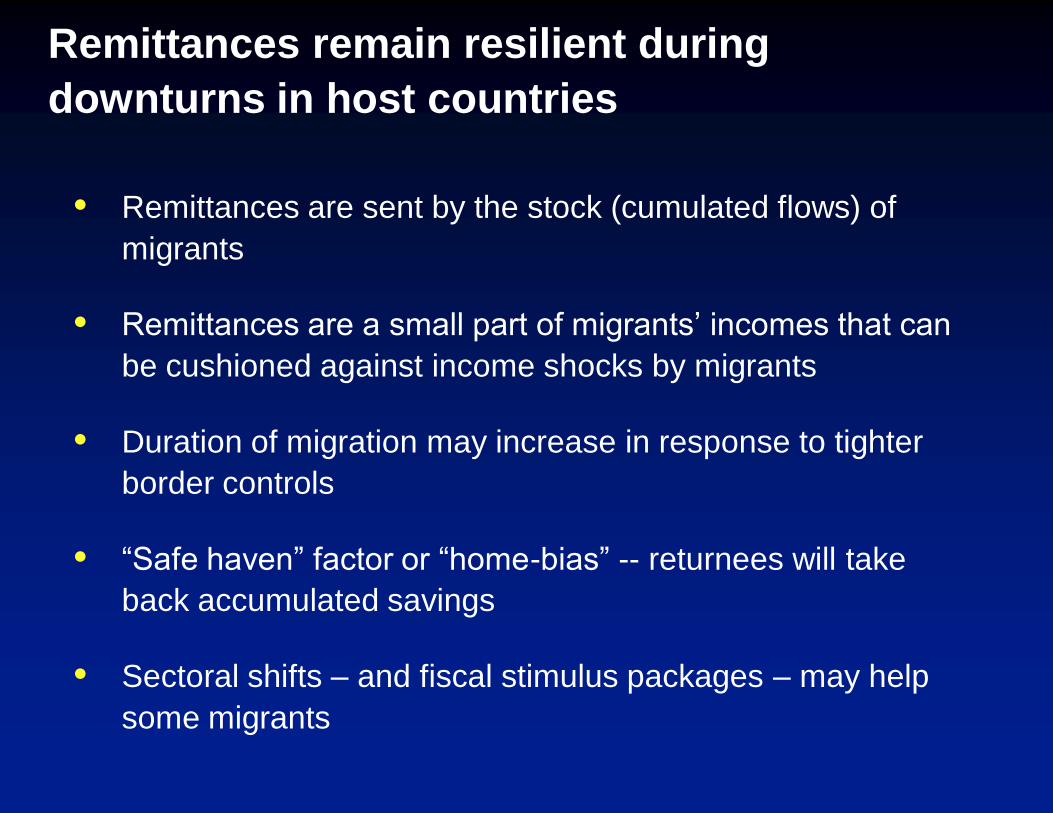
Remittances remain resilient during
downturns in host countries
Remittances are sent by the stock (cumulated flows) of
migrants
Remittances are a small part of migrants’ incomes that can
be cushioned against income shocks by migrants
Duration of migration may increase in response to tighter
border controls
“Safe haven” factor or “home-bias” -- returnees will take
back accumulated savings
Sectoral shifts – and fiscal stimulus packages – may help
some migrants

Regional trends
Remittances to Latin America and Caribbean have
bottomed out since 4Q 2009
Flows to South Asia and East Asia have continued
to grow, but at a markedly lower pace
Flows to Europe & Central Asia and Middle-East
and North Africa fell more than expected
Flows to Sub-Saharan Africa remained flat, judging
from sparse data
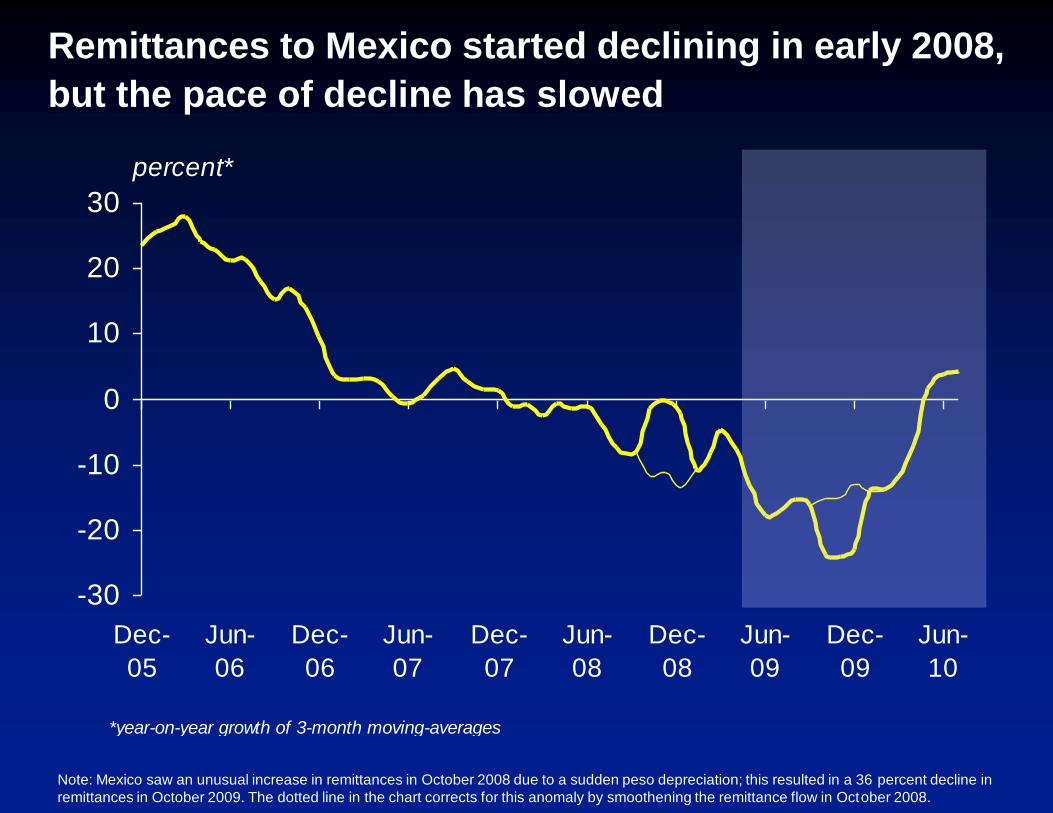
Remittances to Mexico started declining in early 2008,
but the pace of decline has slowed
-30
-20
-10
0
10
20
30
Dec-
05
Jun-
06
Dec-
06
Jun-
07
Dec-
07
Jun-
08
Dec-
08
Jun-
09
Dec-
09
Jun-
10
percent*
*year-on-year growth of 3-month moving-averages
Note: Mexico saw an unusual increase in remittances in October 2008 due to a sudden peso depreciation; this resulted in a 36 percent decline in
remittances in October 2009. The dotted line in the chart corrects for this anomaly by smoothening the remittance flow in October 2008.

Remittances to Latin America and Caribbean appear
to have bottomed out
-25
-15
-5
5
15
Dec-07 Jun-08 Dec-08 Jun-09 Dec-09 Jun-10
El SalvadorHondurasGuatemalaDominican Rep.Jamaica
percent*
*year-on-year growth of 3-month moving-averages

-30
-20
-10
0
10
20
30
40
50
2007
-Q2
2007
-Q3
2007
-Q4
2008
-Q1
2008
-Q2
2008
-Q3
2008
-Q4
2009
-Q1
2009
-Q2
2009
-Q3
2009
-Q4
2010
-Q1
2010
-Q2
-600
-400
-200
0
200
400
600
800
1000
Percent, year-on-year growth Millions US$
Remittances to Ecuador have started falling
again
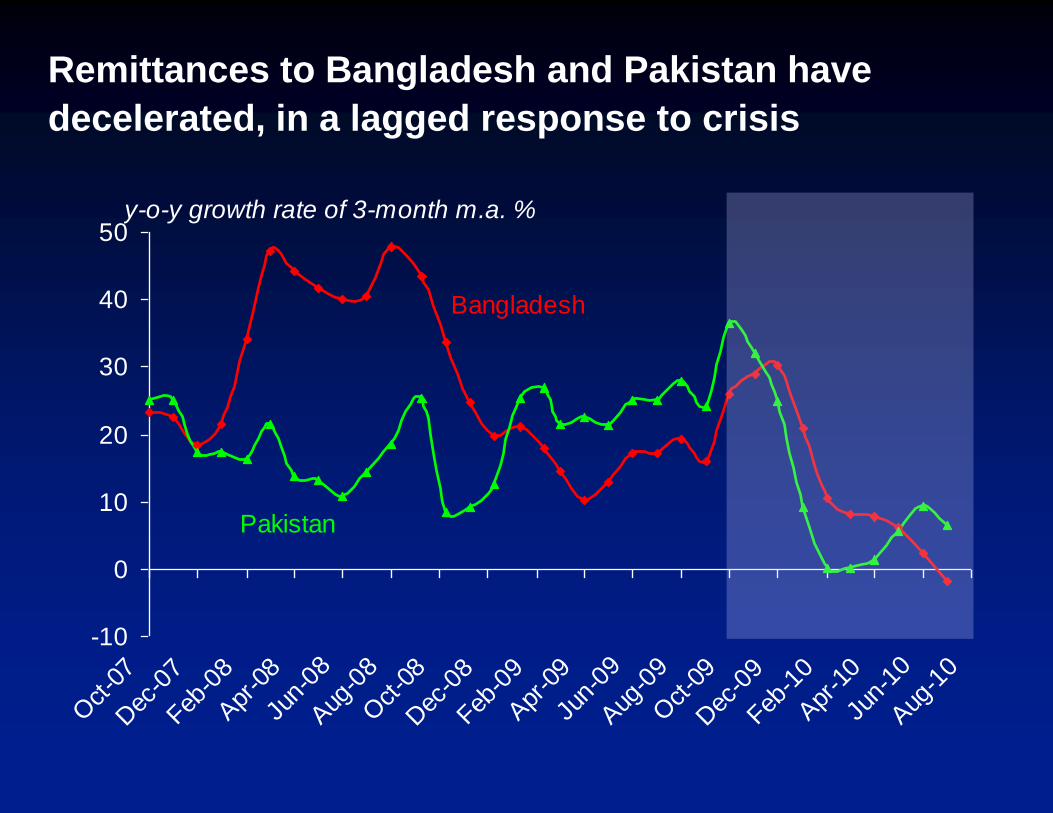
Remittances to Bangladesh and Pakistan have
decelerated, in a lagged response to crisis
-10
0
10
20
30
40
50
Oct
-07
Dec
-07
Feb-0
8
Apr
-08
Jun-
08
Aug
-08
Oct
-08
Dec
-08
Feb-0
9
Apr
-09
Jun-
09
Aug
-09
Oct
-09
Dec
-09
Feb-1
0
Apr
-10
Jun-
10
Aug
-10
y-o-y growth rate of 3-month m.a. %
Bangladesh
Pakistan

Remittances to Philippines have been growing since
Q3 2009
0
5
10
15
20
25
Oct
-07
Dec
-07
Feb-0
8
Apr
-08
Jun-
08
Aug
-08
Oct
-08
Dec
-08
Feb-0
9
Apr
-09
Jun-
09
Aug
-09
Oct
-09
Dec
-09
Feb-1
0
Apr
-10
Jun-
10
Aug
-10
y-o-y growth rate of 3-month m.a. %
Philippines

-40
-20
0
20
40
60
2007
-Q2
2007
-Q3
2007
-Q4
2008
-Q1
2008
-Q2
2008
-Q3
2008
-Q4
2009
-Q1
2009
-Q2
2009
-Q3
2009
-Q4
2010
-Q1
-10
-5
0
5
10
15
Percent, year-on-year growth US$ bn.
Remittances to India grew through the crisis
except in Q1 2009
Note: Private transfers comprise mostly remittances from Indian migrants, but also include other transfers.

Remittances outflows from Russia are correlated
with oil prices
0
2
4
6
8
2002
Q4
2003
Q4
2004
Q4
2005
Q4
2006
Q4
2007
Q4
2008
Q4
2009
Q4
0
20
40
60
80
100
120
140
$ billions
Remittance outflows
(left scale)
Crude oil price
(right scale)
$/barrel
Source: IMF Balance of Payments and Development Prospects Group, World Bank.

Remittance outflows from Saudi Arabia have been
uncorrelated with oil price since early 1990s
0
5
10
15
20
25
1973 1977 1981 1985 1989 1993 1997 2001 2005 2009
0
20
40
60
80
100$ billions
Remittance outflows
from Saudi Arabia
Crude oil price
(right scale)
$/barrel

Three observations
The more diverse the migration destinations, the
more resilient are remittances
The lower the barriers to labor mobility, the stronger
the link between remittances and economic cycles
in that corridor
Exchange rate movements produce valuation
effects, but they also influence the consumption-
investment motive for remittances

Outline
A. Stylized facts on international migration
B. Development impact of international
migration and remittances
C. Remittance trends during global financial
crisis and outlook for 2010-11
D. Policy implications

D. Policy implications
1. The international remittances agenda

International
Remittances
Agenda
1. Monitoring,
analysis, projection
2. Retail payment
systems
3. Financial
access for
households
4. Capital
market access
for institutions

International remittances Agenda
1. Improve monitoring, analysis, projection (MAPping)
2. Improve retail payment systems:
Reduce remittance costs
Improve competition in remittance industry
Share networks - avoid exclusivity contracts
Avoid overregulation of remittance industry
Introduce new technology
3. Leverage remittances for financial access for households
4. Leverage remittances for improving access to capital markets
for institutions/countries

D. Policy implications
1. The international remittances agenda
2. Know your migrants/diaspora
3. Help potential migrants acquire globally marketable
skills
4. Ethical recruitment policies may be ineffective, and
unethical –
5. Improve transparency in recruitment of migrants
6. Border control policies should be revisited
7. Migration is not a substitute for employment
creation at home

Summary
Migration generates substantial welfare gains and reduces poverty
Benefits to countries of origin are mostly through remittances (and also through trade, investments, and transfer of knowledge, skill and technology)
Remittances flows have been resilient during global financial crisis, but risks to outlook from jobless economic recovery and rising protectionism

Thank you!


![Silwal presentation [PDF 9.79MB]](https://img.pdfslide.net/doc/110x75/589edeb61a28abb24d8b6e2d/silwal-presentation-pdf-979mb.jpg)