Embed Size (px)
Citation preview

Development of 2014 Georgia Wildland Fire Emission InventoryTao Zeng, Di Tian and James Boylan Georgia Environmental Protection DivisionAir Protection Branch
2017 International Emissions Inventory ConferenceBaltimore, MD
August 18, 2017

OUTLINE
1. Wildland fires in Georgia and their impacts on air quality
2. Develop Georgia EPD’s 2014 wildland fire inventory
3. Review EPA’s 2014 National wildland fire Inventory
4. Future improvement plan5. Summary
2
1. WILDLAND FIRES IN GEORGIA AND THEIR IMPACTS ON AIR QUALITY
3
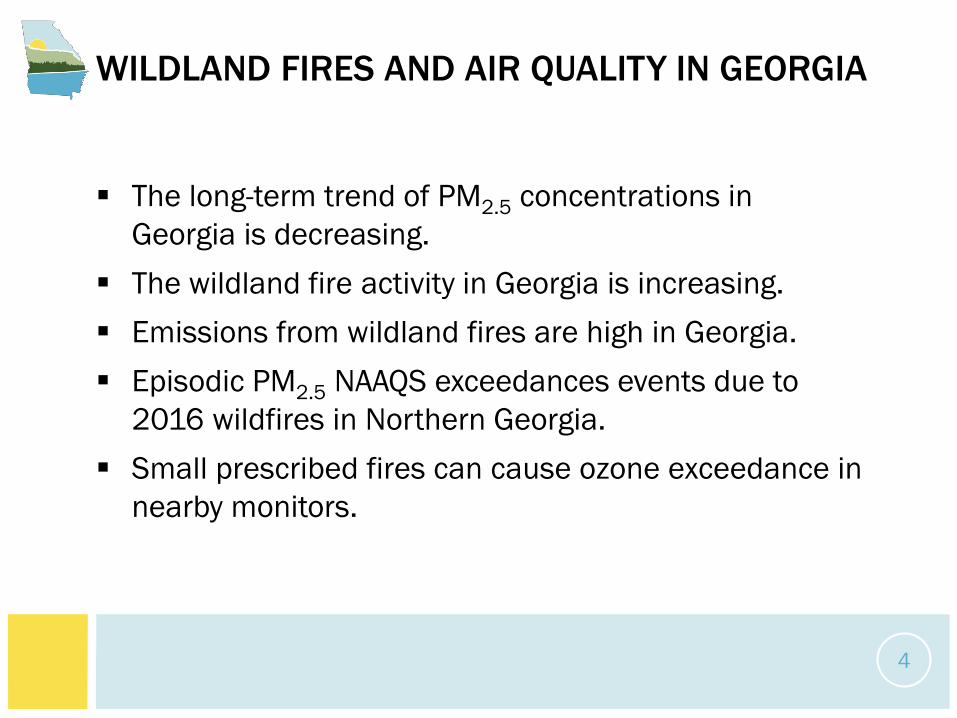
WILDLAND FIRES AND AIR QUALITY IN GEORGIA
The long-term trend of PM2.5 concentrations in Georgia is decreasing.
The wildland fire activity in Georgia is increasing. Emissions from wildland fires are high in Georgia. Episodic PM2.5 NAAQS exceedances events due to
2016 wildfires in Northern Georgia. Small prescribed fires can cause ozone exceedance in
nearby monitors.
4

ANNUAL PM2.5 DESIGN VALUE TRENDS
5
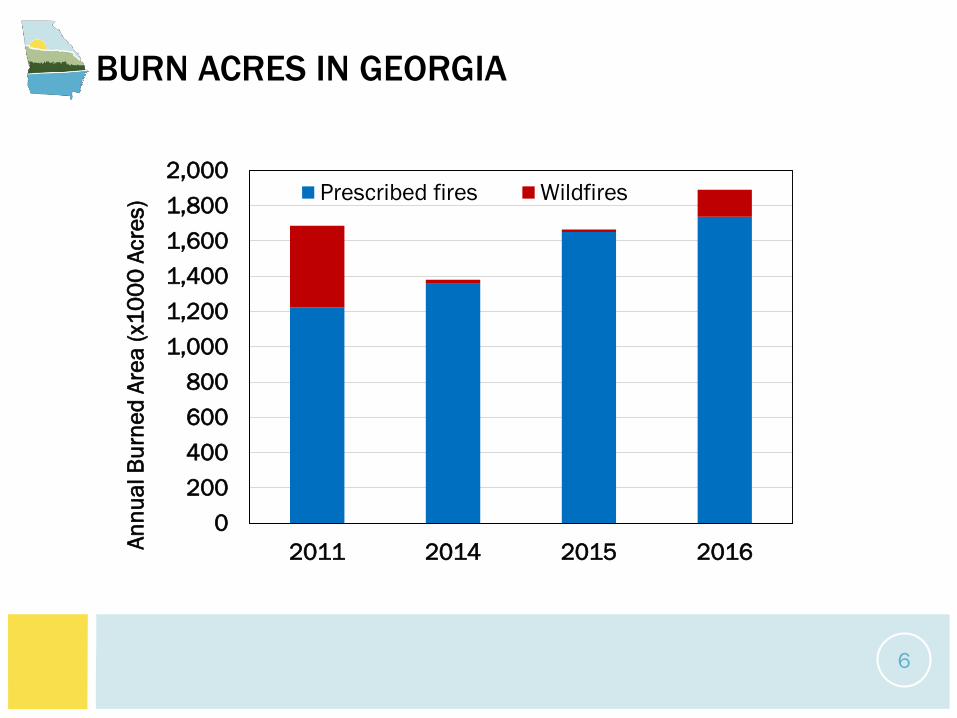
BURN ACRES IN GEORGIA
0200400600800
1,0001,2001,4001,6001,8002,000
2011 2014 2015 2016Annu
al B
urne
d Ar
ea (x
1000
Acr
es) Prescribed fires Wildfires
6
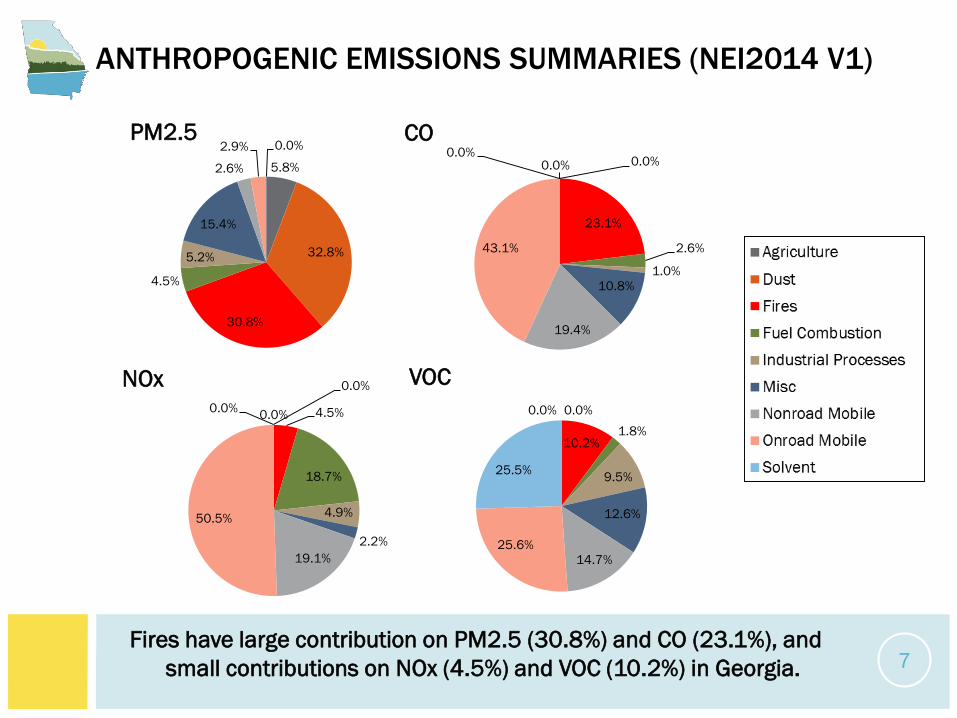
ANTHROPOGENIC EMISSIONS SUMMARIES (NEI2014 V1)
Fires have large contribution on PM2.5 (30.8%) and CO (23.1%), and small contributions on NOx (4.5%) and VOC (10.2%) in Georgia. 7
5.8%
32.8%
30.8%
4.5%
5.2%
15.4%
2.6%
2.9% 0.0%PM2.5
0.0% 0.0%
23.1%
2.6%
1.0%10.8%
19.4%
43.1%
0.0%CO
0.0%
0.0%
4.5%
18.7%
4.9%
2.2%19.1%
50.5%
0.0%
NOx0.0% 0.0%
10.2%1.8%
9.5%
12.6%
14.7%25.6%
25.5%
VOC
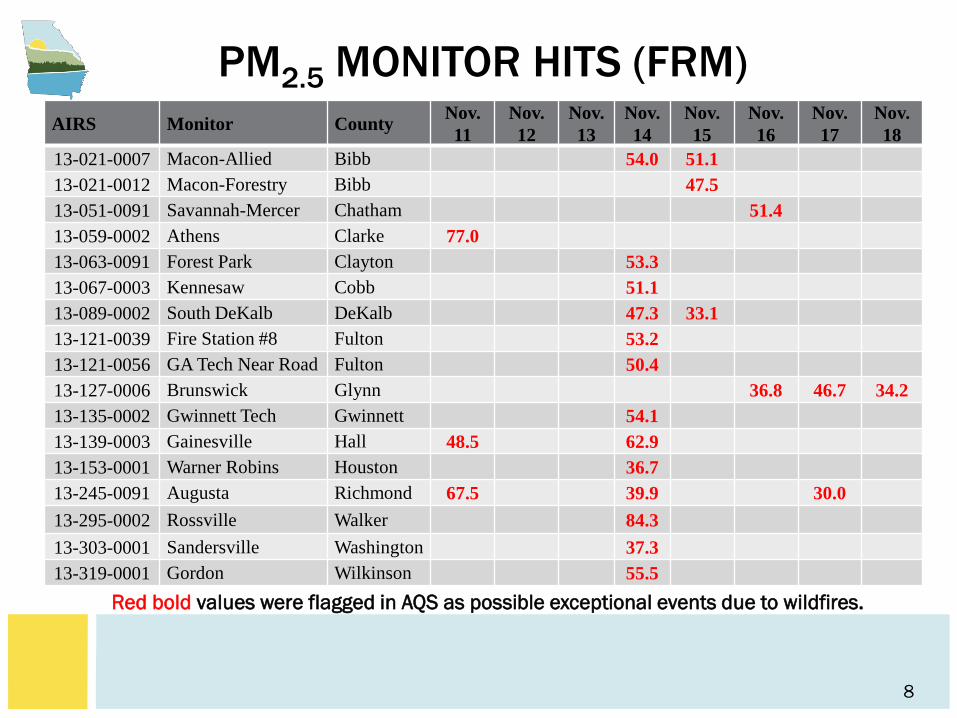
PM2.5 MONITOR HITS (FRM)AIRS Monitor County Nov.
11Nov. 12
Nov. 13
Nov. 14
Nov. 15
Nov. 16
Nov. 17
Nov. 18
13-021-0007 Macon-Allied Bibb 54.0 51.113-021-0012 Macon-Forestry Bibb 47.513-051-0091 Savannah-Mercer Chatham 51.413-059-0002 Athens Clarke 77.013-063-0091 Forest Park Clayton 53.313-067-0003 Kennesaw Cobb 51.113-089-0002 South DeKalb DeKalb 47.3 33.113-121-0039 Fire Station #8 Fulton 53.213-121-0056 GA Tech Near Road Fulton 50.413-127-0006 Brunswick Glynn 36.8 46.7 34.213-135-0002 Gwinnett Tech Gwinnett 54.113-139-0003 Gainesville Hall 48.5 62.913-153-0001 Warner Robins Houston 36.713-245-0091 Augusta Richmond 67.5 39.9 30.013-295-0002 Rossville Walker 84.313-303-0001 Sandersville Washington 37.313-319-0001 Gordon Wilkinson 55.5
Red bold values were flagged in AQS as possible exceptional events due to wildfires.
8

OZONE – FORT MOUNTAIN
9
• Prescribed fire (2 acres) on April 24, 2015– 8-hour daily maximum ozone concentration was 104 ppb
• The next highest 8-hour ozone concentration at this site in 2015 was 67 ppb– Elevated 1-minute ozone concentrations (over 500 ppb) from 11:00 am to 1:00 pm
• Q/D = 0.174 tpd/km << 100 tpd/km– Emis_NOx: 0.0114 tons, Emis_VOC: 0.0151 tons, D = 0.15 km– Q/D > 100 tpd/km recommended by EPA to screen fire events with large air quality
impacts in the “Guidance on the Preparation of Exceptional Events Demonstrations for Wildfire Events that May Influence Ozone Concentrations”
2. DEVELOP GEORGIA EPD’S 2014 WILDLAND FIRE INVENTORY
10
GEORGIA EPD WILDLAND FIRE EMISSION INVENTORY
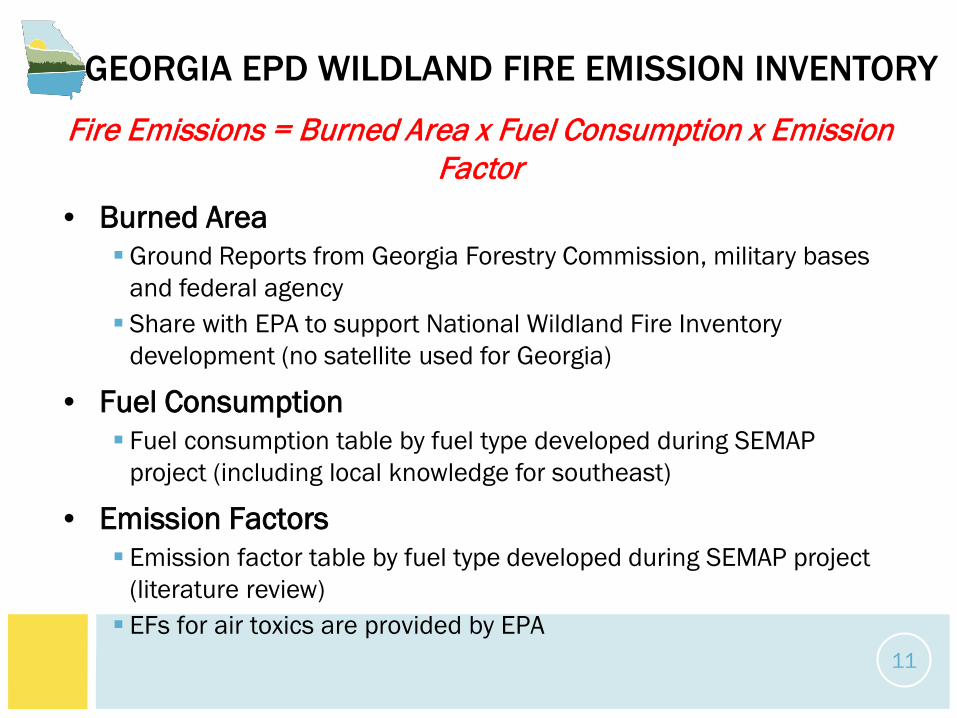
Fire Emissions = Burned Area x Fuel Consumption x Emission Factor
• Burned AreaGround Reports from Georgia Forestry Commission, military bases
and federal agency Share with EPA to support National Wildland Fire Inventory
development (no satellite used for Georgia)
• Fuel Consumption Fuel consumption table by fuel type developed during SEMAP
project (including local knowledge for southeast)
• Emission Factors Emission factor table by fuel type developed during SEMAP project
(literature review) EFs for air toxics are provided by EPA
11
EMISSIONS SPLIT FOR FLAMING/SMOLDERING
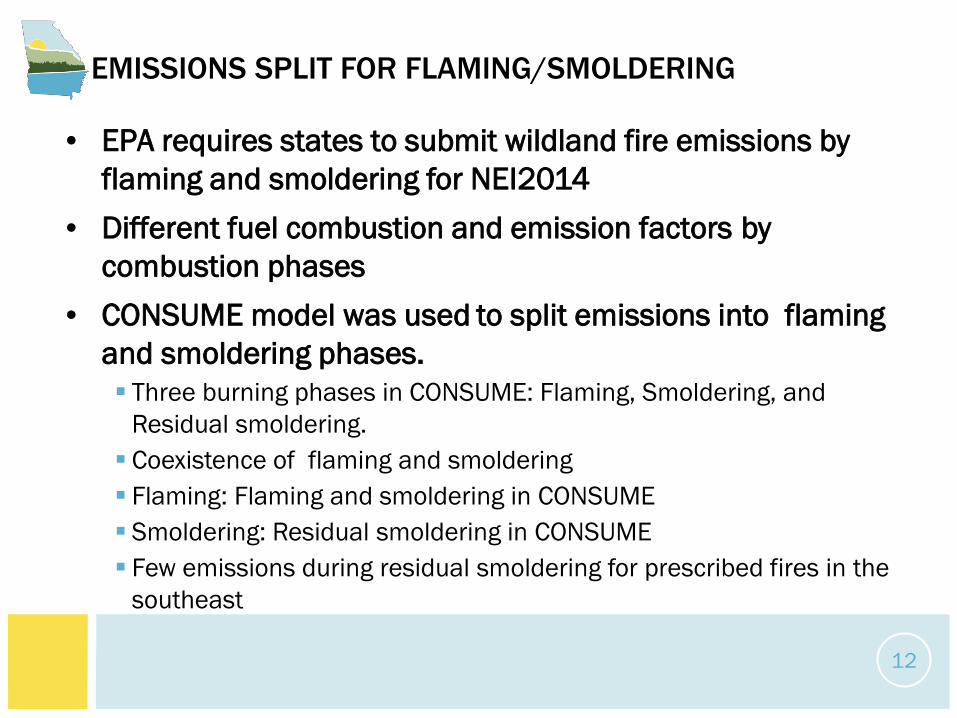
• EPA requires states to submit wildland fire emissions by flaming and smoldering for NEI2014
• Different fuel combustion and emission factors by combustion phases
• CONSUME model was used to split emissions into flaming and smoldering phases. Three burning phases in CONSUME: Flaming, Smoldering, and
Residual smoldering. Coexistence of flaming and smoldering Flaming: Flaming and smoldering in CONSUME Smoldering: Residual smoldering in CONSUME Few emissions during residual smoldering for prescribed fires in the
southeast
12
3. REVIEW EPA’S 2014 NATIONAL WILDLAND FIRE INVENTORY
13

NEI2014 FIRE EMISSIONS---- TOTAL EMISSIONS
14
0
20000
40000
60000
80000
100000
120000
140000
160000
BA/10 PM25 PM10 CO/10 NOx NH3 SO2 VOC
Fire
Em
issi
on (T
ons)
GA EPA
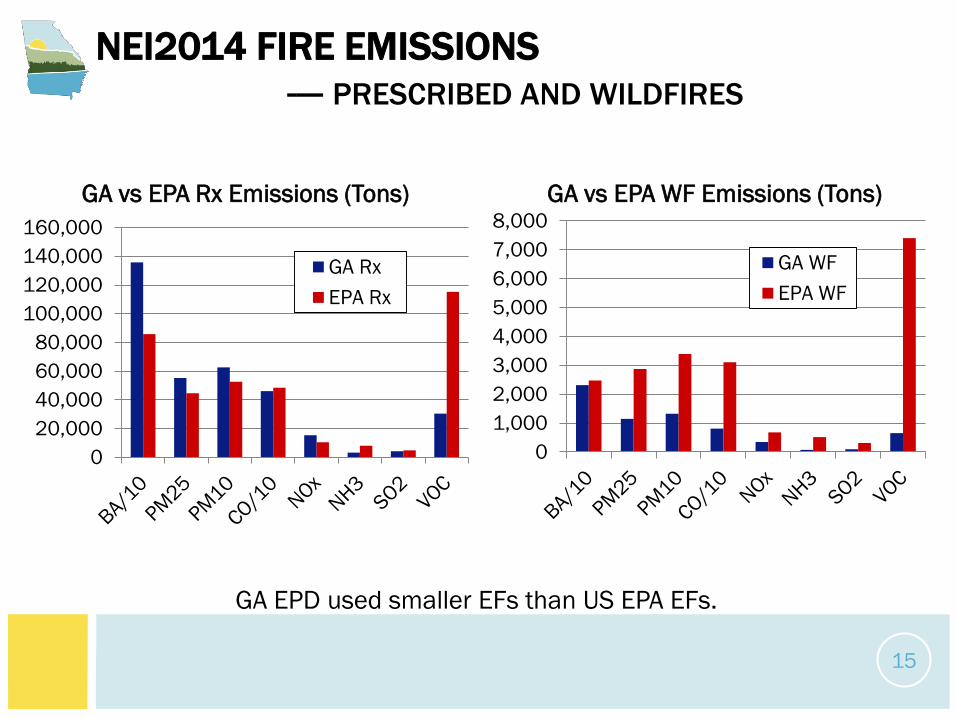
NEI2014 FIRE EMISSIONS---- PRESCRIBED AND WILDFIRES
GA EPD used smaller EFs than US EPA EFs.
15
020,00040,00060,00080,000
100,000120,000140,000160,000
GA vs EPA Rx Emissions (Tons)
GA RxEPA Rx
01,0002,0003,0004,0005,0006,0007,0008,000
GA vs EPA WF Emissions (Tons)
GA WFEPA WF
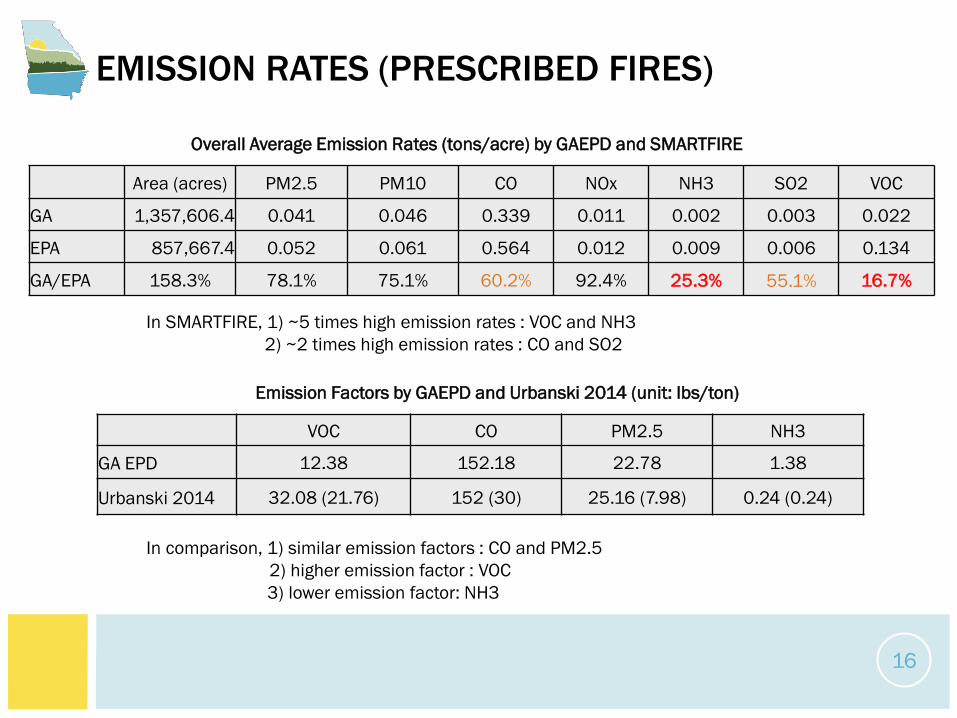
EMISSION RATES (PRESCRIBED FIRES)
VOC CO PM2.5 NH3
GA EPD 12.38 152.18 22.78 1.38
Urbanski 2014 32.08 (21.76) 152 (30) 25.16 (7.98) 0.24 (0.24)
Emission Factors by GAEPD and Urbanski 2014 (unit: lbs/ton)
Area (acres) PM2.5 PM10 CO NOx NH3 SO2 VOC
GA 1,357,606.4 0.041 0.046 0.339 0.011 0.002 0.003 0.022
EPA 857,667.4 0.052 0.061 0.564 0.012 0.009 0.006 0.134
GA/EPA 158.3% 78.1% 75.1% 60.2% 92.4% 25.3% 55.1% 16.7%
Overall Average Emission Rates (tons/acre) by GAEPD and SMARTFIRE
In SMARTFIRE, 1) ~5 times high emission rates : VOC and NH32) ~2 times high emission rates : CO and SO2
In comparison, 1) similar emission factors : CO and PM2.52) higher emission factor : VOC3) lower emission factor: NH3
16
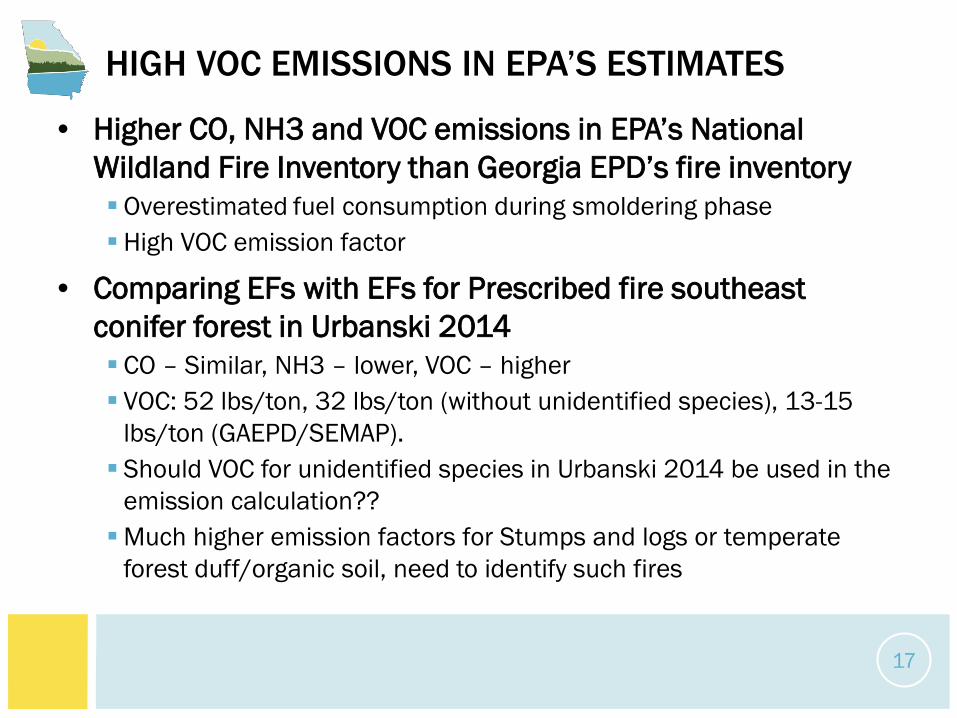
HIGH VOC EMISSIONS IN EPA’S ESTIMATES
• Higher CO, NH3 and VOC emissions in EPA’s National Wildland Fire Inventory than Georgia EPD’s fire inventoryOverestimated fuel consumption during smoldering phaseHigh VOC emission factor
• Comparing EFs with EFs for Prescribed fire southeast conifer forest in Urbanski 2014 CO – Similar, NH3 – lower, VOC – higher VOC: 52 lbs/ton, 32 lbs/ton (without unidentified species), 13-15
lbs/ton (GAEPD/SEMAP). Should VOC for unidentified species in Urbanski 2014 be used in the
emission calculation??Much higher emission factors for Stumps and logs or temperate
forest duff/organic soil, need to identify such fires
17
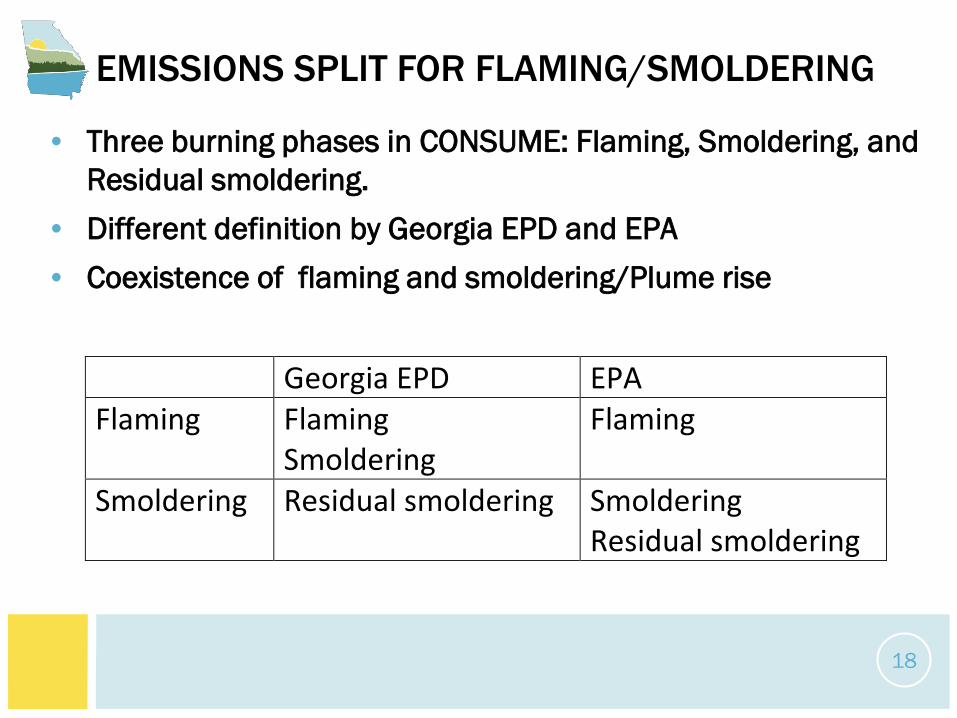
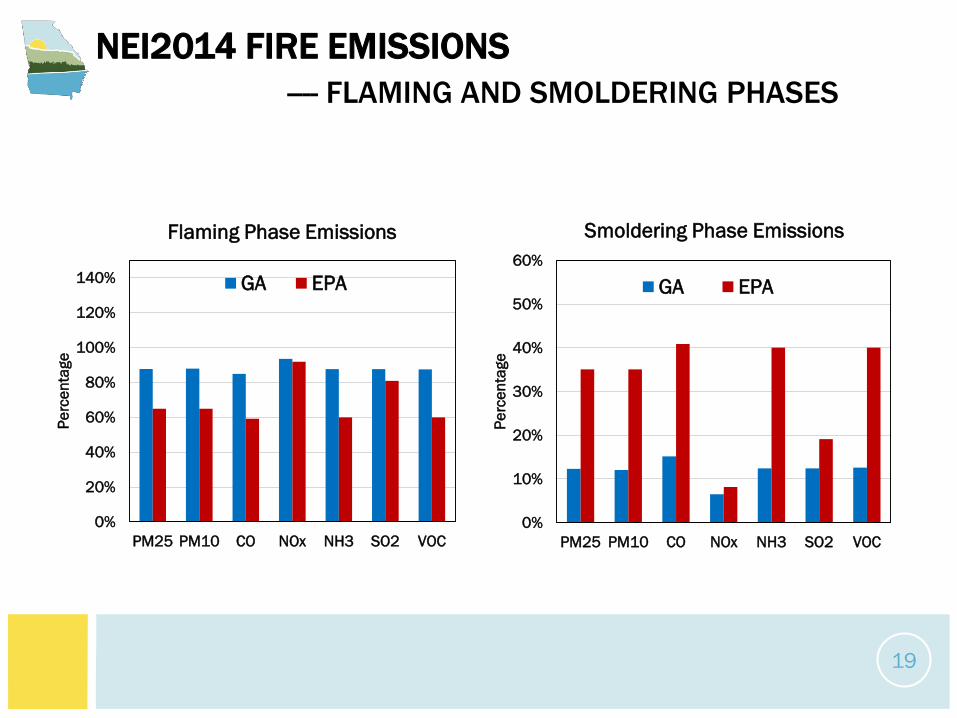
EMISSIONS SPLIT FOR FLAMING/SMOLDERING
• Three burning phases in CONSUME: Flaming, Smoldering, and Residual smoldering.
• Different definition by Georgia EPD and EPA• Coexistence of flaming and smoldering/Plume rise
18
Georgia EPD EPA Flaming Flaming
Smoldering Flaming
Smoldering Residual smoldering Smoldering Residual smoldering
0%
20%
40%
60%
80%
100%
120%
140%
PM25 PM10 CO NOx NH3 SO2 VOC
Perc
enta
ge
Flaming Phase Emissions
GA EPA
0%
10%
20%
30%
40%
50%
60%
PM25 PM10 CO NOx NH3 SO2 VOC
Perc
enta
ge
Smoldering Phase Emissions
GA EPA
NEI2014 FIRE EMISSIONS---- FLAMING AND SMOLDERING PHASES
19

GROUND REPORTS VS SATELLITE FIRE DETECTION
Coverage Satellite fire detection is continuous with large spatial coverage (cloud/canopy
interferences) Ground data is continuous with good coverage (human errors/missing reports)
Data Uncertainty Satellite detects radiance and convert it to fire size, ground pixel size is >100m. Ground data is a direct estimate of fire size, no size limit, but with uncertainties
in fire size/location.
Possible Error Satellite fire detection: fire size, cloud interference, false alarm Ground report: human error, including missing report, fire size&location
Statistically, there are certain correlation between the two fire products in the whole state, but lacking correlations for individual fires. (Zeng et al., Atmos. Environ., 2015; Hu et al., JGR, 2016)
20
0.0%
10.0%
20.0%
30.0%
40.0%
50.0%
60.0%
1 10 100 500 1000 More
GA Prescribed fires
Fire CountsAcres
0.0%
20.0%
40.0%
60.0%
80.0%
1 10 100 500 1000 More
EPA Prescribed Fires
Fire CountsAcres
0.0%
10.0%
20.0%
30.0%
40.0%
50.0%
60.0%
1 10 100 500 1000 More
GA Wildfires
Fire CountsAcres
0.0%
10.0%
20.0%
30.0%
40.0%
50.0%
60.0%
1 10 100 500 1000 More
EPA Wildfires
Fire CountsAcres
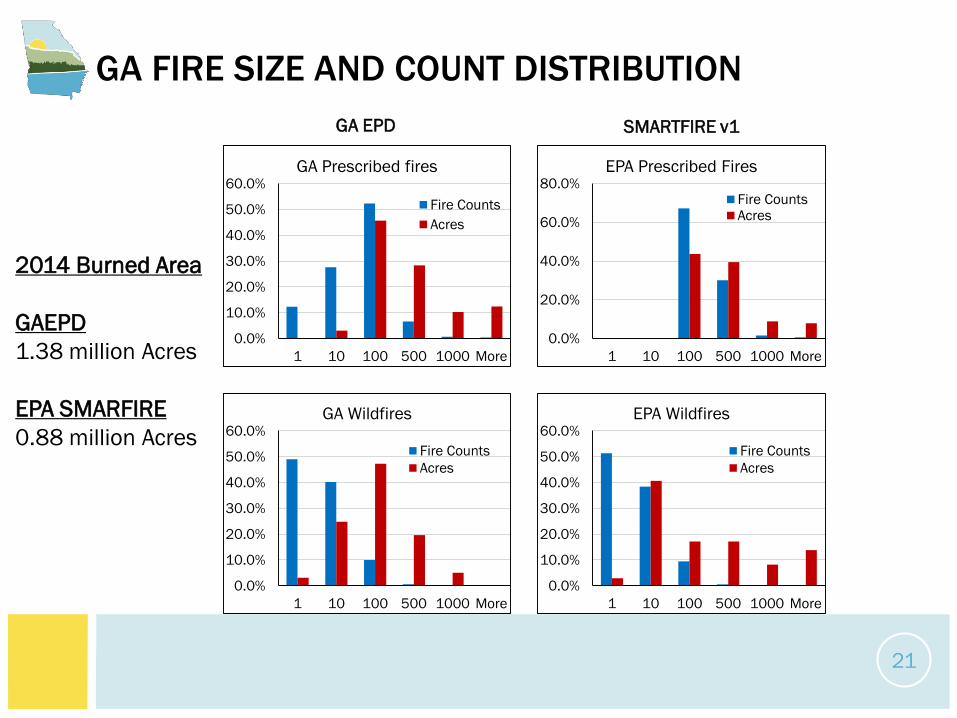
2014 Burned Area
GAEPD1.38 million Acres
EPA SMARFIRE0.88 million Acres
FIRE SIZE AND COUNTS DISTRIBUTIONSGA EPD SMARTFIRE v1
GA FIRE SIZE AND COUNT DISTRIBUTION
21
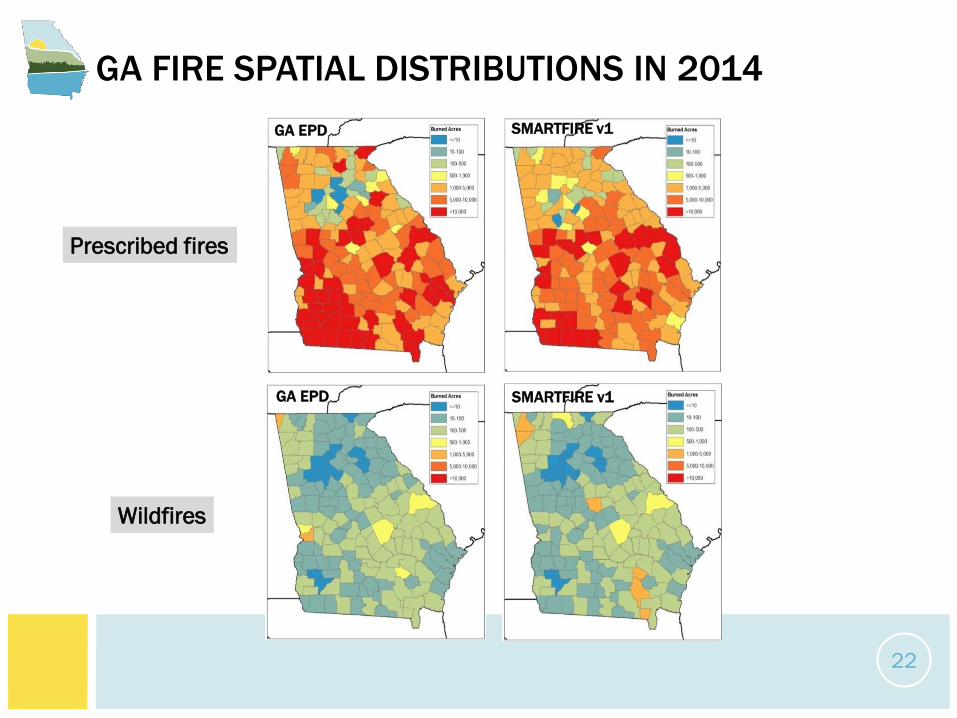
GA FIRE SPATIAL DISTRIBUTIONS IN 2014
Prescribed fires
Wildfires
SMARTFIRE v1GA EPD
SMARTFIRE v1GA EPD
Prescribed fires
22
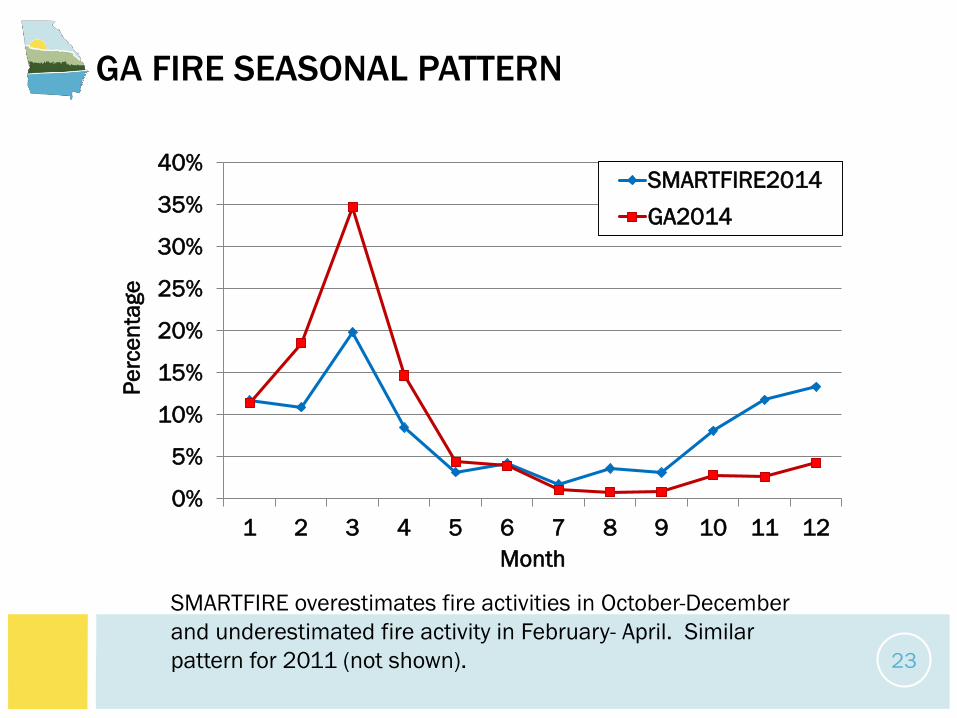
GA FIRE SEASONAL PATTERN
0%
5%
10%
15%
20%
25%
30%
35%
40%
1 2 3 4 5 6 7 8 9 10 11 12
Perc
enta
ge
Month
SMARTFIRE2014GA2014
SMARTFIRE overestimates fire activities in October-December and underestimated fire activity in February- April. Similar pattern for 2011 (not shown). 23
4. FUTURE IMPROVEMENT PLAN
24
PRESCRIBED BURN PERMIT TRACKING SYSTEM
25
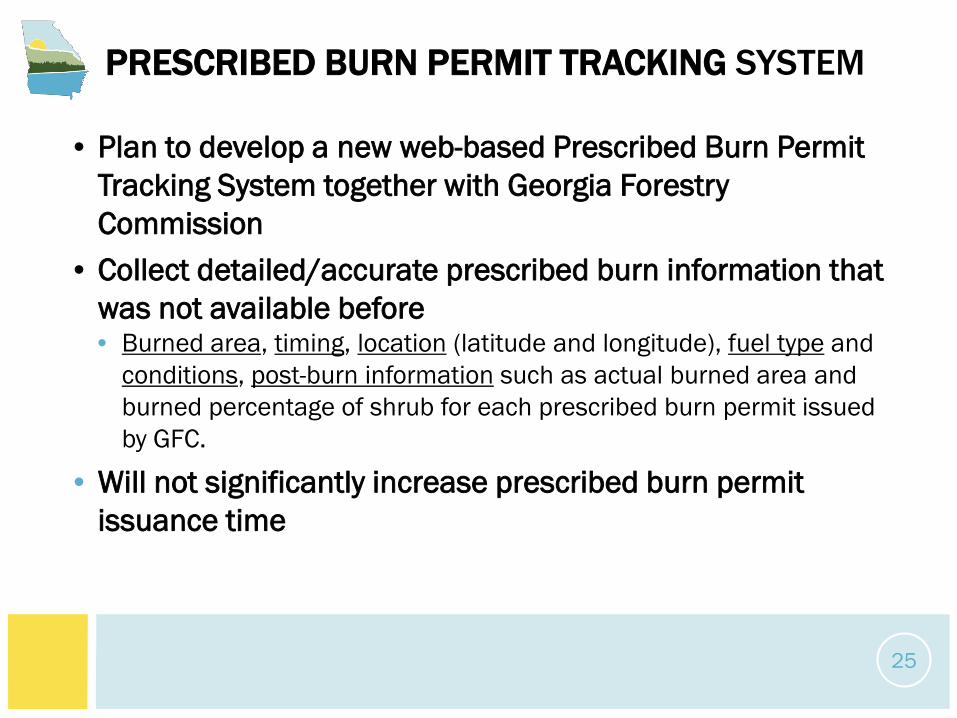
• Plan to develop a new web-based Prescribed Burn Permit Tracking System together with Georgia Forestry Commission
• Collect detailed/accurate prescribed burn information that was not available before• Burned area, timing, location (latitude and longitude), fuel type and
conditions, post-burn information such as actual burned area and burned percentage of shrub for each prescribed burn permit issued by GFC.
• Will not significantly increase prescribed burn permit issuance time
IMPROVE FUEL CONSUMPTION INFORMATION
26
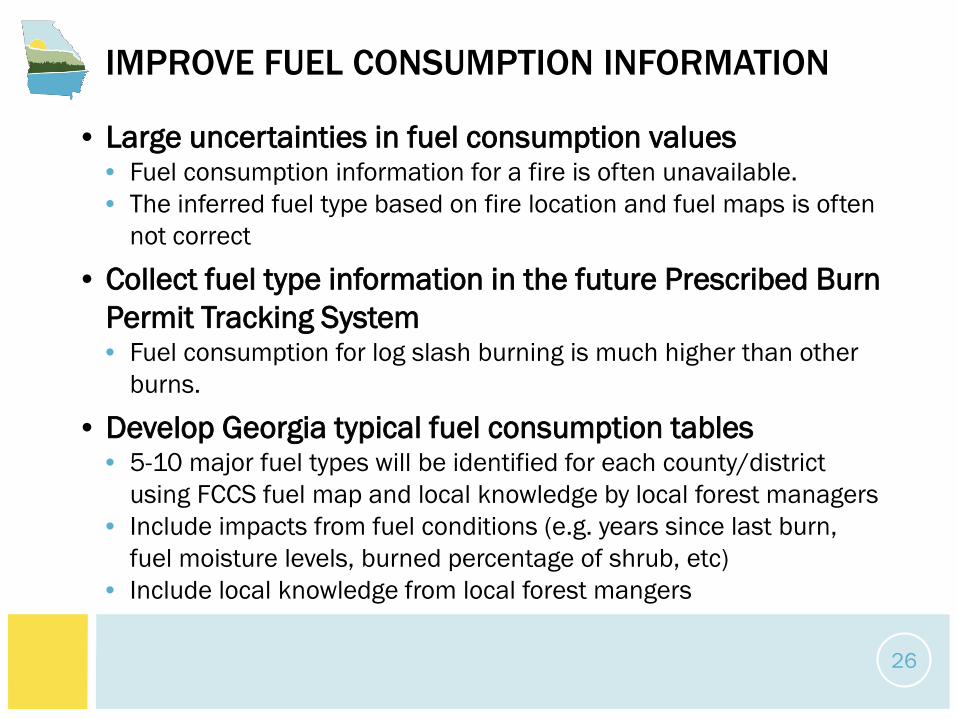
• Large uncertainties in fuel consumption values• Fuel consumption information for a fire is often unavailable.• The inferred fuel type based on fire location and fuel maps is often
not correct
• Collect fuel type information in the future Prescribed Burn Permit Tracking System• Fuel consumption for log slash burning is much higher than other
burns.
• Develop Georgia typical fuel consumption tables• 5-10 major fuel types will be identified for each county/district
using FCCS fuel map and local knowledge by local forest managers• Include impacts from fuel conditions (e.g. years since last burn,
fuel moisture levels, burned percentage of shrub, etc)• Include local knowledge from local forest mangers
SUMMARY
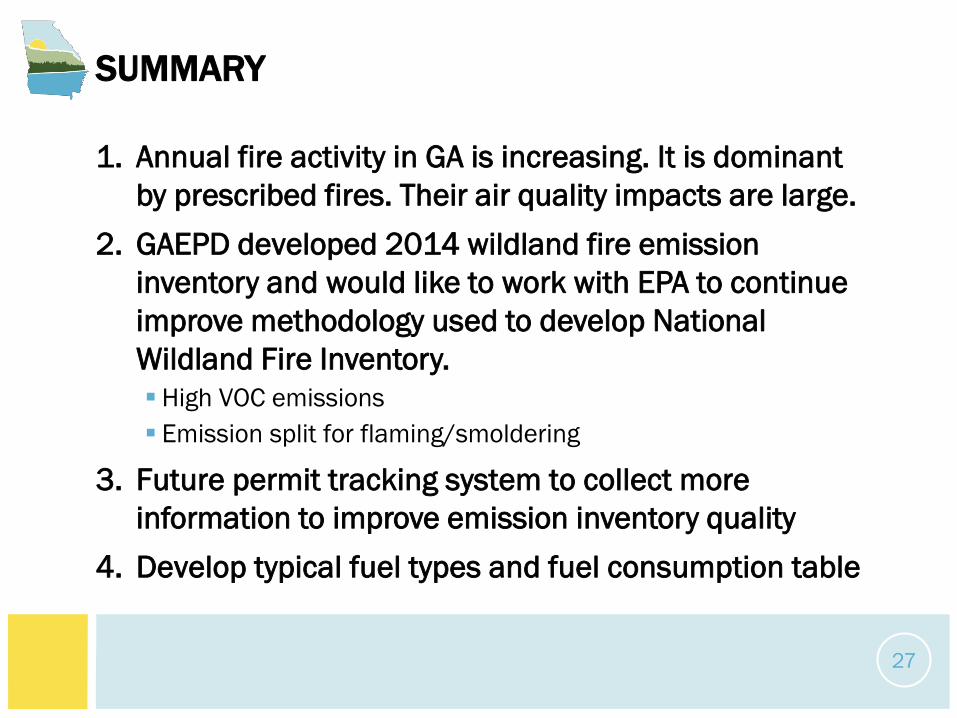
1. Annual fire activity in GA is increasing. It is dominant by prescribed fires. Their air quality impacts are large.
2. GAEPD developed 2014 wildland fire emission inventory and would like to work with EPA to continue improve methodology used to develop National Wildland Fire Inventory.High VOC emissions Emission split for flaming/smoldering
3. Future permit tracking system to collect more information to improve emission inventory quality
4. Develop typical fuel types and fuel consumption table
27

CONTACT INFORMATION
28
Tao Zeng, Ph.D.Georgia Dept. of Natural Resources
4244 International Parkway, Suite 120Atlanta, GA 30354
[email protected] 404-363-7092