Embed Size (px)
Citation preview

Development of a Binary Logistics Regression Prediction Model for First
Year Student Persistence into the Second Year using Pre- and Post-
Enrollment Variables in Private Liberal-Arts, Faith-Based, Midwest College.
Brandon J. Johnson
B.A., Buena Vista University, 2003
M.Ed., University of Saint Mary, 2009
Submitted to the Graduate Department and Faculty of the School of Education of
Baker University in partial fulfillment of the requirements for the degree of
Doctor of Education in Educational Leadership
Dennis King, Ed.D., Major Advisor
Marcus Childress, Ph.D.
Ronald Slepitza, Ph.D.
Date Defended: April 21, 2016
Copyright 2016 by Brandon J. Johnson

ii
Abstract
The purpose of the current study was to identify the best combination of pre- and
post-enrollment factors that best predict first year student persistence to their second year
of college at the same institution. Furthermore, the purpose was to determine the
successful prediction percentage for student persistence and to determine the odds ratio
for the prediction model. The population of this study was new first year undergraduate
students who enrolled at Avila University since the fall of 2009 with a sample limited to
815 students.
In this quantitative study, binary logistic regression models were developed using
archival data to address the research questions. The dependent variable was persistence
to the second year of college.
Results of the hypothesis testing found that a statistically significant correlation
was found for each hypothesis question. The model included both pre- and post-
enrollment variables, 1st term GPA and 2nd term credits earned were the two predictors
that contributed significantly to the model. The Regression Model indicated that student
were more likely to persistent to their second year of college the higher their 1st term
GPA was and the more credits earned in the 2nd term. Models of significance were also
found for pre-enrollment variables and post-enrollment variables, respectively.
Based on the findings, the researcher recommends that this study be repeated at
colleges similar and dissimilar to Avila University to determine generalizability of the
predictor model and incorporate other variables such as unmet financial need and
measures of student resilience.
iii
Dedication
This dissertation is dedicated to my late father, Harland Ray Johnson. His love for
others and life will always be a standard to which I live my life. In his remembrance, I
offer the Serenity Prayer: “God grant us the serenity to accept the things we cannot
change, to change the things we can, and the wisdom to know the difference.” Sobriety
changed his life so he then dedicated his later years to serving those who struggle with
addiction. From a user then as a substance abuse counselor, he understood first-hand the
struggles of his friends (properly known as clients). Completing college changed my life,
so today I dedicate my efforts to supporting those most likely not to succeed in college as
I was that young man who had variables stacked against my pursuit of a college degree.
This work is personal and allows me to show my dad that I appreciate all of his sacrifices
that offered me the life I lead today.
Rest in Peace, Big H. I miss you.

iv
Acknowledgements
The completion of my dissertation has been an intense ride, one that I will always
appreciate and reflect upon. Regardless, it would not have been possible without the help
of numerous people. First, I would like to thank my advisor, Dr. Dennis King, for is
patience, guidance and encouragement. Dr. King challenged me with every draft review
to push myself as a writer and researcher. Dr. Phillip Messner, the guy that re-energized
me to finish and developed my appreciation and understanding of logistical regression. I
would like to thank Dr. Marcus Childress as the second member of my dissertation
committee for the guidance and expertise he provided me throughout the process.
Finally, I would like to thank the third member of my dissertation committee, Dr. Ron
Slepitza. Dr. Slepitza has not only supported my research but has sincerely cared about
my professional development as a higher education administrator while being dedicated
and present to my family.
I am blessed to have worked alongside talented and dedicated professionals in my
career, from those who are forced to put up with me on a daily basis to those I share great
responsibility with as a leader of both the University of Saint Mary and Avila University.
I would like to personally thank Dr. Bryan LeBeau and Sr. Diane Steele for their
motivation to pursue a doctorate and Sr. Marie Joan Harris for her graceful motivation –
you three all believed in my potential and for that I am deeply grateful. To Eva Williams,
as you rest in peace know that you have impacted a life more than you ever knew.
The only reason this opportunity was possible for me is the unwavering support
and encouragement from my family. Sarah, you keep me centered on what is most
important in life, I love you. Kids, I love you both – you have brought unmatched joy to

v
my life. Mom and Blake, your unconditional love has lasted through time. Kent, MB, Jo
– and many family and friends, you have brought great joy and love to my life. I
sincerely thank you all for your support.

vi
Table of Contents
Abstract ............................................................................................................................... ii
Dedication .......................................................................................................................... iii
Acknowledgements ............................................................................................................ iv
Table of Contents ............................................................................................................... vi
List of Tables ..................................................................................................................... ix
Chapter One: Introduction ...................................................................................................1
Background ..............................................................................................................3
Statement of the Problem .........................................................................................5
Purpose Statement ....................................................................................................6
Significance of the Study .........................................................................................6
Delimitations ............................................................................................................7
Assumptions .............................................................................................................8
Research Questions ..................................................................................................8
Definition of Terms..................................................................................................9
Overview of the Methodology ..............................................................................11
Organization of the Study ......................................................................................11
Chapter Two: Review of the Literature .............................................................................13
College Completion ...............................................................................................13
Historic Review of Retention Research .. ………………………………………………. 17
Retention Research Results .............................................................................................. 25
Summary ........................................................................................................................... 30
Chapter Three: Methods ....................................................................................................32
Research Design.....................................................................................................32

vii
Population and Sample ..........................................................................................33
Sampling Procedures .............................................................................................33
Instrumentation ......................................................................................................34
Measurement ..............................................................................................35
Validity and Reliability ..............................................................................36
Data Collection Procedures ....................................................................................38
Data Analysis and Hypothesis Testing ..................................................................40
Limitations .............................................................................................................42
Summary ................................................................................................................42
Chapter Four: Results ........................................................................................................43
Descriptive Statistics ..............................................................................................43
Hypothesis Testing.................................................................................................46
Summary ................................................................................................................51
Chapter Five: Interpretation and Recommendations .........................................................53
Study Summary ......................................................................................................53
Overview of the Problem ...........................................................................53
Purpose Statement and Research Questions ..............................................54
Review of the Methodology.......................................................................55
Major Findings ...........................................................................................55
Findings Related to the Literature..........................................................................56

viii
Conclusions ........................................................................................................................57
Implications for Action ..............................................................................57
Recommendations for Future Research .....................................................58
Concluding Remarks ..................................................................................59
References ..........................................................................................................................60
Appendix (ces) ...................................................................................................................66
Appendix A. IRB Application (Baker University) ................................................66
Appendix B. IRB Approval (Baker University) ....................................................71
Appendix C. IRB Application (Avila University) .................................................73
Appendix D. IRB Approval (Avila University) .....................................................81
Appendix E. Pre-Enrollment Logistical Regression Classification .......................83
Appendix F. Post-Enrollment Logistical Regression Classification......................84
Appendix G. Pre-and Post-Enrollment Logistical Regression Classification .......85

ix
List of Tables
Table 1. Net Financial Return or Loss to Taxpayers per Degree: Lifetime-Tax Payment
Minus Taxpayer Subsidy ...................................................................................................14
Table 2. Top Ten Most Effective Retention Strategies and Tactics by Institutional
Type ...................................................................................................................................21
Table 3. National First-to-second year Retention by Institutional Type & Admission
Selectivity ..........................................................................................................................23
Table 4. Retention Rates (2010)—First-time College Freshman Returning Their Second
Year ...................................................................................................................................24
Table 5. State of Missouri First year Retention Rate Trend ..............................................25
Table 6. Persistence Rate of Conditionally Admitted, Full-time, Degree-seeking
Undergraduates from Term One to Term Two ..................................................................27
Table 7. Persistence Rate from Term One to Term Two of First year, Full-time, Degree-
seeking Undergraduates Who Took Two Developmental Courses ...................................28
Table 8. Ratio of Credit Hours Completed to Attempted of First year, Full-time, Degree-
seeking Undergraduates in First Term ...............................................................................29
Table 9. First-Time, Full-Time Student Cohort Data ........................................................33
Table 10. ACT’s College Readiness Benchmarks with Average ACT Scores ..................35
Table 11. Avila University’s Credit Hour and Grading System ........................................37
Table 12. Categorical Variable Data Coding .....................................................................40
Table 13. Continuous Variable Descriptive Statistics .......................................................44
Table 14. Continuous Post-Enrollment Variable Descriptive Statistics ............................44
Table 15. Categorical Pre-Enrollment Variable Frequency ...............................................45

x
Table 16. Categorical Post-Enrollment Variable Frequency .............................................45
Table 17. Logistic Regression Analysis Model Coefficients and Test for Pre-Enrollment
Variables ............................................................................................................................47
Table 18. Logistic Regression Analysis of Pre-Enrollment Variables Model
Summary ............................................................................................................................47
Table 19.Logistic Regression Analysis of Pre-Enrollment Variables Step 2 ....................47
Table 20. Logistic Regression Analysis Model Coefficients and Test for Post-Enrollment
Variables ............................................................................................................................49
Table 21. Logistic Regression Analysis of Post-Enrollment Variables Model
Summary ............................................................................................................................49
Table 22. Logistic Regression Analysis of Post-Enrollment Variables Step 2..................49
Table 23. Logistic Regression Analysis Model Coefficients and Test for Full
Model .................................................................................................................................51
Table 24. Logistic Regression Analysis of All Variables Model Summary ......................51
Table 25. Logistic Regression Analysis of All Variables Step 2 .......................................51

1
Chapter One
Introduction
First year college student persistence has received national attention and is a focus
at Avila University. It is evident through economic and societal advantages that earning
a bachelor’s degree has a lasting impact on the individual student, the college or
university, and all levels of society. Furthermore, college-level learning is key to
individual prosperity, to economic security, and to the enduring strength of the
democracy (Lumina Foundation, 2012). On average, a person holding a bachelor’s
degree earns nearly twice as much as someone who holds only a high school diploma,
resulting in the financial worth of obtaining a college degree equaling as much as one
million dollars more over a lifetime (Carnevale, Cheah, & Rose, 2012).
The individual financial benefit of attaining a bachelor’s degree has an effect on
cities and state government agencies and their taxpayers. According to Klor de Alva and
Schneider (2011), “On average, taxpayers subsidize bachelor’s degrees in nearly all not-
for-profit institutions at around $8,000 per degree, and in public institutions the taxpayer
investment is more than $60,000 with return to the taxpayer ranging from $17,000 to
$30,000” (p. 1). Nationally, the typical college graduate working full-time year-round
paid 134% more in federal income taxes than those who earned a high school diploma
but did not graduate from college (College Board, 2007).
In addition to the financial impact of bachelor’s degree attainment, there is
evidence of improved personal wellbeing. For example, according to the U.S.
Department of Health and Human Services (2011), “Between 2007-2010, obesity among
boys and girls 2-19 years of age decreased with increasing education of the head of

2
household” (p. 30). Also, persons with more than a high school education had the lowest
percentage of cocaine use or street drugs (Brode et al., 2007). Furthermore, individuals
who hold a bachelor’s degree are less likely to participate in social support programs, less
likely to smoke, more likely to vote, and more likely to volunteer (College Board, 2007).
Most importantly, on the average in 2006, 25-year-old men without a high school
diploma had an average life expectancy of 9.3 years fewer than others with a bachelor’s
degree or higher, and women had an expectancy of 8.6 years fewer (U.S. Department of
Health and Human Services, 2011).
Given the lasting impact on the individual student at all levels of society are
apparent; however, “college student departure poses a long-standing problem that attracts
the interest of practitioners as they manage the enrollments of their college or university”
(Braxton, Hirschy, & McClendon, 2004, p. 1). Academic difficulties, the inability to
resolve individual educational and occupational goals, and failure to become or remain
incorporated in the intellectual and social life of the institution influence student
departure (Tinto, 1993).
Student retention research has historically offered insight to various issues
attached to student persistence towards obtaining a college degree. According to Astin
(1975), “the principle deficiency of published research on college student departure is the
lack of longitudinal design and the use of only one or a limited number of institutions” (p.
3). In a contrasting way, Tinto (1993) advocates that there is benefit to a study focusing
on one institution:
While it is true that such multi-institutional studies can be quite revealing of the
aggregate patterns of departure, they are little use to either researcher or policy

3
planners concerned with the character and roots of student departure from specific
institutions. (p. 38)
Research on college student retention is offered in literature and strongly supported by
data; however, institutions exist in a particular context so detailed studies unique to an
institution might provide the most relevant data to support reducing student departure
(Hossler, 1991).
Background
To achieve a bachelor’s degree, students must successfully transition from high
school through their first year of college, which presents challenges such as an increase in
academic rigor and adapting socially to a new environment. In support of the student,
certain variables can be evaluated to predict a successful transition from high school to
college. For instance, high school academic achievement variables are strong predictors
of retention (Reason, 2003). Eighty-seven percent of students who complete four years
of math, science, and English in high school stay on track to graduate from college; those
who do not complete that coursework persists in college at a 62% rate (Adelman, 1999;
Warburton, Bugarin, & Nuñez, 2001). As a result, high school curriculum holds a strong
influence over the academic preparedness of a college-bound student. In addition, “a
student’s academic performance measured by their college grade point average (GPA) is
a major factor in college attrition” (Astin, 1975, p. 98). Therefore, it is necessary to
introduce the input of academic preparation along with other challenges that might affect
a first year college student persisting to the second year (Astin, 1993).
Avila University, a Catholic University sponsored by the Sisters of St. Joseph of
Carondelet, is a liberal arts, values-based community of learning providing professional,

4
undergraduate, and graduate education to prepare students for responsible lifelong
contributions to the global community. The mission and values of Avila University guide
the efforts of the community to provide students a college experience that prepares them
to be quality professionals and valuable members of their communities. Avila University
values excellence in teaching and learning; the Catholic identity of the university; the
sponsorship and contributions of the Sisters of St. Joseph; the worth, dignity, and
potential of each human being; diversity and its expression; commitment to the continual
growth of the whole person; and interaction with and service to others (Avila University,
2012). The deliberate caring and serving of the people without distinction is at the core
of the institution and can be felt through the academic curriculum and co-curricular
activities.
Located in Kansas City, Missouri, Avila University had a student population in
fall 2013 of 1,971 students, of which 1,401 were undergraduates. Of the total enrollment,
67% were female; 61% were white, non-Hispanic; and 28% were Catholic. Furthermore,
there were 1,124 full-time undergraduate students; 1,021 were enrolled as traditional full-
time undergraduate students with 392 residing in university residence halls (Avila
University, 2013).
The National Center for Education Statistics provides pre-enrollment data for the
fall 2011 first year cohort at Avila University. The data show that 94% of first year
students submitted ACT scores and 7% submitted SAT scores (U.S. Department of
Education, 2013). The 2009, 2010, 2011, and 2012 first year student cohorts included in
the current study have distinct measurements of persistence, GPA, and ACT composite
scores.

5
Statement of the Problem
Avila University’s inconsistent year-to-year retention rate, swaying from 75% for
the fall 2009 cohort to down to 65% for the fall 2010 cohort and then elevating up to 71%
for the fall 2013 cohort, and its focus on increasing full-time undergraduate enrollment
from 1,021 in the fall of 2013 to 1,200 in the fall of 2017 establishes that the study of
persistence is critical in the management of full-time undergraduate enrollment. The
problem is that Avila University does not understand the reasons for the inconsistent
retention rates of its first year students. Learning more about variables that that best
predict student persistence might help offer an explanation for the inconsistent results the
university is experiencing among first year students.
Scholars have shown that higher education is associated not only with
occupational attainment, but also with other outcomes of interest such as health,
happiness, sociopolitical attitudes, civic participation, cosmopolitanism, cultural taste,
and social capital (Armstrong, Arum, & Stevens, 2008). Furthermore, there is substantial
evidence to suggest individuals and society benefit from higher education. According to
Hout (2012), “Conventional wisdom—imparted by parents, teachers, guidance
counselors, and policy makers—reads these differences as evidence that young people
would improve their lives by staying in high school, graduating, going on to college, and
earning a degree” (p. 380).
A college-educated workforce is critical in the United States of America to remain
competitive in the global marketplace (Tinto, 2012). Although there are many efforts to
increase student access to college, “what matters is not simply attending college but
completing a degree, especially a four-year degree” (Tinto, 2012, p. 1). An estimated

6
50% of college students will leave higher education prior to graduation, and these high
departure rates negatively affect the stability of institutional enrollments, budgets, and the
public’s perception of the quality of colleges and universities (Braxton et al., 2004).
Additionally, the positive return on investing in education is diminished.
Purpose Statement
The purpose of the current study was to identify the best combination of pre- and
post-enrollment factors that best predict first year student persistence to their second year
of college at the same institution. Furthermore, the purpose was to determine the
successful prediction percentage for student persistence and to determine the odds ratio
for the prediction model. The pre-enrollment variables were cumulative high school
GPA, ACT composite score, number of college credits earned in high school, month of
registration, type of admission offered, and gender. The post-enrollment variables were
enrollment in a developmental math course, first-semester GPA, second-semester GPA,
number of credits attempted in the first semester, number of hours earned in the first
semester, number of credits attempted in the second semester, number of hours earned in
the second semester, and residence status.
Significance of the Study
Improved college student retention benefits a variety of constituents. This study
is significant as it will provide Avila University the retention data necessary to inform
decisions on policy and programs that are intended to improve first year student
persistence. Also, the results of this study will be used to better predict first year student
retention and adapt current recruitment and advising actions to address the findings. The
increased understanding will enhance the learning community and, in turn, provide

7
practical use by guiding the university enrollment management plan to ensure that more
students who enroll at Avila University persist to their second year of college.
Delimitations
The following delimiters are provided to offer “self-imposed boundaries set by
the researcher on the purpose and scope of the study” (Lunenburg & Irby, 2008, p. 134):
1. This study was focused on the new full-time first year cohorts who entered the
university in the fall of 2010, 2011, 2012, and 2013.
2. This study does not include new transfer students who had fewer than 24 credit
hours from previous coursework, and who are often categorized as first year
students, were excluded from this study.
3. This study was focused on pre-enrollment variables including students’
cumulative high school GPA, ACT composite score, number of college credits
earned during high school, type of admission offered, month of registration, and
gender. Other pre-enrollment variables exist that were not included in this study.
4. This study was focused on post-enrollment variables including first and second
semester GPA, credits taken and credits earned in the first and second semesters,
residential status, and enrollment in developmental math or English courses.
Other post-enrollment variables exist that were not included in this study.
5. This study was conducted at a value-based, Catholic, liberal arts university. The
results of this study potentially cannot be generalized to other post-secondary
institutions.

8
Assumptions
“Assumptions are postulates, premises, and propositions that are accepted as
operational for purposes of research” (Lunenburg & Irby, 2008, p. 135). For this study,
the following assumptions were made:
1. It was assumed that students who enrolled as first year students had full intentions
of matriculating to their second year and ultimately graduating from the
university.
2. It was assumed based on the institution’s criteria for admission that students
included in this study were believed to be capable of achieving collegiate
academic and social success in order to be retained.
3. It was assumed that high school GPAs hold common standards of achievement
within each participant’s secondary school.
4. It was assumed that the ACT/SAT tests were administrated appropriately and
consistently and that the scores were calculated and recorded accurately.
Research Questions
Three research questions were used to shape this study to align with the purpose
of identifying indicators that best predict first year student persistence to their second
year of college at the same institution. The following questions focus the research to look
at specific data and were used for this study:
RQ1. What combination of pre-enrollment variables (cumulative high school
GPA, ACT composite score, number of college credits earned in high school,
month of registration, type of admission offered, and gender) best predicts student
persistence?
9
RQ2. What combination of post-enrollment variables (enrollment in a
developmental math course, first-semester GPA, second-semester GPA, number
of credits attempted in the first semester, number of hours earned in the first
semester, number of credits attempted in the second semester, number of hours
earned in the second semester, and residence status) best predicts student
persistence?
RQ3. What combination of pre- and post-enrollment variables best predicts
student persistence?
Definition of Terms
For the purpose of clarity, the following key terms of this study are defined.
ACT composite score. An ACT composite score has a range of 1 to 36. The
composite score is the average of the four test scores (English, mathematics, reading, and
science) earned during a single test administration, rounded to the nearest whole number
(ACT, 2009).
Admission status. The admission status is determined by the Office of
Undergraduate Admission upon receiving the required application materials (Avila
University, 2012). There are two types of admission status:
Regular admission. Regular-admitted students meet minimum admission criteria
set by faculty. In general, the minimum criteria is as follows:
1. High school grade point average of 2.5 or above (4.0 scale);
recommended 16 units of college preparatory coursework as reflected in
the high school transcript; and

10
2. ACT score of 20 or above or SAT score of 930 or above (Avila
University, 2012).
Provisional admission. Provisional-admitted students may be required to
participate in a university skills training program designed to develop academic
and college organizational skills. Additionally, provisional-admitted students
may be restricted in the number of credit hours for which they may enroll in
their first semester (Avila University, 2012).
Cumulative grade point average (GPA). The cumulative GPA is obtained by
dividing the total number of grade points earned by the total number of semester hours
earned during the student’s high school career (Avila University, 2012).
First year student. A first year student is a student who has graduated high
school (or its equivalence) and is entering the first year of college without enrolling in
college courses post-high school graduation. Students must be degree-seeking (Avila
University, 2012).
Full-time student. A full-time student is enrolled in 12 to 18 undergraduate credit
hours per semester (Avila University, 2012).
Persistence. Persistence is the rate at which students who begin higher education
at a given point in time continue in higher education (Tinto, 2012).
Traditional undergraduate student. A traditional undergraduate student is
enrolled in courses primarily held during the day at Avila University (Avila University,
2012).

11
Overview of the Methodology
This was a binary logistics regression study using both categorical and continuous
numeric data gathered on first year college students enrolled full-time at a private, faith-
based, liberal arts university. The participants were from 2010, 2011, 2012, and 2013
cohorts. The data were selected by purposive means. Binary logistics regression models
were developed using archival data to address the research questions to identify the
independent variable combination that comprised the most parsimonious model for
predicting the dependent variable.
Organization of the Study
The purpose of this study was to identify indicators that best predict student
persistence to their second year of college at one particular institution. The study is
presented in five chapters. Chapter one included the introduction and rationale of the
study, background, statement of the problem, purpose statement, significance of the
study, delimitations, assumptions, research questions, definition of terms, and the
methodology overview.
Provided in chapter two is a comprehensive review of the literature on the topic of
post-secondary student retention. More specifically, a summary of practical and
theoretical findings of related retention studies is provided along with an overview of
ACT retention data. In chapter three the methodology of the study is expanded to include
a description of the research design, population and sample, sampling procedure,
instrumentation and measurement, data collection procedures, data analysis and
hypothesis testing, and limitations of the study.

12
Chapter four includes the findings of the study. In chapter five, the interpretation
and recommendations through discussion of the results tied to the literature and a
conclusion with implications for action and recommendations for future research are
described.
13
Chapter Two
Review of the Literature
College student retention from the first year to the second year continues to be an
area of focus for post-secondary institutions as that rate of persistence has been connected
with federal expectations and a national understanding of student success. As a result,
the need to study first year college student retention is important to the landscape of
colleges and universities across the United States. The purpose of this literature review
was to investigate the immense amount of research focusing on college student retention
along with recommended strategies and tactics that best support student persistence.
College Completion
According to Georgetown University Center on Education and the Workforce
(Carnevale, Cheah & Jayasundera, 2012), 60% of U.S. jobs will require some form of
post-secondary education by 2018. Accordingly, a bachelor’s degree pays a handsome
net financial reward in comparison to a high school diploma—a reward that over a
lifetime can range, on average, from a net present value in 2010 dollars of more than
$230,000, at non-/less selective secondary institutions (Klor de Alva & Schneider, 2011).
In fact, census data from the American Community Survey demonstrates that educational
attainment is by far the most important social characteristic for predicting earnings and,
specifically, individuals who attain a bachelor’s degree earn $790,000 more over a
lifetime than those who had only some college (Julian & Kominski, 2011). Furthermore,
Nexus Research and Policy Center and American Institutes for Research (Klor de Alva &
Schneider, 2011) focuses on the economic returns and costs of a bachelor’s degree.

14
On average, taxpayers subsidize bachelor’s degrees in nearly all not-for-profit
institutions at $8,000 per degree, and in public institutions, the taxpayer investment is
more than $60,000 (Klor de Alva & Schneider, 2011). Overall, taxpayers derive
substantial benefits from higher wages bachelor’s graduates earn in comparison to high
school graduate. During the first decade of work by bachelor’s graduates, the return to
the taxpayer ranges between $17,000 and $30,000 depending on the competitiveness of
the institution (Klor de Alva & Schneider, 2011). From a taxpayer’s perspective, the
return on investment is substantial regardless of the type of post-secondary institution
awarding bachelor’s degrees. Table 1 provides details on net financial return or loss to
taxpayers based on institutional type:
Table 1
Net Financial Return or Loss to Taxpayers per Degree: Lifetime-Tax Payments Minus
Taxpayer Subsidy
Barron’s
Rating
For-Profit Public Not-for-
Profit
Non/Less
Competitive
$60, 948 ($7,485) $44,143
Competitive
N/A
$4,113
$49,537
Very Competitive
N/A
$16,944
$69,988
Most Competitive
N/A
($9,278)
$88,402
Highly Competitive N/A $22,816 $84,759
Note: From “Who Wins? Who Pays? The Economic Returns and Costs of a Bachelor’s Degree” (Klor de
Alva & Schneider, 2011)

15
In addition, return on taxpayer investment per bachelor’s degree graduate is most
substantial with the not-for-profit institutions, regardless of the competitiveness of the
institution.
A bachelor’s degree not only offers economic advantages for the individual who
obtained it but also for the individual’s city and state government agencies. Furthermore,
the typical college graduate working full-time, year-round paid 134% more in federal
income taxes and almost 80% more in total federal, state, and local taxes than the typical
high school graduate (College Board, 2007). The median earnings of full-time, year-
round workers age 25 and older with a bachelor’s degree is $50,900, with $11,900 in tax
payments. Comparatively, high school graduates on average earn $31,500 with $6,600 in
tax payment (College Board, 2007). Specifically, a worker with a bachelor’s degree will
earn $1 million more than someone with a high school diploma and no college experience
(Carnevale, Cheah, & Rose, 2012). Only 14.3% of high school graduates earn more than
the median bachelor’s degree holder (Carnevale, Cheah, & Rose, 2012). Obtaining a
post-secondary credential is usually worth the effort, as evidenced by higher earnings
over a lifetime (Carnevale, Cheah, & Rose, 2012).
Another factor for consideration is the correlation of life expectancy and degree
attainment. In 2011, the U.S. Department of Health and Human Services, comparing life
expectancy by educational degree of attainment, found that the gap in life expectancy at
age 25, by education, widened between 1996 and 2006 for both men and women with a
bachelor’s degree or higher (p. 37). Moreover, children and adolescents living in
households where the head of household has a college degree are less likely to be obese
compared with those living in households where the household head has less education

16
(Carroll, Flegal, Lamb, & Ogden, 2010). Also, persons with more than a high school
education had the lowest percentage of ever used and past use of cocaine or street drugs
(Brode, Fryar, Hirsch, Porter, Kottiri, & Louis, 2007). Subsequently, The College Board
(2007) reinforced the value to the bachelor’s degree by providing facts on aspects of life,
specifically regarding health insurance, unemployment, poverty, public assistance
program usage, behaviors of smoking and exercise, voting, and volunteerism. The
following are key concepts from The College Board (2007) findings:
The proportion of college graduates receiving health insurance in 2005 was 16
percentage points higher than the percentage of high school graduates receiving
these benefits (p. 16).
Unemployment rates are much lower for college graduates than for high school
graduates and the 3.6% poverty rate in 2005 for bachelor’s degree recipients was
about one-third of the 10.8% poverty rate for high school graduates (p.18).
Individuals with higher levels of education are less likely than others to live in
households that participate in social support programs (p. 20).
Smoking rates among college graduates have been significantly lower than
smoking rates among other adults since information about the risks became public
(p. 21). In addition, individuals with higher levels of education are more likely to
engage in exercise than those with lower levels of education (p. 23).
Adults with higher levels of education are more likely than others to be open to
differing opinions and are more likely to vote (p. 27).

17
In 2006, volunteer rate was 43% among college graduates, over twice the 19% of
high school graduates. Additionally, the median number of volunteer hours
increased with educational attainment (p.25).
Earning a college degree not only contributes more to the tax base and by having a
greater ability to participate in the local economies; individuals with college degrees
place less of a burden on the social services support network and the cost associated with
it. In view of these findings, in order to achieve a bachelor’s degree, students must
navigate their first year of college academically and socially.
High school achievement variables are strong predictors of retention (Reason,
2003). Concurrently, academic variables achieved during the first year of college are
strong predictors of retention. As an estimate, 50% of college students will leave higher
education (Braxton, Hirschy & McClendon, 2004) with 75% of such students leaving
within their first two years of college (Tinto, 1987). Improving first year college student
retention provides a positive return on investment for the student, institution, and
economy. In contrast, high departure rates negatively affect the stability of institutional
enrollments, budgets, and the public’s perception of the quality of colleges and
universities (Braxton, Hirschy & McClendon, 2004).
Historical Review of Retention Research
College student persistence research dates as far back as 1938 when the U.S.
Department of Interior and the Office of Education published a study led by John
McNeely. This research focused on the reason for departure, personal characteristics,
and social engagement. William Spady (1970) provided the first widely recognized
model in retention study and in the following year published research that suggested

18
student attrition was linked to both formal and informal academic experience and social
integration.
These studies led to the emergence of Vincent Tinto’s research on student
departure. Tinto’s (1975) model of student integration, which was based in part on
Durkheim’s suicide model, suggested that student attrition was linked to both formal and
informal academic experiences as well as social integration. Tinto’s (1975) model
proposes that the degree of success students have influenced their level of commitment to
an institution, academic goals, and career goals.
Other student departure theories attempt to explain the rates of attrition from the
first year of college to students’ second year. Specifically, student departure research is
critical to the individual prospective college student, the professional enrollment
practitioner, and society. Theories from a variety of disciplines have accrued on the topic
of student departure and student success.
In particular, psychosocial theories view individual development as the
accomplishment of a series of developmental tasks (Pascarella & Terenzini, 2005, p. 20).
These theories suggest possible vectors of college student development, explained as
“major highways for journeying toward individualization—the discovery and refinement
of one’s unique way of being—and also toward communion with other individuals and
groups, including the larger national and global society” (Chickering, 1969, p.35).
A deviation from psychosocial theories and sociological perspectives offers
research on the influence the environment has on college student departure. For example,
Astin (1993) provides the I-E-O model, which makes clear temporal distinctions between
input, environmental, and outcome variables; in other words, the student input

19
characteristics are assessed prior to any exposure to the college environment, while the
college environment is assumed to intervene between input and outcome (p. 80). Related
to the input aspect of Astin’s model, the Interactionalist Theory explains that students
enter college with various unique characteristics regarding family background and
previous school experiences (Tinto, 1975). Similar to the underlying forces of Astin’s I-
E-O model, but offering more specific environmental reasons to college student
departure, Tinto (1993) argues that student departure arises out of a process of interaction
between an individual and other members of the academic and social system of an
institution.
Recent research suggests actions that have a positive impact on student success.
For instance, Swail (2004) offers the “Geometric Model of Student Persistence and
Achievement which provides a method for discussion and focus on the cognitive and
social attributes that students bring to campus; and the institutional role in the student
experience. The student is placed at the center of this model,” (p. 13). Post-secondary
administrators can use this model by proactively supporting student persistence and
achievement (Swail, 2004). To that end, the balance of cognitive, social, and institutional
factors will all influence a first year college student and the efforts to keep the balance of
those factors centered within the model.
Conversely, Tinto (2012) challenges his previously published student attrition
research by focusing on the correlation between why students leave and the reasons
college students persist. Historically, student success “research has also tended to focus
on theoretically appealing concepts that do not easily translate into definable courses of
action,” (Tinto, 2012, p. 5). Student success efforts need to move from theory to practice.

20
According to Tinto (2012), “Students are more likely to succeed in settings that establish
clear and high expectations for their success, provide academic and social support,
frequently assess and provide feedback about their performance, and actively involve
them with others on campus, especially in the classroom,” (p. 8). These general practices
provide institutions a guide to best influence student persistence. To fully utilize theory
and the research-based model focusing on student retention, practitioners use specific
strategies and tactics to prevent student departure. As provided in Table 2, Noel-Levitz,
Inc. (2012), based on their research and consulting experiences, provides the most
effective retention strategies and tactics being used in higher education to best support
student persistence:

21
Table 2
Top 10 Most Effective Retention Strategies and Tactics by Institution Type
Rank Four-Year Private Four-Year Public
1 Academic support program or
services
Honors programs for academically
advanced students
2 Programs designed specifically for
first year students
Programs designed specifically for
first year students
3 Practical work experiences provided
in students’ intended major to apply
their learning
Academic support programs or
services
4 Honors programs for academically
advanced students
Supplementary instruction
5 Tutoring Learning Communities
6 Advising by professional staff, one-
on-one
Mandatory advising by
professional staff, one-on-one
7 Mandatory advising by professional
staff, one-on-one
Practical work experiences
provided in students’ intended
major to apply their learning
8 Early-alert and intervention system Tutoring
9 Advising especially for students
approaching graduation to ensure
they are on track
Programs designed specifically for
students who are at risk
academically
10 Programs designed specifically for
students who are at risk
academically
Programs designed specifically for
international students
Note. Adapted from “2013 Student Retention and College Completion Practices Report,” by Noel-Levitz,
2013, p. 3.
The research by Noel-Levitz, Inc. (2013) further suggests “academic support
programs, honors programs, and first year student programs emerged as the top-ranked,
most effective strategies and tactics across higher education” (p. 1). Specifically,

22
improved student retention is the “result of intentional, structured, and proactive actions
and policies directed toward the success of all students” (Tinto, 2012, p. 117). Within the
most effective strategies for four-year private institutions is early alert and intervention.
With an early-alert program, both pre-enrollment and post-enrollment variables might be
used as examined in this study.
Over the past 20 years, colleges and universities, as well as foundations, state
governments and, more recently, federal governments, have invested considerable
resources in the development and implementation of a range of retention programs
(Tinto, 2012.). According to ACT, Inc. (2014), the national average first-to-second-year
retention for all types of institutions is 67.6 (p. 3). Categorized by type of post-secondary
institution, Table 3 provides details on the number of participating institutions and the
percentage rate of the data. Also presented in Table 3, ACT, Inc. provides the data on
institutional type, segmented by level of selectivity.

23
Table 3
National First-to-second Year Retention by Institutional Type & Admission Selectivity
Institutional Type All Admission
Selectivity Mean (%)
Traditional Admission
Selectivity
Mean (%)
Two-year Public 54.9 49.4
Two-year Private 64.3 69.6
Bachelor’s Public 64.2 68.7
Bachelor’s Private 69.8 65.2
Bachelor’s and Master’s
Public
68.4 69.0
Bachelor’s and Master’s
Private
73.2 69.9
Bachelor’s, Master’s, and
Doctoral Public
77.9 73.4
Bachelor’s, Master’s, and
Doctoral Private
80.9 73.5
Total (All Types) 67.6 N/A
Note. Adapted from “Condition of College & Career Readiness,” by ACT, 2014b, p. 3.
Although the data is similar, The National Center for Higher Education Management
Systems (NCHEMS) provides greater insight pulling from a national database of all post-
secondary institutions across the United States. Furthermore, NCHEMS provides data,
(presented within Table 4) by state, in close proximity to Missouri.

24
Table 4
Retention Rates (2010)—First-time College Freshman Returning Their Second Year
Area/State Total Retention
Rate (%)
Full-Time Retention
Rate (%)
Nation 54.3 60.8
Missouri 54.7 59.5
Kansas 52.6 57.9
Nebraska 59.6 64.0
Iowa 50.0 55.1
Oklahoma 50.6 55.5
Arkansas 53.0 57.1
Note. Adapted from “Retention Rates—First-Time College Freshman Returning Their Second Year,” by
NCHEMS Information Center, 2010. Retrieved from
http://www.higheredinfo.org/dbrowser/?level=nation&mode=data&state=0&submeasure=228
The comparison by state shows that there is a first year student retention rate discrepancy
within a region. As can been seen in Table 9, Avila had a retention rate of has exceeded
the nation and included states in Table 4. The student behavior and retention practices
might be similar across a region, with the retention result of college first year students
returning to school their second year varying by state. The first year college student
retention trend in Missouri is presented in Table 5.

25
Table 5
State of Missouri First year Retention Rate Trend
Area Year 2007 Year 2008 Year 2009 Year 2010
Nation 53.0 53.5 52.6 54.3
Missouri 55.0 57.2 55.7 54.7
Note. Adapted from “Retention Rates – First-Time College Freshman Returning Their Second Year,” by
NCHEMS Information Center, 2010. Retrieved from
http://www.higheredinfo.org/dbrowser/?level=nation&mode=data&state=0&submeasure=228
Comparing Missouri’s first year retention rate trend to the national trend, Missouri is
consistently achieving higher rates. As the national rate improved in 2010, it was
comparable to Missouri’s rate. Avila University consistently has had a higher retention
rate than both the national and state of Missouri average.
National, regional, and state of Missouri retention data provide the framework to
understand the importance of this research. Moving from data to research provides the
background and theoretical approaches used to improve retention rates.
Retention Research Results
Pre-Enrollment Variables.
Prior to a student’s first year in college, variables are available to predict a
student’s academic success in college. Research on pre-enrollment variables will be
provided in this section.
A students past academic record and ability is the greatest predictor of college
student persistence through college (Astin, 1975). As high school grades decrease, the
chance of students being successful in college also decreases (Astin, 1975). Although
there is a variety of ways to look at academic record and ability, “hundreds of studies

26
using various measurements and methodologies have yielded strikingly similar results:
college grade point average can be predicted with modest accuracy (multiple correlation
around .55) from admission information. The two most potent predictors are the student’s
high school GPA and scores on a college admissions tests” (Astin, 1993, p. 187). One of
the major college admission tests is ACT.
Further, 28% of ACT-tested high school graduates met none of the ACT College
Readiness Benchmarks which comprise of English composition, college algebra, social
sciences and biology, compared to 25% who met all four (ACT, 2011b). These
benchmarks are the minimum ACT test scores required for a student to have a high
probability of success in first year, credit-bearing college courses (ACT, 2007, p. 24).
A second variable to consider is the type of admission a student is offered upon
entering a post-secondary institution. Although criteria are not consistent across colleges
and universities, generally schools place conditions on students who fall below the
typical standards of regular admission. Astin (1975) suggests that "perhaps most
important in terms of setting admissions policy is the finding that the ability to predict
dropping out is still extremely limited” and that when “considering changes in admission
policy, institutions should keep in mind that a number of environmental circumstances
can also influence attrition rates" (p. 51). Table 6 provides detailed persistent rates of
full-time students who were conditionally admitted to the institution.

27
Table 6
Persistence Rate of Conditionally Admitted, Full-time, Degree-seeking Undergraduates
from Term One to Term Two
All Four-year
Private
Participating
Institutions (%)
Four-year Private
Institutions with
Lower Selectivity
(%)
Four-year Private
Participating
Institutions with
Higher
Selectivity (%)
25th percentile 75.0 66.0 76.5
Medium 84.0 81.0 84.5
75th percentile 88.5 89.0 88.0
Note. Adapted from “2015 Student Retention Indicators Benchmark Report,” by Noel-Levitz, Inc., 2015, p. 4.
This information suggests that admitting selectivity of the institution influences the
persistence rate of students who were admitted conditionally.
Research on college student gender has various results in terms of its influence on
academic performance and persistence (Astin, 1975; Tinto, 1987; Reason, 2003). In
particular, males tend to have a lower grade point average and a greater probability of
academic warning (DeBerard, M., Spielmans, G., & Julka, D., 2004). This factor might
explain why more women than men who enter higher education eventually graduate from
college. Nonetheless, gender as a variable provides gender characteristic information that
is useful in student success research.

28
Post-Enrollment Variables.
Once students begin their first year of college coursework, variables become
available to evaluate. Research on post-enrollment variables will be provided in this
section.
One variable includes Students who graduate from high school but are
underprepared for college course work. One of the consequences of students entering
college underprepared is that the student is required to take remedial courses. According
to The College Board (2011), “As of 2008, 37.6% of first and second-year
undergraduates in the United States are in remedial courses after high school graduation”
(p.119). Table 7 provides the implication on student persistence when students are
enrolled in remedial coursework showing that students who take two developmental
courses had a medium persistence rate of 20%, meaning 2 out of 10 students persisted
from term one to term two.
Table 7
Persistence Rate from Term One to Term Two of First year, Full-time, Degree-seeking
Undergraduates Who Took Two Developmental Courses
All Four-year
Private
Participating
Institutions (%)
Four-year Private
Institutions with
Lower Selectivity
(%)
Four-year Private
Participating
Institutions with
Higher Selectivity
(%)
25th percentile 7.3 7.5 7.5
Medium 20.0 19.0 20.5
75th percentile 33.8 41.0 28.8
Note. Adapted from “2015 Student Retention Indicators Benchmark Report,” by Noel-Levitz, Inc., 2015, p.
7.

29
Other academic variables, such as grade point average and course completion are
strong indicators of first year success and likely to influence decisions to return for the
sophomore year. Considering both remedial and non-remedial coursework, the student’s
grade point average provides unique insight to predicting persistence as “academic
performance is a major factor in college attrition for both men and women" (Astin, A.,
1975, p. 98.). In addition to and reflected in the grade point average, the course
completion should be evaluated to predict student persistence. Table 8 provides the ratio
of courses completed by first year students for four-year private institutions based on the
level of selectivity.
Table 8
Ratio of Credit Hours Completed to Attempted of First year, Full-time, Degree-seeking
Undergraduates in First Term.
All Four-year
Private
Participating
Institutions (%)
Four-year Private
Institutions with
Lower Selectivity
(%)
Four-year Private
Participating
Institutions with
Higher
Selectivity (%)
25th percentile 90.0 86.0 92.0
Medium 93.0 92.0 94.0
75th percentile 95.0 94.0 96.0
Note. Adapted from “2015 Student Retention Indicators Benchmark Report,” by Noel-Levitz, Inc., 2015, p.
10.
The majority of courses taken by first year, full-time undergraduate students are
completed based on the ratio figures.

30
Finally, identifying where students reside during college influences their
persistence rate. Students residing in university provided residence halls have a higher
level of co-curricular involvement that takes place outside of the classroom (Astin, 1977;
Chickering, 1975). Furthermore, residential students are retained at a greater rate than
students who do not reside on campus (Astin, 1977; Tinto, 1993). In addition, the
satisfaction of commuter students regarding the institution’s academic climate and their
beliefs on whether or not people who go to college are better prepared for life are both
significant indicators of student persistence (Johnson, J., 1997).
Summary
Research has conveyed theoretical approaches and analytical data to explain the
student departure phenomenon. The breadth and depth of published research fluctuate by
variables; however, the research on predicting student departure is plentiful and ongoing.
Chapter Summary
This chapter showed breadth and depth of college student persistence research
published over time. Astin (1975) argued that the principle deficiency of published
research is the lack of longitudinal design and the use of only one or a limited number of
institutions (p. 3). In contrast, Tinto (1993) disagrees, stating that “while it is true that
such multi-institutional studies can be quite revealing of the aggregate patterns of
departure, they are little use to either the researcher or policy planners concerned with the
character and roots of student departure from specific institutions (p. 38). There
continues to be a focus on this subject matter in research and practice. Chapter Three
presents the current study’s research design, population, sample, sampling procedure, and

31
data collection procedures. In addition, Chapter Three presents data analysis, hypothesis
testing, and limitation of this study.

32
Chapter Three
Methods
This study was focused on pre- and post-enrollment variables that may predict
persistence to first year students’ second year of college. Specific student data were
collected to be analyzed and interpreted pertaining to student persistence. The research
design section contains information on the variables used in the study by assigning them
to two groups: pre-enrollment variables and post-enrollment variables. The population,
sample, and sampling procedure are described. Within the instrumentation section, the
measurement, validity, and reliability of the ACT assessment and GPA are described. An
explanation of the process used to collect the data, the data analysis and hypothesis
testing, as well as limitations to the study, are provided.
Research Design
The regression model predicts a categorical dependent variable from a set of
predictor independent variables (Fidell & Tabachnick, 2007). The dependent variable
was persistence to the second year of college. The pre-enrollment independent variables
were cumulative high school GPA (on a 4.0 scale), ACT composite score, number of
college credits earned in high school, month of registration, type of admission offered
(regular, provisional, or restricted provisional), and gender. The post-enrollment
independent variables were enrollment in a developmental math course, first-semester
GPA, second-semester GPA, number of credit hours attempted in the first semester,
number of credit hours attempted in the second semester, number of credit hours earned
in the first semester, number of credit hours earned in the second semester, and
residential status (on-campus or off-campus).

33
Population and Sample
The population of this study was new first year undergraduate students who
enrolled at Avila University since the fall of 2009. The sample selected was comprised
of five first-time, full-time student cohorts who were entering their fall semester of
college from 2009 until 2013. Table 9 contains a general profile of the first year cohorts
included in this study.
Table 9
First-Time, Full-Time Student Cohort Data
Characteristic Fall 2009 Fall 2010 Fall 2011 Fall 2012 Fall 2013
Total Cohort 118 167 138 210 182
Mean ACT* 22.62 22.57 22.20 22.70 21.95
Mean GPA 3.35 3.26 3.24 3.29 3.23
Fall-to-
Spring
Retention %
92 89 92 88 89
Fall-to-Fall
Retention %
75 65 66 70 71
* ACT Composite Score.
The sample included 815 first year college students enrolled full-time at Avila
University.
Sampling Procedures
Students were selected for this study by purposive means, as they were chosen
based on their enrollment status at Avila University. Purposive sampling involves
selecting a sample centered on characteristics of people in the sample (Jones & Kottler,

34
2006; Lunenburg & Irby, 2008). All students (n = 815) who enrolled full-time as first
year students at Avila University were included in this study; however, 97.2% (n = 792)
were used in data set for analysis.
Instrumentation
ACT is one measurement used in the study. The ACT test is used to measure how
well a student is academically prepared to handle college-level academic rigor (ACT,
Inc., 2007). The best way to predict success in college is to measure as directly as
possible the degree to which each student has developed the academic skills and
knowledge that are important for success in college (ACT, Inc., 2007). Accordingly,
Avila University requires their first year applicants to submit their official ACT or SAT
scores, with a majority submitting ACT, which contains four multiple-choice tests
(English, mathematics, reading, and science) and an optional writing test, which are all
designed to measure skills that are most important for success in post-secondary
education and which are acquired in secondary education (ACT, Inc., 2007).
The average ACT composite score has remained nearly constant between 2007
and 2011 (ACT, Inc., 2011b). Specifically, in terms of sub-scores, English represents the
lowest average score with reading dropping at the most dramatic rate over the 5-year time
period while math has improved from 21.0 to 21.1 between 2007 and 2011 (ACT, Inc.,
2011b). Considering ACT’s College Readiness Benchmarks, the numbers are not
supportive of quality academic preparation to ensure college readiness and, in time,
student success. Table 10 contains details on ACT’s college readiness benchmarks by
college course.

35
Table 10
ACT’s College Readiness Benchmarks with Average ACT Scores
College Course Subject Area Test ACT Benchmark Average ACT Scores
English Composition English 18 20.6
Social Sciences Reading 21 21.3
College Algebra Mathematics 22 21.1
Biology Science 24 20.9
Note. Adapted from “Condition of College & Career Readiness,” by ACT, 2011b, p. 16.
A curriculum-based test, ACT measures what students are able to do with what
they have learned in school, not abstract qualities such as intelligence or aptitude (ACT,
Inc., 2007, p. 1). Furthermore, the majority of the test exercises focus on complex
problem-solving and only a few for narrow skills (ACT, Inc., 2007). Numerous times, a
student may take the ACT at one of the physical locations and on the dates approved by
ACT, Incorporated.
Measurement. The ACT functions as a stand-alone program typically taken
when a student is in eleventh or twelfth grade and measures a student’s academic
readiness for college in key content areas:
For each of the four multiple-choice tests (English, mathematics, reading, and
science), the raw score (number of correct responses) are converted to scale
scores from 1 to 36. The Composite score is the average of the four scale scores
rounded to the nearest whole number (fractions of 0.5 or greater round up).
(ACT, Inc., 2007, p. 16)

36
Validity and reliability. According to Lunenburg and Irby (2008), “Validity is
the degree to which an instrument measures what it purports to measure” (p. 181) and
“reliability is the degree to which an instrument consistently measures whatever it is
measuring” (p. 182). Many institutions use the ACT data to determine academic
preparedness for college; therefore, consistencies of these scores are important as
institutions make a determination of acceptance. To ensure consistency, there is an
ongoing assessment of the content of the ACT test during the development process to
ensure the test is measuring what it should be measuring, with each item being examined
at a minimum of 16 times (ACT, Inc., 2007). Furthermore, “detailed test specifications
have been developed to ensure that the test content is representative of the current high
school and university curricula” (ACT, Inc., 2007, p. 74). Reliability coefficients are
estimates of test score’s consistency that range from zero to one with values near one
indicating greater consistency. In 2005-2006 school years, approximately 2,000 ACT
test-takers offered a reliability coefficient medium score of .77, with a minimum of .76
and maximum of .78. To ensure consistency of the ACT test:
Care is taken to ensure that the basic structure of the ACT tests remains the same
from year to year so that the scale scores are comparable, the specific
characteristics of the test items are used in each specification category are
reviewed regularly. (ACT, Inc., 2007, p. 7)
GPA
GPA is also a measurement used in this study. Each participant’s final high
school GPA was included in this data set for this study and serves as a measure of

37
academic performance assessment. Additionally, participants’ college GPAs were
included for the first and second semester of college.
Non-weighted cumulative GPA is the average of all final course grades received
in secondary school level courses based on a 4.0 scale. A non-weighted grade point
average is calculated by multiplying the final course grade with the credit awarded
divided by the total credits. To calculate GPA, the total number of grade points is
divided by the total number of semester hours (Avila University, 2014). Table 11
contains the details on the points associated with each earned grade.
Table 11
Avila University’s Credit Hour and Grading System
Grades Meaning Points per Credit Hour
A Superior 4
B Above Average 3
C Average 2
D Below Average 1
F Failing 0
Note. Adapted from “2014-15 Undergraduate Academic Catalog,” by Avila University, 2014, p. 37.
For high school GPA, Avila University requires that all official transcripts be sent
directly to the Office of Undergraduate Admission from a professional staff member of
the secondary school, preferably the college counselor (Avila University, 2014). The
credit hour and grading system are under the authority of each secondary school,
however, Avila University converts the secondary school GPA using this scale presented
in Table 11.

38
Through a variety of means, including but not limited to surveys, standardized
examinations, and in-class assessments, Avila University is committed to a
multidimensional, ongoing process of assessment to evaluate the performance of the
academic achievement of the students (Avila University, 2014). Specifically, the
assessment information is used “to determine student achievement, to evaluate the
effectiveness of the curriculum, to guide the revision of programs, courses and
instruction, and to serve as a catalyst to aid students in self-evaluation and goal setting”
(Avila University, 2014, p. 45). At the same time, students have the right to appeal course
grades through the established procedure as outlined in the 2014-15 Undergraduate
Academic Catalog (Avila University, 2014).
All official academic records are maintained in the Registration and Student
Records Office, as Avila University is in compliance with the 1974 Family Education
Rights and Privacy Act, which “provides for the right to inspect and review educational
records, to seek to amend those records, and to limit disclosure or information from the
records” (Avila University, 2014, p. 38).
Data Collection Procedures
The first step of data collection was to receive approvals from Baker University’s
Institutional Review Board and Avila University’s Institutional Review Board.
Therefore, an Institutional Review Board (IRB) request was submitted to Baker
University on September 16, 2015 (Appendix A), and on September 23, 2015, the Baker
University IRB committee approved the study (Appendix B).
Likewise, an Institutional Review Board request was submitted to Avila
University on October 22, 2015 (Appendix C), and on October 26, 2015, the Avila

39
University IRB committee approved the research study (Appendix D). Once permission
was granted by the IRBs of Baker University and Avila University, data from Avila
University’s Student Information System (Jenzabar EX) were extracted by Avila
University’s Information Management Coordinator using the reporting tool Sybase®
Infomaker®, which was then imported into IBM® SPSS® Statistics Faculty Pack 23 for
Windows.
The continuous archival variables included in the dataset were,
1) cumulative high school grade point average (0.0 to 4.0),
2) ACT composite score (0 to 36),
3) number of college credits earned in high school (numeric credits),
4) first-semester of college grade point average (0.0 to 4.0),
5) second-semester of college grade point average (0.0 to 4.0),
6) number of credit hours attempted first semester of college (numeric credits),
7) number of credit hours attempted second-semester of college (numeric credits),
8) number of credit hours earned first-semester of college (numeric credits),
9) number of credit hours earned second-semester of college (numeric credits).
The remaining variables were nominal and are shown in Table 12 with the code
associated with each categorical variable.

40
Table 12
Categorical Variable Data Coding
Variable Nominal Data Code
Male 1
Female 2
Resident 1
Commuter 2
Regular Admission 1
Provisional Admission 2
Provisional Restricted Admission 3
Month of Enrollment: January 1
Month of Enrollment: April 4
Month of Enrollment: May 5
Month of Enrollment: June 6
Month of Enrollment: July 7
Month of Enrollment: August 8
Development (DV) Math 1st Year No 0
Developmental (DV) Math 1st Year Yes 1
Returned Fall (Second Year): No 0
Returned Fall (Second Year): Yes 1
Data Analysis and Hypothesis Testing
The study was conducted to examine the following research questions to
determine which combination of variables best predicts first year students’ persistence to
the second year. The research questions provided the basis for the data analysis.
RQ1. What combination of pre-enrollment variables (cumulative high school
GPA, ACT composite score, number of college credits earned in high school,
month of registration, type of admission offered, and gender) best predicts student
persistence?

41
H1. A significant prediction model will be found using the pre-enrollment
independent variables.
RQ2. What combination of post-enrollment variables (enrollment in a
developmental math course, first-semester GPA, second-semester GPA, number
of credits attempted in the first semester, number of hours earned in the first
semester, number of credits attempted in the second semester, number of hours
earned in the second semester, and residence status) best predicts student
persistence?
H2. A significant prediction model will be found using the post-enrollment
independent variables.
RQ3. What combination of pre- and post-enrollment variables best predicts
student persistence?
H3. A significant prediction model will be found using the pre- and post-
enrollment independent variables.
Binary logistics regression models were used to address each of the research
questions. Logistic regression predicts the probability that an observation falls into one
of two categories of a dichotomous dependent variable based on one or more variables
that can be either continuous or categorical. Each categorical variable was dummy-coded
before use in the data analysis. Testing the full model and then only the pre- and post-
enrollment models to determine if a significant prediction model is present. To determine
the odds of student persistence, the logistical regression equation can be used were as
logit(p) = β0 + β1*X1 with one predictor or logit(p) = β0 + (β1*X1) + (β2*X2) + (β...*X...)
with two or more interaction predictors. The cut values for all models were 0.05.

42
Limitations
The results of the study will be interpreted with caution because of the following
limitations. Participants in this study enrolled at Avila University after attending a
variety of secondary schools which each have their own course grading scale,
assessments, and strategies on how to calculate grade point average. Secondary schools
also do not execute a common curriculum or remedial coursework. Additionally, the
participants have diverse backgrounds in terms of where they were raised, gender, social-
economic status, and ethnicity.
Summary
Provided in this chapter is a comprehensive description of the methodology and
procedures used to address the research questions. The participants of this study enrolled
in one specific institution, full-time, for their first year of college. The hypotheses were
organized under the appropriate research questions. The data collection procedure and
analysis method details have been provided. Provided in chapter four are the results of
the hypothesis testing.

43
Chapter 4
Results
The purpose of this study was to identify a logistical regression model to predict
first year college student persistence to their second year using pre- and post-enrollment
variables. The study examined five years of data for first-time first year students enrolled
full-time at Avila University. The study analyzed various independent variables to best
predict their influence on the nominal dependent variable, student persistence. This
chapter restates each research question (RQ), the hypothesis tested to address it, the
statistical analyzes conducted to address each research question and the results of the
hypotheses testing.
Descriptive Statistics
The sample of this research study consisted of 792 first-time first year students
from the fall cohort classes of 2010 -2011, 2011-2012, 2012-2013, and 2013-2014 at
Avila University. The following tables provide descriptive statistics on the continuous
and categorical independent variables along with the dependent variable (Returned Fall).
Table 13 provides the descriptive statistics for the continuous independent pre-enrollment
variables used in the model showing that on average each student transferred in 4.51
college credits and earned a 3.30 GPA in high school.

44
Table 13
Continuous Variable Descriptive Statistics
N Minimum Maximum Mean
Std.
Deviation
Transfer Hours 792 0.00 60.00 4.51 .287
ACT 792 10.00 34.00 22.69 .131
HS GPA 792 2.03 4.00 3.30 .017
Table 14 provides the descriptive statistics for the continuous post-enrollment variable
used in the model showing that students were consistent in 1st Term and 2nd Term earning
at 2.95 mean GPA. Additionally, in both terms student average earned credits were less
than average attempted credit again showing consistency across terms.
Table 14
Continuous Post-Enrollment Variable Descriptive Statistics
N Minimum Maximum Mean
Std.
Deviation
1st Term Attempt 792 0 22 14.21 .069
1st Term Earned 792 0 22 13.35 .119
1st Term GPA 792 0.00 4.00 2.95 .035
2nd Term Attempt 707 1 21 14.89 .080
2nd Term Earned 707 0 21 14.06 .137
2nd Term GPA 707 0.00 4.00 2.95 .035
Table 15 provides the descriptive statistics of the categorical pre-enrollment variables
used in the model. The table shows the frequency of the variable within the model and
the percent of the frequency in relation to the total number within the category. As
shown in Table 15, the majority (a combined 90.4%) of first year students enrolled in the
months of April, May and June.

45
Table 15
Categorical Pre-Enrollment Variable Frequency
Frequency Percent
Male 309 39.0
Female 483 61.0
Regular Admission 589 74.4
Provisional Admission 108 13.6
Provisional Restricted Admission 95 12.0
Month of Enrollment: January 3 0.4
Month of Enrollment: April 294 37.1
Month of Enrollment: May 284 35.9
Month of Enrollment: June 138 17.4
Month of Enrollment: July 45 5.7
Month of Enrollment: August 28 3.5
Table 16 provides the descriptive statistics of the categorical post-enrollment variables
used in the model. The table shows the frequency of the variable within the model and
the percent of the frequency in relation to the total number within the category. As
shown in Table 16, less than one-third (27.8%) took developmental math in their first
year and only 28.2% did not return to Avila University for their second year of college.
Table 16
Categorical Post-Enrollment Variable Frequency
Frequency Percent
Resident 465 58.7
Commuter 327 41.3
Development (DV) Math 1st Year No 572 72.2
Developmental (DV) Math 1st Year Yes 220 27.8
Returned Fall (Second Year): No 223 28.2
Returned Fall (Second Year): Yes 569 71.8

46
Hypothesis Testing
RQ1. What combination of pre-enrollment variables (cumulative high school
GPA, ACT composite score, number of college credits earned in high school,
month of registration, type of admission offered, and gender) best predicts student
persistence?
H1. A significant prediction model will be found using the pre-enrollment
independent variables.
The hypothesis was accepted, as a significant logistics regression model was
found. Two predictors (transfer hours and high school GPA) are positively
correlated with the dependent variable (student persistence) and both contributed
significantly to the model. Shown in Table 18 persistence is best predicted by two
variables, transfer hours (b .074, Wald X2(1) =16.918, p < .000), and high school
GPA (b =.699, Wald X2(1) =14.395, p < .000). The odds of persistence increase
1.077 times each increase of 1 hour earned credit prior to enrollment, compared to
2.012 times for each increase of 1-point increase to high school GPA. The odds of
persistence for this Logistic Regression model is equal to -.570 + (.074*Transfer
Hours) + (.699*High School GPA) +/- E. Nagelkerke’s R2 of .110 indicated a
weak relationship between prediction and grouping accounting for about 11% of
the variance in the model. Prediction success for overall was 71.8% (Appendix
F). These significant results suggest that 1) transfer hours and 2) high school GPA
are the best predictors.

47
Table 17
Logistic Regression Analysis Model Coefficients and Test for Pre-Enrollment Variables
Predictor Wald’s X2 df Sig.
Step 1 Step .074 1 .000
Block .699 1 .000
Model -1.570 1 .000
Step 2 Step 1 .000
Block 2 .000
Model 2 .000
Hosmer and Lemeshow Test X2
Step 1 5.613 8 .690
Step 2 7.593 8 .474
Table 18
Logistic Regression Analysis of Pre-Enrollment Variables Model Summary
Step -2 Log likelihood Cox & Snell R2 Nagelkerke R2
1 900.911a .050 .072
2 878.761b .076 .110
a. Estimation terminated at iteration number 5 because parameter estimates changed by less than
.001.
b. Estimation terminated at iteration number 5 because parameter estimates changed by less than.
.001.
Table 19
Logistic Regression Analysis of Pre-Enrollment Variables Step 2
Predictor B SE B Wald’s X2 df sig. Exp(B)
Transfer Hours .074 .018 16.918 1 .000 1.077
High School GPA .699 .184 14.395 1 .000 2.012
Constant -1.570 .581 7.311 1 .000 .208
RQ2. What combination of post-enrollment variables (enrollment in a
developmental math course, first-semester GPA, second-semester GPA, number
of credits attempted in the first semester, number of hours earned in the first

48
semester, number of credits attempted in the second semester, number of hours
earned in the second semester, and residence status) best predicts student
persistence?
H2. A significant prediction model will be found using the post-enrollment
independent variables.
The hypothesis was accepted, as significant logistics regression model was found.
Two predictors (1st Term GPA and 2nd Term Earned Credit) are positively correlated with
the dependent variable (student persistence) and both contributed significantly to the
model. Persistence is best predicted by two variables, 1st Term GPA (b .625, Wald x2(1)
=18.183, p < .000), and 2nd Term Earned Credits (b =.180, Wald x2(1) = 32.593, p <
.000). The odds of persistence increase 1.868 times each increase of 1 point higher GPA
is the 1st term, compared to 1.197 times for each increase of credit hour earned 2nd term.
The odds of persistence for this Logistic Regression model is equal to -2.877 + (.625*1st
Term GPA) + (.180*2nd Term Earned Credit) +/- E. Nagelkerke’s R2 of .242 indicated a
moderate to weak relationship between prediction and grouping accounting for about
24.2% of the variance in the model. Prediction success for overall was 79.9% (Appendix
G). These significant results suggest that 1st Term GPA and 2nd Term Earned Credits are
the best predictors.

49
Table 20
Logistic Regression Analysis Model Coefficients and Test for Post-Enrollment Variables
Predictor Wald’s X2 df Sig.
Step 1 Step 99.189 1 .000
Block 99.189 1 .000
Model 99.189 1 .000
Step 2 Step 18.218 1 .000
Block 117.407 2 .000
Model 117.407 2 .000
Hosmer and Lemeshow Test X2
Step 1 8.239 6 .221
Step 2 7.631 8 .470
Table 21
Logistic Regression Analysis of Post-Enrollment Variables Model Summary
Step -2 Log likelihood Cox & Snell R2 Nagelkerke R2
1 610.041a .131 .207
2 591.822a .153 .242
a. Estimation terminated at iteration number 5 because parameter estimates changed by less than
.001.
Table 22
Logistic Regression Analysis of Post-Enrollment Variables Step 2
Predictor B SE Wald’s X2 df Sig. Exp(B)
1st Term GPA .625 .147 18.183 1 .000 1.868
2nd Term Earned Cr. .180 .032 32.593 1 .000 1.197
Constant -2.877 .454 40.196 1 .000 .056
50
RQ3. What combination of pre- and post-enrollment variables best predicts
student persistence?
H3. A significant prediction model will be found using the pre- and post-
enrollment independent variables.
The hypothesis was accepted, as significant logistics regression model was found.
Two predictors (1st Term GPA and 2nd Term Earned Credit) are positively correlated with
the dependent variable (student persistence) and both contributed significantly to the
model. Shown in Table 25, persistence is best predicted by two variables, 1st Term GPA
(b .625, Wald X2(1) =18.183, p < .000), and 2nd Term Earned Credits (b =.180, Wald
x2(1) = 32.593, p < .000). The odds of persistence increase 1.868 times each increase of
1 point higher GPA is the 1st term, compared to 1.197 times for each increase of credit
hour earned 2nd term. The odds of persistence for this Logistic Regression model is equal
to -2.877 + (.625*1st Term GPA) + (.180*2nd Term Earned Credit) +/- E. Shown in Table
24, Nagelkerke’s R2 of .242 indicated a moderate to weak relationship between prediction
and grouping accounting for about 24.2% of the variance in the model. Prediction success
for overall was 79.9% (Appendix H). These significant results suggest that 1st Term GPA
and 2nd Term Earned Credits are the best predictors.

51
Table 23
Logistic Regression Analysis Model Coefficients and Test for Full Model
Predictor Wald’s X2 df Sig.
Step 1 Step 99.189 1 .000
Block 99.189 1 .000
Model 99.189 1 .000
Step 2 Step 18.218 1 .000
Block 117.407 2 .000
Model 117.407 2 .000
Hosmer and Lemeshow Test X2
Step 1 8.239 6 .221
Step 2 7.631 8 .470
Table 24
Logistic Regression Analysis of All Variables Model Summary
Step -2 Log likelihood Cox & Snell R2 Nagelkerke R2
1 610.041a .131 .207
2 591.822a .153 .242
a. Estimation termination at iteration number 5 because parameter estimated changed by less than
.001.
Table 25
Logistic Regression Analysis of All Variables Step 2
Predictor B SE Wald’s X2 df sig. Exp(B)
1st Term GPA .625 .147 18.183 1 .000 1.868
2nd Term Earned Cr. .180 .032 32.593 1 .000 1.197
Constant -2.877 .454 40.196 1 .000 .056
Summary
The purpose of chapter four was to present the results of this study. It provided
clarification on the descriptive statistics regarding the sample and each variable included.
Furthermore, the descriptive statistics for each variable were provided based on the type

52
of variable (pre- or post-enrollment) and they type of variable (categorical or continuous).
Three research questions and three hypothesis questions concerning first year college
student persistence to second-year were analyzed using binomial Logistical Regression
models.
Results of the hypothesis testing found that a significant logistical regression
model was found for each hypothesis question. For pre-enrollment variable model,
transfer hour and high school GPA were the two predictors that contributed significantly
to the model. For the post-enrollment variable model, 1) 1st term GPA and 2) 2nd term
credits earned were the two predictors that contributed significantly to the model. For the
model that included both pre- and post-enrollment variables, 1) 1st term GPA and 2) 2nd
term credits earned were the two predictors that contributed significantly to the model.
The regression model indicated that student were more likely to persistent to their second
year of college the higher their 1st term GPA was and the more credits earned in the 2nd
term.
Chapter five provides a summary of the study including an overview of the
problem, purpose statement and research questions. Additionally, chapter five includes a
review of the methodology and major findings. Next, the findings related to literature are
presented. Last, the conclusion is presented which includes the implications for action,
recommendation for future research, and concluding remarks.

53
Chapter Five
Interpretation and Recommendations
With government and societal expectations that students not simply further their
education post high school, but that they obtain the knowledge and ultimately the degree
or credentials necessary to be successful in life. Chapter five summarizes the study,
delivers an interpretation of the findings and how the findings relate to the available
research, and offers recommendations and suggestions for future persistence studies.
Study Summary
Strong research on college student retention has been published but institutions
exist in a particular context so detailed studies unique to an institution might provide the
most relevant data to support reducing student departure (Hossler, 1991). This study
examined pre- and post-enrollment variables to determine if they were statistically
significant in predicting Avila University’s first year students returning for their second
year. No formal study had been conducted at Avila University in recent years regarding
pre- and post-enrollment predictors for first year students returning to Avila for their
second year.
Overview of the Problem
Avila University holds inconsistent year-to-year retention rates for their first year
cohort. There is substantial evidence to suggest individuals and society benefit from
higher education from occupational and higher pay attainment to social-political attitudes
and civic engagement (Armstrong, Arum, & Stevens, 2008). Nonetheless, the federal
government has increased their attention on student persistence and degree attainment. A
college-educated workforce is critical in the United States of America to remain

54
competitive in the global marketplace (Tinto, 2012). Student departure prior to the
second year is a shared concern by Avila University and other institutions of higher
education.
Purpose Statement and Research Questions
The purpose of this study was to identify the best combination of pre- and post-
enrollment factors that best predict first year student persistence to their second year at
Avila University. Additionally, the purpose was to determine the successful prediction
percentage for student persistence and to determine the odds ratio for the predictive
model. Three research questions were used to shape this study to align with the purpose
of identifying indicators that best predict first year student persistence to their second
year of college at the same institution. The following questions focus the research to look
at specific data and were used for this study:
RQ1. What combination of pre-enrollment variables (cumulative high school
GPA, ACT composite score, number of college credits earned in high school,
month of registration, type of admission offered, and gender) best predicts student
persistence?
RQ2. What combination of post-enrollment variables (enrollment in a
developmental math course, first-semester GPA, second-semester GPA, number
of credits attempted in the first semester, number of hours earned in the first
semester, number of credits attempted in the second semester, number of hours
earned in the second semester, and residence status) best predicts student
persistence?

55
RQ3. What combination of pre- and post-enrollment variables best predicts
student persistence?
Review of the Methodology
The population of this study was new first year undergraduate students who had
enrolled at Avila University since the fall of 2009. The sample selected was comprised
of five first-time, full-time student cohorts who were entering their fall semester of
college from 2009 until 2013. Students were selected for this study by purposive means.
In this quantitative study, binary logistic regression models were developed using
archival data to address the research questions. The regression model predicts a
categorical dependent variable from a set of predictor independent variables. The
dependent variable was persistence to the second year of college.
Major Findings
The major finding from this research is that the academic success that a student
achieves during their first year of college provides more predictability than their high
school academic achievements. College students who achieve a lower GPA in their 1st
term must be mindful of their 2nd term course load in order to achieve necessary credits
that would improve their likeliness of returning to Avila University the fall of their
second year. This information was retrieved from the results of the hypothesis testing.
Results of the hypothesis testing found that a statistically significant correlation
was found for each hypothesis question. Transfer hours and high school GPA were the
two predictors that contributed significantly to the pre-enrollment model. 1st term GPA
and 2nd term credits earned were the two predictors that contributed significantly to the
post-enrollment model. When combining pre- and post-enrollment variables, the model

56
yielded the same findings as the post-enrollment model in that 1st term GPA and 2nd term
credits earned were the two predictors that contributed significantly to the pre- and post-
enrollment model. The regression analysis indicated that students were more likely to
persist to their second year of college the higher their 1st term GPA was and the more
credits earned in the 2nd term.
Findings Related to Literature
College student persistence has been studied during the past 80 years
with theoretical differences linking college student persistence to academic
ability or social integration (Spady, 1970; Tinto, 1975; Astin, 1993,
Chickering, 1969, Swail, 2004). Research continues in the twenty-first century
to determine what variables best predict student persistence. This section will
link findings from the study conducted on first year college student persistence
to prior research.
The current study found that in a student’s first year of college, 1st term
GPA and 2nd term credits earned best predicted student persistence. Astin
(1975) suggested that past academic performance is the greatest predictor of
college student persistence through college which is not supported by this
research. The findings in this study were relatable but not fully aligned to the
findings from Stewart, Doo Hun and JoHyun’s (2015) research that found high
school GPA and 1st term GPA were significant predictors of first year student
persistence.
This study did find that when only analyzing pre-enrollment variables,
high school GPA combined with transfer hours were most predictive. These

57
findings do not support Astin’s (1993) research that presented college grade
point average can be predicted with modest accuracy from admission
information and the two most potent predictors are the student’s high school
GPA and scores on a college admissions tests. Although high school GPA was
predictive, college admissions tests (ACT) was not. In support of this research,
ACT, Inc. (2002) found high school GPA was more accurate than ACT
composite score in predicted first year student GPA.
This research did not find either of the pre-enrollment variables gender
or type of admission predictive. Astin (1975) acknowledge that the ability to
predict student drop-out is limited by setting admission policy.
Gender has various results when researched on its influence or college student
persistence (Astin, 1975; Tinto, 1987; Reason, 2003), this study found that
gender did not significantly predict first year college students returning for
their second year at Avila University.
Conclusions
This study was timely to inform Avila University as to what variables best predict
student persistence. Avila is committed to improving first-year student retention and
improving student success. The findings of this study could be used to help Avila
improve their retention rate along with other similar colleges who struggle in the same
regard.
Implications for Action
The findings of this study should benefit Avila University in supporting first year
students persisting to their second year. An awareness of the factors that are statistically

58
significant in predicting persistence should guide advising and academic planning for all
first year students who enroll at Avila in future years. Avila University faculty and staff
need to understand this research to best serve students. Higher education and Avila
University may access this model to ensure students are being advised in a manner that
best predicts their return, considering their 1st Term GPA and 2nd Term Credits Earned.
To not take action on this research, Avila University would be not appropriately
supporting first year students as they persue a college degree.
Recommendations for Future Research
This study allowed the researcher to explore factors that predict first year student
retention. The following recommendations are made for other researchers interested in
conducting a study on first year college student retention.
Using the same dataset, it is possible to build models that would predict attrition
(student departure). Additionally, segmenting the data to determine if the predictive
variables change based on student’s s gender or residential status.
Future research should also include student financial variables such as the
students reported Expected Family Contribution (EFC) reported on the Free Application
for Federal Student Aid (FAFSA) and specifically, take into account the unmet need of
the student. Also, replicate this study but include student resilience and dedication to
success in college, generally referred to as grit.
Duplicating this study at other colleges might provide an analysis that would offer
that institution factors that predict their first year students persisting. Adding other
factors, like student financial variable and “grit” might provide a more robust predictive

59
model. Changing the dependent variable from persistence to the second-year to
persistence to obtaining a bachelor degree would also offer a valuable perspective.
Concluding Remarks
In society today, education is under intense pressure to successfully prepare and
credential students for their future. Educating students more effectively and efficiently
will only be achieved through analysis of data to inform decisions focused on student’s
success. The literature on this topic varies by study on the actual predictors of student
success; nonetheless, Avila University will utilize the findings from this research to better
support student persistence. This study will empower other practitioner-researchers to
find the answers necessary to help more first year college students persist.

60
References
ACT, Inc. (2002). Predicting different levels of academic success in college using high
school GPA and ACT composite score. Retrieved from
http://www.act.org/content/dam/act/unsecured/documents/ACT_RR2002-4.pdf
ACT, Inc. (2007). ACT technical manual. Retrieved from
http://www.act.org/qualitycore/pdf/TechnicalManual.pdf
ACT, Inc. (2009). The condition of college readiness, 2009. Iowa City, IA: Author.
Retrieved from http://www.act.org/research/policymakers/pdf/
TheConditionofCollegeReadiness.pdf
ACT, Inc. (2011). The condition of college readiness & career readiness, 2011. Iowa
City, IA: Author. Retrieved from http://www.act.org/research/policymakers/
cccr11/pdf/ConditionofCollegeandCareerReadiness2011.pdf
ACT, Inc. (2014). The condition of college readiness, 2014. Iowa City, IA: Author.
Retrieved from http://www.act.org/content/act/en/research/condition-of-college-
and-career-readiness-report-2014.html?page=0&chapter=5
Adelman, C. (1999). Answers in the toolbox: Academic intensity, attendance patterns,
and bachelor’s degree attainment. Washington, DC: U.S. Department of
Education, Office of Educational Research and Improvement.
Armstrong, E. A., Arum, R., & Stevens, M. L. (2008). Sieve, incubator, temple, hub:
Empirical and theoretical advances in the sociology of higher education.
Annual Review of Sociology, 34, 127-151.
Astin, A., (1975). Preventing students from dropping out. San Francisco, CA:
Jossey-Bass, Inc.

61
Astin, A., (1977). Four critical year. Effects of college on beliefs, attitudes, and
Knowledge. San Francisco, CA: Jossey-Bass, Inc.
Astin, A. (1993). What matters in college: Four critical years revisited. San
Francisco, CA: Jossey-Bass, Inc.
Atkinson, R., & Geiser, S. (2009). Reflections on a century of college admissions tests.
Center for Studies in Higher Education. UC Berkeley: Center for Studies in
Higher Education. Retrieved from: http://escholarship.org/uc/item/49z7127p
Aud, S., Hussar, W., Johnson, F., Kena, G., Roth, E., Manning, E., Wang, X., & Zhang,
J. (2012). The condition of education 2012 [NCES 2012-045]. Washington, DC;
National Center for Education Statistics, U.S. Department of Education: U.S.
Government Printing Office.
Avila University. (2012). Undergraduate academic catalog 2012-2013. Retrieved from
https://issuu.com/avilapubs/docs/2014-2015undergraduatecatalog
Braxton, J., Hirschy, A., & McClendon, S. (2004). Understanding and reducing college
student departure. San Francisco, CA: Jossey-Bass, Inc.
Brode, D., Fryar, C., Hirsch, R., Porter, K., Kottiri, B., & Louis, T. (2007). Drug use and
sexual behaviors reported by adults: United States, 1999-2002. Hyattsville, MD:
National Center for Health Statistics.
Carnevale, A., Cheah, B., & Rose, S. (2012). The college payoff: Education, occupation,
lifetime earnings. Washington, DC: The Georgetown University Center on
Education and the Workforce.

62
Carroll, M., Flegal, K., Lamb, M., & Ogden, C. (2010). Obesity and socioeconomic
status in children and adolescents: United States, 2005-2008. Hyattsville, MD:
National Center of Health Statistics.
Chickering, A. (1969). Education and identity. San Francisco, CA: Jossey-Bass.
College Board. (2007). Education pays: The benefits of higher education for individuals
and society. Washington, DC: Author. Retrieved from http://www.collegeboard.
com/prod_downloads/about/news_info/trends/ed_pays_2007.pdf
College Board. (2011). The college completion agenda: 2011 progress report.
Washington, DC: Advocacy & Policy Center. Retrieved from
http://completionagenda.collegeboard.org/reports
DeBerard, M., Spielmans, G, & Julka, D. (2004). Predictors of academic and retention
amoung college freshmen: A longitudinal study. College Student Journal, 38,
66-80.
Fidell, L. & Tabachnick, B. (2007). Using multivariate statistics. (5th ed.).
Boston, MA: Pearson/Allyn & Bacon.
Higher Education Opportunity Act, Public Law 110-315 (2008).
Hossler, D. (1984). Enrollment management: An integrated approach. New York, NY:
College Entrance Examination Board.
Hossler, D. (1991). Evaluating student recruitment and retention programs. San
Francisco, CA: Jossey-Bass.
Hout, M. (2012). Social and economic returns on college education in the United
States. Annual Review of Sociology. 38, 379-400.

63
Johnson, J. (1997). Commuter college students: What factors determine who will persist
or who will drop out?. College Student Journal, 31(3), 323.
Julian, T. A., & Kominski, R. A. (2011). Education and synthetic work-life earnings
estimates. American Community Survey Reports. Washington, DC: U.S. Census
Bureau.
Klor de Alva, J., & Schneider, M. (2011). Who wins? Who pays? The economic returns
and cost of a bachelor’s degree. San Francisco, CA: Nexus Research and Policy
Center, Washington, D.C.: American Institute for Research. Retrieved from
http://www.air.org/files/WhoWins_bookmarked_050411.pdf
Lumina Foundation. (2012, March). A stronger nation through higher education: How
and why Americans must achieve a big goal for college attainment. Retrieved
from www.luminafoundation.org/publication s/A_Stronger_Nation-2012.pdf
Lunenburg, F. C., & Irby, B. J. (2008). Writing a successful thesis or dissertation: Tips
and strategies for students in the social and behavior sciences. Thousand Oaks,
CA: Corwin Press.
Noel-Levitz, Inc. (2013). Student retention and college completion practices report.
Retrieved from https://www.ruffalonl.com/papers-research-higher-education-
fundraising/2013/2013-student-retention-and-college-completion-practices-report
Radford, A., Berkner, L., Wheeless, S., & Shepherd, B. (2010). Persistence and
attainment of 2003-04 beginning postsecondary students: After 6 years [NCES
2011-151]. Washington, DC: U.S. Department of Education, National Center for
Education Statistics. Retrieved from http://nces.ed.gov/pubs2011/2011151.pdf

64
Pascarella, E. & Terenzini, P. (2005). How college affects students, Volume 2, A third
decade of research. San Fransisco, CA: Jossey-Bass.
Reason, R. D. (2003). Using an act-based merit-index to predict between-year retention.
Journal of College Student Retention, 5(1), 71-87. Retrieved from
http://search.proquest.com/docview/196729201?accountid=26368
Spady, W. (1970). Dropouts from higher education: An interdisciplinary review and
synthesis. Interchange, 1(1), 64-85.
Stewart, S., Doo Hun, L., & JoHyun, K. (2015). Factors influencing college persistence
for first-time students. Journal of Developmental Education, 38(3), 12-20.
Swail, W. (2004). The art of student retention: A handbook for practitioners and
administrators. Austin, TX: Educational Policy Institute.
Tinto, V. (1975). Dropouts from higher education: A theoretical synthesis of recent
literature. A Review of Educational Research, 45, 89-125.
Tinto, V. (1987). Leaving college: Rethinking the causes and cures of student
Attrition (1st Ed.). Chicago, IL: The University of Chicago Press.
Tinto, V. (1993). Leaving college: Rethinking the causes and cures of student
attrition. (2nd Ed). Chicago, IL: The University of Chicago Press.
Tinto, V. (2012). Completing college: Rethinking institutional action. Chicago, IL:
The University of Chicago Press.
Warburton, E. C., Bugarin, R., & Nuñez, A. M. (2001). Bridging the gap: Academic
preparation and postsecondary success of first-generation students. Education
Statistics Quarterly, 3(3), 73-77.

65
U.S. Department of Education. (2013). Institute of Education Sciences, National Center
of Education Statistics. Retrieved from
http://nces.ed.gov/collegenavigator/?id=176628
U.S. Department of Health and Human Services. (2011). Health, United States, 2011 with
special feature of socioeconomic status and health. Retrieved from
http://www.cdc.gov/nchs/data/hus/hus11.pdf

66
Appendices
Appendix B: Baker University IRB Application
Date: 8/16/15
School of education IRB PROTOCOL NUMBER _________________
Graduate department (iRb USE ONLY)
IRB Request
Proposal for Research
Submitted to the Baker University Institutional Review Board
I. Research Investigator(s) (Students must list faculty sponsor first)
Department(s) School of Education Graduate Department
Name Signature
1. Dr. Dennis King Major Advisor
2. Dr. Katie Hole Research Analyst
3. University Committee Member
4. External Committee Member
Principal Investigator: Brandon J. Johnson
Email: [email protected]
Mailing address: 53 E. 106th Terr. Kansas City, MO 64114
Faculty sponsor: Dr. Dennis King
Phone:
Email: [email protected]
Expected Category of Review: _X__Exempt __ Expedited __Full
II: Protocol: (Type the title of your study)
Student Retention to Second Year of College: A Study of Pre-Enrollment and Post-
Enrollment Variables to Predict Persistence
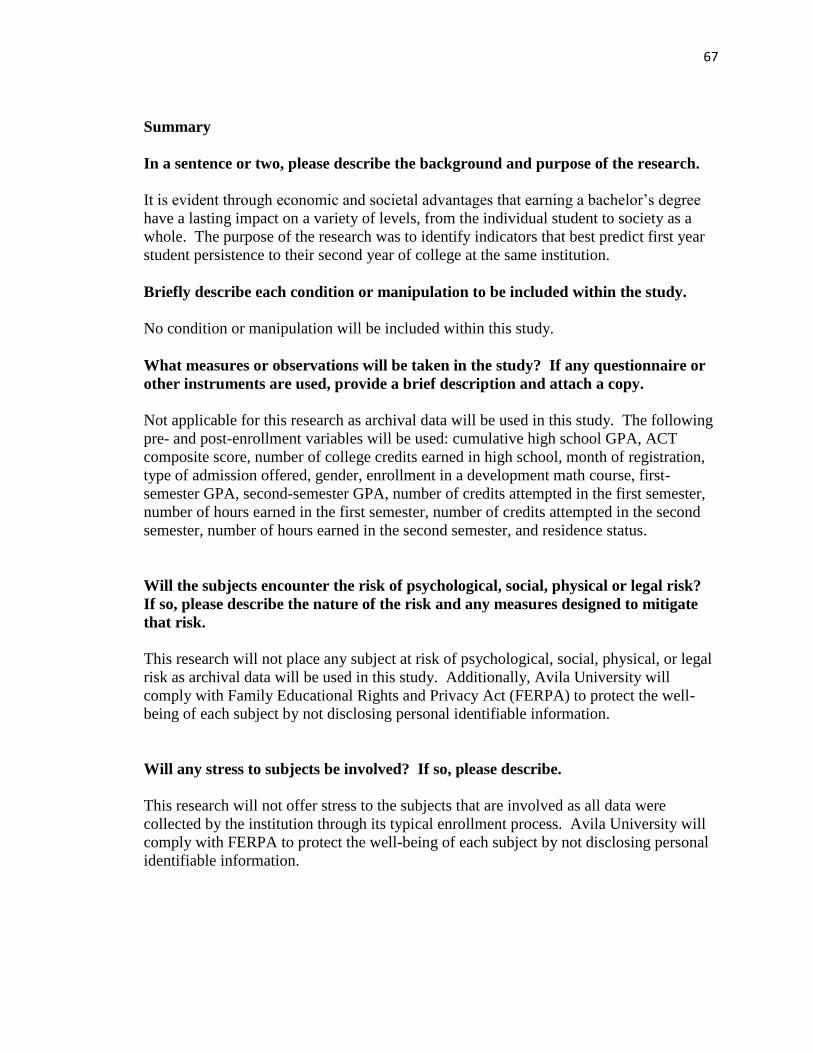
67
Summary
In a sentence or two, please describe the background and purpose of the research.
It is evident through economic and societal advantages that earning a bachelor’s degree
have a lasting impact on a variety of levels, from the individual student to society as a
whole. The purpose of the research was to identify indicators that best predict first year
student persistence to their second year of college at the same institution.
Briefly describe each condition or manipulation to be included within the study.
No condition or manipulation will be included within this study.
What measures or observations will be taken in the study? If any questionnaire or
other instruments are used, provide a brief description and attach a copy.
Not applicable for this research as archival data will be used in this study. The following
pre- and post-enrollment variables will be used: cumulative high school GPA, ACT
composite score, number of college credits earned in high school, month of registration,
type of admission offered, gender, enrollment in a development math course, first-
semester GPA, second-semester GPA, number of credits attempted in the first semester,
number of hours earned in the first semester, number of credits attempted in the second
semester, number of hours earned in the second semester, and residence status.
Will the subjects encounter the risk of psychological, social, physical or legal risk?
If so, please describe the nature of the risk and any measures designed to mitigate
that risk.
This research will not place any subject at risk of psychological, social, physical, or legal
risk as archival data will be used in this study. Additionally, Avila University will
comply with Family Educational Rights and Privacy Act (FERPA) to protect the well-
being of each subject by not disclosing personal identifiable information.
Will any stress to subjects be involved? If so, please describe.
This research will not offer stress to the subjects that are involved as all data were
collected by the institution through its typical enrollment process. Avila University will
comply with FERPA to protect the well-being of each subject by not disclosing personal
identifiable information.

68
Will the subjects be deceived or misled in any way? If so, include an outline or
script of the debriefing.
The subjects in this research will not be deceived or misled in any way as the all data will
be archival so no direct interaction with subjects will take place.
Will there be a request for information which subjects might consider to be personal
or sensitive? If so, please include a description.
The request of information will be made to Avila University and the subjects will be
anonymous. The archived data in this study will not be identifiable by student name. No
other personal identifications (social security number, student identification number)
were requested to also guarantee anonymity. Avila University will fully comply with
FERPA by not disclosing personal identifiable information.
Will the subjects be presented with materials which might be considered to be
offensive, threatening, or degrading? If so, please describe.
The subjects in this research will not be presented with materials considered to be
offensive, threatening, or degrading as all data were archived and collected through the
typical enrollment process of the University.
Approximately how much time will be demanded of each subject?
Archived data will be used from Avila University’s Student Information System
(Jenzabar EX) so there will be no time demanded of each subject in this study.
Who will be the subjects in this study? How will they be solicited or contacted?
Provide an outline or script of the information which will be provided to subjects
prior to their volunteering to participate. Include a copy of any written solicitation
as well as an outline of any oral solicitation.
Aggregated archived data will be used from students who enrolled at Avila University
between the years of 2010-2013, including first year cohorts fall 2010, fall 2011, fall
2012, and fall 2013. Individual students will not be identified in this study. Student
identification data will not be solicited or contacted, as archived cohort data is the focus
of this study.
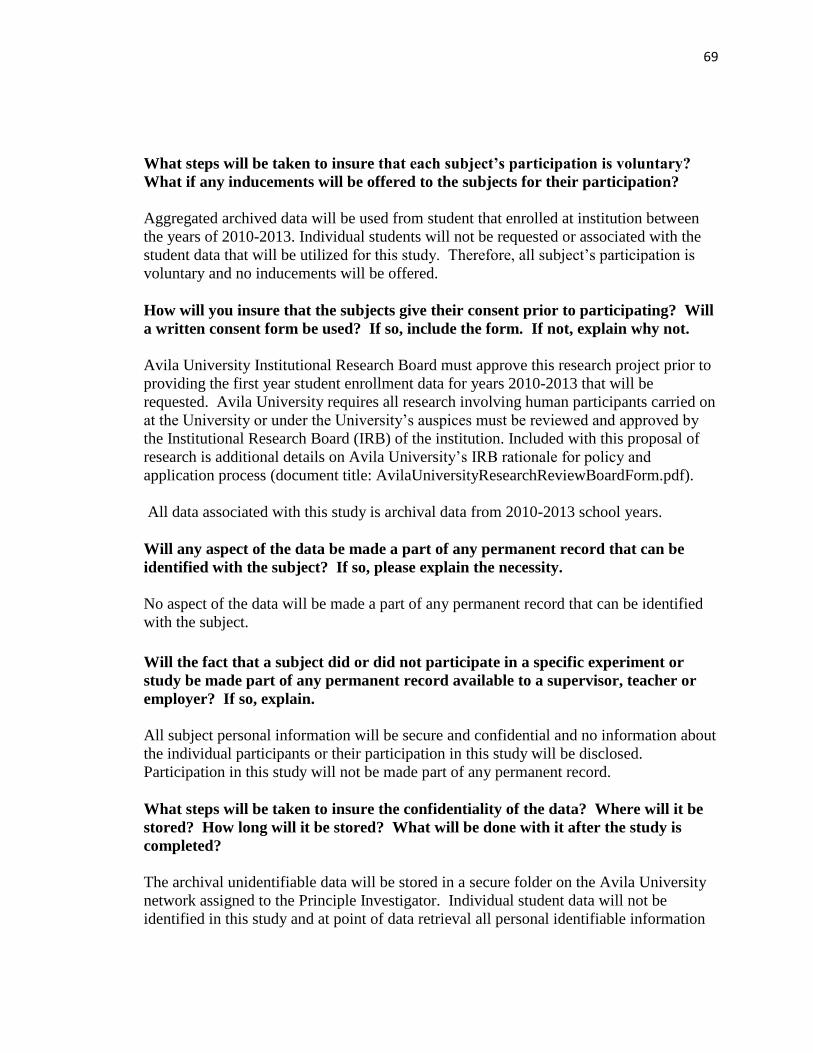
69
What steps will be taken to insure that each subject’s participation is voluntary?
What if any inducements will be offered to the subjects for their participation?
Aggregated archived data will be used from student that enrolled at institution between
the years of 2010-2013. Individual students will not be requested or associated with the
student data that will be utilized for this study. Therefore, all subject’s participation is
voluntary and no inducements will be offered.
How will you insure that the subjects give their consent prior to participating? Will
a written consent form be used? If so, include the form. If not, explain why not.
Avila University Institutional Research Board must approve this research project prior to
providing the first year student enrollment data for years 2010-2013 that will be
requested. Avila University requires all research involving human participants carried on
at the University or under the University’s auspices must be reviewed and approved by
the Institutional Research Board (IRB) of the institution. Included with this proposal of
research is additional details on Avila University’s IRB rationale for policy and
application process (document title: AvilaUniversityResearchReviewBoardForm.pdf).
All data associated with this study is archival data from 2010-2013 school years.
Will any aspect of the data be made a part of any permanent record that can be
identified with the subject? If so, please explain the necessity.
No aspect of the data will be made a part of any permanent record that can be identified
with the subject.
Will the fact that a subject did or did not participate in a specific experiment or
study be made part of any permanent record available to a supervisor, teacher or
employer? If so, explain.
All subject personal information will be secure and confidential and no information about
the individual participants or their participation in this study will be disclosed.
Participation in this study will not be made part of any permanent record.
What steps will be taken to insure the confidentiality of the data? Where will it be
stored? How long will it be stored? What will be done with it after the study is
completed?
The archival unidentifiable data will be stored in a secure folder on the Avila University
network assigned to the Principle Investigator. Individual student data will not be
identified in this study and at point of data retrieval all personal identifiable information

70
will be excluded. Three years after this study is complete, all data will be permanently
deleted and not recoverable.
If there are any risks involved in the study, are there any offsetting benefits that
might accrue to either the subjects or society?
There are no risks involved in this research. Avila University’s Institutional Review
Board will need to approve this study to ensure that all student information is protected
and secured while fully complying with FERPA.
Will any data from files or archival data be used? If so, please describe.
For this research only archival data will be used. The first year student cohort pre-
enrollment variables that will be used are: cumulative high school GPA, ACT composite
score, number of college credits earned in high school, month of registration, type of
admission offered, and gender. The first year student cohort post-enrollment variables
that will be used are: enrollment in a development math course, first-semester GPA,
second-semester GPA, number of credits attempted in the first semester, number of hours
earned in the first semester, number of credits attempted in the second semester, number
of hours earned in the second semester, and residence status.

71
Appendix B: Baker University IRB Approval

72
Baker University Institutional Review Board
9/16/15
Dear Brandon Johnson and Dr. King,
The Baker University IRB has reviewed your research project application and approved this project under Exempt Status Review. As described, the project complies with all the requirements and policies established by the University for protection of human subjects in research. Unless renewed, approval lapses one year after approval date.
Please be aware of the following:
1. Any significant change in the research protocol as described should be
reviewed by this Committee prior to altering the project. 2. Notify the IRB about any new investigators not named in original
application. 3. When signed consent documents are required, the primary investigator
must retain the signed consent documents of the research activity. 4. If this is a funded project, keep a copy of this approval letter with your
proposal/grant file. 5. If the results of the research are used to prepare papers for publication or
oral presentation at professional conferences, manuscripts or abstracts are requested for IRB as part of the project record.
Please inform this Committee or myself when this project is terminated or completed. As noted above, you must also provide IRB with an annual status report and receive approval for maintaining your status. If you have any questions, please contact me at [email protected] or 785.594.8440.
Sincerely, Chris Todden EdD Chair, Baker University IRB
Baker University IRB Committee
Verneda Edwards EdD
Sara Crump PhD
Erin Morris PhD
Scott Crenshaw

73
Appendix C: Avila University IRB Application

74

75
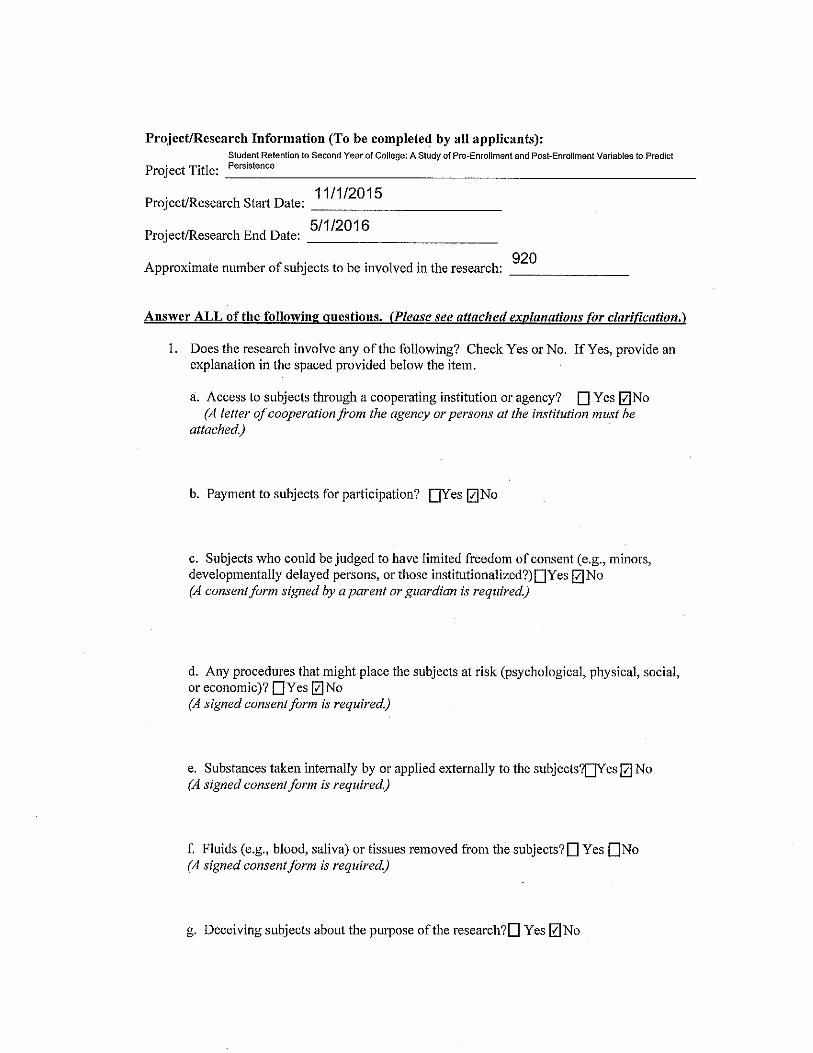
76
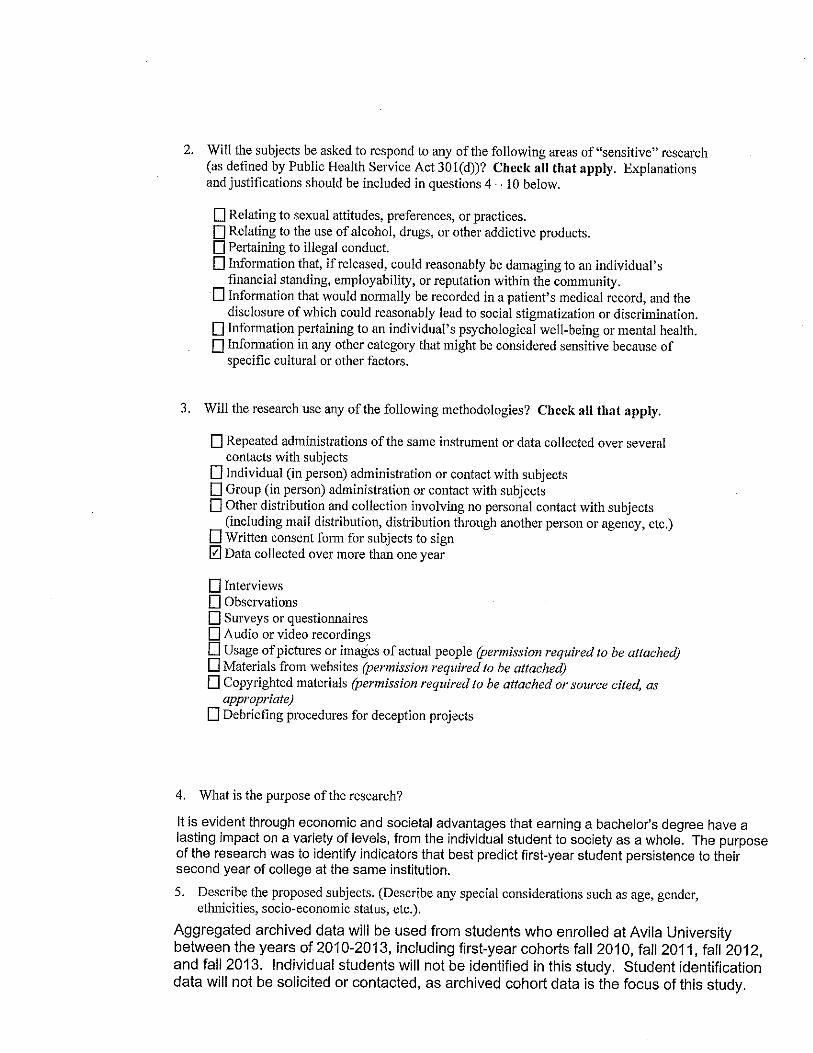
77

78

79

80

81
Appendix D: Avila University IRB Approval

82
October 26, 2015
Brandon Johnson
Vice President for Enrollment Management
Dear Brandon,
Your request for the research project entitled Student Retention to Second Year of College: A Study of Pre-Enrollment and Post-Enrollment Variables to Predict Persistence has been approved by the Institutional Review Board as submitted. It is understood that your research is expected to be completed by May 1, 2016.
I hope that your research goes well and is productive. If you have any further questions, please do not hesitate to call me at 816-501-3759 or by making an appointment in the Academic Affairs Office.
Sincerely,
Mary Knaus LeCluyse, J.D.
Academic Affairs Support Specialist
MKL:ebh

83
Appendix E: Pre-Enrollment Logistical Regression Classification
Classification Table
Observed Returned Fall No Returned Fall Yes Percent Correct
Returned Fall No 0 223 0.0
Returned Fall Yes 0 569 100.0
Overall Percentage 71.8
a. Constant is included in the model
b. The cut value is .500

84
Appendix F: Post-Enrollment Logistical Regression Classification
Classification Table
Observed Returned Fall
No
Returned Fall
Yes
Percent Correct
Returned Fall No 0 142 0.0
Returned Fall Yes 0 565 100.0
Overall Percentage 79.9
c. Constant is included in the model
d. The cut value is .500

85
Appendix G: Pre- and Post-Enrollment Logistical Regression Classification
Classification Table
Observed Returned Fall No Returned Fall Yes Percent Correct
Returned Fall No 0 142 0.0
Returned Fall Yes 0 565 100.0
Overall Percentage 79.9
e. Constant is included in the model
f. The cut value is .500