Embed Size (px)
Citation preview

Development of a direct method for
local scale post-earthquake multi-
hazards susceptibility assessment
MD. SOHEL RANA
February, 2017
SUPERVISORS:
Dr. Cees J. Van Westen
Dr. Olga Christina Mavrouli
Development of a direct method for
local scale post-earthquake multi-
hazards susceptibility assessment
MD. SOHEL RANA
Enschede, The Netherlands, February, 2017
SUPERVISORS:
Dr. Cees J. Van Westen
Dr. Olga Christina Mavrouli
THESIS ASSESSMENT BOARD:
Professor, Dr. V.G. Jetten (Chair)
Dr. Rens. van Beek, External Examiner, Utrecht University
Thesis submitted to the Faculty of Geo-Information Science and
Earth Observation of the University of Twente in partial fulfilment of
the requirements for the degree of Master of Science in Geo-
information Science and Earth Observation.
Specialization: Applied Earth Sciences with Specialization in Natural
Hazards, Risk and Engineering

DISCLAIMER
This document describes work undertaken as part of a programme of study at the Faculty of Geo-Information Science and
Earth Observation of the University of Twente. All views and opinions expressed therein remain the sole responsibility of the
author, and do not necessarily represent those of the Faculty.

i
ABSTRACT
After the devastating 2015 Gorkha earthquake in Nepal, reconstruction activities have been delayed
considerably, due to many reasons, of a political, organizational and technical nature. Due to the widespread
occurrence of co-seismic landslides, and the expectation that these may be aggravated or re-activated in
future years during the intense monsoon periods, there is a need to evaluate for thousands of sites whether
these are suited for reconstruction. In this evaluation multi-hazards, such as rockfall, debris slides, debris
flow, and floods were taken into account. The application of indirect knowledge-based, data-driven or
physically-based approaches is not suitable due to several reasons. Physically-based models generally require
a large number of parameters, for which data is not available. Data-driven, statistical methods, depend on
historical information, which is less useful after the occurrence of a major event, such as an earthquake.
Besides, they would lead to unacceptable levels of generalization, as the analysis is done based on rather
general causal factor maps. The same holds for indirect knowledge-driven methods.
However, location-specific susceptibility analysis of hazardous events is required using a simple method that
can be used by many people at the local level. In this research, a direct scientific method was developed
where local level technical people can easily and quickly assess the post-earthquake multi hazards
susceptibility following a decision tree approach, using a Web-GIS app on a smartphone or tablet. The
method assumes that a central organization, such as the Department of Soil Conservation and Watershed
Management, generates spatial information beforehand that is used in the direct assessment at a certain
location. Pre-earthquake, co-seismic and post-seismic landslide inventories are generated through the
interpretation of Google Earth multi-temporal images, using anaglyph methods. Spatial data, such as Digital
Elevation Models, land cover maps, and geological maps are used in a GIS to generate Terrain Units in an
automated manner. Source areas for rockfall and debris flows are outlined from the factor maps, and
historical inventory, and regional scale empirical runout model (Flow-R) are used to define areas that might
be affected. This data is then used in the field in an application that guides the user through the decision
tree by asking a number of questions, which can be answered by using the existing data, and by direct field
observations. The method was applied in a part of Rasuwa district, which was seriously affected by co-
seismic and post-earthquake mass movements, leading to the evacuation of a number of hydropower
construction project.
Keywords: Multi-hazards, susceptibility, decision tree approach, direct method, Digital Elevation Model,
Flow-R empirical runout model, Automated Terrain Unit, Web-GIS apps.

ii
ACKNOWLEDGEMENTS
First and foremost, praise and gratitude to almighty Allah (God) for giving me the knowledge to accomplish
this work.
I would like to express my heartfelt thanks to my first supervisor, Dr. Cees J. van Westen for his wisdom
guidance and amazing ideas which guide me proceed in right direction to finish this thesis work. His
inspiration learning knowledge has transformed me to think critically for solving every steps of this research
work. Also, he has been kind enough to patience my thoughts and ideas which actually made the all
discussions prolific.
The words cannot describe my thankfulness to my second supervisor, Dr. Olga Christina Mavrouli who
always guided and supported me in all aspect. Her invaluable encouragement pushed me forward to
complete this work. Even, in my field work, she always guided me and helped me to understand the physics
of rock science. Her expert research knowledges facilitated me to test the decision tree in the field for multi-
hazards susceptibility assessment which finally guide me to develop the improved one.
Many thanks to Dr. Jianqiang Zhang, Post. Doc Researcher, ITC for supporting me with his expedient
thoughts and technical know-how. My sincere thanks to him also because of sharing his research generated
landslides inventory and land cover data which has helped me to perform automated terrain analysis for this
study. My deep gratitude to drs. Nanette Kingma, lecturer of my domain for her kindness to provide valuable
suggestions and inspirations throughout entire MSc period. I would also like to express thanks to Japan
Aerospace Exploration Agency (JAXA) for providing the ALOS 5m DEM freely for a part of my study
area.
I also like to thank Ms. Susmita Dhakal, lecturer, Tribhuvan university of Nepal for supporting me in field
work with her MSc. students and testing my decision tree. I should not forget Mr. Akash Acharya, MSc
student, Tribhuvan University, Nepal for helping me to communicate with local people all time in the field
work. Being a student of geological engineering, he also effectively tested my decision tree approach in the
field.
Many thanks to my scholarship provider “Joint Japan/World Bank Graduate Scholarship” who fully
financed my MSc. study. I would also like to thanks my organization (local Government Engineering
Department of Bangladesh) for allowing me to study in Netherlands.
I am pleased to thanks my all classmates for the time that we shared together and continuous encouragement
and support.
My eternal gratitude to my parents and family for their love, sacrifice and support which has no boundaries
and distance. At last but not least, special mention to my little angel ‘Laiba’, as she allowed me to stay in
distance during this 18 months by her divine smiling.

iii
TABLE OF CONTENTS
1. INTRODUCTION .............................................................................................................................................. 1
1.1 Background ...................................................................................................................................................................1 1.2 Problem statement ......................................................................................................................................................3 1.3 Research Objective ......................................................................................................................................................3 1.4 Research Questions .....................................................................................................................................................4 1.5 Research approach ......................................................................................................................................................4 1.6 Thesis outline ...............................................................................................................................................................4
2. LITERATURE REVIEW ................................................................................................................................... 6
2.1 Post-earthquake multi-hazards ..................................................................................................................................6 2.2 Different methods of landslides susceptibility assessment ..................................................................................6 2.3 Decision tree approach for hazards assessment ................................................................................................. 10 2.4 Terrain unit mapping ............................................................................................................................................... 11 2.5 Multi-hazards assessment using Google Earth ................................................................................................... 12
3. STUDY AREA AND DATA ......................................................................................................................... 14
3.1 Study Area .................................................................................................................................................................. 14 3.2 Data collection .......................................................................................................................................................... 15 3.3 Landslide Inventory ................................................................................................................................................. 16 3.4 Digital Elevation Model .......................................................................................................................................... 17 3.5 Land cover Map ........................................................................................................................................................ 18
4. DATA PROCESSING FOR DECISION TREE ...................................................................................... 21
4.1 Mass movements runout flow path assessment using Flow-R ........................................................................ 21 4.2 Terrain unit mapping ............................................................................................................................................... 30 4.3 Homogeneous road segment mapping ................................................................................................................. 37
5. DEVELOPMENT OF A DECISION TREE MULTI-HAZARDS SUSCEPTIBILITY
ASSESSMENT .................................................................................................................................................. 40
5.1 Initial Decision tree .................................................................................................................................................. 40 5.2 Testing the decision tree in the field ..................................................................................................................... 41 5.3 Problems in decision tree testing ........................................................................................................................... 47 5.4 Improvement of the decision tree ......................................................................................................................... 48
6. APPLICATION OF THE PROPOSED DECISION TREE ................................................................. 51
6.1 Case examples results............................................................................................................................................... 51 6.2 Discussions ................................................................................................................................................................ 54
7. TOWARDS AN APP FOR DECISION TREE IMPLIMENTATION ................................................ 55
7.1 Structure of Mobile GIS .......................................................................................................................................... 55 7.2 Framework of decision tree mobile Web-GIS app ............................................................................................ 56 7.3 Mock Web-GIS app of multi-hazards susceptibility decision tree .................................................................. 59
8. CONCLUSIONS AND RECOMMENDATIONS ................................................................................... 62

iv
LIST OF FIGURES
Figure 1.1: Flowchart of overall research approach of this study........................................................................................... 5
Figure 2.1: Different methods of landslides susceptibility assessment (Corominas et al., 2014)............................................. 7
Figure 2.2: An example of decision tree which was used for evaluating potential landslide activity in Landslide Hazard
Assessment for Situational Awareness (LHASA) model in Central America & the Caribbean (Kirschbaum et al., 2015).
........................................................................................................................................................................................ 11
Figure 3.1: Location map of study area ............................................................................................................................ 14
Figure 3.2: Landslides inventory of study area based on landslides type ............................................................................. 16
Figure 3.3: Landslides inventory of study area based on triggering factors .......................................................................... 17
Figure 3.4: Elevation map covering Dandagaun and Mailung area, showing with (a) 30m DEM (b) 5m DEM ............ 17
Figure 3.5: Slope map and histogram of study area based on 30m DEM ......................................................................... 18
Figure 3.6: Comparison of two slope gradient maps, prepared by using 5m and 30m resolution DEM .............................. 19
Figure 3.7: Correlation of random sampling 1000 point slope gradient values between two slope data ................................ 19
Figure 3.8: Figure shows (a) land cover with five major classes and (b) bar chart of % area coverage of each land cover class
........................................................................................................................................................................................ 20
Figure 4.1: Illustration of spreading to the neighbour cells (Horton et al., 2013) ............................................................... 22
Figure 4.2: Co-seismic rockfall sources of Dandagaun and Mailung area .......................................................................... 23
Figure 4.3: Potential rockfall runout paths considering different travel angles with varying maximum velocity .................... 25
Figure 4.4: Potential (a) rockfall sources considering slope>600 and (b) runout spreading using the 5m DEM ................. 26
Figure 4.5: Identification of (a) potential rockfall sources in area with slope gradient >70 degree (b) runout spreading by
using 5m DEM ............................................................................................................................................................... 26
Figure 4.6: Identification of (a) potential rockfall sources in area with slope gradient >50 degree (b) runout spreading by
using 30m DEM ............................................................................................................................................................ 27
Figure 4.7: Spreading probability of rock slides runout at Mailung area using (a) 5m ALOS and (b) 30m SRTM DEM
........................................................................................................................................................................................ 27
Figure 4.8: Spreading probability of debris flows at Ramche with alternatives parameters .................................................. 28
Figure 4.9: (a) Debris slides inventory and sources of debris flows (b) Spreading probability of debris flows at Haku area . 29
Figure 4.10: Effect of debris flows susceptibility results in terrain unit at Haku area ........................................................ 30
Figure 4.11: Illustrations of different approaches for homogenous units (a) exposure based and (b) terrain based ................ 31
Figure 4.12: Manual terrain units mapping of a part of study area .................................................................................. 32
Figure 4.13: Methodological flow chart of automated terrain unit mapping analysis ........................................................... 33
Figure 4.14: The factor maps which were used in terrain units mapping analysis ............................................................... 34
Figure 4.15: Automated terrain units map of study area .................................................................................................. 35
Figure 4.16: Attribute information of selected automated terrain unit (a) other than landslide unit and (b) landslide unit.. 36
Figure 4.17: Interpretation between automated terrain unit and manually mapped terrain unit ......................................... 37
Figure 4.18: Road condition of some segments of Pasang Lhamu Highway after the 2015 earthquake .............................. 38
Figure 4.19: Manually mapped of road segments of Pasang Lhamu Highway in the study area ........................................ 39
Figure 5.1: A part of initial decision tree for multi-hazards analysis (Source: Dr. Cees van Westen) ................................. 41
Figure 5.2: Overall results of testing of decision tree at field work showing units having (a) different types of hazards (b)
different level of hazards(DS=Debris slide, DF=Debris flow and RF=Rockfall). ........................................................... 42
Figure 5.3: Results of initial decision tree at Mailung village (a) pre-earthquake Google Earth image (b) post-earthquake
Google Earth image (c) photo from field observation (d) susceptibility assessment flow ........................................................ 43
Figure 5.4: Results of initial decision tree at Gogani village (a) pre-earthquake Google Earth image (b) post-earthquake
Google Earth image (c) photo from field observation (d) susceptibility assessment flow ........................................................ 45
v
Figure 5.5: Results of initial decision tree at Sano Haku village (a) pre-earthquake Google Earth image (b) post-earthquake
Google Earth image (c) photo from field observation (d) susceptibility assessment flow. ...................................................... 46
Figure 5.6: Illustrations of different levels in the proposed decision tree for multi-hazard susceptibility assessment ............... 49
Figure 5.7: The proposed decision tree of multi-hazard susceptibility assessment ................................................................ 50
Figure 6.1: Results of the proposed decision tree for multi-hazard susceptibility assessment at Mailung area ...................... 51
Figure 6.2: Results of the proposed decision tree for multi-hazard susceptibility assessment in Gogani village ..................... 52
Figure 6.3: Results of the proposed decision tree for multi-hazard susceptibility assessment at Sano Haku area ................. 53
Figure 7.1: Illustrations of the architecture of mobile GIS (ESRI, n.d.) ........................................................................... 56
Figure 7.2: Thematic diagram of using of Web-GIS app at different districts in Nepal .................................................... 59
Figure 7.3: Proposed architecture of the decision tree approach app of multi-hazards susceptibility assessment (MHSA) ... 60
Figure 7.4: Sample question window with the attribute information by using Info tab in the proposed app ........................ 60
Figure 7.5: Automated terrain editing option depending on field situation in proposed app ................................................ 61
Figure 7.6: Final results of multi-hazards susceptibility assessment of a terrain unit ......................................................... 61

vi
LIST OF TABLES
Table 3.1: List of major ancillary data for this study ........................................................................................................ 15
Table 4.1: Implemented weightings of persistence functions in the assessment of spreading (Horton et al., 2013) ................ 22
Table 4.2: Comparison of potential rockfall source areas having slope steepness>600......................................................... 26
Table 4.3: List of data which were used in automated terrain mapping analysis ................................................................ 32
Table 4.4: Classification of manual homogeneous road segment ......................................................................................... 39
Table 5.1: Conflicting factors in initial decision tree .......................................................................................................... 47
Table 5.2: Proposed modification for the conflicting factors of initial decision tree ............................................................... 48
Table 7.1: List of GIS data layers which are needed to include in decision tree app ........................................................... 57
Table 7.2: The factors having the GIS functionality in decision tree .................................................................................. 58

vii
LIST OF ABBREVIATIONS
ALOS Advanced Land Observing Satellite
ANN Artificial Neural Networks
ASCII American Standard Code for Information Interchange
ATU Automated Terrain Unit
CSS Cascading Style Sheets
DEM Digital Elevation Model
DISCO District Soil Conservation Officer
DMG Department of Mines and Geology
DoLIDAR Department of Local Infrastructure Development and Agricultural Roads
DSCWM Department of Soil Conservation and Watershed Management
DTM Digital Terrain Model GIS Geographic Information System
HDX Humanitarian Data Exchange HTML Hypertext Markup Language
ICIMOD International Centre for Integrated Mountain Development
ILWIS Integrated Land and Water Information System
JAXA Japan Aerospace Exploration Agency
LHASA Landslide Hazard Assessment for Situational Awareness
LIDAR Light Detection And Ranging
MCT Main Central Thrust
NSET National Society for Earthquake Technology
OSII On Screen Image Interpretation
PASW Predictive Analysis SoftWare
PROBSTAB Probabilistic Slope Stability
QUEST Quick, Unbiased, Efficient, and Statistical Tree
RAMMS Rapid Mass Movement Simulation
SFLM Simplified Friction Limited Model
SHALSTAB Shallow Landslide Slope Stability
SINMAP Stability Index Mapping
SLIP Shallow Landslides Instability Prediction SMCE Spatial Multi Criteria Evaluation
SRTM Shuttle Radar Topography Mission
TMU Terrain Mapping Unit
TPI Topographic Position Index
TU Terrain Unit
UNDP United Nation Development Program
USGS United States Geological Survey
VDC Village Development Committee


Development of a direct method for local scale post-earthquake multi-hazards susceptibility assessment
1
1. INTRODUCTION
1.1 Background
Geological processes might cause natural hazards and extreme events with destructive consequences for
people and properties. In the mountains, human lives, property, infrastructures and ecosystems are
threatened repeatedly by various hazards and dangerous processes. Natural hazards in the mountains include
landslides, debris flow, rockfall, floods, rock/snow avalanches as well as others large-scale hazards such as
earthquakes, volcanic eruptions. The massive hazards, most of the cases, create secondary hazards or
cascading hazards which causes multi-hazards in mountainous area. As example, a strong earthquakes may
trigger a number of secondary hazards such as landslides, debris flows, floods, rockfall etc. Consequently,
they change the land surface strongly, which causes more geo-hazards especially in mountain areas. Usually,
co-seismic landslides in mountain area mobilize a lot of materials and make slope bare. In addition,
subsequent extreme rainfall events may cause the intensification of more hazards like debris flows and floods
(Yang et al., 2015). The hazards resulting after the earthquake can be dangerous and may last for a number
of year after the earthquake. These may severely threaten people as well as destroy infrastructures. Therefore,
it is important to consider multi-hazards aspect for analysing natural hazards in mountainous area.
Multi-hazards analysis involves the approach of assessing the potential occurrence of different types of
natural hazards in a given area where the characteristics of single hazardous events as well as their mutual
interactions and interrelations are taken into account. Therefore, consideration of type of hazards are also
important in multi-hazards analysis. As example, analysis of multi-hazards in mountain regions may include
landslides, flood, snow avalanches etc. where different types of landslides are taken most importantly.
According to Varnes (1978), based on slope movement and materials types landslides are classified with
different types such as rockfall, rock slides, rock topple, debris slides, debris flow, earth slides etc. which
was also modified by including more type as described by Hungr et al., (2014). Therefore, depending on the
area, different types of hazardous events are taken for multi-hazards susceptibility analysis. In hazards
assessment context, two terms are frequently used; susceptibility assessment and hazard assessment.
Susceptibility maps contain zones which have relative spatial likelihood of potentially damaging phenomena
that may occur in future. On the other hand, hazard analysis gives information on the probability of
occurrence and magnitude or intensity of hazard events at a specific area (Varnes, 1984). Generally, in
landslides susceptibility assessment, mostly causal factors such as topography (e.g. Slope, aspect, elevation),
geology (e.g. lithology, fault), Soil (geotechnical properties), land use and geomorphology in combination
with landslide inventories are used (Ding and Hu, 2014; Hong et al., 2016). Whereas, in hazard assessment,
possible triggering factors (e.g. rainfall, earthquake) and their frequency are additionally taken into account.
There are different approaches of landslides hazard assessment; qualitative (knowledge driven) and
quantitative: data driven & physically based (Corominas et al., 2014; Zizioli et al. 2013). Knowledge-driven
approaches are based on expert opinion and most of them are indirect methods (e.g. Fuzzy logic, Multiclass
overlay, Boolean logic, SMCE: Spatial multi criteria evaluation). In fuzzy logic knowledge based approach,
landslides hazard mapping is an effort to overcome the deficiencies of data and is suitable for application
over large areas (Zhu et al., 2014). Also a Spatial Multi Criteria Evaluation (SMCE) approach can be applied
over large areas, or in cases where there are no detailed landslide inventories available. SMCE is a very
flexible tool that can be applied in many cases with very different data sets, even in poor data conditions
(Van Westen et al., 2010; Pellicani et al., 2014). All most in all indirect knowledge based methods, a number
of casual factor maps, and expert-based weights are assigned. As a result, all areas with the same combination
of factors get the same score and same hazard level. Actually, using of these type general causal factor maps

Development of a direct method for local scale post-earthquake multi-hazards susceptibility assessment
2
leads to large generalisations which is not desirable. Knowledge based approach could be direct methods
such as geomorphological hazard mapping where only geomorphologists can develop hazard map based on
different maps and their knowledge.
On the other hand, data-driven methods evaluate statistically the probability of landslide occurrence, having
the same combination of factors that produced them in the past. These methods can be bivariate statistical
models such as; weights of evidence, frequency ratio (Hussin et al., 2016; Regmi et al., 2014), multivariate
statistical models such as; regression analysis (Hong et al., 2016; Bai et al., 2010) and Artificial Neural
Networks (Poudyal et al., 2010). Usually, statistical approach is commonly used where landslides inventories
and causative factors are applied to build a susceptibility model for prediction of future landslides. In most
of the data driven methods, the same combination of factors are considered throughout the entire area as
general assumptions. Also, the approach is less useful on the site-specific scale, where local geological and
geographic heterogeneities may prevail (Pradhan et al., 2010).
Alternatively, physically based landslides hazard assessment methods are based on the modelling of slope
failure. By using slope stability model, this method is widely applied for landslides hazard zoning over large
area (Nicholson and Namekar, 2013). Some physically based models are used to analyse slope stability with
different rainfall scenarios where it shows that an increase of rainfall intensity results in a significant increase
of unstable area (Yang et al., 2015). In addition, combination of models of landslides initiation, local
geomorphological mobilization criteria for selecting debris-flow initiation points and simulation of transport
& propagation of debris flows & rock falls could be useful for multi-hazards analysis (Park et al., 2016). On
the other hand, by using the infinite slope model, most of the physically based models that are used at local
scale are applicable shallow landslides (less than a few meters in depth) (Corominas et al., 2014). The
advantage of these physically based is that they can be used with low data availability by assuming different
parameters whereas, the main drawbacks are the degree of simplification involved and need for large amount
of reliable data. Additionally, some dynamic numerical runout models (e.g. Flow-R, RAMMS, FLO-2D,
AschFlow etc.) are used for medium scale landslides (specially debris flow, rockfall) hazards analysis (Quan
Luna et al., 2016). Local scale debris flow runout models generally require a large number of parameters
related to initiation conditions, rheology and entrainment that are difficult to collect. However, there are
currently no models available that allow the modelling of all hazardous processes in the same configuration.
In fact, the reliability of the outcomes of landslides hazard assessment depends on using of important causal
factors, scale of analysis and the choice of scientific models. The available literature reveals that the most
important factors in landslide hazard assessment are topography, geology, land use, seismic intensity, and
rainfall. In the mountain area like Nepal, the steep slopes as well as the geology and intense rainfalls influence
the occurrence of landslides most (Poudyal et al., 2010). On the other hand, the scale of model in landslide
hazard assessment depends on the purpose of study as well as the requirements of users. In most of the
cases it was found that landslide hazard analysis was performed based at national or regional scale (Yang et
al., 2015; Regmi et al., 2014; Ding and Hu, 2014; Horton et al., 2013). Conversely, local level hazards
assessment can play an effective role to risk mitigation and reconstruction planning. Though in some studies
hazard analysis is performed using event tree approach, those are site specific and considering only one type
of hazards (Kirschbaum et al., 2015; Saito et al., 2009). In addition, there is no involvement of local people
of this approach. In other cases, in Community-based Disaster Risk Management approach, community
people are involved for risk reduction or mitigation activity with some extend of hazard assessment. It is
done basically by discussing with the local communities what hazard they have experienced in the past, and
allowing them to map their own hazard zones. But local people cannot make these judgements for large
scale events like earthquakes that they didn’t experience themselves before.

Development of a direct method for local scale post-earthquake multi-hazards susceptibility assessment
3
1.2 Problem statement
Recently, a strong earthquake with moment magnitude of 7.8 strikes at Gorkha of Nepal on 25 April, 2015
which causes a number of aftershocks within few days that lead to about 5000 landslides including debris
flows (ICIMOD, 2016). These hazards not only killed people but also destroyed a large numbers of
infrastructures in urban and rural areas with recorded deaths of 9000 people and the total economic loss
was about 7 billion U.S. dollars (Goda et al., 2015).
After the devastating 2015 Gorkha earthquake, reconstruction activities have been delayed considerably,
due to many reasons, of a political, organizational and technical nature. Due to the widespread occurrence
of co-seismic landslides, and the expectation that these may be aggravated or re-activated in future years
during the intense monsoon periods, there is a need to evaluate for thousands of sites whether these are
suited for reconstruction. In this evaluation multi-hazards, such as rockfall, debris slides, debris flow, and
flash floods are taken into account. The application of indirect knowledge-based, data-driven or physically-
based approaches is not suitable due to several reasons. Physically-based models generally require a large
number of parameters, for which data is not available. Data-driven, statistical methods, depend on historical
information, which is less useful after the occurrence of a major event, such as an earthquake. Besides, they
would lead to unacceptable levels of generalization, as the analysis is done based on rather general causal
factor maps. The same holds for indirect knowledge-driven methods.
However, location-specific hazards analysis is required using a simple method that can be used by many
people at the local level. In this research, a direct scientific method is developed where local level technical
people can easily and quickly assess the post-earthquake multi hazards following a decision tree approach,
using an app on a smartphone or tablet. The methods assumes that a central organization, such as the
Department of Soil Conservation and Watershed Management, generates spatial information beforehand
that is used in the direct assessment at a certain location. The method was applied in a part of Rasuwa
district, which was seriously affected by co-seismic and post-seismic mass movements, leading to the
evacuation of a number of village, and temporary closure of a number of hydropower construction projects.
1.3 Research Objective
The overall objective of this research is to develop a direct method for multi-hazards (e.g. debris slide, debris
flow, rockfall, and flood) susceptibility analysis based on a decision tree and with geospatial data that is
available on a tablet in the field. The application of this method would be established in such a way so that
local technical people can easily and quickly assess the susceptibility at field level for local level
reconstruction planning. To achieve this objective, the following specific objectives has been carried out:
(a) Analyse whether such an approach would be best done exposure-based (e.g. starting from the potential location for reconstruction) or terrain based (starting from local homogenous units as a basis for zoning)
(b) Perform terrain analysis for developing unit maps considering exposure elements aspect or homogeneous terrain zone.
(c) Develop a decision tree approach for multi-hazards susceptibility assessment and test at several
locations for different types of exposure elements (e.g. point based, or linear based).

Development of a direct method for local scale post-earthquake multi-hazards susceptibility assessment
4
(d) Enhance the evaluation possibilities by using available additional information derived from by using empirical model to identify the factors which need to be included in decision tree.
(e) Evaluate the efficiency of the direct method (decision tree approach) for post-earthquake multi-hazards susceptibility assessment and provide recommendation to develop an app for its efficient usage.
1.4 Research Questions
The research questions for this study are as follows:
What would be the level of required knowledge and skills of the people that should carry out such susceptibility evaluation, focusing on technical personal at district level?
Would it be better to analyse the susceptibility based on a specific location for reconstruction planning of a building (point based) or road (line based) or would it be better to make a zonation based on homogeneous units?
Which parameters can be used to generate terrain units for which multi-hazards susceptibility is evaluated? Can these units be generated (semi-)automatically in GIS, or is a substantial input in image interpretation required?
How can empirical model output be considered at decision tree to assess multi-hazards susceptibility?
How the method could be implemented as an app on a tablet or smartphone?
1.5 Research approach
To achieve the mentioned objectives and to answer the research questions, the study is comprised of field
work to test the decision tree, various data processing in GIS environment, uses of Flow-R model for
rockfall and debris flow runout assessment, automated terrain analysis to prepare unique terrain unit
mapping which leads to develop a decision tree for multi-hazards susceptibility assessment. Finally, towards
developing an app on proposed decision tree, comprehensive recommendation has been suggested with
feasible architecture and features. The overall research approach is shown in Figure 1.1.
1.6 Thesis outline
The research study is structured as following chapters:
Chapter 1: contains a background of multi-hazards and their susceptibility assessment methods, the research
problem to be address by this study, the research objects and the related research questions with overall
research approach.
Chapter 2: covers a detailed literature reviews on different methods of multi-hazards (landslides hazards)
susceptibility assessment including available decision tree approach and terrain unit mapping.
Chapter 3: mostly describes about the study area and data uses for this study
Chapter 4: contains the detailed data processing for decision tree methods which includes the rockfall and
debris flow runout flow paths assessment by using the empirical model Flow-R, manually mapped terrain
unit, automated terrain unit analysis.

Development of a direct method for local scale post-earthquake multi-hazards susceptibility assessment
5
Chapter 5: describes about the decision tree method for multi-hazards susceptibility assessment, testing the
initial decision tree in the field, case examples results and their findings and development of the improved
decision tree.
Chapter 6: contains the results of improved decision tree and their findings with case examples
Chapter 7: describes about the possibility and framework of development a Web-GIS app of decision tree
approach for multi-hazard susceptibility assessment with mock app.
Chapter 8: ends with concluding remarks and scope for future study.
Figure 1.1: Flowchart of overall research approach of this study

Development of a direct method for local scale post-earthquake multi-hazards susceptibility assessment
6
2. LITERATURE REVIEW
2.1 Post-earthquake multi-hazards
A landslide is the general name given to the movement of earth surface down a slope along a surface of
separation by falling, sliding, or flowing. According to Cruden (1991), “a landslide is the movement of mass
of rock, earth or debris to down the slope”. Landslides include rock falls, deep failures of soil slopes, and
shallow debris flows. They result from the failure of the materials which make up a hill slope and are driven
by the force of gravity. They are an integral part of the mountain building process and are one of the main
means by which the uplifted mountain mass is transported down to lower valleys and basins.
In mountainous areas with extreme phenomena such earthquakes and very intense rainfalls, earthquake
and/or rainfall-induced landslides and floods represent significant hazards, in terms of damage to
infrastructure, direct economic cost and lost productivity. Post-earthquake landslides are the most significant
secondary hazard of earthquakes in areas of high relief, and can be responsible for high fatality rates.
Rockfall, landslide and debris flow might also block the rivers & lake which causes outburst of flooding.
For example, 2015 Gorkha earthquake of Nepal causes about 5000 landslides covering in this region which
resulting the death of about 9,000 people and loss and damage equivalent to USD 7 billion (ICIMOD, 2016).
Additionally, earthquake induced other multi-hazards such as debris flow, avalanches, landslides dams and
glacial lake outburst floods in this region after the Gorkha earthquake. While the direct effects of
earthquakes are well established and often spectacular, the activity of these secondary phenomena and their
long-term economic and societal costs are commonly overlooked.
Hence, in earthquake prone mountainous area, understanding of multi-hazards is very important for hazard
and risk assessment. Different natural hazards are formed based on different geophysical environment
factors. Also, the impacts of one hazardous event are often exacerbated by interaction with other hazards.
Close proximity between events may reduce resilience and recovery, and hence is indicative of greater risk
than for events considered in isolation. Therefore, the analysis of multi-hazard risk is not a simple task.
Hazard relations and interactions may have unexpected effects and pose threats that are not captured by
means of separate single-hazard analysis. In this aspect, hazards matrix or event tree approach is commonly
used for multi-hazards analysis. As example, Marzocchi et al. (2012) described an event tree to analyse multi-
hazard risk due to triggering effects whilst Kappes et al. (2011) suggested a matrix to identify the possible
triggering effect within seven hazards in an Alpine region. On the other hand, considering the trigger factors
for each hazard, the relationships between different natural hazards are categorized and hazard interaction
are analysed to calculate the probability and magnitude of multiple hazards (Liu et al., 2016). However,
multi-hazards and risk assessment is performed primarily for the purpose of providing information and
insight to decision making, especially in emergency response, and disaster preparedness and mitigation.
2.2 Different methods of landslides susceptibility assessment
Landslides hazard analysis is complex and involving a multitude of factors and needs to be studied
systematically in order to locate the areas most prone for landslides. Therefore, multi-hazards approach is
essential for landslides hazard assessment. As because, different casual factors and characteristics play role
to occur different types of landslides with different spatial, temporal and size probabilities. In addition,
landslides hazard often occur combining with types of hazards. Hence, the landslides hazard assessment
largely depends on the availability of different casual factors and event based landslides inventories.

Development of a direct method for local scale post-earthquake multi-hazards susceptibility assessment
7
Different methods are available for landslides susceptibility assessment which are broadly categorized into
quantitative (data driven method, physically based modelling) and qualitative (knowledge driven method) as
shown in Figure 2.1. Each of the methods are described in the following sections.
Figure 2.1: Different methods of landslides susceptibility assessment (Corominas et al., 2014)
2.2.1 Data driven approach
Data driven methods evaluate statistically the probability of landslide occurrence, having the same
combination of factors that have triggered in the past. These methods can be bivariate statistical models
(e.g. weights of evidence), Multivariate statistical models (e.g. logistic regression, discriminant analysis) and
Artificial Neural Networks (ANN). In bivariate data driven method, landslide occurrences in each percentile
class for each factor map is calculated separately. Then, weight values are calculated by comparing the
landslide occurrences in each percentile class with the overall landslide occurrence in the factor map.
In the probabilistic weight of evidence bivariate method, the weight for each landslide predictive factor is
calculated, based on the presence or absence of the landslides within the area (Pradhan et al., 2010; Regmi
et al., 2010; Kumar et al., 2008). A weighting table is produced for each factor map that includes for each
class the positive weight (W+) and negative weight (W−) where it indicates the importance of the presence
and absence of each class on the occurrence of landslides respectively. The table also has the contrast value
which indicates the measure of the overall importance of a factor map class on the conditions causing
landslide occurrence. One of the main advantages of the weight of evidence approach is the capability of
combining the subjective choice of the classified factors by the expert with the objective data-driven
statistical analysis of the GIS (Hussin et al., 2016). Bivariate statistical methods are a good approach to
determine which factors or combination of factors maps are taken role to occur landslides. Some cases, the
simulated performance and success rate of weight of evidence methods is very high compare to other
approach (Pradhan et al., 2010). However, the approach may be less useful on the site-specific scale, where
local geological and geographic heterogeneities may prevail.
On the other hand, in multivariate data driven statistical methods, the combined relationship between a
dependent variable (landslide occurrence) and a series of independent variables (landslides controlling
Knowledge based
Direct Method
- Geomorphological
hazards maps
Indirect Method
- Boolean logic
- Fuzzy logic
- Multiclass overlay
- Spatial multi criteria
evaluation
Data Driven
Bivariate statistics
- Weight of evidence
- Frequency ratio
- Information value etc.
Multivariate statistics
- Logistic regression
- Discriminant analysis
- Cluster analysis
Artificial Neural Networks
Physically based model
Static methods
- Infinite slope model
- Profile-based
- 3-D models
Dynamic methods
- Rainfall/slope hydrology
- Seismic acceleration
Quantitative Methods (Indirect) Qualitative Methods

Development of a direct method for local scale post-earthquake multi-hazards susceptibility assessment
8
factors) is evaluated (Corominas et al., 2014; Santacana et al., 2003). The presence and absence of landslides
for all factors in sample units are calculated. The calculated results are then analysed either by logistic
regression, multiple regression or by discriminant analysis. Logistic regression estimates the probability of
a certain event occurring by forming a regression relation between a dependent variable and several
independent variables. The main advantage is that, an appropriate link function is added to the usual linear
regression model to make the variables either continuous or discrete, or any combination of both types (Bai
et al., 2010). Considering working in GIS environment, statistical analysis cannot performed quickly and
easily in logistic regression model. It requires conversion of the data to ASCII or other format to be used in
the statistical package, and later reconversion to incorporate it into the GIS database. Additionally, multiple
logistic regression allows one to form a multivariate regression relation between a dependent variable and
several independent variables. Using the multivariate logistic regression method, the spatial relationship
between landslide-occurrence location and landslide-related factors can be calculated (B Pradhan, 2010b).
Data driven artificial neural network (ANN) is consisted of a set of nodes and a number of interconnected
processing elements for landslides hazard assessment. In landslide studies, commonly used input neurons
are landslides occurring different factors (i.e. elevation, slope angle, slope aspect, plan curvature, distance to
drainage, geology, rainfall etc.) in networks. The neurons imply conditioning factors, and their selection can
also influence the accuracy of the landslide susceptibility maps (Dou et al., 2015). As ANN can process
input data at varied measurement scales and units, such as continuous, categorical and binary data, it is one
of preferable approaches for landslide susceptibility assessment mapping (Zare et al., 2013).
2.2.2 Physically based modelling approach
Physically based landslides susceptibility assessment methods are based on modelling of slope failure
process. By using slope stability model, slope failure analysis could be a good approach to develop landslides
susceptibility specially in large area (Nicholson & Namekar, 2013). Alternately, by using infinite slope model,
physically based models are used mainly for shallow landslides (less than a few meters in depth) analysis at
local scale. Different triggering factors such as earthquake or rainfall plays an important role to occur shallow
landslides. As example, by using Stability INdex MAPping (SINMAP) physically based model, post-
earthquake slope stability can be assessed under different rainfall scenarios (Yang et al., 2015). It shows that
an increase rainfall intensity results in a significant increase of unstable area which was carried out based
on regional scale. Actually, the model parameters are needed to be calibrated to reflect the significant
influence of triggering factors and geological settings. However, comparison between different physically
based models is important for other researchers to enhance the quality & reliability of each approach as well
as to achieve specific goal of the most appropriate approach could be identified (Zizioli et al., 2013). In this
comparison study, four models; SINMAP, SHALSTAB, TRIGRS and SLIP model were used. The
comparison showed that SHALSTAB gave the spatial distribution of critical rainfall intensity which
determined the potential for shallow landslide initiation and SLIP model had the facility of time-varying
stability analysis on territory scale with very low time-consuming computation.
In some cases, combination of models such as landslides initiation, local geomorphological mobilization
criteria for selecting debris-flow initiation points and simulation of transport & propagation debris flow
could be useful for post-earthquake hazards analysis. As couple model, Park et al. (2016) used TRIGRS
model as landsides initiation and empirical Flow-R model to simulation of debris flow runout. This couple
model results show that debris-flow modelling provides a susceptibility map at regional scale and it allows
fast computation. It also suggests that if it is parameterized and calibrated for local conditions, it would
provide a powerful tool for decision making planning and disaster preparedness. Another coupled model;
STARWARS+PROBSTAB has evidence of better performance for assessing spatio-temporal probabilities
of shallow landslides initiation compare to other physically based models (Kuriakose, 2010). Although,

Development of a direct method for local scale post-earthquake multi-hazards susceptibility assessment
9
STARWARS+PROBSTAB is couple model, it is only used for soil water model and slope stability model,
i.e. only used for landslides initiation model. Rather, all most all cases, physically based models are used to
assess only one type of hazard.
Basically, most of the physically based models are dynamic, therefore, they can address the spatial and
temporal variation of landslides initiation. Even, with having incomplete landslides inventory, physically
based models are also used for slope instability analysis of landslides occurring. The parameters used in these
models are most often measureable and are considered state variables that have unique value at a given space
and time. Therefore, they have higher predictive capability and are the most suitable for quantitatively
assessing the influences of individual parameters of landslides initiation (Corominas et al., 2014). However,
physically based models have degree of simplification involvement and it requires a large number of
trustworthy data to get convincing model outputs.
2.2.3 Knowledge driven approach
In general, knowledge driven approach is qualitative approach which are carried out by two methods; direct
and indirect. The main idea of knowledge based approach for landslides hazard assessment is to realise the
relationship between landslides susceptibility and the influencing factors for a certain area directly from field
by expert geomorphologists. Then the idea of these relationship is applied to other area for landslides hazard
assessment. In direct method, the experts interpret the susceptibility of the terrain directly from field, based
on the observed phenomena and the geomorphological & geological setting. Alternately, the landslides
susceptibility can be evolved from details geomorphological map in office by the experts. In this direct
method, no extensive GIS modelling is used while it is only used as a tool of preparing final map (Corominas
et al., 2014). Knowledge based approach can also be used indirectly for landslides hazard assessment by
considering different factor maps in GIS. From expert knowledge, different factor maps are considered with
different weights to assess landslides hazard map. The most commonly used knowledge based indirect
methods are Fuzzy logic, Multiclass overlay, Boolean logic, Spatial Multi Criteria Evaluation (SMCE).
In Fuzzy logic knowledge based approach, the expert knowledge of the complicated nonlinear relationships
between landslides susceptibility and predisposing factors is extracted under fuzzy logic and represented as
a set of fuzzy membership functions. A crisp set range (0, 1) has either membership value of 1 or non-
membership value of 0, whereas a fuzzy set has continuous membership in the range (0, 1). The fuzzy logic
method allows for more flexible combinations of weighted maps, and could be readily implemented with a
GIS modelling language. According to Zhu et al. (2014), it consists of three generic steps: (i) extraction of
knowledge on the relationship between landslide susceptibility and predisposing factors from domain
experts, (ii) characterization of predisposing factors using GIS techniques, and (iii) prediction of landslides
susceptibility under fuzzy logic. The fuzzy set theory has been also used to handle the complex sets of
predisposing factors for landslides hazard assessment. It employs the idea of a membership function that
expresses the degree of membership with respect to some attribute of interest. It can be used with data from
any measurement scale (nominal, ordinal, interval or ratio) and the weighting of evidence is controlled
entirely by the expert (B Pradhan, 2010a). Fuzzy membership function weights can be determined
subjectively or objectively. Membership function can be assigned quantitatively by using frequency ratio of
landslides inventory and landslide factors. Landslide frequency ratio can be calculated by ratio of percent
domain of a factor class and percent landslide in that class (Kumar & Anbalagan, 2015; Pradhan, 2010b;
Poudyal et al., 2010). Frequency ratio method for determination of fuzzy membership value reduces
subjectivity in the model.
On the other hand, Spatial Multi Criteria Evaluation is also used as knowledge based indirect approach for
landslides susceptibility analysis. GIS based SMCE approach is used to detect the most likelihood areas of

Development of a direct method for local scale post-earthquake multi-hazards susceptibility assessment
10
landslides susceptibility using a number of factors (Van Westen et al., 2010; Pourghasemi et al., 2014). It is
a technique for decision making, where the input consists of a set of indicator maps is considered as the
spatial representation of the criteria, which are grouped, standardized and weighted in a criteria tree. The
main characteristic of SMCE method is that there are no rules in designing and organizing the criteria tree,
in the assignment of the weights, or in the normalization process. Also it is a very flexible tool that can be
applied in many cases with very different data sets, even in poor data conditions. It has also advantages to
use different measurement scales of indicator maps with standardized from 0 to 1 using different
standardization process (Abella & Van Westen, 2007). At the same time, constraint indicator maps can also
be used in SMCE for hazard analysis. Though the standardization of factor maps is considered based on
experts knowledge, frequency ratio analysis could be a guidance to the actual standardization (Gaprindashvili
& Van Westen, 2015).
2.3 Decision tree approach for hazards assessment
Another approach of hazards analysis is decision tree/event tree method which is a technique for finding
and describing structural patterns in data as tree structures. A decision tree does not require the relationship
between all the input variables and an objective variable in advance. This approach is primarily used to
achieve a more concise and vibrant representation of the relationship between an objective variable and
explanatory variables (Saito et al., 2009). The decision tree is based on a multistage tree structure which is
composed of a root node, a set of internal nodes, and a set of terminal nodes. Each node of the decision-
tree structure makes a binary decision that separates either one class or some of the classes from the
remaining classes. The processing is carried out by moving forward the tree until the terminal node is
reached. However, it is observed that decision tree approach is widely used with complex technical analysis
in GIS environment including statistical analysis of different predisposing factors in a tree structure for
landslides hazard assessment (Kirschbaum et al., 2015; Poudyal, 2013; Saito et al., 2009). As example, a
binary based decision tree by using pixel-by-pixel calculation in GIS environment with three factors;
susceptibility index (SI), antecedent rainfall index (ARI) and daily rainfall (RF) is applied for rainfall triggered
landslides hazard assessment in regional scale (Kirschbaum et al., 2015). The decision tree was formed as
three tier where different threshold values were assigned at different intermediate nodes to step forward to
different branches in the tree as shown in Figure 2.2. It is noted that prior to hazard assessment, landslides
susceptibility index map is required in this decision tree.
Decision tree approach may also be used with decision tree algorithm statistical software (e.g. PASW:
Predictive Analysis SoftWare) for landslides susceptibility analysis where large datasets are classified to make
partition a set of given entities into smaller classes (Poudyal, 2013). PASW uses the decision tree analysis
model QUEST (Quick, Unbiased, Efficient, and Statistical Tree) algorithm. In this model different potential
factors of historical events are statistically analysed to set the threshold value at different intermediate nodes.
Each factor data are derived in GIS environment and introduce those in PASW for statistical analysis. The
software analyse the factors data in its own tree-structured classification algorithm that yields the landslide
susceptibility values of each pixel. After that the landslide susceptibility map is produced with the help of
predicted numerical values of each pixel on the map.

Development of a direct method for local scale post-earthquake multi-hazards susceptibility assessment
11
Figure 2.2: An example of decision tree which was used for evaluating potential landslide activity in Landslide Hazard Assessment for Situational Awareness (LHASA) model in Central America & the Caribbean (Kirschbaum et al., 2015).
It has been realized that all those decision tree are framed based on data driven approach which is also an
indirect methods for hazards analysis. In addition, all cases it was applied considering one type of hazards
at regional or national scale. As the approaches depend on historical information which is less useful after
the occurrence of a major event, such as an earthquake. Besides, they would lead to unacceptable levels of
generalization, as the analysis is done based on general causal factor maps considering large area. On the
hand, at large scale hazard analysis location specific factors play the important role for achieving realistic
results. Therefore, in this study, direct knowledge based approach has been applied for location-specific
multi-hazards susceptibility analysis by using a decision tree method directly in the field together with pre
analysed geospatial data.
2.4 Terrain unit mapping
Landform is a specific geomorphic feature on the surface of the earth, ranging from large-scale features
such as plains, plateaus, and mountains to minor features such as hills, valleys, and alluvial fans whereas
terrain is the vertical and horizontal dimension of land surface. Land surface segmentation is the process
to distinguish segments (elements) that are homogeneous in genetically and also morphologically.
Geomorphological theory defines genetically and geometrically pure geomorphic individuals; landforms
(such as alluvial fans, aeolian dunes and glacial cirques) and elements (such as cliffs, floors, slip faces and
channels). Land surface segmentation is the process to identify these.
The process of land surface segmentation arises from a theoretical concept of geomorphic or terrain units.
Both the interior properties of ideal units and the character of their boundaries have a crucial role in defining
the units. According to (Guzzetti et al., (1999), the terrain units are “based on the observation that in natural
environments the interrelations between materials, forms and processes result in boundaries which
frequently reflect geomorphological and geological differences”. In traditional geomorphological mapping,
all morphogenetic relevant characteristics of landscape (character of ground, soil, surface material, and
drainage) are included in the process of segmentation (Minar & Evans, 2008). GIS and available high
resolution remote sensing data such as satellite image, aerial photos, DEM has led to the recent revolution

Development of a direct method for local scale post-earthquake multi-hazards susceptibility assessment
12
of mapping method. Although the availability of high resolution information, field observation and
subsequent mapping allows the most direct way to know the land surface and enables a basis for terrain
assessment and geomorphological analysis (Otto & Smith, 2013). However, it is very difficult to understand
the overall topography and also time consuming to develop geomorphological map for large area. In this
aspect, advanced remote sensing data and technology are used to analyse the terrain for developing digital
geomorphological units map. Terrain analysis explains the arrangement of the Earth’s surface as well as their
classification based on the surface pattern similarities. Based on DEM, different terrain factors such as slope
gradient, slope aspect, slope curvature, relative relief etc. are calculated in terrain analysis. In landslides
hazard assessment, terrain analysis is most often used specially in mountainous areas as because landslides
susceptibility has good correlation with slope gradient and relative relief (Ghimire, 2011; Dai & Lee, 2001).
Therefore, considering geomorphological aspect, terrain unit mapping is very important for landslides
hazard zoning.
Because of difficulties of accessibility in steep areas, development of detailed geomorphological inventories
are time consuming by direct field survey methods. In addition, such approaches are the restricted
possibilities to update the map and subjectivity in the selection of landscape boundaries. Therefore,
automated or semi-automated terrain unit mapping is promising nowadays. Topographic attributes derived
from digital elevation models and automated terrain analyses are increasingly used for characterizing
geomorphology of an area (van Asselen & Seijmonsbergen, 2006). A hybrid semi-automated approach may
provide acceptable geomorphological unit mapping where Topographic Position Index (TPI) is calculated
automatically and, geomorphological units are prepared by on Screen Image Interpretation (OSII) of satellite
data then TPI and OSII are combined to develop the final units (Rashid et al., 2016).
The invention of LIDAR (LIght Detection And Ranging) derived high resolution Digital Terrain Model
(DTM) offers new potential applications for detailed geomorphological mapping. By using detailed
statistical information derived from this high resolution terrain data and object-oriented classification
approach are positively used to define geomorphological units as an expert driven semi-automated method
(van Asselen & Seijmonsbergen, 2006). In this method, expert knowledge are used to select a training dataset
from the analogue geomorphological map. Therefore, by using this semi-automated method, the identified
geomorphological units are directly linked to morphometric properties, material, surface processes and the
origin of landforms. For analysing high resolution terrain data in object based image analysis, automatically
optimized segmentation and classification parameters give higher accuracy and efficiency in automated
geomorphological mapping (Anders et al., 2011). Although the Lidar information is not widely available due
to high cost, it has opened the area of automated terrain analysis to understand detailed level of landscape
which is revolution in geomorphology (Anders & Seijmonsbergen, 2008).
2.5 Multi-hazards assessment using Google Earth
Google Earth is the most popular virtual globe which provides a powerful visualization tool that makes it
possible for users to gain a deeper understanding of the geospatial and temporal dimensions of a hazard,
before, during, and after it occurs. As a tool of displaying historical natural hazards data google earth enables
a broader audience to discover and use the data, with an improved understanding of the geographic and
temporal distribution of historical hazard events. It is a good visualization tool because it is easy to use,
interactive, and generates high-resolution images as well as 3D view with digital elevation information and
profile.
It is hardly found that google earth is directly used for natural hazards assessment while the basic information
or image are often used in this aspect. As example, google earth has worldwide coverage of high resolution
Development of a direct method for local scale post-earthquake multi-hazards susceptibility assessment
13
and multi-temporal satellite images, combined with DEMs to obtain 3D-views of the terrain has given
opportunity for the identification and mapping of landslide inventory (Sato & Harp, 2009; Lacroix, 2016).
Landslides are identified from high resolution satellite images from it with the help of many attributes,
including colour, tone, mottling (surface roughness), texture and association. Likewise, extend of flood and
debris flow, damaged features due to earthquake can also be identified from high resolution and multi
temporal google image.
In addition, Google Earth allows varied users to collaborate and combine their data on one interface which
broadening the information framework available for disaster management. This collaborative ability enables
users to accomplish more at all stages of disaster management than could be accomplished by an individual
group of users (Elvidge & Tuttle, 2008). Having the powerful tool of geographical context, it can work as
virtual globe to support situation awareness for disaster management (Tomaszewski, 2011). For example, a
natural disaster such as a flood, mudslide, tsunami, or earthquake may quickly affect large numbers of
vulnerable populations. In this aspect, considering time critical situation, virtual globes may be used to
identify and map the affected populations, analyse terrain and transport routes for allocating of relief
supplies, and other resource-based decision making activities.

Development of a direct method for local scale post-earthquake multi-hazards susceptibility assessment
14
3. STUDY AREA AND DATA
3.1 Study Area
The study area lies in the southern part of Rasuwa district in Nepal and is bounded by the latitude 280 1.04´
to 280 10.14´ N and the longitude 850 7.33´ to 850 21.48´ E which is shown as Figure 3.1. The altitude of the
area ranges from 740 m to as high as 4032 m and the total study area is about 194 km2. The topography of
the area is highly dissected and rough, the north-east part has high relief. The area is predominantly rural
with a subsistence farming community. On the other hand, the Langtang National Park which is located at
northern part of Rasuwa, is one of the most popular trekking region in Nepal. This park is connected by a
road from Kathmandu which is continued to Tibetan border. In addition, Trishuli river, which is originated
from Tibetan region, passes through the Rasuwa district.
Figure 3.1: Location map of study area
The district is located in the lesser Himalaya as well as on higher Himalaya. Kuncha group, Nawakot group,
Higher Himalayan Crystalline group and Tertiary Granite are the major stratigraphic units of the region as
shown in geological map (Figure A1-1 of Annex-1). The map and the geological information were collected
from Department of Mines and Geology (DMG), Nepal. The main rock types in the area are Metasandstone,
Phyllite, Schist, Quartzite, Gneiss, Granites etc. The Main Central Thrust (MCT) passes North of Goljung
where the fault plane dips to north and bends towards east from Syaphrubesi and passes eastward of
Dhunche (Dhital, 2015).
After the 25 April, 2015 Gorkha earthquake of Nepal, many minor aftershocks as well as couple of major
aftershocks were also occurred within 20 days which resulting a large numbers of landslides (including rock
fall/rock slides and debris flows) in Rasuwa district. The Langtang area and Trishuli river valley were severely

Development of a direct method for local scale post-earthquake multi-hazards susceptibility assessment
15
affected with these earthquake triggered hazards resulting in devastating damage and killing of people. The
southern part of Rasuwa district which is mainly covered four administrative VDCs (Dandagaun, Ramche,
Dhunche and Haku) has been selected as study area as because after the 25 April, 2015 earthquake, a huge
number of landslides were occurred in this area. Many landslides were also happened along the Trishuli
River valley on both sides of the river in Dandagaum and Haku VDC.
3.2 Data collection
The necessary information and data which were used in this study were collected either by secondary sources
or during field work in study area. The satellite images, before and after 2015 earthquake, were collected
from google earth to prepare homogeneous unit mapping before going to field work. The other ancillary
data such as landslides inventories, DEM, landuse, geology, building, road, drainage data etc. were collected
from different sources which is listed in Table 3.1. During the field work, the initial decision tree of multi-
hazards susceptibility assessment was tested at different locations and the homogeneous unit maps were
modified as well. In addition, the basic information of previous hazards were collected from local people
with discussion in the field.
Table 3.1: List of ancillary data for this study
Data Year Format Scale/
Resolution
Source
Google earth images 2014 and
2015
Digital Raster Google Earth
Digital Elevation Model
a. SRTM b. ALOS
2001
2015
Digital Raster
30x30 m
5x5 m
USGS portal
JAXA
Landslides Inventories
a. Covering country, Nepal
b. Covering Rasuwa District
June 2015
2016
Digital Vector
Digital Vector
Nepal earthquake HDX portal
(dataset is prepared by Durham
University and British
Geological Survey)
Dr. Jianqiang Zhang, Post. Doc
Researcher, ITC, Netherlands
Topographic Map 1992 Hardcopy 1:50000 Department of Survey, Nepal
Contour Line 1992 Digital Vector 40 m
interval
Department of Survey, Nepal
Geological Map 1984 Hardcopy 1:50000 Department of mines and
Geology, Nepal
Land cover 2016 Digital Raster 30x30 m Dr. Jianqiang Zhang, Post. Doc
Researcher, ITC, Netherlands
Administrative boundary 2001 Digital Vector Nepal earthquake HDX portal
Road/Drainage network 2015 Digital Vector Nepal earthquake HDX portal
(OpenStreetMap data)
Buildings footprints 2015 Digital Vector Nepal earthquake HDX portal
(OpenStreetMap data)

Development of a direct method for local scale post-earthquake multi-hazards susceptibility assessment
16
3.3 Landslide Inventory
A landslide inventory is the registered information of past landslides having their characterization and
distribution. Generally, characterization is covered with location site name, geographical location, date of
occurrence, type, state of activity, triggering factors etc. Some inventory may have additional detail
information such as volume, surface dimensions, depth of failure surface, slope geometry, lithological
structure and material properties, landuse, casualties, damage etc. The simplest form of landslides inventory
is landslides mapping. By using satellite images or aerial photos coupled with field survey to collect historical
information on individual landslide events, the inventories are prepared. Nowadays, Google Earth plays
very efficient role to map the landslides events with its high resolution and multi temporal information.
The landslides inventory which was prepared by one of the post-doc researchers of ITC (Dr. Jianqiang
Zhang) for his research purpose was used in this study. This complete inventory was prepared based on
mainly using multi temporal Google Earth images coupled with field survey as well as collected the previous
inventory from other sources which was also prepared based on satellite images and Google Earth. It has
basic characteristic information which includes location, time of occurrence, type (debris slide, debris flow,
earth slide, rock fall), triggering factor (co-seismic and rainfall) etc. For this study, these types of information
of landslides events are adequate for decision tree based hazards analysis. The Figure 3.2 describes about
the landslides inventory of the study area based on different categories of landslides such as debris slides,
debris flows, rockfall, and earth slides. It shows that among the different types, rock fall and debris slides
are very common in this area. On the other hand, Figure 3.3 shows the landslides based on triggering factors
such as rainfall induced and co-seismic landslides. It also shows that a large number landslides were triggered
by earthquake in this area. The collected landslides information was covered within 1992 to 2016 time
period.
Figure 3.2: Landslides inventory of study area based on landslides type

Development of a direct method for local scale post-earthquake multi-hazards susceptibility assessment
17
Figure 3.3: Landslides inventory of study area based on triggering factors
3.4 Digital Elevation Model
Land surface topography is considered an important factor in controlling the ground instabilities especially
in mountainous areas. Usually, landslides are located in hilly terrain where the slope is steep and elevation is
high. Alternatively, gentle topography is free from landslides. Therefore, Digital Elevation Model (DEM) is
the main information to analyse different topographic factors such as elevation, slope gradient, slope aspect,
slope curvature, relative relief for landslides hazard or susceptibility assessment. In this study, freely available
SRTM 30x30m DEM was used for entire study area while ALOS 5x5m high resolution DEM was also used
for a small area which is covered Dandagaun and Mailung area of Rasuwa district as shown in Figure 3.4.
The ALOS DEM was received from JAXA (2016) as a sample DEM of 25 km2 area only.
Figure 3.4: Elevation map covering Dandagaun and Mailung area, showing with (a) 30m DEM (b) 5m DEM
(b) (a)

Development of a direct method for local scale post-earthquake multi-hazards susceptibility assessment
18
Slope gradient is considered as one of the most important triggering factors for landslides. The shear stress
in soil, rock blocks or in other unconsolidated material increases as the slope gradient rises, which makes
the slope prone to failure. In this study, slope gradient was generated from 30m DEM which ranges from
00 to 760. For the decision tree based susceptibility assessment, zoning units were considered primarily based
on slope factor in present study. Because of high elevation and high relative relief as well as landslides prone
area, the slope angles of this study area were classified into following four classes; <150 (Low), 150-350
(Moderate), 350-500 (Steep), and >500 (very steep or cliff). It has been seen that most slopes are in the range
of 200-450 (Figure 3.5b) whereas most of the steep slopes and cliffs are spatially distributed at different
altitudes and mostly near to valley area as shown in Figure 3.5a. The occurrence of landslides is related to
steep slopes, as indicated by the comparison of Figure 3.2 and Figure 3.5.
Figure 3.5: Slope map and histogram of study area based on 30m DEM
Based on the two different DEMs information (5m and 30m), two slope gradient maps were prepared
covering Mailung and Dandagaun area (Figure 3.6). It shows that high resolution one has the more cliff area
(>50 degrees) compare to low resolution slope gradient map. From the plot of histogram of two slope maps,
it has been shown that, although the distribution of slope gradient has the similar pattern, the total number
of pixels of each slope class has much more in finer resolution slope map compare to coarse one. Besides,
the correlation of slope values between two slope maps is too low as showed in Figure 3.7. This indicates
that using these two different resolution slope data in same analysis has possibility to reflect different pattern
of results.
3.5 Land cover Map
Land cover is an important factor for landslide susceptibility assessment as different land cover class has
different impact on the occurrence of the hazards. As example cultivated land affects the slope stability
owing to saturation of covered soil whereas forest makes soil more stable and also regulates continuous
water flow (Karsli et al., 2009). To include the effect of land cover it is important to prepare homogeneous
unit or terrain unit mapping for different land cover classes. In this study, land cover data which was
prepared by one of my colleagues (post-doc researcher), was used for terrain unit mapping. It was prepared
from downloaded post-earthquake (November 2015) high resolution google images by onscreen digitization
and subsequently corrected during field work. The data contains eight classes of land cover information:
forest, bush land, grass land, farmland, barren area, river and urban area.
(b) (a)

Development of a direct method for local scale post-earthquake multi-hazards susceptibility assessment
19
Figure 3.6: Comparison of two slope gradient maps, prepared by using 5m and 30m resolution DEM
Figure 3.7: Correlation of random sampling 1000 point slope gradient values between two slope data
y = 0.3907x + 19.986R² = 0.2665
0.00
10.00
20.00
30.00
40.00
50.00
60.00
70.00
80.00
0.00 10.00 20.00 30.00 40.00 50.00 60.00 70.00 80.00 90.00
Slo
pe
grad
ien
t_30m
Slope gradient_5m
Correlation between different resolution slope data

Development of a direct method for local scale post-earthquake multi-hazards susceptibility assessment
20
However, the urban area was not perfectly digitized from the Google images. Therefore, the building
footprints of OpenStreet map was included in that land cover map to modify the urban area as built-up
area. In this case, 100m buffer area of buildings footprints was considered to make the cluster of built-up
area as because the existing buildings were not too much far from each other. In addition, bush land and
grass land were combined with farmland as a single class to reduce the number of class which was finally
used in automated terrain unit mapping analysis. The prepared land cover map has been shown as Figure
3.8(a) which was finally resampled into 30x30m pixel size. The figure shows that being mountainous region,
maximum area is covered with forest (more than 60% area) (Figure 3.8b) whereas most of the built-up areas
are located together with agricultural land. Although, the built-up area was over estimated in some area such
as close to river, for using this in decision tree approach susceptibility assessment it was practical. As because,
in decision tree approach homogeneous unit of built-up area was primarily considered for multi-hazards
susceptibility assessment.
Figure 3.8: Figure shows (a) land cover with five major classes and (b) bar chart of % area coverage of each land cover class
(a) (b)
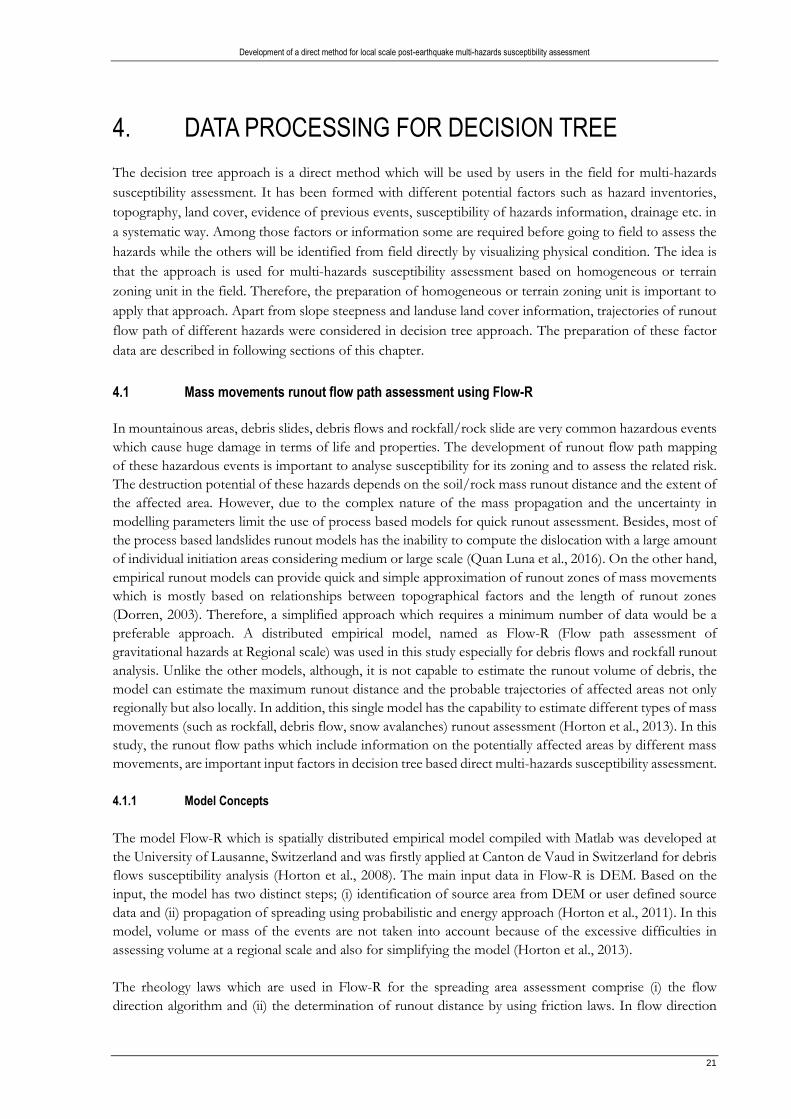
Development of a direct method for local scale post-earthquake multi-hazards susceptibility assessment
21
4. DATA PROCESSING FOR DECISION TREE
The decision tree approach is a direct method which will be used by users in the field for multi-hazards
susceptibility assessment. It has been formed with different potential factors such as hazard inventories,
topography, land cover, evidence of previous events, susceptibility of hazards information, drainage etc. in
a systematic way. Among those factors or information some are required before going to field to assess the
hazards while the others will be identified from field directly by visualizing physical condition. The idea is
that the approach is used for multi-hazards susceptibility assessment based on homogeneous or terrain
zoning unit in the field. Therefore, the preparation of homogeneous or terrain zoning unit is important to
apply that approach. Apart from slope steepness and landuse land cover information, trajectories of runout
flow path of different hazards were considered in decision tree approach. The preparation of these factor
data are described in following sections of this chapter.
4.1 Mass movements runout flow path assessment using Flow-R
In mountainous areas, debris slides, debris flows and rockfall/rock slide are very common hazardous events
which cause huge damage in terms of life and properties. The development of runout flow path mapping
of these hazardous events is important to analyse susceptibility for its zoning and to assess the related risk.
The destruction potential of these hazards depends on the soil/rock mass runout distance and the extent of
the affected area. However, due to the complex nature of the mass propagation and the uncertainty in
modelling parameters limit the use of process based models for quick runout assessment. Besides, most of
the process based landslides runout models has the inability to compute the dislocation with a large amount
of individual initiation areas considering medium or large scale (Quan Luna et al., 2016). On the other hand,
empirical runout models can provide quick and simple approximation of runout zones of mass movements
which is mostly based on relationships between topographical factors and the length of runout zones
(Dorren, 2003). Therefore, a simplified approach which requires a minimum number of data would be a
preferable approach. A distributed empirical model, named as Flow-R (Flow path assessment of
gravitational hazards at Regional scale) was used in this study especially for debris flows and rockfall runout
analysis. Unlike the other models, although, it is not capable to estimate the runout volume of debris, the
model can estimate the maximum runout distance and the probable trajectories of affected areas not only
regionally but also locally. In addition, this single model has the capability to estimate different types of mass
movements (such as rockfall, debris flow, snow avalanches) runout assessment (Horton et al., 2013). In this
study, the runout flow paths which include information on the potentially affected areas by different mass
movements, are important input factors in decision tree based direct multi-hazards susceptibility assessment.
4.1.1 Model Concepts
The model Flow-R which is spatially distributed empirical model compiled with Matlab was developed at
the University of Lausanne, Switzerland and was firstly applied at Canton de Vaud in Switzerland for debris
flows susceptibility analysis (Horton et al., 2008). The main input data in Flow-R is DEM. Based on the
input, the model has two distinct steps; (i) identification of source area from DEM or user defined source
data and (ii) propagation of spreading using probabilistic and energy approach (Horton et al., 2011). In this
model, volume or mass of the events are not taken into account because of the excessive difficulties in
assessing volume at a regional scale and also for simplifying the model (Horton et al., 2013).
The rheology laws which are used in Flow-R for the spreading area assessment comprise (i) the flow
direction algorithm and (ii) the determination of runout distance by using friction laws. In flow direction

Development of a direct method for local scale post-earthquake multi-hazards susceptibility assessment
22
algorithms, flow direction is assigned from one cell to its eight neighbour cells. The conditions in algorithms
are defined in such a way that there is always found at least one cell to run the flow. Several flow direction
algorithms are included in the model where ‘The Holmgren (1994)’ algorithm is very relevant considering
flows. The algorithm adds a parameter to the multiple flow direction to control the divergence of flow by
allowing an exponential factor (x) as shown in Eq. 1 (Horton et al., 2013).
………………………..(1)
In this equation, the parameter i, j are the flow directions, pifd is susceptibility proportion in direction i, tanβi
is slope gradient between the central cell and the cell in direction i, and x is variable exponent. For x =1 the
spreading is similar to multiple flow direction and when it increases, the flow is convergence and it is reduced
to single flow direction when x → ∞.
A persistence function (Eq. 2) is also used in Flow-R model for taking into account the flow inertia (Horton
et al., 2013). It assigns weights to the flow direction with respect to previous direction as shown in Figure
4.1. There are three persistence options inbuilt in the model which are (i) Proportional (ii) Cosine and (iii)
Gamma (2000) as shown in Table 4.1.
…………………………………………………...….(2)
Here, pip is the flow proportion in the direction i according to the persistence, α(i) is the angle between the
previous direction and the direction from central cell to cell i and wα is the weight for the corresponding
change in direction.
Table 4.1: Implemented weightings of persistence functions in the
assessment of spreading (Horton et al., 2013)
Figure 4.1: Illustration of spreading to the neighbour cells (Horton et al., 2013)
To assess the runout distance in Flow-R, energy balance algorithms are used which is based on friction law.
As the source mass is unknown, the energy balance is unitary as shown in Eq. 3 (Horton et al., 2013). As
the processing takes place in each cell, they control the distance reached by the flow and in addition reduce
the divergence.
Eikin = E0
kin + ΔEipot – Ei
f ………………………………………..……(3)
Where Eikin is the kinetic energy at the cell of direction i, E0
kin is the kinetic energy at central cell, ΔEipot is
the change in potential energy to the cell in direction i, Eif is the energy lost in friction to the cell in direction
i. Several algorithms are used to calculate the friction loss among which simplified friction-limited model
(SFLM) is frequently used. In SFLM, the constant friction loss is considered based on minimum travel angle
w0 w45 w90 w135 w180
Proportional 1 0.8 0.4 0 0
Cosine 1 0.707 0 0 0
Gamma(2000) 1.5 1 1 0 0

Development of a direct method for local scale post-earthquake multi-hazards susceptibility assessment
23
or reach angle which is the angle of the line connecting the source area to the most distant point reached by
the flow. The friction loss is assessed based on following Eq. 4.
Efi = gΔx tanɸ ………………………………………………………..(4)
Where Efi is the energy lost by friction from central cell to cell in direction i, Δx is the increment of horizontal
displacement, tanɸ is the gradient of energy line where ɸ is the travel angle and g is the acceleration due to
gravity.
Due to the unrealistic energy amounts reached during the propagation, the SFLM approach may result in
impracticable runout distance in steep slope area. Hence, a maximum velocity limit may be considered to
ensure not to exceed realistic velocities which will keep the energy within reasonable values (Horton et al.,
2008).
4.1.2 Calibration of the model
In this study, Flow-R was used for rockfall and debris flow runout assessment. Initially, the parameters
related to the spreading were calibrated to apply the model for this study. ‘The Holmgren (1994) modified’
flow direction algorithm was used for flow spreading analysis. In this algorithm, the height of central cell
(dh) is increased as because it allows smoothing of DEM roughness and can produce more consisting
spreading, particularly for high resolution DEM (Horton et al., 2013). In this study, dh value was taken 1.0
meter and the exponent (x) was taken 4 as suggested by Horton et al., (2013). The 2015 co-seismic rockfalls
were used as known sources and 5m ALOS DEM was used for spreading the flow, in the area of Mailung.
As the model does not consider the rockfall volume, only the arc part of each rockfall sources were digitized
as polyline (Figure 4.2). As shown in figure, other type of landslides were also existed in this areas which
were not as the sources of rockfall and also those were not triggered by 2015 earthquake.
Figure 4.2: Co-seismic rockfall sources of Dandagaun and Mailung area

Development of a direct method for local scale post-earthquake multi-hazards susceptibility assessment
24
These polyline sources were converted to raster format and then finally converted to ASCII format as the
suitable GIS environment in Flow-R is ASCII format. The DEM data was also converted to this format and
runout spreading was performed based on this. Basically, two spreading parameters were calibrated; (i)
travel angle (ɸ) and (ii) maximum velocity (Vmax) to limit the energy. By using the known sources rockfall
runout assessment, model was run in the area of Mailung considering different travel angle (300, 400 and
500) and maximum velocity (15 m/s, 30m/s, 40m/s and 50m/s) which has been shown in Figure 4.3. It
shows, the rockfall runout potential trajectories where different colours indicate the different range of
probability of each runout path. In addition, the observed co-seismic rockfall was overlaid on potential
runout paths. From the different alternatives, it has been seen that the potential runout flow paths with
ɸ=400 and Vmax=30m/s are quite similar with observed rockfall compared to other alternatives. Therefore,
these calibrated parameters were used to rockfall runout assessment for the entire study area. 4.1.3 Rockfall runout analysis
After the calibration of the parameters of Flow-R, a rockfall runout flow paths assessment was performed
for the study area. As the DEM and the location of the rockfall sources are the most important input data
for runout assessment, initially the area which is covered by high resolution (5m ALOS) DEM was taken
into account for rockfall runout assessment. To do that rockfall sources were identified as the area which
have higher than 600 slope gradient as because the study area is very steep while considering 5m DEM. GIS
analysis was performed in ArcGIS to calculate >600 slope area which is shown as Figure 4.4a. It shows that
a lot of areas are existed with rock cliff which could be the sources of probable rockfall. Using these area as
sources, rockfall runout flow paths were assessed in Flow-R. The calibrated parameter of travel angle (400)
and maximum velocity (30m/s) as well as Horton et al., (2013) suggested ‘dh’ value of modified Holmgren
(1994) flow direction algorithm which was set as 1.0m and the exponent of spreading as 4 were considered
to analyse the rockfall runout flow paths (Figure 4.4b). The model results illustrate that the potential rockfall
runout paths have been covered almost all the area because of too many rockfall sources.
In this regard, in next step the area which has greater than 700 of slope steepness was considered as potential
rockfall sources (Figure 4.5a). It is realized that the most areas are not located at higher altitudes, instead
they are located just above the valley. The rockfall runout spreading assessment was then performed taking
the same parameters as it was considered for the >600 slope steepness sources areas. The runout results
show the spreading areas of all sources which are combined by keeping the maximum probability values
(Figure 4.5b). This illustrates, the total area exposed to rockfall spreading, with an associated probability
which provides a measure of the runout potential. The area with red colour has a higher probability (50%-
100%) to be reached by a rockfall than orange one (15%-50%) whereas the probability of yellow areas is
<15%. The green colour represents the existing buildings/houses location. We can see some buildings are
located within the rockfall runout paths specially those which are located at valley areas.
On the other hand, considering the entire study area 30m DEM was used for rockfall runout assessment. It
has been seen that, if the source areas are considered as slope steepness>600, it has very less area comparing
with 5m DEM (Table 4.2). Notably this comparison was made at Mailung area where both the dataset were
available. Therefore, the potential rockfall source area was identified as the area having >500 (as classified
as cliff in this study) slope steepness considering 30m DEM. Keeping the all spreading parameters as those
were in previous case, these potential sources were used in Flow-R for rockfall runout flow path assessment
covering the entire study area (Figure 4.6).
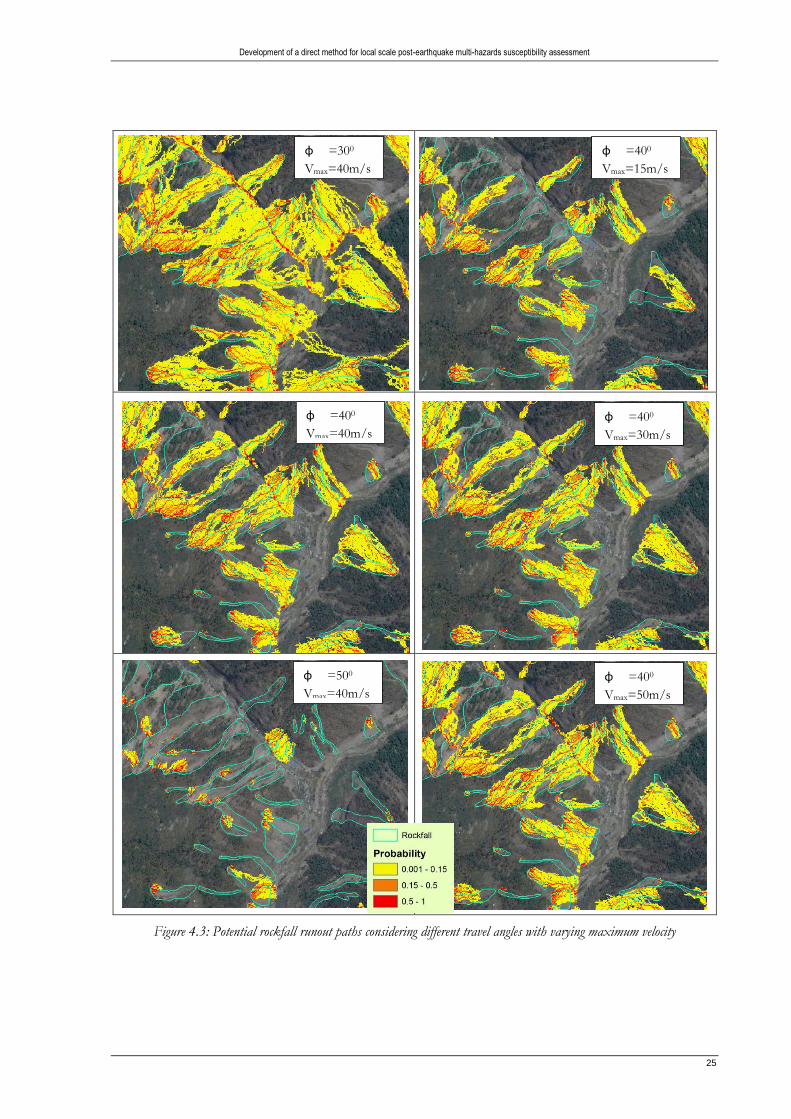
Development of a direct method for local scale post-earthquake multi-hazards susceptibility assessment
25
Figure 4.3: Potential rockfall runout paths considering different travel angles with varying maximum velocity
ɸ =300
Vmax=40m/s
ɸ =400
Vmax=40m/s
ɸ =500
Vmax=40m/s
ɸ =400
Vmax=50m/s
ɸ =400
Vmax=15m/s
ɸ =400
Vmax=30m/s

Development of a direct method for local scale post-earthquake multi-hazards susceptibility assessment
26
Figure 4.4: Potential (a) rockfall sources considering slope>600 and (b) runout spreading using the 5m DEM
Figure 4.5: Identification of (a) potential rockfall sources in area with slope gradient >70 degree (b) runout spreading by using 5m DEM
Table 4.2: Comparison of potential rockfall source areas having slope steepness>600
DEM Sources area having slope angle>60 degree
No. of Pixel Area(m2) Comparison
5m resolution 115911 2897775 Coarse one contains only 23% source area of high
resolution one
30m resolution 749 674100
(a) (b)
(a) (b)

Development of a direct method for local scale post-earthquake multi-hazards susceptibility assessment
27
Figure 4.6: Identification of (a) potential rockfall sources in area with slope gradient >50 degree (b) runout spreading by using 30m DEM
In Flow-R, amongst the input data DEM is the most important one. If it is used to identify the sources as
well as propagation, the results strongly depend on the DEM quality such as resolution and accuracy. As
the slope angle is measured from DEM, it plays the most important role to identify the lower slope cell for
propagation. In this study, DEM was only used for propagation. As a case study at Dandagaun and Mailung
area, 30m and 5m DEM were used to compare the rockfall propagation results based on known co-seismic
rock slides sources. Figure 4.7 shows rockfall potential propagation routes are more refine or as a form of
channelized in case of using of higher resolution DEM. By using the 30m one, potential runout spreads
larger area because of coarser pixel size which resulting less accurate results in some places (Figure 4.7b). As
example, at blue circle marked area, it is showed that the buildings are safe from rockfall spreading in case
of using 5m DEM whereas in coarse resolution they are not safe. Therefore, it is important to interpret the
results when modelling is performed with very coarse DEM as because it is likely to represent overestimated
spreading.
Figure 4.7: Spreading probability of rock slides runout at Mailung area using (a) 5m ALOS and (b) 30m SRTM DEM
(a) (b)
(a) (b)
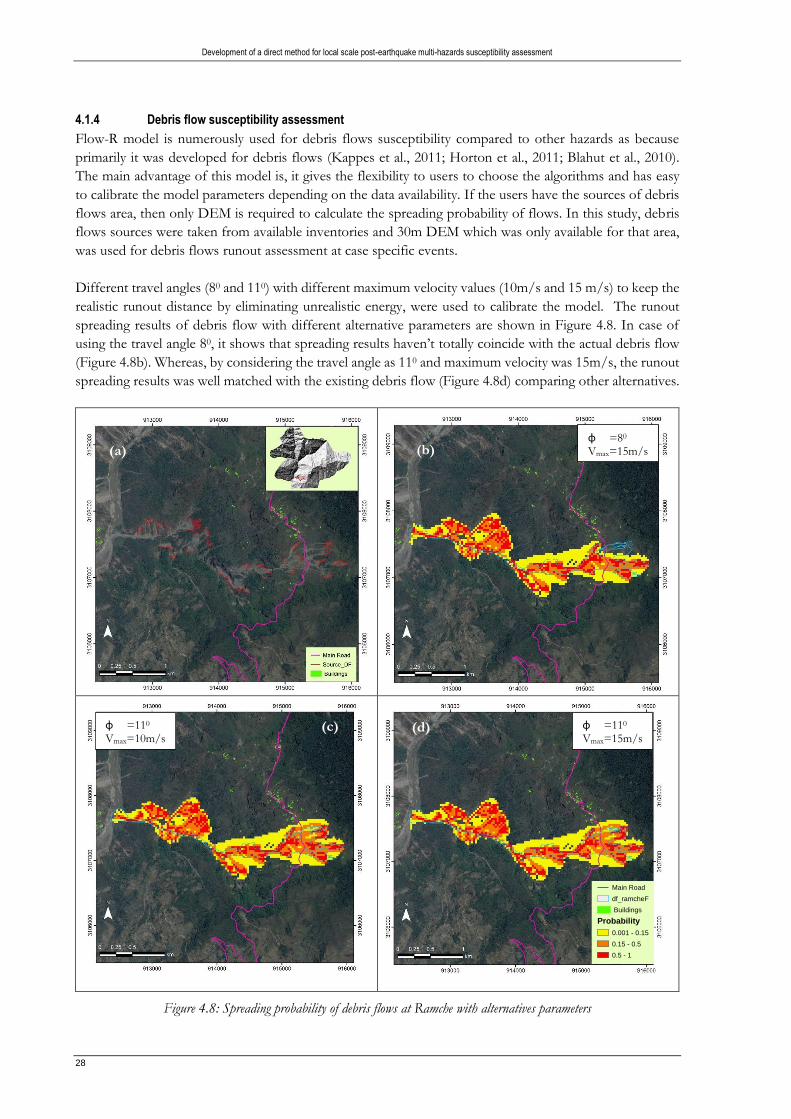
Development of a direct method for local scale post-earthquake multi-hazards susceptibility assessment
28
4.1.4 Debris flow susceptibility assessment
Flow-R model is numerously used for debris flows susceptibility compared to other hazards as because
primarily it was developed for debris flows (Kappes et al., 2011; Horton et al., 2011; Blahut et al., 2010).
The main advantage of this model is, it gives the flexibility to users to choose the algorithms and has easy
to calibrate the model parameters depending on the data availability. If the users have the sources of debris
flows area, then only DEM is required to calculate the spreading probability of flows. In this study, debris
flows sources were taken from available inventories and 30m DEM which was only available for that area,
was used for debris flows runout assessment at case specific events.
Different travel angles (80 and 110) with different maximum velocity values (10m/s and 15 m/s) to keep the
realistic runout distance by eliminating unrealistic energy, were used to calibrate the model. The runout
spreading results of debris flow with different alternative parameters are shown in Figure 4.8. In case of
using the travel angle 80, it shows that spreading results haven’t totally coincide with the actual debris flow
(Figure 4.8b). Whereas, by considering the travel angle as 110 and maximum velocity was 15m/s, the runout
spreading results was well matched with the existing debris flow (Figure 4.8d) comparing other alternatives.
Figure 4.8: Spreading probability of debris flows at Ramche with alternatives parameters
(a) ɸ =80 Vmax=15m/s
(b)
ɸ =110 Vmax=10m/s
(c) ɸ =110 Vmax=15m/s
(d)
Main Road
df_ramcheF
Buildings
Probability
0.001 - 0.15
0.15 - 0.5
0.5 - 1

Development of a direct method for local scale post-earthquake multi-hazards susceptibility assessment
29
Besides, the formed fan at the Flow-R simulation coincides spatially with the observed fan in the field, which
also resulted in blockage of the river, after the 2015 earthquake (Figure 4.8d). The runout spreading of higher
probability (red and orange colour) fit well with the existing debris flow (cyan colour) as it was also seen in
field work. Though the houses/buildings are located away from this site, these parts of the road were totally
damaged and it is still exposed to damage due to this debris slide, as well as to a deep sited active landslides
on the same location.
The same model parameters that were calibrated for the Ramche Flow-R debris flow were also used at other
areas such as Thulo Haku, Sano Haku as because both the areas have same type of soil (medium grained)
as found in field work. These areas are located at the northern part of study area where few villages exist
having about 1500 population (according to 2011 census data). There were two big debris slides in that area
which were initially occurred earlier, they were reactivated during the 2015 earthquake and monsoon. The
huge debris materials were carried by the drainage channels to follow the Trishuli river. During the last
monsoon, new debris slides occurred at the Haku area among them one is big one (green circle of Figure
4.9a). This new source was not existed at available Google image, however, it was found in the location at
field work as because it has been created very recent. It was also realized from field experience that this slide
has probability extend to near future. Therefore, considering all these aspects, debris flows runout
assessment was performed at this area using Flow-R in order to assess the potential spreading of the flow.
Figure 4.9: (a) Debris slides inventory and sources of debris flows (b) Spreading probability of debris flows at Haku area
The model results (Figure 4.9b) show that the prediction of debris flows spreading is quite convincing
compared to the actual situation. The predicted runout of debris from the new source follows the existing
gully, which indicates that the results are realistic. It is also seen that the villages are within the debris flows
spreading zones with different ranges of probability in which Sano Haku (located within 15%-50%
probability) is more susceptible compared to Thulo Haku and Haku Besi. However, overall spreading
pattern is not refine enough because of course resolution DEM. In order to investigate in more detail the
potential of Thulo Haku and Haku Besi being affected by the debris flow, a more detailed analysis is
required, taking into account local terrain parameters and a DEM of better resolution.
(b)
Thulo Haku Haku Besi
Sanu Haku
(a)

Development of a direct method for local scale post-earthquake multi-hazards susceptibility assessment
30
4.1.5 Uses of model outputs in Decision Tree based multi-hazards susceptibility analysis
In the decision tree approach, based on individual homogenous/terrain unit multi-hazards susceptibility will
be assessed. In this approach, different factors will be used among which mass movement runout flow paths
map is an important one. Therefore, Flow-R model results are able to provide the runout flow paths of
rockfall and debris flow. The unit which is located on the path of rockfall or debris flows runout has a higher
class of susceptibility compare to the area which is not located in the runout zone.
As example, the debris flows runout results which were performed at Haku area are shown in Figure 4.10
together with terrain unit. It illustrates that the units with marked 1 are not susceptible of debris flows runout
while the units with marked 2 are susceptible and they have different probability of spreading runout.
However, it is always important to delineate the terrain unit or homogenous zones properly.
Figure 4.10: Effect of debris flows susceptibility results in terrain unit at Haku area
4.2 Terrain unit mapping
Terrain units are the base of the land-system classification approach which is normally based on
geomorphological and geological differences. In natural environment, the inter relation of materials forms
and processes results the boundaries of different units. Therefore, detailed information of topography,
geology and geomorphology are very important for preparing the terrain unit mapping of an area. In this
study, topographic information (slope from 30m DEM), land cover data, Google Earth and its 3D oblique
view were used to prepare the terrain unit mapping.
4.2.1 Manually interpreted terrain unit
The meaning of manual (subjective) terrain unit mapping is a process to delineate the boundary of each unit
based on available information and knowledge judgement by manually. Careful image interpretation is very
1
2
2
2 2
2
2 2 2
2 2 2
2
1
2
2
1
1
Debris flows runout map

Development of a direct method for local scale post-earthquake multi-hazards susceptibility assessment
31
important for subjective terrain mapping. There are two approach for preparing the units for assessing
hazards or susceptibility; (i) terrain zone unit (ii) exposed elements based homogenous unit (Figure 4.11). In
first approach topographical factors as well as geology and geomorphology are considered to delineate the
boundary of units covering a given area whereas in the second approach the focus is on the exposed
elements. As example, in Figure 4.11(a), it has been showed two units which were made based on different
exposed buildings. Although, both units have the almost same slope steepness, the ID 01 unit doesn’t
located at the rockfall flow path whereas, unit 02 is located just on the rockfall runout flow path as it was
observed in the field work. Therefore, in exposed elements base homogeneous unit approach, the detailed
topographic information of each exposed element (i.e. each building) and it’s surrounded physical condition
is required to boundary the units which cost local level detailed data as well as time. Overall experts’ level
geomorphological knowledge and trainings are required to do that. On the other hand, in case of terrain
zoning unit approach the units are separated based on slope class, aspect, land cover, river/drainage as
shown in Figure 4.11(b). As example, unit 02 and unit 10 are located at same slope class and have same type
land cover, however, they have different aspect whereas, unit 01 and 03 are rivers.
Figure 4.11: Illustrations of different approaches for homogenous units (a) exposure based and (b) terrain based
In this study, manually mapped terrain zoning units were prepared before going to field work. To do that,
high resolution multiple images with dated November 2015 were downloaded from Google Earth covering
the study area. It was also ensured that terrain effect was checked off before downloading the images. Those
images were merged and georeferenced in ArcGIS to prepare as base image for image interpretation. Using
30m DEM and georeferenced image, stereo images were prepared for 3D viewing with anaglyph in an open
source software ILWIS (Integrated Land and Water Information System). Additionally, slope map was
prepared from DEM and displayed in transperent on georeferenced map to understand the terrain effect
and land cover information was considered from Google images. However, geological map was not too
effective as because it has only one class geology covering the entire study due to its coarse resolution.
The boundaries of units were digitized from google image at 1:3000 to 1:5000 scale and given them with
unique codes (Figure 4.12). It shows that some terrain zoning units are too coarse compare to other units.
As because, to delineate the boundary primarily built-up area was considered. Other than built-up area such
as forests or agriculture, the units were not bounded as small units although multiple gullies were existed.
In addition, terrain units map did not cover the entire study area, concentration was only given at field work
sites where the decision tree was tested. Moreover, the terrain unit maps were updated during field work.
(a)
01
02
Exposure based
02
01
03
04
05 06
07
08
09 10
11
12
(b)
Terrain based

Development of a direct method for local scale post-earthquake multi-hazards susceptibility assessment
32
Figure 4.12: Manual terrain units mapping of a part of study area
4.2.2 Automated Terrain unit mapping
Among all information for developing the automated terrain unit mapping, topographic information of the
area is the main aspect. Different topographic information such as slope gradient, slope aspect or slope
curvature are used for terrain analysis (van Asselen & Seijmonsbergen, 2006). In addition, other information
such as geomorphology, geology, landuse etc. are also used together with topographic information to
delineate terrain boundaries. In this study, slope gradient, land cover, runout flow paths of rockfall & debris
flow and landslides inventory were used to develop automated terrain unit. The basic information of these
data are given as Table 4.3.
Table 4.3: List of data which were used in automated terrain mapping analysis
Data Source/Preparation
Slope gradient Prepared from 30m SRTM DEM (considering
entire study area)
Land cover Map Prepared from Google Earth image by screen
digitizing together with OpenStreet road and
buildings data
Rockfall and Debris runout zones Results from Flow-R modelling, reclassified into a
binary map (1=runout, 0= no runout)
Landslides inventories Prepared from multi temporal Google Earth
images by screen digitization
(collected from Post-doc colleague)
The overall methodology of preparing the terrain unit map is shown as Figure 4.13. Initially, four factor
maps (Figure 4.14) which were used in terrain mapping analysis were prepared as described below.
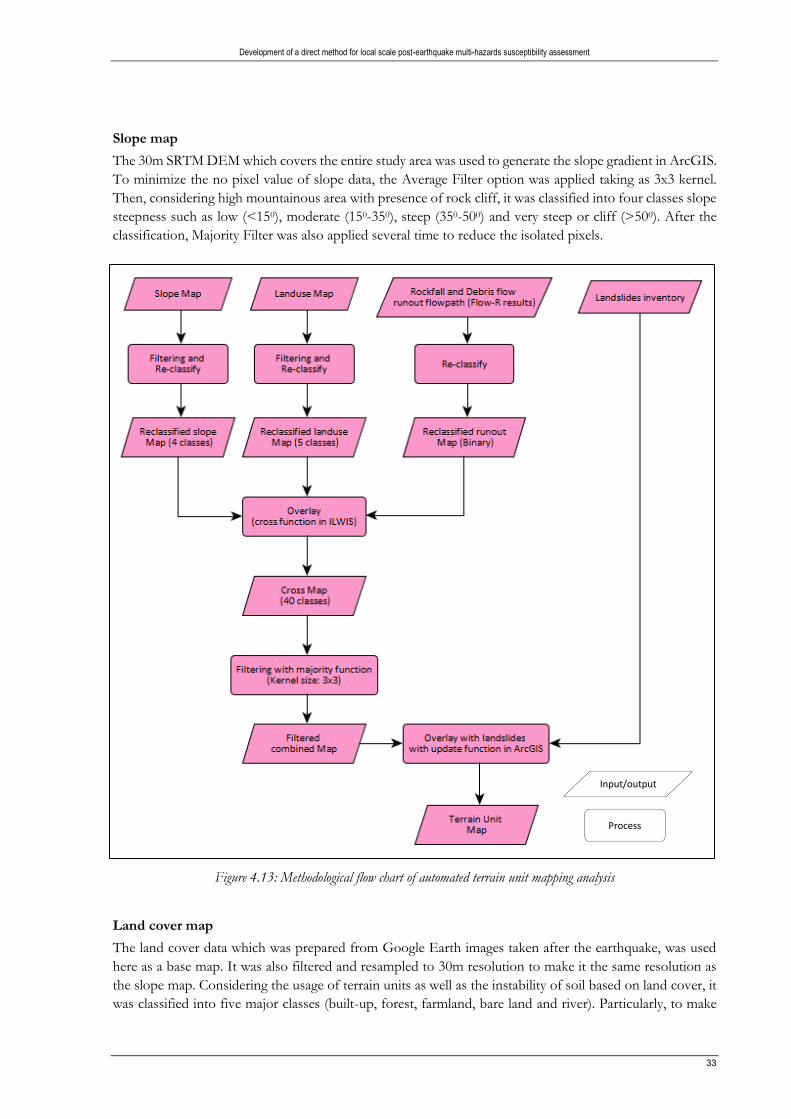
Development of a direct method for local scale post-earthquake multi-hazards susceptibility assessment
33
Slope map
The 30m SRTM DEM which covers the entire study area was used to generate the slope gradient in ArcGIS.
To minimize the no pixel value of slope data, the Average Filter option was applied taking as 3x3 kernel.
Then, considering high mountainous area with presence of rock cliff, it was classified into four classes slope
steepness such as low (<150), moderate (150-350), steep (350-500) and very steep or cliff (>500). After the
classification, Majority Filter was also applied several time to reduce the isolated pixels.
Figure 4.13: Methodological flow chart of automated terrain unit mapping analysis
Land cover map
The land cover data which was prepared from Google Earth images taken after the earthquake, was used
here as a base map. It was also filtered and resampled to 30m resolution to make it the same resolution as
the slope map. Considering the usage of terrain units as well as the instability of soil based on land cover, it
was classified into five major classes (built-up, forest, farmland, bare land and river). Particularly, to make
Input/output
Process

Development of a direct method for local scale post-earthquake multi-hazards susceptibility assessment
34
built-up class OpenStreet building footprints were considered. For this reason, 100m buffer area of building
footprints was considered to make the cluster of built-up area as because the existing buildings are not too
much far from each other. On the other hand, the road class was not separated in land cover data whereas
it was considered as separate exposure element to hazards. Likewise, homogeneous road segment units have
been analysed separately which will be described in section 4.6.
Rockfall and Debris flows runout flow path map
By using the Flow-R model, the rockfall runout was assessed for the study area considering the 30m DEM.
Debris flow runout flow paths were also assessed where the sources were identified from the landslide
inventory mapped from Google images as well as from field experiences (see section 4.1.3 and 4.1.4). For
the automated terrain analysis, both the rockfall and debris flow runout paths were merged and then
reclassify as binary map where 1 means presence of rockfall/debris runout and 0 means not presence any
runout.
Figure 4.14: The factor maps which were used in terrain units mapping analysis
Landslide inventory map
The high resolution landslides inventory which was prepared from multi temporal Google Earth images was
used in the automated terrain mapping analysis. The basic information of landslides such as types, time and
triggering factors are existing in this inventory. In addition, each landslide event has it’s unique ID in this
inventory, therefore, specific attribute information of each landslide polygon are ensured to keep in terrain
unit map.
Runout flow paths Map
Slope gradient Map Land cover Map
Landslide inventory Map

Development of a direct method for local scale post-earthquake multi-hazards susceptibility assessment
35
After preparing the factor maps, slope, landuse and runout flow path maps were overlaid to make a
combined map by using Cross operation in ILWIS. Different combination of all the classes of three factor
maps were created in which contained all together 40 classes were existed. This combined map was then
filtered several times by using a Majority filter in a 3x3 kernel to merge the isolated pixel/pixels with their
neighbour class. After that, it was converted to vector format as a polygon map and it was then combined
with the landslide inventory map, so that the final polygon map was either a combination of slope class/land
cover/and runout classes or a landslide polygon. However, after eliminating the isolated classes and
combining the landslides information, the terrain unit map was prepared which contains altogether
combined 34 classes and the individual landslide polygon as showed in Figure 4.15. The final combined map
has thousands of polygons where each polygon represents one terrain unit with having identical class.
Figure 4.15: Automated terrain units map of study area
Figure 4.15 shows that some units are too small in size compare to others as because, near the valley area
different classes slope gradient are existed which resulting multiple terrain unit although it has same class of
land cover. In this study total 2462 terrain units are generated based on the above mention automated
analysis among which landslides has 539 units (polygons) with their identical attributes. Among the different
classes of units, the maximum area is covered by the unit class which has moderate slope steepness, forest
land cover and no runout paths (Annex-2). It also shows that among the different classes of built-up area,
the built-up units having moderate slope have the large percentage of area. Besides, considering the average
size of each class terrain unit, unit having forest land cover has the larger size unit even in almost all slope
steepness classes (table of Annex-2).
In the automated terrain unit map, each unit has a unique ID as well as the information of slope steepness,
landuse type and the rockfall/debris flow runout flow path. In case of landslide unit, it has the basic
information such as type, time, triggering factor etc. By using the ‘Identifier feature tool’ in ArcGIS, the
attribute information of automated each terrain unit are easily identifiable (Figure 4.16). Therefore, the using
of this type terrain unit map will be very supportive in direct method multi-hazards susceptibility assessment.
Terrain unit Map

Development of a direct method for local scale post-earthquake multi-hazards susceptibility assessment
36
As because, in the proposed direct approach, considering different factor, users need to assess one
location/unit for multi-hazards susceptibility assessment directly from field. This type of detailed map or
information will guide the users to move forward to assess the susceptibility of hazards step by step as
elaborately described in the proposed decision tree approach (see section 5.4).
Figure 4.16: Attribute information of selected automated terrain unit (a) other than landslide unit and (b) landslide unit
Additionally, if a Web-GIS app is prepared based on the proposed decision tree, the automated terrain unit
will be preloaded to the app so that user can directly access to the layer to know the unit information. (For
detail see section 7.3). However, it is mostly depended on the perfection of boundary delineation of units.
The manual terrain units which were prepared for this study, were compared with this automated terrain
units (Figure 4.17).
(a)
(b)

Development of a direct method for local scale post-earthquake multi-hazards susceptibility assessment
37
Figure 4.17: Interpretation between automated terrain unit and manually mapped terrain unit
In this study, for preparing the manually mapped terrain units, mostly built-up area was taken into account
to delineate the unit. Different classes of slope steepness, slope aspect (from 3D oblique view of Google
Earth) and presence of gullies were considered to boundary the units. As a results, other than the built-up
area, the terrain units were larger in size as shown in Figure 4.17. By comparing manual and automated
terrain unit map, it has been seen that multiple automated terrain units exist within a single unit of the
manually mapped terrain unit map. In Figure 4.17, two manually mapped units are selected (cyan colour) as
marked 1 and 2. It shows, almost four automated units exist in 1 marked unit whereas seven automated
units exist in the marked 2 unit. Actually, the manual terrain mapping requires detail level geological and
geomorphological information as well as requires specific geomorphological knowledge on terrain
classification, which is not always available and which may differ between individuals. Even, much more
detailed geomorphological information is required in case of exposed based unit mapping. Although the
method might results in better delineated terrain units when done by an expert Geomorphologist with
enough time investment, in practice this will be difficult to guarantee. Therefore, automated terrain unit
approach with a scientific way would be a better approach that can be followed by different persons,
resulting in similar products.
4.3 Homogeneous road segment mapping
Roads are also important element-at-risk to consider next to buildings. Therefore, it is important to assess
the susceptibility of multi-hazards for road segments within hazards prone area. Different road segments
may experience different degree of susceptibility by different hazard types, and therefore the correct
subdivision of the road network into more or less homogenous segments is important. However, in
mountain areas, the road alignment and it’s topology is not as simple as in flat area. Generally, most of road
segments in a mountain region are built in sloping terrain with heterogeneous land cover and geology,
resulting in road cuts, and fills that are not present in any of the input maps. Therefore, an automated
approach of homogeneous road segments is difficult and also required detailed information. In this study
1
2

Development of a direct method for local scale post-earthquake multi-hazards susceptibility assessment
38
area, one major road named as ‘Pasang Lhamu Highway’ passes through the study area and finally connects to
the Tibetan border. From the field visit, it has been realized that many portions of this road were built by
cutting the slope and by crossing landslide zones. Some segments of the road has been severely damaged
due to the 2015 earthquake induced landslides and also has experiences of bad drainage problem (Figure
4.18).
(a) Rock cliffs with open joint
(b) Damaged section due to landslide
(c) Road surface damaged due to bad drainage
(d) Road passes through an active landslide
Figure 4.18: Road condition of some segments of Pasang Lhamu Highway after the 2015 earthquake
Experiencing the actual field condition of the important road, an attempted was taken to perform manually
approach road segments analysis. To avoid the complexity of automated road segment analysis, only a
manual approach was used to generate homogenous road segment. To do that, the results of automated
terrain unit mapping (which has the information of slope steepness, land cover and hazard runout path) was
combined with information on road cuts, drainage and landslides within a 3D oblique view of Google Earth
to digitize the different homogeneous road segments. The road segments are classified into six categories
with unique characteristic as shown in Table 4.4.
Based on the above classification, the Pasang Lhamu Highway was manually segmented by on screen
digitization of Google Earth images (Figure 4.19). It shows that most of the segments don’t have any
disruption from surrounding which has been classified as normal segment. By visualizing the slope map
with road layer, it is observed that this class road segments are located almost within moderate slope
steepness (between 150 – 350) region. Although, this type of road segment doesn’t have any disturbance
from landslides or rockfall or road cuts, the road surface condition is very poor as because most of the parts
blacktop surfaces was damage due to heavy traffic movement.

Development of a direct method for local scale post-earthquake multi-hazards susceptibility assessment
39
Table 4.4: Classification of manual homogeneous road segment
Type of Road segment Criteria
Normal segment Gently slope, no disturbance but have bad surface
condition
Drainage path segment Drainage passes over the segment
Active landslides zone Located at active landslides zone
Debris slide segment Debris runout passes over the segment
Rockfall zone Road segment located below the rock cliff with open
joint
Road cut segment Developed by cutting rock bed slope
Figure 4.19: Manually mapped of road segments of Pasang Lhamu Highway in the study area
On the other hand, some segments are located on the path of previous debris slides path as well as in active
landslides zone which are still in dangerous situation as observed during field work. Improper drainage
makes that side streams simply pass over the road flooding in a couple of section. As the drainage was not
properly taken into consideration during the construction of the road, some segments are being eroded due
to drainage path which resulting dangerous condition of those sections (see photo in Figure 4.18c). From
the field work experiences, 50m buffer area of drainage path has been taken as drainage path road segment.
Some parts of this highway was constructed by cutting hill slope which are located at steep and very steep
slope area. This road segments are classified here as road cut segment. Some segments of the road are
located below the rock cliffs which have the open joint as observed in the field work (photo of Figure 4.18a).
Those parts of road are identified as rockfall zone segment (Figure 4.19). Moreover, all the road segments
have unique ID as well as attributes information (see index map of Figure 4.19). Therefore, based on unique
ID, multi-hazards susceptibility assessment is also possible for road segments in the field by using decision
tree approach.

Development of a direct method for local scale post-earthquake multi-hazards susceptibility assessment
40
5. DEVELOPMENT OF A DECISION TREE MULTI-
HAZARDS SUSCEPTIBILITY ASSESSMENT
In most cases researchers use indirect methods for natural hazards assessment which may be either
quantitatively or qualitatively whereas direct methods are rarely used. Generally, in direct methods
geomorphological maps are converted to a hazard map or several maps are combined into one using
subjective decision rules based on the experience of the earth scientist. Based on the observed indicators of
hazardous phenomena and the geomorphological & geological setting, the experts interpret hazardous
event’s susceptibility directly from the influencing factors in the field. In this study, an effort was done to
develop a direct method for multi-hazards susceptibility assessment in which the causal factors are organized
as a decision tree in a systematic way.
A decision tree is a flow-chart-like hierarchical tree structure which is consisted of decision nodes
corresponding to attributes, branches and leaves. The branches link to the different possible attribute values
and leaves include the objects that typically belong to same class. Such representation help to induce decision
rules that is used to classify the instances. In the tree, the logic is set to find a strong relationship between
input factors and target values in a group of observations that form a data set. When a set of input factors
is identified as having a strong relationship to a target value, then all these factors are considered as leaves
in the decision tree. Qualitative decision is more subjective not just based on the numerical statistical data
but other associated factors that may have some or major influence on the collected data.
Depending on the purpose and users of the decision tree, the structure of the tree would be different. In
this study, the purpose of developing a decision tree is to assess the susceptibility of multi-hazard in
mountainous areas where large variation of geomorphology exists. Besides, the approach needs to be a quick
method for multi-hazard susceptibility assessment for reconstruction aspect. As because, it is needed to
apply at thousands of locations with consideration at local scale. Therefore, the tree needs to be a simple
but scientific approach so that local level technical people can use that. In case of Nepal, Department of
Soil Conservation and Watershed Management (DSCWM) is responsible to collect and manage the landslide
related hazards issue. The authority has the offices at each district where it has the local technical people to
do their responsibilities. Hence, they will be the users of the proposed decision tree for the multi-hazard
susceptibility assessment considering reconstruction planning. However, some important information such
as the characteristics of terrain unit (slope steepness, land cover type, rockfall/debris flow/debris slide
runout flow path) and landslide historical inventory are required before applying the decision tree which
might be done covering country level by the experts in central office. In the following sections, the
developed decision tree approach and its field application results are described in details.
5.1 Initial Decision tree
Initially, a qualitative multi-hazard decision tree was prepared by Dr. Cees van Westen, Associate Professor,
ITC of University of Twente, Netherlands. In the decision tree, different hazards such as debris slides, debris
flow, rockfall and flood with their different class (low, moderate and high) were considered for local level
hazards assessment. It is required to mention that, it was termed as hazard assessment considering danger
aspect. Also, the level of class was classified as high (not suitable for reconstruction), moderate (suitable
only with intensive protective measures) and low (suitable for reconstruction with minor protective
measures). However, in the modified decision tree, it has been termed as susceptibility assessment as the
frequency or magnitude of hazardous events has not considered. In the initial tree, different potential factors
such as topography, land cover features, information of previous hazardous evets from local people,

Development of a direct method for local scale post-earthquake multi-hazards susceptibility assessment
41
evidence of previous events from field observation etc. were included to assess different hazards. The tree
was developed in such a way that after passing through the different levels, various hazards type would be
assessed for homogenous units. At first, the assessment is started based on the topography of assessed
terrain mapping unit (TMU). Based on the slope steepness, there are four types of TMU in the initial decision
tree: almost flat (< 50), slope steepness 50-200, slope steepness 200-400, and slope steepness >400. The
topological condition of the surrounding unit is also considered. Apart from topographical factors, different
sets of physical factors which are assessed directly from the field by observation or through interviewing
local people. The decision tree was implemented in an Excel sheet. Overall, the decision tree is formed in
such a way that it guides the users by asking various questions one after another which can be answered by
YES or NO. If the answer is YES it will go towards right direction and if it is NO, it goes downward (Figure
5.1). Moreover, the complete initial decision tree has been shown as Annex-3.
Figure 5.1: A part of initial decision tree for multi-hazards analysis (Source: Dr. Cees van Westen)
5.2 Testing the decision tree in the field
As the initial decision tree was not tested in the field earlier, it was one of the objectives of this study to test
the approach at the local level. Before testing in the field, it was also important to know which type of basic
mapping units was best suited for susceptibility assessment; either exposure based (e.g. starting from
potential location for reconstruction) or terrain unit based (starting from local homogenous units as a basis
for zoning). Generally, it also depends on the users of decision tree as because the aim of developing the
direct method was that it would be simple and easily used by the local technical people such as the District
Soil Conservation Officer (DISCO) of DSCWM.
To find the suitable approach, different group discussions were conducted during field work in the study
area. People from different government organizations (DSCWM, DMG, DoLIDAR etc.), research
Go to next TMU
Part of decision tree (If YES go right and if NO go downward)
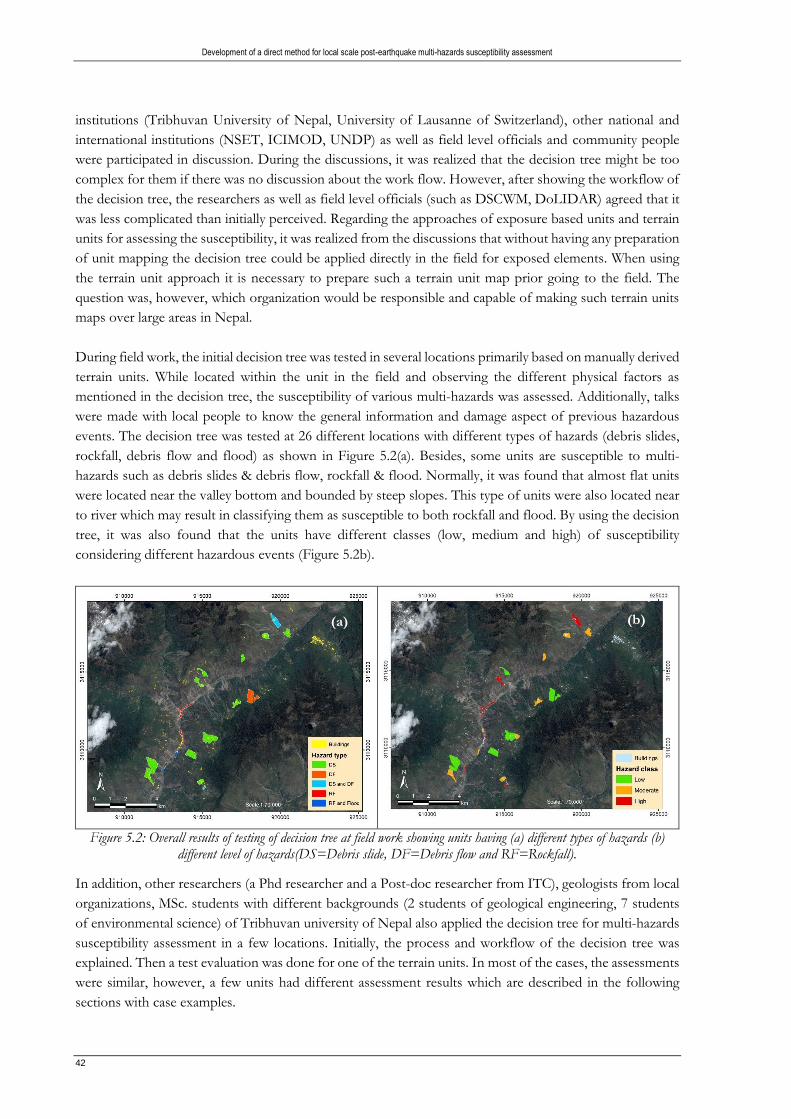
Development of a direct method for local scale post-earthquake multi-hazards susceptibility assessment
42
institutions (Tribhuvan University of Nepal, University of Lausanne of Switzerland), other national and
international institutions (NSET, ICIMOD, UNDP) as well as field level officials and community people
were participated in discussion. During the discussions, it was realized that the decision tree might be too
complex for them if there was no discussion about the work flow. However, after showing the workflow of
the decision tree, the researchers as well as field level officials (such as DSCWM, DoLIDAR) agreed that it
was less complicated than initially perceived. Regarding the approaches of exposure based units and terrain
units for assessing the susceptibility, it was realized from the discussions that without having any preparation
of unit mapping the decision tree could be applied directly in the field for exposed elements. When using
the terrain unit approach it is necessary to prepare such a terrain unit map prior going to the field. The
question was, however, which organization would be responsible and capable of making such terrain units
maps over large areas in Nepal.
During field work, the initial decision tree was tested in several locations primarily based on manually derived
terrain units. While located within the unit in the field and observing the different physical factors as
mentioned in the decision tree, the susceptibility of various multi-hazards was assessed. Additionally, talks
were made with local people to know the general information and damage aspect of previous hazardous
events. The decision tree was tested at 26 different locations with different types of hazards (debris slides,
rockfall, debris flow and flood) as shown in Figure 5.2(a). Besides, some units are susceptible to multi-
hazards such as debris slides & debris flow, rockfall & flood. Normally, it was found that almost flat units
were located near the valley bottom and bounded by steep slopes. This type of units were also located near
to river which may result in classifying them as susceptible to both rockfall and flood. By using the decision
tree, it was also found that the units have different classes (low, medium and high) of susceptibility
considering different hazardous events (Figure 5.2b).
Figure 5.2: Overall results of testing of decision tree at field work showing units having (a) different types of hazards (b) different level of hazards(DS=Debris slide, DF=Debris flow and RF=Rockfall).
In addition, other researchers (a Phd researcher and a Post-doc researcher from ITC), geologists from local
organizations, MSc. students with different backgrounds (2 students of geological engineering, 7 students
of environmental science) of Tribhuvan university of Nepal also applied the decision tree for multi-hazards
susceptibility assessment in a few locations. Initially, the process and workflow of the decision tree was
explained. Then a test evaluation was done for one of the terrain units. In most of the cases, the assessments
were similar, however, a few units had different assessment results which are described in the following
sections with case examples.
(b) (a)

Development of a direct method for local scale post-earthquake multi-hazards susceptibility assessment
43
Case example-1
Terrain unit code (TU): 29080801 (District Code + VDC Code + Ward code+ Serial no) Location: Mailung village, Haku VDC of Rasuwa district
(a) Google Earth image dated 12 December 2014
(pre-earthquake)
(b) Google Earth image dated 9 November 2015
(post-earthquake)
(c) Photo was taken on 8 October 2016 during field work
(d) Process work flow
Figure 5.3: Results of initial decision tree at Mailung village (a) pre-earthquake Google Earth image (b) post-earthquake Google Earth image (c) photo from field observation (d) susceptibility assessment flow
Figure 5.3 shows the process of susceptibility assessment for the Mailung settlement. It was assessed by
asking several questions one after another by observing different physical factors of that area to proceed
through the decision tree. The unit was located almost at flat area and also bounded by steep slope at
upslope. It was also seen that rocky cliffs are present in the upslope and there were some evidence of
Based on decision tree
(If Yes go right, if No go down)
Manually mapped TU

Development of a direct method for local scale post-earthquake multi-hazards susceptibility assessment
44
vegetation anomalies and fallen rocks, therefore, it was assessed as high rockfall hazard area. However, the
evidence of fallen rocks were present only the cyan colour buildings (this was the Korean power plant office
which was constructed for a new hydropower plant project) location (Figure 5.3a and 5.3b) whereas at the
right side buildings location it didn’t reach. On the other hand, other researchers assessed this unit as
moderate rockfall hazard as because the evidence of fallen rocks and vegetation anomalies were not during
the recent earthquake, and this area was in fact spared from the numerous rockfall that affected nearby
areas, because it was on a promontory, and rockfall from the cliffs upslope went on both sides but not
through the unit itself.. Also, there was no crack or visible discontinuity visible in the rock cliffs.
Nevertheless, these things were not considered in the initial decision tree, and were considered important
to further add to the decision tree. Importantly, the terrain unit might be modified logically as well as
consideration of Flow-R rockfall runout results might improve the assessment results.
Case example-2
Terrain unit (TU) code: 29080901 Location: Gogani village, Haku VDC of Rasuwa district
(a) Google Earth image dated 12 December 2014 (pre-
earthquake)
(b) Google Earth image dated 9 November 2015
(post-earthquake)
(c) Photo was taken on 7 October 2016 during field work
Manually mapped TU

Development of a direct method for local scale post-earthquake multi-hazards susceptibility assessment
45
(d) Process work flow
Figure 5.4: Results of initial decision tree at Gogani village (a) pre-earthquake Google Earth image (b) post-earthquake Google Earth image (c) photo from field observation (d) susceptibility assessment flow
It was observed from the field as well as from existing slope map that the unit had the slope steepness
between 20-40 degrees. By overviewing the surrounding area, it was realized that the unit had concave
section with colluvium deposition which might be formed very long past landslides. Though there were no
new road construction or any type of landuse changes, scars of several co-seismic landslide were located
very close to this unit. Additionally, a large debris slide occurred during the 2015 earthquake just at the
adjacent below part (photo of Figure 5.4b and 5.4c) which has created some cracks at the area. Therefore,
following the decision tree and considering all those things, the unit was assessed as highly susceptible to
debris slides. In addition, local information indicated that the settlement of Gogani were totally damaged
due to the 2015 earthquake and the people were shifted to other places temporarily resulting the village is
abandoned up to today .
Case example-3
Terrain unit (TU) code: 29080201 Location: Sano Haku village, Haku VDC of Rasuwa district
(a) Google Earth image dated 12 December 2014
(pre-earthquake)
(b) Google Earth image dated 9 November 2015 (post-earthquake)
Based on decision tree
(If Yes go right, if No go down)
Manually mapped TU

Development of a direct method for local scale post-earthquake multi-hazards susceptibility assessment
46
(c) Photo was taken on 7 October 2016 during field work
(d) Process work flow
Figure 5.5: Results of initial decision tree at Sano Haku village (a) pre-earthquake Google Earth image (b) post-earthquake Google Earth image (c) photo from field observation (d) susceptibility assessment flow.
The Sano Haku village is located on a slope steepness between 200-400 with concave forms with colluvium
deposition. By observing the surrounding areas, it was realized that the area was formed from earlier
landslides. New scars were created during the 2015 earthquake which are located in the upper hill part,
almost within 500m from the unit. Therefore, considering these factors and following the decision tree, the
unit was assessed as high debris slide susceptibility (Figure 5.5).
On the other hand, the unit is located next to an active gully which has an erosive tendency as seen from
field observation. The gully receives water as well as debris material from the landslides in the upper hill
which was initiated during earthquake and enlarged significantly during the last monsoon. Therefore, the
unit was also considered for debris flow susceptibility. Being located very close to a gully which has the
erosive power and has some evidence of debris deposition specially at the edge of the unit, it was assessed
as having a moderate debris flow susceptibility. However, the entire unit might not have the same level of
Debris flow hazard
assessment
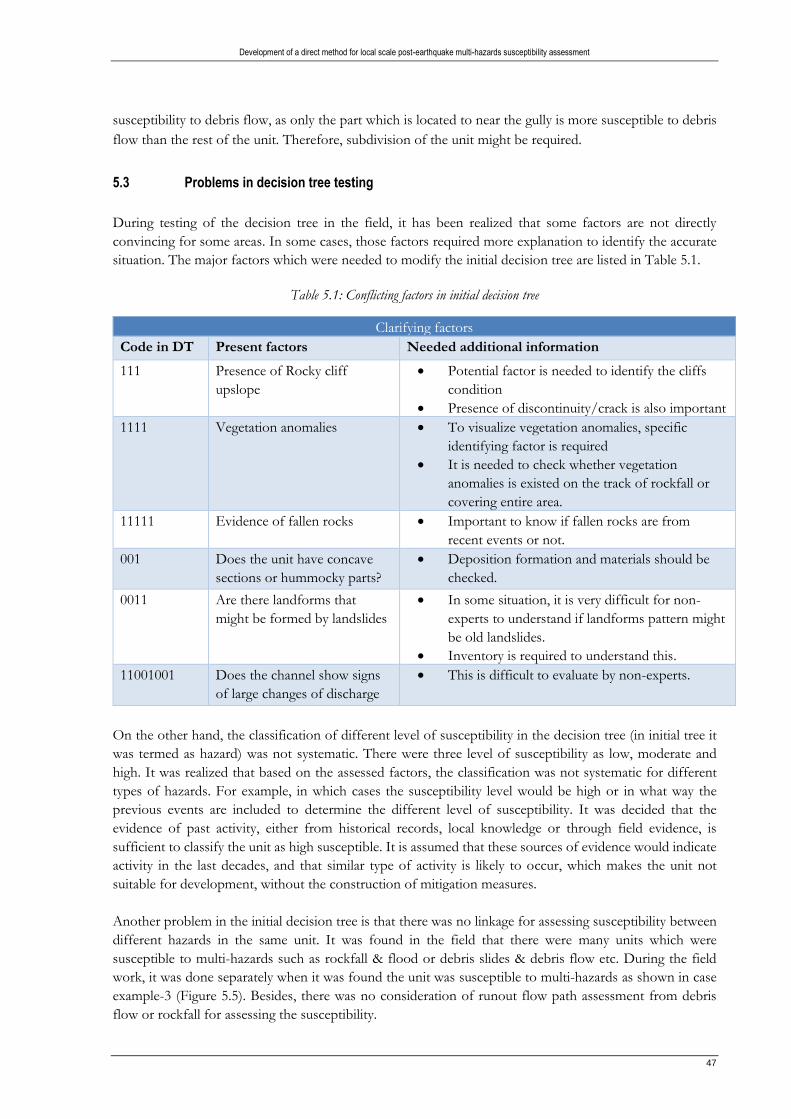
Development of a direct method for local scale post-earthquake multi-hazards susceptibility assessment
47
susceptibility to debris flow, as only the part which is located to near the gully is more susceptible to debris
flow than the rest of the unit. Therefore, subdivision of the unit might be required.
5.3 Problems in decision tree testing
During testing of the decision tree in the field, it has been realized that some factors are not directly
convincing for some areas. In some cases, those factors required more explanation to identify the accurate
situation. The major factors which were needed to modify the initial decision tree are listed in Table 5.1.
Table 5.1: Conflicting factors in initial decision tree
Clarifying factors
Code in DT Present factors Needed additional information
111 Presence of Rocky cliff
upslope
Potential factor is needed to identify the cliffs
condition
Presence of discontinuity/crack is also important
1111 Vegetation anomalies To visualize vegetation anomalies, specific
identifying factor is required
It is needed to check whether vegetation
anomalies is existed on the track of rockfall or
covering entire area.
11111 Evidence of fallen rocks Important to know if fallen rocks are from
recent events or not.
001 Does the unit have concave
sections or hummocky parts?
Deposition formation and materials should be
checked.
0011 Are there landforms that
might be formed by landslides
In some situation, it is very difficult for non-
experts to understand if landforms pattern might
be old landslides.
Inventory is required to understand this.
11001001 Does the channel show signs
of large changes of discharge
This is difficult to evaluate by non-experts.
On the other hand, the classification of different level of susceptibility in the decision tree (in initial tree it
was termed as hazard) was not systematic. There were three level of susceptibility as low, moderate and
high. It was realized that based on the assessed factors, the classification was not systematic for different
types of hazards. For example, in which cases the susceptibility level would be high or in what way the
previous events are included to determine the different level of susceptibility. It was decided that the
evidence of past activity, either from historical records, local knowledge or through field evidence, is
sufficient to classify the unit as high susceptible. It is assumed that these sources of evidence would indicate
activity in the last decades, and that similar type of activity is likely to occur, which makes the unit not
suitable for development, without the construction of mitigation measures.
Another problem in the initial decision tree is that there was no linkage for assessing susceptibility between
different hazards in the same unit. It was found in the field that there were many units which were
susceptible to multi-hazards such as rockfall & flood or debris slides & debris flow etc. During the field
work, it was done separately when it was found the unit was susceptible to multi-hazards as shown in case
example-3 (Figure 5.5). Besides, there was no consideration of runout flow path assessment from debris
flow or rockfall for assessing the susceptibility.

Development of a direct method for local scale post-earthquake multi-hazards susceptibility assessment
48
By using the decision tree, the assessment of susceptibility of multi-hazards is intended to be made for
homogenous units. The decision tree assessment results should give the same results for the entire unit.
However, in some cases it was found that different parts of the units didn’t have the same level of
susceptibility, for example the border area of the unit, close to steep slopes might be undercut where this
doesn’t apply to the entire unit. Therefore, the delineation of unit boundaries plays an important role to
assess the hazards. Hence, considering the above mentioned problems, it was needed to modify the initial
decision tree which could provide more systematic approach for assessing the susceptibility of multi-
hazards.
5.4 Improvement of the decision tree
It is important that the decision tree should not be case specific, and should be used in many locations by
considering all factors to assess multi-hazards susceptibility. It should be generic and simple so that it can
be easily applied by non-technical experts in most of the cases. As it is mentioned earlier, it is assumed from
field experiences, in case of Nepal, it will be used by DISCO officer who has local level technical knowledge
but doesn’t have any expert knowledge. Based on the field testing of initial decision tree as well as from
realization of necessity of minimizing the problems in the tree, as mentioned in section 5.3, the decision tree
was needed for modification. The conflicting factors of the initial decision tree have been focused on
clarified and modified in the proposed decision tree by incorporating historical events inventory, and
observation signs as described in Table 5.2. Additionally, the results of Flow-R runout assessment has been
incorporated in the proposed tree to identify whether the unit is located in the runout flow paths or not.
Table 5.2: Proposed modification for the conflicting factors of initial decision tree
Factors in initial decision tree Clarified in the proposed decision tree
Presence of Rocky cliff upslope Potential indicators of recent event is included by observing
the presence of different color in rock scars such as “Does it
have different color rock scars or open joints”
Vegetation anomalies To visualize vegetation anomalies, such as broken/damaged
trees or presence of different aged vegetation comparing
adjacent area
Evidence of fallen rocks Potential indicators of event will be considered based on
whether fallen rocks look fresh color or covered with some
vegetation.
Either from observations of fallen blocks or information
from local people
Does the unit have concave
sections or hummocky parts?
It can be understood when there are deposition with
colluvium materials.
Are there landforms that might be
formed by landslides
Possible to collect from already mapped landslides
information (landslides inventory) or from discussion with
local people.
Does the channel show signs of
large changes of discharge
By checking the evidence by river deposition or information
from local people
The terminology of different hazard assessment was modified as susceptibility assessment of hazardous
events as there was no evaluation of frequency or magnitude/intensity of hazardous events. Rather, it was
considered based on the relative likelihood of future hazardous event, solely depended on the existing
situation of the local site. In the proposed decision tree (Figure 5.7), there are three level of susceptibility of

Development of a direct method for local scale post-earthquake multi-hazards susceptibility assessment
49
hazardous events; (i) High susceptible (high dangerous area which is not preferable for reconstruction), (ii)
Moderate susceptible (reconstruction can be done with taking proper protective measures) and (iii) Low/No
susceptible (suitable for reconstruction) The most important factor i.e the historical landslide inventory was
not directly considered in the initial tree. In the proposed decision tree, the inventory has been directly
included to check at first whether the unit has any previous experiences of any hazardous event or not. If
this is the case, it will be considered as a high susceptible unit. However, when a unit is classified as high
susceptible, it should always be evaluated by experts before deciding on further development Also, it is still
required to check whether the unit is susceptible to any other hazardous event or not.
A second major improvement is the inclusion of Flow-R model results of rockfall and debris flows runout
flow paths in the improved decision tree. The information of runout flow paths is checked for susceptibility
assessment in decision tree. In addition, automated terrain unit maps are used for multi-hazard susceptibility
assessment. As because, it has the information of class of slope steepness (low: <150, moderate: 150-350,
steep: 350-500 and very steep/cliff: >500), land cover type as well as the existence of rockfall/debris runout.
Although, geomorphological information is not used in automated terrain unit analysis or in the decision
tree, it is desirable, however, it requires expert geomorphological knowledge. Additionally, manual
procedure for generating geomorphological based terrain unit might be too time consuming which might
be unrealistic in Nepal case. In general, there are five different steps in the proposed decision tree for
assessing the susceptibility of multi-hazards which is shown in Figure 5.6. Checking all the alternatives one
after another, the inclusive susceptibility to multi-hazards will be assessed for each terrain unit.
Figure 5.6: Illustrations of different levels in the proposed decision tree for multi-hazard susceptibility assessment
On the other hand, considering different types of hazard different questions related to different causal
factors are organized in the decision tree. The questions related the causal factors will be answered by
observing the existing field condition. As example, for rockfall susceptibility at flat unit, it is needed to
check three factors such as (i) Is the unit located inside the rockfall path (ii) Does it have rock scars or open
joints (iii) Is there any evidence of fallen rocks or vegetation anomalies. Depending on the answers of these
questions, the unit is assessed as high or moderate rockfall susceptibility. In this way, a combination of
scientific knowledge with local knowledge can be made using a simple decision tree. To overcome the
problem of multi-hazards for each unit, linkage has been made between different types of hazards. The
improved decision tree is shown in Figure 5.7. The workflow of proposed decision tree is like the initial one
i.e the questions will be answered by YES or NO. If the answer is YES it will go towards right direction and
if it is NO, it goes downward.
It has also been considered that for some factors such as landslide inventory, model output of rockfall and
debris flow runout assessment, Digital Elevation Model and derivatives such as slope steepness classes, land
cover information, data on buildings and roads, and automated terrain units are needed before going to the
field. On the other hand, if an apps can be developed based on the proposed decision tree, the simple GIS
analysis will be done within the apps in the field (this will be described in detail in chapter-7).
Historical evidence of hazardous event
• Present or not
TU with different slope steepness
• Checking whether a hazard can intitiate in the unit itself
Unit bounded by steep slopes upslope
• Can a hazard from a steep upslope unit reach the unit
Unit bounded by steep slopes downslope
• Assessing whether the unit will be affected due to downslope unit hazard
Unit is located next to drainage channel
• Assessing whether the unit is susceptible to flood

Development of a direct method for local scale post-earthquake multi-hazards susceptibility assessment
50
Figure 5.7: The proposed decision tree of multi-hazards susceptibility assessment
Susceptibility class
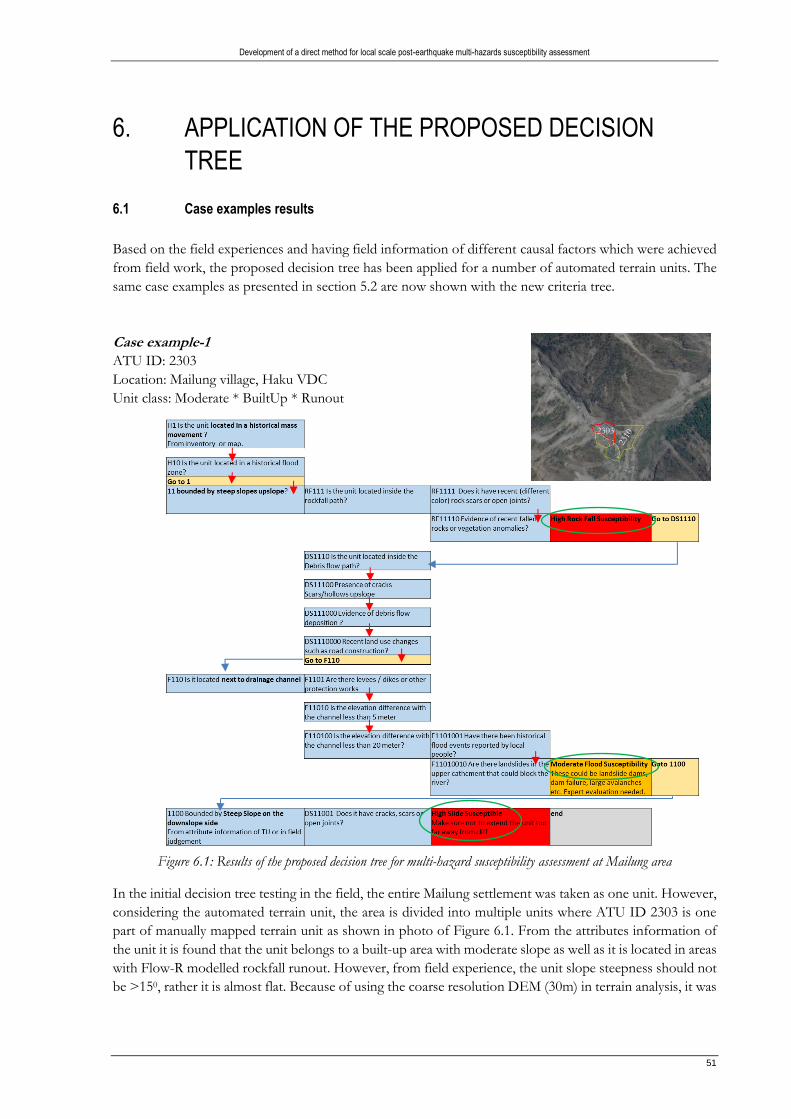
Development of a direct method for local scale post-earthquake multi-hazards susceptibility assessment
51
6. APPLICATION OF THE PROPOSED DECISION
TREE
6.1 Case examples results
Based on the field experiences and having field information of different causal factors which were achieved
from field work, the proposed decision tree has been applied for a number of automated terrain units. The
same case examples as presented in section 5.2 are now shown with the new criteria tree.
Case example-1
ATU ID: 2303
Location: Mailung village, Haku VDC
Unit class: Moderate * BuiltUp * Runout
Figure 6.1: Results of the proposed decision tree for multi-hazard susceptibility assessment at Mailung area
In the initial decision tree testing in the field, the entire Mailung settlement was taken as one unit. However,
considering the automated terrain unit, the area is divided into multiple units where ATU ID 2303 is one
part of manually mapped terrain unit as shown in photo of Figure 6.1. From the attributes information of
the unit it is found that the unit belongs to a built-up area with moderate slope as well as it is located in areas
with Flow-R modelled rockfall runout. However, from field experience, the unit slope steepness should not
be >150, rather it is almost flat. Because of using the coarse resolution DEM (30m) in terrain analysis, it was
2303

Development of a direct method for local scale post-earthquake multi-hazards susceptibility assessment
52
classified in moderate slope steepness class (150 – 350). Therefore, the unit is taken as low slope steepness
class (<150) for assessing the susceptibility of multi-hazard based on proposed decision tree.
At first, it is assessed that the unit does not have experiences of any hazardous events which is seen from
landslide inventory. After that, it is checked whether it has a steep slope in the upslope or downslope
direction or it is located next to a drainage channel. By following the proposed decision tree, it is seen that
the unit is susceptible to high rockfall which is from bounded upslope part. The unit is also susceptible to
moderate flood being located next to the drainage channel as well as it is also susceptible to high debris slide
specially the edge of unit boundary in downslope side (Figure 6.1). Being as a high susceptible area, the unit
is not suitable for reconstruction. However, the Korean hydropower plant company’s office which was
totally damaged during the 2015 earthquake induced rockfalls, is planning to rebuild it at the same location
with taking intensive rockfall protective measures.
Case example-2
ATU ID: 1947
Location: Gogani village, Haku VDC
Unit class: Moderate * BuiltUp * No runout
Figure 6.2: Results of the proposed decision tree for multi-hazard susceptibility assessment in Gogani village
Considering the automated terrain unit, Gogani village belongs to built-up area with moderate slope
steepness (150-350) and it is not located within any rock fall or debris runout flow path zone. There are also
no historical events in the landslide inventory for this unit. Being located within the moderate slope
steepness firstly, it has been assessed whether it has any hazard which might be created from this unit itself,
Automated terrain unit

Development of a direct method for local scale post-earthquake multi-hazards susceptibility assessment
53
such as landslides, which is not found following the decision tree. The unit doesn’t bounded steep slopes
upslope whereas it is bounded by steep downslope. It is observed from field experiences that a large co-
seismic debris slide occurs in 2015 just the downslope boundary of the unit which resulting cracks in the
boundary (see Figure 5.4c). Therefore, following the decision tree, the unit is susceptible to high debris slide
resulting from steep downslope bounded unit. However, as the unit is not located next to drainage, the unit
doesn’t have susceptibility to flood. Being a highly susceptible debris slide area, this unit is unsafe for
reconstruction or development.
Case example-3
ATU ID: 929
Location: Sano Haku village, Haku VDC
Unit class: Moderate * BuiltUp * Runout
Figure 6.3: Results of the proposed decision tree for multi-hazard susceptibility assessment at Sano Haku area
The unit of Sano Haku village also belongs to built-up area with moderate slope steepness. It is seen from
attributes information, the unit is located on runout flow paths of debris flow whereas it doesn’t have
experiences of previous hazardous events. Although, there is no possibility to initiate any hazard in unit
itself, the debris flow runout may reach to the unit, however, there is no evidence of debris flow deposition
which resulting the unit as moderate debris flow susceptibility (Figure 6.3). On the other hand, as the unit
is not bounded by steep slopes downslope and also not located next to drainage channel, it is not susceptible
Automated terrain unit

Development of a direct method for local scale post-earthquake multi-hazards susceptibility assessment
54
to any other hazard. As the unit is susceptible to moderate debris flow only, for any reconstruction work
further investigation is required to identify detail level runout flow path assessment.
6.2 Discussions
By using the automated terrain units, the proposed decision tree was applied at the same locations where
initial tree was used for susceptibility assessment. Both cases, it shows that boundary of terrain unit is
important for assessing the susceptibility of multi-hazards. As example in the Mailung area, in case of initial
decision tree, the entire Mailung settlement area was taken as one unit. As there was no causal factor related
to rockfall runout flow path in the initial tree, the entire unit was assessed as same susceptibility, i.e high
rockfall susceptibility (Figure 5.3). On the other hand, by using the automated terrain unit, that area was
divided into multiple units because of including the runout flow paths factor. As a results, by using the
proposed decision tree, one unit of this location (ATU_2303) was assessed as high rockfall susceptibility
whereas, the right side unit of that one i.e. ATU_2310 unit (Figure 6.1) has the different level of
susceptibility. By testing the proposed decision tree it was seen that the unit is not susceptible to any other
hazards except moderate flood susceptibility.
Therefore, for using the decision tree, delineation of unit boundary is important. Also, the measurement of
slope steepness is not always the same due to the poor quality of the DEM (30 m SRTM DEM). In the field,
the ATU_2303 or ATU_2310 unit was estimated to almost flat (<5 degrees) whereas in the automated
terrain unit mapping, both the units belong to the moderate slope class (15-35 degrees). Therefore, user
should always have the flexibility to adjust the boundaries of the automated terrain units. Based on field
observations, and users should be able to overrule the results from the GIS analysis, as they might be based
on erroneous or inaccurate data. In addition, considering rockfall runout flow paths the entire unit has not
the same susceptibility to rockfall. Therefore, by applying the proposed decision tree with automated terrain
units, it has given different results with multi-hazard (high rockfall, high debris slide and moderate flood
susceptibility) as shown in Figure 6.1. Moreover, in the proposed tree, the susceptibility assessment of
different type of hazards is well connected to each other.
The proposed decision tree is framed in such a comprehensive way that the susceptibility of hazards is
assessed firstly considering the unit itself. Afterwards, susceptibility has been analysed whether the unit has
the chance to be affected from steep units upslope or downslope side or if it is located next to drainage
channel. As a results, all alternatives of causing the susceptibility of multi-hazards are ensured in the
proposed decision tree. On the other hand, as the automated terrain unit is included in the proposed decision
tree, users are able to get the important information (slope steepness, land cover, runout flow path and
historical landslides information) of the unit from it’s attributes table. Without having those information,
most of the cases the assessment is fully depended on the ability of the user to observe different casual
factors in the field, or being fully dependant on local knowledge. However, it is necessary to prepare
automated terrain unit mapping before going to field for multi-hazards susceptibility assessment.
Based on the testing of initial decision tree in the field by users of different expertise, several shortcomings
were identified and cast a light on the aspects that had to be modified and improved. The historical
information of hazardous events either from inventory or from the local information has also been
importantly included in the proposed decision tree. Therefore, by using this logically framed systemic
proposed decision tree at few known units, the results of multi-hazards susceptibility assessment is quite
convincing realizing the field situation which was observed during field work. However, further testing of
the proposed decision tree approach, even in different environment, will make it more trustworthy.

Development of a direct method for local scale post-earthquake multi-hazards susceptibility assessment
55
7. TOWARDS AN APP FOR DECISION TREE
IMPLIMENTATION The Decision Tree approach described in the previous chapters might be considered complicated to use by
local technical staff with limited knowledge in earth-sciences and GIS. The proper use of the decision tree
requires a combination of GIS operations (e.g. evaluating past inventories, slope steepness, proximity to
steep units, runout modelling) with local knowledge that can only be obtained through field observation and
talking to local people. Therefore it would be very beneficial if the decision tree method could be
implemented in an app on a handheld device, which would allow the use of GIS operations in an offline
setting.
The rise in smartphones and tablets has lead in the development and use of applications, some of which
require the incorporation of GIS. By including the mobile GIS in smartphone or tablet, different apps can
be developed in order to collect data from remote locations. Apart from the simple spatial data collection
such as incident reporting, damage assessment or emergency responses, nowadays, mobile GIS are widely
used for spatial data acquisition, storage, sharing and spatio-temporal analysis for supporting decision-
making. Given these recent advance in mobile GIS and app development technologies, the implementation
of the proposed decision tree in app to be used at a smartphone or a tablet. In this chapter, some
recommendations are given on the framework of developing a mobile app for the application of the decision
tree approach for multi-hazards susceptibility assessment. The actual implementation of the app is beyond
the scope of this MSc research, however, a mock-up has been prepared which can be demonstrated during
the examination.
7.1 Structure of Mobile GIS
Among the different mobile GIS architectures, the ‘Stand Alone Client’ GIS architectures is the simplest
one, in a way that it can be used even in offline i.e. without internet connection (Mobaraki et al., 2006). By
using this architecture, mobile GIS software and the customized application reside entirely on a mobile
device. However, due to limited storage space in mobile devices, large geo-data or complicated GIS analyses
are very hard to perform independently in a smartphone or tablet. On the other hand, in ‘Client Server’
architecture, the geo-data is placed to a separate server or computer and served to the client (mobile device
such as smartphone or tablet) by GIS server software through a wireless network. Nevertheless, continuous
connection is required between the server and client to perform the activities which reduce the flexibility,
as if the connection fails, the mobile GIS will no longer work. Whereas, in the ‘Distributed Client Server’
architecture, apart from storing all geo-data at a server some part of the data is placed into client devices.
Therefore, the mobile GIS is useable even if it is not connected with server. Later, the data is synchronised
when it is connected to the server. In this case, the client devices store geospatial data in a geo-data cache
located in a temporary GIS storage space or a flash memory card which is also used in offline mode (without
connected with central server). The customized datasets are downloaded and synchronized from the server
when it is connected. Additionally, the collected spatial data is also stored in the server, therefore, this
functionally is advantageous the exchange and sharing of spatial data between stakeholders from different
jurisdictional levels. The connectivity of GIS architecture of this approach is shown in Figure 7.1.

Development of a direct method for local scale post-earthquake multi-hazards susceptibility assessment
56
Figure 7.1: Illustrations of the architecture of mobile GIS (ESRI, n.d.)
Alternatively, Web-GIS application is another option to make the application services available to others
within and outside from the application hosting organization. The system in this case consists of at least a
server and a client, where the server is a GIS server and the client is a web browser by using desktop
application or mobile application. The main advantage is that it does not matter how far apart the server
and client might be from each other. In addition, considering the costing of individual GIS software as well
as a using the Web-GIS by a large number of users simultaneously it is cost effective (Ananda et al.,
2016)(Ananda et al., 2016)(Ananda et al., 2016). Besides, because of the simple design of Web-GIS, general
public users who are not experts in GIS, can easily use this application. However, smooth internet access is
always required to connect the server for using the application. Nowadays, Hybrid apps which are built on
a combination of native (stand-alone client) and web app technologies are quite promising. Instead of
targeting a mobile browser, hybrid applications target a Web View hosted inside a native container. This
enables them to do things like access hardware capabilities of the mobile device. Hence, Hybrid Web-GIS
apps with cache feature facilities would be the better option to develop an app of proposed decision tree
for multi-hazards susceptibility assessment as because it would also be workable even in offline situation
(i.e. without internet).
7.2 Framework of decision tree mobile Web-GIS app
Hybrid apps use a Web View, which is essentially a scaled-down browser, are able to use HTML, CSS and
JavaScript to build apps by using a native application wrapper that is used in smart phones or tablets (Shin
& Shin, 2014). This uses the device’s web view to act as a browser to display the web-based code of the
hybrid app. Besides, integration of the phone’s native functionality such as camera, geolocation etc with the
Web-GIS app is important for effective uses in mobile devices. As the hybrid apps are rendered in a web
view, the age-old issue of multiple browsers and varying support levels across multiple operating systems

Development of a direct method for local scale post-earthquake multi-hazards susceptibility assessment
57
need to be ensured. On the other hand, the proposed app will be used even in very remote area where
internet connectivity might not available. Therefore, it is needed to develop the app an offline-first approach
where provision of caching network requests in local storage will give an optimal experience in periods of
low or no signal. Hybrid Web-GIS app need to be developed in such a way that GIS data either from remote
sensing sources, field surveys, digital maps or a database component that allows the storage and
manipulation of spatial data and finally a presentation component that brings together themes or layers of
data for a number of spatial analytical operations. Considering the above mentioned technical aspect, the
Web-GIS hybrid app need to be developed based on the questions exist in the proposed decision tree for
multi-hazard susceptibility assessment. The interface need to develop in user friendly manner so that non
expert users can easily use that.
A comprehensive database structure is needed prior to use the Web-GIS app. The database should contain
the spatial information of different vector or raster data in the form of attribute tables linked to the terrain
unit map, that has been prepared in advanced according to the method presented in section 4.2.2. It should
also contain historical landslide and flood (if available) inventories, DEM derivatives such as slope steepness,
land cover data as well as rockfall and debris flow runout flow path data in such as a way so that any spatial
query can be made. It is needed to assign the attributes to the terrain units based on the other factor maps,
so that the vector layer of the terrain units is the only layer that is really changed in the field. The attributes
of this layer should be editable to record the susceptibility results from the field, and also the boundaries of
the units must be editable in the field if required.
As the geodatabase is a storage of sets of data which might be placed in a server, upon requesting the queries
of Web-GIS application server it can provide the data for GIS application or visualization. Therefore, the
spatial database should be designed in such a way that the application server layer communicates with
multiple data layers via the data integration layer, and interacts to analyse and operate data. The GIS
application server needs to be capable to perform basic GIS analysis such as vector editing, attribute editing,
overlay, spatial queries, integration of Google maps, and visualization of maps by using different geo-web
services. The basic layers with their necessary attributes which should be included in geodatabase are listed
in Table 7.1. Table 7.1: List of GIS data layers which are needed to include in decision tree app
Data Layer Data type format
Road network Vector data with Road segment ID, length, description
of the segment, type of segment etc.
Built-up area (buildings footprints) Vector data
Landslides inventory Vector data with unique ID, type, time of occurrence,
triggering factor etc.
Automated terrain unit Vector data contains terrain unit ID, unit area, type
(landslide or non-landslide unit), Unit class (combined
information of slope steepness, land cover, presence of
runout flow).
Rockfall/Debris flow runout path Raster data in binary format (1= presence of runout,
0= No runout)
Slope angle Raster
Hillshade Raster
Land cover Vector data with object ID, area, land cover class etc.
Google Map/image Raster

Development of a direct method for local scale post-earthquake multi-hazards susceptibility assessment
58
In the proposed decision tree, there are some causal factors (in question format) which can be assessed
directly from field observation whereas the others can be assessed by using GIS functionalities with data
from the pre-loaded input layers. The factors listed in Table 7.2 of decision tree are needed to assess in GIS
environment in the proposed app.
Table 7.2: The factors having the GIS functionality in decision tree
Factors GIS functionality
Identification whether the unit
is located in a historical mass
movement or not.
Pre-fieldwork: Preparation of automated terrain unit as described in
section 4.2.2. Overlaying of the historical landslides and flood
inventory with automated terrain unit layer
During fieldwork: The historical landslide and flood information is
stored as attributes in the attribute table linked to the terrain unit map,
and can be simply retrieved in the field for every terrain unit
Identification of unit slope
steepness
Pre-fieldwork: Based on DEM derivatives as slope map, it will be
included in automated terrain unit analysis
During fieldwork: The slope class is an attribute linked to the terrain
unit map. From the attributes of terrain unit it will be retrievable. Also,
possible to visualize slope class map together with terrain unit map
keeping Hillshade effect.
Identification of slope
steepness of neighbouring
units
Pre-fieldwork: By automated terrain unit analysis, slope class will be
assigned at each unit.
During fieldwork: Visualization of the terrain unit map on top of
slope map. Selection of the surrounding unit(s) of which the slope
steepness should be assessed using the ‘select by feature tool’, on the
automated terrain unit layer and retrieve the attribute table to identify
the bounded unit’s slope class.
Identification of whether the
unit is located inside the
rockfall/debris flow path
Pre-fieldwork: Requirement of assessing the runout flow path of
rockfall/debris flow by using Flow-R and inclusion the results in
terrain unit analysis.
During fieldwork: By query or selecting the assessing terrain unit,
information can be found for the attribute table of terrain unit map.
Also, visualization of the terrain unit map on top of runout flow path
maps to know whether it is from rockfall or debris flow.
For using the decision tree Web-GIS app for multi-hazard susceptibility assessment at the country level,
coordination of different level offices is required. Database and application servers should be placed in the
central office of the organization which is responsible for maintaining landslides database and for hazard
management. As example, the Department of Soil Conservation and Watershed Management (DSCWM) is
responsible for landslide management. It has one central office and also has separate offices in each District,
with local Soil Conservation District officers and technical staff. Therefore, the central server of the app
might be placed at it’s central office. Each district office can get access to the data of the respective district
and load this information in the app through mobile devices in their cache memories so that the mobile
Web-GIS app can be used at the field level without internet service (Figure 7.2). The field users will use the
decision tree app to analyse the multi hazards susceptibility and record the collected information in the
desired fields of app. The collected data from several locations will be aggregated in district level while those

Development of a direct method for local scale post-earthquake multi-hazards susceptibility assessment
59
mobile devices will be connected with the web server and synchronized with database server. On the other
hand, the central server can always be updated by collecting the information from different district offices
because these offices will be in connected all time through web services.
Figure 7.2: Thematic diagram of using of Web-GIS app at different districts in Nepal
7.3 Mock Web-GIS app of multi-hazards susceptibility decision tree
Basically, the app will consist of two main parts; (i) formatted questions of causal factors for susceptibility
assessment and (ii) GIS analysis and visualization with maps. In the question part, each question will be
visible on the mobile device screen with YES, NO and Info tab. Depending on the answer given by the
users (either YES or NO), next question will be visible to users to answer and proceed till to the end. In
most of the individual questions, there will be Info tab to get further information regarding that question
from GIS data stored in the app. On the other hand, in GIS analysis part, simple GIS functions such as
overlay or spatial query, will be used based on the pre-loaded input layers. The user can accept the
suggestions that are given based on the GIS operations, but can also decide to give a different answer. This
can be due to the fact that the GIS data may be of insufficient quality, or could be outdated. For example,
when using 30 m DEM data, slope values calculated might deviated considerably from those observed in
the field, and the user can decide to allocate a different slope class than indicated by the system. This also
applies for the outlines of the terrain units, which are made through automatic procedures outlines in section
4.2.2, and are based on coarse resolution DEM data. This might require adjustment of boundaries of terrain
units in the field. The app must have the opportunity to make such editing of boundaries, without generating
entirely new terrain units, which would change the database structure considerably.
It is proposed that he app interface has three windows on the mobile device screen (i) Question & response
window (ii) a popup window (where additional information will be visible by Info tab ) (iii) Map visualization
window (Figure 7.3). At the beginning, the users need to provide some basic information about the identity
of the user as well as select the terrain unit.
Field user
Central office (DSCWM)
District office
District office
Field user

Development of a direct method for local scale post-earthquake multi-hazards susceptibility assessment
60
Figure 7.3: Proposed architecture of the decision tree approach app of multi-hazards susceptibility assessment (MHSA)
In the map window, some basic functionalities will be included such as zoom in/out, pan, select features
tool, north direction, scale, unit, map content layers with the ability of legend customization etc. In the map
window, users are able to zoom their location to see the automated terrain boundary unit. By clicking on a
terrain unit, user can identify his/her location based on GPS feature of mobile devices. The user doesn’t
have to be located in the unit that is evaluated, because it also possible to evaluate units that are located on
the other side of a steep valley. After that, users will start the multi-hazards susceptibility assessment for that
unit by answering different questions which will be visible on the left of the screen one after another. There
is also an Info tab by which users are able to see more information from the attribute table of different layers
as well as from popup window (Figure 7.4).
Figure 7.4: Sample question window with the attribute information by using Info tab in the proposed app
As the terrain units have generated by considering automated approach, depending the field situation, it
might require to edit it’s boundary. In case of editing the terrain unit boundaries, the app will have the

Development of a direct method for local scale post-earthquake multi-hazards susceptibility assessment
61
flexibility to edit the boundaries by using selecting feature with edit vertex option (Figure 7.5). However,
generating entirely new terrain units need to be restricted in the app.
Figure 7.5: Automated terrain editing option depending on field situation in proposed app
The app needs to be developed in such a way that multi-hazards susceptibility can be assessed for the same
unit by keeping a link between different hazards as presented in the decision tree. After completing all the
steps of the assessment, the susceptibility assessment results will be viewable on the map. Also, the map
window will show all the terrain units where the assessment unit will be displayed with separated colour
(Figure 7.6). Besides, the attribute table of automated terrain unit layer will be modified by adding different
fields such as assessment hazard types and susceptibility class as well as the basic information as provided
at the initial stage of using app. It is also required to export those tables with different formats (e.g. csv,
Excel) as well as preferred customized map. Finally, when the client (i.e. mobile devices) will be connected
with the central server, the data will be synchronized, and with the objective to provide data that can covering
bigger parts of a district and country. As the mobile Web-GIS app can also be used offline, this makes is
use very effect especially in remote areas.
Figure 7.6: Final results of multi-hazards susceptibility assessment of a terrain unit

Development of a direct method for local scale post-earthquake multi-hazards susceptibility assessment
62
8. CONCLUSIONS AND RECOMMENDATIONS
The main objective of this study has been the development of a direct method that is based on a decision
tree approach for multi-hazards (debris slides, debris flow, rockfall and floods) susceptibility assessment.
Based on the testing of initial decision tree in the field by users of different expertise, several shortcomings
were identified and cast a light on the aspects that had to be modified and improved. It was realized in the
field that if a unit has experiences to have the previous events, the unit is already in susceptible zone to
hazards. Therefore, the historical landslide inventory is importantly included in the proposed decision tree.
On the other hand, the potential runout extent of hazardous events such as rockfall, debris flow could be
different even in shorter extended area as it was seen in Mailung settlement area. To overcome this, empirical
Flow-R modelling runout results has been included in the proposed decision tree. It has been seen, the
model is able to provide acceptable rockfall and debris flow runout paths only using the DEM. However,
the resolution and quality of DEM has significant importance to generate better results. Between using two
DEM (5m and 30m) datasets in a small part of the study area, it was found that higher resolution DEM
generated more accurate rockfall runout paths compare to coarse one. In case of debris flow runout
assessment, 30m DEM was used as it was only available in the debris flows locations of this study area.
Hence, it was seen that the resulted runout flow paths were overestimated because of the coarse size of
pixels.
In addition, considering the entire study area, 30m DEM was used in Flow-R model for runout assessment.
In rockfall runout analysis, the areas which have >50 degree of slope steepness were taken as rockfall
sources. The slope map was prepared from 30m SRTM DEM data. Whereas, if the source areas were
considered by taking the slope steepness >60 degree, 30m slope data had only 23% area as compared with
5m slope data in Mailing area. It has also been seen that the correlation between these two slope data is very
low. Therefore, using the higher resolution DEM covering the entire study area in runout modelling has
chance to improve the results of runout paths assessment.
Terrain unit is an important input factor in the decision tree approach for multi-hazards susceptibility
assessment. In case of the manual terrain mapping, detail level geological and geomorphological information
is required. Expert geomorphological knowledge on terrain classification, which is not always available and
which may differ between individuals, is also required for manual mapping. Although the method might
results in better delineated terrain units when done by an expert Geomorphologist with enough time
investment, in practice this will be difficult to guarantee. Therefore, automated terrain unit approach with a
scientific way is done in this study which might be followed by different persons, resulting in similar
products. The 30 DEM derivative slope gradient, land cover, modelling results of rockfall or debris flow
runout paths and the historical landslides information are considered in automated terrain analysis.
Altogether, 2462 terrain units are generated for this research study area where the average size of terrain
units having forest land cover is larger comparing other classes (Annex 2).
As the automated terrain units contain various information (slope steepness, land cover type, runout flow
paths, and historical landslides info), it has effectively used in proposed decision tree for multi-hazards
susceptibility assessment. Additionally, users of decision tree have the flexibility to adjust the boundaries of
the automated terrain units depending on the field situation. Alternatively, considering exposure elements
based homogenous unit, would be more precious, however, it requires expert geomorphological knowledge
and training as well as enough time consuming to cover a large area which is difficult in Nepal. Besides, the

Development of a direct method for local scale post-earthquake multi-hazards susceptibility assessment
63
number of units would be very large number compare to automated terrain unit which require large number
of people to assess the multi-hazard susceptibility assessment by using the decision tree.
The proposed decision tree was applied at few terrain units at which the initial tree was applied in the field.
In overall, by using the proposed decision tree, susceptibility to different hazards are assessed for same unit
as the assessing steps of multi-hazards are logically connected to each other in the proposed tree. As
example, in Mailung area with ATU_ID 2303, it was seen that the unit is susceptible to high rockfall, high
debris slide as well as to moderate flood (see Figure 6.1) which satisfy the field situation. On the other, as
the historical hazards information as well as runout flow paths information exist in decision tree, it has made
more focus to assess the multi-hazards susceptibility.
As mentioned earlier, the proposed decision tree will be widely used by the local technical staff with limited
knowledge in earth-sciences and GIS. The methodology that was proposed for the multi-hazards
susceptibility assessment using the improved decision tree can be easily implemented in a Web-GIS app
which is also useable at a smartphone or tablet. App based decision tree would be more user friendly as
because it will help the users to navigate through the work flow process of decision tree. It would be
developed in such a systemic way that users would be able to answer different factors related question by
answering YES or NO. In addition, it will incorporate very simple GIS functionalities so that users can
easily get the necessary attribute information of terrain unit from the pre-loaded layers in the app as shown
as mock app in section 7.3.
However, the proposed decision tree is developed to assess the susceptibility of multi-hazards not for hazard
assessment as because there is no evaluation of hazard frequency and also not consideration of
intensity/magnitude of the hazard. Actually, to do that detailed information is required which is mostly not
available. Geological (detailed level) and Geomorphological data are not used because of data unavailability.
Also, as the users of this decision tree is local technical people with limited knowledge on Geomorphology,
these data are not useful them. Considering the different factors in decision tree, if there is no historical
data, and no local knowledge, it will be hard to make the right judgement. Unlike other landslides hazard,
flood hazard need to be further worked out. Apart from different types of landslide hazards, other hazards
are not yet included which could also be included in future. However, in case of extreme event such as
earthquake the decision tree approach is hard to use.
This study reveals that high resolution DEM (i.e 5m ALOS DEM) has the scope to improve the mass
movements runout assessment by Flow-R model as well as in automated terrain unit analysis. Even, it would
be more convincing if Lidar DEM might be used. The proposed decision tree might be improved by further
testing with involving local level technical people. To justify the usability, testing in other environment is
needed. As many steps are framed in single decision tree, without making a mobile app, using the tree seems
complex. Though, presently, the tree only deals for susceptibility assessment, evaluating frequency and
magnitude/intensity, it could be developed towards multi-hazards assessment. Matrix based approached
which includes relation between classes of frequency with classes of intensity might be considered in multi-
hazards assessment as an example of hazard mapping system in Switzerland (Figure A1-2 of Annex-1).
However, in case of earthquake, it is difficult to evaluate the frequency as well as the location and magnitude
in advance. Even, it is hard to foresee the devastation of earthquake damage and also difficult to judge
whether the places affected by co-seismic hazards will remain dangerous in future.

Development of a direct method for local scale post-earthquake multi-hazards susceptibility assessment
64
LIST OF REFERENCES
Abella, E. A. C., & Van Westen, C. . (2007). Generation of a landslide risk index map for Cuba using
spatial multi-criteria evaluation, (July), 311–325. http://doi.org/10.1007/s10346-007-0087-y Ananda, F., Uria, D., & Ngigi, M. (2016). Towards a new methodology for web GIS development.
International Journal of Software Engineering & Applications (IJSEA), 7(4), 67–73. http://doi.org/10.5121/ijfcst.2015.5107
Anders, N., & Seijmonsbergen, H. (2008). A Revolution in Geomorphology. GIM International, pp. 0–1. Retrieved from https://www.gim-international.com/content/article/a-revolution-in-geomorphology
Anders, N., Seijmonsbergen, H., Bouten, W., & Smith, M. (2011). Optimizing object-based image analysis for semi- automated geomorphological mapping, 117–120.
Bai, S. B., Wang, J., L, G. N., Zhou, P. G., Hou, S. S., & Xu, S. N. (2010). GIS-based logistic regression for landslide susceptibility mapping of the Zhongxian segment in the Three Gorges area, China. Geomorphology, 115(1-2), 23–31. http://doi.org/10.1016/j.geomorph.2009.09.025
Blahut, J., Horton, P., Sterlacchini, S., & Jaboyedoff, M. (2010). Debris flow hazard modelling on medium scale: Valtellina di Tirano, Italy. Natural Hazards and Earth System Science, 10(11), 2379–2390. http://doi.org/10.5194/nhess-10-2379-2010
Corominas, J., van Westen, C., Frattini, P., Cascini, L., Malet, J. P., Fotopoulou, S., … Smith, J. T. (2014). Recommendations for the quantitative analysis of landslide risk. Bulletin of Engineering Geology and the Environment, 73(2), 209–263. http://doi.org/10.1007/s10064-013-0538-8
Cruden, D. M. (1991). A simple definition of a landslide. Bulletin of the International Association of Engineering Geology, 43(1), 27–29. http://doi.org/10.1007/BF02590167
Dai, F. C., & Lee, C. F. (2001). Terrain-based mapping of landslide susceptibility using a geographical information system: A case study. Canadian Geotechnical Journal, 38(5), 911–923. http://doi.org/10.1139/t01-021
Dhital, M. R. (2015). Geology of the Nepal Himalaya. http://doi.org/10.1007/978-3-319-02496-7 Ding, M., & Hu, K. (2014). Susceptibility mapping of landslides in Beichuan County using cluster and
MLC methods. Natural Hazards, 70(1), 755–766. http://doi.org/10.1007/s11069-013-0854-0 Dorren, L. K. a. (2003). A review of rockfall mechanics and modelling approaches. Progress in Physical
Geography, 27, 69–87. http://doi.org/10.1191/0309133303pp359ra Dou, J., Yamagishi, H., Pourghasemi, H. R., Yunus, A. P., Song, X., Xu, Y., & Zhu, Z. (2015). An
integrated artificial neural network model for the landslide susceptibility assessment of Osado. Natural Hazards, 78(3), 1749–1776. http://doi.org/10.1007/s11069-015-1799-2
Elvidge, C. D., & Tuttle, B. T. (2008). How Virtual Globes Are Revolutionizing Earth Observation Data Access. The International Archives of the Photogrammetry, Remote Sensing and Spatial Information Sciences, XXXVII(January), 137–140.
Gaprindashvili, G., & Van Westen, C. J. (2015). Generation of a national landslide hazard and risk map for the country of Georgia. Natural Hazards. http://doi.org/10.1007/s11069-015-1958-5
Ghimire, M. (2011). Landslide occurrence and its relation with terrain factors in the Siwalik Hills, Nepal: Case study of susceptibility assessment in three basins. Natural Hazards, 56(1), 299–320. http://doi.org/10.1007/s11069-010-9569-7
Goda, K., Kiyota, T., Pokhrel, R. M., Chiaro, G., Katagiri, T., Sharma, K., & Wilkinson, S. (2015). The 2015 Gorkha Nepal Earthquake: Insights from Earthquake Damage Survey. Frontiers in Built Environment, 1(April), 1–15. http://doi.org/10.3389/fbuil.2015.00008
Guzzetti, F.; Carrara, A.; Cardinali, M.; Reichenbach, P. (1999). Landslide hazard evaluation: A review of current techniques and their application in a multi-scale study, Central Italy. Geomorphology, 31(1-4), 181–216. http://doi.org/10.1016/S0169-555X(99)00078-1
Hong, H., Pourghasemi, H. R., & Pourtaghi, Z. S. (2016). Landslide susceptibility assessment in Lianhua County (China): A comparison between a random forest data mining technique and bivariate and multivariate statistical models. Geomorphology, 259, 105–118. http://doi.org/10.1016/j.geomorph.2016.02.012
Horton, P., Jaboyedoff, M., & Bardou, E. (2008). Debris flow susceptibility mapping at a regional scale. In 4th Canadian Conference on Geohazards: From Causes to Management (pp. 399–406). Retrieved from http://www.geohazard.ggl.ulaval.ca/alea/horton.pdf
Horton, P., Jaboyedoff, M., Rudaz, B., & Zimmermann, M. (2013). Flow-R, a model for susceptibility
Development of a direct method for local scale post-earthquake multi-hazards susceptibility assessment
65
mapping of debris flows and other gravitational hazards at a regional scale. Natural Hazards and Earth System Sciences, 13(4), 869–885. http://doi.org/10.5194/nhess-13-869-2013
Horton, P., Jaboyedoff, M., Zimmermann, M., Mazotti, B., & Longchamp, C. (2011). Flow-R, a model for debris flow susceptibility mapping at a regional scale - some case studies. Proceedings of the 5th International Conference on Debris-Flow Hazards Mitigation: Mechanics, Prediction and Assessment, 875–884. http://doi.org/10.4408/IJEGE.2011-03.B-095
Hungr, O., Leroueil, S., & Picarelli, L. (2014). The Varnes classification of landslide types, an update. Landslides, 11(2), 167–194. http://doi.org/10.1007/s10346-013-0436-y
Hussin, H. Y., Zumpano, V., Reichenbach, P., Sterlacchini, S., Micu, M., van Westen, C., & Balteanu, D. (2016). Different landslide sampling strategies in a grid-based bi-variate statistical susceptibility model. Geomorphology, 253, 508–523. http://doi.org/10.1016/j.geomorph.2015.10.030
ICIMOD. (2016). The Impact of Nepal ’ s 2015 Gorkha Earthquake-Induced Geohazards. International Centre for Integrated Mountain Development, Kathmandu, Nepal. Retrieved from ISBN 978 92 9115 386 2 (printed)
JAXA. (2016). Japan Aerospace Exploration Agency:AW3D World 3D Topographic Data - Global Digital Elevation Model. Retrieved December 18, 2016, from http://aw3d.jp/en/
Kappes, M. S., Malet, J. P., Remaître, A., Horton, P., Jaboyedoff, M., & Bell, R. (2011). Assessment of debris-flow susceptibility at medium-scale in the Barcelonnette Basin, France. Natural Hazards and Earth System Science, 11(2), 627–641. http://doi.org/10.5194/nhess-11-627-2011
Kappes, M. S., Papathoma-Kohle, M., & Keilier, M. (2011). Assessing physical vulnerability for multi-hazards using an indicator-based methodology. Applied Geography, (March 2011). http://doi.org/10.1016/j.apgeog.2011.07.002
Karsli, F., Atasoy, M., Yalcin, A., Reis, S., Demir, O., & Gokceoglu, C. (2009). Effects of land-use changes on landslides in a landslide-prone area (Ardesen, Rize, NE Turkey). Environmental Monitoring and Assessment, 156(1-4), 241–255. http://doi.org/10.1007/s10661-008-0481-5
Khanal, G. P. (2016). A Report on Geological Assement of Earthquake Affected Settlement Area , Rasuwa District , Central Nepal. Department of Mines and Geology (DMG), Nepal.
Kirschbaum, D. B., Stanley, T., & Simmons, J. (2015). A dynamic landslide hazard assessment system for Central America and Hispaniola. Natural Hazards and Earth System Science, 15(10), 2257–2272. http://doi.org/10.5194/nhess-15-2257-2015
Kumar, R., & Anbalagan, R. (2015). Landslide susceptibility zonation in part of Tehri reservoir region using frequency ratio , fuzzy logic and GIS, (2), 431–448.
Kumar, R., Shuichi, D. Æ., Nonomura, A., & Yamanaka, Æ. M. (2008). GIS-based weights-of-evidence modelling of rainfall-induced landslides in small catchments for landslide susceptibility mapping, 311–324. http://doi.org/10.1007/s00254-007-0818-3
Kuriakose, S. L. (2010). Physically based dynamic modeling of the effect of land use changes on shallow landslide initiation in the Western Ghats of Kerala, India. (PhD Thesis) ITC, University of Twente, Netherlands. Retrieved from https://www.itc.nl/library/papers_2010/phd/kuriakose.pdf
Lacroix, P. (2016). Landslides triggered by the Gorkha earthquake in the Langtang valley, volumes and initiation processes. Earth, Planets and Space, 68(1), 46. http://doi.org/10.1186/s40623-016-0423-3
Liu, B., Siu, Y. L., & Mitchell, G. (2016). Hazard interaction analysis for multi-hazard risk assessment : a systematic classification based on hazard-forming environment, (2012), 629–642. http://doi.org/10.5194/nhess-16-629-2016
Marzocchi, W., Gasparini, P., Garcia-aristizabal, A., Mastellone, M. L., Ruocco, A. Di, Marzocchi, R. W., & Gasparini, P. (2012). Basic principles of multi-risk assessment : a case study in Italy, (1), 1–27. http://doi.org/10.1007/s11069-012-0092-x
Minar, J., & Evans, I. S. (2008). Elementary forms for land surface segmentation : The theoretical basis of terrain analysis and geomorphological mapping, 95, 236–259. http://doi.org/10.1016/j.geomorph.2007.06.003
Mobaraki, A., Mansourian, A., Malek, M., & Mohammadi, H. (2006). Application of Mobile GIS and SDI for Emer gency Management. In International Society for Photogrammetry and Remote Sensing, Conference-XXXVI. Ankara, Turkey: ISPRS. Retrieved from www.isprs.org/proceedings/XXXVI/part1/Papers/PS3-50.pdf
Nicholson, P., & Namekar, S. (2013). Earthquake-Induced Landslides. In A. Ugai, Keizo, Yagi, Hiroshi, Wakai (Ed.), (pp. 725–736). Kiryu, Japan.: Springer Berlin Heidelberg. http://doi.org/10.1007/978-3-642-32238-9
Otto, J. C., & Smith, M. J. (2013). Geomorphological mapping. Geomorphological Techniques, Section 2., 1–10.

Development of a direct method for local scale post-earthquake multi-hazards susceptibility assessment
66
http://doi.org/10.1144/GSL.ENG.2001.018.01.08 Park, D. W., Lee, S. R., Vasu, N. N., Kang, S. H., & Park, J. Y. (2016). Coupled model for simulation of
landslides and debris flows at local scale. Natural Hazards, 81(3), 1653–1682. http://doi.org/10.1007/s11069-016-2150-2
Pellicani, R., Van Westen, C. J., & Spilotro, G. (2014). Assessing landslide exposure in areas with limited landslide information. Landslides, 11(3), 463–480. http://doi.org/10.1007/s10346-013-0386-4
PLANAT. (2005). VADEMECUM: Hazard Maps and Related Instruments in SWISS System. Bern, Switzerland. Retrieved from http://www.planat.ch/fileadmin/PLANAT/planat_pdf/alle_2012/2001-2005/PLANAT_2005_-_Vademecum.pdf
Poudyal, C. P. (2013). Landslide susceptibility analysis using decision tree method, Phidim, Eastern Nepal. Bulletin of the Department of Geology, 15, 69–76. http://doi.org/10.3126/bdg.v15i0.7419
Poudyal, C. P., Chang, C., Oh, H. J., & Lee, S. (2010). Landslide susceptibility maps comparing frequency ratio and artificial neural networks: A case study from the Nepal Himalaya. Environmental Earth Sciences, 61(5), 1049–1064. http://doi.org/10.1007/s12665-009-0426-5
Pourghasemi, H. R., Moradi, H. R., Fatemi Aghda, S. M., Gokceoglu, C., & Pradhan, B. (2014). GIS-based landslide susceptibility mapping with probabilistic likelihood ratio and spatial multi-criteria evaluation models (North of Tehran, Iran). Arabian Journal of Geosciences, 7(5), 1857–1878. http://doi.org/10.1007/s12517-012-0825-x
Pradhan, B. (2010). Application of an advanced fuzzy logic model for landslide susceptibility analysis Received : 20-05-2009 Accepted : 11-02-2010, 3(3), 370–381.
Pradhan, B. (2010a). Landslide Susceptibility mapping of a catchment area using frequency ratio , fuzzy logic and multivariate logistic regression approaches, (June), 301–320.
Pradhan, B. (2010b). Remote sensing and GIS-based landslide hazard analysis and cross-validation using multivariate logistic regression model on three test areas in Malaysia. Advances in Space Research, 45 (2010), 1244–1256. http://doi.org/10.1016/j.asr.2010.01.006
Pradhan, B., Oh, H.-J., & Buchroithner, M. (2010). Weights-of-evidence model applied to landslide susceptibility mapping in a tropical hilly area. Geomatics, Natural Hazards and Risk, 1(3), 199–223. http://doi.org/10.1080/19475705.2010.498151
Quan Luna, B., Blahut, J., van Asch, T., van Westen, C., & Kappes, M. (2016). ASCHFLOW - A dynamic landslide run-out model for medium scale hazard analysis. Geoenvironmental Disasters, 3(1), 29. http://doi.org/10.1186/s40677-016-0064-7
Rashid, I., Romshoo, S. A., Hajam, J. A., & Abdullah, T. (2016). A Semi-Automated Approach for Mapping Geomorphology in Mountainous Terrain , Ferozpora Watershed ( Kashmir Himalaya ). Geological Society of India, 88(August), 206–212. http://doi.org/10.1007/s12594-016-0479-5
Regmi, A. D., Yoshida, K., Pourghasemi, H. R., DhitaL, M. R., & Pradhan, B. (2014). Landslide susceptibility mapping along Bhalubang - Shiwapur area of mid-Western Nepal using frequency ratio and conditional probability models. Journal of Mountain Science, 11(5), 1266–1285. http://doi.org/10.1007/s11629-013-2847-6
Regmi, N. R., Giardino, J. R., & Vitek, J. D. (2010). Modeling susceptibility to landslides using the weight of evidence approach : Western Colorado , USA. Geomorphology, 115(1-2), 172–187. http://doi.org/10.1016/j.geomorph.2009.10.002
Saito, H., Nakayama, D., & Matsuyama, H. (2009). Comparison of landslide susceptibility based on a decision-tree model and actual landslide occurrence: The Akaishi Mountains, Japan. Geomorphology, 109(3-4), 108–121. http://doi.org/10.1016/j.geomorph.2009.02.026
Santacana, N., Baeza, B., Corominas, J., & De, A. N. A. (2003). A GIS-Based Multivariate Statistical Analysis for Shallow Landslide Susceptibility Mapping in La Pobla de Lillet Area ( Eastern Pyrenees , Spain ), 281–295.
Sato, H. P., & Harp, E. L. (2009). Interpretation of earthquake-induced landslides triggered by the 12 May 2008, M7.9 Wenchuan earthquake in the Beichuan area, Sichuan Province, China using satellite imagery and Google Earth. Landslides, 6(2), 153–159. http://doi.org/10.1007/s10346-009-0147-6
Shin, S. W., & Shin, D. Bin. (2014). Imagery map mobile web service to link geo-tagged information. KSCE Journal of Civil Engineering, 18(6), 1831–1838. http://doi.org/10.1007/s12205-014-0419-0
Tomaszewski, B. (2011). Situation awareness and virtual globes: Applications for disaster management. Computers and Geosciences, 37(1), 86–92. http://doi.org/10.1016/j.cageo.2010.03.009
van Asselen, S., & Seijmonsbergen, A. C. (2006). Expert-driven semi-automated geomorphological mapping for a mountainous area using a laser DTM. Geomorphology, 78(3-4), 309–320.

Development of a direct method for local scale post-earthquake multi-hazards susceptibility assessment
67
http://doi.org/10.1016/j.geomorph.2006.01.037 Van Westen, C., Quan Luna, B., Vargas Franco, R., Malet, J., Jaboyedoff, M., Horton, P., & Kappes, M.
(2010). Development of training materials on the use of Geo-information for Multi-Hazard Risk Assessment in a Mountainous Environment. Proceedings of the Mountain Risks International Conference, 469–475. Retrieved from http://www.researchgate.net/publication/234139496_Development_of_training_materials_on_the_use_of_geo_-_information_for_multi_-_hazard_risk_assessment_in_a_mountainous_environment/file/d912f50f86e5713aeb.pdf
Varnes, D. J. (1978). Slope Movement Types and Processes. Transportation Research Board Special Report, (176), 11 – 33. http://doi.org/In Special report 176: Landslides: Analysis and Control, Transportation Research Board, Washington, D.C.
Varnes, D. J. (1984). Landslide hazard zonation: a rewiew od principles and practise. Bulletin of the International Association of Engineering Geology. http://doi.org/10.1007/BF02594720
Yang, Z., Lan, H., Liu, H., Li, L., Wu, Y., Meng, Y., & Xu, L. (2015). Post- earthquake Rainfall- triggered Slope Stability Analysis in the Lushan Area. Journal of Mountain Science, 12(2). http://doi.org/10.1007/s11629-013-2839-6
Zare, M., Pourghasemi, H. R., Vafakhah, M., & Pradhan, B. (2013). Landslide susceptibility mapping at Vaz Watershed ( Iran ) using an artificial neural network model : a comparison between multilayer perceptron ( MLP ) and radial basic function ( RBF ) algorithms, 2873–2888. http://doi.org/10.1007/s12517-012-0610-x
Zhu, A.-X., Wang, R., Qiao, J., Qin, C.-Z., Chen, Y., Liu, J., … Zhu, T. (2014). An expert knowledge-based approach to landslide susceptibility mapping using GIS and fuzzy logic. Geomorphology, 214, 128–138. http://doi.org/10.1016/j.geomorph.2014.02.003
Zizioli, D., Meisina, C., Valentino, R., & Montrasio, L. (2013). Comparison between different approaches to modeling shallow landslide susceptibility: A case history in Oltrepo Pavese, Northern Italy. Natural Hazards and Earth System Sciences, 13(3), 559–573. http://doi.org/10.5194/nhess-13-559-2013
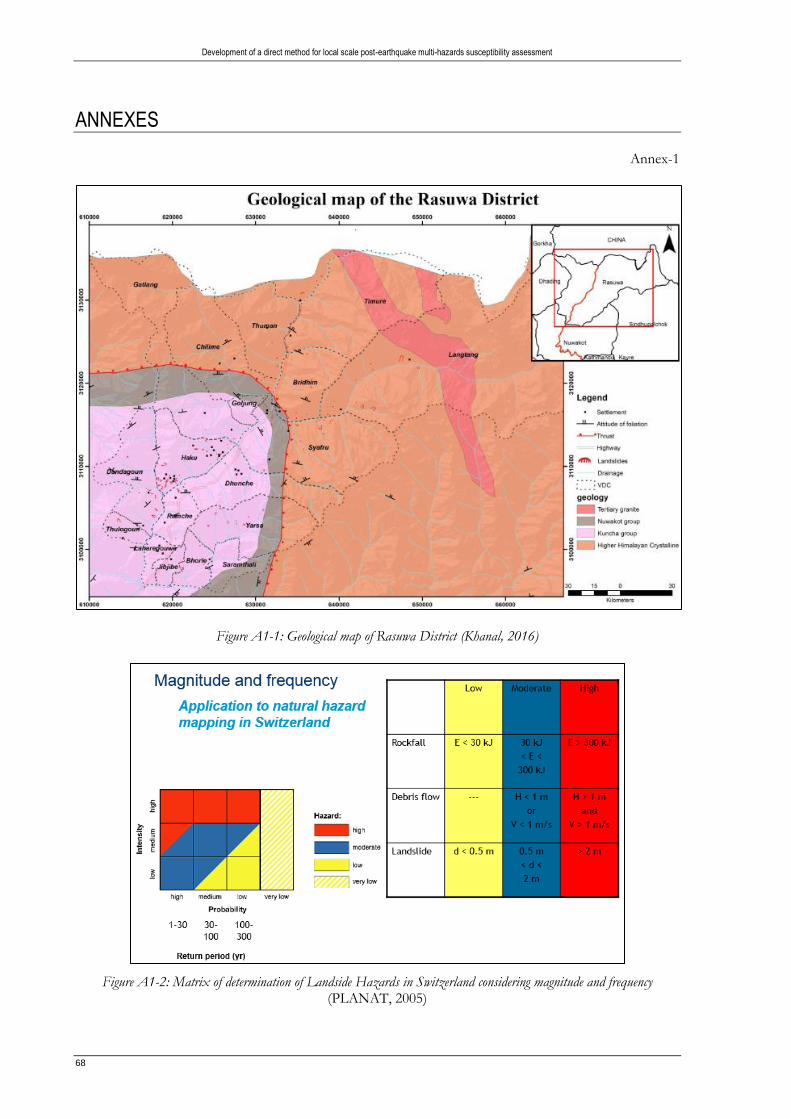
Development of a direct method for local scale post-earthquake multi-hazards susceptibility assessment
68
ANNEXES
Annex-1
Figure A1-1: Geological map of Rasuwa District (Khanal, 2016)
Figure A1-2: Matrix of determination of Landside Hazards in Switzerland considering magnitude and frequency (PLANAT, 2005)
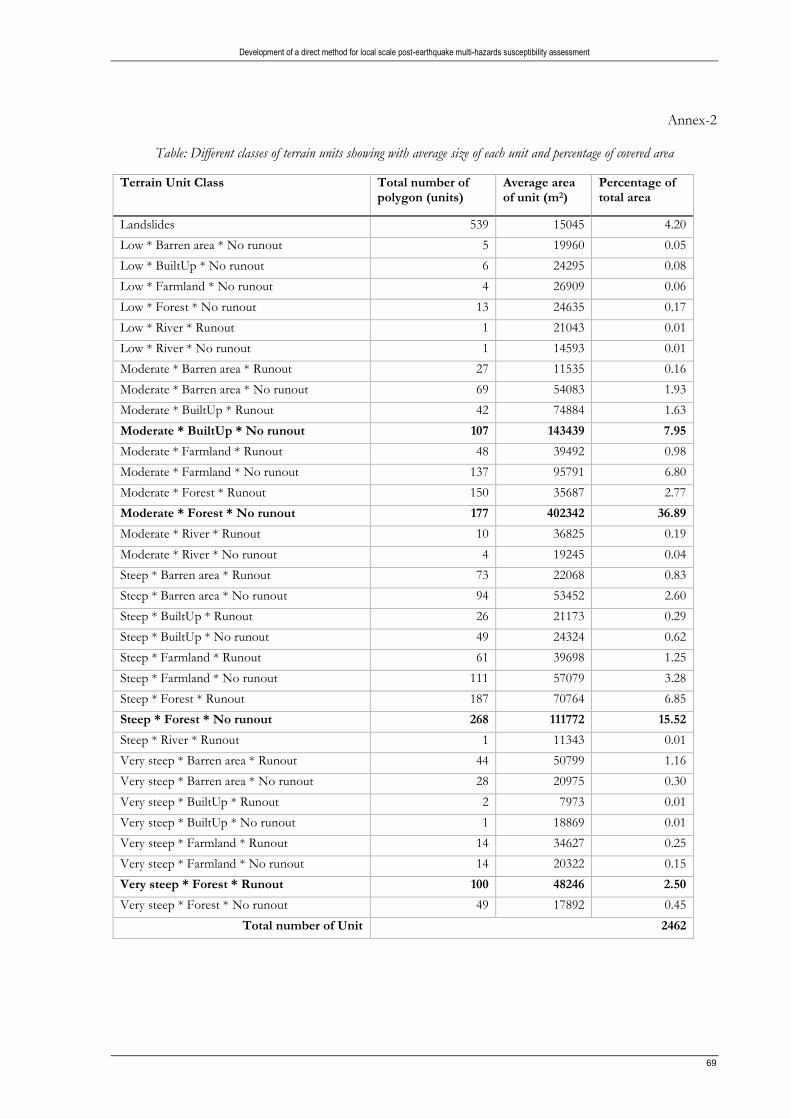
Development of a direct method for local scale post-earthquake multi-hazards susceptibility assessment
69
Annex-2
Table: Different classes of terrain units showing with average size of each unit and percentage of covered area
Terrain Unit Class Total number of polygon (units)
Average area of unit (m2)
Percentage of total area
Landslides 539 15045 4.20
Low * Barren area * No runout 5 19960 0.05
Low * BuiltUp * No runout 6 24295 0.08
Low * Farmland * No runout 4 26909 0.06
Low * Forest * No runout 13 24635 0.17
Low * River * Runout 1 21043 0.01
Low * River * No runout 1 14593 0.01
Moderate * Barren area * Runout 27 11535 0.16
Moderate * Barren area * No runout 69 54083 1.93
Moderate * BuiltUp * Runout 42 74884 1.63
Moderate * BuiltUp * No runout 107 143439 7.95
Moderate * Farmland * Runout 48 39492 0.98
Moderate * Farmland * No runout 137 95791 6.80
Moderate * Forest * Runout 150 35687 2.77
Moderate * Forest * No runout 177 402342 36.89
Moderate * River * Runout 10 36825 0.19
Moderate * River * No runout 4 19245 0.04
Steep * Barren area * Runout 73 22068 0.83
Steep * Barren area * No runout 94 53452 2.60
Steep * BuiltUp * Runout 26 21173 0.29
Steep * BuiltUp * No runout 49 24324 0.62
Steep * Farmland * Runout 61 39698 1.25
Steep * Farmland * No runout 111 57079 3.28
Steep * Forest * Runout 187 70764 6.85
Steep * Forest * No runout 268 111772 15.52
Steep * River * Runout 1 11343 0.01
Very steep * Barren area * Runout 44 50799 1.16
Very steep * Barren area * No runout 28 20975 0.30
Very steep * BuiltUp * Runout 2 7973 0.01
Very steep * BuiltUp * No runout 1 18869 0.01
Very steep * Farmland * Runout 14 34627 0.25
Very steep * Farmland * No runout 14 20322 0.15
Very steep * Forest * Runout 100 48246 2.50
Very steep * Forest * No runout 49 17892 0.45
Total number of Unit 2462
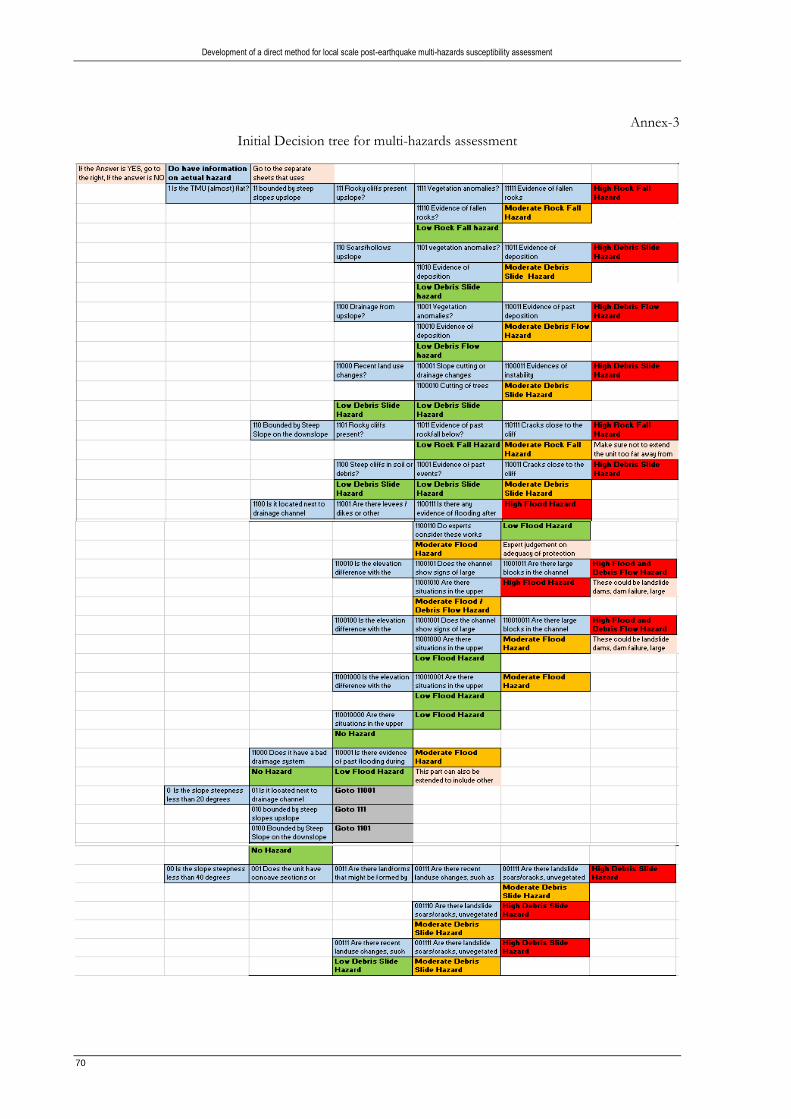
Development of a direct method for local scale post-earthquake multi-hazards susceptibility assessment
70
Annex-3
Initial Decision tree for multi-hazards assessment

Development of a direct method for local scale post-earthquake multi-hazards susceptibility assessment
71