Embed Size (px)
Citation preview

1
WAT E R S SO LU T IO NS
ionKey/MS System
ACQUITY UPLC® M-Class System
ionKey™ Source
Xevo® TQ-S Mass Spectrometer
iKey™ Separation Device
Oasis® MAX 96-well µElution Plate
MassLynx® 4.1 Software
Waters® Collection Plate
K E Y W O R D SOasis, sample preparation, bioanalysis, peptide quantification, Glucagon, UPLC, plasma, ionKey/MS, iKey
A P P L I C AT IO N B E N E F I T S ■■ High sensitivity assay with LOD of
12.5 pg/mL in human plasma.
■■ Reduced solvent consumption (50X) compared to 2.1 mm scale means significant cost savings.
■■ Use of mixed-mode solid-phase extraction (SPE) reduces matrix interferences and enhances selectivity of the extraction.
■■ 96-well μElution plate format enables concentration of the sample while maintaining solubility and minimizes peptide loss due to adsorption.
■■ Selective, fast SPE extraction (<30 minutes) without time-consuming immunoaffinity purification.
■■ The ionKey/MS™ System yielded 4X greater S:N and a 10X improvement in sensitivity over 2.1 mm scale allowing for greater confidence in results, more tests per sample, and more injections.
IN T RO DU C T IO N
Glucagon for Injection (rDNA origin) is a polypeptide hormone identical to human
glucagon and is used to treat severe hypoglycemia (low blood sugar).1 It is a
single chain polypeptide that contains 29 amino acids residues with a molecular
weight of 3483 (Figure 1). As a research tool, accurate quantification of glucagon
from biological matrices can help us to better understand diabetes as a function
of disease progression and/or drug treatment. Many assays, using different
methodologies exist for glucagon analysis in biological samples.2-7 Glucagon,
like other biologics, has historically been quantified using ligand binding assays
(LBAs).2-5 With advances in MS and chromatography technologies over the past
few years there has been a trend toward the analysis of large molecules by
LC-MS/MS. This is, in part, driven by the fact that LBAs can suffer from significant
cross-reactivity issues and lack of standardization. Additionally, LC-MS/MS also
has the advantage of shorter development times, greater accuracy and precision,
the ability to multiplex, and can readily distinguish between closely related
analogues, metabolites or endogenous interferences. Large peptides, such as
glucagon, are particularly difficult to analyze by LC-MS/MS as MS sensitivity
is low due to poor transfer into the gas phase and poor fragmentation. In addition,
glucagon suffers from significant non-specific binding, poor solubility,
and must be properly stabilized in biological matrices during collection
and sample preparation,6-8 making LC and sample preparation method
development challenging.
Development of a High Sensitivity SPE-LC-MS/MS Assay for the Quantification of Glucagon in Human Plasma Using the ionKey/MS SystemMary E. Lame, Erin E. Chambers, Sukhdev S. Bangar, and Kenneth J. Fountain Waters Corporation, Milford, MA, USA
Figure 1. Representative amino acid sequence of glucagon.

2
E X P E R IM E N TA L
Sample prepration
Step 1: Pretreatment
Commercially available plasma was treated with a protease inhibitor
cocktail (1:100). Plasma was then spiked with various concentrations
of glucagon and mixed. These samples (200 µL) were acidified with
acetic acid (0.5% final concentration) and vortexed, followed by
dilution with 200 µL 5% ammonium hydroxide in water.
Step 2: SPE using a Oasis® MAX µElution 96-well Plate (p/n 186001829)
Method conditions
UPLC conditionsLC System: ACQUITY UPLC M-Class, configured
for trap and back-flush elution
Separation device: iKey Peptide BEH C18, 130Å, 1.7 µm, 150 µm x 100 mm (p/n 186006766)
Trap column: ACQUITY UPLC M-Class Symmetry C18 Trap Column, 100Å, 5 µm, 300 µm x 50 mm (p/n 186007498)
Mobile phase A: 0.1% formic acid in water
Mobile phase B: 0.1% formic acid in acetonitrile
Loading solvent: 85:15 mobile phase A:B, 25 µL/min for first two minutes, reverse valve
Valve position: Initial position one (forward loading of trap), switch to position two at two minutes (back flush elute of trap onto the analytical column)
Analytical gradient: see Table 1
Elution flow rate: 2.0 µL/min
Column temp.: 75 °C
Sample temp.: 15 °C
Injection volume: 5 µL
Total run time: 14.5 min
Collection plates: Waters 1 mL Collection Plates
Table 1. LC gradient conditions.
Gradient: Time Profile
(min) %A %B Curve
0 85 15 6
6 55 45 6
6.5 15 85 6
8.5 15 85 6
9.5 85 15 6
CONDITION: 200 µL methanol
EQUILIBRATE: 200 µL water
LOAD SAMPLE: Entire diluted plasma sample (400 µL) was loaded onto the extraction plate
WASH 1: 200 µL 5% ammonium hydroxide in water
WASH 2: 200 µL 10% acetonitrile in water
ELUTE: 2 X 25 µL 65:25:10 acetonitrile:water: acetic acid
DILUTE: 50 µL water
INJECT: 5 µLMS conditionsMS system: Xevo TQ-S
Ionization mode: ESI positive
Capillary voltage: 3.8 kV
Source temp.: 120 °C
Cone gas flow: 100 L/hr
Collision cell pressure: 5.5 x 10 (-3) mbar
Collision energy: Optimized by component, see Table 2
Cone voltage: Optimized by component, see Table 2
Data managementChromatography software: MassLynx 4.1
Quantification software: TargetLynx™
Development of a High Sensitivity SPE-LC-MS/MS Assay for the Quantification of Glucagon in Human Plasma

3
The pharmacokinetic profile of administered exogenous glucagon is characterized by a rapid absorption and
elimination with a half-life of <20 minutes, resulting in a total duration of exposure to the peptide of ~2 hours.
At the practical clinical dose, 0.25–2.0 ng/mL, maximum glucagon levels of ~8 ng/mL are reached in
20 minutes. Endogenous glucagon in plasma is present in low pg/mL levels (<100 pg/mL), which makes
detection by LC-MS/MS even more difficult.
The work described herein uses a combination of selective μElution mixed-mode SPE sample preparation,
optimal MS precursor and fragment choice, and the ionKey/MS System (Figure 2) for the highly selective and
sensitive quantification of glucagon in human plasma. Detection limits of 12.5 pg/mL using only 200 μL of
plasma were achieved with a linear dynamic range from 12.5 to 1,000 pg/mL. This work also capitalizes on the
attributes of the ionKey/MS System enabling a 5X reduction in injection volume, a 10X increase in sensitivity,
and 4X increase in signal-to-noise (S:N) compared to 2.1 mm I.D. analytical scale method.
Figure 2. ionKey Source.
Development of a High Sensitivity SPE-LC-MS/MS Assay for the Quantification of Glucagon in Human Plasma

4
m/z300 400 500 600 700 800 900 1000 1100 1200 1300 1400 1500 1600
%
0
100
m/z300 400 500 600 700 800 900 1000 1100 1200 1300 1400 1500 1600
%
0
100
Daughters of 871ES+ 1.88e61040.4
871.4
841.9
752.2
706.0347.1
305.3
780.9
1002.8940.8
1083.9
1122.0
1447.41223.6 1298.5 1512.6
Daughters of 697ES+ 3.22e6693.8
579.4347.3 544.9
780.8752.0 1002.3940.2
841.71040.7
1376.9
A
B [M+5H]5+
[M+4H]4+
*
*
*
Figure 3. MSMS spectra of the 4+ (A) and 5+ (B) precursors of glucagon. Fragments chosen for quantitation are indicated by asterisks (*).
Table 2. MS Conditions for glucagon.
Precursor MRM transition Cone voltage (V)
Collision energy (eV)
Product ion type
[M+5H]5+ 697.1>693.5 40 12 Ammonia loss(5+)
[M+5H]5+ 697.1>940.2 40 20 b24(3+)
[M+4H]4+ 871.5>1040.2 40 26 b26(3+)
R E SU LT S A N D D IS C U S S IO N
Mass spectrometry
The 4+(m/z 871.5) and 5+(m/z 697.1) multiply charged precursors were observed for glucagon; MSMS spectra for these precursors,
obtained at their optimal collision energies, are shown in Figure 3. The fragments at m/z 693.5 and 940.2 of the 5+ precursor, and
1040.2 of the 4+ precursor were chosen for quantification (Table 2). Although many peptides produce intense fragments below m/z 200,
these ions (often immonium ions) result in high background in extracted samples due to their lack of specificity. In this assay, the use of
highly specific b/y fragments yielded significantly improved specificity, facilitating the use of simpler LC and SPE methodologies.
Development of a High Sensitivity SPE-LC-MS/MS Assay for the Quantification of Glucagon in Human Plasma

5
Liquid chromatography
Chromatographic separation of glucagon was achieved using the novel microfluidic chromatographic iKey
Separation Device. The iKey Separation Device (Figure 4) is packed with UPLC®-grade sub-2-µm particles that
permits operation at high pressure and results in highly efficient LC separations. By integrating microscale
LC components into a single platform design, problems associated with capillary connections, including
manual variability, leaks, and excessive dead volume, are avoided. Use of the iKey Separation Device
provided excellent peak shape, narrow peak widths (<4.0 secs at base), and resolution from endogenous
matrix interferences.
Glucagon was eluted using a linear gradient from 15–45% B over 6 minutes. Representative chromatograms
are shown in Figure 5. The use of multidimensional chromatography, specifically a trap and back-flush elution
strategy, provided further sample cleanup and facilitated the loading of 5 μL of the high organic SPE eluate
(required to maintain solubility of the peptides) without experiencing analyte breakthrough. Additionally, the
ability to inject sample volumes typical for analytical scale LC analysis on the iKey Separation Device can
provide the substantial gains in sensitivity that are often required to accurately and reliably detect low pg/mL
levels of peptides and proteins in complex matrices.
Time1.00 2.00 3.00 4.00 5.00 6.00 7.00 8.00 9.00 10.00 11.00 12.00 13.00
%
0
100
1.00 2.00 3.00 4.00 5.00 6.00 7.00 8.00 9.00 10.00 11.00 12.00 13.00
%
0
100
1.00 2.00 3.00 4.00 5.00 6.00 7.00 8.00 9.00 10.00 11.00 12.00 13.00
%
0
100MRM of 4 Channels ES+
697.1 > 940.2 (Glucagon)3.56e6
7.53
MRM of 4 Channels ES+ 871.5 > 1040.2 (Glucagon)
3.56e6
7.53
MRM of 4 Channels ES+ 697.1 > 693.5 (Glucagon)
3.56e6
7.54
[M+5H]5+/Ammonia Loss
[M+5H]5+/b24(3+)
[M+4H]4+/b26(3+)
Figure 5. UPLC separation of glucagon from extracted plasma, using the iKey Peptide BEH C18, 130Å 1.7 µm, 150 µm x 100 mm (p/n 186006766).
Figure 4. iKey Separations Device.
Development of a High Sensitivity SPE-LC-MS/MS Assay for the Quantification of Glucagon in Human Plasma

6
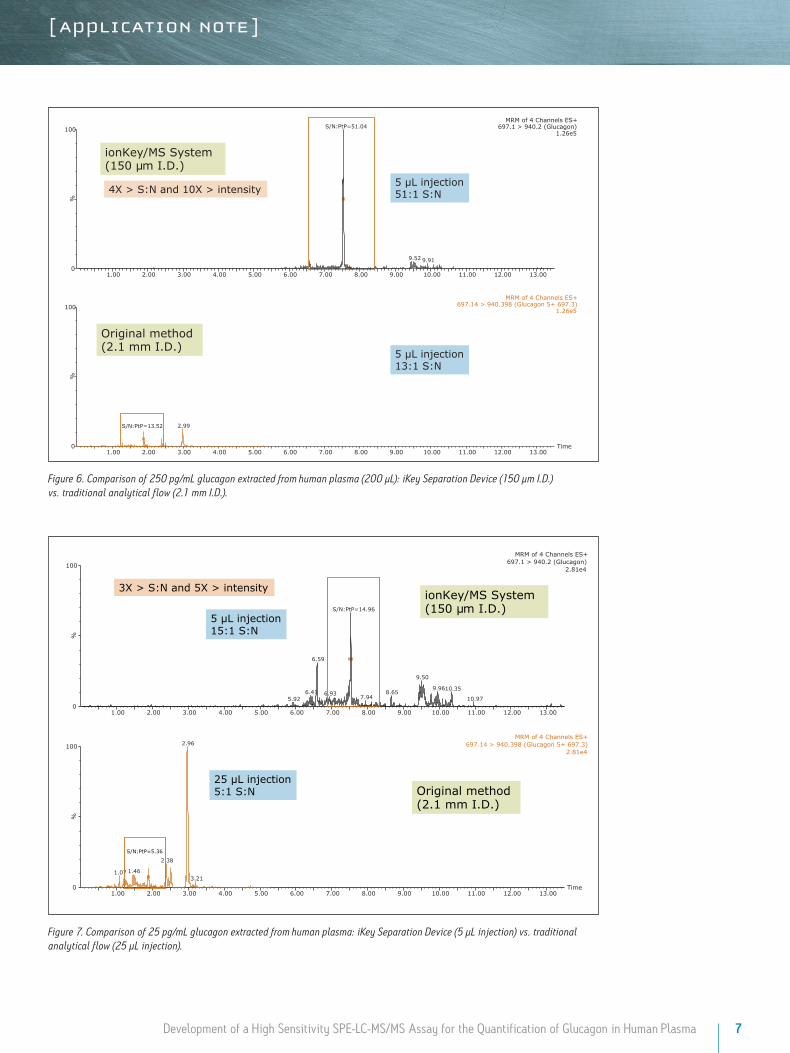
Enhanced sensitivity with the use of the ionKey/MS System
Versus analytical scale (2.1 mm I.D.), the ionKey/MS System generally offers increased sensitivity, making
it ideal for glucagon analysis. This also facilitates the use of smaller sample volumes whilst maintaining or
improving sensitivity. For a 250 pg/mL plasma extracted sample, the same injection volume (5 μL) on the
ionKey/MS System yielded 4X greater S:N and a 10X improvement in sensitivity versus 2.1 mm scale
(Figure 6). Using the 150 µm iKey Separation Device, low pg/mL levels of glucagon were detected in extracted
plasma. Figure 7 demonstrates the improvements the ionKey/MS System provides for a 25 pg/mL extracted
plasma sample. Versus 2.1 mm scale (25 μL injection), a 5 μL injection on the ionKey/MS System yields 5X
greater sensitivity and a 3X improvement in S:N. Ultimately, the use of the ionKey/MS System enabled the
development of a low flow quantitative MRM method for glucagon that achieved detection limits of 12.5 pg/mL
from only 200 μL of plasma.
Sample preparation
Development of this assay was challenging due to a high degree of non-specific binding (NSB) and difficulty
maintaining peptide solubility throughout the SPE extraction and elution process. SPE was performed using
Oasis MAX, a mixed-mode sorbent, to enhance selectivity. To ensure glucagon stability during sample
preparation and extraction, human plasma was treated with protease inhibitor cocktail. Glucagon was then
spiked at various concentrations into the plasma and mixed. These samples were then acidified with acetic acid
(0.5% final concentration). Acidification helped disrupt protein binding. Plasma samples were then pre-treated
with 5% NH4OH in water to adjust pH prior to SPE. The diluted plasma (pH >10) samples were then applied to
conditioned SPE plates. Glucagon was well retained on the SPE sorbent during the load step, with no break-
through occurring. At this basic pH, glucagon will carry a net negative charge, putting it in the proper charge
state to bind to Oasis MAX (quaternary amine) by ion exchange. Optimization of the elution solution was
critical to maximize recovery, maintain its solubility, and minimize interferences from the plasma matrix.
The optimum elution solution was 65% organic, 25% water, with 10% acetic acid.
The enhanced selectivity of the Oasis MAX SPE extraction was imperative to accurately detect and quantify low
pg/mL levels of glucagon in plasma. This is especially important where the use of the less specific 5+ precursor
and ammonia loss fragment MRM transition might be necessary to achieve low limits of detection. During
method development, use of reversed-phase (RP) only SPE was assessed. RP SPE yielded 10–15% greater
recovery than the strong anion-exchange mixed-mode SPE (MAX). However, endogenous background was
higher and yielded greater matrix effects (data not shown). In particular, matrix effects were >30% for the
ammonia loss MRM transition when RP only extraction was employed. This greatly limited its use for robust
quantification. Alternatively, the enhanced selectivity of the Oasis MAX SPE device greatly reduced matrix
effects (<15%) and facilitated use of the less specific ammonia loss fragment for accurate quantification. In
addition, the 96-well Oasis µElution Plate can be processed manually in under 30 minutes and is compatible
with most liquid-handling robotic systems for automation to meet sample throughput requirements. This format
also provides the ability to elute in very small sample volumes, minimizes the potential for adsorptive peptide
losses and chemical instability, as well as concentrates the sample for increased sensitivity.
Development of a High Sensitivity SPE-LC-MS/MS Assay for the Quantification of Glucagon in Human Plasma
7
Time1.00 2.00 3.00 4.00 5.00 6.00 7.00 8.00 9.00 10.00 11.00 12.00 13.00
%
0
100
1.00 2.00 3.00 4.00 5.00 6.00 7.00 8.00 9.00 10.00 11.00 12.00 13.00
%
0
100MRM of 4 Channels ES+
697.1 > 940.2 (Glucagon)1.26e5
S/N:PtP=51.04
9.52 9.91
MRM of 4 Channels ES+ 697.14 > 940.398 (Glucagon 5+ 697.3)
1.26e5
2.99S/N:PtP=13.52
4X > S:N and 10X > intensity 5 L injection 51:1 S:N
5 L injection 13:1 S:N
ionKey/MS System(150 µm I.D.)
Original method (2.1 mm I.D.)
Figure 6. Comparison of 250 pg/mL glucagon extracted from human plasma (200 µL): iKey Separation Device (150 µm I.D.) vs. traditional analytical flow (2.1 mm I.D.).
Figure 7. Comparison of 25 pg/mL glucagon extracted from human plasma: iKey Separation Device (5 µL injection) vs. traditional analytical flow (25 µL injection).
Time1.00 2.00 3.00 4.00 5.00 6.00 7.00 8.00 9.00 10.00 11.00 12.00 13.00
%
0
100
1.00 2.00 3.00 4.00 5.00 6.00 7.00 8.00 9.00 10.00 11.00 12.00 13.00
%
0
100
MRM of 4 Channels ES+ 697.1 > 940.2 (Glucagon)
2.81e4
S/N:PtP=14.96
6.59
6.415.92
6.93
9.50
8.657.94
9.9610.35
10.97
MRM of 4 Channels ES+ 697.14 > 940.398 (Glucagon 5+ 697.3)
2.81e42.96
2.38
1.461.073.21
3X > S:N and 5X > intensity ionKey/MS System(150 µm I.D.)
Original method (2.1 mm I.D.)
5 L injection 15:1 S:N
25 L injection 5:1 S:N
S/N:PtP=5.36
Development of a High Sensitivity SPE-LC-MS/MS Assay for the Quantification of Glucagon in Human Plasma

8
Time1.00 2.00 3.00 4.00 5.00 6.00 7.00 8.00 9.00 10.00 11.00 12.00 13.00
%
0
100
1.00 2.00 3.00 4.00 5.00 6.00 7.00 8.00 9.00 10.00 11.00 12.00 13.00
%
0
100
1.00 2.00 3.00 4.00 5.00 6.00 7.00 8.00 9.00 10.00 11.00 12.00 13.00
%
0
100
MRM of 4 Channels ES+ 697.1 > 940.2 (Glucagon)
1.61e6
S/N:RMS=230.26
MRM of 4 Channels ES+ 871.5 > 1040.2 (Glucagon)
1.61e6
S/N:RMS=243.21
MRM of 4 Channels ES+ 697.1 > 693.5 (Glucagon)
1.61e6S/N:RMS=244.13
697.1 693.5Non-specific ammonia loss
697.1 940.2Specific b24 ion
871.5 1040.2Specific b26 ion
S:N 230
S:N 243
S:N 244
Figure 8. Comparison of glucagon MRM transition sensitivity and specificity in a 500 pg/mL extracted human plasma sample.
Specificity vs. sensitivity
Triple quadrupole mass spectrometers, when
operated in MRM mode, offer a unique combination
of sensitivity, specificity, and dynamic range.
However, in biological matrices, the task of
achieving analyte specificity can be difficult,
particularly with large peptides due to the high
abundance of other endogenous proteins and
peptides. Thus, the challenge of improving specificity
lies not only in the sample preparation, and
chromatography, but also selective choice of MRM
transition for analysis. In the case of glucagon, the
697.1/693.5 MRM transition, corresponding to the
5+ precursor and ammonia loss fragment, resulted in
a 10X greater signal than any of the other selective
precursor/fragment transitions when tested in neat
standard solution (data not shown) and in extracted
plasma. However, in extracted plasma samples it was
not as specific and resulted in higher background
noise. Figure 8 shows a 500 pg/mL extracted plasma
sample, and demonstrates the increased sensitivity
and lack of specificity of the ammonia loss transition
compared to the selective b-ion transitions.
Table 3. Glucagon standard curve summary statistics from 12.5–1,000.0 pg/mL extracted from human plasma.
Std. conc (pg/mL)
Area Calc. conc. (pg/mL)
%Dev Accuracy
Blank – – – –
Blank – – – –
12.5 469 13.8 10.5 89.5
12.5 461 13.6 9.0 91.0
25 982 25.8 3.3 96.7
25 959 25.3 1.1 98.9
50 2005 49.8 -0.4 100.4
50 2080 53.5 6.9 93.1
100 3958 95.6 -4.4 104.4
100 3733 90.3 -9.7 109.7
250 10142 240.5 -3.8 103.8
250 9481 225.0 -10.0 110.0
500 20893 492.4 -1.5 101.5
500 20184 475.8 -4.8 104.8
1000 44244 1039.5 4.0 96.0
1000 44094 1036.0 3.6 96.4
Development of a High Sensitivity SPE-LC-MS/MS Assay for the Quantification of Glucagon in Human Plasma

9
Although the intensity using the 697.1/ 693.5 MRM
transition is 10X greater than the b-specific ion
transitions (697.1>940.2 and 871.5 >1040.2),
its sensitivity is mitigated by the accompanying
higher background signal, as is demonstrated by
the equivalent S:N ratios of all 3 MRM transitions.
Additionally, measured matrix effects for the
b-specific ion transitions were less than 10% in
plasma, while the ammonia loss transition resulted
in matrix effects between 10–15%. A summary of
standard curve performance is shown in Table 3,
and is illustrated in Figure 9. Using a 1/X regression,
glucagon was linear from 12.5–1,000.0 pg/mL
with R2 values of >0.99 for all 3 MRM transitions
monitored. Representative chromatograms for
extracted glucagon plasma standard samples are
shown in Figure 10.
Figure 9. Representative standard curve in human plasma, from 12.5–1,000.0 pg/mL.
Compound name: Glucagon 1040Correlation coefficient: r = 0.998699, r2 = 0.997400Calibration curve: 42.6771 * x + -120.577Response type: External Std, AreaCurve type: Linear, Origin: Exclude, Weighting: 1/x, Axis trans: None
pg/mL-0 100 200 300 400 500 600 700 800 900 1000
Res
pons
e
-0
10000
20000
30000
40000
Time1.00 2.00 3.00 4.00 5.00 6.00 7.00 8.00 9.00 10.00 11.00 12.00 13.00
%
0
100
1.00 2.00 3.00 4.00 5.00 6.00 7.00 8.00 9.00 10.00 11.00 12.00 13.00
%
0
100
1.00 2.00 3.00 4.00 5.00 6.00 7.00 8.00 9.00 10.00 11.00 12.00 13.00
%
0
100
1.00 2.00 3.00 4.00 5.00 6.00 7.00 8.00 9.00 10.00 11.00 12.00 13.00
%
0
100
1.00 2.00 3.00 4.00 5.00 6.00 7.00 8.00 9.00 10.00 11.00 12.00 13.00
%
0
100
1.00 2.00 3.00 4.00 5.00 6.00 7.00 8.00 9.00 10.00 11.00 12.00 13.00
%
0
100
1.00 2.00 3.00 4.00 5.00 6.00 7.00 8.00 9.00 10.00 11.00 12.00 13.00
%
0
100
1.00 2.00 3.00 4.00 5.00 6.00 7.00 8.00 9.00 10.00 11.00 12.00 13.00
%
0
100MRM of 4 Channels ES+
871.5 > 1040.2 (Glucagon)9.86e5
Area
39153
MRM of 4 Channels ES+ 871.5 > 1040.2 (Glucagon)
6.07e5Area
22564
MRM of 4 Channels ES+ 871.5 > 1040.2 (Glucagon)
2.78e5Area
10780
MRM of 4 Channels ES+ 871.5 > 1040.2 (Glucagon)
8.45e4Area
3346
MRM of 4 Channels ES+ 871.5 > 1040.2 (Glucagon)
4.62e4Area
1693
MRM of 4 Channels ES+ 871.5 > 1040.2 (Glucagon)
2.50e4Area
856
MRM of 4 Channels ES+ 871.5 > 1040.2 (Glucagon)
2.13e4Area
486
MRM of 4 Channels ES+ 871.5 > 1040.2 (Glucagon)
3.49e4Blank plasma
12.5 pg/mL
25 pg/mL
50 pg/mL
100 pg/mL
250 pg/mL
500 pg/mL
1,000 pg/mL Area
Figure 10. Representative chromatograms from glucagon extracted from plasma at 12.5, 25, 50, 100, 250, 500, and 1,000 pg/mL, compared to blank plasma.
Development of a High Sensitivity SPE-LC-MS/MS Assay for the Quantification of Glucagon in Human Plasma

Waters Corporation 34 Maple Street Milford, MA 01757 U.S.A. T: 1 508 478 2000 F: 1 508 872 1990 www.waters.com
Waters, T he Science of What’s Possible, ACQUITY UPLC, Xevo, Oasis, MassLynx, ACQUITY, Symmetry, and UPLC are registered trademarks of Waters Corporation. ionKey/MS, iKey, ionKey, and TargetLynx are trademarks of Waters Corporation. All other trademarks are the property of their respective owners.
©2014–2016 Waters Corporation. Produced in the U.S.A. January 2016 720005073EN AG-PDF
CO N C LU S IO NS
The combination of the ionKey/MS System, mixed-mode µElution SPE, and higher
m/z b or y ion MS fragments provided the level of selectivity and sensitivity
necessary to accurately quantify low pg/mL concentrations of glucagon in
extracted plasma. Use of µElution format SPE eliminated the need for evaporation,
reducing glucagon losses due to adsorption and non-specific binding. The 150 µm
iKey Separation Device enabled the development of a highly sensitive, low flow
quantitative MRM method for glucagon with an LOD of 12.5 pg/mL and a dynamic
range from 12.5–1,000.0 pg/mL. The current analysis uses 200 µL of plasma and
provides a significant improvement in sensitivity and S:N over the analytical scale
(2.1 mm I.D.) analysis using 1/5th the sample injection volume. Furthermore, an
injection of the same volume (5 µL) of sample corresponded to a 10X increase in
on-column sensitivity allowing for greater confidence in results, as compared to
the traditional analytical method for this peptide. In addition, the ionKey/MS
System reduces solvent and sample consumption, thereby reducing cost and
allowing for multiple injections of samples for improved accuracy or to meet the
guidelines for incurred sample reanalysis (ISR).
References
1. Eli Lilly and Company Glucagon United States package insert. http://pi.lilly.com/us/rglucagon-pi.pdf
2. R&D Systems, Inc. Quantikine® ELISA Glucagon Immunoassay, Catalog Number DGCG0. For the Quantitative Determination of Glucagon Concentrations in Cell Culture Supernates, Serum, and Plasma. R&D Systems, Inc., Minneapolis, MN, USA (2011).
3. EMD Millipore Corporation. Glucagon Chemiluminescent ELISA Kit, 96-Well Plate (Cat # EZGLU-30K). EMD Millipore Corporation, St. Charles, MO, USA (2012).
4. Millipore. Glucagon RIA Kit, 250 Tubes (Cat. # GL-32K). Millipore, St. Charles, MO, USA (2011).
5. ALPCO Diagnostics. Glucagon RIA: For the Quantitative Determination of Glucagon in Plasma. ALPCO Diagnostics, Salem, NH, USA (2011).
6. Lapko V, Brown P, Nachi R et al. Exploring quantification of peptides: measurement of glucagon in human plasma by LC-MS/MS. Presented at: EBF 3rd Annual Open Symposium: From Challenges to Solutions. Barcelona, Spain, 1–3 December 2010.
7. Lapko VN, Miller PS, Brown GP, Islam R et al. Sensitive glucagon quantification by immunochemical and LC-MS/MS methods. Bioanalysis (2013) 5(23).
8. Gerich JE, Lorenzi M, Bier DM et al., Effects of physiologic levels of glucagon and growth hormone on human carbohydrate and lipid metabolism. Studies involving administration of exogenous hormone during suppression of endogenous hormone secretion with somatostatin. J.Clin Invest. 1976 Apr; 57(4):875–84.