Embed Size (px)
Citation preview

Development of a Methodology to Determine Risk of Counterfeit Use
iNEMI Counterfeit Components Project Team Mark Schaffer, iNEMI, [email protected]
ABSTRACT
Counterfeit components have become a multi-million dollar, yet undesirable, part of the electronics industry. The profitability of the counterfeit industry rests in large part on its ability to recognize supply constraints and quickly respond, effectively taking advantage of a complex and vulnerable supply chain. Factors such as product obsolescence, long life cycles, economic downturn and recovery, local disruptions in manufacturing due to natural disasters, and lack of proper IP legislation all represent opportunities for the counterfeit component industry to flourish. Electronic counterfeits affect every segment of the market, including consumer goods, networking and communications, medical, automotive, and aerospace and defense. In manufacturing, the use of undetected counterfeits can lead to increased scrap rates, early field failures, and increased rework rates; while this presents a major problem impacting profitability, the use of counterfeit components in high-reliability applications can have far more serious consequences with severe or lethal outcomes.
The independent distributor level has typically been seen as the weak link in the supply chain where counterfeits are most likely to be introduced. With the emergence of new legislation and through the efforts of different industry entities, new standards and guidelines are now available for suppliers to establish and maintain product traceability and to establish receiving inspection and detection protocols. There is no substitute for a healthy supply chain, and distributors play an essential role in the dynamics of the system. At the same time, there is an increased awareness of the need for proper management of electronic waste. Regardless of the nature of the counterfeits, whether cloned, skimmed, or re-branded, counterfeits are dangerous and too expensive to be ignored.
The work presented here by the iNEMI Counterfeit Components Project takes a comprehensive view of the problem by surveying the possible points of entry in the supply chain and assessing the impact of counterfeit components on the industry at various points of use. We then propose a risk assessment calculator that can be used to quantify the risks of procuring counterfeit parts. This calculator is aimed at all segments of the supply chain and will be of interest to component manufacturers, product designers, distributors, loss estimators, industry groups and end users.
INTRODUCTION
The existence of counterfeit electronic components, materials and assemblies (hereafter referred to simply as counterfeit components) is not a new phenomenon1, 2. However, global trade of counterfeit components has recently increased markedly. There are four distinct categories of electronic products in which counterfeit components are most frequently found:
• Manufacturing shortfall and product shortages • High-value products • Obsolete, discontinued, and legacy devices • Field installable options or upgrades
1 Bill Crowley, “Automated Counterfeit Electronic Component Warning System and Counterfeit Examples”, SMTA/CALCE
Counterfeit Symposium, June 2012 2 Philip DiVita et al, “Avoiding Counterfeit Parts When Addressing Component Obsolescence”, SMTA/CALCE Counterfeit
Symposium, June 2012

Development of a Methodology to Determine Risk of Counterfei t Use (© iNEMI 2013)
2
The Semiconductor Industries Association Anti-Counterfeiting Task Force3 has defined counterfeiting as:
• Substitution or the use of unauthorized copies of a device or product • The use of inferior materials or a modification of performance without notice • The sale of a substandard component or product in place of an original OCM device or OEM product
The following definition was adopted from “Defense Industrial Base Assessment: Counterfeit Electronics”; US Dept of Commerce – Office of Technology Evaluation; January 2010.4
… a counterfeit is an electronic part that is not genuine because it:
• Is an unauthorized copy • Does not conform to original manufacturer’s design, model, and/or performance standards • Is not produced by the original manufacturer or is produced by unauthorized contractors • Is an off-specification, defective, or used product sold as "new" or working • Has incorrect or false markings and/or documentation
COUNTERFEIT DEVICE CATEGORIES
Counterfeit components can be produced, sourced, and distributed in many different ways. The identity of these non-standard parts is usually very well concealed in the present supply chain. Types of counterfeit components can be divided into the following categories.
Cloning The complete manufacture of a reverse engineered device to have the same form, fit, and function as the original. Devices are produced on low end equipment and will not meet the original reliability requirements. Devices are branded and sold as Original Component Manufacturer (OCM) parts.
Product “skimming”, subcontractors, or second source suppliers Manufacturers may over-produce or claim a lower production yield. These extra devices can then be introduced into the market through the broker chains.
Disposal of scrap and rejects Devices rejected during manufacturing are sent to recyclers to salvage precious metals. Recyclers may certify destruction without scrapping the devices and subsequently sell them back into the supply chain.
Devices used as qualification samples OCMs and OEMs use large quantities of devices to qualify/certify form, fit and function of devices. Accelerated life testing is used to evaluate the functionality and reliability at end of life. Pilfered devices stored for future evaluations can be sold into the supply chain as virgin product. When scrapped, many units may still function making this material a prime target for diversion frauds.
Reclamation and reuse of components Large quantities of electronic equipment containing working devices are scrapped. Valuable components can be recovered for reuse; however, uncontrolled removal can damage and/or compromise the original electrical performance, reliability and operational life. These compromised parts can then be sold into the supply chain.
Re-branding Some products have high performance requirements and must undergo more extensive testing during manufacture (for example, devices that must operate at extreme temperature ranges, such as automotive, aerospace and military applications, or high speed versions of memory modules and processors). Devices with lower specifications that were never tested to the more stringent specifications are acquired at a lower cost, re-marked, and resold at the higher price.
False claims of conformity to industry certifications (e.g., RoHS) Paperwork is provided stating devices are compliant and old (non-compliant) devices are substituted.
Devices containing embedded malicious malware Programmable devices are reprogrammed to cause latent damage to products. This problem is most critical in the Aerospace, Defense, and Medical sectors in which counterfeits could render systems inoperative, compromising the safety and security of users. The Office and Large Business Systems sector, in particular, the FSI (financial services institutions) and pharmaceuticals, own a lot of embedded servers supporting mission critical activities that could pose serious economic and health risks. The latter may have greater implications and impact on a global crisis via malware.
3 http://www.semiconductors.org 4 http://www.bis.doc.gov/defenseindustrialbaseprograms/osies/defmarketresearchrpts/final_counterfeit_electronics_report.pdf
Development of a Methodology to Determine Risk of Counterfei t Use (© iNEMI 2013)
3
SITUATION ANALYSIS
iNEMI segregates the electronics industry into the following product sectors. (See Table 1 for details of the sectors and typical product service times.).
• Aerospace and Defense • Automotive • Medical • High-End Systems (including data communication, networking, voice communication and large business
systems) • Office Systems • Consumer and Portable
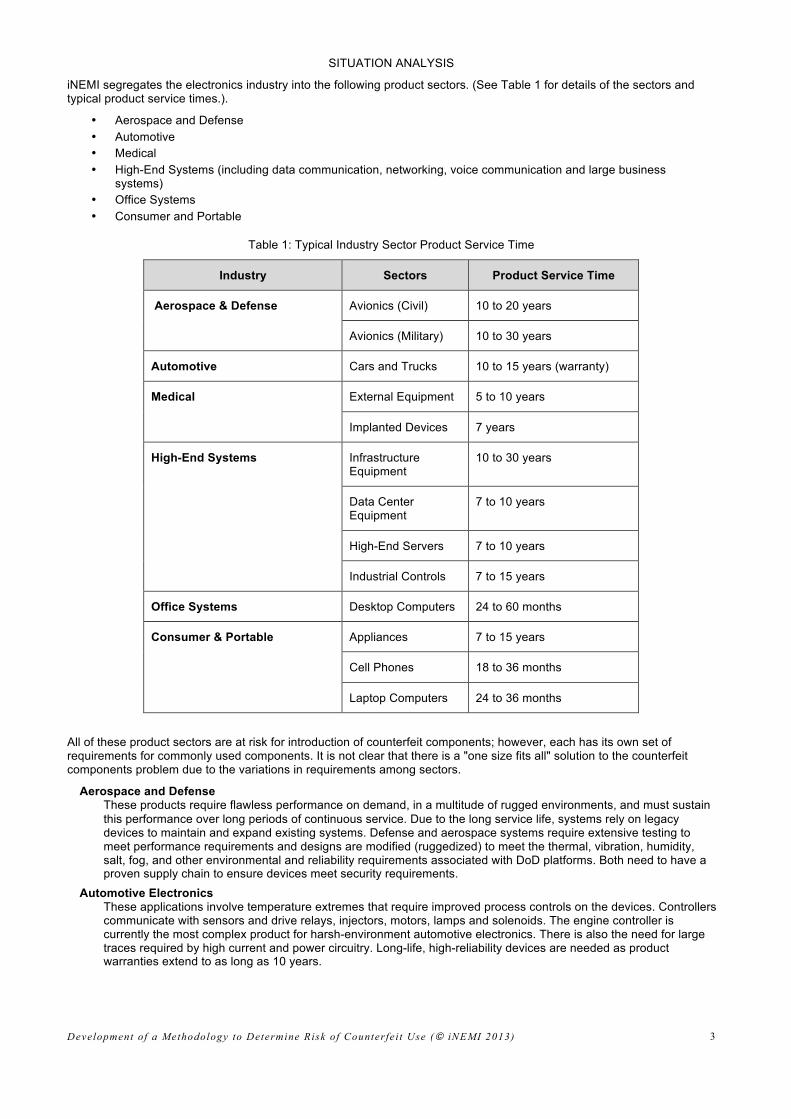
Table 1: Typical Industry Sector Product Service Time
Industry Sectors Product Service Time
Avionics (Civil) 10 to 20 years Aerospace & Defense
Avionics (Military) 10 to 30 years
Automotive Cars and Trucks 10 to 15 years (warranty)
External Equipment 5 to 10 years Medical
Implanted Devices 7 years
Infrastructure Equipment
10 to 30 years
Data Center Equipment
7 to 10 years
High-End Servers 7 to 10 years
High-End Systems
Industrial Controls 7 to 15 years
Office Systems Desktop Computers 24 to 60 months
Appliances 7 to 15 years
Cell Phones 18 to 36 months
Consumer & Portable
Laptop Computers 24 to 36 months
All of these product sectors are at risk for introduction of counterfeit components; however, each has its own set of requirements for commonly used components. It is not clear that there is a "one size fits all" solution to the counterfeit components problem due to the variations in requirements among sectors.
Aerospace and Defense These products require flawless performance on demand, in a multitude of rugged environments, and must sustain this performance over long periods of continuous service. Due to the long service life, systems rely on legacy devices to maintain and expand existing systems. Defense and aerospace systems require extensive testing to meet performance requirements and designs are modified (ruggedized) to meet the thermal, vibration, humidity, salt, fog, and other environmental and reliability requirements associated with DoD platforms. Both need to have a proven supply chain to ensure devices meet security requirements.
Automotive Electronics These applications involve temperature extremes that require improved process controls on the devices. Controllers communicate with sensors and drive relays, injectors, motors, lamps and solenoids. The engine controller is currently the most complex product for harsh-environment automotive electronics. There is also the need for large traces required by high current and power circuitry. Long-life, high-reliability devices are needed as product warranties extend to as long as 10 years.
Development of a Methodology to Determine Risk of Counterfei t Use (© iNEMI 2013)
4
Medical Products
These include large infrastructure equipment, small stationary equipment, and implantable devices. High reliability is required for life critical applications such as electronic implants, medical imaging systems, and resuscitation systems. Many of the large systems use legacy devices and need a reliable supply of replacement parts.
High-End Systems These include three major categories: high-performance computing, data centers and communications. The networking and computing hardware has been gaining more common components as communications becomes an integral part of enterprise computing and as technology advancements enable tighter integration of communication and computing technologies in commercial business systems. The products represented include mainframe and high-performance computers, the data centers and server farms that house the computers, and communications equipment such as switches and routers and enterprise service provider equipment.
Office Systems These include desktop PCs, and other general office equipment (printers, copiers). This sector is cost sensitive and requires the latest cost effective technologies. The main vulnerabilities relative to counterfeit components are cloning, product "skimming," reclamation, and rebranding.
Consumer and Portable These products are increasing in complexity; however the main drivers are the reduction in cost and increase in functionality while looking at ways of continuously shrinking the system footprint. The sector has the shortest product life, and the main vulnerabilities are similar to the office and large business systems, i.e., cloning, product "skimming", reclamation, and rebranding.
POSSIBLE STRATEGIES
Dealing with the different counterfeit device categories will require the use of a variety of strategies. There are different strategies for each category that are most likely to be successful.
Cloning Legacy and high-value components are suspected to be the most dominant. Device serialization may prove to have a beneficial impact on this category of counterfeits.
Product “skimming”, subcontractors, or second source suppliers Place better controls on the documentation with violators identified and prevented from conducting further business.
Disposal of scrap and rejects Establish better controls on scrap processing and handling. Systems designed to more effectively monitor and audit the waste stream may be needed.
Devices used as qualification samples This form of counterfeit may not be prevalent enough to warrant developing solutions; however, this needs to be verified by an investigation into the extent of this source of counterfeit components.
Reclamation and reuse of components Some OCMs and OEMs have legitimate operations to reclaim and reuse components using strict procedures to ensure that quality and reliability have not been compromised. Verification procedures for legitimate devices need to be established.
Re-branding Inspection, inspection, inspection (mechanical, electrical, etc.) as well as lot testing.
False claims of conformity to industry certifications (e.g., RoHS) Incoming inspection should be required, since counterfeiters are providing false documentation. Traceability and serialization may help to reduce this category of counterfeit devices.
Devices containing embedded malicious malware This problem is most critical in the aerospace and defense and medical sectors in which counterfeits could render systems inoperative, compromising the safety and security of users. The use of all possible approaches to counterfeit reduction is warranted for this sector.
INITIAL WORK
The first phase of iNEMI’s Counterfeit Components Project is broken into several high-level tasks. The first three tasks (on which this paper is based) were: Task 1: Identify and summarize any related research or development within the industry and academic communities. Task 2: Review and tabulate successes that have worked in the past (Best Known Methods/Best Known Practices). Task 3: Develop a methodology to evaluate or assess the risk of counterfeit use.
Development of a Methodology to Determine Risk of Counterfei t Use (© iNEMI 2013)
5
In addition to the tasks specifically identified in the Project Statement of Work, the team also:
• Focused on those attributes that are of most value to the supply chain and participating project members, and that are applicable to multiple spaces across the supply chain.
• Identified and developed methodologies with associated metrics to assess the overall extent of the counterfeit problem in the electronics industry. The outputs will enable iNEMI members to assess the risk of counterfeit use in their respective industries, the risk of untrusted sources of supply in that industry and understand the total cost of ownership associated with those risks.
• The methodologies and strategies apply to all phases of the manufacturing cycle and supply chain. Not only do counterfeit components have a serious impact on the OCM, but impact all downstream users from the legitimate component brokers to the OEMs that integrate these components to the end-user.
• Metrics to assess the overall extent of the problem and anti-counterfeiting will be identified for all phases.
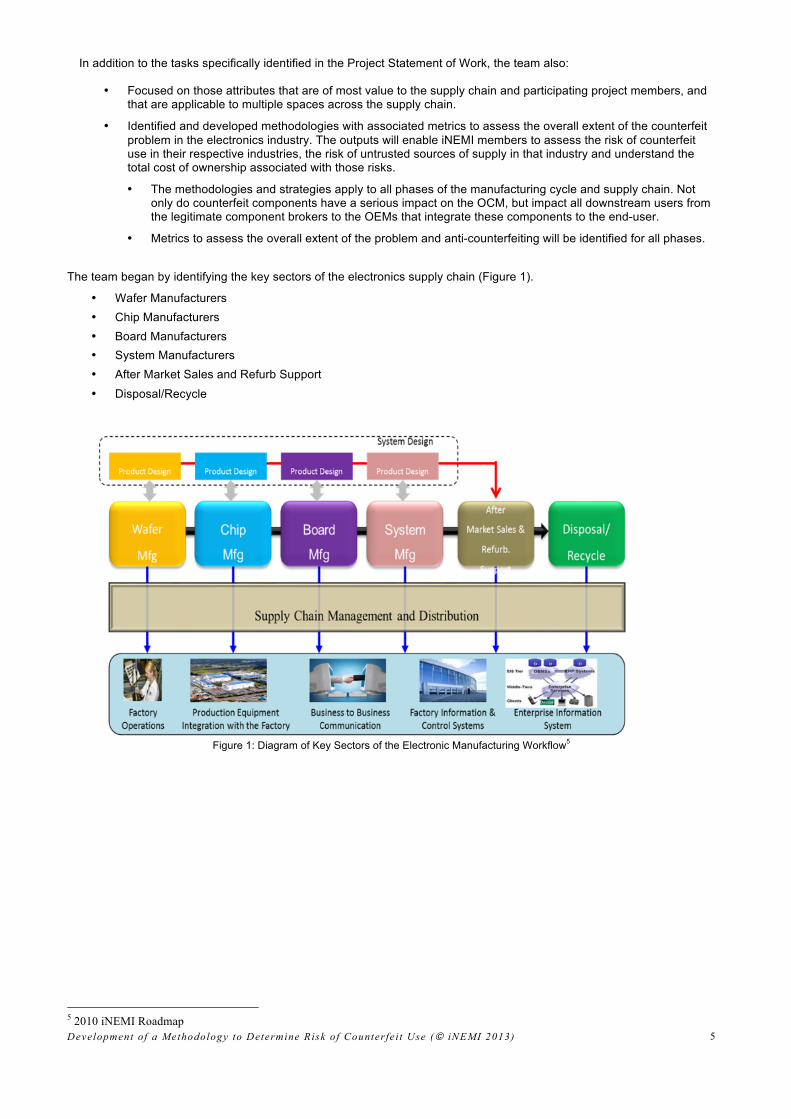
The team began by identifying the key sectors of the electronics supply chain (Figure 1).
• Wafer Manufacturers • Chip Manufacturers • Board Manufacturers • System Manufacturers • After Market Sales and Refurb Support • Disposal/Recycle
Figure 1: Diagram of Key Sectors of the Electronic Manufacturing Workflow5
5 2010 iNEMI Roadmap

Development of a Methodology to Determine Risk of Counterfei t Use (© iNEMI 2013)
6
Figure 2: Cluster map for board manufacturer shows potential flows of authentic and counterfeit materials
The electronics supply chain was then broken into a series of manufacturing "cluster maps" to help visualize how materials, parts, assemblies, and waste move, and identify the key players in each manufacturing sector.
The Board Manufacturer Cluster diagram (Figure 2) highlights two principal flows between the major Electronic Manufacturing Workflow blocks: the “authentic” and “counterfeit” material flow paths. The authentic material flow pathways indicate peer-to-peer connections where the board manufacturer has established strong agreements and has policies in place to prevent corruption of their supply stream. These measures generally provide a high confidence in the supply chain and feature traceability of the pedigree of electronic components.
The counterfeit material flow pathways highlight potential opportunities for breaching into the supply chain and corrupting traceability and pedigree of the electronic components. The risk of infiltration using one of these pathways increases when product shortages occur. Risks can also increase as new participants enter the networks to service growing demand. For example, as green manufacturing increases demand for recycling, new players rushing to capture market share may overlook security protocols. Also consider how criminals are well versed at pretending to be new participants.
With the completion of the cluster maps for the electronics supply chain, the team was able to begin work on the task of developing a methodology for assessing the risk of counterfeit use.
TASK 3- DEVELOPING A RISK ASSESSMENT CALCULATOR FOR COUNTERFEIT USE
1. Premise of the Spreadsheet / Assumptions
Examining the cluster maps for the different segments of the electronics supply chain, the team decided that the risk of counterfeit use was based on four key elements:
• The profile of the product in question • The inputs or characteristics of the supplier and supply line • The processes used on the product to deter counterfeit use • The outputs or channel characteristics
The team’s goal was to provide a quantitative methodology of risk assessment built on these four key elements that any company could use to rate their product.
2. Structure of the Spreadsheet / Rating Scale – See Appendix 1 for sample of calculator
2.1) Product Profile
The profile of the product in terms of demand for that product and where it is on the life cycle are key determinants in the risk of counterfeit use. The higher the demand for a product, the more attractive it becomes for counterfeiting. If a product is in high demand and also the original supply is near end of life, then the product profile risk of counterfeit is highest.
Development of a Methodology to Determine Risk of Counterfei t Use (© iNEMI 2013)
7
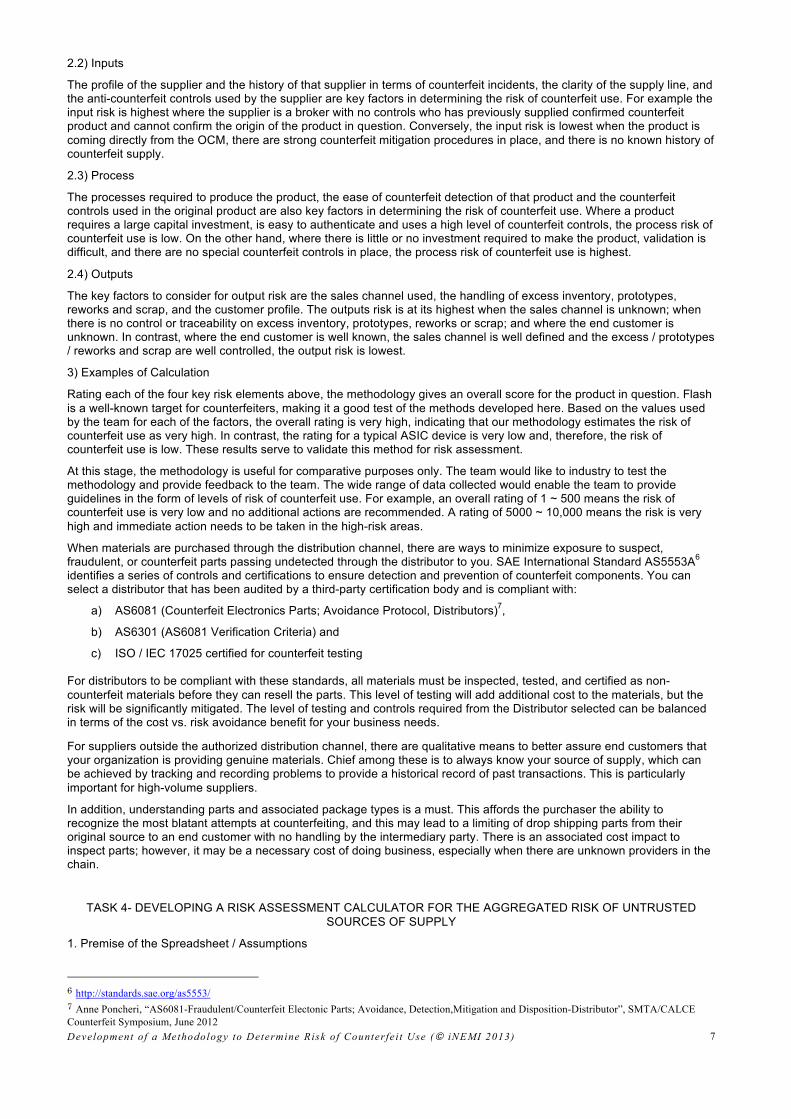
2.2) Inputs
The profile of the supplier and the history of that supplier in terms of counterfeit incidents, the clarity of the supply line, and the anti-counterfeit controls used by the supplier are key factors in determining the risk of counterfeit use. For example the input risk is highest where the supplier is a broker with no controls who has previously supplied confirmed counterfeit product and cannot confirm the origin of the product in question. Conversely, the input risk is lowest when the product is coming directly from the OCM, there are strong counterfeit mitigation procedures in place, and there is no known history of counterfeit supply.
2.3) Process
The processes required to produce the product, the ease of counterfeit detection of that product and the counterfeit controls used in the original product are also key factors in determining the risk of counterfeit use. Where a product requires a large capital investment, is easy to authenticate and uses a high level of counterfeit controls, the process risk of counterfeit use is low. On the other hand, where there is little or no investment required to make the product, validation is difficult, and there are no special counterfeit controls in place, the process risk of counterfeit use is highest.
2.4) Outputs
The key factors to consider for output risk are the sales channel used, the handling of excess inventory, prototypes, reworks and scrap, and the customer profile. The outputs risk is at its highest when the sales channel is unknown; when there is no control or traceability on excess inventory, prototypes, reworks or scrap; and where the end customer is unknown. In contrast, where the end customer is well known, the sales channel is well defined and the excess / prototypes / reworks and scrap are well controlled, the output risk is lowest.
3) Examples of Calculation
Rating each of the four key risk elements above, the methodology gives an overall score for the product in question. Flash is a well-known target for counterfeiters, making it a good test of the methods developed here. Based on the values used by the team for each of the factors, the overall rating is very high, indicating that our methodology estimates the risk of counterfeit use as very high. In contrast, the rating for a typical ASIC device is very low and, therefore, the risk of counterfeit use is low. These results serve to validate this method for risk assessment.
At this stage, the methodology is useful for comparative purposes only. The team would like to industry to test the methodology and provide feedback to the team. The wide range of data collected would enable the team to provide guidelines in the form of levels of risk of counterfeit use. For example, an overall rating of 1 ~ 500 means the risk of counterfeit use is very low and no additional actions are recommended. A rating of 5000 ~ 10,000 means the risk is very high and immediate action needs to be taken in the high-risk areas.
When materials are purchased through the distribution channel, there are ways to minimize exposure to suspect, fraudulent, or counterfeit parts passing undetected through the distributor to you. SAE International Standard AS5553A6 identifies a series of controls and certifications to ensure detection and prevention of counterfeit components. You can select a distributor that has been audited by a third-party certification body and is compliant with:
a) AS6081 (Counterfeit Electronics Parts; Avoidance Protocol, Distributors)7,
b) AS6301 (AS6081 Verification Criteria) and
c) ISO / IEC 17025 certified for counterfeit testing For distributors to be compliant with these standards, all materials must be inspected, tested, and certified as non-counterfeit materials before they can resell the parts. This level of testing will add additional cost to the materials, but the risk will be significantly mitigated. The level of testing and controls required from the Distributor selected can be balanced in terms of the cost vs. risk avoidance benefit for your business needs.
For suppliers outside the authorized distribution channel, there are qualitative means to better assure end customers that your organization is providing genuine materials. Chief among these is to always know your source of supply, which can be achieved by tracking and recording problems to provide a historical record of past transactions. This is particularly important for high-volume suppliers.
In addition, understanding parts and associated package types is a must. This affords the purchaser the ability to recognize the most blatant attempts at counterfeiting, and this may lead to a limiting of drop shipping parts from their original source to an end customer with no handling by the intermediary party. There is an associated cost impact to inspect parts; however, it may be a necessary cost of doing business, especially when there are unknown providers in the chain.
TASK 4- DEVELOPING A RISK ASSESSMENT CALCULATOR FOR THE AGGREGATED RISK OF UNTRUSTED SOURCES OF SUPPLY
1. Premise of the Spreadsheet / Assumptions
6 http://standards.sae.org/as5553/ 7 Anne Poncheri, “AS6081-Fraudulent/Counterfeit Electonic Parts; Avoidance, Detection,Mitigation and Disposition-Distributor”, SMTA/CALCE Counterfeit Symposium, June 2012
Development of a Methodology to Determine Risk of Counterfei t Use (© iNEMI 2013)
8
The team chose the following key elements as indicators for risk of suppliers:
• Memberships, accreditations • Mitigation and controls by the supplier • Company characteristics
Based on objective information grouped in these three key elements, the calculator produces relative ratings that are expected to be correlated to the risk of receiving counterfeits from untrusted sources. The ratings can support a decision whether to purchase from a particular source or which of several suppliers to choose. Only non-authorized suppliers (brokers, independent distributors) are considered “untrusted sources,” to which the calculator is applicable. The calculator is not intended to rate authorized distributors.
2. Structure of the Spreadsheet / Rating Scale – See Appendix 2 for sample of calculator
2.1) Memberships and accreditations
Reputable and accountable brokers who are safer to do business with will seek accreditation to industry standards and operate to best practices. The memberships chosen are IDEA (Independent Distributors of Electronics Association) and GIDEP (Government-Industry Data Exchange Program). It is straightforward to add more memberships in a future version of the calculator. When comparing suppliers, users need to be aware that only North American companies can join GIDEP. The team identified the ISO 9000 series, SEMI T20, AS 6081 and the upcoming AS 6171 as the most relevant standards. AS 6171 will become a differentiator after its release and after some companies have been accredited.
2.2) Mitigation and controls
Factors for quantifying mitigation and controls include: inspection by or on behalf of the supplier and how detailed the inspection is; the environmental conditions at the supplier for handling, shipping, storage; what type of insurance or warranty the supplier provides against counterfeits; the policy in the case that a counterfeit occurs; and the policy in the case where parts are suspect, but no actual proof of counterfeit.
2.3) Company characteristics
Scores for company characteristics are based on he number of employees, the number of locations in different countries, the business scale as measured by annual revenue, the history of past occurrence of providing suspects or counterfeits, and the commodity expertise of the supplier’s staff.
3) Examples of Calculation
Rating each of the three key risk elements above, the methodology gives an overall score for the supplier in question in the range of 9 – 8249. After entering the complete input information, the total rating result is, for example, 103 for supplier A and 8249 for supplier B. Choose supplier A, not B. Due to the extremely high rating for supplier B, consider disqualifying supplier B from any purchases until the company improves.
TASK 5- DEVELOPING A CALCULATOR TO ESTIMATE THE OVERALL COUNTEREFIT COSTS & LOSSES
1. Premise of the Spreadsheet / Assumptions
A major challenge facing most companies is to estimate how big the counterfeit problem is in financial terms. The purpose of this calculator is to provide an easy-to-use method to estimate the costs and losses associated with counterfeit product. It provides the user with three separate assessments: the Counterfeit Loss Estimate by product or product group, the Counterfeit Loss by geography or market, and the Total Counterfeit Costs and Losses estimate. The three assessments can be run independently to get an estimate for the losses by product, for example, or combined to give a full picture of the counterfeit losses by product and market and an overall estimate of the cost of counterfeit to the company.
The counterfeit loss estimate is based on the output from the risk assessment calculator in Task 3, where the risk of counterfeit is classified as low, medium or high. The losses by geography or market are generated using the Corruption Control Index supplied by the World Bank8. For the sake of simplicity and ease of use, the calculators use a minimum of information to estimate the cost of counterfeit and all the information should be readily available in most companies.
2. Structure of the Spreadsheet / Rating Scale
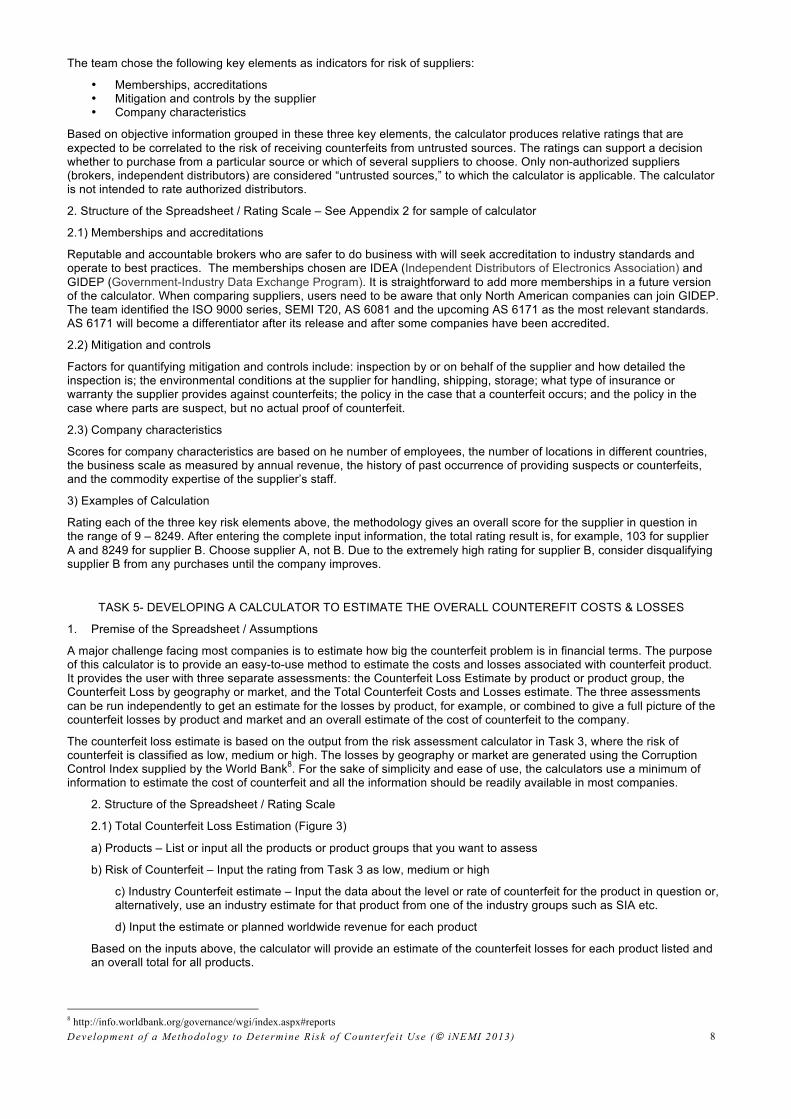
2.1) Total Counterfeit Loss Estimation (Figure 3)
a) Products – List or input all the products or product groups that you want to assess
b) Risk of Counterfeit – Input the rating from Task 3 as low, medium or high
c) Industry Counterfeit estimate – Input the data about the level or rate of counterfeit for the product in question or, alternatively, use an industry estimate for that product from one of the industry groups such as SIA etc.
d) Input the estimate or planned worldwide revenue for each product
Based on the inputs above, the calculator will provide an estimate of the counterfeit losses for each product listed and an overall total for all products.
8 http://info.worldbank.org/governance/wgi/index.aspx#reports
Development of a Methodology to Determine Risk of Counterfei t Use (© iNEMI 2013)
9
Figure 3. Total Counterfeit Loss Estimation by product
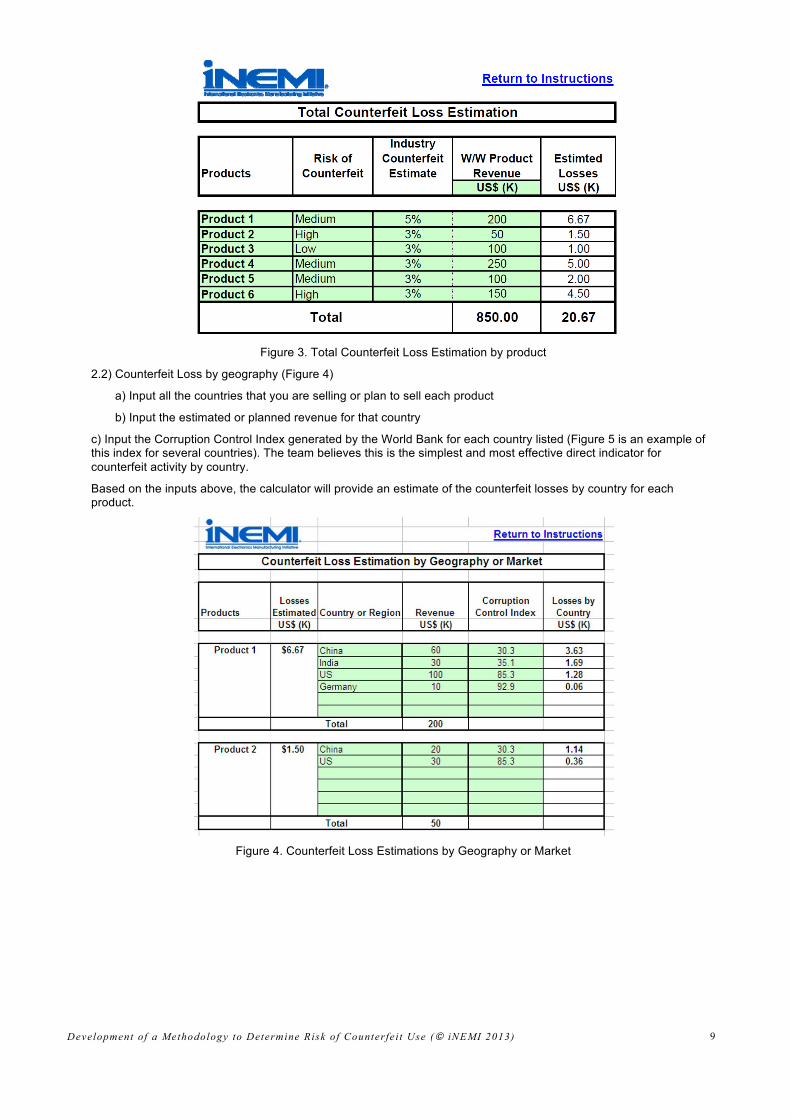
2.2) Counterfeit Loss by geography (Figure 4)
a) Input all the countries that you are selling or plan to sell each product
b) Input the estimated or planned revenue for that country
c) Input the Corruption Control Index generated by the World Bank for each country listed (Figure 5 is an example of this index for several countries). The team believes this is the simplest and most effective direct indicator for counterfeit activity by country.
Based on the inputs above, the calculator will provide an estimate of the counterfeit losses by country for each product.
Figure 4. Counterfeit Loss Estimations by Geography or Market

Development of a Methodology to Determine Risk of Counterfei t Use (© iNEMI 2013)
10
Figure 5. Corruption Control Index Example from the World Bank
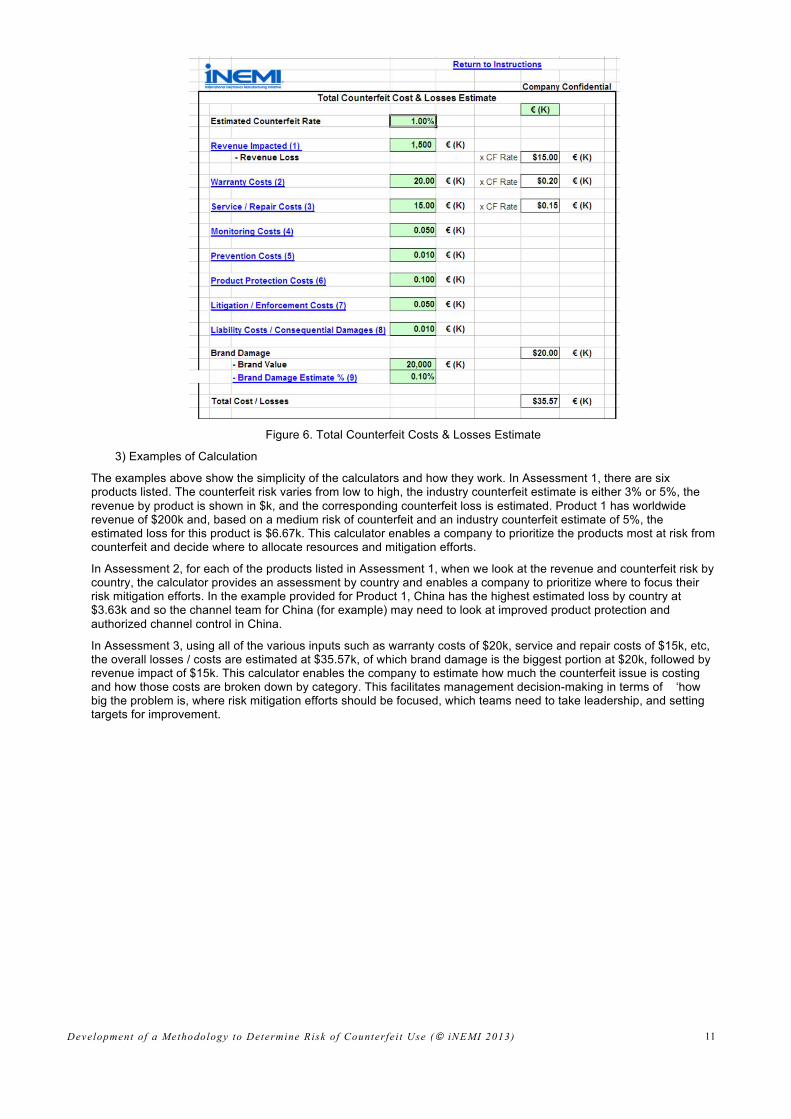
2.3) Total Counterfeit Costs (Figure 6)
This calculator attempts to pull together the total picture in terms of counterfeit costs and losses experienced by a company. The revenue loss is estimated based on total revenue and the counterfeit rate. The other inputs such as warranty costs, service costs … should be readily available. A brief description of them is as follows:
• Warranty Costs – All warranty repair and replacement costs
• Service / Repair Costs – All parts and labor involved in the service and repair activity
• Monitoring Costs – Includes test buys, data collection, validation service… costs incurred
• Prevention Costs – Includes education, travel, conferences, additional channel controls & supports
• Product Protection Costs – Extra silicon, circuitry, hardware, software, firmware required to protect the product from counterfeit activity
• Litigation / Enforcement Costs – Costs of pursuing cases in court, legal follow-up etc.
• Liability Costs / Consequential Damage – Costs due to liability claims
• Brand Damage – Estimate of the damage caused to brand value by counterfeit activity. The damage estimate can be based on percentage of customers lost, sales lost or other such negative outcome due to counterfeit activity.
Development of a Methodology to Determine Risk of Counterfei t Use (© iNEMI 2013)
11
Figure 6. Total Counterfeit Costs & Losses Estimate
3) Examples of Calculation
The examples above show the simplicity of the calculators and how they work. In Assessment 1, there are six products listed. The counterfeit risk varies from low to high, the industry counterfeit estimate is either 3% or 5%, the revenue by product is shown in $k, and the corresponding counterfeit loss is estimated. Product 1 has worldwide revenue of $200k and, based on a medium risk of counterfeit and an industry counterfeit estimate of 5%, the estimated loss for this product is $6.67k. This calculator enables a company to prioritize the products most at risk from counterfeit and decide where to allocate resources and mitigation efforts.
In Assessment 2, for each of the products listed in Assessment 1, when we look at the revenue and counterfeit risk by country, the calculator provides an assessment by country and enables a company to prioritize where to focus their risk mitigation efforts. In the example provided for Product 1, China has the highest estimated loss by country at $3.63k and so the channel team for China (for example) may need to look at improved product protection and authorized channel control in China.
In Assessment 3, using all of the various inputs such as warranty costs of $20k, service and repair costs of $15k, etc, the overall losses / costs are estimated at $35.57k, of which brand damage is the biggest portion at $20k, followed by revenue impact of $15k. This calculator enables the company to estimate how much the counterfeit issue is costing and how those costs are broken down by category. This facilitates management decision-making in terms of ‘how big the problem is, where risk mitigation efforts should be focused, which teams need to take leadership, and setting targets for improvement.
Development of a Methodology to Determine Risk of Counterfei t Use (© iNEMI 2013)
12
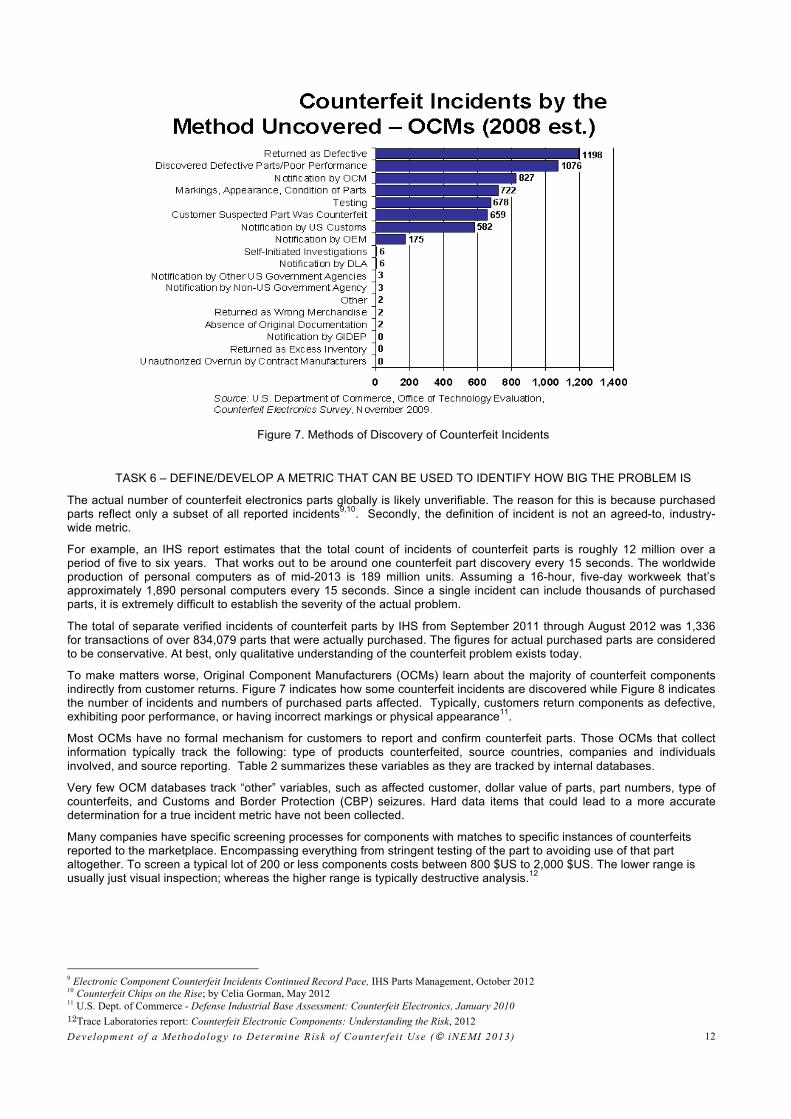
Figure 7. Methods of Discovery of Counterfeit Incidents
TASK 6 – DEFINE/DEVELOP A METRIC THAT CAN BE USED TO IDENTIFY HOW BIG THE PROBLEM IS
The actual number of counterfeit electronics parts globally is likely unverifiable. The reason for this is because purchased parts reflect only a subset of all reported incidents9,10. Secondly, the definition of incident is not an agreed-to, industry-wide metric.
For example, an IHS report estimates that the total count of incidents of counterfeit parts is roughly 12 million over a period of five to six years. That works out to be around one counterfeit part discovery every 15 seconds. The worldwide production of personal computers as of mid-2013 is 189 million units. Assuming a 16-hour, five-day workweek that’s approximately 1,890 personal computers every 15 seconds. Since a single incident can include thousands of purchased parts, it is extremely difficult to establish the severity of the actual problem.
The total of separate verified incidents of counterfeit parts by IHS from September 2011 through August 2012 was 1,336 for transactions of over 834,079 parts that were actually purchased. The figures for actual purchased parts are considered to be conservative. At best, only qualitative understanding of the counterfeit problem exists today.
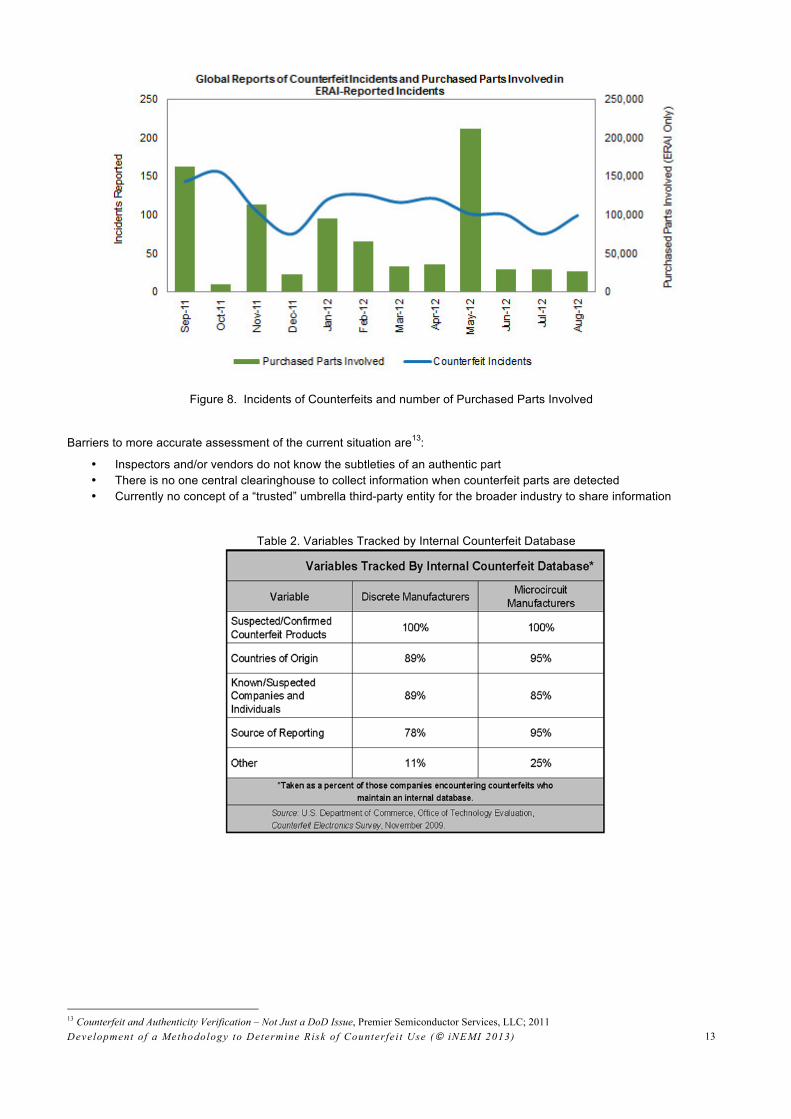
To make matters worse, Original Component Manufacturers (OCMs) learn about the majority of counterfeit components indirectly from customer returns. Figure 7 indicates how some counterfeit incidents are discovered while Figure 8 indicates the number of incidents and numbers of purchased parts affected. Typically, customers return components as defective, exhibiting poor performance, or having incorrect markings or physical appearance11.
Most OCMs have no formal mechanism for customers to report and confirm counterfeit parts. Those OCMs that collect information typically track the following: type of products counterfeited, source countries, companies and individuals involved, and source reporting. Table 2 summarizes these variables as they are tracked by internal databases.
Very few OCM databases track “other” variables, such as affected customer, dollar value of parts, part numbers, type of counterfeits, and Customs and Border Protection (CBP) seizures. Hard data items that could lead to a more accurate determination for a true incident metric have not been collected.
Many companies have specific screening processes for components with matches to specific instances of counterfeits reported to the marketplace. Encompassing everything from stringent testing of the part to avoiding use of that part altogether. To screen a typical lot of 200 or less components costs between 800 $US to 2,000 $US. The lower range is usually just visual inspection; whereas the higher range is typically destructive analysis.12
9 Electronic Component Counterfeit Incidents Continued Record Pace, IHS Parts Management, October 2012 10 Counterfeit Chips on the Rise; by Celia Gorman, May 2012 11 U.S. Dept. of Commerce - Defense Industrial Base Assessment: Counterfeit Electronics, January 2010 12Trace Laboratories report: Counterfeit Electronic Components: Understanding the Risk, 2012
Development of a Methodology to Determine Risk of Counterfei t Use (© iNEMI 2013)
13
Figure 8. Incidents of Counterfeits and number of Purchased Parts Involved
Barriers to more accurate assessment of the current situation are13:
• Inspectors and/or vendors do not know the subtleties of an authentic part • There is no one central clearinghouse to collect information when counterfeit parts are detected • Currently no concept of a “trusted” umbrella third-party entity for the broader industry to share information
Table 2. Variables Tracked by Internal Counterfeit Database
13 Counterfeit and Authenticity Verification – Not Just a DoD Issue, Premier Semiconductor Services, LLC; 2011

Development of a Methodology to Determine Risk of Counterfei t Use (© iNEMI 2013)
14
TASK 7 – VALIDATION APPROACH ON THE CALCULATOR METHODOLOGIES
Our validation approach was to present the work of the team and calculators at established conferences that attract experts in the field of counterfeit components. Feedback has been generally positive and many different organizations are currently reviewing the approach used in the calculators. For example, a similar approach is being developed for use in SAE standards. The iNEMI team and the SAE team are sharing details.
We had 50+ individuals attend two iNEMI webinars to introduce the calculators to industry. As of 10/31/13, more than 80 people had downloaded the calculators for review, and we conducted follow-up interviews with several of those. Furthermore, iNEMI members promoted the iNEMI calculators during presentations at the Software Assurance Working Group Sessions - Summer 2013 and at the SMTA-EAST 2013 conference. They were well received and the audience wanted copies of all 3 calculators
We learned that simplicity and flexibility of the calculators are vital. These tools are designed to work intuitively. Each different user and platform has different needs, making the simplicity of the method developed by iNEMI critical. This allows for broad application of the calculators and starts the risk-mitigation thought process.
These tools and their inherent simplicity have motivated conversations to help “lift the veil” off the problem of counterfeit electronics. Using these calculators, organizations have begun to look beyond assessment difficulties and look into fraud.
The calculators help users decide where to begin.
FEEDBACK
At the end of each webinar, we asked attendees to provide feedback on the calculators. We also followed up with several of them a few weeks after the webinars to ask questions regarding their use of the calculators.
The objective of gathering feedback was to determine if the calculators were useful and unique to attendees, or if we had created something that had already been done. Responses were overwhelming that the calculators were helpful and that we were not a reinventing the wheel. Figure 9 shows the responses for how helpful the calculators are and whether or not attendees had used similar calculators. Figure 10 ranked the usefulness of the calculators on a scale of 0 (not useful) to 4 (most useful).
In follow-up, respondents said the calculator tools were easy to comprehend, easy to follow, and “kept it simple” to use them.
Figure 9. Interviews with trial users indicated that the tools were helpful and unlike other tools that most of the respondents had used.
3
19
Have you used similar calculators?
Yes No
21
1
Are these calculators helpful?
Yes No

Development of a Methodology to Determine Risk of Counterfei t Use (© iNEMI 2013)
15
The follow-up interviews indicated that users were finding the greatest value in using the calculator tools:
• With medical equipment • In sustaining engineering phases • By smaller companies that may not have the resources to create their own tools • To increase the visibility of counterfeit components to the company’s board
Very few respondents had seen similar calculators prior to the three developed by iNEMI, and those who had indicated that they were internally created tools. We believe these are the first industry-wide tools for examining the scope and details of counterfeit components.
Figure 10. Usefulness of calculators — 0 is least useful and 4 is most useful
TECHNIQUES FOR DETECTION OF COUNTERFEITS / ANALYTICAL METHODS FOR FAILURE ANALYSIS
In addition to the assessment of risk of counterfeit use, the team reviewed the current state of detection techniques and analysis of counterfeits. A complete solution for mitigating counterfeits would include both an informed planning approach based on assessment of risk as well as an ongoing and post-production evaluation for the detection of counterfeits parts.
From a technology perspective, methods for distinguishing between genuine and counterfeit electronic components are very similar to physical analytical failure analysis techniques. There is a large battery of generic technologies, in addition to specialized techniques, employed in this effort. These techniques fall into three main groups:
• Electrical: cryptographic fingerprinting, electrical device, test electrical function, electrical parametric test, steganographic fingerprinting
• Physical / structural analyses: differential scanning calorimeter (DSC), defect detection using chemical penetrant, HW Trojan detection, nanoentonography, optical microscopy, package/label coding, thermo-mechanical analysis , X-ray microscopy, scanning acoustic microscopy
• Chemical / compositional techniques: scanning electron microscopy (SEM), electron back scatter, diffraction energy dispersive spectroscopy (EDS), Fourier transform infrared spectroscopy (FTIR), near infrared based chemical imaging, Raman spectroscopy; transmission electron microscopy (TEM), X-ray fluorescence (XRF), auger, time-of-flight secondary ion spectroscopy (TOF/SIMS), X-ray photoelectron spectroscopy (XPS)
These techniques have varying efficacy, maturity, and cost effectiveness in evaluating component quality, taint-integrity and for component authentication. While detecting taint in components is currently at the research level, it is nearly impossible to determine authenticity even in high quality parts using these techniques.
COUNTERFEIT DETECTION METHODS
Incoming inspection for counterfeit parts can be broken into two basic categories14 15:
1) Procedures that anyone can execute to provide the minimum level of protection
2) Procedures that require more analytical techniques utilizing specialized equipment and expertise 14 Donald Davidson ,“An Assessment of Counterfeit Detection and Confirmation”, SMTA/CALCE Counterfeit Symposium, June 2012 15 Gary M. Beckstedt, Jr. ,“Supply Chain Management and Internal Inspection Techniques to Mitigate Counterfeit Component Impact”, SMTA/CALCE Counterfeit Symposium, June 2011
3.23
3.36
2.41
0.00 0.50 1.00 1.50 2.00 2.50 3.00 3.50 4.00
RISK OF COUNTERFEIT USE – CALCULATOR #1
RISK FOR UNTRUSTED SOURCES – CALCULATOR #2
COUNTERFEIT LOSSES & COSTS – CALCULATOR #3
Please rank the usefulness of the calculators:

Development of a Methodology to Determine Risk of Counterfei t Use (© iNEMI 2013)
16
Table 3 provides a list of some different types of analytical and inspection techniques. See Appendix 2 for details of the detection methods.
Table 3: Counterfeit Detection Methods
Minimum Inspections for Receiving Parts Detailed Analytical Inspection
Optical inspection with stereo microscope Scanning acoustic microscopy
X-ray inspection XRF analysis
Electrical test Functional Test
Non
-de
stru
ctiv
e an
alys
is
Tech
niqu
es
Gene Test
Solvent test Cross sectioning and microscopic inspection
Decapsulation test SEM-EDX
ICP/OES
GC/MS
UV-vis spectroscopy
FTIR spectroscopy
Des
truc
tive
Ana
lysi
s Te
chni
ques
Ion chromatography (IC)
RECOMMENDATIONS
1. Use the tools to: a. Discover weaknesses b. Investigate those areas of highest concern c. Realize the magnitude of your issue
2. Measure your risk:
a. Compare yourself to industry norms and published information b. Compare yourself to your peers if you can get that information
3. Decide what to do to mitigate risk and optimize your risk mitigation plan to address the problem
Each instance is unique – we have given you a way of approaching the problem and risks to mitigate. How to do it may be unique for each of you.
FUTURE CALCULATOR DEVELOPMENT
• The initial set of tools are a vehicle for identifying common problems within an industry which in turn can foster collaboration toward a cross-industry/general solution.
• To continue the development of these calculators and to garner engagement and adoption in other industries, we recommend specifically targeting other industry segments to solicit use of the calculators, and to update and add functionality based on what is relevant to a specific segment.
– For example, Medical (equipment), automotive, aerospace
• It is suggested that consecutive one-year projects to develop a broader industry calculator set with a narrow focus on counterfeit components in the three areas identified with the existing calculators be initiated.
• The next step will be to present to iNEMI membership to solicit another industry sector to continue to evolve the calculators

Development of a Methodology to Determine Risk of Counterfei t Use (© iNEMI 2013)
17
CONTRIBUTORS
BJ Favaro, Cisco, San Jose, CA
Sam Gupta, Cisco, San Jose, CA
Jeffrey Lee, IST-Integrated Services Technology, Inc., Hsinchu, Taiwan
Martin Huhne, Celestica Inc., Sriracha, Thailand
Iulia Muntele, Sanmina Corporation, Huntsville, AL
Sally Arno, Plexus Corp., Neenah, WI
Mark Schaffer, iNEMI, Pflugerville, TX

Developm
ent of a Methodology to D
etermine R
isk of Counterfeit U
se (© iN
EM
I 2013)
18
Appendix 1: R
isk Assessm
ent Calculator

Developm
ent of a Methodology to D
etermine R
isk of Counterfeit U
se (© iN
EM
I 2013)
19
A
ppendix 2: Risk A
ssessment C
alculator for Untrusted S
ources of Supply
Note: The num
bers in the row of S
upplier 1 provide an arbitrary example
S
uppliers M
emberships and A
ccreditations
Mitigation and C
ontrols
Com
pany Characteristics
Supplier N
ame
IDE
A
GID
EP
IS
O
9000 S
EM
I T20
AS
6081
In House
Testing using A
S
6171 (after
release of
standard)
Score
Inspection
Environm
ental conditions for
handling, shipping, storage
Insurance / W
arranty
Policy in
case of counterfeit occurrenc
e
Policy in
case of suspect parts but no actual proof of
counterfeit
Score
Num
ber of em
ployees
Num
ber of
locations in
different countries
Business S
cale S
upplier H
istory C
omm
odity E
xpertise S
core Total
Rating
Supplier 1
2 2
2 3
1 2
48 2
3 3
2 3
108 2
3 2
1 5
60 208
Supplier 2
Supplier 3
. . .
Development of a Methodology to Determine Risk of Counterfei t Use (© iNEMI 2013)
20
APPENDIX 3: INSPECTION AND ANALYTICAL METHODS FOR COUNTERFEIT DETECTION
Inspection for counterfeit parts at incoming inspection can be broken into two basic categories: (1) one that almost anyone can execute for minimum level of testing and (2) one that requires more analytical techniques utilizing specialized equipment and expertise.
First category for inspection – minimum inspections for receiving parts
1.1 Non-destructive analysis
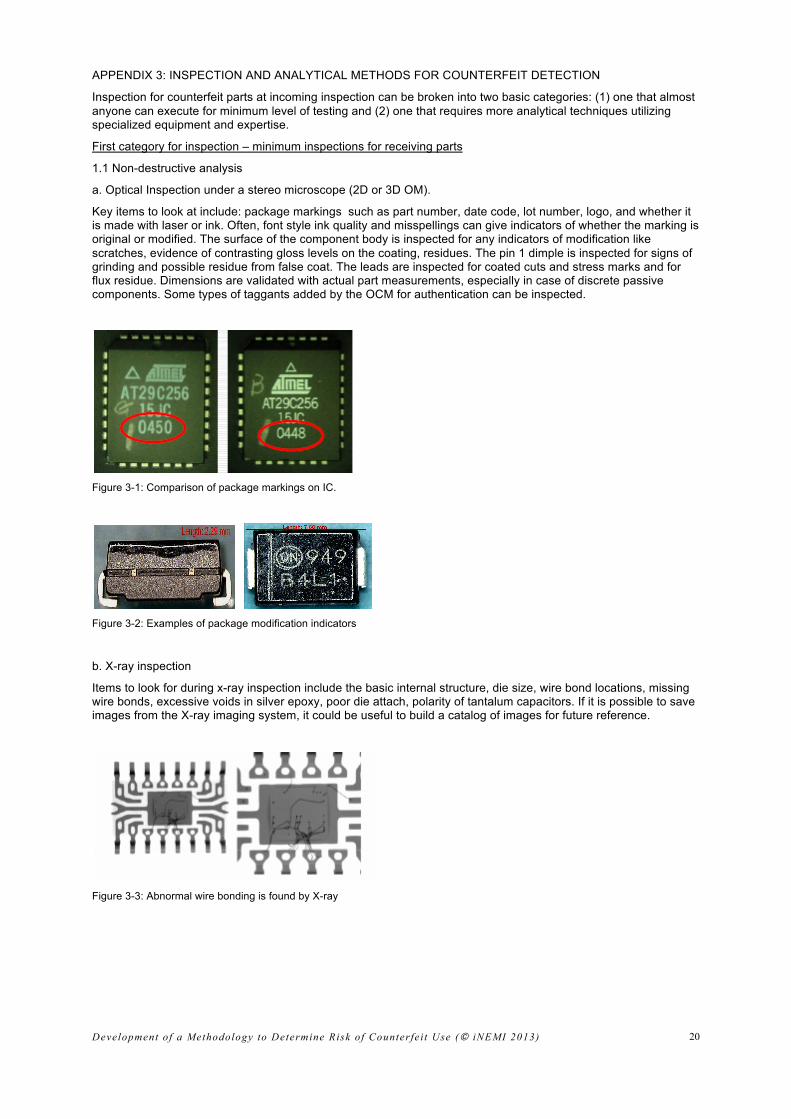
a. Optical Inspection under a stereo microscope (2D or 3D OM).
Key items to look at include: package markings such as part number, date code, lot number, logo, and whether it is made with laser or ink. Often, font style ink quality and misspellings can give indicators of whether the marking is original or modified. The surface of the component body is inspected for any indicators of modification like scratches, evidence of contrasting gloss levels on the coating, residues. The pin 1 dimple is inspected for signs of grinding and possible residue from false coat. The leads are inspected for coated cuts and stress marks and for flux residue. Dimensions are validated with actual part measurements, especially in case of discrete passive components. Some types of taggants added by the OCM for authentication can be inspected.
Figure 3-1: Comparison of package markings on IC.
Figure 3-2: Examples of package modification indicators
b. X-ray inspection
Items to look for during x-ray inspection include the basic internal structure, die size, wire bond locations, missing wire bonds, excessive voids in silver epoxy, poor die attach, polarity of tantalum capacitors. If it is possible to save images from the X-ray imaging system, it could be useful to build a catalog of images for future reference.
Figure 3-3: Abnormal wire bonding is found by X-ray

Development of a Methodology to Determine Risk of Counterfei t Use (© iNEMI 2013)
21
Figure 3-4: Bonding pad comparison by X-ray
Figure 3-5: One can see the ink mark on the outside of the package but X-ray imaging reveals reverse polarity.
c. Electrical test, also called static test
Electrical parameters of passives are validated against specifications with an LCR meter. A curve tracer is used to show characteristics and polarity of discrete semiconductors and to compare with specifications such as threshold voltage or leakage current.
1.2. Destructive analysis
a. Solvent test
Various solvents can be applied for a marking permanency test or to test for false top coat.
Figure 3-6: Marking confirmation with acetone.
b. De-capsulation test
Removal of the molding compound using chemical means to reveal the inner die surface permits inspection of the OEM die markings, device name, part number, design marks, the manufacturer’s logo and review of the die edges for chipping.
Figure 3-7. Device name can be checked after decapsulation.
Second category — more complicated Inspections
The inspections listed below require some specialized equipment. Leverage of a qualified outside lab may be in the best interest if the minimum tests from above indicate some suspect characteristics that require more in-depth analysis.
2.1 Non-destructive analysis
a. Scanning acoustic microscopy (C-SAM or TSAM)
Development of a Methodology to Determine Risk of Counterfei t Use (© iNEMI 2013)
22
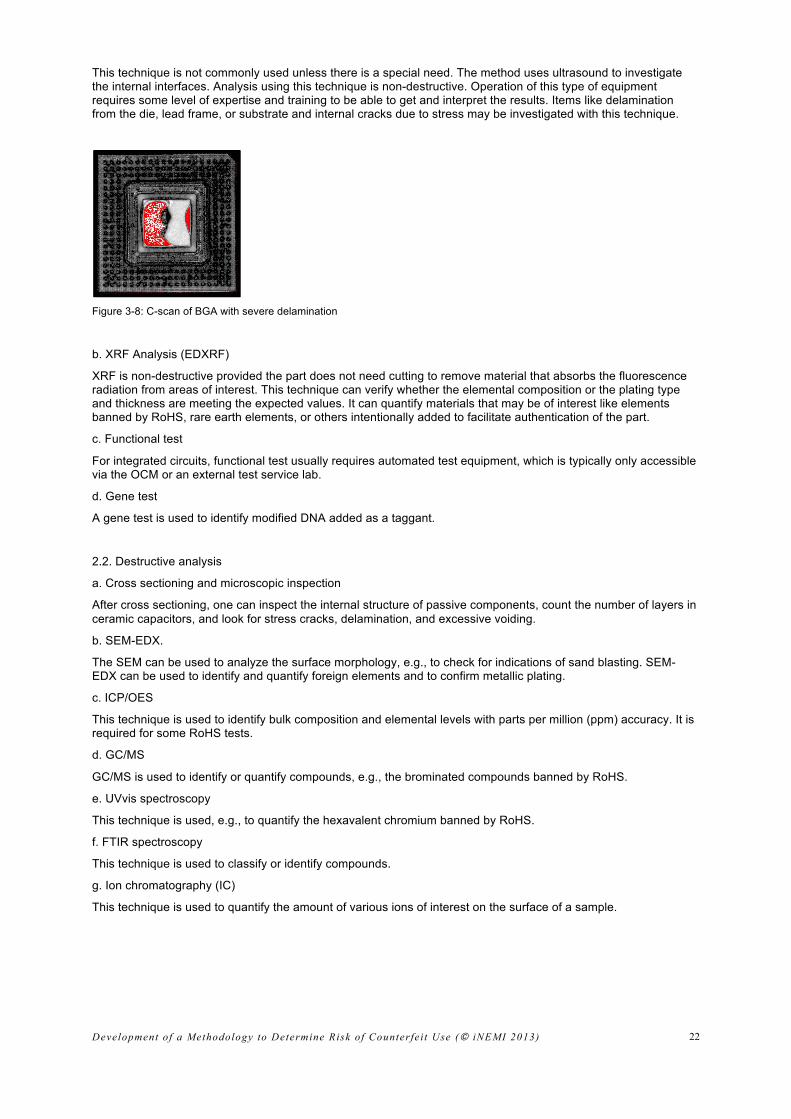
This technique is not commonly used unless there is a special need. The method uses ultrasound to investigate the internal interfaces. Analysis using this technique is non-destructive. Operation of this type of equipment requires some level of expertise and training to be able to get and interpret the results. Items like delamination from the die, lead frame, or substrate and internal cracks due to stress may be investigated with this technique.
Figure 3-8: C-scan of BGA with severe delamination
b. XRF Analysis (EDXRF)
XRF is non-destructive provided the part does not need cutting to remove material that absorbs the fluorescence radiation from areas of interest. This technique can verify whether the elemental composition or the plating type and thickness are meeting the expected values. It can quantify materials that may be of interest like elements banned by RoHS, rare earth elements, or others intentionally added to facilitate authentication of the part.
c. Functional test
For integrated circuits, functional test usually requires automated test equipment, which is typically only accessible via the OCM or an external test service lab.
d. Gene test
A gene test is used to identify modified DNA added as a taggant.
2.2. Destructive analysis
a. Cross sectioning and microscopic inspection
After cross sectioning, one can inspect the internal structure of passive components, count the number of layers in ceramic capacitors, and look for stress cracks, delamination, and excessive voiding.
b. SEM-EDX.
The SEM can be used to analyze the surface morphology, e.g., to check for indications of sand blasting. SEM-EDX can be used to identify and quantify foreign elements and to confirm metallic plating.
c. ICP/OES
This technique is used to identify bulk composition and elemental levels with parts per million (ppm) accuracy. It is required for some RoHS tests.
d. GC/MS
GC/MS is used to identify or quantify compounds, e.g., the brominated compounds banned by RoHS.
e. UVvis spectroscopy
This technique is used, e.g., to quantify the hexavalent chromium banned by RoHS.
f. FTIR spectroscopy
This technique is used to classify or identify compounds.
g. Ion chromatography (IC)
This technique is used to quantify the amount of various ions of interest on the surface of a sample.

Development of a Methodology to Determine Risk of Counterfei t Use (© iNEMI 2013)
23
EDXRF FTIR ICP-OES
UVvis IC GC/MS
SEM/EDX
Figure 3-9: Analytical Detection Methodologies

Development of a Methodology to Determine Risk of Counterfei t Use (© iNEMI 2013)
24
APPENDIX 4: SURVEY DATA
Survey Questions Answer Answer Answer
How would the calculator tools fit in your business process flow?
I am QA/Reg Compliance Mgr; tool would be used by Regulatory Group supporting Medical equipment manufacturing
No tool driven process is in place today.
We handle RMAs and Field repairs for our OEM customers.
I am consult advisor to start-up Medical companies to R&D Product Teams on reliability, risk and quality. Possible fit.
The R&D Product teams generally worry about front-end selection of vendors to minimize risk and to assure FDA certification.
Separate Sustaining Engineering team is responsible for NPI to manufacturing.
Repairs and returns handled by manufacturer.
Not much use for these tools as we have already developed the tools systems but would be interested to hear of any developments.
Did you find the calculator tools easy to comprehend?
Yes! For those areas I did not understand the presentation cleared it up.
Yes! For those areas I did not understand the presentation cleared it up.
Yes - tools are easy to follow .... keep it simple.
Have you tried the calculator tools yet, or do you plan to use them in the future? Is there a particular reason why you don’t plan to use these tools?
Plan on using everything but counterfeit losses and cost tool. No access to the data and does not match my skill set.
Yes! No specific plans yet.
We already have tools / systems well developed
Where do you see the greatest value proposition for the calculator tools?
Regulatory team supporting Medical equipment manufacturing worldwide.
Sustaining engineering phase.
Smaller companies that have not the resources or time to invest would find these tools useful. Also of use to companies who want to bring this problem to their board.
We discussed three tools. They calculate risk of counterfeit, risk for untrusted sources or counterfeit losses and cost. Which of these tools is of greatest interest for your mitigation risk approach?
All except the counterfeit losses and counterfeit losses and cost tool.
R&D Product Teams during initial design stage.
Any suggestions on possible enhancements to the calculator tools?
No!
Are there other key factors you believe the tools should consider to properly account for risk?
No particular thoughts at this time.