Embed Size (px)
Citation preview
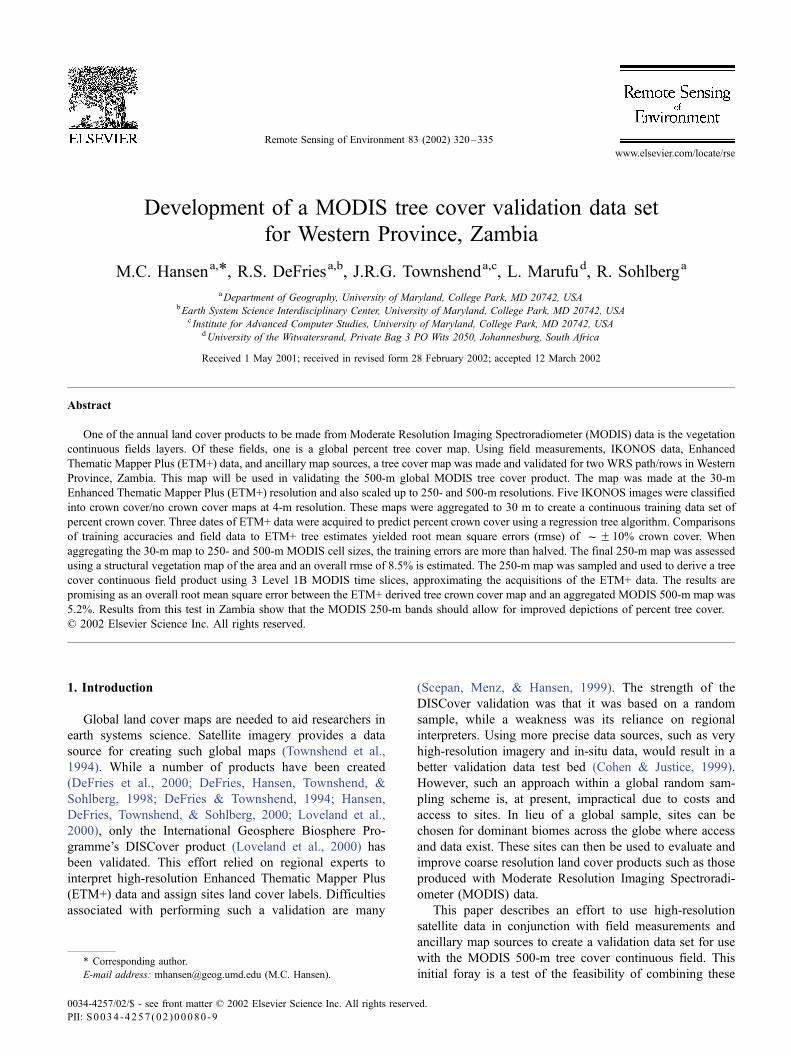
Development of a MODIS tree cover validation data set
for Western Province, Zambia
M.C. Hansena,*, R.S. DeFriesa,b, J.R.G. Townshenda,c, L. Marufud, R. Sohlberga
aDepartment of Geography, University of Maryland, College Park, MD 20742, USAbEarth System Science Interdisciplinary Center, University of Maryland, College Park, MD 20742, USA
c Institute for Advanced Computer Studies, University of Maryland, College Park, MD 20742, USAdUniversity of the Witwatersrand, Private Bag 3 PO Wits 2050, Johannesburg, South Africa
Received 1 May 2001; received in revised form 28 February 2002; accepted 12 March 2002
Abstract
One of the annual land cover products to be made from Moderate Resolution Imaging Spectroradiometer (MODIS) data is the vegetation
continuous fields layers. Of these fields, one is a global percent tree cover map. Using field measurements, IKONOS data, Enhanced
Thematic Mapper Plus (ETM+) data, and ancillary map sources, a tree cover map was made and validated for two WRS path/rows in Western
Province, Zambia. This map will be used in validating the 500-m global MODIS tree cover product. The map was made at the 30-m
Enhanced Thematic Mapper Plus (ETM+) resolution and also scaled up to 250- and 500-m resolutions. Five IKONOS images were classified
into crown cover/no crown cover maps at 4-m resolution. These maps were aggregated to 30 m to create a continuous training data set of
percent crown cover. Three dates of ETM+ data were acquired to predict percent crown cover using a regression tree algorithm. Comparisons
of training accuracies and field data to ETM+ tree estimates yielded root mean square errors (rmse) of fF 10% crown cover. When
aggregating the 30-m map to 250- and 500-m MODIS cell sizes, the training errors are more than halved. The final 250-m map was assessed
using a structural vegetation map of the area and an overall rmse of 8.5% is estimated. The 250-m map was sampled and used to derive a tree
cover continuous field product using 3 Level 1B MODIS time slices, approximating the acquisitions of the ETM+ data. The results are
promising as an overall root mean square error between the ETM+ derived tree crown cover map and an aggregated MODIS 500-m map was
5.2%. Results from this test in Zambia show that the MODIS 250-m bands should allow for improved depictions of percent tree cover.
D 2002 Elsevier Science Inc. All rights reserved.
1. Introduction
Global land cover maps are needed to aid researchers in
earth systems science. Satellite imagery provides a data
source for creating such global maps (Townshend et al.,
1994). While a number of products have been created
(DeFries et al., 2000; DeFries, Hansen, Townshend, &
Sohlberg, 1998; DeFries & Townshend, 1994; Hansen,
DeFries, Townshend, & Sohlberg, 2000; Loveland et al.,
2000), only the International Geosphere Biosphere Pro-
gramme’s DISCover product (Loveland et al., 2000) has
been validated. This effort relied on regional experts to
interpret high-resolution Enhanced Thematic Mapper Plus
(ETM+) data and assign sites land cover labels. Difficulties
associated with performing such a validation are many
(Scepan, Menz, & Hansen, 1999). The strength of the
DISCover validation was that it was based on a random
sample, while a weakness was its reliance on regional
interpreters. Using more precise data sources, such as very
high-resolution imagery and in-situ data, would result in a
better validation data test bed (Cohen & Justice, 1999).
However, such an approach within a global random sam-
pling scheme is, at present, impractical due to costs and
access to sites. In lieu of a global sample, sites can be
chosen for dominant biomes across the globe where access
and data exist. These sites can then be used to evaluate and
improve coarse resolution land cover products such as those
produced with Moderate Resolution Imaging Spectroradi-
ometer (MODIS) data.
This paper describes an effort to use high-resolution
satellite data in conjunction with field measurements and
ancillary map sources to create a validation data set for use
with the MODIS 500-m tree cover continuous field. This
initial foray is a test of the feasibility of combining these
0034-4257/02/$ - see front matter D 2002 Elsevier Science Inc. All rights reserved.
PII: S0034 -4257 (02 )00080 -9
* Corresponding author.
E-mail address: [email protected] (M.C. Hansen).
www.elsevier.com/locate/rse
Remote Sensing of Environment 83 (2002) 320–335
various spatial scales of data for validating coarse resolution
maps. The Southern African Research Initiative (SAFARI)
2000 (Swap & Privette, 1999) program afforded an oppor-
tunity to test mapping tree cover in a tropical woodland
setting. In addition to its use in validating MODIS products,
the map derived in this exercise will eventually be expanded
to cover the area of the Kalahari transect (Scholes &
Parsons, 1997) for use by ecosystem modelers and others
who need cover information on fuel loads of annual biomass
burning and other applications.
An excellent source of validation data is very high
resolution satellite imagery (1–4 m), which have only
recently become commercially available (Tanaka & Sugi-
mura, 1999). While still an expensive option compared to
other, coarser data, they afford the user a fine-scale tool
for mapping without reliance on dated imagery. Table 1
outlines the general characteristics of the sensor. The
work described here employed IKONOS data to map tree
cover. Tree cover characterizations at very high resolu-
tions have more frequently employed photo-interpretation
methods to delineate cover such as in Miller et al. (1995)
and Turner, Wong, Chew, and Ibrahim (1996). Manual
methods are limited in their application due to a lack of
objectivity and prohibitive time requirements. More auto-
mated approaches have used image processing techniques
to map tree cover using digital aerial photographs (Gou-
geon, 1995; Kadmon & Harari-Kremer, 1999). Automated
approaches are the more practical choice for mapping,
especially since one goal of this work is to develop a
repeatable procedure which could be used at various sites
globally.
In this study, the IKONOS data are used to create a 30-m
training data set for use in characterizing ETM+ imagery. The
result is a 30-m continuous tree cover map, which is then
aggregated to MODIS resolutions for use in testing and
validation of MODIS products. To measure the success of
the approach, in-situ tree cover measurements as well as
ancillary maps are employed to evaluate the final map
product.
2. Data
2.1. IKONOS imagery
Five IKONOS images were acquired for use in develop-
ing a percent tree crown cover training data set. Table 2
shows the scene centers and associated vegetation cover
types for these footprints. In addition to the individual bands
listed in Table 1, simple average, standard deviation, and
average standard deviation texture measures were created
using 3� 3 and 5� 5 pixel kernels. Normalized Difference
Vegetation Index (NDVI) was also calculated as well as
NDVI texture measures like those in the individual bands.
The total number of image layers used to classify crown
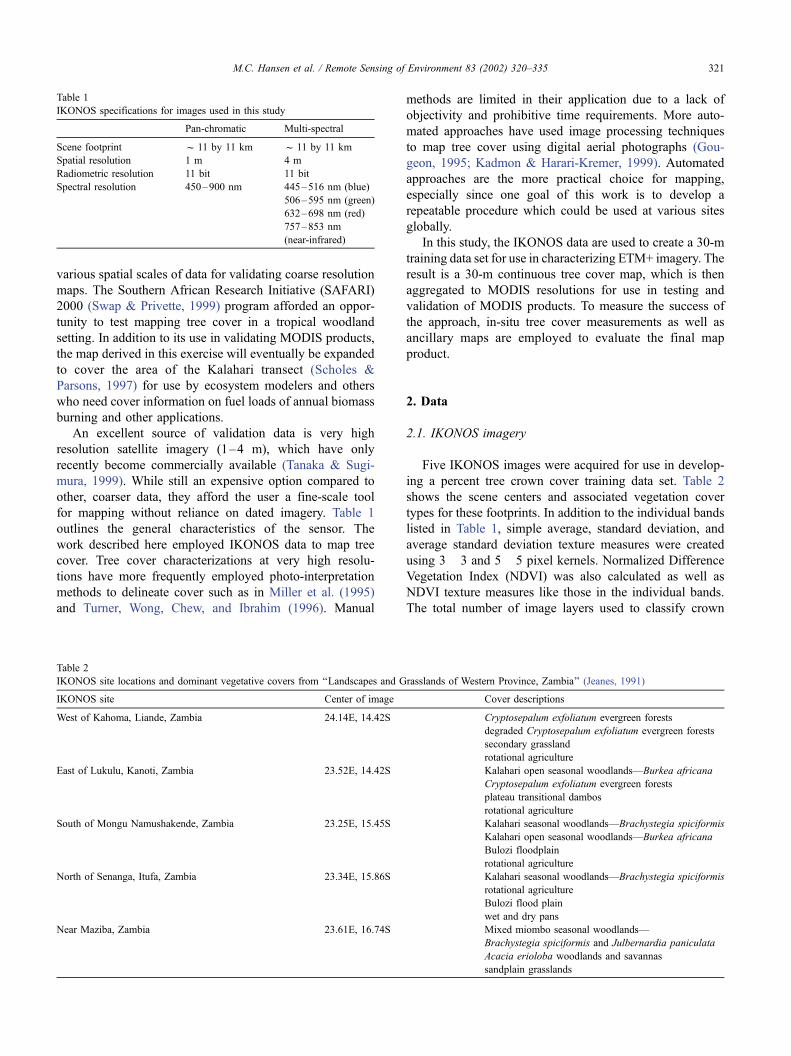
Table 1
IKONOS specifications for images used in this study
Pan-chromatic Multi-spectral
Scene footprint f 11 by 11 km f 11 by 11 km
Spatial resolution 1 m 4 m
Radiometric resolution 11 bit 11 bit
Spectral resolution 450–900 nm 445–516 nm (blue)
506–595 nm (green)
632–698 nm (red)
757–853 nm
(near-infrared)
Table 2
IKONOS site locations and dominant vegetative covers from ‘‘Landscapes and Grasslands of Western Province, Zambia’’ (Jeanes, 1991)
IKONOS site Center of image Cover descriptions
West of Kahoma, Liande, Zambia 24.14E, 14.42S Cryptosepalum exfoliatum evergreen forests
degraded Cryptosepalum exfoliatum evergreen forests
secondary grassland
rotational agriculture
East of Lukulu, Kanoti, Zambia 23.52E, 14.42S Kalahari open seasonal woodlands—Burkea africana
Cryptosepalum exfoliatum evergreen forests
plateau transitional dambos
rotational agriculture
South of Mongu Namushakende, Zambia 23.25E, 15.45S Kalahari seasonal woodlands—Brachystegia spiciformis
Kalahari open seasonal woodlands—Burkea africana
Bulozi floodplain
rotational agriculture
North of Senanga, Itufa, Zambia 23.34E, 15.86S Kalahari seasonal woodlands—Brachystegia spiciformis
rotational agriculture
Bulozi flood plain
wet and dry pans
Near Maziba, Zambia 23.61E, 16.74S Mixed miombo seasonal woodlands—
Brachystegia spiciformis and Julbernardia paniculata
Acacia erioloba woodlands and savannas
sandplain grasslands
M.C. Hansen et al. / Remote Sensing of Environment 83 (2002) 320–335 321
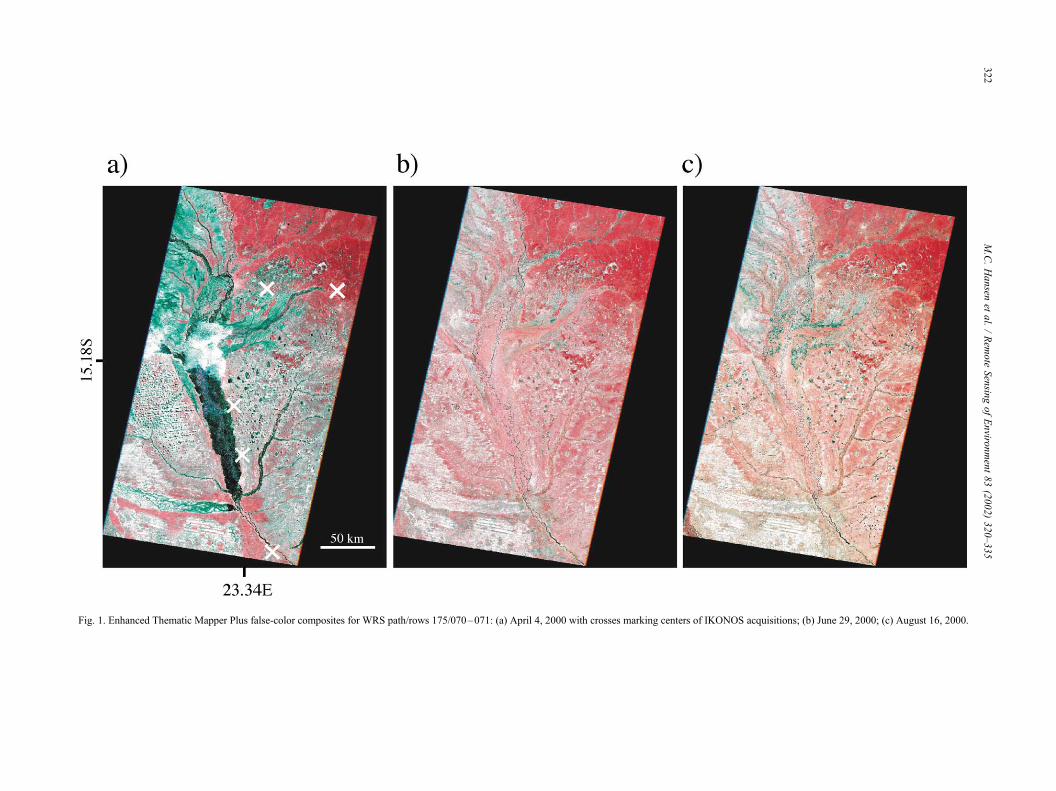
Fig. 1. Enhanced Thematic Mapper Plus false-color composites for WRS path/rows 175/070–071: (a) April 4, 2000 with crosses marking centers of IKONOS acquisitions; (b) June 29, 2000; (c) August 16, 2000.
M.C.Hansen
etal./Rem
ote
Sensin
gofEnviro
nment83(2002)320–335
322
cover was 35. At the IKONOS resolution, identifying many
tree canopies is aided by including local variability measures.
The measures here are similar to those of Coop and Catling
(1997) where the spatial resolution is not successively
degraded, but kept at the original 4-m cell size. Coop and
Caitling found that in keeping the original resolution, the
local variance does not fall substantially, much like a semi-
variogram. The 5� 5 window was chosen as the maximum
filter size by inspection of the images and that the typical
object size, or crown size, was captured at this scale.
2.2. Enhanced Thematic Mapper Plus imagery
Three ETM+ images were used to estimate percent tree
cover. A wet season image dated April 4, 2000 was the
clearest peak greenness image available in the ETM+
archive for path/rows 175/070–071. Peak greenness con-
dition imagery is necessary for mapping tree cover, as many
seasonal tree types such as drought deciduous formations
become difficult to map during off-peak conditions. Multi-
temporal imagery is needed to improve differentiating tree
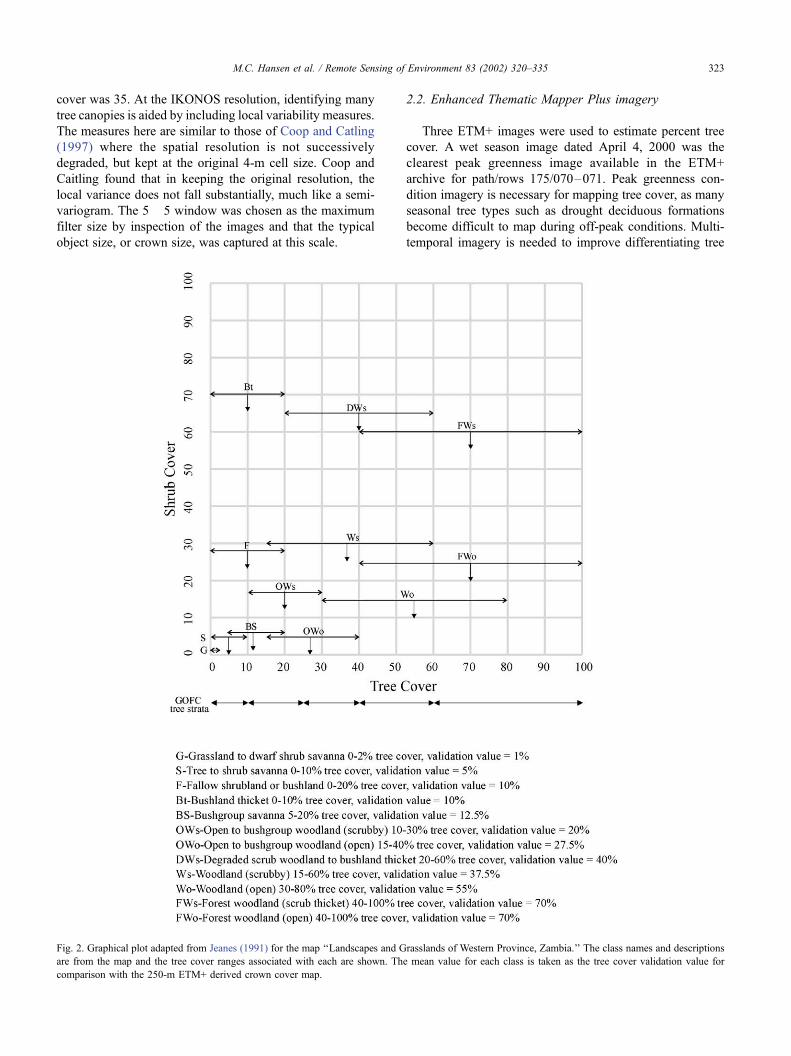
Fig. 2. Graphical plot adapted from Jeanes (1991) for the map ‘‘Landscapes and Grasslands of Western Province, Zambia.’’ The class names and descriptions
are from the map and the tree cover ranges associated with each are shown. The mean value for each class is taken as the tree cover validation value for
comparison with the 250-m ETM+ derived crown cover map.
M.C. Hansen et al. / Remote Sensing of Environment 83 (2002) 320–335 323
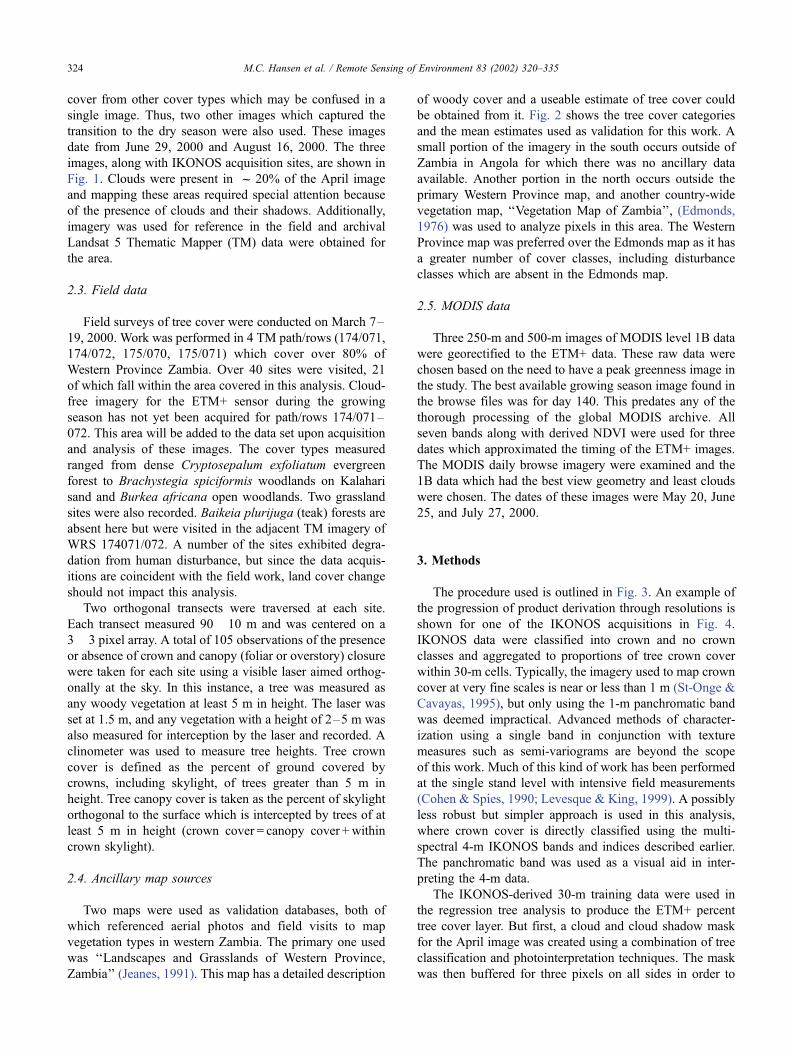
cover from other cover types which may be confused in a
single image. Thus, two other images which captured the
transition to the dry season were also used. These images
date from June 29, 2000 and August 16, 2000. The three
images, along with IKONOS acquisition sites, are shown in
Fig. 1. Clouds were present in f 20% of the April image
and mapping these areas required special attention because
of the presence of clouds and their shadows. Additionally,
imagery was used for reference in the field and archival
Landsat 5 Thematic Mapper (TM) data were obtained for
the area.
2.3. Field data
Field surveys of tree cover were conducted on March 7–
19, 2000. Work was performed in 4 TM path/rows (174/071,
174/072, 175/070, 175/071) which cover over 80% of
Western Province Zambia. Over 40 sites were visited, 21
of which fall within the area covered in this analysis. Cloud-
free imagery for the ETM+ sensor during the growing
season has not yet been acquired for path/rows 174/071–
072. This area will be added to the data set upon acquisition
and analysis of these images. The cover types measured
ranged from dense Cryptosepalum exfoliatum evergreen
forest to Brachystegia spiciformis woodlands on Kalahari
sand and Burkea africana open woodlands. Two grassland
sites were also recorded. Baikeia plurijuga (teak) forests are
absent here but were visited in the adjacent TM imagery of
WRS 174071/072. A number of the sites exhibited degra-
dation from human disturbance, but since the data acquis-
itions are coincident with the field work, land cover change
should not impact this analysis.
Two orthogonal transects were traversed at each site.
Each transect measured 90� 10 m and was centered on a
3� 3 pixel array. A total of 105 observations of the presence
or absence of crown and canopy (foliar or overstory) closure
were taken for each site using a visible laser aimed orthog-
onally at the sky. In this instance, a tree was measured as
any woody vegetation at least 5 m in height. The laser was
set at 1.5 m, and any vegetation with a height of 2–5 m was
also measured for interception by the laser and recorded. A
clinometer was used to measure tree heights. Tree crown
cover is defined as the percent of ground covered by
crowns, including skylight, of trees greater than 5 m in
height. Tree canopy cover is taken as the percent of skylight
orthogonal to the surface which is intercepted by trees of at
least 5 m in height (crown cover = canopy cover +within
crown skylight).
2.4. Ancillary map sources
Two maps were used as validation databases, both of
which referenced aerial photos and field visits to map
vegetation types in western Zambia. The primary one used
was ‘‘Landscapes and Grasslands of Western Province,
Zambia’’ (Jeanes, 1991). This map has a detailed description
of woody cover and a useable estimate of tree cover could
be obtained from it. Fig. 2 shows the tree cover categories
and the mean estimates used as validation for this work. A
small portion of the imagery in the south occurs outside of
Zambia in Angola for which there was no ancillary data
available. Another portion in the north occurs outside the
primary Western Province map, and another country-wide
vegetation map, ‘‘Vegetation Map of Zambia’’, (Edmonds,
1976) was used to analyze pixels in this area. The Western
Province map was preferred over the Edmonds map as it has
a greater number of cover classes, including disturbance
classes which are absent in the Edmonds map.
2.5. MODIS data
Three 250-m and 500-m images of MODIS level 1B data
were georectified to the ETM+ data. These raw data were
chosen based on the need to have a peak greenness image in
the study. The best available growing season image found in
the browse files was for day 140. This predates any of the
thorough processing of the global MODIS archive. All
seven bands along with derived NDVI were used for three
dates which approximated the timing of the ETM+ images.
The MODIS daily browse imagery were examined and the
1B data which had the best view geometry and least clouds
were chosen. The dates of these images were May 20, June
25, and July 27, 2000.
3. Methods
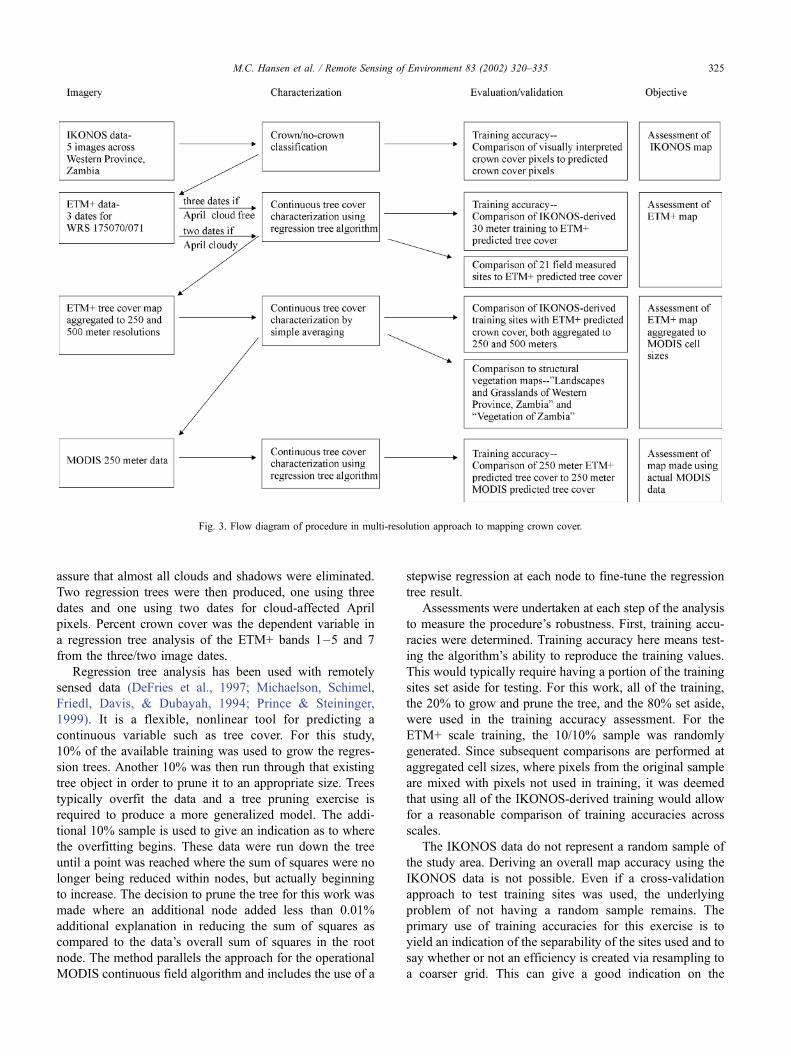
The procedure used is outlined in Fig. 3. An example of
the progression of product derivation through resolutions is
shown for one of the IKONOS acquisitions in Fig. 4.
IKONOS data were classified into crown and no crown
classes and aggregated to proportions of tree crown cover
within 30-m cells. Typically, the imagery used to map crown
cover at very fine scales is near or less than 1 m (St-Onge &
Cavayas, 1995), but only using the 1-m panchromatic band
was deemed impractical. Advanced methods of character-
ization using a single band in conjunction with texture
measures such as semi-variograms are beyond the scope
of this work. Much of this kind of work has been performed
at the single stand level with intensive field measurements
(Cohen & Spies, 1990; Levesque & King, 1999). A possibly
less robust but simpler approach is used in this analysis,
where crown cover is directly classified using the multi-
spectral 4-m IKONOS bands and indices described earlier.
The panchromatic band was used as a visual aid in inter-
preting the 4-m data.
The IKONOS-derived 30-m training data were used in
the regression tree analysis to produce the ETM+ percent
tree cover layer. But first, a cloud and cloud shadow mask
for the April image was created using a combination of tree
classification and photointerpretation techniques. The mask
was then buffered for three pixels on all sides in order to
M.C. Hansen et al. / Remote Sensing of Environment 83 (2002) 320–335324
assure that almost all clouds and shadows were eliminated.
Two regression trees were then produced, one using three
dates and one using two dates for cloud-affected April
pixels. Percent crown cover was the dependent variable in
a regression tree analysis of the ETM+ bands 1–5 and 7
from the three/two image dates.
Regression tree analysis has been used with remotely
sensed data (DeFries et al., 1997; Michaelson, Schimel,
Friedl, Davis, & Dubayah, 1994; Prince & Steininger,
1999). It is a flexible, nonlinear tool for predicting a
continuous variable such as tree cover. For this study,
10% of the available training was used to grow the regres-
sion trees. Another 10% was then run through that existing
tree object in order to prune it to an appropriate size. Trees
typically overfit the data and a tree pruning exercise is
required to produce a more generalized model. The addi-
tional 10% sample is used to give an indication as to where
the overfitting begins. These data were run down the tree
until a point was reached where the sum of squares were no
longer being reduced within nodes, but actually beginning
to increase. The decision to prune the tree for this work was
made where an additional node added less than 0.01%
additional explanation in reducing the sum of squares as
compared to the data’s overall sum of squares in the root
node. The method parallels the approach for the operational
MODIS continuous field algorithm and includes the use of a
stepwise regression at each node to fine-tune the regression
tree result.
Assessments were undertaken at each step of the analysis
to measure the procedure’s robustness. First, training accu-
racies were determined. Training accuracy here means test-
ing the algorithm’s ability to reproduce the training values.
This would typically require having a portion of the training
sites set aside for testing. For this work, all of the training,
the 20% to grow and prune the tree, and the 80% set aside,
were used in the training accuracy assessment. For the
ETM+ scale training, the 10/10% sample was randomly
generated. Since subsequent comparisons are performed at
aggregated cell sizes, where pixels from the original sample
are mixed with pixels not used in training, it was deemed
that using all of the IKONOS-derived training would allow
for a reasonable comparison of training accuracies across
scales.
The IKONOS data do not represent a random sample of
the study area. Deriving an overall map accuracy using the
IKONOS data is not possible. Even if a cross-validation
approach to test training sites was used, the underlying
problem of not having a random sample remains. The
primary use of training accuracies for this exercise is to
yield an indication of the separability of the sites used and to
say whether or not an efficiency is created via resampling to
a coarser grid. This can give a good indication on the
Fig. 3. Flow diagram of procedure in multi-resolution approach to mapping crown cover.
M.C. Hansen et al. / Remote Sensing of Environment 83 (2002) 320–335 325
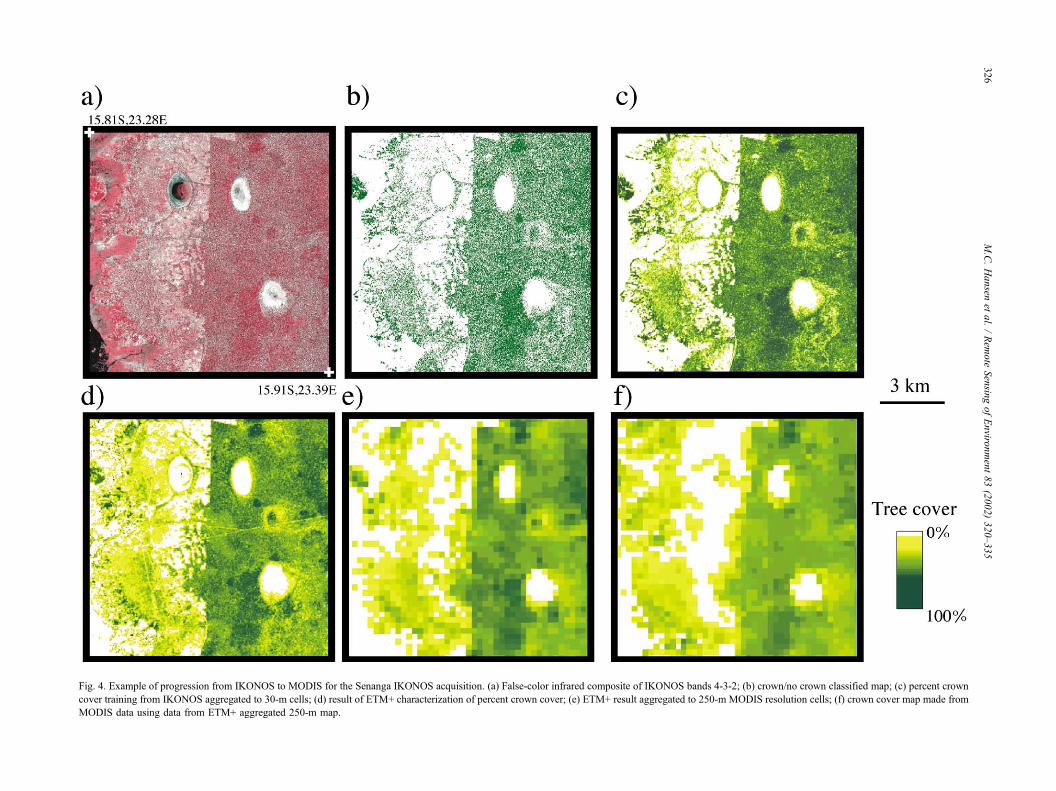
Fig. 4. Example of progression from IKONOS to MODIS for the Senanga IKONOS acquisition. (a) False-color infrared composite of IKONOS bands 4-3-2; (b) crown/no crown classified map; (c) percent crown
cover training from IKONOS aggregated to 30-m cells; (d) result of ETM+ characterization of percent crown cover; (e) ETM+ result aggregated to 250-m MODIS resolution cells; (f) crown cover map made from
MODIS data using data from ETM+ aggregated 250-m map.
M.C.Hansen
etal./Rem
ote
Sensin
gofEnviro
nment83(2002)320–335
326
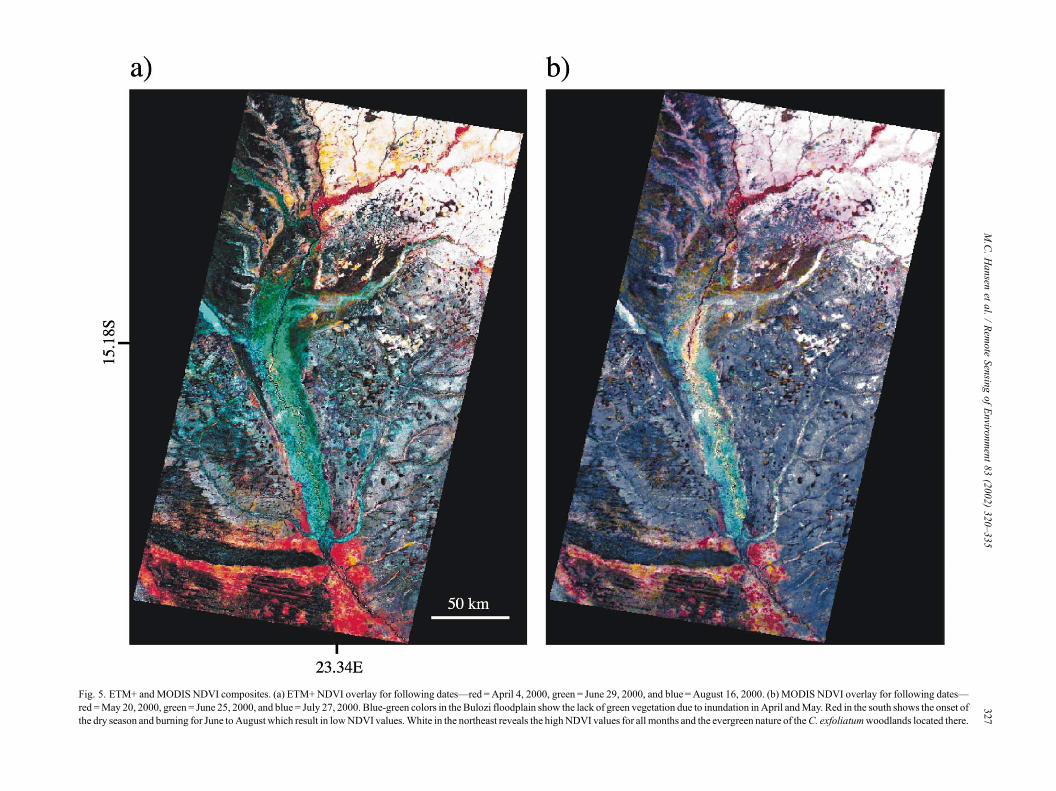
Fig. 5. ETM+ andMODIS NDVI composites. (a) ETM+ NDVI overlay for following dates—red =April 4, 2000, green = June 29, 2000, and blue =August 16, 2000. (b) MODIS NDVI overlay for following dates—
red =May 20, 2000, green = June 25, 2000, and blue = July 27, 2000. Blue-green colors in the Bulozi floodplain show the lack of green vegetation due to inundation in April andMay. Red in the south shows the onset of
the dry season and burning for June to August which result in lowNDVI values.White in the northeast reveals the highNDVI values for all months and the evergreen nature of theC. exfoliatumwoodlands located there.
M.C.Hansen
etal./Rem
ote
Sensin
gofEnviro
nment83(2002)320–335
327
improvements in accuracy gained by resampling the fine-
scale map output to coarser grid cell sizes.
The second assessment consisted of comparisons with
field data. The two major problems with the field data are
(1) indeterminate exact geolocation and (2) the lack of a
spatially random sample, as with the training data. The field
sites were chosen in a way to ensure homogeneous cover by
examining texture images of the archival TM data and
evaluating homogeneity on the ground. This field work
was performed before the elimination of selective availabil-
ity, an introduced error which resulted in displacements of
up to 100 m for global positioning satellite receivers
(Langley, 1997). As a result, errors associated with the
ETM+ sensor blurring sharp boundaries are not quantified.
A benefit of the field data is that it can be used to test the
measure of agreement between the output map product and
a sample of in-situ measured field sites chosen to represent
the various tree cover strata present in the imagery. Another
benefit of the field data is that it allows us to take the
interpreted variable from the IKONOS imagery, that of
crown cover, and derive a relationship between it and the
other variable of interest, canopy cover.
The third assessment was a statistical sample of existing
structural vegetation maps for comparison with the map
product. This exercise is meant to provide a reliable accu-
racy estimate for the 250-m ETM+ derived map. The
‘‘Landscapes and Grasslands of Western Province, Zambia’’
and ‘‘Vegetation of Zambia’’ maps use a similar classifica-
tion scheme as the one for the continuous fields. For
example, the maps define trees as 5-m-tall woody plants
and a sequence of tree canopy cover strata from forest
to woodland to savanna to grassland is defined based on
this definition. The maps also allow for a statistically
random spatial sample to be taken for assessing the overall
and per stratum accuracies of the map output. The major
limitation of this approach is that the canopy cover estimates
are made based on class labels as the map itself is not a
depiction of a continuously varying tree cover. The primary
map, ‘‘Landscapes and Grasslands of Western Province,
Zambia,’’ was scanned and georegistered. This map has a
scale of 1:500,000, meaning that a 250-m2 area is repre-
sented as a 0.5-mm2 on the map, approaching a point in
practical terms. A cursor of this size was used with the
scanned map to locate sample points.
The 250-m map, created by aggregating the ETM+
data, was divided into five strata which represent general
tree cover classes provided by the Global Observations of
Forest Cover (GOFC) framework (Ahern et al., 1999). The
strata were 0–10%, 11–25%, 26–40%, 41–60%, and
>60% tree canopy cover. Each stratum had 25 sites
randomly selected from the 250-m map. The latitude and
longitude coordinates for these sites were then plotted on
the Western Province map. Based on Fig. 2, each point
was assigned a single class cover value. Out of the 125
points, 28 were along or near the boundaries of two
classes, but only a single class was taken for each point.
None of the sites fell outside of the map boundaries in
Angola. Thirteen were located in Northwest Province,
outside of the Western Province map. For these points,
the ‘‘Vegetation Map of Zambia’’ (Edmonds, 1976) was
referenced and numbers assigned by crosswalking the
Edmonds class to one from the Western Province map.
Three MODIS images were georegistered to the aggre-
gated 250-m data for use in a test of the ability to use
MODIS to map percent tree crown cover. Fig. 5 shows
three overlain NDVI time planes for the ETM+ and
MODIS 1B data. The dates are slightly different as are
the enhancements, however, the general phenological var-
iation is comparable. The colors clearly show the fluctua-
tion of water in the Bulozi Plain, the onset of burning and
senescence in the south, and the evergreen foliage of the
forests in the northeast. From the 250-m map, a 10%
sample was taken to grow a regression tree, and another
10% taken to prune the grown tree. The approach mirrors
that of the ETM+ map production. After the map was
made, the output was aggregated to 500 and 250 m, and
500-m comparisons were made.
4. Results
4.1. Classifying IKONOS data
The final IKONOS classifications were compared to the
traced training areas. The average training accuracy for all
five IKONOS images was 86.7%. The texture indices were
of great use in separating crowns, particularly the variability
of the near-infrared (NIR). In the classification trees created
for each IKONOS image, texture measures dominate as high
local variability due to illuminated and shadowed areas of
crowns is characteristic of trees. Local variance values of the
NIR were found to relate to forest structure variables by
Coop and Caitling (1999). Of course, some stands are of
such a continuous, smooth structure that high local variance
values are not useful and metrics other than NIR local
variance are used.
The greatest difficulty in mapping the IKONOS data was
defining shadowed areas as crown or no crown. Even in the
1-m data, these distinctions were not easily made. Fig. 6
shows a training site from one of the IKONOS images. This
is a marginally successful depiction with an overall agree-
ment of 75%. The root mean square errors (rmse) of the
IKONOS training to the IKONOS predicted at 30 m for this
site is 9.64%. The rmse of the ETM+ result to both the
IKONOS training and classification result is 13.81% and
13.05%, respectively. The total crown cover for the
300� 300 m training site is 57.9% for the IKONOS training
data, 56.2 for the IKONOS classification result, and 57.6 for
the ETM+ crown cover depiction. Two facts are important
to note from this figure. First, even though the rmse between
the three depictions is near or greater than 10% crown cover,
the total crown cover for the area, about the size of a
M.C. Hansen et al. / Remote Sensing of Environment 83 (2002) 320–335328
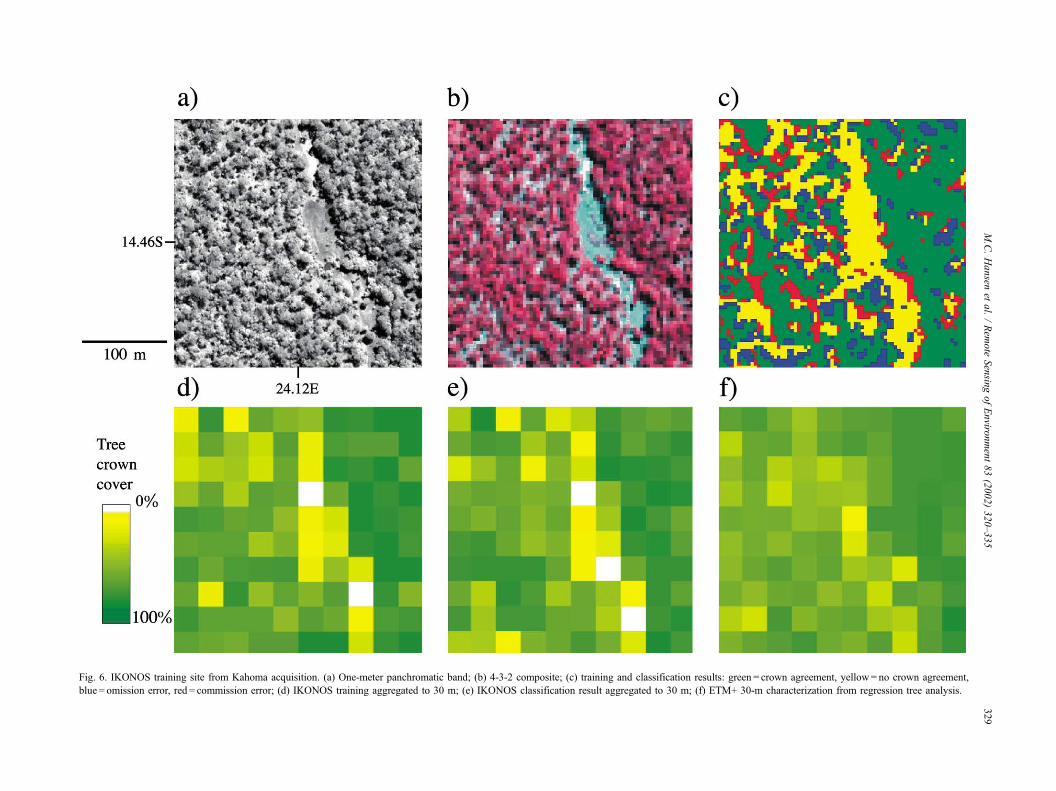
Fig. 6. IKONOS training site from Kahoma acquisition. (a) One-meter panchromatic band; (b) 4-3-2 composite; (c) training and classification results: green = crown agreement, yellow= no crown agreement,
blue = omission error, red = commission error; (d) IKONOS training aggregated to 30 m; (e) IKONOS classification result aggregated to 30 m; (f) ETM+ 30-m characterization from regression tree analysis.
M.C.Hansen
etal./Rem
ote
Sensin
gofEnviro
nment83(2002)320–335
329
MODIS pixel, is almost identical. Second, the ETM+ im-
agery exhibits adjacency effects which preclude the sharp
delineation of tree cover seen in the IKONOS image. Both
the high and low ends of the data are smoothed out in this
case. The functional resolution of the ETM+ is greater than
30 m when sensor modulation transfer and point spread
functions (MTF and PSF) are included. Townshend et al.
(2000) tested these effects and warn data users to beware
making per pixel characterizations. It appears that the
ETM+ pixels should be either deconvolved or resampled
to a coarser scale to reduce the impact this blurring has on
boundary delineation. This could also be done by resam-
pling the product to a coarser scale, as was done in this
study.
The high end of crown cover in the IKONOS imagery
proved somewhat problematic. When crowns begin to touch
and overlap, the mixing of shadow, canopy, and ground
leads to some difficulty in accurately estimating crown
cover. Small gaps are indistinguishable and even larger gaps
and shorter trees can be obscured in shadow. Field measure-
ments for forest sites, including B. plurijuga and C. exfo-
liatum forests, had crown cover values around 80%. Based
on this fact, the high end of the 30-m aggregated IKONOS
training was scaled. Values from 60% to 100% crown cover
were scaled to 60% to 80% crown cover.
4.2. Characterizing and aggregating ETM+ data
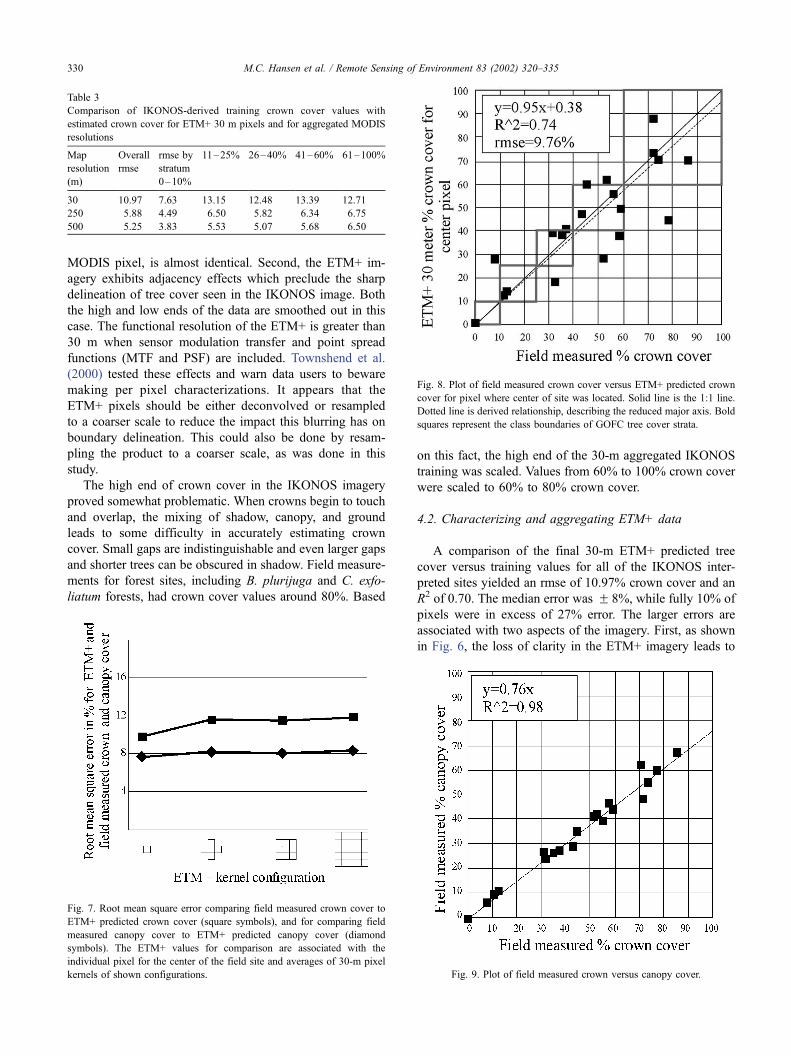
A comparison of the final 30-m ETM+ predicted tree
cover versus training values for all of the IKONOS inter-
preted sites yielded an rmse of 10.97% crown cover and an
R2 of 0.70. The median error was F 8%, while fully 10% of
pixels were in excess of 27% error. The larger errors are
associated with two aspects of the imagery. First, as shown
in Fig. 6, the loss of clarity in the ETM+ imagery leads to
Table 3
Comparison of IKONOS-derived training crown cover values with
estimated crown cover for ETM+ 30 m pixels and for aggregated MODIS
resolutions
Map
resolution
(m)
Overall
rmse
rmse by
stratum
0–10%
11–25% 26–40% 41–60% 61–100%
30 10.97 7.63 13.15 12.48 13.39 12.71
250 5.88 4.49 6.50 5.82 6.34 6.75
500 5.25 3.83 5.53 5.07 5.68 6.50
Fig. 7. Root mean square error comparing field measured crown cover to
ETM+ predicted crown cover (square symbols), and for comparing field
measured canopy cover to ETM+ predicted canopy cover (diamond
symbols). The ETM+ values for comparison are associated with the
individual pixel for the center of the field site and averages of 30-m pixel
kernels of shown configurations.
Fig. 8. Plot of field measured crown cover versus ETM+ predicted crown
cover for pixel where center of site was located. Solid line is the 1:1 line.
Dotted line is derived relationship, describing the reduced major axis. Bold
squares represent the class boundaries of GOFC tree cover strata.
Fig. 9. Plot of field measured crown versus canopy cover.
M.C. Hansen et al. / Remote Sensing of Environment 83 (2002) 320–335330
many errors where there are sharp tree cover boundaries.
Secondly, in the spectral domain, there are isolated pixels
which are inseparable, even given three dates and six bands
of ETM+ data (see the center of the upper left dambo in Fig.
4d).
A test of the predicted crown cover for the three date
analysis versus the two date analysis yielded an rmse of
F 9% crown cover with a median error of F 5%. The larger
errors were almost exclusively associated with the flooded
grassland formations. The two date products could not
accurately delineate the grasslands. The use of only the
June and August images caused difficulties in mapping the
grasslands of the Bulozi Plain and some dambos. The April
image has dramatically different signatures for many grass-
lands which for that time are inundated. Not having those
signatures leads to some errors in the cloud masked area.
Resampling both the training data and the map output to
a 250-m grid increases the R2 to 0.88 and the rmse falls to
5.88% and the median error to F 5% of the predicted value.
Only 10% of the pixels have errors in excess of 13% crown
cover. Table 3 shows these results and those of a 500-m
comparison. The benefits of resampling to a coarser grid are
obvious as both the ETM+ and training pixels are blurred
and per pixel sensor limitations are partially overcome.
Also, the last few inseparable spectral signatures between
very different canopy cover classes can be washed out or
minimized via aggregating.
4.3. Comparison of 30-m map with field data
The field data sites were tabulated and plotted against
various kernels of the ETM+ tree cover output. Fig. 7 shows
the various kernel arrangements along with results compar-
ing the estimated crown cover to the field measured crown
cover. There is no significant variability seen between
kernel figurations and this is taken as evidence that in
general, the geolocation problem was minimized by select-
ing homogeneous sites. Individual sites could still exhibit
signature extension problems, but for these sites no such
problems are evident. A plot of the center pixel ETM+
crown cover prediction versus the field measurements is
shown in Fig. 8.
All misses within the boundaries of tree crowns were
noted and a strong relationship between field measured
crown and canopy cover was found (R2 = 0.98). The plot of
canopy versus crown cover can be seen in Fig. 9. This
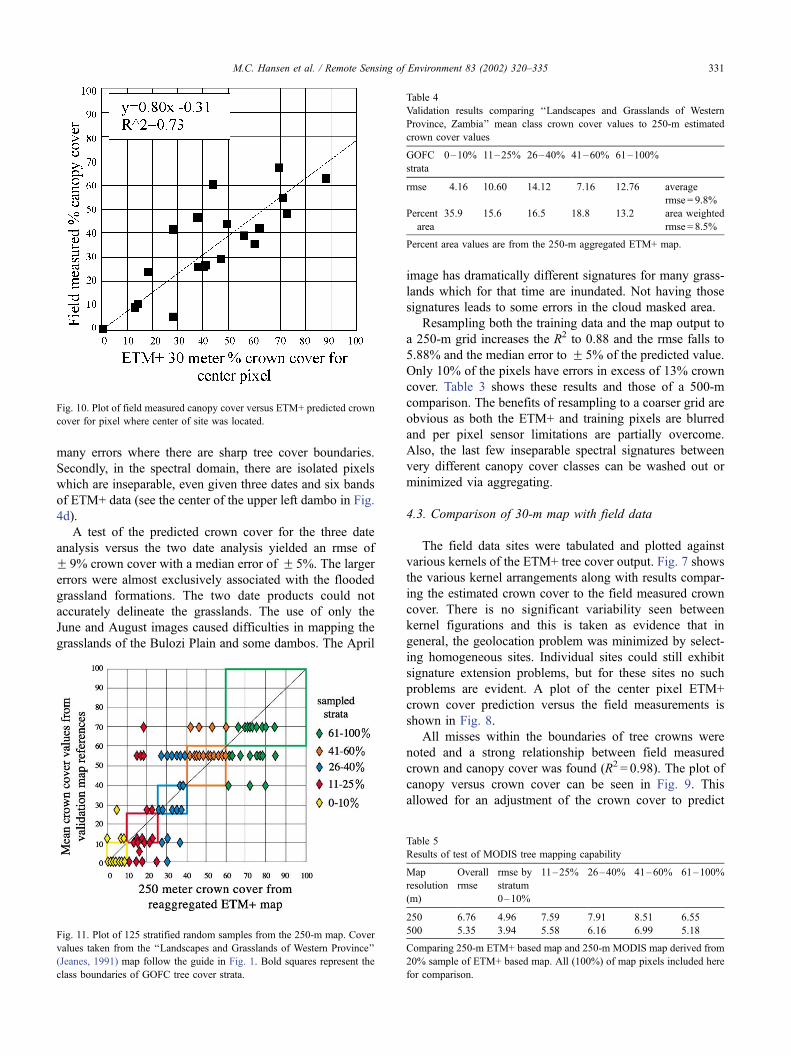
allowed for an adjustment of the crown cover to predict
Fig. 10. Plot of field measured canopy cover versus ETM+ predicted crown
cover for pixel where center of site was located.
Fig. 11. Plot of 125 stratified random samples from the 250-m map. Cover
values taken from the ‘‘Landscapes and Grasslands of Western Province’’
(Jeanes, 1991) map follow the guide in Fig. 1. Bold squares represent the
class boundaries of GOFC tree cover strata.
Table 4
Validation results comparing ‘‘Landscapes and Grasslands of Western
Province, Zambia’’ mean class crown cover values to 250-m estimated
crown cover values
GOFC
strata
0–10% 11–25% 26–40% 41–60% 61–100%
rmse 4.16 10.60 14.12 7.16 12.76 average
rmse = 9.8%
Percent
area
35.9 15.6 16.5 18.8 13.2 area weighted
rmse = 8.5%
Percent area values are from the 250-m aggregated ETM+ map.
Table 5
Results of test of MODIS tree mapping capability
Map
resolution
(m)
Overall
rmse
rmse by
stratum
0–10%
11–25% 26–40% 41–60% 61–100%
250 6.76 4.96 7.59 7.91 8.51 6.55
500 5.35 3.94 5.58 6.16 6.99 5.18
Comparing 250-m ETM+ based map and 250-m MODIS map derived from
20% sample of ETM+ based map. All (100%) of map pixels included here
for comparison.
M.C. Hansen et al. / Remote Sensing of Environment 83 (2002) 320–335 331
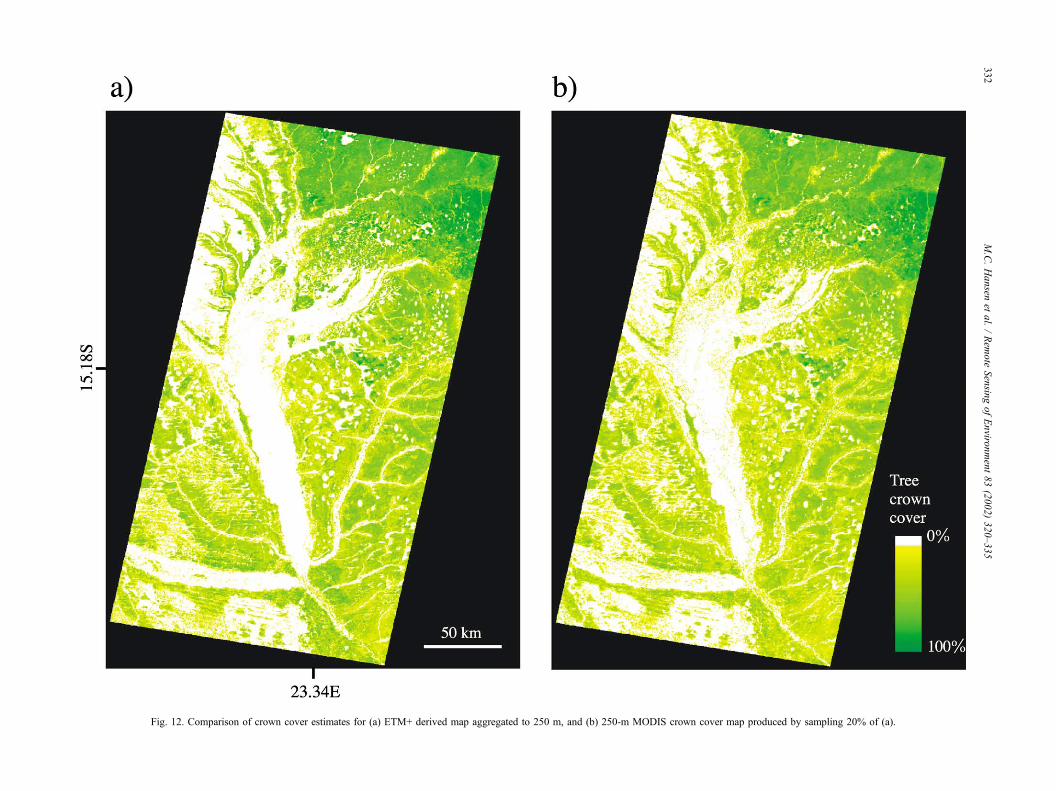
Fig. 12. Comparison of crown cover estimates for (a) ETM+ derived map aggregated to 250 m, and (b) 250-m MODIS crown cover map produced by sampling 20% of (a).
M.C.Hansen
etal./Rem
ote
Sensin
gofEnviro
nment83(2002)320–335
332
canopy cover (canopy = 0.76*crown). The field canopy cover
values are plotted against the ETM+ canopy cover estimates
in Fig. 10. The field data for canopy cover compared to the
scaled ETM+ canopy cover map resulted in an average error
for the ETM+ kernel configurations of 8.1% canopy cover.
4.4. Comparison of 250-m map with ancillary map sources
The data from the 250-m resampled ETM+ map and the
validation values from the maps are plotted in Fig. 11. The
overall area weighted average error was 8.5%. The errors
are further explained in Table 4. While this approach is
inexact given the categorical depiction of tree cover in the
Western Province map, the numbers provide an indication
that the typical range of errors for this map are within the
range of traditional tree cover classes such as those of the
five strata used here. The least accurate stratum in this
comparison is the open woodland class. This reveals the
predominance of the woodland class in both the Western
Province and Zambia maps. The range of cover for this
class is 30–80% for the Western Province map and 40–
60% for Edmonds’ Zambia map. We feel that the contin-
uous field approach, where training is created on actual
intermediate cover pixels, yields explicit results for this
entire range and should be an improvement over the
existing maps for this area. The use of broad categories
over large canopy cover ranges is unable to capture the
actual variability of cover which is present in the satellite
signal. The evaluations undertaken here show that it is
possible to capture this variability and map it in a contin-
uous fashion.
5. Experimental mapping with MODIS data
The final part of the analysis involved using actual
MODIS data in mapping the area of study. Ultimately, a
global MODIS product will be used for comparison. As that
has yet to be generated, a map using level 1b MODIS data
was made. The map was generated using a 20% sample of
the validation data set. Since the training sites for the
MODIS data come directly from the validation data set,
this is not a true validation example. It represents a test of
the spectral information content of the MODIS data in
reproducing the validation map and what may be expected
in a best possible result from the global MODIS product.
The results comparing the 250-m ETM+ validation tree
cover map to the MODIS-derived 250-m map can be seen in
Table 5. The numbers reveal a robust capability when using
MODIS data to map tree cover for this area. Most of the
larger errors are along narrow valleys and are related to
limitations in the georegistration of the imagery. Addition-
ally, some evidence of blurring due to adjacency effects and
possible impacts of the MTF and PSF on MODIS pixel
values are present. However, the overall result when com-
pared to the 250-m map (Fig. 12) is encouraging.
6. Discussion
Canopy cover is currently the basis for the MODIS
continuous field of tree cover map product. The crown to
canopy cover adjustment based on field measurements is
deemed necessary as the gaps in the canopies are not visible
with the IKONOS imagery, but are, of course, on the
ground. The final 30-, 250- and 500-m maps can be scaled
using this relationship to estimate canopy cover. Performing
such an adjustment assumes that this relationship exists
across the region or biome. Certainly, different species of
trees have different canopy cover values. However, each of
these transects represents an integrated measure of tree
stands of various composition and range from C. exfolia-
tum-dominated broadleaf evergreen forests to more seasonal
B. spiciformis, B. africana, and Guibourtia coleosperma
woodlands and savannas. While making such an adjustment
could take a more complex form, where various stands each
had their own adjustment function, the evidence for this area
shows that a simple approach may be possible at this
resolution. A more intensive effort where a species or
ecoregion-based adjustment is sought is beyond the scope
and resources of this work.
The comparison of the 250-m aggregated map to the
Western Province map resulted in an rmse which indicates
the 250-m data to be an accurate portrayal of tree cover.
Congalton and Green (1999) point out the limitations when
using existing map sources for validation. First, there is the
difficulty in comparing different legends. The adjustment of
a map legend to conform to the new map’s legend is inexact.
Second, existing maps are older and some have likely
changed. Third, the errors of the source map are unknown
and disagreements are labeled errors in the new map. These
potential errors tend to cause an unknown overestimation of
the errors in the satellite-derived products.
Examining the few pixels which have the greatest dis-
agreement, some educated guesses can be made about the
sources of the errors. First, it appears that B. plurijuga (teak)
forests are overestimated in the ancillary map. Only one
sample point was located within the teak forests in the
ancillary map, and the predicted tree cover for that site was
18%. Interpretation of the imagery afterward showed there
to be fewer and smaller areas of dense tree cover within the
teak areas than indicated on the maps.
Three samples were characterized in the ancillary map as
degraded woodland and bushland thicket. For these sites,
the 250-m map overestimated tree cover. It is probable that
consistently mapping woody cover at the 5-m height thresh-
old is unreliable. It cannot be expected that dense woody
cover of 4 m in height will be distinguished from the same
formation at 6 m in height. While height cannot be directly
measured using multi-spectral imagery, tall, dense stands
can largely be discriminated from other covers. While in any
given scene at a particular time, a grassland may be
spectrally equivalent to a woodland, over time the phenol-
ogy of the two will diverge enough for there to be a
M.C. Hansen et al. / Remote Sensing of Environment 83 (2002) 320–335 333
successful discrimination. Identifying the cover types where
such discrimination is not possible would be of benefit to
data set users. It appears possible that the degraded wood-
land and bushland thicket class is one such example.
Many uses of land cover in modeling employ the land
cover class as a label to attribute various biophysical pa-
rameters. The continuous field approach offers many
advantages over classifications in allowing the user to
define his or her own classes of interest via thresholding.
However, the results here illustrate another advantage. The
root mean square error allows the user to recognize whether
the magnitude of errors present is acceptable in a manner
more easily interpreted than a classification accuracy. For
example, if the measurements from the field data are
converted to the five-class scheme, an accuracy of only
65% results. However, the rmse of 11.1% reveals, as does
Fig. 8, that the errors are most likely in adjacent cover
classes. In other words, all errors are not equal and some
may have no impact on the user’s analysis (DeFries & Los,
1999). This can be divined in a confusion matrix, but not as
easily with a single value as the rmse. Errors present in Fig.
8 are not as destructive to an analysis as errors between, for
example, forest and grassland. Users who could partition
their biophysical properties to a continuous set of variables
tied to the continuous tree cover values will further reduce
the impacts of reference map errors.
A comparison made with the data from the ancillary
Western Province map shows similar results. Again, the
assignment of mean class cover values to the map is an
oversimplification which probably underestimates map
accuracy. However, when converting the continuous field
to the GOFC classes and comparing to the classes in the
map, an accuracy of 56% is achieved (Fig. 11). However,
90% of the sampled sites are classified correctly or in an
adjacent cover class. The rmse value of 9.8% for the 125
sites provides a level of confidence much diminished when
using class labels.
7. Conclusion
Multi-scale remote sensing data sets can be used to aid in
large area mapping projects. The results here show that
very-high resolution data sets allow for the direct inter-
pretation of the variable of interest, while multi-temporal,
coarser data sets allow for the mapping of that variable over
a wide region. In situ measurements and ancillary map
sources help to provide an estimate of the product’s
reliability.
However, a number of issues remain to be resolved.
First and foremost is the need to develop statistically
rigorous sampling procedures for validating the intermedi-
ate level characterizations using the ETM+ data. Relying
on ancillary map sources is not prudent, as they may not
exist, or be of suspect quality. The optimal method would
include enough ground sites randomly selected to provide
a definitive rmse for the output map. However, access to
sites is a problem almost anywhere. In Zambia, it is the
lack of infrastructure that is the primary limitation. In the
United States, access would be most limited by sites on
private property. Costs of site access will have to be
incorporated into sampling procedures. Another issue is
the ability to relate the IKONOS-interpreted variable of
crown cover with the in situ measured canopy cover
variable. These relationships may not be so easily esti-
mated for all biomes.
Work is ongoing to refine the approach and apply it for a
number of sites representative of dominant biome types.
Initial site locations are in the conterminous United States
and will cover 2–3 ETM+ footprints as the Zambia proto-
type did. Current work is focused on maximizing field data
collection efficiency, including the possible use of digital
cameras to quickly gather canopy data as in the MODIS
Bigfoot validation project (Campbell, Burrows, Gower, &
Cohen, 1999). A standard procedure of in-situ data collec-
tion such as that of Bigfoot could allow for a globally
reproducible, standardized validation technique. This would
remove the need for relying on ancillary data sets for
validation.
Acknowledgements
Funding from the National Aeronautics and Space
Administration supported this research under contract
NAS596060 and grant NAG59339. We would also like to
thank NASA’s Scientific Data Buy for purchasing the
IKONOS images from nSpace Imaging L.P. This study was
part of the SAFARI 2000 Southern African Regional
Science Initiative.
References
Ahern, F., Belward, A., Churchill, P., Davis, R., Janetos, A., Justice, C.,
Loveland, T., Malingreau, J.-P., Maiden, M., Skole, D., Taylor, V.,
Yauoka, Y., & Zhu, Z. (1999). A strategy for global observation of
forest cover. GOFC design team draft report, p. 58.
Campbell, J. C., Burrows, S., Gower, S. T., & Cohen, W. B. (1999). Big-
Foot: characterizing land cover, LAI, and NPP at the Landscape Scale
for EOS/MODIS validation. Field Manual 2.1. Environmental Science
Division Pub. No. 4937. Oak Ridge, TN: Oak Ridge National Lab-
oratory.
Cohen, W. B., & Justice, C. O. (1999). Validating MODIS terrestrial eco-
logy products: linking in situ and satellite measurements. Remote Sen-
sing of Environment, 70, 1–4.
Cohen, W. B., & Spies, T. A. (1990). Semivariograms of digital imagery for
analysis of conifer canopy structure. Remote Sensing of Environment,
34, 167–178.
Congalton, R. G., & Green, K. (1999). Assessing the accuracy of remotely
sensed data: principles and practices. Boca Raton, FL: Lewis Publishers.
Coop, N. C., & Catling, P. C. (1997). Predicting the complexity of habitat in
forests from airborne videography for wildlife management. Interna-
tional Journal of Remote Sensing, 12, 2677–2682.
DeFries, R. S., Hansen, M., Steininger, M., Dubayah, R., Sohlberg, R., &
Townshend, J. (1997). Subpixel forest cover in Central Africa from
M.C. Hansen et al. / Remote Sensing of Environment 83 (2002) 320–335334

multisensor, multitemporal data. Remote Sensing of Environment, 60,
228–246.
DeFries, R. S., Hansen, M. C., Townshend, J. R. G., Janetos, A. C., & Love-
land, T. R. (2000). A new global 1-km dataset of percentage tree cover
derived from remote sensing. Global Change Biology, 6, 247–254.
DeFries, R. S., Hansen, M. C., Townshend, J. R. G., & Sohlberg, R. S.
(1998). Global land cover classifications at 8 km spatial resolution: the
use of training data derived from Landsat imagery in decision tree
classifiers. International Journal of Remote Sensing, 19, 3141–3168.
DeFries, R. S., & Los, S. O. (1999). Implications of land-cover misclassi-
fications for parameter estimates in global land-surface models: an
example from the Simple Biosphere Model (SiB2). Photogrammetric
Engineering and Remote Sensing, 65, 1083–1088.
DeFries, R. S., & Townshend, J. R. G. (1994). NDVI-derived land cover
classification at global scales. International Journal of Remote Sensing,
15(17), 3567–3586.
Edmonds, A. C. (1976). Vegetation Map of Zambia, 1:500000. Lusaka,
Zambia: Forest Department, Government of Zambia, Survey Depart-
ment.
Gougeon, F. A. (1995). A crown-following approach to the automatic
delineation of individual tree crowns in high spatial resolution aerial
images. Canadian Journal of Remote Sensing, 21, 274–284.
Hansen, M. C., DeFries, R. S., Townshend, J. R. G., & Sohlberg, R. (2000).
Global land cover classification at 1 km spatial resolution using a clas-
sification tree approach. International Journal of Remote Sensing, 21,
1331–1364.
Jeanes, K. W. (1991). Landscapes and grasslands of Western Province,
Zambia. Dept. of Agriculture, Western Province.
Kadmon, R., & Harari-Kremer, R. (1999). Studying long-term vegetation
dynamics using digital processing of historical aerial photographs.
Remote Sensing of Environment, 68, 164–176.
Langley, R. B. (1997). The GPS error budget. GPS World, 10, 51–56.
Levesque, J., & King, D. J. (1999). Airborne digital camera image semi-
variance for evaluation of forest structural damage at an acid mine site.
Remote Sensing of Environment, 68, 112–124.
Loveland, T. R., Reed, B. C., Brown, J. F., Ohlen, D. O., Zhu, Z., Yang,
L., & Merchant, J. W. (2000). Development of a global landcover
characteristics database and IGBP DISCover from 1 km AVHRR data,
21 (6 and 7), 1303–1330.
Michaelson, J., Schimel, D. S., Friedl, M. A., Davis, F.W., &Dubayah, R. O.
(1994). Regression tree analysis of satellite and terrain data to guide
vegetation sampling and surveys. Journal of Vegetation Science, 5,
673–696.
Miller, J. R., Schulz, T. T., Thompson Hobbs, N., Wilson, K. R., Schrupp,
D. L., & Baker, W. L. (1995). Changes in the landscape structure of a
Southeastern Wyoming Riparian Zone following shifts in the stream
dynamics. Biological Conservation, 72, 371–379.
Prince, S. D., & Steininger, M. K. (1999). Biophysical stratification of the
Amazon basin. Global Change Biology, 5, 1–22.
Scepan, J., Menz, G., & Hansen, M. C. (1999). The DISCover validation
image interpretation process. Photogrammetric Engineering and Re-
mote Sensing, 65(9), 1075–1081.
Scholes, R. J., & Parsons, D. A. B. (1997). The Kalahari Transect: Research
on Global Change and Sustainable Development in Southern Africa.
IGBP Report 42, Stockholm, Sweden, 61 pp.
St-Onge, B. A., & Cavayas, F. (1995). Estimating forest stand structure
from high resolution imagery using the directional variogram. Interna-
tional Journal of Remote Sensing, 16, 1999–2021.
Swap, R. J., & Privette, J. (1999). Overview of the Southern African Re-
gional Science Initiative—SAFARI 2000. IEEE 1999 International
Geoscience and Remote Sensing Symposium. Hamburg, Germany, 28
June–2 July, 1999.
Tanaka, S., & Sugimura, T. (1999). A new frontier of remote sensing from
IKONOS images. International Journal of Remote Sensing, 22, 1–5.
Townshend, J. R. G., Huang, C., Kalluri, S. N. V., DeFries, R. S., Liang, S.,
& Yang, K. (2000). Beware of per-pixel characterization of land cover.
International Journal of Remote Sensing, 21, 839–843.
Townshend, J. R. G., Justice, C. O., Skole, D., Malingreau, J.-P., Cihlar, J.,
Teillet, P., Sadowski, F., & Ruttenberg, S. (1994). The 1 km resolution
global data set: needs of the International Geosphere-Biosphere Pro-
gramme. International Journal of Remote Sensing, 17, 231–255.
Turner, I. M., Wong, Y. K., Chew, P. T., & Ibrahim, A. B. (1996). Rapid
assessment of tropical rain forest successional status using aerial photo-
graphs. Biological Conservation, 77, 177–183.
M.C. Hansen et al. / Remote Sensing of Environment 83 (2002) 320–335 335