Embed Size (px)
Citation preview

Science Journal of Circuits, Systems and Signal Processing 2018; 7(2):48-59
http://www.sciencepublishinggroup.com/j/cssp
doi: 10.11648/j.cssp.20180702.12
ISSN: 2326-9065 (Print); ISSN: 2326-9073 (Online)
Development of a Modular Biopotential Amplifier Trainer for Biomedical Instrumentation Laboratory Experiments
Saiful Islam Khan, Fakrul Islam Tushar, Md. Amirul Islam Rokan, Rupu Chowdhury
Department Electrical and Electronic Engineering, American International University Bangladesh, Dhaka, Bangladesh
Email address:
To cite this article: Saiful Islam Khan, Fakrul Islam Tushar, Md. Amirul Islam Rokan, Rupu Chowdhury. Development of a Modular Biopotential Amplifier
Trainer for Biomedical Instrumentation Laboratory Experiments. Science Journal of Circuits, Systems and Signal Processing.
Vol. 7, No. 2, 2018, pp. 48-59. doi: 10.11648/j.cssp.20180702.12
Received: February 20, 2018; Accepted: March 8, 2018; Published: March 29, 2018
Abstract: This paper presents the design, development and implementation of a reconfigurable low-cost biopotential
amplifier trainer module (RTR module) and quantitative analysis of the students’ compatibility with the trainer module. The
trainer module can measure Electrocardiogram (ECG), Electroencephalogram (EEG) and Electromyogram (EMG) biopotential
signals by reconfiguring the module using the basic circuit and filtering blocks. Given hand on experience, the module is
designed and implemented in such reconfigurable manner that the students can avoid, disconnect and add any filtering blocks
to understand the effect of these filters to the biopotential signals. The laboratory experience is an important component of the
learning process. The RTR module is a low cost and compact educational tool. With this RTR module, the students should be
able to recognize the biopotential signals and the acquisition methods in an intuitive and easy way, allowing them to improve
their skills of designing biomedical instrumentation.
Keywords: Biopotential, Electrocardiogram, Biomedical Instrumentation
1. Introduction
All manuscripts must be in English. These guidelines
include in medical electronics and bio-signal engineering
biopotential is an unavoidable factor. Biopotentials are
electric potentials that is measured in living cells, tissues and
organisms, which accompanies biochemical process [1].
There are different types of biopotentials in different parts of
human body which are responsible for cardiac function, brain
function, muscle movement, eye movement, sensory function
and many other events in the body. Different biopotentials
are ECG, EEG, EMG, EOG, AAP etc. Among all other
biopotentials Electrocardiogram (ECG),
Electroencephalogram (EEG) and Electromyogram (EMG)
are the most important as they are representing cardiac
activity, neural activity of brain and muscle construction
respectively. Depending on their physiological nature,
different biopotential signals have distinct amplitude and
frequency characteristics. The distribution of this commonly
used biopotential signals span more than four decades both in
amplitude, from 1µV to 10 mV, and in frequency, from 1 Hz
to 10 kHz. [2].
These biopotential signals contaminated with various noise
such as ambient noise, motion artifacts and inherent
instability of signal [3, 4]. The amplification of biopotential
signals and these noises can be eliminated through different
design or filtering techniques such as instrumentation
amplifier, right leg driven circuit, high pass filter, low pass
filter and notch filter.
In engineering and technical education, the laboratorial
experiment is an important component of the learning
process. The proposed universal modular biopotential
amplifier trainer named RTR module is developed with a
view to develop the students learning enhancement and
clearing their knowledge about biopotential signals and their
acquiring instrumentation. Reconfigurable design of the RTR
module given the students freedom to add or avoid different
filtering and basic circuit blocks during measurement of the
biopotential signals, and to realize their effects practically.

Science Journal of Circuits, Systems and Signal Processing 2018; 7(2):48-59 49
Figure 1. Methodology for achieving goal of the proposed RTR MODULE.
Comparatively biomedical educational devices are very
costly. The proposed RTR module is a cost-effective
alternative for the students and reconfigurable design of the
RTR module leads them to the improvement of their skills,
providing hand-on and work-based designing abilities of
biomedical instrumentation.
2. RTR Module
2.1. Method and Functional Blocks
The main challenge of Acquiring biopotential signals is,
biopotential signals are usually in millivolts or less in
amplitude and have specific frequency ranges for different
[2]. Amplitude of voltage and frequency of the ECG, EEG
and EMG shown in Table 1. Measurement of biopotential
signals may use amplifier which can deal with voltages at
low level or high source impedances. Moreover, it is also
important to reject the field coupling from the power line and
to reject noise from the electric system and environment.
The proposed RTR module is capable of measuring the
ECG, EEG and EMG signals. RTR module is developed
following the Bipolar 3 lead configuration [2]. Three
electrodes are used, including two measurement electrodes
(Ea and Eb) and a reference electrode (Eref). Passive AgCl
patch electrodes are used.
Amplifiers with different gains and different filtering
blocks are required as these biopotentials signals are different
in both voltage and frequency ranges shown in Table 1.
Table 1. Amplitude and Frequencies of biopotential signals.
Source Amplitude Frequency
ECG 0.5mV - 1mV 0.2Hz – 50Hz
EEG 100µV - 2mV 3Hz – 50Hz
EMG 100µV - 90mV 5Hz – 150Hz
RTR Module is developed and implemented with
reconfigurable design. RTR module consists Instrumentation
amplifiers with different gains, right leg driven circuit, high
pass filters, low pass filters, filters of higher orders, and
notch filters. Acquiring the different biopotential signals
different instrumentation amplifiers can be used with
different gains. Reconfiguring design of the RTR module
allows the student to select suitable high and low pass filters
blocks as well as the higher order filters according to their
required ranges. Each and every fundamental circuits and
filtering blocks have separate input and output pins. Using
this input-output pins student can add or remove any circuit/
filter blocks and realize it’s effect.
Figure 2, Figure 3 and Figure 4 representing the
configuration of the RTR module functional block diagrams
for the measurement of ECG, EEG and EMG signals
respectively
Figure 2. Functional block diagram of ECG measurement configuration.

50 Saiful Islam Khan et al.: Development of a Modular Biopotential Amplifier Trainer for Biomedical
Instrumentation Laboratory Experiments
Figure 3. Functional block diagram of EEG measurement configuration.
Figure 4. Functional block diagram of EMG measurement configuration.
By flexibly connecting the pin connections shown in the
Figure 2, Figure 3 and Figure 4 the RTR Module can be
configured to measure the ECG, EEG and EMG signals
respectively. Besides this configuration the student can add
additional filtering blocks and can remove the blocks from
the configuration to understand its effect.
2.2. Equations
The RTR module composed of several fundamental circuit
blocks that are generally used in biopotential amplifiers,
including three instrumentation amplifiers with different
gains, right leg driven circuit, notch filter, 7Hz high pass
filter, 13Hz low pass filter (2nd
and 4th
order) and 512Hz low
pass filter (2nd
and 4th
order).

Science Journal of Circuits, Systems and Signal Processing 2018; 7(2):48-59 51
Figure 5. Circuit diagram of Right leg driven circuit module.
Common mode rejection or CMR, is one of the most
important parameters for biopotential signal applications [7].
During measurements, a large amount of electromagnetic
interference is coupled to the patients’ body through the skin.
To reduce the CMR interference right leg driven circuit
was made up. TL071 was used for the right leg driven circuit
with unity gain. Figure 5 shown the circuit module of right
leg driven circuit.
Instrumentation amplifiers have been broadly used in
biopotential recording applications because of the high input
impedance and the easy gain and offset adjustments through
resistors [5]. Voltage ranges of ECG, EEG and EMG are in
Micro-Volt to Mile-Volt ranges. To make these signals
readable for the other blocks of module a great deal of
amplification is used to employ high gain. We have used 3
different instrumentations amplifier as these biopotential
signals need different gains and interconnected the
instrumentation amplifier and right leg driven circuit
internally to reject CMR so student not have the freedom to
disconnect the right leg driven circuit.
Figure 6. Instrumentation amplifier circuit module of ECG measurement.

52 Saiful Islam Khan et al.: Development of a Modular Biopotential Amplifier Trainer for Biomedical
Instrumentation Laboratory Experiments
Figure 7. Instrumentation amplifier circuit module of EEG and EMG measurement.
Figure 6 shown the instrumentation amplifier circuit
module of the ECG measurement. INA122 is used as an
instrumentation amplifier for ECG measurement. The
calculation of gain can be obtained from equation (1). Figure
7 Shown the Instrumentation amplifier circuit module for
both the EEG and EMG amplifier as they required almost
same amount of gain. AD620 is used as instrumentation
amplifier in this case. The calculation of the gain can be
obtained from equation (2). Table 2 shows all the amplifiers
gain.
���� � 5 � ��� (1)
���� � 1 � ��.��� (2)
Fig. 2 shown there is non-inverting amplifier added after
the instrumentation amplifier in ECG measurement
configuration. The amplitude of the ECG signal decreased
due to the active filtering. The main goal of designing a non-
inverting amplifier is to saturate the ECG signals and
converted them into an amplified waveform. TL071 is used
as non-inverting amplifier and its gain can be calculated from
equation (3). Figure 8 (a) shown the non-inverting
amplifiers’ circuit module.
���� � 1 � ���� (3)
Table 2. Gains of different amplifiers.
Biopotential Signals Instrumentation amplifier GAIN Non- Inverting amplifier GAIN
TOTAL GAIN Name Gain Name Gain
ECG AN122 10.88 TL071 100 1088
EEG AD620 989 X X 989
EMG AD620 989 X X 989
After amplification it’s very important to select the proper
filtering options as these biopotential signals have different
frequency ranges shown in Table 1. In Figure 2, Figure 3 and
Figure 4 shown that in every configuration of the output
biopotential signals is taken from the notch filters output. In
EEG and EMG configuration before adding high pass and
low pass filter a notch filter is added. Figure 8 (b) shown a
notch filter circuit module.
In every IC, there is a noise from a power source which is
generated from the power line. This noise has the same
frequency as the power supply line. This noise can interface
with the desired signal [10]. To avoid and nullify this power
line noise 50 hz notch filter is used. The center rejection
frequency of this circuit is determined by equation (4).
� � ���� �
��∗��∗��∗������� (4)

Science Journal of Circuits, Systems and Signal Processing 2018; 7(2):48-59 53
Figure 8. (a) Non-inverting amplifier Circuit module. (b) Notch filter circuit module.
Figure 9. Some example of EEG waves at different human state [2].
EEG signal is quite complex to measure and it has
different frequency componeent in different human state.
Figure 9 shows some example of EEC waves. For making it
easy in this module, we wanted to capture the alpha range of
54 Saiful Islam Khan et al.: Development of a Modular Biopotential Amplifier Trainer for Biomedical
Instrumentation Laboratory Experiments
the EEG signal only and preset our filters according to that.
Figure 9 explains the frequency range of Alpha signal which
is between 8 to 12 Hz. To cut of the delta and theta waves,
which have frequencies below 7Hz, so a 7Hz high pass filter
was need. A 7Hz 2nd
order multiple-feedback high pass filter
was used to cutoff those unwanted signals. Since the
frequency of the alpha wave is 8-12 Hz. A low pass filter
circuit is needed that will cut off any frequency above 12 Hz.
In the ideal case, the cut-off frequency of the low-pass filter
would be 12 Hz. But in the practical scenario, the gain starts
to drop quite before the cut-off frequency. In that case using a
12 Hz low pass filter would cause a data loss. That is why a
13 Hz low pass filter was chosen so that there is less
attenuation in an alpha wave.
Figure 10. (a) 7Hz 2nd order high pass filter circuit module. (b) 13Hz 2nd order high pass filter circuit module. (c) 13Hz 4th order high pass filter circuit
module.
Figure 11. 512 Hz 2nd order low pass filter.
Figure 10 (c) shows 13 Hz 4th
order circuit module used
for the reason to attenuate the signals above 12 Hz more so
that the output at the end of the full circuit does not contain
any signals above 12 Hz. The cutoff frequencies fHP and fLP
was calculated using the following equation in eqn. 4 and 5.
And resistors and capacitors were selected accordingly.
��� � ���� �
��∗��∗��∗������� (4)
� � � ���� �
��∗��∗��∗������� (5)
Figure 4 shows the EMG measurement reconfiguration of
the RTR module. EMG module almost has the configuration
of the ECG module, the only difference is in the filtering
options. Table 1 shows the frequency range of the EMG
signals. A 7 Hz high pass filter is used and to reject the
higher unwanted frequencies two 512 Hz low pass filters
were used (2nd
&4th
order). Figure 11 shown the circuit
module of the 512 Hz 2nd
order low pass filter. 512 Hz 4th
order low pass filter is designed by cascading two 512 Hz 2nd
order low pass filters.

Science Journal of Circuits, Systems and Signal Processing 2018; 7(2):48-59 55
2.3. Implementation and Display
Proposed module gives output wave shapes that can be
observed directly using a cathode ray oscilloscope (CRO) or
a digital one. However, data acquisition system can also be
employed to see the real-time ECG, EEG and EMG output
on a personal computer or even in MATLAB so that students
can further work with the collected data.
(a)
(b)
(c)
Figure 12. Designed prototype of RTR module. (a) Inner circuit blocks; (b) Side view. (c) Top view.

56 Saiful Islam Khan et al.: Development of a Modular Biopotential Amplifier Trainer for Biomedical
Instrumentation Laboratory Experiments
A simple proposed data acquisition system can be
achieved using a microcontroller unit and MATLAB for
software interfacing; the proposed block setup is shown in
Figure 13.
The analog outputs from the module are to be converted
into a digital data through an ADC for the computer to rea
and display. A microcontroller can be configured and
programmed to do the operation.
For interfacing or build up the communication between the
hardware part to the computer we had used the serial
communication of the PC and finally using the serial
communication facility of MATLAB environment we
succeed to show the Real-time data on MATLAB.
Figure 13. Proposed block setup of data acquisition system.
3. Results
Define The experiment with the human body biopotential
signal measurements Ag/AgCl surface electrodes were used
and RTR module was reconfigured according to the
configuration shown is Figure 2 Figure 3 and Figure 3 for the
measurement of ECG, EEG and EMG respectfully.
With the human body experiments, first, we discussed the
ECG experiment. For the placement of the lead, bipolar lead
configuration was used [9], where two measurement
electrodes are attached to the right (Ea) and left (Eb) arms,
respectively. The reference electrode (Eref) is placed in the
right leg. The placement of electrodes and experimental
result are shown in Figure 14 (a).
(a)
(b)
(c)

Science Journal of Circuits, Systems and Signal Processing 2018; 7(2):48-59 57
(d)
Figure 14. ECG measurement. (a) Electrode placement: Eb on the left and
Ea on the right wrist and Eref on the right foot; to observe lead I (potential
difference between LA & RA) of Einthoven triangle. (b) ECG in digital
oscilloscope (colour inverted to omit black background) (c) & (d) ECG
using Notch filter.
(a)
(b)
Figure 15. EEG measurement. (a) Electrode placement: Eb on the left and Ea
on the right, while Eref on the ear lobe to ensure a reference point. (b) Output
in digital oscilloscope (color inverted to omit black background).
For the EEG measurement experiment, the module
connection configuration is given in Figure 8. Our EEG
module was designed to acquire the alpha range of the
EEG signal which can be absorbed with the eyes closed
[8] in figure 15 (b). Two measurement electrodes were
placed on the right and left side of forehead, standard
temporal electrodes to record the infra- and suprasylvian
regions which lie over the Sylvian fissure. The placement
of the electrodes and experimental result are shown in
Figure 15.
(a)
(b)
(c)
Figure 16. EMG measurement. (a) Electrode placement: electrode Ea and
Eb placed on the fore arm muscle and Eref on the elbow to ensure reference
point (b) Output in digital oscilloscope (color inverted to omit black
background).
58 Saiful Islam Khan et al.: Development of a Modular Biopotential Amplifier Trainer for Biomedical
Instrumentation Laboratory Experiments
Finally, the EMG measurement experiment was done. For
measuring the EMG signal the bioamplifier module
connection configuration is shown in Figure 16. For the
EMG measurement electrodes are placed on the skin surface
of the forearm flexor muscle, and the reference electrode was
placed on the elbow to ensure a reference point because there
is no muscle which can give rise to a potential. The
placement of the electrodes and experimental result are
shown in Figure 16 (a, b).
4. Survey
The purpose of developing RTR module is the improvement
of the students’ skills, providing hand-on and work-based
designing abilities of biomedical instrumentation. The RTR
module developed as an education tool for the biomedical
instrumentation laboratory experiments. At the end of the use
of biomedical instrumentations laboratory measurement using
RTR module, the students were asked to feedback opinion with
six questionnaire items, shown in Table 3.
Table 3. Student Survey Questions.
# Description
Q1 The “RTR Module” will improve medical instrumentation knowledge when compared to traditional lecture courses.
Q2 This “RTR Module” provides more practical knowledge and technologies for medical instrumentation.
Q3 You can relate the RTR Modules instrumentation with your theoretical knowledge.
Q4 RTR Modules step by step filtering options give you more clear ideas about bio-amplification and filtering.
Q5 RTR Module is giving more improved in hands-on skills of medical instrument design.
Q6 This “RTR module” will make you pay more affords on this course.
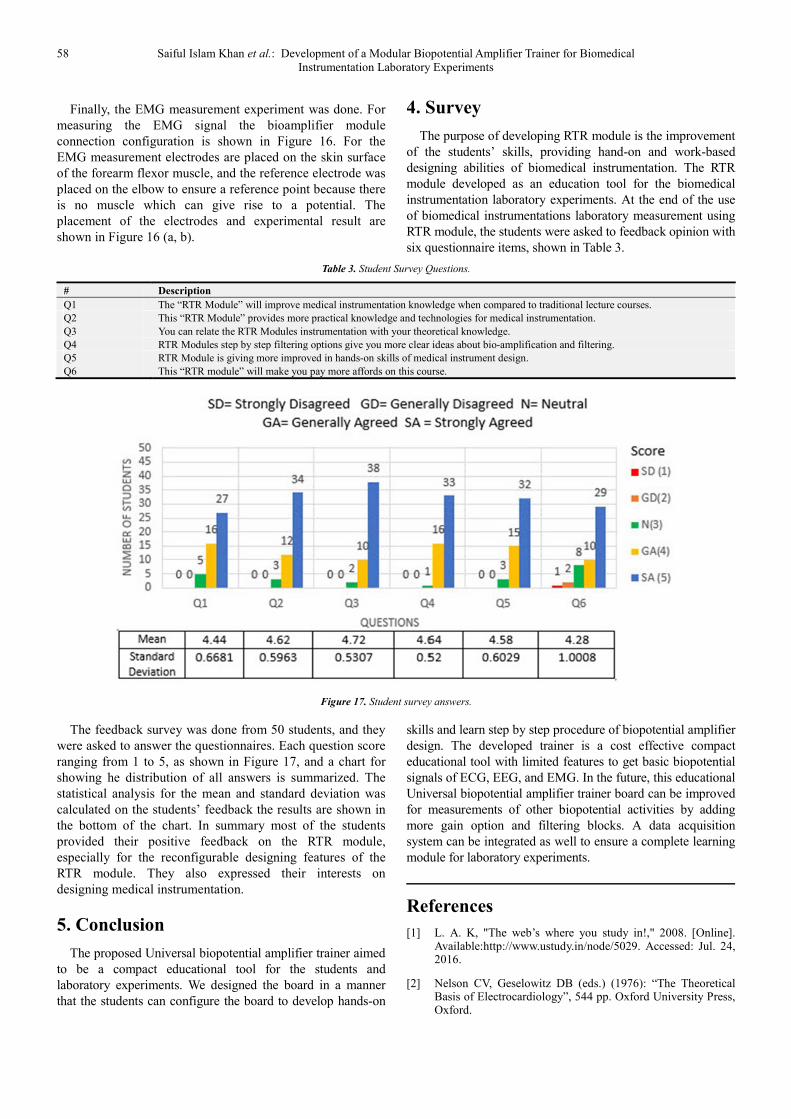
Figure 17. Student survey answers.
The feedback survey was done from 50 students, and they
were asked to answer the questionnaires. Each question score
ranging from 1 to 5, as shown in Figure 17, and a chart for
showing he distribution of all answers is summarized. The
statistical analysis for the mean and standard deviation was
calculated on the students’ feedback the results are shown in
the bottom of the chart. In summary most of the students
provided their positive feedback on the RTR module,
especially for the reconfigurable designing features of the
RTR module. They also expressed their interests on
designing medical instrumentation.
5. Conclusion
The proposed Universal biopotential amplifier trainer aimed
to be a compact educational tool for the students and
laboratory experiments. We designed the board in a manner
that the students can configure the board to develop hands-on
skills and learn step by step procedure of biopotential amplifier
design. The developed trainer is a cost effective compact
educational tool with limited features to get basic biopotential
signals of ECG, EEG, and EMG. In the future, this educational
Universal biopotential amplifier trainer board can be improved
for measurements of other biopotential activities by adding
more gain option and filtering blocks. A data acquisition
system can be integrated as well to ensure a complete learning
module for laboratory experiments.
References
[1] L. A. K, "The web’s where you study in!," 2008. [Online]. Available:http://www.ustudy.in/node/5029. Accessed: Jul. 24, 2016.
[2] Nelson CV, Geselowitz DB (eds.) (1976): “The Theoretical Basis of Electrocardiology”, 544 pp. Oxford University Press, Oxford.

Science Journal of Circuits, Systems and Signal Processing 2018; 7(2):48-59 59
[3] Carlo J. De Luca, Surface Electromyography: Detection and Recording. Delsys Incorporated, 2002.
[4] M. B. I. Raez, M. S. Hussain and F. Mohd-Yasin, “Techniques of EMG signal analysis: detection, processing, classification and applications,”Biol. Proced. Online 2006; 8 (1):11-35.doi:10.1251/bpo115 March 23, 2006.
[5] M. S. J. Steyaert and W. M. C. Sansen, “A micropower low-noise monolithic instrumentation amplifier for medical purposes,” IEEE J. Solid-State Circuits, vol. 22, no. 6, pp. 1163–1168, 1987.
[6] J. G. Webster, “Implementing guided design in a medical instrumentation course,” IEEE Transactions on Education, vol. 22, no. 2, pp. 110 – 116, 1979.
[7] M. Guermandi, A. Bigucci, E. F. Scarselli and R. Guerrieri, "EEG acquisition system based on active electrodes with common-mode interference suppression by Driving Right Leg circuit," 2015 37th Annual International Conference of the
IEEE Engineering in Medicine and Biology Society (EMBC), Milan, 2015, pp. 3169-3172. doi: 10.1109/EMBC.2015.7319065.
[8] B. Vermani, N. Hooda and N. Kumar, "Parametric evaluation of EEG signal during Eyes Close and Eyes Open state," 2015 Annual IEEE India Conference (INDICON), New Delhi, 2015, pp. 1-5.doi: 10.1109/INDICON.2015.7443754.
[9] M. H. Fan, M. H. Guan, Q. C. Chen and L. H. Wang, "Three-lead ECG detection system based on an analog front-end circuit ADS1293," 2017 IEEE International Conference on Consumer Electronics - Taiwan (ICCE-TW), Taipei, 2017, pp. 107-108.doi: 10.1109/ICCE-China.2017.7991018.
[10] U. Biswas and M. Maniruzzaman, "Removing power line interference from ECG signal using adaptive filter and notch filter," 2014 International Conference on Electrical Engineering and Information & Communication Technology, Dhaka, 2014, pp. 1-4.doi: 10.1109/ICEEICT.2014.6919072.