Embed Size (px)
Citation preview
Journal of Chromatography A, 1208 (2008) 202–214
Contents lists available at ScienceDirect
Journal of Chromatography A
journa l homepage: www.e lsev ier .com/ locate /chroma
Development of a multi-residue method for the determinationof pesticides in cereals and dry animal feed using gaschromatography–tandem quadrupole mass spectrometryII. Improvement and extension to new analytes
Stanisław Walorczyk ∗
Institute of Plant Protection-National Research Institute, Władysława Wegorka 20, 60-318 Poznan, Poland
a r t i c l e i n f o
Article history:Received 21 June 2008Received in revised form 17 August 2008Accepted 19 August 2008Available online 23 August 2008
Keywords:Triple quadrupoleTandem mass spectrometryGas chromatographyPesticide residue analysisCerealsAnimal feed
a b s t r a c t
This paper describes the extension and re-validation of a previously published multi-residue method tocurrently 140 pesticides and 4 pesticide degradation products in cereals and feedingstuffs. The pesticideswere extracted using buffered QuEChERS (“quick, easy, cheap, rugged, effective and safe”) method and thencleaned up using dispersive solid-phase extraction with Bondesil PSA and C18 sorbents, and optionally bya freezing-out clean-up step. The final extracts were analyzed in a single injection gas chromatographic-tandem quadrupole mass spectrometric (GC–MS/MS) acquisition method. A high degree of confidencewas achieved by entering two multiple reaction monitoring transitions per compound. In this way, quan-tification of analytical results and unequivocal identification of pesticide residues in compliance with therecent European Union criteria could be done in a single analysis. Thorough optimization of the GC–MS/MSacquisition conditions and application of an effective clean-up procedure has resulted in a remarkableenhancement of the validation parameters. The linearity of the calibration curves was excellent in matrix-matched standards, and yielded the coefficients of determination (R2) ≥ 0.99 for approximately 96% of thetarget analytes. Average recoveries of the pesticides spiked at 0.01 mg kg−1 into a feed mixture and wheatgrain were in the range 70–120% with associated RSD values ≤20% for approximately 60% and 67% ofthe compounds, respectively. At the higher spiking levels of 0.05, 0.1 and 0.5 mg kg−1 average recoveriesand RSDs readily met the validation criteria for nearly all the studied pesticides. Based on these results,the proposed approach has been proven to be highly efficient and suitable for routine determinations ofmulti-class pesticides in a range of cereal and related matrices. Up to now, 145 samples of matrices of
differing complexity including cereals grain, bran, whole ears, straw, hay, feed mixtures and other sam-ples such as malt, starch and dry vegetables have been analyzed. A total of 15 different pesticides havebeen detected, among which pirimiphos methyl (19 cases), deltamethrin (14 cases), tolylfluanid (5 cases),d teb
1
fcaabt(
sotpa
0d
dichlofluanid (5 cases), an
. Introduction
The analysis of undesirable contaminants in various food andeed samples is nowadays a problem of primary concern for qualityontrol laboratories due to human and animal health risks associ-ted with the accumulation of these substances. Contaminants of
nimal feed can cause harmful health effects in the animals and maye harmful to people through secondary exposure of consumerso products deriving from these animals. In the European UnionEU), feedingstuffs are subject to legislation covering their compo-∗ Tel.: +48 61 864 9181; fax: +48 61 867 6301.E-mail addresses: [email protected], s [email protected].
plfgntcp
021-9673/$ – see front matter © 2008 Elsevier B.V. All rights reserved.oi:10.1016/j.chroma.2008.08.068
uconazole (4 cases) were the most frequently encountered ones.© 2008 Elsevier B.V. All rights reserved.
ition, manufacture, storage, transport and usage. Contaminationf feedingstuffs may include both naturally occurring and syntheticoxic compounds [1,2]. Particular attention should be addressed toesticide residues due to the common use of these compounds ingriculture [3,4].
The difficulties of pesticide residue analysis in animal feed sam-les are caused by the fact that these matrices are burdened with
arge quantities of other components after extraction as animaleeds can be complex mixtures that include constituents such as
rains, milling byproducts, added vitamins, minerals, fats, and otherutritional and energy sources. Even simpler cereal matrices con-ain much more co-extractants than typical matrices of high waterontent such as fruits and vegetables. Additionally, the exact com-osition of the sample is often unknown to the testing laboratory.
togr. A
Tph
iia[otnsdrh
orsstsissatmsams
iaedacm70
eottsaRw
aqmpsoltrmdye
2
2
moa[[wotG
2
meaftstrCwt&uta1f
qtcAusT(u1V
2
og(daf1ad
S. Walorczyk / J. Chroma
herefore, the choice of an adequate determinative technique is ofaramount importance to give reliable results in samples with aeavy matrix burden.
Although the number references to the analysis of pesticidesn animal feeds and animal feed components such as cereals hasncreased in recent years, the articles published either confine to
limited number of compounds, e.g. organochlorine insecticides5–7] and organophosphorus insecticides [8] or describe the usef gas chromatography combined with single-stage mass spec-rometry [9]. There were just two articles that highlighted theeed for application of GC coupled with novel detection techniquesuch as time-of-flight mass spectrometry (TOF-MS) [10] and tan-em quadrupole mass spectrometry (TQ-MS/MS) [11] to identifyesidues of multiple pesticides in these difficult matrices with aigh level of confidence.
A unique feature of TOF-MS is the capability of simultane-us sampling and analysis of all ions across the whole massange which permits full spectrum sensitivity comparable withelected ion monitoring (SIM) and enables mass spectral libraryearching at low concentrations in complex matrices [12]. Onhe other hand, GC–MS/MS allows to perform two consecutivetages of mass fragmentation in which parent ions fragment-ng into daughter ions are monitored. This substantially improveselectivity and sensitivity of the determination compared toingle-stage MS thanks to elimination of isobaric interferencesnd reduction of the chemical noise [13]. Employing either ofhese techniques at the final determinative step is one of the
ost distinctive trends in pesticide residue analysis and is con-idered as a practical way to get around difficulties in targetnalytes identification in the case of difficult food and feedatrices containing excessive amounts of potentially interfering
ubstances.Regarding analysis of pesticide residues in cereals and feed-
ngstuffs, van der Lee et al. [10] developed a method for thenalysis of 106 compounds in cereal-based animal feed applyingthyl acetate extraction, gel permeation chromatography (GPC) andispersive solid-phase extraction (dispersive-SPE) clean-up steps,nd finally determination by comprehensive two-dimensional gashromatography (GC × GC) with TOF-MS detection in the full scanode. The method was demonstrated to give recoveries between
0% and 110% and RSDs below 20% at two levels of 0.01 and.1 mg kg−1 for the majority of the studied compounds.
This author employed a buffered QuEChERS (acronym for “quick,asy, cheap, rugged, effective and safe”) method to prepare samplesf cereals grain and some dry feedingstuffs prior to the determina-ion of 122 pesticides by GC–TQ-MS/MS [11]. Despite the fact thathe method was found to be useful for the purpose of multi-residuecreening as it permitted detection at low levels (0.01 mg kg−1) forpproximately 68% of the target pesticides, many recoveries andSDs were not as good as required for validation in complianceith the criteria established by the EU.
Hence, the main objective of the current project was to developn improved method for the reliable identification and accurateuantification of pesticide residues in cereals and feedingstuffs. Theethodology was based on the previous work but some analytical
roperties have been enhanced. The most important aspects con-idered during the present work were (i) extension of the scopef the previous method to include as many as 144 target ana-
ytes, (ii) re-design of the GC–MS/MS acquisition method and (iii)esting the effectiveness of freezing-out clean-up as a means of
educing adverse influence of co-extractants on method and instru-ent performance. In addition, an important part of this work wasemonstrating the applicability of the new method to the anal-sis of actual samples of cereals and animal feeds and thoroughvaluation of the method performance during routine work.
2psn2
1208 (2008) 202–214 203
. Experimental
.1. Chemicals and standards
Solvents and reagents such as acetonitile, acetone, toluene,agnesium sulphate, sodium citrate tribasic dehydrate and dis-
dium hydrogencitrate sesquihydrate, sodium chloride, formiccid, Bondesil PSA and C18 were those used in a previous work11]. Certified pesticide analytical standards and internal standardstriphenylphosphate (TPP) and polychlorinated biphenyl (PCB 153)]ere purchased from Dr. Ehrenstorfer (Augsburg, Germany), most
f them of purity ≥98%. Single composite mixtures of all pes-icides at appropriate concentrations were used to calibrate theC–MS/MS system and spike samples in recovery experiments.
.2. GC–MS/MS conditions
GC analyses were performed using a CP-3800 gas chro-atograph (Varian, Middelburg, The Netherlands) equipped with
lectronic flow control (EFC), a 1079 universal capillary injector, andCP-8400 autosampler. The injector temperature was held at 250 ◦C
or 1.5 min during injection and then programmed at 200 ◦C min−1
o 300 ◦C which was held for 20 min. A split ratio was initiallyet at 20:1, at 0.01 min the split vent was closed until minute 1.5,hen the split ratio was held at 100:1 until minute 20, and finallyeduced to 20:1. The single-tapered injector liner was fitted into aarboFrit plug (Restek, Bellefonte, PA, USA). Sample extracts (5 �L)ere injected in toluene at a injection rate of 15 �L s−1. Separa-
ion was done using a DB-5 MS 30 m × 0.25 mm, 0.5 �m column (JW, Folsom, USA) protected by a 2 m × 0.53 mm guard column of
ncoated fused silica at the inlet end. Helium (99.999% purity) washe carrier gas at a flow rate of 1.2 mL min−1. The column was heldt 80 ◦C for 3 min after injection then programmed at 30 ◦C min−1 to50 ◦C, then programmed to 300 ◦C at 10 ◦C min−1 which was heldor 10 min.
The GC system was interfaced with a model 1200 tripleuadrupole mass spectrometer, also from Varian. The mass spec-rometer was operated in the electron ionization mode (EI, 70 eV). Aollect delay time of 6.5 min was set to prevent instrument damage.filament current of 50 �A, and a multiplier voltage of 1700 V weresed in MS/MS mode. The temperatures of the transfer line, ionource and manifold were set at 290, 270, and 40 ◦C, respectively.he mass spectrometer was calibrated with perfluorotributylaminePFTBA). For the MS/MS experiments, argon (99.9998% purity) wassed as the collision gas with the collision cell pressure set at.7 mTorr. Data acquisition and processing were performed usingarian MS Workstation, version 6.6.
.3. Sample preparation procedure
A modified QuEChERS method was used for the preparationf sample extracts [11,14]. According to this method, 5 g of finelyround sub-sample was placed in a polypropylene centrifuge tube50 mL) and 10 mL water was added. Later, 50 �L of internal stan-ard solution (TPP at 150 �g mL−1) and 15 mL acetonitrile weredded and the mixture shaken vigorously on a laboratory shakeror 5 min. Further, 0.5 g disodium hydrogencitrate sesquehydrate,g trisodium citrate dihydrate, 4 g anhydrous magnesium sulphate,nd 1 g sodium chloride were added, and the mixture was imme-iately hand-shaken for 1 min, then centrifuged at 4500 rpm for
min. At this stage, an optional low-temperature clean step waserformed prior to dispersive-SPE for the most complex matricesuch as maize and compound feeds. For this, an aliquot of the super-atant was transferred into a glass test tube and stored for at leasth (or overnight) in a freezer (−26 ◦C). The extract was then sep-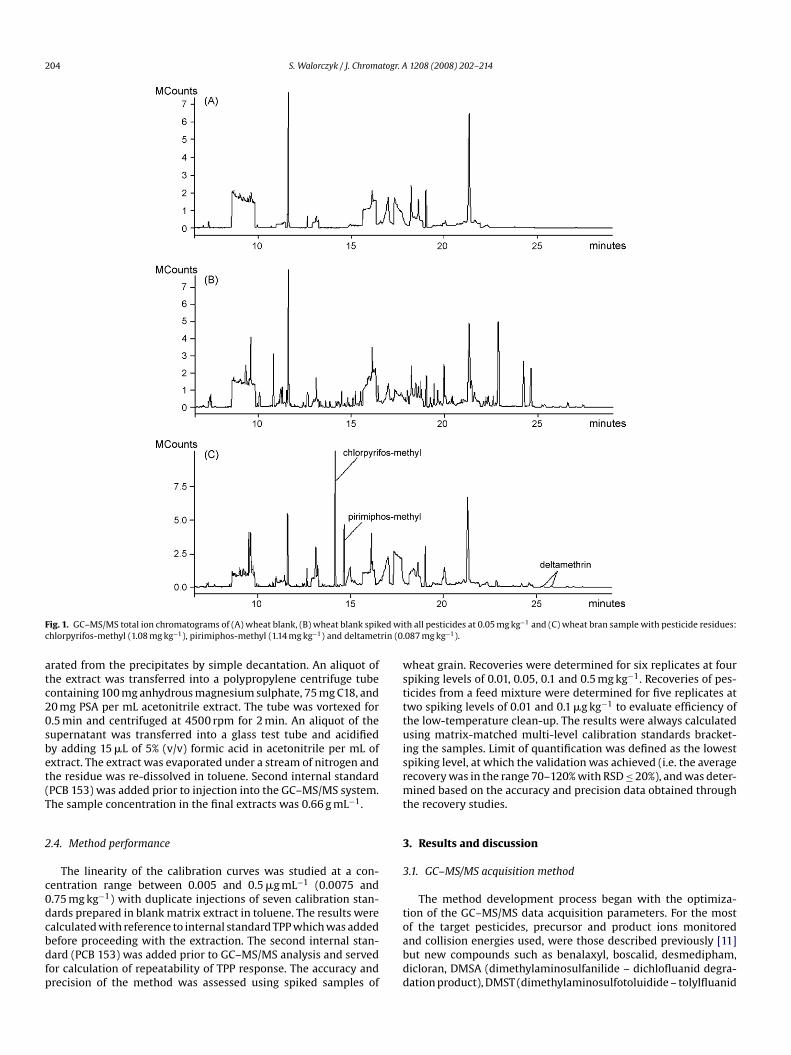
204 S. Walorczyk / J. Chromatogr. A 1208 (2008) 202–214
F ed wic rin (0.
atc20sbet(T
2
c0dcbdfp
wstttuisrmt
3
3
t
ig. 1. GC–MS/MS total ion chromatograms of (A) wheat blank, (B) wheat blank spikhlorpyrifos-methyl (1.08 mg kg−1), pirimiphos-methyl (1.14 mg kg−1) and deltamet
rated from the precipitates by simple decantation. An aliquot ofhe extract was transferred into a polypropylene centrifuge tubeontaining 100 mg anhydrous magnesium sulphate, 75 mg C18, and0 mg PSA per mL acetonitrile extract. The tube was vortexed for.5 min and centrifuged at 4500 rpm for 2 min. An aliquot of theupernatant was transferred into a glass test tube and acidifiedy adding 15 �L of 5% (v/v) formic acid in acetonitrile per mL ofxtract. The extract was evaporated under a stream of nitrogen andhe residue was re-dissolved in toluene. Second internal standardPCB 153) was added prior to injection into the GC–MS/MS system.he sample concentration in the final extracts was 0.66 g mL−1.
.4. Method performance
The linearity of the calibration curves was studied at a con-entration range between 0.005 and 0.5 �g mL−1 (0.0075 and.75 mg kg−1) with duplicate injections of seven calibration stan-ards prepared in blank matrix extract in toluene. The results were
alculated with reference to internal standard TPP which was addedefore proceeding with the extraction. The second internal stan-ard (PCB 153) was added prior to GC–MS/MS analysis and servedor calculation of repeatability of TPP response. The accuracy andrecision of the method was assessed using spiked samples ofoabdd
th all pesticides at 0.05 mg kg−1 and (C) wheat bran sample with pesticide residues:087 mg kg−1).
heat grain. Recoveries were determined for six replicates at fourpiking levels of 0.01, 0.05, 0.1 and 0.5 mg kg−1. Recoveries of pes-icides from a feed mixture were determined for five replicates atwo spiking levels of 0.01 and 0.1 �g kg−1 to evaluate efficiency ofhe low-temperature clean-up. The results were always calculatedsing matrix-matched multi-level calibration standards bracket-
ng the samples. Limit of quantification was defined as the lowestpiking level, at which the validation was achieved (i.e. the averageecovery was in the range 70–120% with RSD ≤ 20%), and was deter-ined based on the accuracy and precision data obtained through
he recovery studies.
. Results and discussion
.1. GC–MS/MS acquisition method
The method development process began with the optimiza-ion of the GC–MS/MS data acquisition parameters. For the most
f the target pesticides, precursor and product ions monitorednd collision energies used, were those described previously [11]ut new compounds such as benalaxyl, boscalid, desmedipham,icloran, DMSA (dimethylaminosulfanilide – dichlofluanid degra-ation product), DMST (dimethylaminosulfotoluidide – tolylfluanid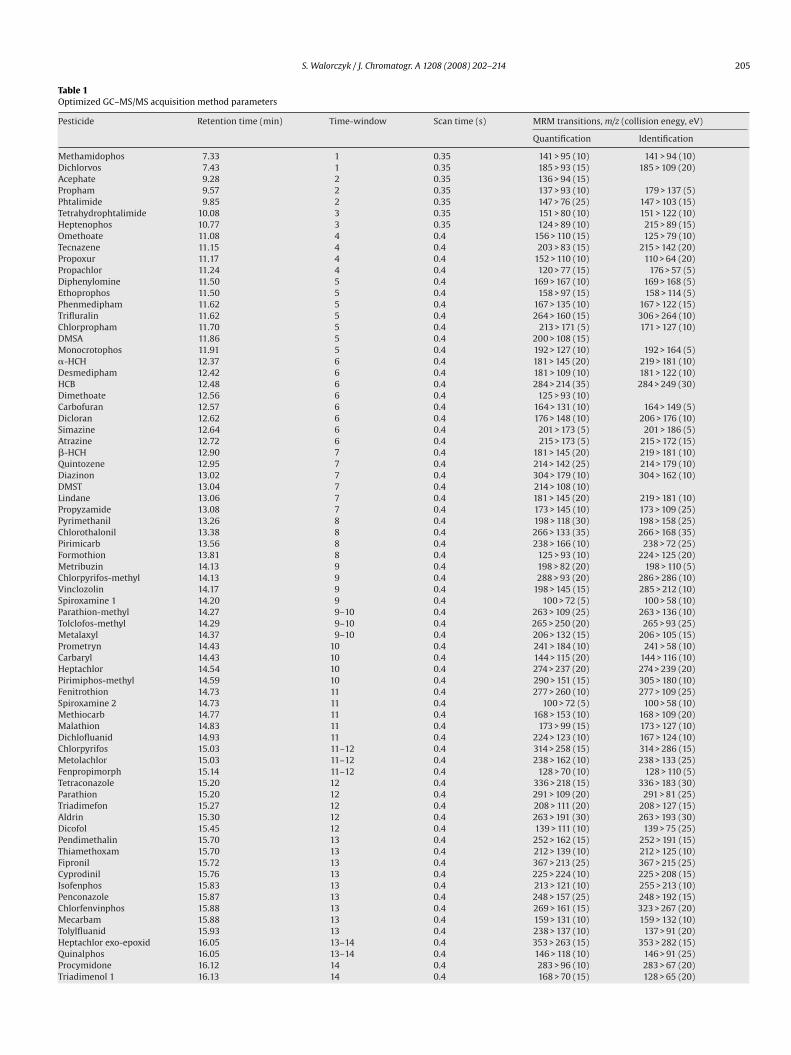
S. Walorczyk / J. Chromatogr. A 1208 (2008) 202–214 205
Table 1Optimized GC–MS/MS acquisition method parameters
Pesticide Retention time (min) Time-window Scan time (s) MRM transitions, m/z (collision enegy, eV)
Quantification Identification
Methamidophos 7.33 1 0.35 141 > 95 (10) 141 > 94 (10)Dichlorvos 7.43 1 0.35 185 > 93 (15) 185 > 109 (20)Acephate 9.28 2 0.35 136 > 94 (15)Propham 9.57 2 0.35 137 > 93 (10) 179 > 137 (5)Phtalimide 9.85 2 0.35 147 > 76 (25) 147 > 103 (15)Tetrahydrophtalimide 10.08 3 0.35 151 > 80 (10) 151 > 122 (10)Heptenophos 10.77 3 0.35 124 > 89 (10) 215 > 89 (15)Omethoate 11.08 4 0.4 156 > 110 (15) 125 > 79 (10)Tecnazene 11.15 4 0.4 203 > 83 (15) 215 > 142 (20)Propoxur 11.17 4 0.4 152 > 110 (10) 110 > 64 (20)Propachlor 11.24 4 0.4 120 > 77 (15) 176 > 57 (5)Diphenylomine 11.50 5 0.4 169 > 167 (10) 169 > 168 (5)Ethoprophos 11.50 5 0.4 158 > 97 (15) 158 > 114 (5)Phenmedipham 11.62 5 0.4 167 > 135 (10) 167 > 122 (15)Trifluralin 11.62 5 0.4 264 > 160 (15) 306 > 264 (10)Chlorpropham 11.70 5 0.4 213 > 171 (5) 171 > 127 (10)DMSA 11.86 5 0.4 200 > 108 (15)Monocrotophos 11.91 5 0.4 192 > 127 (10) 192 > 164 (5)�-HCH 12.37 6 0.4 181 > 145 (20) 219 > 181 (10)Desmedipham 12.42 6 0.4 181 > 109 (10) 181 > 122 (10)HCB 12.48 6 0.4 284 > 214 (35) 284 > 249 (30)Dimethoate 12.56 6 0.4 125 > 93 (10)Carbofuran 12.57 6 0.4 164 > 131 (10) 164 > 149 (5)Dicloran 12.62 6 0.4 176 > 148 (10) 206 > 176 (10)Simazine 12.64 6 0.4 201 > 173 (5) 201 > 186 (5)Atrazine 12.72 6 0.4 215 > 173 (5) 215 > 172 (15)�-HCH 12.90 7 0.4 181 > 145 (20) 219 > 181 (10)Quintozene 12.95 7 0.4 214 > 142 (25) 214 > 179 (10)Diazinon 13.02 7 0.4 304 > 179 (10) 304 > 162 (10)DMST 13.04 7 0.4 214 > 108 (10)Lindane 13.06 7 0.4 181 > 145 (20) 219 > 181 (10)Propyzamide 13.08 7 0.4 173 > 145 (10) 173 > 109 (25)Pyrimethanil 13.26 8 0.4 198 > 118 (30) 198 > 158 (25)Chlorothalonil 13.38 8 0.4 266 > 133 (35) 266 > 168 (35)Pirimicarb 13.56 8 0.4 238 > 166 (10) 238 > 72 (25)Formothion 13.81 8 0.4 125 > 93 (10) 224 > 125 (20)Metribuzin 14.13 9 0.4 198 > 82 (20) 198 > 110 (5)Chlorpyrifos-methyl 14.13 9 0.4 288 > 93 (20) 286 > 286 (10)Vinclozolin 14.17 9 0.4 198 > 145 (15) 285 > 212 (10)Spiroxamine 1 14.20 9 0.4 100 > 72 (5) 100 > 58 (10)Parathion-methyl 14.27 9–10 0.4 263 > 109 (25) 263 > 136 (10)Tolclofos-methyl 14.29 9–10 0.4 265 > 250 (20) 265 > 93 (25)Metalaxyl 14.37 9–10 0.4 206 > 132 (15) 206 > 105 (15)Prometryn 14.43 10 0.4 241 > 184 (10) 241 > 58 (10)Carbaryl 14.43 10 0.4 144 > 115 (20) 144 > 116 (10)Heptachlor 14.54 10 0.4 274 > 237 (20) 274 > 239 (20)Pirimiphos-methyl 14.59 10 0.4 290 > 151 (15) 305 > 180 (10)Fenitrothion 14.73 11 0.4 277 > 260 (10) 277 > 109 (25)Spiroxamine 2 14.73 11 0.4 100 > 72 (5) 100 > 58 (10)Methiocarb 14.77 11 0.4 168 > 153 (10) 168 > 109 (20)Malathion 14.83 11 0.4 173 > 99 (15) 173 > 127 (10)Dichlofluanid 14.93 11 0.4 224 > 123 (10) 167 > 124 (10)Chlorpyrifos 15.03 11–12 0.4 314 > 258 (15) 314 > 286 (15)Metolachlor 15.03 11–12 0.4 238 > 162 (10) 238 > 133 (25)Fenpropimorph 15.14 11–12 0.4 128 > 70 (10) 128 > 110 (5)Tetraconazole 15.20 12 0.4 336 > 218 (15) 336 > 183 (30)Parathion 15.20 12 0.4 291 > 109 (20) 291 > 81 (25)Triadimefon 15.27 12 0.4 208 > 111 (20) 208 > 127 (15)Aldrin 15.30 12 0.4 263 > 191 (30) 263 > 193 (30)Dicofol 15.45 12 0.4 139 > 111 (10) 139 > 75 (25)Pendimethalin 15.70 13 0.4 252 > 162 (15) 252 > 191 (15)Thiamethoxam 15.70 13 0.4 212 > 139 (10) 212 > 125 (10)Fipronil 15.72 13 0.4 367 > 213 (25) 367 > 215 (25)Cyprodinil 15.76 13 0.4 225 > 224 (10) 225 > 208 (15)Isofenphos 15.83 13 0.4 213 > 121 (10) 255 > 213 (10)Penconazole 15.87 13 0.4 248 > 157 (25) 248 > 192 (15)Chlorfenvinphos 15.88 13 0.4 269 > 161 (15) 323 > 267 (20)Mecarbam 15.88 13 0.4 159 > 131 (10) 159 > 132 (10)Tolylfluanid 15.93 13 0.4 238 > 137 (10) 137 > 91 (20)Heptachlor exo-epoxid 16.05 13–14 0.4 353 > 263 (15) 353 > 282 (15)Quinalphos 16.05 13–14 0.4 146 > 118 (10) 146 > 91 (25)Procymidone 16.12 14 0.4 283 > 96 (10) 283 > 67 (20)Triadimenol 1 16.13 14 0.4 168 > 70 (15) 128 > 65 (20)
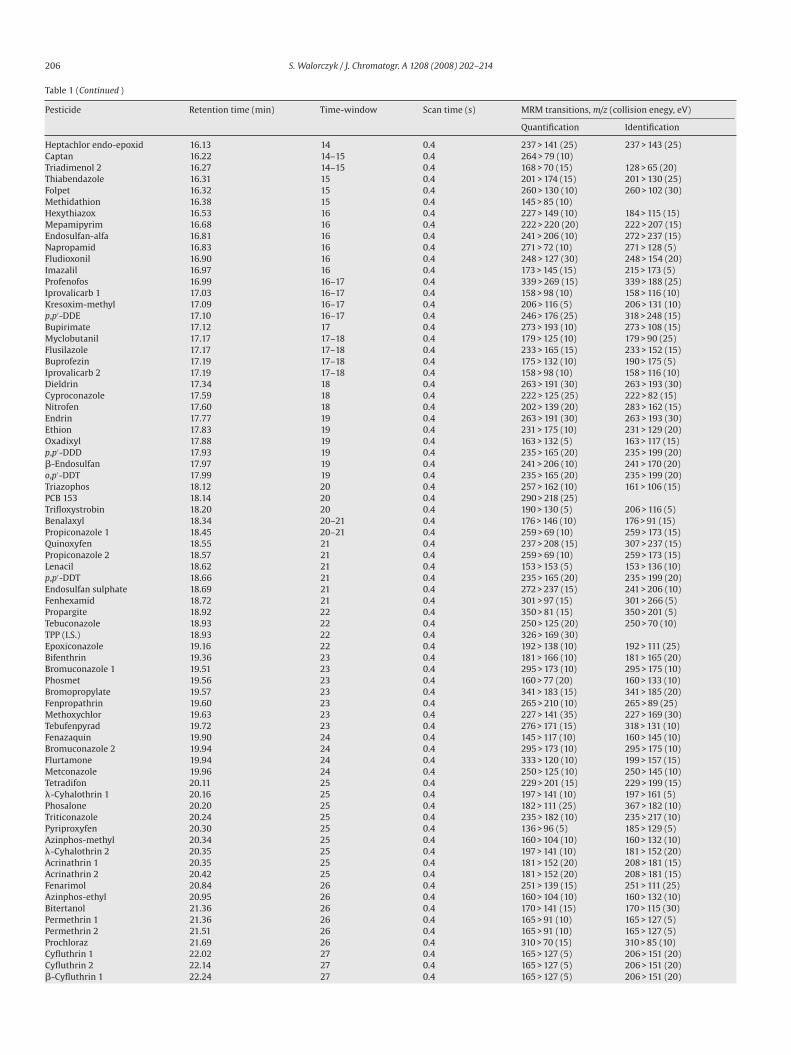
206 S. Walorczyk / J. Chromatogr. A 1208 (2008) 202–214
Table 1 (Continued )
Pesticide Retention time (min) Time-window Scan time (s) MRM transitions, m/z (collision enegy, eV)
Quantification Identification
Heptachlor endo-epoxid 16.13 14 0.4 237 > 141 (25) 237 > 143 (25)Captan 16.22 14–15 0.4 264 > 79 (10)Triadimenol 2 16.27 14–15 0.4 168 > 70 (15) 128 > 65 (20)Thiabendazole 16.31 15 0.4 201 > 174 (15) 201 > 130 (25)Folpet 16.32 15 0.4 260 > 130 (10) 260 > 102 (30)Methidathion 16.38 15 0.4 145 > 85 (10)Hexythiazox 16.53 16 0.4 227 > 149 (10) 184 > 115 (15)Mepamipyrim 16.68 16 0.4 222 > 220 (20) 222 > 207 (15)Endosulfan-alfa 16.81 16 0.4 241 > 206 (10) 272 > 237 (15)Napropamid 16.83 16 0.4 271 > 72 (10) 271 > 128 (5)Fludioxonil 16.90 16 0.4 248 > 127 (30) 248 > 154 (20)Imazalil 16.97 16 0.4 173 > 145 (15) 215 > 173 (5)Profenofos 16.99 16–17 0.4 339 > 269 (15) 339 > 188 (25)Iprovalicarb 1 17.03 16–17 0.4 158 > 98 (10) 158 > 116 (10)Kresoxim-methyl 17.09 16–17 0.4 206 > 116 (5) 206 > 131 (10)p,p′-DDE 17.10 16–17 0.4 246 > 176 (25) 318 > 248 (15)Bupirimate 17.12 17 0.4 273 > 193 (10) 273 > 108 (15)Myclobutanil 17.17 17–18 0.4 179 > 125 (10) 179 > 90 (25)Flusilazole 17.17 17–18 0.4 233 > 165 (15) 233 > 152 (15)Buprofezin 17.19 17–18 0.4 175 > 132 (10) 190 > 175 (5)Iprovalicarb 2 17.19 17–18 0.4 158 > 98 (10) 158 > 116 (10)Dieldrin 17.34 18 0.4 263 > 191 (30) 263 > 193 (30)Cyproconazole 17.59 18 0.4 222 > 125 (25) 222 > 82 (15)Nitrofen 17.60 18 0.4 202 > 139 (20) 283 > 162 (15)Endrin 17.77 19 0.4 263 > 191 (30) 263 > 193 (30)Ethion 17.83 19 0.4 231 > 175 (10) 231 > 129 (20)Oxadixyl 17.88 19 0.4 163 > 132 (5) 163 > 117 (15)p,p′-DDD 17.93 19 0.4 235 > 165 (20) 235 > 199 (20)�-Endosulfan 17.97 19 0.4 241 > 206 (10) 241 > 170 (20)o,p′-DDT 17.99 19 0.4 235 > 165 (20) 235 > 199 (20)Triazophos 18.12 20 0.4 257 > 162 (10) 161 > 106 (15)PCB 153 18.14 20 0.4 290 > 218 (25)Trifloxystrobin 18.20 20 0.4 190 > 130 (5) 206 > 116 (5)Benalaxyl 18.34 20–21 0.4 176 > 146 (10) 176 > 91 (15)Propiconazole 1 18.45 20–21 0.4 259 > 69 (10) 259 > 173 (15)Quinoxyfen 18.55 21 0.4 237 > 208 (15) 307 > 237 (15)Propiconazole 2 18.57 21 0.4 259 > 69 (10) 259 > 173 (15)Lenacil 18.62 21 0.4 153 > 153 (5) 153 > 136 (10)p,p′-DDT 18.66 21 0.4 235 > 165 (20) 235 > 199 (20)Endosulfan sulphate 18.69 21 0.4 272 > 237 (15) 241 > 206 (10)Fenhexamid 18.72 21 0.4 301 > 97 (15) 301 > 266 (5)Propargite 18.92 22 0.4 350 > 81 (15) 350 > 201 (5)Tebuconazole 18.93 22 0.4 250 > 125 (20) 250 > 70 (10)TPP (I.S.) 18.93 22 0.4 326 > 169 (30)Epoxiconazole 19.16 22 0.4 192 > 138 (10) 192 > 111 (25)Bifenthrin 19.36 23 0.4 181 > 166 (10) 181 > 165 (20)Bromuconazole 1 19.51 23 0.4 295 > 173 (10) 295 > 175 (10)Phosmet 19.56 23 0.4 160 > 77 (20) 160 > 133 (10)Bromopropylate 19.57 23 0.4 341 > 183 (15) 341 > 185 (20)Fenpropathrin 19.60 23 0.4 265 > 210 (10) 265 > 89 (25)Methoxychlor 19.63 23 0.4 227 > 141 (35) 227 > 169 (30)Tebufenpyrad 19.72 23 0.4 276 > 171 (15) 318 > 131 (10)Fenazaquin 19.90 24 0.4 145 > 117 (10) 160 > 145 (10)Bromuconazole 2 19.94 24 0.4 295 > 173 (10) 295 > 175 (10)Flurtamone 19.94 24 0.4 333 > 120 (10) 199 > 157 (15)Metconazole 19.96 24 0.4 250 > 125 (10) 250 > 145 (10)Tetradifon 20.11 25 0.4 229 > 201 (15) 229 > 199 (15)�-Cyhalothrin 1 20.16 25 0.4 197 > 141 (10) 197 > 161 (5)Phosalone 20.20 25 0.4 182 > 111 (25) 367 > 182 (10)Triticonazole 20.24 25 0.4 235 > 182 (10) 235 > 217 (10)Pyriproxyfen 20.30 25 0.4 136 > 96 (5) 185 > 129 (5)Azinphos-methyl 20.34 25 0.4 160 > 104 (10) 160 > 132 (10)�-Cyhalothrin 2 20.35 25 0.4 197 > 141 (10) 181 > 152 (20)Acrinathrin 1 20.35 25 0.4 181 > 152 (20) 208 > 181 (15)Acrinathrin 2 20.42 25 0.4 181 > 152 (20) 208 > 181 (15)Fenarimol 20.84 26 0.4 251 > 139 (15) 251 > 111 (25)Azinphos-ethyl 20.95 26 0.4 160 > 104 (10) 160 > 132 (10)Bitertanol 21.36 26 0.4 170 > 141 (15) 170 > 115 (30)Permethrin 1 21.36 26 0.4 165 > 91 (10) 165 > 127 (5)Permethrin 2 21.51 26 0.4 165 > 91 (10) 165 > 127 (5)Prochloraz 21.69 26 0.4 310 > 70 (15) 310 > 85 (10)Cyfluthrin 1 22.02 27 0.4 165 > 127 (5) 206 > 151 (20)Cyfluthrin 2 22.14 27 0.4 165 > 127 (5) 206 > 151 (20)�-Cyfluthrin 1 22.24 27 0.4 165 > 127 (5) 206 > 151 (20)
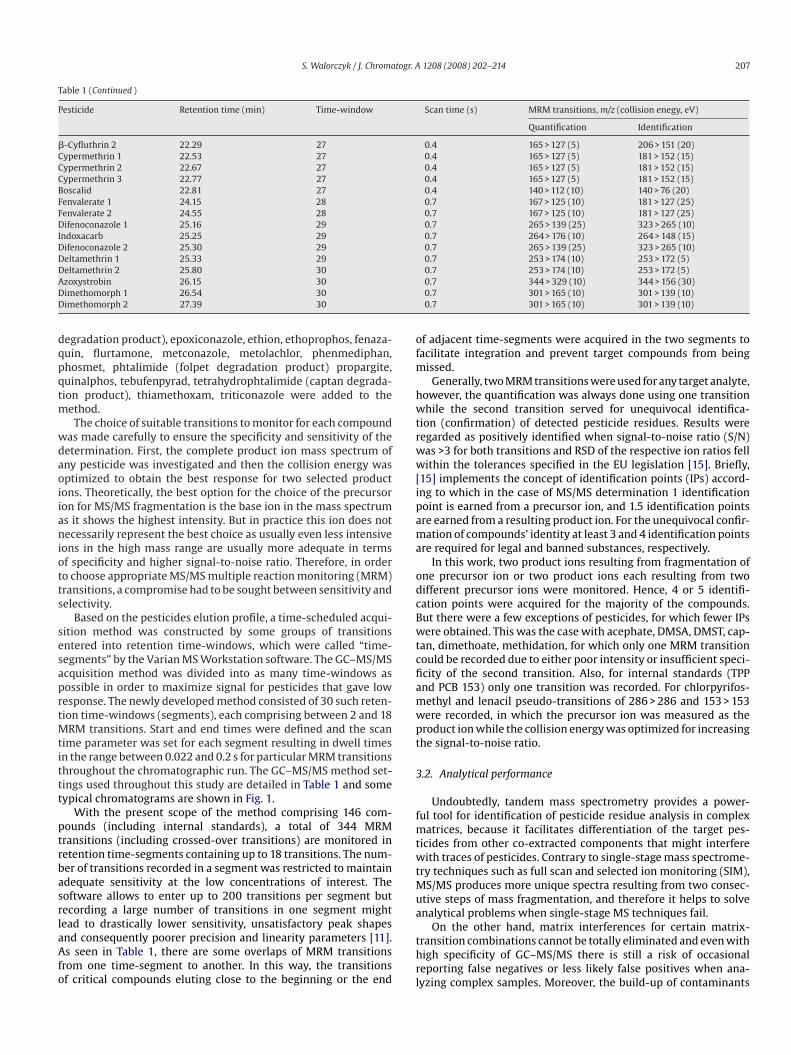
S. Walorczyk / J. Chromatogr. A 1208 (2008) 202–214 207
Table 1 (Continued )
Pesticide Retention time (min) Time-window Scan time (s) MRM transitions, m/z (collision enegy, eV)
Quantification Identification
�-Cyfluthrin 2 22.29 27 0.4 165 > 127 (5) 206 > 151 (20)Cypermethrin 1 22.53 27 0.4 165 > 127 (5) 181 > 152 (15)Cypermethrin 2 22.67 27 0.4 165 > 127 (5) 181 > 152 (15)Cypermethrin 3 22.77 27 0.4 165 > 127 (5) 181 > 152 (15)Boscalid 22.81 27 0.4 140 > 112 (10) 140 > 76 (20)Fenvalerate 1 24.15 28 0.7 167 > 125 (10) 181 > 127 (25)Fenvalerate 2 24.55 28 0.7 167 > 125 (10) 181 > 127 (25)Difenoconazole 1 25.16 29 0.7 265 > 139 (25) 323 > 265 (10)Indoxacarb 25.25 29 0.7 264 > 176 (10) 264 > 148 (15)Difenoconazole 2 25.30 29 0.7 265 > 139 (25) 323 > 265 (10)Deltamethrin 1 25.33 29 0.7 253 > 174 (10) 253 > 172 (5)DADD
dqpqtm
wdaoiianiotts
sesaprtMtittt
ptrbasrlaAfo
ofm
hwtrww[ipama
odcBwtcfiamwpt
3
fmtwtMua
eltamethrin 2 25.80 30zoxystrobin 26.15 30imethomorph 1 26.54 30imethomorph 2 27.39 30
egradation product), epoxiconazole, ethion, ethoprophos, fenaza-uin, flurtamone, metconazole, metolachlor, phenmediphan,hosmet, phtalimide (folpet degradation product) propargite,uinalphos, tebufenpyrad, tetrahydrophtalimide (captan degrada-ion product), thiamethoxam, triticonazole were added to the
ethod.The choice of suitable transitions to monitor for each compound
as made carefully to ensure the specificity and sensitivity of theetermination. First, the complete product ion mass spectrum ofny pesticide was investigated and then the collision energy wasptimized to obtain the best response for two selected productons. Theoretically, the best option for the choice of the precursoron for MS/MS fragmentation is the base ion in the mass spectrums it shows the highest intensity. But in practice this ion does notecessarily represent the best choice as usually even less intensive
ons in the high mass range are usually more adequate in termsf specificity and higher signal-to-noise ratio. Therefore, in ordero choose appropriate MS/MS multiple reaction monitoring (MRM)ransitions, a compromise had to be sought between sensitivity andelectivity.
Based on the pesticides elution profile, a time-scheduled acqui-ition method was constructed by some groups of transitionsntered into retention time-windows, which were called “time-egments” by the Varian MS Workstation software. The GC–MS/MScquisition method was divided into as many time-windows asossible in order to maximize signal for pesticides that gave lowesponse. The newly developed method consisted of 30 such reten-ion time-windows (segments), each comprising between 2 and 18
RM transitions. Start and end times were defined and the scanime parameter was set for each segment resulting in dwell timesn the range between 0.022 and 0.2 s for particular MRM transitionshroughout the chromatographic run. The GC–MS/MS method set-ings used throughout this study are detailed in Table 1 and someypical chromatograms are shown in Fig. 1.
With the present scope of the method comprising 146 com-ounds (including internal standards), a total of 344 MRMransitions (including crossed-over transitions) are monitored inetention time-segments containing up to 18 transitions. The num-er of transitions recorded in a segment was restricted to maintaindequate sensitivity at the low concentrations of interest. Theoftware allows to enter up to 200 transitions per segment butecording a large number of transitions in one segment might
ead to drastically lower sensitivity, unsatisfactory peak shapesnd consequently poorer precision and linearity parameters [11].s seen in Table 1, there are some overlaps of MRM transitionsrom one time-segment to another. In this way, the transitionsf critical compounds eluting close to the beginning or the end
thrl
0.7 253 > 174 (10) 253 > 172 (5)0.7 344 > 329 (10) 344 > 156 (30)0.7 301 > 165 (10) 301 > 139 (10)0.7 301 > 165 (10) 301 > 139 (10)
f adjacent time-segments were acquired in the two segments toacilitate integration and prevent target compounds from being
issed.Generally, two MRM transitions were used for any target analyte,
owever, the quantification was always done using one transitionhile the second transition served for unequivocal identifica-
ion (confirmation) of detected pesticide residues. Results wereegarded as positively identified when signal-to-noise ratio (S/N)as >3 for both transitions and RSD of the respective ion ratios fellithin the tolerances specified in the EU legislation [15]. Briefly,
15] implements the concept of identification points (IPs) accord-ng to which in the case of MS/MS determination 1 identificationoint is earned from a precursor ion, and 1.5 identification pointsre earned from a resulting product ion. For the unequivocal confir-ation of compounds’ identity at least 3 and 4 identification points
re required for legal and banned substances, respectively.In this work, two product ions resulting from fragmentation of
ne precursor ion or two product ions each resulting from twoifferent precursor ions were monitored. Hence, 4 or 5 identifi-ation points were acquired for the majority of the compounds.ut there were a few exceptions of pesticides, for which fewer IPsere obtained. This was the case with acephate, DMSA, DMST, cap-
an, dimethoate, methidation, for which only one MRM transitionould be recorded due to either poor intensity or insufficient speci-city of the second transition. Also, for internal standards (TPPnd PCB 153) only one transition was recorded. For chlorpyrifos-ethyl and lenacil pseudo-transitions of 286 > 286 and 153 > 153ere recorded, in which the precursor ion was measured as theroduct ion while the collision energy was optimized for increasinghe signal-to-noise ratio.
.2. Analytical performance
Undoubtedly, tandem mass spectrometry provides a power-ul tool for identification of pesticide residue analysis in complex
atrices, because it facilitates differentiation of the target pes-icides from other co-extracted components that might interfereith traces of pesticides. Contrary to single-stage mass spectrome-
ry techniques such as full scan and selected ion monitoring (SIM),S/MS produces more unique spectra resulting from two consec-
tive steps of mass fragmentation, and therefore it helps to solvenalytical problems when single-stage MS techniques fail.
On the other hand, matrix interferences for certain matrix-ransition combinations cannot be totally eliminated and even withigh specificity of GC–MS/MS there is still a risk of occasionaleporting false negatives or less likely false positives when ana-yzing complex samples. Moreover, the build-up of contaminants
208 S. Walorczyk / J. Chromatogr. A 1208 (2008) 202–214
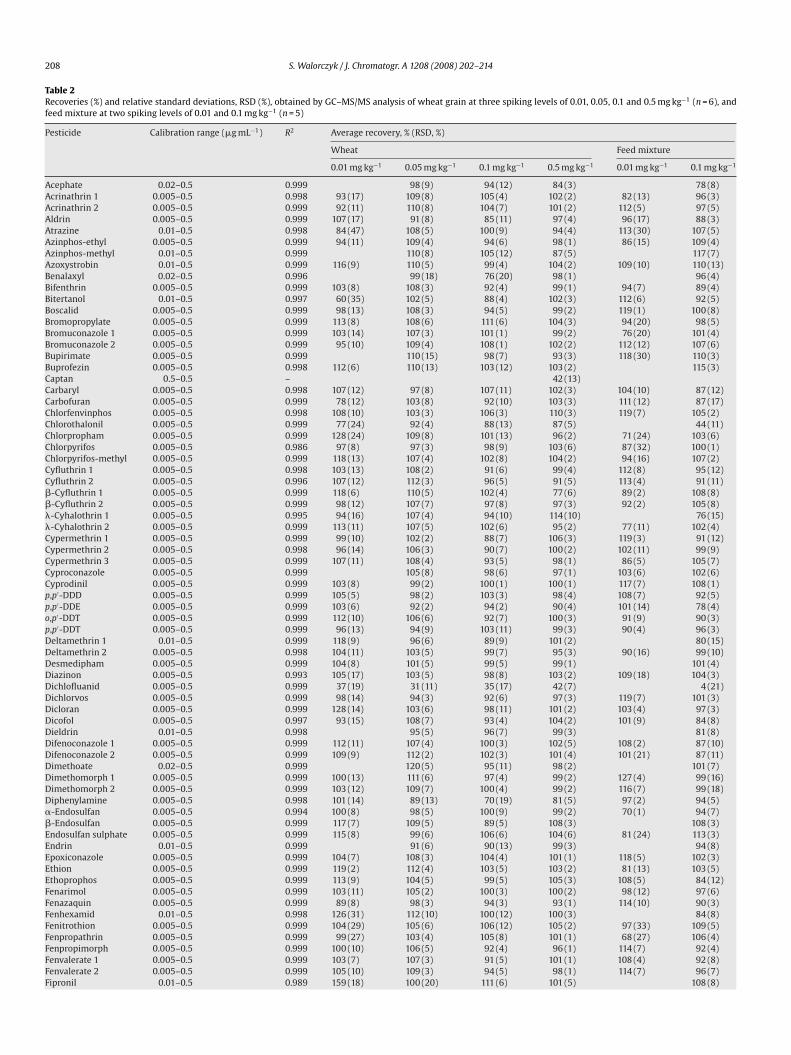
Table 2Recoveries (%) and relative standard deviations, RSD (%), obtained by GC–MS/MS analysis of wheat grain at three spiking levels of 0.01, 0.05, 0.1 and 0.5 mg kg−1 (n = 6), andfeed mixture at two spiking levels of 0.01 and 0.1 mg kg−1 (n = 5)
Pesticide Calibration range (�g mL−1) R2 Average recovery, % (RSD, %)
Wheat Feed mixture
0.01 mg kg−1 0.05 mg kg−1 0.1 mg kg−1 0.5 mg kg−1 0.01 mg kg−1 0.1 mg kg−1
Acephate 0.02–0.5 0.999 98 (9) 94 (12) 84 (3) 78 (8)Acrinathrin 1 0.005–0.5 0.998 93 (17) 109 (8) 105 (4) 102 (2) 82 (13) 96 (3)Acrinathrin 2 0.005–0.5 0.999 92 (11) 110 (8) 104 (7) 101 (2) 112 (5) 97 (5)Aldrin 0.005–0.5 0.999 107 (17) 91 (8) 85 (11) 97 (4) 96 (17) 88 (3)Atrazine 0.01–0.5 0.998 84 (47) 108 (5) 100 (9) 94 (4) 113 (30) 107 (5)Azinphos-ethyl 0.005–0.5 0.999 94 (11) 109 (4) 94 (6) 98 (1) 86 (15) 109 (4)Azinphos-methyl 0.01–0.5 0.999 110 (8) 105 (12) 87 (5) 117 (7)Azoxystrobin 0.01–0.5 0.999 116 (9) 110 (5) 99 (4) 104 (2) 109 (10) 110 (13)Benalaxyl 0.02–0.5 0.996 99 (18) 76 (20) 98 (1) 96 (4)Bifenthrin 0.005–0.5 0.999 103 (8) 108 (3) 92 (4) 99 (1) 94 (7) 89 (4)Bitertanol 0.01–0.5 0.997 60 (35) 102 (5) 88 (4) 102 (3) 112 (6) 92 (5)Boscalid 0.005–0.5 0.999 98 (13) 108 (3) 94 (5) 99 (2) 119 (1) 100 (8)Bromopropylate 0.005–0.5 0.999 113 (8) 108 (6) 111 (6) 104 (3) 94 (20) 98 (5)Bromuconazole 1 0.005–0.5 0.999 103 (14) 107 (3) 101 (1) 99 (2) 76 (20) 101 (4)Bromuconazole 2 0.005–0.5 0.999 95 (10) 109 (4) 108 (1) 102 (2) 112 (12) 107 (6)Bupirimate 0.005–0.5 0.999 110 (15) 98 (7) 93 (3) 118 (30) 110 (3)Buprofezin 0.005–0.5 0.998 112 (6) 110 (13) 103 (12) 103 (2) 115 (3)Captan 0.5–0.5 – 42 (13)Carbaryl 0.005–0.5 0.998 107 (12) 97 (8) 107 (11) 102 (3) 104 (10) 87 (12)Carbofuran 0.005–0.5 0.999 78 (12) 103 (8) 92 (10) 103 (3) 111 (12) 87 (17)Chlorfenvinphos 0.005–0.5 0.998 108 (10) 103 (3) 106 (3) 110 (3) 119 (7) 105 (2)Chlorothalonil 0.005–0.5 0.999 77 (24) 92 (4) 88 (13) 87 (5) 44 (11)Chlorpropham 0.005–0.5 0.999 128 (24) 109 (8) 101 (13) 96 (2) 71 (24) 103 (6)Chlorpyrifos 0.005–0.5 0.986 97 (8) 97 (3) 98 (9) 103 (6) 87 (32) 100 (1)Chlorpyrifos-methyl 0.005–0.5 0.999 118 (13) 107 (4) 102 (8) 104 (2) 94 (16) 107 (2)Cyfluthrin 1 0.005–0.5 0.998 103 (13) 108 (2) 91 (6) 99 (4) 112 (8) 95 (12)Cyfluthrin 2 0.005–0.5 0.996 107 (12) 112 (3) 96 (5) 91 (5) 113 (4) 91 (11)�-Cyfluthrin 1 0.005–0.5 0.999 118 (6) 110 (5) 102 (4) 77 (6) 89 (2) 108 (8)�-Cyfluthrin 2 0.005–0.5 0.999 98 (12) 107 (7) 97 (8) 97 (3) 92 (2) 105 (8)�-Cyhalothrin 1 0.005–0.5 0.995 94 (16) 107 (4) 94 (10) 114 (10) 76 (15)�-Cyhalothrin 2 0.005–0.5 0.999 113 (11) 107 (5) 102 (6) 95 (2) 77 (11) 102 (4)Cypermethrin 1 0.005–0.5 0.999 99 (10) 102 (2) 88 (7) 106 (3) 119 (3) 91 (12)Cypermethrin 2 0.005–0.5 0.998 96 (14) 106 (3) 90 (7) 100 (2) 102 (11) 99 (9)Cypermethrin 3 0.005–0.5 0.999 107 (11) 108 (4) 93 (5) 98 (1) 86 (5) 105 (7)Cyproconazole 0.005–0.5 0.999 105 (8) 98 (6) 97 (1) 103 (6) 102 (6)Cyprodinil 0.005–0.5 0.999 103 (8) 99 (2) 100 (1) 100 (1) 117 (7) 108 (1)p,p′-DDD 0.005–0.5 0.999 105 (5) 98 (2) 103 (3) 98 (4) 108 (7) 92 (5)p,p′-DDE 0.005–0.5 0.999 103 (6) 92 (2) 94 (2) 90 (4) 101 (14) 78 (4)o,p′-DDT 0.005–0.5 0.999 112 (10) 106 (6) 92 (7) 100 (3) 91 (9) 90 (3)p,p′-DDT 0.005–0.5 0.999 96 (13) 94 (9) 103 (11) 99 (3) 90 (4) 96 (3)Deltamethrin 1 0.01–0.5 0.999 118 (9) 96 (6) 89 (9) 101 (2) 80 (15)Deltamethrin 2 0.005–0.5 0.998 104 (11) 103 (5) 99 (7) 95 (3) 90 (16) 99 (10)Desmedipham 0.005–0.5 0.999 104 (8) 101 (5) 99 (5) 99 (1) 101 (4)Diazinon 0.005–0.5 0.993 105 (17) 103 (5) 98 (8) 103 (2) 109 (18) 104 (3)Dichlofluanid 0.005–0.5 0.999 37 (19) 31 (11) 35 (17) 42 (7) 4 (21)Dichlorvos 0.005–0.5 0.999 98 (14) 94 (3) 92 (6) 97 (3) 119 (7) 101 (3)Dicloran 0.005–0.5 0.999 128 (14) 103 (6) 98 (11) 101 (2) 103 (4) 97 (3)Dicofol 0.005–0.5 0.997 93 (15) 108 (7) 93 (4) 104 (2) 101 (9) 84 (8)Dieldrin 0.01–0.5 0.998 95 (5) 96 (7) 99 (3) 81 (8)Difenoconazole 1 0.005–0.5 0.999 112 (11) 107 (4) 100 (3) 102 (5) 108 (2) 87 (10)Difenoconazole 2 0.005–0.5 0.999 109 (9) 112 (2) 102 (3) 101 (4) 101 (21) 87 (11)Dimethoate 0.02–0.5 0.999 120 (5) 95 (11) 98 (2) 101 (7)Dimethomorph 1 0.005–0.5 0.999 100 (13) 111 (6) 97 (4) 99 (2) 127 (4) 99 (16)Dimethomorph 2 0.005–0.5 0.999 103 (12) 109 (7) 100 (4) 99 (2) 116 (7) 99 (18)Diphenylamine 0.005–0.5 0.998 101 (14) 89 (13) 70 (19) 81 (5) 97 (2) 94 (5)�-Endosulfan 0.005–0.5 0.994 100 (8) 98 (5) 100 (9) 99 (2) 70 (1) 94 (7)�-Endosulfan 0.005–0.5 0.999 117 (7) 109 (5) 89 (5) 108 (3) 108 (3)Endosulfan sulphate 0.005–0.5 0.999 115 (8) 99 (6) 106 (6) 104 (6) 81 (24) 113 (3)Endrin 0.01–0.5 0.999 91 (6) 90 (13) 99 (3) 94 (8)Epoxiconazole 0.005–0.5 0.999 104 (7) 108 (3) 104 (4) 101 (1) 118 (5) 102 (3)Ethion 0.005–0.5 0.999 119 (2) 112 (4) 103 (5) 103 (2) 81 (13) 103 (5)Ethoprophos 0.005–0.5 0.999 113 (9) 104 (5) 99 (5) 105 (3) 108 (5) 84 (12)Fenarimol 0.005–0.5 0.999 103 (11) 105 (2) 100 (3) 100 (2) 98 (12) 97 (6)Fenazaquin 0.005–0.5 0.999 89 (8) 98 (3) 94 (3) 93 (1) 114 (10) 90 (3)Fenhexamid 0.01–0.5 0.998 126 (31) 112 (10) 100 (12) 100 (3) 84 (8)Fenitrothion 0.005–0.5 0.999 104 (29) 105 (6) 106 (12) 105 (2) 97 (33) 109 (5)Fenpropathrin 0.005–0.5 0.999 99 (27) 103 (4) 105 (8) 101 (1) 68 (27) 106 (4)Fenpropimorph 0.005–0.5 0.999 100 (10) 106 (5) 92 (4) 96 (1) 114 (7) 92 (4)Fenvalerate 1 0.005–0.5 0.999 103 (7) 107 (3) 91 (5) 101 (1) 108 (4) 92 (8)Fenvalerate 2 0.005–0.5 0.999 105 (10) 109 (3) 94 (5) 98 (1) 114 (7) 96 (7)Fipronil 0.01–0.5 0.989 159 (18) 100 (20) 111 (6) 101 (5) 108 (8)
S. Walorczyk / J. Chromatogr. A 1208 (2008) 202–214 209
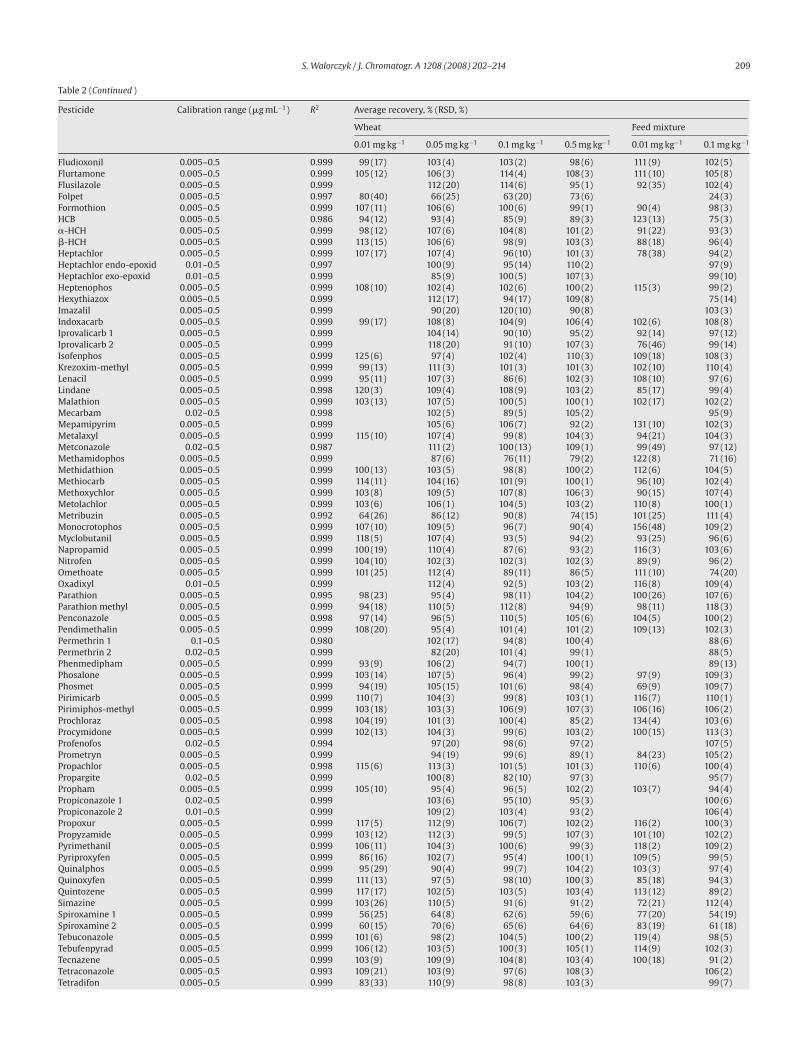
Table 2 (Continued )
Pesticide Calibration range (�g mL−1) R2 Average recovery, % (RSD, %)
Wheat Feed mixture
0.01 mg kg−1 0.05 mg kg−1 0.1 mg kg−1 0.5 mg kg−1 0.01 mg kg−1 0.1 mg kg−1
Fludioxonil 0.005–0.5 0.999 99 (17) 103 (4) 103 (2) 98 (6) 111 (9) 102 (5)Flurtamone 0.005–0.5 0.999 105 (12) 106 (3) 114 (4) 108 (3) 111 (10) 105 (8)Flusilazole 0.005–0.5 0.999 112 (20) 114 (6) 95 (1) 92 (35) 102 (4)Folpet 0.005–0.5 0.997 80 (40) 66 (25) 63 (20) 73 (6) 24 (3)Formothion 0.005–0.5 0.999 107 (11) 106 (6) 100 (6) 99 (1) 90 (4) 98 (3)HCB 0.005–0.5 0.986 94 (12) 93 (4) 85 (9) 89 (3) 123 (13) 75 (3)�-HCH 0.005–0.5 0.999 98 (12) 107 (6) 104 (8) 101 (2) 91 (22) 93 (3)�-HCH 0.005–0.5 0.999 113 (15) 106 (6) 98 (9) 103 (3) 88 (18) 96 (4)Heptachlor 0.005–0.5 0.999 107 (17) 107 (4) 96 (10) 101 (3) 78 (38) 94 (2)Heptachlor endo-epoxid 0.01–0.5 0.997 100 (9) 95 (14) 110 (2) 97 (9)Heptachlor exo-epoxid 0.01–0.5 0.999 85 (9) 100 (5) 107 (3) 99 (10)Heptenophos 0.005–0.5 0.999 108 (10) 102 (4) 102 (6) 100 (2) 115 (3) 99 (2)Hexythiazox 0.005–0.5 0.999 112 (17) 94 (17) 109 (8) 75 (14)Imazalil 0.005–0.5 0.999 90 (20) 120 (10) 90 (8) 103 (3)Indoxacarb 0.005–0.5 0.999 99 (17) 108 (8) 104 (9) 106 (4) 102 (6) 108 (8)Iprovalicarb 1 0.005–0.5 0.999 104 (14) 90 (10) 95 (2) 92 (14) 97 (12)Iprovalicarb 2 0.005–0.5 0.999 118 (20) 91 (10) 107 (3) 76 (46) 99 (14)Isofenphos 0.005–0.5 0.999 125 (6) 97 (4) 102 (4) 110 (3) 109 (18) 108 (3)Krezoxim-methyl 0.005–0.5 0.999 99 (13) 111 (3) 101 (3) 101 (3) 102 (10) 110 (4)Lenacil 0.005–0.5 0.999 95 (11) 107 (3) 86 (6) 102 (3) 108 (10) 97 (6)Lindane 0.005–0.5 0.998 120 (3) 109 (4) 108 (9) 103 (2) 85 (17) 99 (4)Malathion 0.005–0.5 0.999 103 (13) 107 (5) 100 (5) 100 (1) 102 (17) 102 (2)Mecarbam 0.02–0.5 0.998 102 (5) 89 (5) 105 (2) 95 (9)Mepamipyrim 0.005–0.5 0.999 105 (6) 106 (7) 92 (2) 131 (10) 102 (3)Metalaxyl 0.005–0.5 0.999 115 (10) 107 (4) 99 (8) 104 (3) 94 (21) 104 (3)Metconazole 0.02–0.5 0.987 111 (2) 100 (13) 109 (1) 99 (49) 97 (12)Methamidophos 0.005–0.5 0.999 87 (6) 76 (11) 79 (2) 122 (8) 71 (16)Methidathion 0.005–0.5 0.999 100 (13) 103 (5) 98 (8) 100 (2) 112 (6) 104 (5)Methiocarb 0.005–0.5 0.999 114 (11) 104 (16) 101 (9) 100 (1) 96 (10) 102 (4)Methoxychlor 0.005–0.5 0.999 103 (8) 109 (5) 107 (8) 106 (3) 90 (15) 107 (4)Metolachlor 0.005–0.5 0.999 103 (6) 106 (1) 104 (5) 103 (2) 110 (8) 100 (1)Metribuzin 0.005–0.5 0.992 64 (26) 86 (12) 90 (8) 74 (15) 101 (25) 111 (4)Monocrotophos 0.005–0.5 0.999 107 (10) 109 (5) 96 (7) 90 (4) 156 (48) 109 (2)Myclobutanil 0.005–0.5 0.999 118 (5) 107 (4) 93 (5) 94 (2) 93 (25) 96 (6)Napropamid 0.005–0.5 0.999 100 (19) 110 (4) 87 (6) 93 (2) 116 (3) 103 (6)Nitrofen 0.005–0.5 0.999 104 (10) 102 (3) 102 (3) 102 (3) 89 (9) 96 (2)Omethoate 0.005–0.5 0.999 101 (25) 112 (4) 89 (11) 86 (5) 111 (10) 74 (20)Oxadixyl 0.01–0.5 0.999 112 (4) 92 (5) 103 (2) 116 (8) 109 (4)Parathion 0.005–0.5 0.995 98 (23) 95 (4) 98 (11) 104 (2) 100 (26) 107 (6)Parathion methyl 0.005–0.5 0.999 94 (18) 110 (5) 112 (8) 94 (9) 98 (11) 118 (3)Penconazole 0.005–0.5 0.998 97 (14) 96 (5) 110 (5) 105 (6) 104 (5) 100 (2)Pendimethalin 0.005–0.5 0.999 108 (20) 95 (4) 101 (4) 101 (2) 109 (13) 102 (3)Permethrin 1 0.1–0.5 0.980 102 (17) 94 (8) 100 (4) 88 (6)Permethrin 2 0.02–0.5 0.999 82 (20) 101 (4) 99 (1) 88 (5)Phenmedipham 0.005–0.5 0.999 93 (9) 106 (2) 94 (7) 100 (1) 89 (13)Phosalone 0.005–0.5 0.999 103 (14) 107 (5) 96 (4) 99 (2) 97 (9) 109 (3)Phosmet 0.005–0.5 0.999 94 (19) 105 (15) 101 (6) 98 (4) 69 (9) 109 (7)Pirimicarb 0.005–0.5 0.999 110 (7) 104 (3) 99 (8) 103 (1) 116 (7) 110 (1)Pirimiphos-methyl 0.005–0.5 0.999 103 (18) 103 (3) 106 (9) 107 (3) 106 (16) 106 (2)Prochloraz 0.005–0.5 0.998 104 (19) 101 (3) 100 (4) 85 (2) 134 (4) 103 (6)Procymidone 0.005–0.5 0.999 102 (13) 104 (3) 99 (6) 103 (2) 100 (15) 113 (3)Profenofos 0.02–0.5 0.994 97 (20) 98 (6) 97 (2) 107 (5)Prometryn 0.005–0.5 0.999 94 (19) 99 (6) 89 (1) 84 (23) 105 (2)Propachlor 0.005–0.5 0.998 115 (6) 113 (3) 101 (5) 101 (3) 110 (6) 100 (4)Propargite 0.02–0.5 0.999 100 (8) 82 (10) 97 (3) 95 (7)Propham 0.005–0.5 0.999 105 (10) 95 (4) 96 (5) 102 (2) 103 (7) 94 (4)Propiconazole 1 0.02–0.5 0.999 103 (6) 95 (10) 95 (3) 100 (6)Propiconazole 2 0.01–0.5 0.999 109 (2) 103 (4) 93 (2) 106 (4)Propoxur 0.005–0.5 0.999 117 (5) 112 (9) 106 (7) 102 (2) 116 (2) 100 (3)Propyzamide 0.005–0.5 0.999 103 (12) 112 (3) 99 (5) 107 (3) 101 (10) 102 (2)Pyrimethanil 0.005–0.5 0.999 106 (11) 104 (3) 100 (6) 99 (3) 118 (2) 109 (2)Pyriproxyfen 0.005–0.5 0.999 86 (16) 102 (7) 95 (4) 100 (1) 109 (5) 99 (5)Quinalphos 0.005–0.5 0.999 95 (29) 90 (4) 99 (7) 104 (2) 103 (3) 97 (4)Quinoxyfen 0.005–0.5 0.999 111 (13) 97 (5) 98 (10) 100 (3) 85 (18) 94 (3)Quintozene 0.005–0.5 0.999 117 (17) 102 (5) 103 (5) 103 (4) 113 (12) 89 (2)Simazine 0.005–0.5 0.999 103 (26) 110 (5) 91 (6) 91 (2) 72 (21) 112 (4)Spiroxamine 1 0.005–0.5 0.999 56 (25) 64 (8) 62 (6) 59 (6) 77 (20) 54 (19)Spiroxamine 2 0.005–0.5 0.999 60 (15) 70 (6) 65 (6) 64 (6) 83 (19) 61 (18)Tebuconazole 0.005–0.5 0.999 101 (6) 98 (2) 104 (5) 100 (2) 119 (4) 98 (5)Tebufenpyrad 0.005–0.5 0.999 106 (12) 103 (5) 100 (3) 105 (1) 114 (9) 102 (3)Tecnazene 0.005–0.5 0.999 103 (9) 109 (9) 104 (8) 103 (4) 100 (18) 91 (2)Tetraconazole 0.005–0.5 0.993 109 (21) 103 (9) 97 (6) 108 (3) 106 (2)Tetradifon 0.005–0.5 0.999 83 (33) 110 (9) 98 (8) 103 (3) 99 (7)
210 S. Walorczyk / J. Chromatogr. A 1208 (2008) 202–214
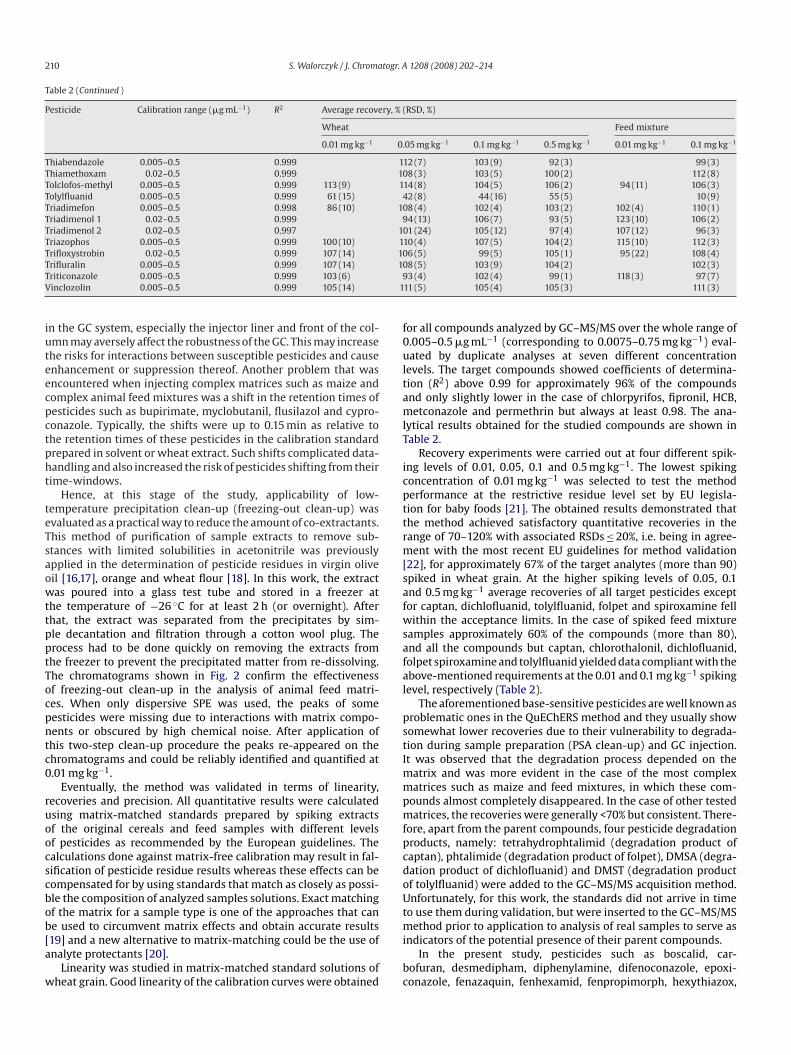
Table 2 (Continued )
Pesticide Calibration range (�g mL−1) R2 Average recovery, % (RSD, %)
Wheat Feed mixture
0.01 mg kg−1 0.05 mg kg−1 0.1 mg kg−1 0.5 mg kg−1 0.01 mg kg−1 0.1 mg kg−1
Thiabendazole 0.005–0.5 0.999 112 (7) 103 (9) 92 (3) 99 (3)Thiamethoxam 0.02–0.5 0.999 108 (3) 103 (5) 100 (2) 112 (8)Tolclofos-methyl 0.005–0.5 0.999 113 (9) 114 (8) 104 (5) 106 (2) 94 (11) 106 (3)Tolylfluanid 0.005–0.5 0.999 61 (15) 42 (8) 44 (16) 55 (5) 10 (9)Triadimefon 0.005–0.5 0.998 86 (10) 108 (4) 102 (4) 103 (2) 102 (4) 110 (1)Triadimenol 1 0.02–0.5 0.999 94 (13) 106 (7) 93 (5) 123 (10) 106 (2)Triadimenol 2 0.02–0.5 0.997 101 (24) 105 (12) 97 (4) 107 (12) 96 (3)Triazophos 0.005–0.5 0.999 100 (10) 110 (4) 107 (5) 104 (2) 115 (10) 112 (3)Trifloxystrobin 0.02–0.5 0.999 107 (14) 106 (5) 99 (5) 105 (1) 95 (22) 108 (4)T 10T 9V 1
iuteecpctpht
teTsaowttpptTocpntc0
ruoocscbob[a
w
f0ultamlT
icpttrm[safwsafal
pstImmpmfpcdoUt
rifluralin 0.005–0.5 0.999 107 (14)riticonazole 0.005–0.5 0.999 103 (6)inclozolin 0.005–0.5 0.999 105 (14)
n the GC system, especially the injector liner and front of the col-mn may aversely affect the robustness of the GC. This may increasehe risks for interactions between susceptible pesticides and causenhancement or suppression thereof. Another problem that wasncountered when injecting complex matrices such as maize andomplex animal feed mixtures was a shift in the retention times ofesticides such as bupirimate, myclobutanil, flusilazol and cypro-onazole. Typically, the shifts were up to 0.15 min as relative tohe retention times of these pesticides in the calibration standardrepared in solvent or wheat extract. Such shifts complicated data-andling and also increased the risk of pesticides shifting from theirime-windows.
Hence, at this stage of the study, applicability of low-emperature precipitation clean-up (freezing-out clean-up) wasvaluated as a practical way to reduce the amount of co-extractants.his method of purification of sample extracts to remove sub-tances with limited solubilities in acetonitrile was previouslypplied in the determination of pesticide residues in virgin oliveil [16,17], orange and wheat flour [18]. In this work, the extractas poured into a glass test tube and stored in a freezer at
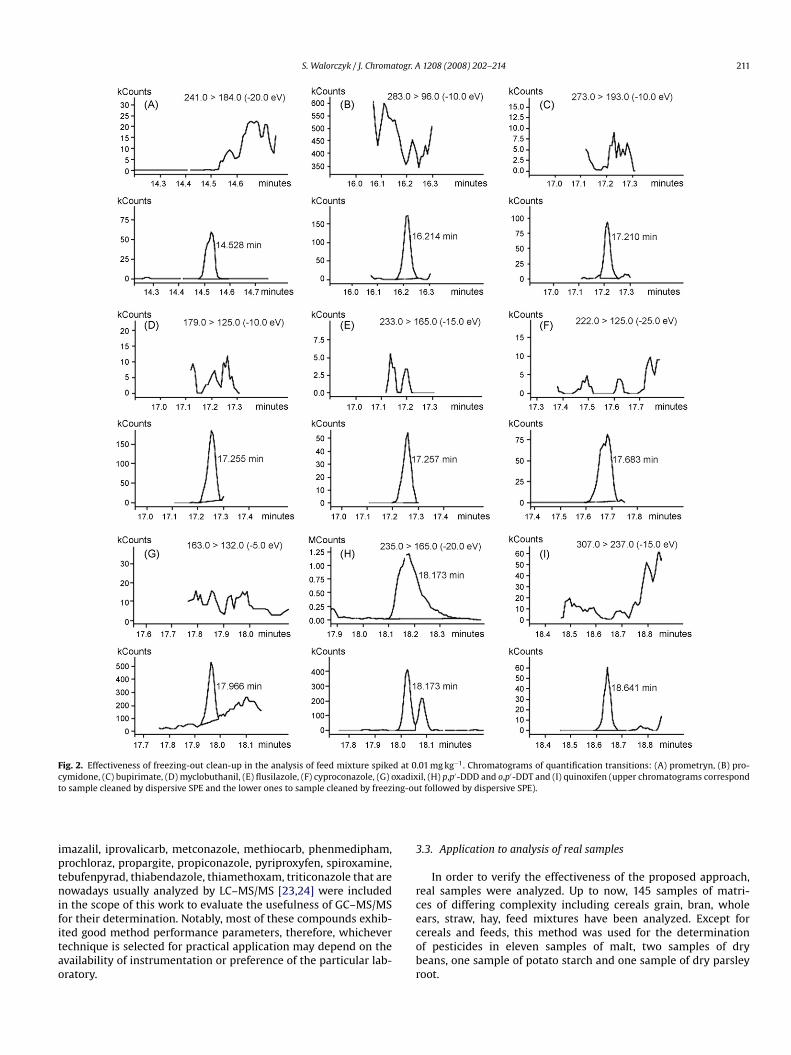
he temperature of −26 ◦C for at least 2 h (or overnight). Afterhat, the extract was separated from the precipitates by sim-le decantation and filtration through a cotton wool plug. Therocess had to be done quickly on removing the extracts fromhe freezer to prevent the precipitated matter from re-dissolving.he chromatograms shown in Fig. 2 confirm the effectivenessf freezing-out clean-up in the analysis of animal feed matri-es. When only dispersive SPE was used, the peaks of someesticides were missing due to interactions with matrix compo-ents or obscured by high chemical noise. After application ofhis two-step clean-up procedure the peaks re-appeared on thehromatograms and could be reliably identified and quantified at.01 mg kg−1.
Eventually, the method was validated in terms of linearity,ecoveries and precision. All quantitative results were calculatedsing matrix-matched standards prepared by spiking extractsf the original cereals and feed samples with different levelsf pesticides as recommended by the European guidelines. Thealculations done against matrix-free calibration may result in fal-ification of pesticide residue results whereas these effects can beompensated for by using standards that match as closely as possi-le the composition of analyzed samples solutions. Exact matchingf the matrix for a sample type is one of the approaches that can
e used to circumvent matrix effects and obtain accurate results19] and a new alternative to matrix-matching could be the use ofnalyte protectants [20].Linearity was studied in matrix-matched standard solutions ofheat grain. Good linearity of the calibration curves were obtained
mi
bc
8 (5) 103 (9) 104 (2) 102 (3)3 (4) 102 (4) 99 (1) 118 (3) 97 (7)
11 (5) 105 (4) 105 (3) 111 (3)
or all compounds analyzed by GC–MS/MS over the whole range of.005–0.5 �g mL−1 (corresponding to 0.0075–0.75 mg kg−1) eval-ated by duplicate analyses at seven different concentration
evels. The target compounds showed coefficients of determina-ion (R2) above 0.99 for approximately 96% of the compoundsnd only slightly lower in the case of chlorpyrifos, fipronil, HCB,etconazole and permethrin but always at least 0.98. The ana-
ytical results obtained for the studied compounds are shown inable 2.
Recovery experiments were carried out at four different spik-ng levels of 0.01, 0.05, 0.1 and 0.5 mg kg−1. The lowest spikingoncentration of 0.01 mg kg−1 was selected to test the methoderformance at the restrictive residue level set by EU legisla-ion for baby foods [21]. The obtained results demonstrated thathe method achieved satisfactory quantitative recoveries in theange of 70–120% with associated RSDs ≤ 20%, i.e. being in agree-ent with the most recent EU guidelines for method validation
22], for approximately 67% of the target analytes (more than 90)piked in wheat grain. At the higher spiking levels of 0.05, 0.1nd 0.5 mg kg−1 average recoveries of all target pesticides exceptor captan, dichlofluanid, tolylfluanid, folpet and spiroxamine fellithin the acceptance limits. In the case of spiked feed mixture
amples approximately 60% of the compounds (more than 80),nd all the compounds but captan, chlorothalonil, dichlofluanid,olpet spiroxamine and tolylfluanid yielded data compliant with thebove-mentioned requirements at the 0.01 and 0.1 mg kg−1 spikingevel, respectively (Table 2).
The aforementioned base-sensitive pesticides are well known asroblematic ones in the QuEChERS method and they usually showomewhat lower recoveries due to their vulnerability to degrada-ion during sample preparation (PSA clean-up) and GC injection.t was observed that the degradation process depended on the
atrix and was more evident in the case of the most complexatrices such as maize and feed mixtures, in which these com-
ounds almost completely disappeared. In the case of other testedatrices, the recoveries were generally <70% but consistent. There-
ore, apart from the parent compounds, four pesticide degradationroducts, namely: tetrahydrophtalimid (degradation product ofaptan), phtalimide (degradation product of folpet), DMSA (degra-ation product of dichlofluanid) and DMST (degradation productf tolylfluanid) were added to the GC–MS/MS acquisition method.nfortunately, for this work, the standards did not arrive in time
o use them during validation, but were inserted to the GC–MS/MS
ethod prior to application to analysis of real samples to serve asndicators of the potential presence of their parent compounds.In the present study, pesticides such as boscalid, car-
ofuran, desmedipham, diphenylamine, difenoconazole, epoxi-onazole, fenazaquin, fenhexamid, fenpropimorph, hexythiazox,
S. Walorczyk / J. Chromatogr. A 1208 (2008) 202–214 211
Fig. 2. Effectiveness of freezing-out clean-up in the analysis of feed mixture spiked at 0.01 mg kg−1. Chromatograms of quantification transitions: (A) prometryn, (B) pro-cymidone, (C) bupirimate, (D) myclobuthanil, (E) flusilazole, (F) cyproconazole, (G) oxadixil, (H) p,p′-DDD and o,p′-DDT and (I) quinoxifen (upper chromatograms correspondt ng-ou
iptnifitao
3
rce
o sample cleaned by dispersive SPE and the lower ones to sample cleaned by freezi
mazalil, iprovalicarb, metconazole, methiocarb, phenmedipham,rochloraz, propargite, propiconazole, pyriproxyfen, spiroxamine,ebufenpyrad, thiabendazole, thiamethoxam, triticonazole that areowadays usually analyzed by LC–MS/MS [23,24] were included
n the scope of this work to evaluate the usefulness of GC–MS/MSor their determination. Notably, most of these compounds exhib-
ted good method performance parameters, therefore, whicheverechnique is selected for practical application may depend on thevailability of instrumentation or preference of the particular lab-ratory.cobr
t followed by dispersive SPE).
.3. Application to analysis of real samples
In order to verify the effectiveness of the proposed approach,eal samples were analyzed. Up to now, 145 samples of matri-es of differing complexity including cereals grain, bran, wholears, straw, hay, feed mixtures have been analyzed. Except for
ereals and feeds, this method was used for the determinationf pesticides in eleven samples of malt, two samples of dryeans, one sample of potato starch and one sample of dry parsleyoot.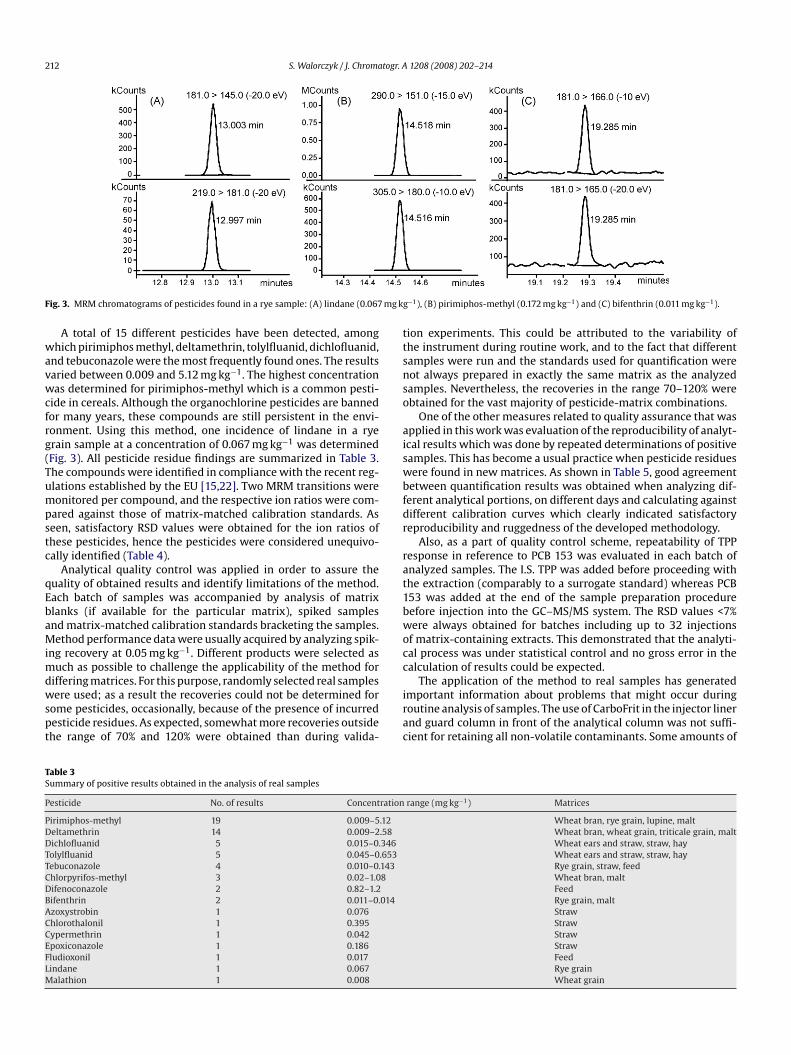
212 S. Walorczyk / J. Chromatogr. A 1208 (2008) 202–214
F mg k
wavwcfrg(Tumpstc
qEbaMimdwspt
ttsnso
aiswbfdr
rat1bwocc
TS
P
PDDTTCDBACCEFLM
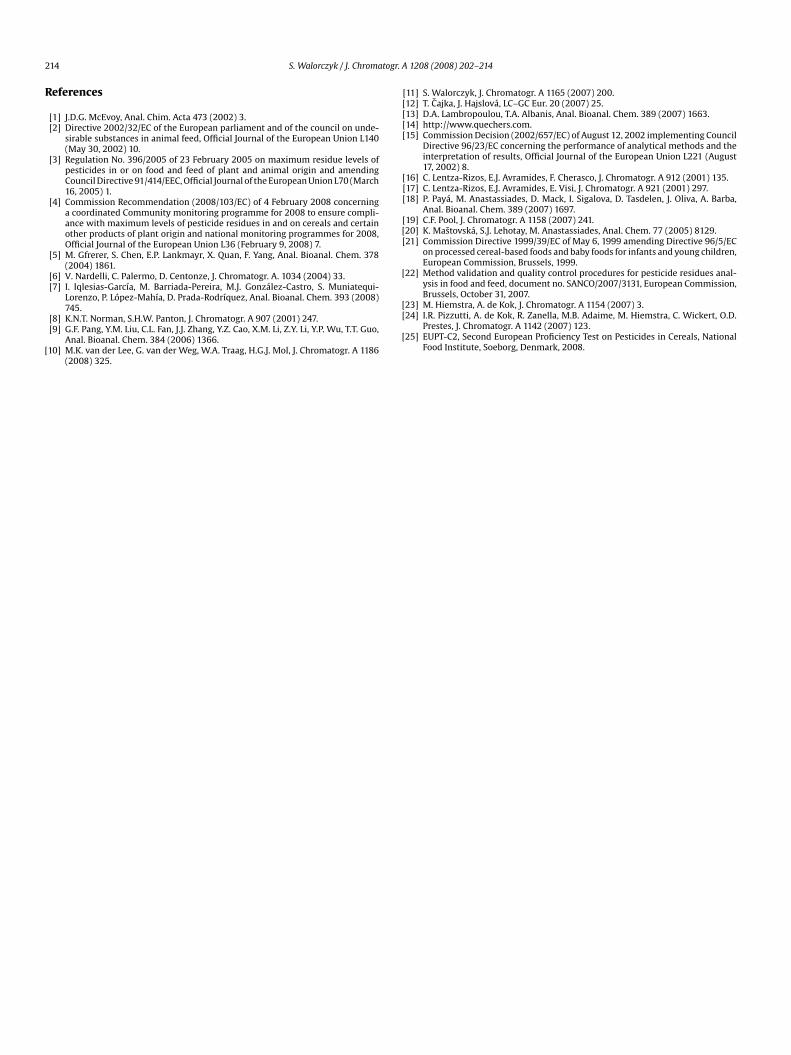
ig. 3. MRM chromatograms of pesticides found in a rye sample: (A) lindane (0.067
A total of 15 different pesticides have been detected, amonghich pirimiphos methyl, deltamethrin, tolylfluanid, dichlofluanid,
nd tebuconazole were the most frequently found ones. The resultsaried between 0.009 and 5.12 mg kg−1. The highest concentrationas determined for pirimiphos-methyl which is a common pesti-
ide in cereals. Although the organochlorine pesticides are bannedor many years, these compounds are still persistent in the envi-onment. Using this method, one incidence of lindane in a ryerain sample at a concentration of 0.067 mg kg−1 was determinedFig. 3). All pesticide residue findings are summarized in Table 3.he compounds were identified in compliance with the recent reg-lations established by the EU [15,22]. Two MRM transitions wereonitored per compound, and the respective ion ratios were com-
ared against those of matrix-matched calibration standards. Aseen, satisfactory RSD values were obtained for the ion ratios ofhese pesticides, hence the pesticides were considered unequivo-ally identified (Table 4).
Analytical quality control was applied in order to assure theuality of obtained results and identify limitations of the method.ach batch of samples was accompanied by analysis of matrixlanks (if available for the particular matrix), spiked samplesnd matrix-matched calibration standards bracketing the samples.ethod performance data were usually acquired by analyzing spik-
ng recovery at 0.05 mg kg−1. Different products were selected asuch as possible to challenge the applicability of the method for
iffering matrices. For this purpose, randomly selected real samplesere used; as a result the recoveries could not be determined for
ome pesticides, occasionally, because of the presence of incurredesticide residues. As expected, somewhat more recoveries outsidehe range of 70% and 120% were obtained than during valida-
irac
able 3ummary of positive results obtained in the analysis of real samples
esticide No. of results Concentration
irimiphos-methyl 19 0.009–5.12eltamethrin 14 0.009–2.58ichlofluanid 5 0.015–0.346olylfluanid 5 0.045–0.653ebuconazole 4 0.010–0.143hlorpyrifos-methyl 3 0.02–1.08ifenoconazole 2 0.82–1.2ifenthrin 2 0.011–0.014zoxystrobin 1 0.076hlorothalonil 1 0.395ypermethrin 1 0.042poxiconazole 1 0.186ludioxonil 1 0.017indane 1 0.067alathion 1 0.008
g−1), (B) pirimiphos-methyl (0.172 mg kg−1) and (C) bifenthrin (0.011 mg kg−1).
ion experiments. This could be attributed to the variability ofhe instrument during routine work, and to the fact that differentamples were run and the standards used for quantification wereot always prepared in exactly the same matrix as the analyzedamples. Nevertheless, the recoveries in the range 70–120% werebtained for the vast majority of pesticide-matrix combinations.
One of the other measures related to quality assurance that waspplied in this work was evaluation of the reproducibility of analyt-cal results which was done by repeated determinations of positiveamples. This has become a usual practice when pesticide residuesere found in new matrices. As shown in Table 5, good agreementetween quantification results was obtained when analyzing dif-erent analytical portions, on different days and calculating againstifferent calibration curves which clearly indicated satisfactoryeproducibility and ruggedness of the developed methodology.
Also, as a part of quality control scheme, repeatability of TPPesponse in reference to PCB 153 was evaluated in each batch ofnalyzed samples. The I.S. TPP was added before proceeding withhe extraction (comparably to a surrogate standard) whereas PCB53 was added at the end of the sample preparation procedureefore injection into the GC–MS/MS system. The RSD values <7%ere always obtained for batches including up to 32 injections
f matrix-containing extracts. This demonstrated that the analyti-al process was under statistical control and no gross error in thealculation of results could be expected.
The application of the method to real samples has generatedmportant information about problems that might occur duringoutine analysis of samples. The use of CarboFrit in the injector linernd guard column in front of the analytical column was not suffi-ient for retaining all non-volatile contaminants. Some amounts of
range (mg kg−1) Matrices
Wheat bran, rye grain, lupine, maltWheat bran, wheat grain, triticale grain, maltWheat ears and straw, straw, hayWheat ears and straw, straw, hayRye grain, straw, feedWheat bran, maltFeedRye grain, maltStrawStrawStrawStrawFeedRye grainWheat grain
S. Walorczyk / J. Chromatogr. A 1208 (2008) 202–214 213
Table 4Repeatability of ion ratios for the pesticides found in real samples calculated from matrix-matched calibration standards in the range 0.01–0.5 �g mL−1 (n = 8)
Pesticide 1st transition 2nd transition Ratio (RSD) (%) 2006/657/EC RSD limit (%)
Azoxystrobin 344 > 329 (10) 344 > 156 (30) 94 (14) 20Bifenthrin 181 > 166 (10) 181 > 165 (20) 93 (2) 25Chlorothalonil 266 > 133 (35) 266 > 168 (35) 80 (5) 20Chlorpyrifos-methyl 288 > 93 (20) 286 > 286 (10) 25 (18) 25Cypermethrin 1 165 > 127 (5) 181 > 152 (15) 62 (9) 20Cypermethrin 2 165 > 127 (5) 181 > 152 (15) 56 (7) 20Deltamethrin 1 253 > 174 (10) 253 > 172 (5) 95 (11) 20Deltamethrin 2 253 > 174 (10) 253 > 172 (5) 94 (9) 20Dichlofluanid 224 > 123 (10) 167 > 124 (10) 47 (8) 20Difenoconazole 1 265 > 139 (25) 323 > 265 (10) 74 (5) 20Difenoconazole 2 265 > 139 (25) 323 > 265 (10) 71 (6) 20Epoxiconazole 192 > 138 (10) 192 > 111 (25) 66 (9) 20Fludioxonil 248 > 127 (30) 248 > 154 (20) 55 (6) 20Lindane 181 > 145 (20) 219 > 181 (10) 40 (9) 25M 7 (10)P 0 (10)T (10)T (20)
taastoc
to1wqowwbsn
TR
M
F
H
M
R
S
W
W
Oigp
mcoflcii−te
alathion 173 > 99 (15) 173 > 12irimiphos-methyl 290 > 151 (15) 305 > 18ebuconazole 250 > 125 (20) 250 > 70olylfluanid 238 > 137 (10) 238 > 91
hese contaminants could reach the analytical column and inter-ct with susceptible pesticides. The sensitivity of the method forll the compounds and especially for the most susceptible onesuch as chlorothalonil and folpet was affected by deterioration ofhe analytical column. Also, a drastic decrease in peaks heights of,p′-DDT and p,p′-DDT due to their degradation indicated a severeontamination of the GC system.
The observation of these symptoms advised the analyst abouthe necessity to do some maintenance of the instrument. It wasbserved that trimming a piece of the guard column (e.g. about5 cm) and reconditioning the column for a short time (up to 1 h)as more important then replacement of the injector liner. Subse-
uent priming of the GC with matrix extract prior to running a batchf samples was needed to stabilize the system. Consistent responsesere obtained after at least two injections. The same liner fitted
ith a CarboFrit could be used for more than one batch of samplesefore the CarboFrit became saturated with matrix compounds. Ifmall numbers of samples were analyzed and the instrument wasot even operated every day, the same liner lasted for several weeks.
able 5eproducibility of results obtained in the analysis of real samples
atrix Pesticide Residues (mg kg−1)
1 2
eed Fludioxonil 0.017 0.016Tebuconazole 0.010 0.010Difenoconazole 1.18 1.23
ay Dichlofluanid 0.096 0.095Tolylfluanid 0.152 0.139
alt Deltamethrin 0.030 0.032Chlorpyrifos-methyl 0.210 0.193Pirimiphos-methyl 0.016 0.011
ye grain Lindane 0.071 0.063Pirimiphos-methyl 0.189 0.154Bifenthrin 0.012 0.009
traw Chlorothalonil 0.340 0.450Tebuconazole 0.017 0.018Epoxiconazole 0.171 0.200Cypermethrin 0.040 0.043Azoxystrobin 0.066 0.086
heat bran Chlorpyrifos-methyl 1.08 1.08Pirimiphos-methyl 1.14 1.14Deltamethrin 0.090 0.084
heat grain Pirimiphos-methyl 4.81 5.43
tm
4
fbamtcfwicsaTrcqo
A
gf
27 (8) 2555 (16) 2053 (8) 20
154 (10) 20
ther symptoms like variations in the relative intensities of MS/MSons making confirmation of some pesticides difficult provided aood indication that the ion source should be cleaned to restore itserformance.
Finally, an additional and independent verification of theethod performance was made by participation in EUPT-C2 profi-
iency test in 2008 [25]. All pesticides within the analytical scopef the method that were present in the analyzed wheat whole grainour sample (i.e. azoxystrobin, bifenthrin, chlorpyrifos-methyl,ypermethrin-alfa, difenoconazole, epoxiconazole, malathion, pir-micarb, prochloraz, spiroxamine, trifloxystrobin) were correctlydentified with good quantitative results; Z-scores of 0.2, 0.4, 0.5,0.9, 0.5, 0.0, 0.7, 0.3, −0.1, −0.5 and 0.2 were obtained, respec-
ively. This provided an additional convincing evidence of the highfficiency of the developed method and its suitability for the prac-ical determinations of multi-class pesticides in cereal and related
atrices.
. Conclusions
This work has demonstrated that GC–MS/MS can be a power-ul tool for comprehensive multi-residue screening of pesticideselonging to various chemical classes in complex matrices suchs cereals and feedingstuffs. The previously published GC–MS/MSethod has been successfully extended to 144 analytes, however
he novelty is not restricted to the increased number of investigatedompounds but predominantly to the enhancement of method per-ormance characteristics such as linearity, precision and accuracyhich was achieved as a consequence of thorough optimization of
nstrument acquisition conditions and application of an efficientlean-up procedure. The proposed method takes advantage of theelectivity provided by tandem mass spectrometry coupled to GCnd the quick, easy, rugged, effective and safe (QuEChERS) method.he applicability of the method was demonstrated by analysis ofeal samples (cereal grain, bran, straw, hay, whole ears, multi-omponent feed mixtures and some other matrices) showing gooduality control data, thus making possible reliable determinationf the targeted pesticides.
cknowledgements
Skillful assistance of the technical personnel in the laboratory isratefully acknowledged. Special thanks go to Mrs. Zofia Rogowskaor preparation of all sample extracts.
2 togr. A
R
[
[[[[[
[[[
[[[
[
Brussels, October 31, 2007.
14 S. Walorczyk / J. Chroma
eferences
[1] J.D.G. McEvoy, Anal. Chim. Acta 473 (2002) 3.[2] Directive 2002/32/EC of the European parliament and of the council on unde-
sirable substances in animal feed, Official Journal of the European Union L140(May 30, 2002) 10.
[3] Regulation No. 396/2005 of 23 February 2005 on maximum residue levels ofpesticides in or on food and feed of plant and animal origin and amendingCouncil Directive 91/414/EEC, Official Journal of the European Union L70 (March16, 2005) 1.
[4] Commission Recommendation (2008/103/EC) of 4 February 2008 concerninga coordinated Community monitoring programme for 2008 to ensure compli-ance with maximum levels of pesticide residues in and on cereals and certainother products of plant origin and national monitoring programmes for 2008,Official Journal of the European Union L36 (February 9, 2008) 7.
[5] M. Gfrerer, S. Chen, E.P. Lankmayr, X. Quan, F. Yang, Anal. Bioanal. Chem. 378(2004) 1861.
[6] V. Nardelli, C. Palermo, D. Centonze, J. Chromatogr. A. 1034 (2004) 33.[7] I. Iqlesias-García, M. Barriada-Pereira, M.J. González-Castro, S. Muniatequi-
Lorenzo, P. López-Mahía, D. Prada-Rodríquez, Anal. Bioanal. Chem. 393 (2008)
745.[8] K.N.T. Norman, S.H.W. Panton, J. Chromatogr. A 907 (2001) 247.[9] G.F. Pang, Y.M. Liu, C.L. Fan, J.J. Zhang, Y.Z. Cao, X.M. Li, Z.Y. Li, Y.P. Wu, T.T. Guo,
Anal. Bioanal. Chem. 384 (2006) 1366.10] M.K. van der Lee, G. van der Weg, W.A. Traag, H.G.J. Mol, J. Chromatogr. A 1186
(2008) 325.
[[
[
1208 (2008) 202–214
11] S. Walorczyk, J. Chromatogr. A 1165 (2007) 200.12] T. Cajka, J. Hajslová, LC–GC Eur. 20 (2007) 25.13] D.A. Lambropoulou, T.A. Albanis, Anal. Bioanal. Chem. 389 (2007) 1663.14] http://www.quechers.com.15] Commission Decision (2002/657/EC) of August 12, 2002 implementing Council
Directive 96/23/EC concerning the performance of analytical methods and theinterpretation of results, Official Journal of the European Union L221 (August17, 2002) 8.
16] C. Lentza-Rizos, E.J. Avramides, F. Cherasco, J. Chromatogr. A 912 (2001) 135.17] C. Lentza-Rizos, E.J. Avramides, E. Visi, J. Chromatogr. A 921 (2001) 297.18] P. Payá, M. Anastassiades, D. Mack, I. Sigalova, D. Tasdelen, J. Oliva, A. Barba,
Anal. Bioanal. Chem. 389 (2007) 1697.19] C.F. Pool, J. Chromatogr. A 1158 (2007) 241.20] K. Mastovská, S.J. Lehotay, M. Anastassiades, Anal. Chem. 77 (2005) 8129.21] Commission Directive 1999/39/EC of May 6, 1999 amending Directive 96/5/EC
on processed cereal-based foods and baby foods for infants and young children,European Commission, Brussels, 1999.
22] Method validation and quality control procedures for pesticide residues anal-ysis in food and feed, document no. SANCO/2007/3131, European Commission,
23] M. Hiemstra, A. de Kok, J. Chromatogr. A 1154 (2007) 3.24] I.R. Pizzutti, A. de Kok, R. Zanella, M.B. Adaime, M. Hiemstra, C. Wickert, O.D.
Prestes, J. Chromatogr. A 1142 (2007) 123.25] EUPT-C2, Second European Proficiency Test on Pesticides in Cereals, National
Food Institute, Soeborg, Denmark, 2008.