Embed Size (px)
Citation preview
Development of a new composite powder material of cement
additive with Polyamide 12 for selective laser sintering
A thesis
submitted to
Cardiff University
For the degree of
Doctor of Philosophy
by
Saleh Ahmed Aldahsh
Manufacturing Engineering Centre
School of Engineering
Cardiff University
United Kingdom
2011

I
Abstract
Applications of rapid prototyping are expanding to new domains. This is particularly
true of the selective laser sintering (SLS) process. In order for that process to be
competitive and become a strong candidate for new applications, such as rapid
manufacturing, the material used needs to be improved. The aim of the work
presented in this thesis was to develop a new composite material made up of
Polyamide 12 (a common SLS material) and cement, an inexpensive additive, for the
purpose of improving the mechanical properties, as well as reducing the cost of the
sintered components.
An experimental study was conducted of the thermal properties of the cement-
Polyamide 12 composite material with different proportions of cement and Polyamide
12. The purpose of the study was to determine optimal SLS parameters to produce
good quality fabricated SLS specimens. The research also involved an experimental
investigation of the mechanical properties (Young‟s modulus, tensile, flexural,
compression and impact strengths, and density) as a function of the proportion of
cement additive to Polyamide 12. Finally, a method of quickly and inexpensively
producing test specimens by casting instead of using SLS was developed and
experiments conducted to demonstrate the similarity in properties between cast and
SLS specimens.

II
This research has shown that adding cement to Polyamide 12 yields a composite
material that enables the production of sintered specimens with mechanical properties
that are superior to those of pure Polyamide 12 specimens. As cement is much
cheaper than Polyamide 12, the composite material is also obviously less expensive
than pure Polyamide 12.
III
Acknowledgements
I would like to express my sincere gratitude to Allah for giving me the opportunity to
complete the writing of this thesis. I am also grateful to my wife, Jawaher, my
daughter, Shekhah and my little son, Ahmed for their patience, giving me their love
and supporting that I needed.
I am heartily thankful to my supervisor Professor D T Pham (OBE), Director of
Manufacturing Engineering Centre (MEC), for his valued supervision, advice,
availability, support and encouragement enabled this thesis to be written and will
always be deeply appreciated.
To all colleagues and friends at the Mechanical and Manufacturing Engineering, I
would like to express my gratitude for their patience and continuous support. Special
thanks go to Dr. Shwe Soe, Dr. Sam Evans, Mr. Justin for their constant assistance
through technical help, endless discussion and unquestionable support. Also my
thanks go to Mr. Rod Bottom and Dr. Steve Holding.
Lastly, I also express my warmest appreciation to all of those who supported me in
any respect during the completion of the research.
IV
Declaration
This work has not previously been accepted in substance for any degree and is not
concurrently being submitted in candidature for any degree.
Signed:…………………… (Saleh Ahmed Aldahsh) Date :………………..
Statement 1
This thesis is being submitted in partial fulfilment of the requirements for the degree
of PhD.
Signed:…………………… (Saleh Ahmed Aldahsh) Date :………………..
Statement 2
This thesis is the result of my own independent work/investigation, except where
otherwise stated. Other sources are acknowledged by explicit references.
Signed:…………………… (Saleh Ahmed Aldahsh) Date :………………..
Statement 3
I hereby give consent for my thesis, if accepted, to be available for photocopying and
for inter-library loan and for the title and summary to be made available to outside
organisations.
Signed:…………………… (Saleh Ahmed Aldahsh) Date :………………..
V
Table of contents
Abstract ......................................................................................................................I
Acknowledgements ................................................................................................. III
Table of contents ...................................................................................................... V
List of figures .........................................................................................................XII
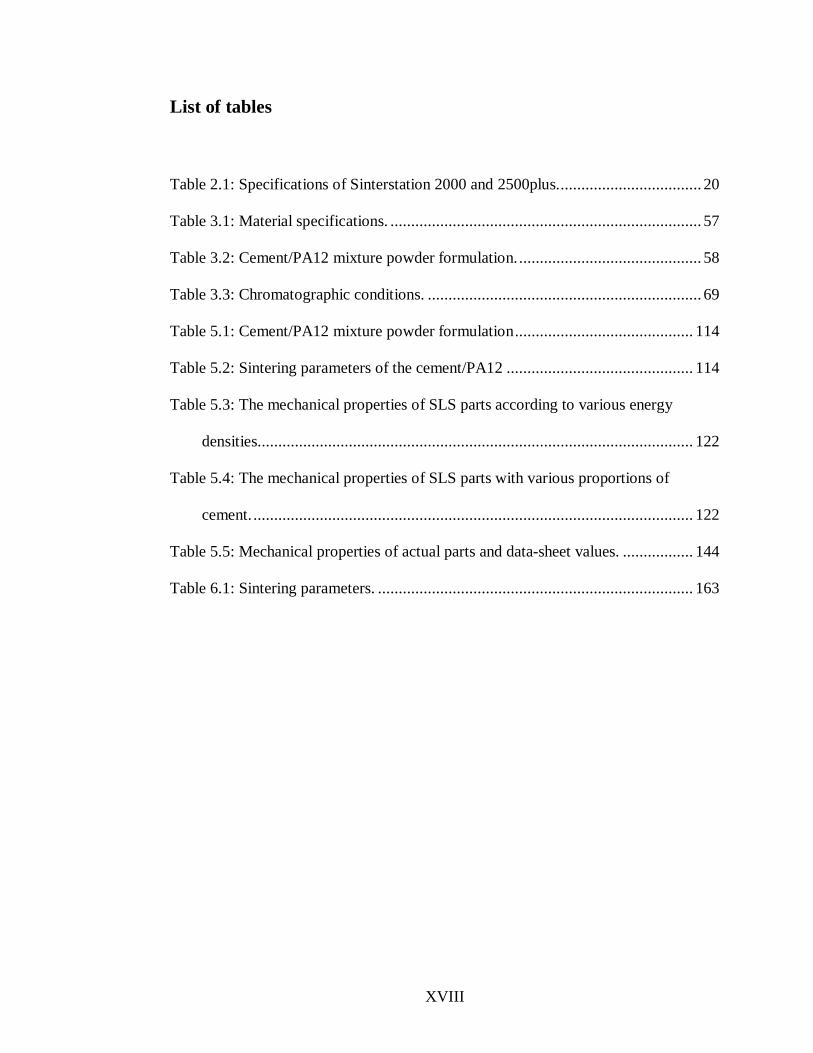
List of tables...................................................................................................... XVIII
Abbreviations ....................................................................................................... XIX
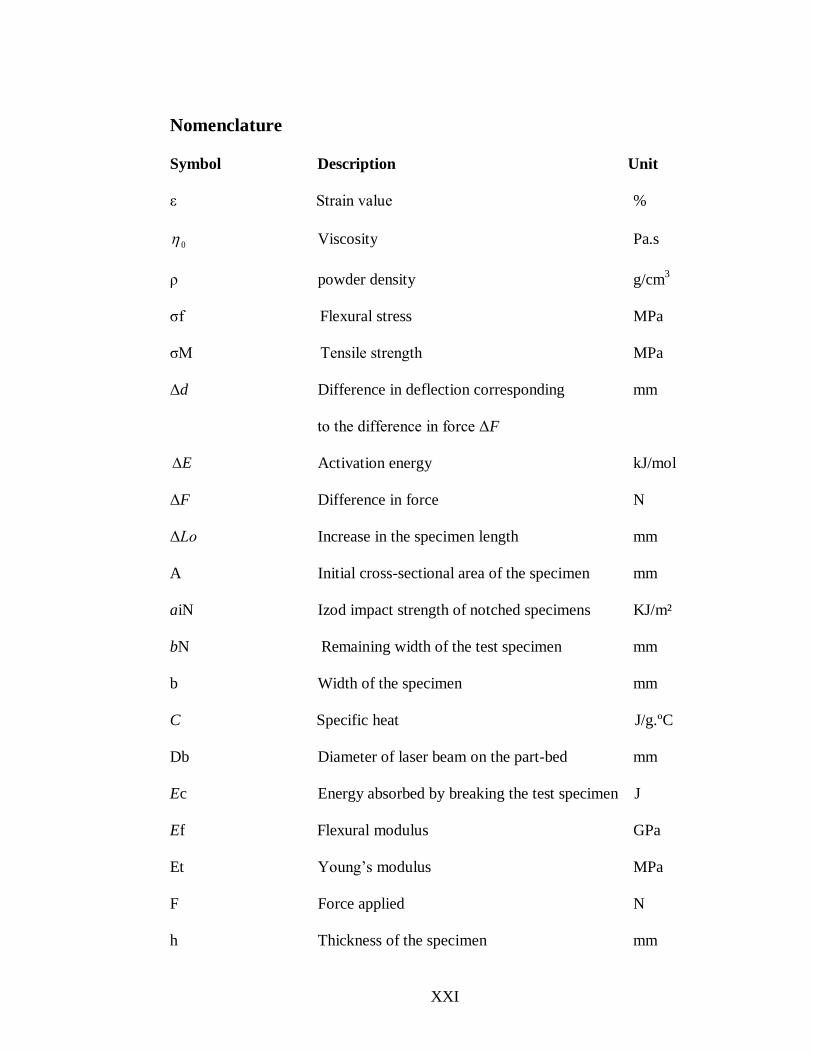
Nomenclature ....................................................................................................... XXI
Chapter 1 Introduction ............................................................................................... 1
1.1 Background ..................................................................................................... 1
1.2 Aim and objectives .......................................................................................... 3
1.3 Organisation of the thesis ................................................................................. 4
Chapter 2 Literature Review ...................................................................................... 7
2.1 Preliminaries ................................................................................................... 7
2.2 Classification of Common Rapid Prototyping Technologies .......................... 11
2.2.1 Laminated Object Manufacturing ............................................................ 11
2.2.2 Stereolithography (SLA) ......................................................................... 12
2.2.3 Fused Deposition Modelling ................................................................... 15
2.2.4 Three-Dimensional Printing .................................................................... 15
2.2.5 Selective Laser Sintering ......................................................................... 18
2.2.5.1 Common fabrication parameters ....................................................... 21
2.2.5.1.1 Fill-laser power ......................................................................... 21
2.2.5.1.2 Laser beam speed ...................................................................... 22

VI
2.2.5.1.3 Laser beam offset .................................................................... 23
2.2.5.1.4 Scan-spacing ........................................................................... 23
2.2.5.1.5 Scanning strategy .................................................................... 26
2.2.5.1.6 Energy density ........................................................................ 26
2.2.5.1.7 Slice thickness ........................................................................ 27
2.2.5.1.8 Heater control ......................................................................... 30
A. Warm-up stage ................................................................................ 30
B. Build stage ...................................................................................... 31
C. Cool-down stage .............................................................................. 32
2.2.5.2 Materials used in SLS and their applications .................................... 34
2.2.5.2.1 Polyamide 12............................................................................. 34
2.2.5.2.2 Metal ......................................................................................... 35
2.2.5.2.3 Polystyrene / CastForm ............................................................. 36
2.2.5.2.4 Polycarbonate (PC) .................................................................... 36
2.2.5.3 Common problems related to the SLS process .................................. 37
2.2.5.3.1 Powder fluff .............................................................................. 38
2.2.5.3.2 Cracking of part-bed and feed-cartridge ..................................... 38
2.2.5.3.3 Clumping .................................................................................. 40
2.2.5.3.4 Crystals and condensation ......................................................... 40
2.2.5.3.5 Bonus Z ..................................................................................... 42
2.2.5.3.6 Curling “in-build”...................................................................... 42
2.2.5.3.7 Curling “post-build” .................................................................. 45
2.2.5.3.8 Growth ...................................................................................... 45
VII
2.2.5.3.9 Missed-scan ............................................................................... 47
2.2.5.3.10 Weak parts/porosity ................................................................. 47
2.2.5.4 Previous studies of composite material used in SLS ......................... 49
2.2.5.4.1 Glass-filled polyamide 3200 ...................................................... 49
2.2.5.4.2 Aluminium-filled polyamide (Alumide™) ................................. 49
2.2.5.4.3 CarbonMide®-Carbon fibre-filled polyamide ............................. 50
2.2.5.4.4 Silicon carbide/polyamide ......................................................... 51
2.2.5.4.5 Copper polyamide (CuPA) ........................................................ 52
2.3 Summary ....................................................................................................... 53
Chapter 3 Experimental Techniques ........................................................................ 54
3.1 Preliminaries ................................................................................................. 54
3.2 Material Preparation ...................................................................................... 55
3.3 Equipment used for the preparation and production of specimens .................. 59
3.4 Equipment used for measurements of powder properties ................................ 63
3.4.1 Melt Flow Rate (MFR) ........................................................................... 63
3.4.2 Differential Scanning Calorimetry (DSC)................................................ 66
3.4.3 Gel Permeation Chromatography (GPC) ................................................. 68
3.5 Equipment used for measurements of mechanical properties .......................... 70
3.6 Summary ....................................................................................................... 71
Chapter 4 Thermal Properties of Cement and Polyamide 12 Composite in the
Selective Laser Sintering Process ............................................................................ 72
4.1 Preliminaries ................................................................................................. 72
4.2 Characterisation of composite material of cement and Polyamide 12 powder . 73

VIII
4.3 Thermal properties of the powder .................................................................. 76
4.3.1 Glass transition temperature Tg ............................................................... 78
4.3.2 Melting temperature Tm .......................................................................... 79
4.3.3 Crystallisation Temperature Tc ............................................................... 80
4.4 Molecular weight ........................................................................................... 83
4.5 Additives ....................................................................................................... 85
4.6 Experimental work ........................................................................................ 87
4.6.1 Methodology........................................................................................... 87
4.6.2 Results and discussion ............................................................................ 88
4.6.2.1 Effect of the cement proportion on viscosity, melt flow rate, thermal
behaviour and molecular weight of Polyamide 12 ........................................ 88
4.6.2.2 Effect of temperature and time on molecular weight ......................... 92
4.6.2.3 Effect of temperature and time on the viscosity and melt flow rate ... 94
4.6.2.4 Effect of continuous and cyclic heat on MFR and molecular weight . 97
4.6.2.5 Effect of temperature and time on Tg, Tm and Tc ............................. 99
4.7 Discussion ................................................................................................... 103
4.8 Summary ..................................................................................................... 105
Chapter 5 Mechanical Properties of Selective Laser Sintered ................................. 106
Cement and Polyamide 12 Composite ................................................................... 106
5.1 Preliminaries ............................................................................................... 106
5.2 Interaction between cement and Polyamide 12 particles and Polyamide 12
particles ............................................................................................................. 107
5.2.1 Interaction between cement and Polyamide 12 particles ........................ 107

IX
5.2.2 Interaction between Polyamide 12 particles themselves ......................... 110
5.3 Experimentation .......................................................................................... 113
5.3.1 Sample preparation ............................................................................... 113
5.3.2 Measurement and test specimens........................................................... 115
5.4 Results and discussion ................................................................................. 117
5.4.1 Sintering part dimensions and density ................................................... 117
5.4.2 Mechanical properties ........................................................................... 121
5.4.2.1 Tensile properties ........................................................................... 123
5.4.2.2 Young‟s modulus ........................................................................... 126
5.4.2.3 Elongation at break ........................................................................ 129
5.4.2.4 Flexural properties ......................................................................... 131
5.4.2.5 Compression properties .................................................................. 135
5.4.2.6 Impact properties............................................................................ 137
5.4.2.7 Effect of using un-sintered powder on the MFR and mechanical
properties. .................................................................................................. 139
5.4.2.8 Comparison of actual parts with data-sheet values .......................... 143
5.4.3 Morphology and microstructure ............................................................ 145
Chapter 6 Mechanical Properties of Cast Parts Cement and Polyamide 12 Composite
.............................................................................................................................. 151
6.1 Preliminaries ............................................................................................... 151
6.2 Casting Process............................................................................................ 152
6.3 Methodology ............................................................................................... 160
6.3.1 Sample preparation ............................................................................... 160

X
6.3.2 Casting experiments .............................................................................. 161
6.3.3 SLS experiments ................................................................................... 161
6.3.4 Measurement and test specimens........................................................... 162
6.4 Results and discussion ................................................................................. 164
6.4.1 Tensile strength ..................................................................................... 164
6.4.2 Elongation at break ............................................................................... 167
6.4.3 Young‟s modulus .................................................................................. 169
6.4.4 Flexural modulus .................................................................................. 171
6.4.5 Flexural yield strength .......................................................................... 173
6.4.6 Compressive strength ............................................................................ 175
6.5 Summary ..................................................................................................... 177
Chapter 7 Contributions, conclusions and future work ........................................... 178
7.1 Contributions ............................................................................................... 178
7.2 Conclusions ................................................................................................. 179
7.3 Future work ................................................................................................. 185
Appendix A Equations used to find the value of mechanical properties ................. 187
A.1 Flexural stress ............................................................................................. 188
A.2 Flexural modulus ........................................................................................ 188
A.3 Stress calculations of tensile and compressive ............................................. 188
A.4 Elongation .................................................................................................. 189
A.5 Izod impact strength of notched specimens ................................................. 189
Appendix B The history and manufacture of Portland cement ............................... 192
Appendix C Cost of materials ................................................................................ 195
XI
C.1 Effect of cement additive on the price of Polyamide 12. .......................... 196
C.2 Comparison of the cost between composite material of (cement/PA12) and
(GF) .............................................................................................................. 196
Appendix D Case study ......................................................................................... 199
D.1 Case study............................................................................................... 200
D.1 Case study............................................................................................... 200
References............................................................................................................. 202

XII
List of figures
Figure 2.1: Layer-by-Layer Production .................................................................... 10
Figure 2.2: Laminated Object Manufacturing Process .............................................. 14
Figure 2.3: Stereolithography Process...................................................................... 14
Figure 2.4: Fused Deposition Modelling Process. .................................................... 17
Figure 2.5: Three-Dimensional Printing Process. ..................................................... 17
Figure 2.6: Selective Laser Sintering. ...................................................................... 20
Figure 2.7: Changes in Laser-Spot Diameter............................................................ 25
Figure 2.8: Scan-Spacing. ........................................................................................ 25
Figure 2.9: Scanning Strategy. ................................................................................. 29
Figure 2.10: Stair-Step ............................................................................................ 29
Figure 2.11: Feed-Heater Set Point. ......................................................................... 33
Figure 2.12: Part-Heater Set Point. .......................................................................... 33
Figure 2.13: Schematic View of Powder Fluff. ........................................................ 39
Figure 2.14: Cracking Appears in Part-Bed and Feed-Cartridge. .............................. 39
Figure 2.15: Schematic View of Clumping. ............................................................. 41
Figure 2.16: Crystals and Condensation on the Lens of the IR and Laser ................. 41
Figure 2.17: Schematic View of Bonus Z ................................................................ 44
Figure 2.18: Schematic View of Curling “In-Build”. ............................................... 44
Figure 2.19: Schematic View of Curling “Post-Build”. ............................................ 46
Figure 2.20: Schematic View of „Growth‟ ............................................................... 46
Figure 2.21: Schematic View of a „Missed-Scan‟. ................................................... 48
Figure 2.22: Schematic View of „Weak Parts/Porosity‟ ........................................... 48
XIII
Figure 3.1: (SEM) Electron micrograph ................................................................... 57
Figure 3.2: (SEM) Electron micrograph scans of PA12 and cement. ........................ 58
Figure 3.3: Drum mixer BS 125............................................................................... 61
Figure 3.4: VORTI-SIV pilot RBF-15sifter ............................................................. 61
Figure 3.5: Optical microscope. ............................................................................... 61
Figure 3.6: Agar Auto Sputter Coater. ..................................................................... 61
Figure 3.7: Scanning Electron Microscope (SEM). .................................................. 61
Figure 3.8: DTM Sinterstation 2000 machine. ......................................................... 62
Figure 3.9: Oven Heraeus Instruments. .................................................................... 62
Figure 3.10: AGIECUT EXCELLENCE. ................................................................ 62
Figure 3.11: XYZ MACHINE TOOLS LIMITED. .................................................. 62
Figure 3.12: Melt flow rate indexer (MFR) equipment............................................. 65
Figure 3.13: DSC instrument. .................................................................................. 67
Figure 4.1: The molecular structure of a semi-crystalline polymer (Mangonon, 1999).
........................................................................................................................ 75
Figure 4.2: Characteristics that determine the application of thermoplastic polymers
........................................................................................................................ 77
Figure 4.3: Crystallisation temperature Tc with crystal growth rate ν for different ... 82
Figure 4.4: Relationship between molecular weight, Mw and viscosity, 0 .............. 84
Figure 4.5: Relative viscosity with volume fraction filler. ........................................ 86
Figure 4.6: Variation of viscosity with cement content added to Polyamide 12. ....... 90
Figure 4.7: Variation of MFR with cement content added to Polyamide 12. ............. 90
XIV
Figure 4.8:Variation of molecular weight with cement content added to Polyamide12.
........................................................................................................................ 91
Figure 4.9: Variation of Tg, Tm and Tc with cement content added to Polyamide 12.
........................................................................................................................ 91
Figure 4.10: Variation of molecular weight (Mw) of composite of cement/Polyamide
12 powder with different temperatures and timings. ......................................... 93
Figure 4.11: Relationship between molecular weight Mw and viscosity 0. ............. 95
Figure 4.12: Variation of viscosity of composite of cement/Polyamide 12 powder
with different temperatures and timings. .......................................................... 95
Figure 4.13: Variation of MFR of composite of cement/Polyamide 12 powder with
different temperatures and timings. .................................................................. 96
Figure 4.14: Effect of continuous and cyclic heat on Mw of composite of
cement/Polyamide 12 powder. ......................................................................... 98
Figure 4.15: Effect of continuous and cyclic heat on MFR of composite of
cement/Polyamide 12 powder. ......................................................................... 98
Figure 4.16: Effect of temperature and time on Tg of composite of cement/Polyamide
12 powder. ..................................................................................................... 101
Figure 4.17: Effect of temperature and time on Tm of composite of cement/Polyamide
12 powder. ..................................................................................................... 101
Figure 4.18: Effect of temperature and time on Tc of composite of cement/Polyamide
12 powder. ..................................................................................................... 102
Figure 5.1 illustrates the various states of the sintering process for SLS. ................ 109
Figure 5.2: Electron micrograph scans of the fracture surface of ............................ 109
XV
Figure 5.3: Schematic of bond between the particles occurs in X, Y and Z directions.
...................................................................................................................... 112
Figure 5.4: Building and dimensions of tensile test specimen. ............................... 116
Figure 5.5: Variation of length with energy density. .............................................. 119
Figure 5.6: Variation of width with energy density. ............................................... 119
Figure 5.7: Variation of thickness with energy density........................................... 120
Figure 5.8: Variation of density with energy density. ............................................. 120
Figure 5.9: Variation of tensile ultimate with energy density. ................................ 125
Figure 5.10: Variation of tensile ultimate with cement content............................... 125
Figure 5.11: Variation of Young‟s modulus with energy density............................ 128
Figure 5.12: Variation of Young‟s modulus with cement content. .......................... 128
Figure 5.13: Variation of elongation at break in relation to energy density. ............ 130
Figure 5.14: Variation of elongation at break in relation to cement content. ........... 130
Figure 5.15: Variation of flexural modulus with energy density. ............................ 133
Figure 5.16: Variation of flexural yield strength with energy density. .................... 133
Figure 5.17: Variation of flexural modulus with cement content. ........................... 134
Figure 5.18: Variation of flexural yield strength with cement content. ................... 134
Figure 5.19: Variation of compression strength with energy density. ..................... 136
Figure 5.20: Variation of compression strength with cement content. .................... 136
Figure 5.21: Variation of impact strength with energy density. .............................. 138
Figure 5.22: Variation of impact strength with cement content. ............................. 138
Figure 5.23: Variation of MFR of composite of cement/Polyamide 12 powder with
...................................................................................................................... 141
XVI
Figure 5.24: Variation of tensile strength of composite of cement/Polyamide 12 ... 141
Figure 5.25: Variation of compressive strength of composite of cement/Polyamide142
Figure 5.26: Surface image sintered specimens built at energy densities of ............ 146
Figure 5.27: Fracture surface image sintered specimens built at energy densities of
...................................................................................................................... 148
Figure 6.1: Three sphere sintering model (A) original point contacts; (B) neck
growth, (C), and (D) pore rounding. ............................................................... 155
Figure 6.2: Photomicrographic illustration of change from interconnected to isolated
porosity, (A) early phase with interconnected porosity; (B) later phase with
closed porosity. .......................................................................................... 156
Figure 6.3: Schematic illustration of the casting structure. ..................................... 159
Figure 6.4: Die for the production of cast specimens. ............................................ 163
Figure 6.5: Variation in tensile ultimate with cement content for different methods
(SLS; casting). ............................................................................................... 166
Figure 6.6: Correlation between the result of the cast and SLS specimens for tensile
ultimate. ........................................................................................................ 166
Figure 6.7: Variation of elongation at break with cement content for different
methods (SLS; casting). ................................................................................. 168
Figure 6.8: Correlation between results of the cast and SLS specimens for elongation
at break. ......................................................................................................... 168
Figure 6.9: Variation of Young‟s modulus with cement content for different methods
(SLS; casting). ............................................................................................... 170
Figure 6.10: Correlation between the results of the cast and SLS specimens for
Young‟s modulus........................................................................................... 170
XVII
Figure 6.11: Variation of flexural modulus with cement content for different methods
(SLS; casting). ............................................................................................... 172
Figure 6.12: Correlation between the results of the cast and SLS specimens for
flexural modulus. ........................................................................................... 172
Figure 6.13: Variation of flexural yield strength with cement content for different
methods (SLS; casting). ................................................................................. 174
Figure 6.14: Correlation between the results of the cast and SLS specimens for
flexural yield strength. ................................................................................... 174
Figure 6.15: Variation of compression strength with cement content for different
methods (SLS; casting). ................................................................................. 176
Figure 6.16: Correlation between the results for cast and SLS specimens in terms of
compression strength. .................................................................................... 176
Figure A.1: Stress / Strain curves (a) Curve of brittle materials (b) Curve of tough
materials with yield point (d) Curve of tough materials without yield point.... 191
Figure C 1: Effect of cement filler and Polyamide 12 on relative cost. ................... 198
Figure C 2: Comparison of the cost of composite material of cement & PA12 and GF.
...................................................................................................................... 198
Figure D 1: Illustration of a garlic crusher made of composite material of cement
filler with Polyamide 12 (A): 30% cement filler (B) 35% cement filler (D) 40%
cement filler. ................................................................................................. 201
XVIII
List of tables
Table 2.1: Specifications of Sinterstation 2000 and 2500plus................................... 20
Table 3.1: Material specifications. ........................................................................... 57
Table 3.2: Cement/PA12 mixture powder formulation. ............................................ 58
Table 3.3: Chromatographic conditions. .................................................................. 69
Table 5.1: Cement/PA12 mixture powder formulation ........................................... 114
Table 5.2: Sintering parameters of the cement/PA12 ............................................. 114
Table 5.3: The mechanical properties of SLS parts according to various energy
densities......................................................................................................... 122
Table 5.4: The mechanical properties of SLS parts with various proportions of
cement. .......................................................................................................... 122
Table 5.5: Mechanical properties of actual parts and data-sheet values. ................. 144
Table 6.1: Sintering parameters. ............................................................................ 163

XIX
Abbreviations
ABS Acrylonitrile butadiene styrene
AL2O3 Aluminum Oxide
CAD Computer aided design
CaO Calcium Oxide
CCD Charge Coupled Device
CRT Cathode Ray Tube
CSA Cross Sectional Area
CuPA Copper Polyamide
DSLS Direct Selective Laser Sintering
Dp Penetration Depth
3DP Three-Dimensional Printing
DSC Differential scanning calorimetry
3D Three dimensions
EOS Electro Optical Systems
FDM Fused Deposition Modelling
Fe2O3 Iron Oxide
GF Glass filled
GPC Gel permeation chromatography
IR Sensor
ISO International Organization for Standards
LOM Laminated Object Manufacturing

XX
LS Laser Sintering
MFR Melt flow rate
PA12 Polyamide 12
PC Polycarbonate
PP Polypropylene
PE Polyethylene
RM Rapid manufacturing
RP Rapid prototyping
RT Rapid tooling
RW Road Width
SEM Scanning electron microscope
SiC Silicon Carbide
SiO2 Silicon Dioxide
SLA Stereolithography
SLS Selective Laser Sintering
STL Stereolithography Interface Format
UTS Ultimate Tensile Strength
UV Ultraviolet
WT Weight Fractions
XXI
Nomenclature
Symbol Description Unit
ε Strain value %
0 Viscosity Pa.s
ρ powder density g/cm3
ζf Flexural stress MPa
ζM Tensile strength MPa
Δd Difference in deflection corresponding mm
to the difference in force ΔF
E Activation energy kJ/mol
ΔF Difference in force N
ΔLο Increase in the specimen length mm
A Initial cross-sectional area of the specimen mm
aiN Izod impact strength of notched specimens KJ/m²
bN Remaining width of the test specimen mm
b Width of the specimen mm
C Specific heat J/g.ºC
Db Diameter of laser beam on the part-bed mm
Ec Energy absorbed by breaking the test specimen J
Ef Flexural modulus GPa
Et Young‟s modulus MPa
F Force applied N
h Thickness of the specimen mm

XXII
lf Latent melting heat J/kg
Lο Length of the test specimen mm
Lp Laser powder Watt
Ls Laser speed mm/sec
L Span of two points mm
Mw Average molecular weight g/mol
R Gas constants J/ mol.K
r Radius of the particles m
Scsp Scan spacing mm
Tb Part bed temperature ºC
Tc Crystalline temperature ºC
Tg Glass transition temperature ºC
Tm Melting temperature ºC
T Absolute temperature Kelvin
ν Growth rate µm/min
x Size of neck growth m
Chapter 1 Introduction
1
Chapter 1
Introduction
1.1 Background
One of the most common rapid prototyping (RP) techniques in existence is selective
laser sintering (SLS) which is capable of producing very complex part-geometry
directly from three-dimensional CAD software. SLS employs powder-processing in
the construction of parts. Sintered parts are fabricated when the surface tension of
particles is overcome in the heat of an infrared laser beam and they subsequently fuse
together. The powder is supplied by two feed-cartridges which distribute a thin layer
of powder over the build-area with a rotating roller, so that the next layer of powder
may be added. The process continues in this way until the part is completed.
One of the main advantages of the SLS process is that numerous materials and
indeed, any material that can be triturated, may be used in the SLS process via a low
melting temperature binder such as a polymer, for a high melting point phase in order
to produce a geometrically accurate sintered part (Vail et al., 1996; Hon & Gill,
2003). The flexibility of material and shape which SLS technology produces

Chapter 1 Introduction
2
potentially has practical and effective applications in specific areas (Maeda & Childs,
2004).
One of the key factors which make thermoplastics attractive for engineering
applications is the possibility of property enhancement through reinforcement.
Composites produced through additive reinforcement have enabled thermoplastics to
satisfactorily meet demands in the aerospace and automobile industries (Crawford,
1987). Thermoplastics such as Polyamide 12 (PA12) have been developed as SLS
materials for various applications.
However, the purpose of the work presented in this thesis concerns the relatively low
strength and high price of Polyamide 12. The focus of the research is to create new
composite material from cement additive with Polyamide 12 so as to reduce cost, as
well as to considerably improve the mechanical properties of the sintered specimen.
The addition of rigid particles to polymers can produce a number of attractive effects
in the mechanical properties of specimens, such as increased flexural strength,
compression, hardness, rigidity, improvement in fracture toughness, creep resistance
and, in some cases, tensile strength, while impact strength is decreased with
increasing filler (Kohan, 1995; Gill & Hon, 2004).

Chapter 1 Introduction
3
1.2 Aim and objectives
The aim of this research was to test the hypothesis that adding cement to Polyamide
12 yields a composite material enabling the production of sintered parts with
mechanical properties that are superior to those made from pure Polyamide 12. As
cement is much cheaper than Polyamide 12, naturally, the composite material will be
less expensive than pure Polyamide 12.
The objectives of the research are:
To investigate the properties of Polyamide 12 powder and cement powder in
varying proportions, as the new composite powder material is based on SLS.
To expand a methodology for controlling SLS parameters, in order to obtain
consistent and good quality fabricated SLS specimens.
To obtain homogeneous powder mixtures which offer consistency in density
and the mechanical properties of the sintered parts, by developing a
methodology for controlling the mixture of composite powder material.
To develop a casting method to produce specimens with properties similar to
those of SLS parts in the same material, in order to reduce the time and
quantities of material involved when testing new materials.
To study how cement powder influences mechanical properties of sintered
components when added to Polyamide 12.
Chapter 1 Introduction
4
To improve the mechanical properties of functional parts by increasing the
proportion of cement.
The research mainly involved experimentation with composite material having
different proportions of additive to Polyamide 12. Tests were also carried out to
determine the mechanical properties of specimens produced using the new composite
material.
1.3 Organisation of the thesis
Chapter 2 reviews common rapid prototyping processes with emphasis on a
description of Selective Laser Sintering (SLS) technology which is considered one of
the more common rapid prototyping techniques. During the SLS process, the main
fabrication parameters which influence the quality of sintered parts are described.
Some of the common materials used to produce RM and RP parts by SLS are
presented. The problems found in parts produced through the sintering process are
mentioned in this chapter. Additionally, some previous studies of composite materials
used in SLS are reviewed. In Chapter 3, the experimental procedure, equipment and
measurements used to characterise the behaviour of composite material as powder
and sintered specimens are introduced. Additionally, the composite material used in
this thesis is described. The composite material used in this work comprises cement
additives with Polyamide 12.
Chapter 1 Introduction
5
Chapter 4 This chapter discusses the properties of cement and Polyamide 12
composite, as well as the thermal behaviour, melt flow rate, and molecular weight of
this material. This chapter focuses on understanding the thermal properties of
different proportions of composite material of cement and PA12 to determine the
optimum parameters of the SLS process. In addition, the thermal and physical of used
or un-sintered powder are studied to develop a methodology for controlling SLS
parameters, and consequently to obtain consistent and good quality in fabricated SLS
specimens.
Chapter 5 discusses the interactions between cement and Polyamide 12 particles and
between Polyamide 12 themselves. It describes an experimental study of tensile,
Young's modulus, flexural, compression, impact and density specimens, in order to
determine the effects of varying energy density and varying proportions of composite
material of cement additive with Polyamide 12 on the density and mechanical
properties of sintered specimens. The effect of using un-sintered powder on MFR and
mechanical properties is investigated to determine the validity of the powder. In
addition, it compares the mechanical properties of actual parts produced using SLS
with data-sheet values for PA12 material so as to generate confidence in the
measured mechanical properties. Furthermore, it explains the effects of various
energy densities on composite material properties by examining the physical
construction of the specimens presented. The optimum energy density for producing
parts with maximum density, strength and stiffness has been determined in this
chapter.

Chapter 1 Introduction
6
Chapter 6 presents a method of casting to produce parts with similar mechanical
properties to those of components fabricated by SLS. Tensile, Young's modulus,
flexural and compression strength measurements used in the casting method to assess
the effect of varying proportions of composite material of cement additive with
Polyamide 12 on the mechanical properties of specimens. The mechanical properties
of parts produced using casting are compared with those of parts created in SLS using
the same materials. The main purpose of this chapter is to investigate whether or not a
correlation can be made between the mechanical properties of parts produced via
casting methods and those manufactured through SLS.
Finally, chapter 7 concludes the thesis by summarising the contributions and findings
of the research and proposing areas for further study.
Chapter 2 Literature review
7
Chapter 2
Literature Review
2.1 Preliminaries
Rapid prototyping (RP) methods denote a family of technologies capable of
producing very complex part-geometry directly from three-dimensional CAD
software, using a swift, highly automated and flexible manufacturing procedure (Kai
& Fai, 1997; Pham & Dimov, 2000; Cooper, 2001). These technologies are also
known as „Solid Freeform Fabrication‟, „Layer Manufacturing‟ and „Computer
Automated Manufacturing‟ (Beaman et al., 1997; Ilkgun, 2005).
RP systems operate on the principle of layer-by-layer construction (see Figure 2.1).
Through a computer interface, the system receives the STL (Standard Triangulation
Language) model CAD data relating to the object to be produced. The STL file is
very simple as it consists solely of a list of planar triangles: a wide range of input in
any 3D geometric form can be converted to a triangulated model due to the broad
applicability of available-surface triangulation algorithms (Kumar & Dutta, 1997).
The STL model is sliced virtually into thin even layers by software inside the RP
Chapter 2 Literature review
8
system. The model is then reconstructed physically layer by layer, with each layer
being fused to the previous one gradually to generate an object.
These RP technologies have a broad range of applications in different fields,
including aerospace, electronics and biomedical engineering. Consequently, they
offer a unique and versatile process (Pham & Dimov, 2003; Salmoria et al., 2007).
RP processes differ from conventional manufacturing processes in that production
time is shorter when using the former and a wide range of materials can be used to a
high degree of accuracy due to the additive, layered nature of RP. This enables
objects with complicated internal features to be created, which conventional
machinery cannot manufacture directly. In addition, RP builds parts by adding
material layer-by-layer, thus avoiding tooling, reorientation and fixturing problems.
When the bottom layer is attached to a platform, the part is produced without any
reorientation or refixturing needed during manufacture. In contrast to this, traditional
machining methods involve the removal of unwanted material from a solid block.
Generally, a complex object built using traditional machining requires that complex
tooling and tool-path planning be designed and constructed in advance. Furthermore,
difficult fixturing techniques and reorientation of complex objects are necessary
during the fabrication process. In addition to prototypes, however, RP techniques can
also be utilised in tool-making (referred to as „rapid tooling‟) and even in the
manufacture of certain production-quality parts (rapid manufacturing) (King &
Tansey 2003; Ilkgun, 2005).
Chapter 2 Literature review
9
A large numbers of rapid prototyping techniques exists, but only a few of them are
widely used and predominant in the market (Pham & Gault, 1998). In the following
sections, the following most common processes are presented:
Laminated Object Manufacturing (LOM)
Stereolithography (SLA)
Fused Deposition Modelling (FDM)
Three-Dimensional Printing (3DP)
Selective Laser Sintering (SLS)
Each of these technologies is explained with a brief description and an outline of their
building strategies. This current study focuses on SLS technology. In this process, a
wide variety of materials can be used to build parts, and so it has an advantage over
some of the other RP processes. A number of these materials and their applications
are presented in this study. Furthermore, some of the problems found in parts
produced through SLS are mentioned, and finally, a description of previous studies of
composite material used in SLS is given.

Chapter 2 Literature review
10
Figure 2.1: Layer-by-Layer Production (Ilkgun, 2005).

Chapter 2 Literature review
11
2.2 Classification of Common Rapid Prototyping Technologies
In the following sections, common rapid prototyping (RP) processes are classified. In
addition, a brief description of each, together with their building approaches and the
major advantages and disadvantages of these approaches, are also presented.
2.2.1 Laminated Object Manufacturing
Laminated Object Manufacturing (LOM) is one of the RP techniques that mainly
adopt the process of „laminated forming‟. Thin layers of laminate are used to produce
parts during this process. The materials used are paper, plastic, ceramic and
composites: the most common material being paper. Layers are bonded by coating
the sheets with heat sensitive adhesives, allowing layer-by-layer bonding through hot
roller compression.
As illustrated in Figure 2.2, the sheets of material are supplied and fed from a
material-supply roll and transferred to a take-up roll located in a facing position. The
contours of each layer are cut with a CO2 laser controlled by a CAD system. A laser
beam is carefully modulated to penetrate precisely to the depth of one layer. Any
material that is not part of the specimen is trimmed into a rectangular shape by the
laser to facilitate its removal when fabrication of the part is later completed. The
rectangular shape remains in place as an external support during the building process.

Chapter 2 Literature review
12
The LOM process generally has advantages over other RP technologies. For example,
the part does not require a support structure as it is supported by its own material. It is
also simple to use and poses no environmental concerns. Furthermore, it prevents
distortion, shrinkage and deformation due to the very low levels of internal tension
within LOM parts. In contrast however, a high level of effort is applied to decubing,
finishing and sealing parts. Papers are easily peeled off at the adhesion layer and
bubbles can appear between layers. The part can either be burnt due to overheating,
or be subject to integration failure due to insufficient heat. The control of parts'
accuracy in the Z-dimension is relatively complicated for paper LOM parts, due to a
swelling effect („Z growth'). Remains of material supporting the part are scrapped
after building and the cost of such waste can be significant (Mueller & Kochan, 1999;
Pham & Dimov, 2003).
2.2.2 Stereolithography (SLA)
Parts built using SLA are based on a photosensitive liquid resin which forms a solid
polymer when exposed to ultraviolet (UV) light. SLA systems consist of a build-
platform positioned inside a vat of resin and an ultraviolet laser. The first position of
the platform is on top of the surface of the resin, before being lowered to the planned
thickness of the first layer of the part, where it is imaged on the resin surface by the
laser using information obtained from the three-dimensional solid CAD model. Once
an ultraviolet laser has drawn the layer structure on the surface of the resin, the
scanned resin is allowed to polymerise and solidify. The next layer is then scanned so
Chapter 2 Literature review
13
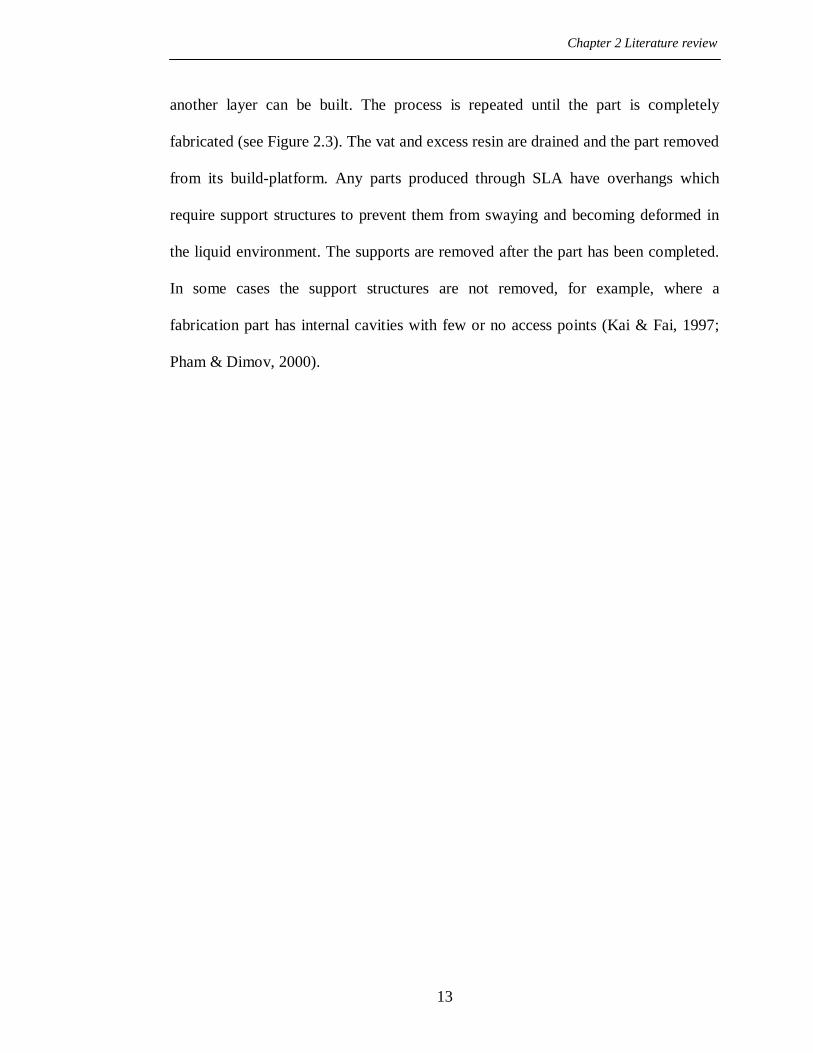
another layer can be built. The process is repeated until the part is completely
fabricated (see Figure 2.3). The vat and excess resin are drained and the part removed
from its build-platform. Any parts produced through SLA have overhangs which
require support structures to prevent them from swaying and becoming deformed in
the liquid environment. The supports are removed after the part has been completed.
In some cases the support structures are not removed, for example, where a
fabrication part has internal cavities with few or no access points (Kai & Fai, 1997;
Pham & Dimov, 2000).

Chapter 2 Literature review
14
Figure 2.2: Laminated Object Manufacturing Process (Liao, et al., 2005).
Figure 2.3: Stereolithography Process (Kietzman, 1999).

Chapter 2 Literature review
15
2.2.3 Fused Deposition Modelling
Fused Deposition Modelling (FDM) requires a nozzle tip to build the part and a base
platform for support and building. The material which is used in this process is
thermoplastic filament or wax. The filament material is fed by a temperature-
controlled extruder to force out and deposit the material onto a platform in a layer-by-
layer process, as shown in Figure 2.4. Once the first layer is finished, the base
platform is lowered and the next layer is deposited. Each added layer bonds to the
previous one as a result of thermal fusion. Consequently, the building process needs
to be maintained at a temperature just below solidification point to ensure proper
adhesion between subsequently added layers. The designed object is fabricated as a
three-dimensional part from computer-generated solid or surface models, as in a
typical RP process based exclusively on the precise deposition of thin layers of
extrudate. In this process, the road width (RW) is controlled by flow parameters at a
temperature set above the melting-point of the thermoplastic material and also by the
precise dimensions of the nozzle tip used (Jamal, 2001; Castle, 2008).
2.2.4 Three-Dimensional Printing
Three Dimensional Printing (3DP) is one of the rapid prototype techniques which
employ powder-processing in the construction of parts. In this process, many types of
powder can be used, including metals, ceramics and polymers. The 3DP machine
consists of a print-head which has X–Y axes suspended over a vertical piston plate,

Chapter 2 Literature review
16
providing control over three directions of motion as shown in Figure 2.5. A thin layer
of powder is spread onto a piston plate and levelled by a roller controlled by a CAD
system. Binding material is passed through a nozzle affixed to the fast-axis carriage
with a back and forth motion over the powder-bed, in order to selectively print
droplets which bind the powder particles together. The piston plate lowers the piece
of work and the roller spreads the next layer of powder. The process is repeated until
the part is completed. A schematic of the process is shown in Figure 2.5. Once
building is complete, excess powder which has been supporting the model is removed
to reveal the fabricated part. Any possible overhangs in the part therefore do not
require the design and fabrication of support structures (Kai & Fai, 1997; Katstra et
al., 2000 ).

Chapter 2 Literature review
17
Figure 2.4: Fused Deposition Modelling Process (Castle, 2008).
Figure 2.5: Three-Dimensional Printing Process (Xpress 3D, 2005).
Chapter 2 Literature review
18
2.2.5 Selective Laser Sintering
Selective Laser Sintering (SLS) is one of the more common rapid prototype
techniques. It was developed and originally patented by the University of Texas,
Austin, and was licensed to the DTM Corporation. DTM introduced the first
commercially available system in 1992, and the latest SLS system by DTM is the
Sinterstation 2500 Plus (Kai & Fai, 1997; Pham & Dimov, 2000). A summary of
specifications for Sinterstation 2500 Plus and Sinterstation 2000 is given in Table 2.1.
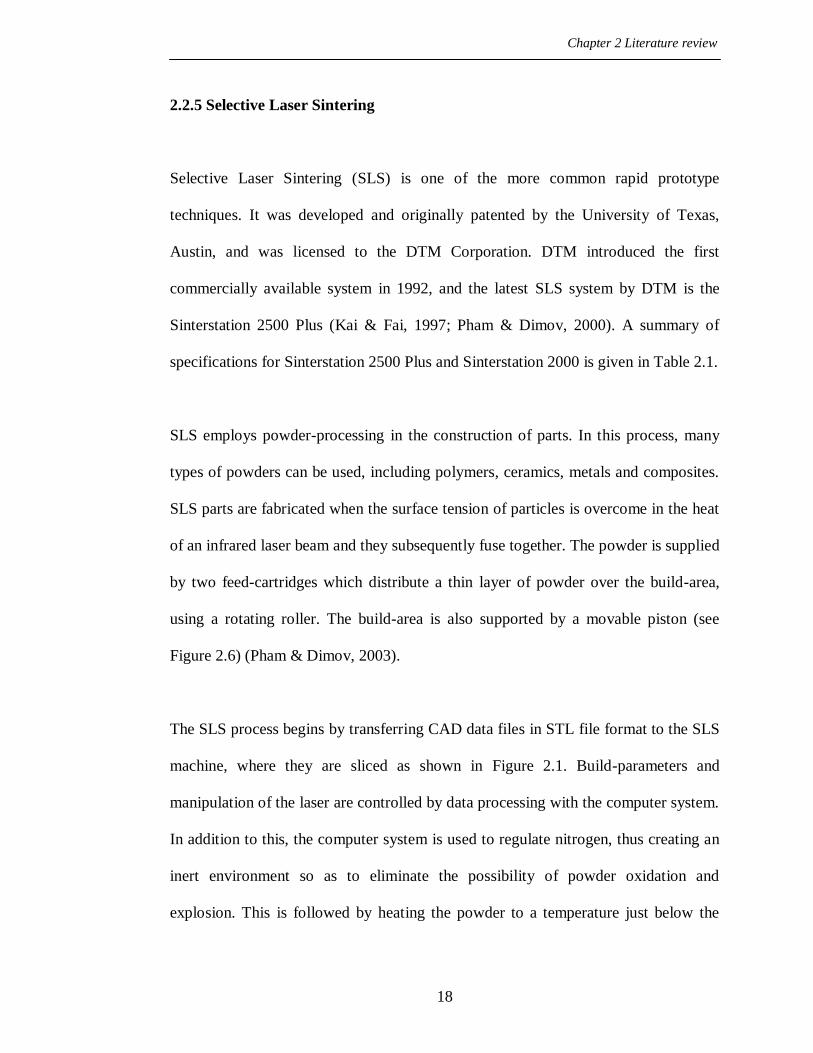
SLS employs powder-processing in the construction of parts. In this process, many
types of powders can be used, including polymers, ceramics, metals and composites.
SLS parts are fabricated when the surface tension of particles is overcome in the heat
of an infrared laser beam and they subsequently fuse together. The powder is supplied
by two feed-cartridges which distribute a thin layer of powder over the build-area,
using a rotating roller. The build-area is also supported by a movable piston (see
Figure 2.6) (Pham & Dimov, 2003).
The SLS process begins by transferring CAD data files in STL file format to the SLS
machine, where they are sliced as shown in Figure 2.1. Build-parameters and
manipulation of the laser are controlled by data processing with the computer system.
In addition to this, the computer system is used to regulate nitrogen, thus creating an
inert environment so as to eliminate the possibility of powder oxidation and
explosion. This is followed by heating the powder to a temperature just below the

Chapter 2 Literature review
19
melting-point of the material concerned, using a heater located above the part-bed.
This minimises thermal distortion, reduces heat stress to the lowest possible degree
and prevents the fabricated part from warping. In this way, fusion to the previous
layer is also facilitated. The temperature of the powder feed-cartridges is controlled to
allow powder to be transferred freely by a rotating roller. A very thin layer (between
100 μm to 125μm) is spread by the roller across the part during the build process. The
transverse speed of the roller is an adjustable machine parameter (Kumar & Dutta,
1997; Yusoff, 2007).
The SLS machine uses a CO2 laser with a capacity of up to 50 watts (Kai & Fai,
1997). The laser beam is guided by two mirrors onto the surface of the powder build-
area, thereby enabling it to scan specific areas of powder corresponding to a
particular slice of the object‟s design geometry (see Figure 2.6). The interaction of
the laser beam with the powder fuses the powder particles to produce the first layer of
LS parts (Neal, 1994; Yusoff, 2007). The part-build cylinder lowers slightly and one
of the feed-cartridges rises so that the next layer of powder may be added. The
process continues in this way until the part is completed. The sintered powder forms
the part while the un-sintered powder remains in the part-build during fabrication,
surrounding the sintered powder as a support.

Chapter 2 Literature review
20
Table 2.1: Specifications of Sinterstation 2000 and 2500plus.
Model Sinterstation 2000 System Sinterstation 2500plus System
Process Selective Laser Sintering Selective Laser Sintering
Laser type CO2 CO2
Laser power (W) 50 50
Spot size (mm) 0.4 0.42
Scan speed (mm/s) 914 5000
Work volume (mm) 300 Ø × 380 Z 381w × 330d × 457h
Computer system Pentium-based; Unix System Pentium-based controller
Power supply 240 VAC, single phase 240 VAC, 3-phase
Figure 2.6: Selective Laser Sintering (Pham & Dimov, 2003).
Chapter 2 Literature review
21
2.2.5.1 Common fabrication parameters
The SLS process has many fabrication parameters which influence the quality of
sintered parts, such as geometric problems, or mechanical and physical properties.
These parameters are set differently according to powder properties and the
requirements of the application (Gibson & Shi, 1997). Consequently, the default
values for all process parameters based on the material used in the process have been
specified by SLS manufacturers as DTM and EOS. In the following section, the most
common fabrication parameters are described.
2.2.5.1.1 Fill-laser power
Fill-laser power takes into account an important SLS parameter available to the CO2
laser beam at the part-bed surface. The input value of fill-laser power depends on the
type of material and thickness of the layer relevant to the part being built (Ilkgun,
2005). This parameter should be set to ensure that the powder at part-bed surface is
heated to a temperature close to its melting-point in order to allow bonding between
adjacent powder particles. To determine the optimum laser power for the material
used in SLS, test parts are fabricated using various levels of laser power (Gibson &
Shi, 1997; Jamal, 2001). Relatively low laser power is used to sinter the powder in
each successive cross-section of the part, because the part-bed temperature is close to
the melting-point of the material. Excessive laser power energy will cause large
thermal penetration into the powder and will consequently affect powder beyond the

Chapter 2 Literature review
22
cross-section of the part, thus causing growth. Conversely, insufficient laser energy
will not fuse the part completely, therefore resulting in porous and weak parts (DTM,
1997). Fill-laser power (P) can be calculated approximately using the following
equation:
BS* p * Db * h * [ C * (Tm - Tb) + lf ]
P = (Eq.2.1)
(1 - R)
where BS represents laser beam speed; p is powder density; Db is the diameter of the
laser beam on the part-bed; h is slice thickness; C is specific heat; Tm is melting
temperature; Tb is part-bed temperature; lf is latent melting heat, and R is reflectivity,
i.e. the refraction of laser light by the powder (Gibson & Shi, 1997).
2.2.5.1.2 Laser beam speed
Laser beam speed is the scan-speed of laser movement across the surface of the part
on the part-bed powder as it fuses the powder particles together. The laser speed for
most part-builds is very fast e.g. between 1m/s to 5m/s, and so, cross-sections of a
large fabricated part can be scanned in seconds (Kai & Fai, 1997; Pham & Dimov,
2000). Laser speed depends on other parameters such as laser-power and scan-
spacing to produce parts with a superior energy density, as shown in Equations 2-3,
leading to low porosity, good surface finish and good mechanical properties.

Chapter 2 Literature review
23
2.2.5.1.3 Laser beam offset
Laser beam-offset is an important parameter affecting the accuracy of SLS parts.
Beam-offset comprises laser-spot diameter, the area of the powder surface affected by
heat and the deflection angle through the laser scan. The dimensions of the laser-spot
diameter change at different points on the surface of the powder, depending on the
deflection angle of the laser beam from the scanning mirror (Wang, 1999; Jamal,
2001). As shown in Figure 2.7, when α = 0, the laser-spot has the smallest diameter
(D), and therefore the laser-spot can focus most effectively on the scan surface. When
α > 0, the diameter of the laser-spot on the scan surface is D' = D/cos α. A difference
of D' and D is articulated as:
δ = D ( 1) (Eq.2.2)
D, however, increases in direct proportion to α but the increase in diameter is not
expected to be significant (approximately 5.4% at the maximum value of α 19˚ and D
= 0.42mm). The effect of this increase is therefore usually ignored.
2.2.5.1.4 Scan-spacing
Scan-spacing is described in Figure 2.8, where laser-path movement during scanning
is shown. Scan-spacing is the distance between two neighbouring, parallel, scanned
vectors. The scan-spacing distance must be smaller than the effective diameter of the
cos α
1

Chapter 2 Literature review
24
laser beam during scanning, otherwise adjacent scanned paths may not be bonded
properly together and the part will be very fragile. By contrast, if the scan-spacing
distance is too small, the surface of the part may be uneven (Ilkgun, 2005).

Chapter 2 Literature review
25
Figure 2.7: Changes in Laser-Spot Diameter (Wang, 1999).
Figure 2.8: Scan-Spacing (Ilkgun, 2005).

Chapter 2 Literature review
26
2.2.5.1.5 Scanning strategy
The scanning strategy of the laser beam for building a layer is controlled by a
machine operator which may be „fill-only‟ - a strategy which can produce the part
faster but less accurately, or a strategy which both „fills and outlines‟ to produce a
part more slowly but with greater accuracy. These two strategies are shown in Figure
2.9. The laser scan proceeds through a „fill‟ or a „fill and outline‟ procedure,
depending on the slice (layer) geometry obtained from the STL file (Ilkgun, 2005).
2.2.5.1.6 Energy density
Energy density is energy transferred to the surface of the part-bed. Laser power, scan-
spacing and laser-scanning speed are considered to be relatively more effective here
as regards energy density, than they are in other processes. To produce high-quality
functional SLS parts, it is important that the powder on the surface of the part-bed
receives a sufficient amount of energy density through the laser sintering process.
Energy density can be calculated using the following equation:
ED = (Eq.2.3)
P
LS * SCSP

Chapter 2 Literature review
27
Here, P represents the level of laser power during scanning exposure, SCSP refers to
the scan-spacing and LS, to laser speed during scanning exposure. The high energy
density of a laser beam, however, results in better fusion of polymer particles,
consequently resulting in decreased porosity and enabling a more compact structure
to be built. Excessively high energy density will produce degradation of the polymer,
hard part-cake, difficulty in taking parts out of the build, rough texture, and a light
brown colour on the surface of the part due to overheating. On the other hand, at low
energy density levels, the part is likely to have insufficient bonding between powder
particles and subsequently higher porosity resulting in weakness (Caulfield et al.,
2007).
2.2.5.1.7 Slice thickness
Slice thickness is the powder thickness of each layer in the part-cylinder, determined
by the depth to which the part piston lowers for each layer and the level at which the
roller-counter rotates from one of the feed-cartridges onto the part-bed. Slice
thickness is considered to be an important factor, influencing both the building time
of the SLS process and surface roughness. The production of parts using thinner
slices can decrease surface roughness but the build takes more time. Although thicker
slices can save time, however, they may reduce the dimensional accuracy of
fabricated parts with a stair-step effect, as shown schematically in Figure 2.10. In the
Sinterstation 2000 process, slice thicknesses range from 0.07mm to 0.5mm and the
default setting is 0.1mm (Gibson & Shi, 1997; Jamal, 2001). Roller-counter rotations
Chapter 2 Literature review
28
may affect slice-thickness i.e. high rotation speeds may result in powder being pushed
in front of the roller. Setting roller speeds too low, however, increases processing
time.
During SLS, the greatest slice thickness is limited by the penetration depth (Dp) of
the powder. Consequently, penetration depth (Dp) depends on laser power, energy
density, particle size, powder density, specific heat and thermal conductivity. A
suitable slice thickness of the powder should therefore be set to balance the
requirements of the application.

Chapter 2 Literature review
29
Figure 2.9: Scanning Strategy (Ilkgun, 2005).
Figure 2.10: Stair-Step (Jamal, 2001).
Fill
Outline
Chapter 2 Literature review
30
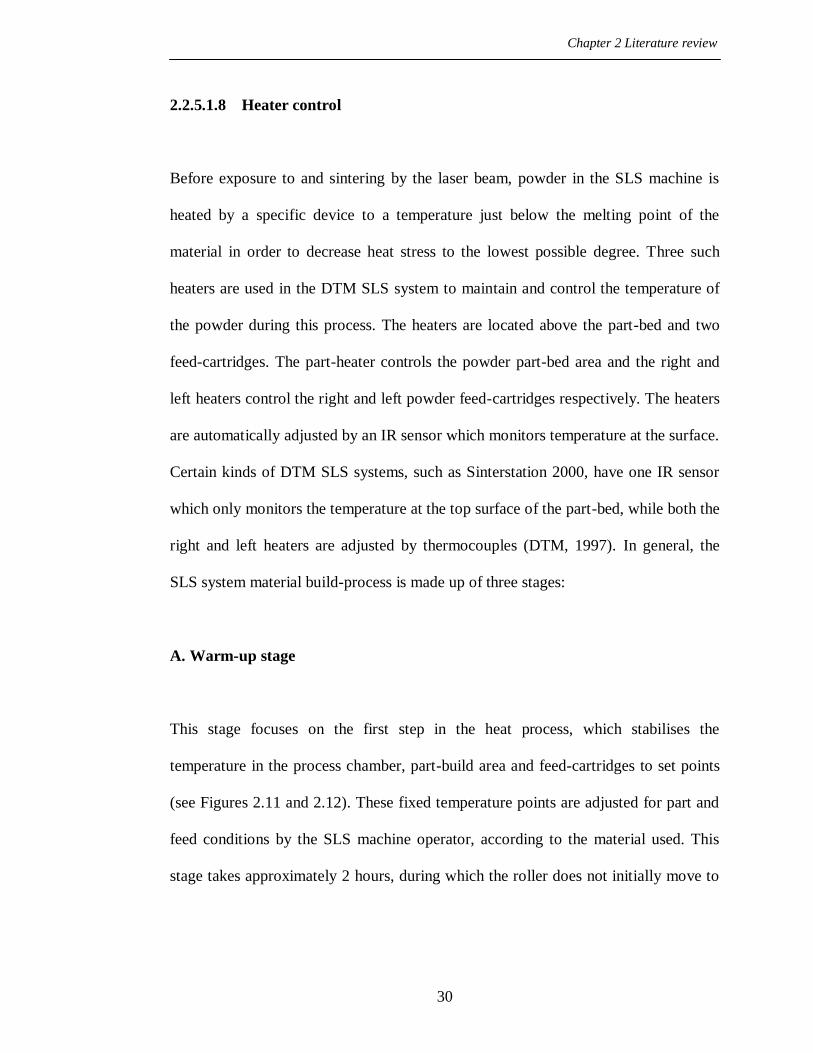
2.2.5.1.8 Heater control
Before exposure to and sintering by the laser beam, powder in the SLS machine is
heated by a specific device to a temperature just below the melting point of the
material in order to decrease heat stress to the lowest possible degree. Three such
heaters are used in the DTM SLS system to maintain and control the temperature of
the powder during this process. The heaters are located above the part-bed and two
feed-cartridges. The part-heater controls the powder part-bed area and the right and
left heaters control the right and left powder feed-cartridges respectively. The heaters
are automatically adjusted by an IR sensor which monitors temperature at the surface.
Certain kinds of DTM SLS systems, such as Sinterstation 2000, have one IR sensor
which only monitors the temperature at the top surface of the part-bed, while both the
right and left heaters are adjusted by thermocouples (DTM, 1997). In general, the
SLS system material build-process is made up of three stages:
A. Warm-up stage
This stage focuses on the first step in the heat process, which stabilises the
temperature in the process chamber, part-build area and feed-cartridges to set points
(see Figures 2.11 and 2.12). These fixed temperature points are adjusted for part and
feed conditions by the SLS machine operator, according to the material used. This
stage takes approximately 2 hours, during which the roller does not initially move to

Chapter 2 Literature review
31
spread the powder and the part-bed piston guides downwards while the roller delivers
25.4 mm of powder from the right and left feed-cartridges to the part-cylinder.
During this stage, part-bed powder temperatures slowly increase from 10ºC to 12˚C
below the material‟s melting point to reach the set points. The set part-bed heater
temperature points determine when the surface powder in the part-bed begins to
glaze. The temperature of the feed-powder is also slowly increased to its highest
possible level and reaches set temperatures at which it can still flow freely. The feed-
heater temperatures set determine when surface powder in the feed-bed begins to
crack. Small cracks are acceptable. If the cracks are excessive, then the temperature
should be reduced in increments of 1˚C until only small cracks are visible. This limits
the degree of thermal shock, or cooling, from the feed-cartridge powder on the part-
bed (DTM, 1997; Yusoff, 2007).
B. Build stage
This stage maintains the temperature of the powder in the part-bed and feed-
cartridges (see Figures 2.11 and 2.12). Part-bed powder temperatures are usually
close to melting-point, and so relatively low laser power is used to melt the powder in
each successive layer during the construction of parts. Excessive laser power will
affect powder outside the part boundary and cause growth. Conversely, insufficient
laser power will not completely fuse powder particles, resulting in porous, weak
parts. As the build-platform is lowered, the fabricated part is covered by the feed-

Chapter 2 Literature review
32
powder which then cools it to the part-bed temperature. The cooling rate is influenced
by the part‟s geometry and its position in the build. Variation in density of the part
also influences the cooling rate. A piston heater heats the top of the part-bed piston,
which helps to slow the cooling rate of the first set of parts built and subsequently
reduces the thermal gradient and prevents distortion. If the cooling rate is too slow, it
may cause growth, whilst if the cooling rate is too high, warping and curling can
occur (DTM, 1996; DTM, 1997). .
C. Cool-down stage
This stage is the final process which allows the sintered parts to cool sufficiently so
that the fabricated parts and un-sintered powder may be removed from the part-bed
cylinder, as shown in Figures 2.11 and 2.12. The fabricated parts may be removed
from un-sintered powder only after their temperature falls below that of the glass
transition of the material, otherwise they could curl and warp, or deform. The
duration of this stage depends on the building volume and the degree of cylinder and
piston heat. A longer cool-down stage will affect the properties and usability of the
material, so un-sintered powder which has been exposed to a long period of cool-
down needs to be refreshed with a sufficient amount of new powder in order to
produce good quality parts (DTM, 1997).

Chapter 2 Literature review
33
Figure 2.11: Feed-Heater Set Point (DTM, 1997).
Figure 2.12: Part-Heater Set Point (DTM, 1997).
Chapter 2 Literature review
34
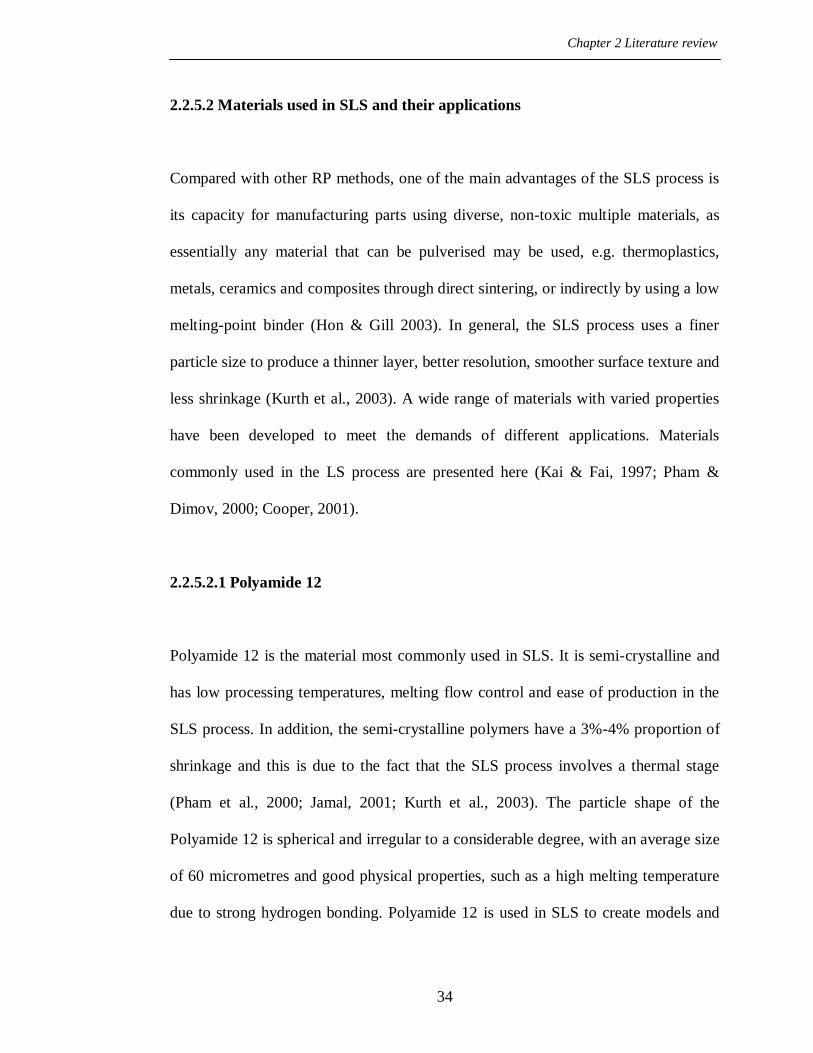
2.2.5.2 Materials used in SLS and their applications
Compared with other RP methods, one of the main advantages of the SLS process is
its capacity for manufacturing parts using diverse, non-toxic multiple materials, as
essentially any material that can be pulverised may be used, e.g. thermoplastics,
metals, ceramics and composites through direct sintering, or indirectly by using a low
melting-point binder (Hon & Gill 2003). In general, the SLS process uses a finer
particle size to produce a thinner layer, better resolution, smoother surface texture and
less shrinkage (Kurth et al., 2003). A wide range of materials with varied properties
have been developed to meet the demands of different applications. Materials
commonly used in the LS process are presented here (Kai & Fai, 1997; Pham &
Dimov, 2000; Cooper, 2001).
2.2.5.2.1 Polyamide 12
Polyamide 12 is the material most commonly used in SLS. It is semi-crystalline and
has low processing temperatures, melting flow control and ease of production in the
SLS process. In addition, the semi-crystalline polymers have a 3%-4% proportion of
shrinkage and this is due to the fact that the SLS process involves a thermal stage
(Pham et al., 2000; Jamal, 2001; Kurth et al., 2003). The particle shape of the
Polyamide 12 is spherical and irregular to a considerable degree, with an average size
of 60 micrometres and good physical properties, such as a high melting temperature
due to strong hydrogen bonding. Polyamide 12 is used in SLS to create models and
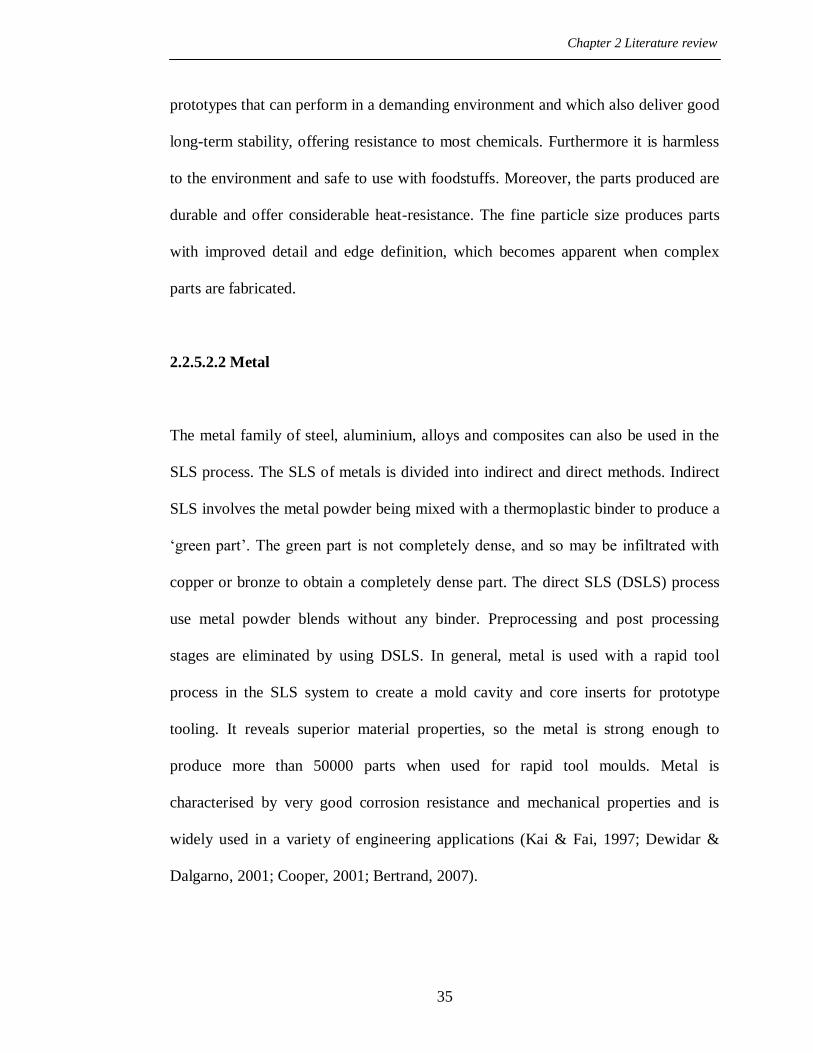
Chapter 2 Literature review
35
prototypes that can perform in a demanding environment and which also deliver good
long-term stability, offering resistance to most chemicals. Furthermore it is harmless
to the environment and safe to use with foodstuffs. Moreover, the parts produced are
durable and offer considerable heat-resistance. The fine particle size produces parts
with improved detail and edge definition, which becomes apparent when complex
parts are fabricated.
2.2.5.2.2 Metal
The metal family of steel, aluminium, alloys and composites can also be used in the
SLS process. The SLS of metals is divided into indirect and direct methods. Indirect
SLS involves the metal powder being mixed with a thermoplastic binder to produce a
„green part‟. The green part is not completely dense, and so may be infiltrated with
copper or bronze to obtain a completely dense part. The direct SLS (DSLS) process
use metal powder blends without any binder. Preprocessing and post processing
stages are eliminated by using DSLS. In general, metal is used with a rapid tool
process in the SLS system to create a mold cavity and core inserts for prototype
tooling. It reveals superior material properties, so the metal is strong enough to
produce more than 50000 parts when used for rapid tool moulds. Metal is
characterised by very good corrosion resistance and mechanical properties and is
widely used in a variety of engineering applications (Kai & Fai, 1997; Dewidar &
Dalgarno, 2001; Cooper, 2001; Bertrand, 2007).

Chapter 2 Literature review
36
2.2.5.2.3 Polystyrene / CastForm
Polystyrene is considered to be an amorphous polymer and has been extensively used
in the SLS process. CastForm is „investment-caster‟ friendly powder that gives low
ash content and is compatible with standard foundry practices. Processing CastForm
involves two main stages: a green part produced by SLS, and wax infiltration. The
green part is 45% so the part is very brittle, due to its specific material properties. The
part is completed by dipping into molten red foundry wax. CastForm material
patterns require few modifications to standard foundry practices, and are quickly and
easily removed. Low density polystyrene and high quality foundry wax ensure a
clean pattern. In addition, CastForm enables a fast track route to metal castings, such
as titanium, aluminium, magnesium, and zinc. In contrast CastForm has some
disadvantages in that it is very difficult and risky to clean away loose powder, as the
part strength is very low at this stage and some features could deform and break
(Gubbels, et al., 1994; Pham, et al., 2003; Dotchev & Soe, 2006; 3T RPD, 2008;
Paramount, 2009).
2.2.5.2.4 Polycarbonate (PC)
Polycarbonate is an amorphous thermoplastic which has been used quite extensively
in the SLS process. The polycarbonate powder is supplied by 3D systems and has a
broad size distribution and irregularly shaped particles with a mean diameter of 90
micrometers. Polycarbonates reveal good thermal stability characteristics and can

Chapter 2 Literature review
37
produce parts with very good dimensional accuracy, feature resolution and surface
finish. The parts produced have moderate strength and durability caused by the
porous structure, so they are only useful for applications that do not require part
strength and durability. If it is necessary to improve mechanical properties, parts can
be infiltrated with an epoxy resin. Polycarbonate is commonly considered as a
polymer to be used for sacrificial patterns in investment casting, as the porous
structure of the polycarbonate parts prevents them from expanding to the point of
ceramic shell cracking (Nelson et al., 1993; Jamal, 2001; Kruth, et al., 2003; Fan et
al., 2005; Berzins et al., 2007).
2.2.5.3 Common problems related to the SLS process
SLS part quality depends on SLS process parameters which are set differently
according to powder properties and the requirements of the application. Optimising
process parameters can eliminate many problems, reduce geometrical inaccuracies
and improve fabricated part properties by monitoring part-build, therefore process
parameters can be established to suit the application. Changes in some process
parameters, however, may affect other parameters and require adjustment. For these
reasons, SLS manufacturers have specified default values for all process parameters,
based on the materials used. Common problems relating to the SLS process, together
with a brief description, as well as the causes, results and corrective action are
presented in the following section (DTM, 1997; Yusoff, 2007; Jamal, 2001).

Chapter 2 Literature review
38
2.2.5.3.1 Powder fluff
Powder fluff is a phenomenon identified when the powder has a higher packing
density at the bottom of the feed-powder cartridges than it has on the top (see Figure
2.13). It occurs when powder is not uniformly consolidated during the loading
process as a result of short feeds during the initial part of the build, thus leading to
low quality parts. As a corrective measure, it has been recommended to minimise
powder fluff by compressing the powder using a flat plastic or heavy cardboard plate,
the same size and shape as the feed-cartridge. This is pressed down onto the cartridge
(DTM, 1997; Boivie, 2000; Zhou, 2009).
2.2.5.3.2 Cracking of part-bed and feed-cartridge
The surfaces of the part-bed and feed-cartridge can crack open as the roller moves
across them (see Figure 2.14). This occurs due to an excessive heating rate from the
part-bed and feed-heaters, causing partial melting of powder on the part-bed and feed
surfaces. As a result, the part cracks if it is built over the seam area that is cracking.
To avoid this problem it has been suggested that the part-bed and feed-heaters‟ set
points are decreased in increments of 2°C until the crack disappears (DTM, 1997).

Chapter 2 Literature review
39
Figure 2.13: Schematic View of Powder Fluff (DTM, 1997).
Figure 2.14: Cracking Appears in Part-Bed and Feed-Cartridge (DTM, 1997).
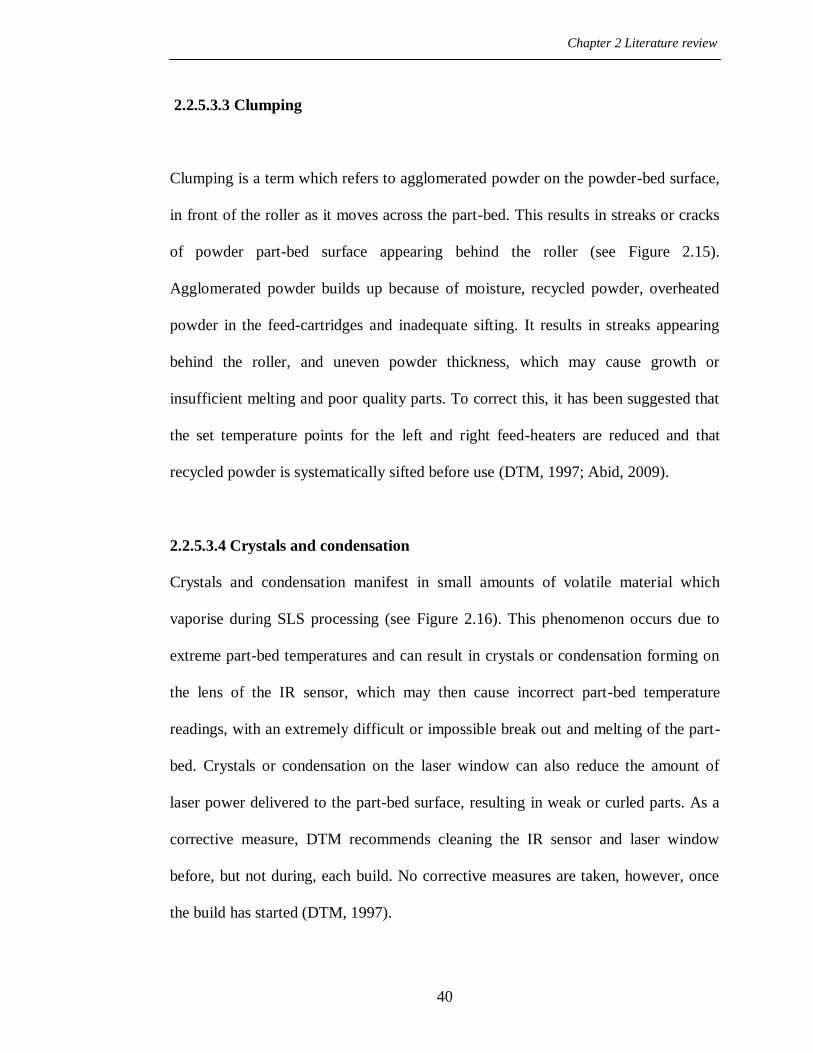
Chapter 2 Literature review
40
2.2.5.3.3 Clumping
Clumping is a term which refers to agglomerated powder on the powder-bed surface,
in front of the roller as it moves across the part-bed. This results in streaks or cracks
of powder part-bed surface appearing behind the roller (see Figure 2.15).
Agglomerated powder builds up because of moisture, recycled powder, overheated
powder in the feed-cartridges and inadequate sifting. It results in streaks appearing
behind the roller, and uneven powder thickness, which may cause growth or
insufficient melting and poor quality parts. To correct this, it has been suggested that
the set temperature points for the left and right feed-heaters are reduced and that
recycled powder is systematically sifted before use (DTM, 1997; Abid, 2009).
2.2.5.3.4 Crystals and condensation
Crystals and condensation manifest in small amounts of volatile material which
vaporise during SLS processing (see Figure 2.16). This phenomenon occurs due to
extreme part-bed temperatures and can result in crystals or condensation forming on
the lens of the IR sensor, which may then cause incorrect part-bed temperature
readings, with an extremely difficult or impossible break out and melting of the part-
bed. Crystals or condensation on the laser window can also reduce the amount of
laser power delivered to the part-bed surface, resulting in weak or curled parts. As a
corrective measure, DTM recommends cleaning the IR sensor and laser window
before, but not during, each build. No corrective measures are taken, however, once
the build has started (DTM, 1997).
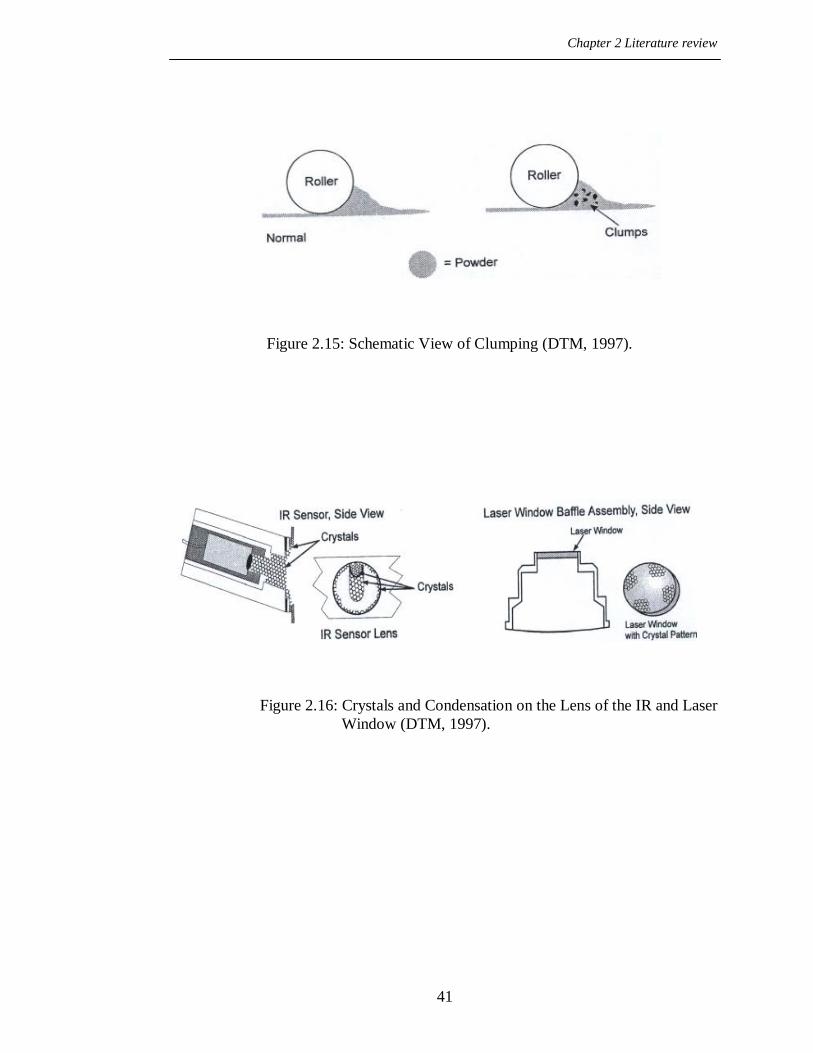
Chapter 2 Literature review
41
Figure 2.15: Schematic View of Clumping (DTM, 1997).
Figure 2.16: Crystals and Condensation on the Lens of the IR and Laser
Window (DTM, 1997).

Chapter 2 Literature review
42
2.2.5.3.5 Bonus Z
Bonus Z is a phenomenon identified when the laser melts a part beyond the specified
depth [usually 0.004 inch (0.1 mm)] during the first few scans and causes vertical
growth in the Z axis. The difference between growth and bonus Z is that growth may
occur on any part edge, while bonus Z occurs only on downward-facing surfaces (see
Figure 2.17). This phenomenon occurs due to the laser penetrating the un-sintered
powder below the part boundary, resulting in a part dimension outside the tolerance
range of the Z axis. To solve this problem, the possibility of bonus Z should be
minimised by reducing the temperature time relative to the powder bed and the fill-
laser power for the first few layers (between the first and fourth layers). Constant
offset in the Z dimensions of the STL file is applied using the DTM offset. The Z
offset affects only downward-facing surfaces by moving them upward, in accordance
with the specified distance (DTM, 1997; Ho et al., 2002; Dewidar et al., 2003).
2.2.5.3.6 Curling “in-build”
Curling is a phenomenon identified when the edges or corners of the part rise above
the powder part-bed surface. The parts may get thinner in the Z axis, as shown in
Figure 2.18. This phenomenon occurs due to temperature difference and the part
temperature dipping too low after the feed-powder is added. Curl can also occur if the
part-bed temperature is too low (Jamal, 2001; Min Hur et al., 2001). As a result, parts
are not flat, especially where large surface-area cross-sections are concerned and the

Chapter 2 Literature review
43
part may move in the part-bed when the roller passes over if the curling is severe. As
a corrective measure, it has been recommended to increase the set point values for the
left and right feed heaters to the highest possible temperature at which the powder can
still flow freely. Increasing the powder-bed temperature may also reduce heat transfer
from the build to the powder part-bed. Furthermore, reducing left and right feed
distances may also cut down on curling „in-build‟ (DTM, 1997).

Chapter 2 Literature review
44
Figure 2.17: Schematic View of Bonus Z (DTM, 1997).
Figure 2.18: Schematic View of Curling “In-Build” (DTM, 1997).
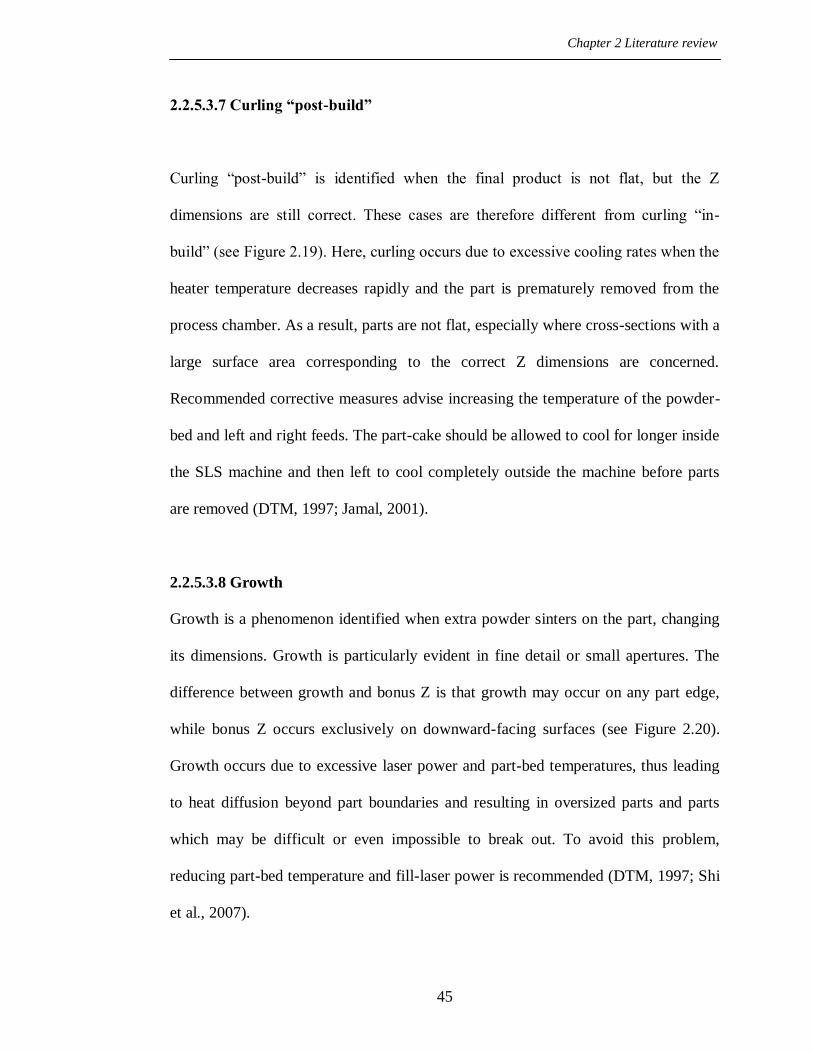
Chapter 2 Literature review
45
2.2.5.3.7 Curling “post-build”
Curling “post-build” is identified when the final product is not flat, but the Z
dimensions are still correct. These cases are therefore different from curling “in-
build” (see Figure 2.19). Here, curling occurs due to excessive cooling rates when the
heater temperature decreases rapidly and the part is prematurely removed from the
process chamber. As a result, parts are not flat, especially where cross-sections with a
large surface area corresponding to the correct Z dimensions are concerned.
Recommended corrective measures advise increasing the temperature of the powder-
bed and left and right feeds. The part-cake should be allowed to cool for longer inside
the SLS machine and then left to cool completely outside the machine before parts
are removed (DTM, 1997; Jamal, 2001).
2.2.5.3.8 Growth
Growth is a phenomenon identified when extra powder sinters on the part, changing
its dimensions. Growth is particularly evident in fine detail or small apertures. The
difference between growth and bonus Z is that growth may occur on any part edge,
while bonus Z occurs exclusively on downward-facing surfaces (see Figure 2.20).
Growth occurs due to excessive laser power and part-bed temperatures, thus leading
to heat diffusion beyond part boundaries and resulting in oversized parts and parts
which may be difficult or even impossible to break out. To avoid this problem,
reducing part-bed temperature and fill-laser power is recommended (DTM, 1997; Shi
et al., 2007).
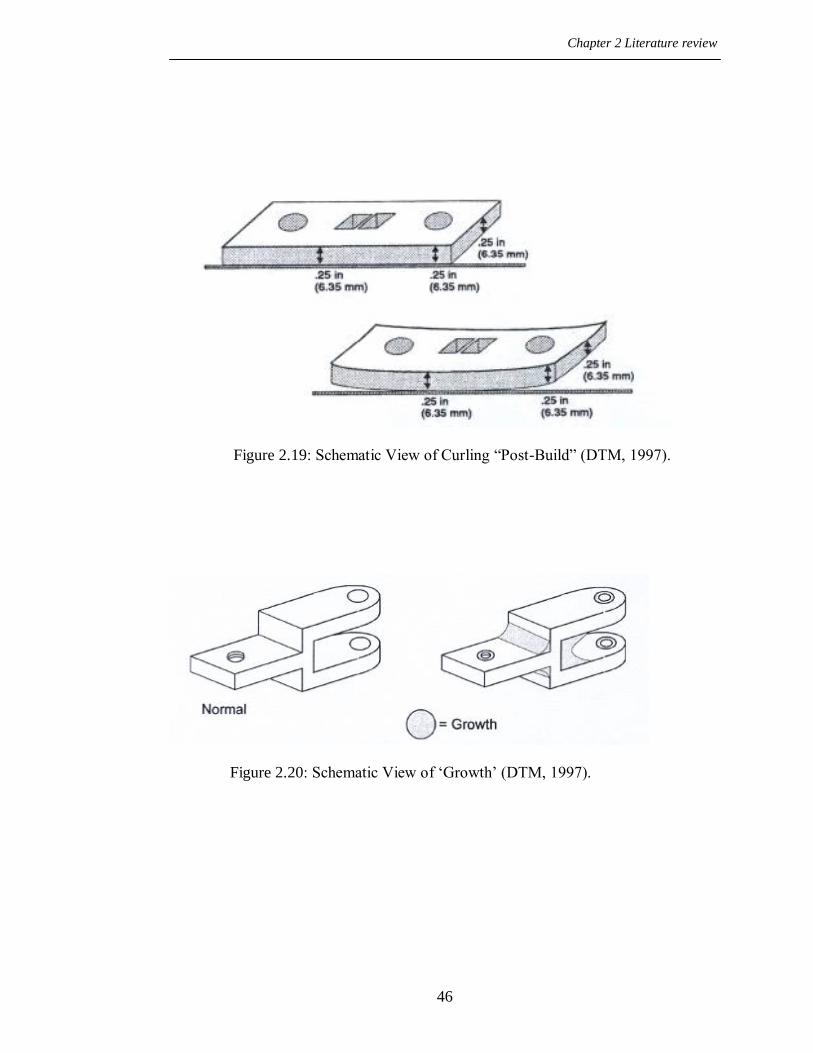
Chapter 2 Literature review
46
Figure 2.19: Schematic View of Curling “Post-Build” (DTM, 1997).
Figure 2.20: Schematic View of „Growth‟ (DTM, 1997).
Chapter 2 Literature review
47
2.2.5.3.9 Missed-scan
A missed-scan is identified when the laser beam does not completely scan the fill area
of a part (see Figure 2.21). Missed-scans occur when an error in the STL file received
from the CAD model does not contain properly connected surface patches. This
problem is not material-related, but will result in incorrect part geometry and perhaps
poor part properties. As a corrective measure, it has been recommended to verify that
the STL and CAD files are correct, or else to create new files (DTM, 1997; Chen, et
al,. 2001; Dimov, et al,. 2005).
2.2.5.3.10 Weak parts/porosity
This problem is identified when parts appear porous and solid, which means that the
part will then be brittle and low density (see Figure 2.22). These cases arise when the
laser window is obscured by crystals and laser power is therefore insufficient. They
also occur when laser speed very high. The result is low strength and density in the
parts fabricated. Corrective performance consists of cleaning the laser window,
increasing fill-laser power during the build, raising part-bed temperature and
decreasing the laser speed (DTM, 1997; Hon, 2003; Schmidt, 2007).

Chapter 2 Literature review
48
Figure 2.21: Schematic View of a „Missed-Scan‟ (DTM, 1997).
Figure 2.22: Schematic View of „Weak Parts/Porosity‟ (DTM, 1997).

Chapter 2 Literature review
49
2.2.5.4 Previous studies of composite material used in SLS
2.2.5.4.1 Glass-filled polyamide 3200
PA 3200 GF is a composite material made from glass bead and polyamide. The glass
bead consists of particles of regular shape and an average size of about 50
micrometres with a high melting-point. However Polyamide 12 is presented in this
composite as a binder and the glass particles as a structural material. When the PA
3200 GF composite is sintered through SLS, the Polyamide 12 particles are fully
molten, and the glass particles remain solid. Glass-filled polyamide differs from
Polyamide 12 in that it has greater mechanical properties, such as rigidity and flexural
qualities. Using glass bead is thought to reinforce the Polyamide 12, consequently
increasing strength, dimensional stability, rigidity and heat resistance. The glass-filled
blend is perfect when prototyping rigid parts intended for production in advanced,
engineered thermoplastics, and is the right choice for functional testing (Childs &
Tontowi, 2001; Cooper, 2001; Mazzoli, et al,. 2006 ; Abid, 2009). In contrast, one of
the drawbacks of PA 3200 GF supplied by EOS is that it is more expensive than
Polyamide 12, which is also supplied by EOS.
2.2.5.4.2 Aluminium-filled polyamide (Alumide™)
Alumide is a new composite material made by EOS GmbH, consisting of two
materials: polymer and aluminium filler. The aluminium has an average particle size
Chapter 2 Literature review
50
of 45 µm and the particle size distribution (90% volume distribution) is in the range
26–75 µm with a high melting-point of around 660 ºC (EOS, 2008 ; Mazzoli, et al,.
2006). Polymer particles are used as binder because they have a low melting point.
Alumide™ has a high dimensional accuracy, can stand high temperatures and has
excellent mechanical properties, such as tensile and flexural modulus. In addition,
Alumide™ promises a greater surface finish and better finishing properties for many
functional prototypes. Mazzoli, (2006) mentions that aluminium-filled polyamide
powder was developed because of the need to manufacture models with excellent
dimensional accuracy and resistance to mechanical stress, especially bending strength
and the ability to stand high temperatures. A typical application for Alumide™ is the
production of stiff parts, with a metallic appearance, for applications in the
automobile industry (e.g. wind tunnel tests), tool inserts for injecting and moulding
small production runs, education, and high accuracy medical models. Moreover, the
surface of Alumide parts can be finished by grinding, polishing, or coating. An
additional advantage is that low tool-wear machining is possible (e.g. milling and
drilling) (Subramanian, et al,. 1995; Mazzoli, et al,. 2006).
2.2.5.4.3 CarbonMide®-Carbon fibre-filled polyamide
CarbonMide is a new composite material introduced into the commercial market by
EOS. It is based on two materials: a carbon-fill and polyamide to produce black parts.
CarbonMide has another commercial name, Windform XT, which has almost the
same characteristics. The parts manufactured through the SLS process using
Chapter 2 Literature review
51
CarbonMide have exceptional mechanical properties characterised by high stiffness
levels, high tensile strength and tensile modulus. Moreover, they have low density,
electrical conductivity, a smooth finish and a sparkling appearance. A typical
application for CarbonMide is the production of fully functional prototypes with
high-end finish for applications in the automobile industry, such as wind tunnel tests
or other aerodynamic applications. Blocher, the managing director of FKM (2008)
has explained that CarbonMide has a great deal of potential in the production of
large, mechanically loaded parts for racing and sports cars (Jain et al., 2006; EOS,
2008).
2.2.5.4.4 Silicon carbide/polyamide
Sic/Polyamide composite has been developed for use with SLS. It consists of two
materials, polyamide and silicon carbide filler as rigid particles. The silicon carbide
has an average particle size of 44.5 µm and is angular in shape when compared to the
polyamide, with a high melting-point of around 2700 ºC. The polyamide powder is
therefore used as a binder because of its low melting point (Gill & Hon, 2004).
Simple and complex shapes are easily produced with this material by using optimised
parameters. Sic/Polyamide composite can be infused with metal by using an
infiltration process to produce both metal matrix and ceramic matrix composites, such
as by infiltrating aluminium matrices into SiC in a nitrogen atmosphere at 750-850º
C, where the polymer was thermally removed. Silicon Carbide loadings near 45
vol.% are typically achieved. At this maximum vol.% of Silicon Carbide, moduli of

Chapter 2 Literature review
52
about 180 GPa and a 4-point bending strength of about 275 MPa are obtained. Its
advantages include the ability to form complex geometries that are not achieved by a
casting process with shrinkage of less than 1%, and minimum machining after
infiltration (Vail, et al., 1993; Beaman et al., 1997; Gill & Hon, 2004).
2.2.5.4.5 Copper polyamide (CuPA)
Copper polyamide is a metal-plastic composite of a copper powder and polyamide
blend introduced by DTM in May 1998 to use in the SLS process (Pham & Dimov,
2000). Tooling inserts are produced with a layer thickness of 75 µm and it is
necessary to finish the tools before their integration in the tool base. Unfinished tool
inserts can be produced in a day and no furnace cycle is required. CuPA is produced
to create tooling for short production runs of equivalent plastic parts with conformal
cooling, good thermal conductivity, heat resistance and durability. CuPA can be built
into mould tool inserts in the SLS machine in the same way as other PA materials
(e.g. PA2200). In addition, the advantages of using CuPA are both numerous,
significant and suitable for injection moulded inserts for several hundred parts (100–
400 parts) from common plastics such as polyethylene (PE), polypropylene (PP),
polystyrene, ABS, PC/ABS. Moreover, the surface of parts made of CuPA can be
easy to machine and finish. In contrast, one of the drawbacks of copper polyamide is
that it is very expensive (Pham & Dimov, 2000; Levy & Schindel, 2002; King &
Tansey, 2002).

Chapter 2 Literature review
53
2.3 Summary
This chapter presents a brief description of common rapid prototyping processes with
the focus on SLS technology for 3D Systems. These are considered one of the most
popular rapid prototyping techniques. In the SLS process, the main fabrication
parameters which influence the quality of sintered parts are described. Some of the
common materials employed to produce RM and RP parts by SLS are presented. The
main problems with using PA12 powder produced through SLS are highlighted,
followed by a description of previous studies of composite material used in SLS.

Chapter 3 Experimental techniques
54
Chapter 3
Experimental techniques
3.1 Preliminaries
This chapter presents the equipment, methodologies and experimental procedures
used to characterise the behaviour of composite material of cement additives with
Polyamide 12 as powder and sintered specimens. In addition, it describes the
composite material used in this research. A better understanding of material
properties is an enormous help in obtaining more appropriate data to input into the
SLS process, in order to get new SLS material and excellent quality sintered
specimens.

Chapter 3 Experimental techniques
55
3.2 Material Preparation
The material used in this research consists of composite material made from
polyamide with cement additive. The polyamide used is the Polyamide 12-based
powder, supplied by EOS. This is an ultrafine powder of Polyamide 12, with a
narrow particle size distribution and nearly round particle shape. Polyamide 12 is a
kind of viscoelastic thermoplastic material with mechanical properties that reflect the
characteristics of both viscous liquids and elastic solids. This means that when the
material is stressed, it responds with viscous flow, which dissipates energy, and with
elastic displacement, which stores energy (Crawford, 1987). The cement used is
Portland cement, defined as an adhesive material capable of joining fragments or
masses of solid substance to a compact whole. The raw materials commonly used to
make Portland cement are limestone or chalk and clay or shale. Limestone and chalk
usually contain significant quantities of components of CaO, which represent the
main constituent of Portland cement clinker. Clay and shale normally contain large
quantities of the compounds SiO2, Al2O3 and Fe2O3. The widespread availability of
limestone and shale keep the cost of Portland cement low (Lea, 1970; Barnes, 1983;
Shirley, 1986). The material specifications for both PA12 and Portland cement are
listed in Table 3.1, while Figure (3.1) shows scanning electron microscopy (SEM)
micrographs of both types of powder. It can be observed that Portland cement is more
angular in shape when compared to PA12.

Chapter 3 Experimental techniques
56
Composite of cement and PA12 was prepared in the Manufacturing Engineering
Centre Laboratory (MEC LAB) at Cardiff University. Both materials were sifted
through an intensive shaking procedure, using a VORTI-SIV sifter to avoid
agglomerates of powder. Following this, composite powder was mechanically mixed
to a determinate formulation (see Table 3.2), in a high-speed mixer for 20 minutes in
order to obtain homogeneous powder mixtures of uniform colour, so that maximum
dispersion of particles was ensured. However, care in mixing was checked by
scanning electron microscopy (SEM), as shown in Figure 3.2.

Chapter 3 Experimental techniques
57
Figure 3.1: (SEM) Electron micrograph
scans of PA12 and cement.
Table 3.1: Material specifications.
Powder properties Portland cement Polyamide 12
Average grain size (m) 15 58
Bulk density (g/cm³) 1.04 0.59
Particle shape Irregular Irregular
Melting temperature (ºC) 1400 185

Chapter 3 Experimental techniques
58
Table 3.2: Cement/PA12 mixture powder formulation.
Cement (g) PA (g) Proportion
30 581 5:95
63 571 10:90
98 558 15:85
136 544 20:80
175 526 25:75
217 507 30:70
261 485 35:65
308 462 40:60
Figure 3.2: (SEM) Electron micrograph scans of PA12 and cement.

Chapter 3 Experimental techniques
59
3.3 Equipment used for the preparation and production of specimens
Cement and PA12 were mechanically mixed in a drum mixer, BS 125, with a
capacity of 150 L and mixing speed of 30 r.p.m. (see Figure 3.3). Composite powder
was sifted in an intensive shaking procedure, using the VORTI-SIV pilot, RBF-15
(see Figure 3.4). The size of the particles was computed with an optical microscope
using OmniMet software, from the image analysis of a two dimensional projection of
the particles. The image analysis system consists of the optical microscope named
above, fitted with a camera for obtaining the image as a pixel representation and a
high-resolution monitor screen for displaying the image. OmniMet software was used
to obtain the average particle size (see Figure 3.5). Agar Auto Sputter Coater was
used to coat the specimens in gold, in order to make the sintered samples conductive
(see Figure 3.6). The topographical information on the surface features of specimens,
their texture and shape, size and arrangement of the particles, were studied using the
Scanning Electron Microscope (SEM), at a voltage of 2-5 kV, and a ZEIZZ 1540 XB,
with 0.000000001 mm resolution and 1000,000X magnification. The SEM images
were obtained with a very small electron probe (or electron spot), scanned over the
surface of the specimens, and by mapping the electron signals detected from each
specimen pixel onto the corresponding pixel of the Cathode Ray Tube (CRT), or
Charge Coupled Device (CCD), i.e. the screen (see Figure 3.7).
All sintered parts were built on a DTM Sinterstation 2000 machine using composite
material of PA12-cement. Directions in the build chamber of the SLS machine are x-
Chapter 3 Experimental techniques
60
axis parallel to the front of the machine, while the y- axis is perpendicular to the x-
axis. The top plane of the powder bed is then the x–y-plane of the build chamber and
the z-axis is perpendicular to the x–y-plane, as shown in Figure 3.8. In order to
simulate the conditions of the SLS process and produce the mechanical properties of
SLS specimens, while understanding the effects of the temperature and heating time
on the deterioration of composite material of cement/PA12, the samples were set in
an Oven Heraeus Instruments Vacutherm, Type 6060M, at 220 ºC in an optimal
nitrogen atmosphere, in order to prevent the powders from oxidising (see Figure 3.9).
All cast specimens were produced in an aluminium die and the die was machined
using the AGIE AGIECUT EXCELLENCE wire cutter (see Figure 3.10). To meet
the British Standard Specification for cast specimens, all parts were post-machined
using the XYZ MACHINE TOOLS LIMITED EDGE 3000 (see Figure 3.11).

Chapter 3 Experimental techniques
61
Figure 3.3: Drum mixer BS 125.
Figure 3.4: VORTI-SIV pilot RBF-15sifter
Figure 3.5: Optical microscope.
Figure 3.6: Agar Auto Sputter Coater.
Figure 3.7: Scanning Electron Microscope (SEM).
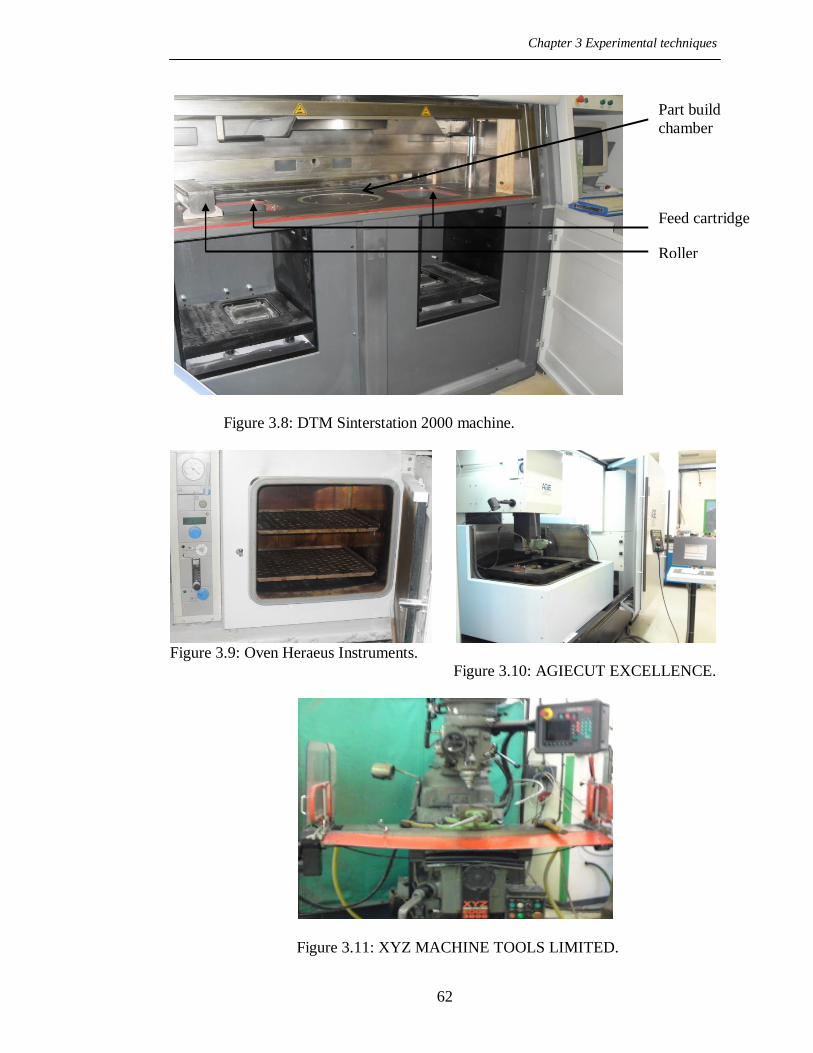
Chapter 3 Experimental techniques
62
Figure 3.8: DTM Sinterstation 2000 machine.
Figure 3.9: Oven Heraeus Instruments.
Figure 3.10: AGIECUT EXCELLENCE.
Figure 3.11: XYZ MACHINE TOOLS LIMITED.
Part build
chamber
Feed cartridge
Roller

Chapter 3 Experimental techniques
63
3.4 Equipment used for measurements of powder properties
3.4.1 Melt Flow Rate (MFR)
The melt flow rate is used to accurately measure the melt flow characteristics of
polymers when extruded through a capillary die of specified length and diameter at
specific temperatures, load and piston positions in the barrel, while a timed
measurement is made (see Figure 3.12) (Crawford, 1990). The MFR process begins
by adding a small amount of material (4-8 grams) to the measurement cylinder at
235ºC. To guarantee a homogenous rope is extruded through the small die, the
sample should be manually compressed several times during the filling procedure.
The latter should take no longer than 1 minute. The measurement piston remains in
place for a waiting period of 5 minutes, or until the heating of the sample is finished.
After that, weights of 1.835 kg are added to the measurement piston to a total of 2.16
kg, and the rope is cut at a pre-determined distance between the two markers of the
measurement piston at measured intervals. In this study, 6 MFR measurements were
taken for each sample (ThermoHaake, 2000; ISO1133, 2005). Two ways to determine
the MFR and its results are indicated in g/10min. One is via a PC, which shows the
value automatically. The second is calculated manually from the determined size of
the sample mass and the duration of the measurement corresponding to the following
equation:
(Eq.3.1)
Chapter 3 Experimental techniques
64
Here, T is the test temperature in degrees Celsius, mnom is the nominal load in
kilograms, m is the average mass, in grams, of the cut-offs, t is the cut-off time-
interval in seconds, and 600 is the factor used to convert grams per second into grams
per 10 min (600 s).
Understanding the melt flow rate of polymers is a key indicator for producers,
processors and converters of plastic materials in the manufacture of consistently
quality products. The chemical structure of polymer affects its melt flow, so polymer
with a high molecular weight has a greater flow resistance than polymer with low
molecular weight (ISO1133, 2005; Yusoff, 2007).

Chapter 3 Experimental techniques
65
Figure 3.12: Melt flow rate indexer (MFR) equipment (ISO1133, 2005).

Chapter 3 Experimental techniques
66
3.4.2 Differential Scanning Calorimetry (DSC)
Differential scanning calorimetry is a technique used to investigate the changes
(thermal transitions) that take place in polymer when exposed to various temperatures
(DSC, 2005). The most important thermal transitions that occur in polymer are
melting temperature, Tm (endothermic transition), crystallisation temperature, Tc
(exothermic transition), and glass transition temperature, Tg. The DSC instrument has
two crucibles made of aluminium. One of the crucibles contains the sample of
polymer and the other is the reference (an empty pan). The sample and reference are
provided with separate heaters connected to a computer which controls them as
illustrated in Figure 3.13. The computer turns on the heaters and starts to heat the two
crucibles at a specific rate, typically 10 C/min. Feedback loops control the feed of
heat to the sample and reference so the temperature programme is closely followed.
The output of a DSC is a plot of the temperature difference on the x-axis and the heat
flow difference between a sample and an inert reference on the y-axis (Gibson & Shi,
1996; Sichina, 2000; ISO11357, 2008). DSC as part of the Mettler Toledo Thermal
Analysis was used in this research to study the thermal transition of composite
material of cement and PA12. The temperature accuracy of DSC is +/- 0.2K and the
heat flow accuracy is +/- 2% (MettlerToledo).

Chapter 3 Experimental techniques
67
Figure 3.13: DSC instrument (DSC, 2005).
Chapter 3 Experimental techniques
68
3.4.3 Gel Permeation Chromatography (GPC)
GPC is a technique for determining the average molecular mass and the molecular
mass distribution of polymers by separating polymer samples into fractions,
according to their molecular size, using a non-ionic stationary phase of packed
spheres. The average molecular mass and the molecular mass distribution are
calculated from a calibration curve constructed using polymer standards (Cowie,
1973; ISO16014, 2003). In this experiment, a single solution of each sample was
prepared by adding 5 ml of solvent to 10 mg of sample and leaving it overnight to
dissolve. The solutions were well mixed and filtered through a 0.45 µm PTFE filter.
The data was collected and analysed using polymer laboratory „Cirrus‟ software. The
chromatographic conditions during the GPC analysis are summarised in Table 3.3.

Chapter 3 Experimental techniques
69
Table 3.3: Chromatographic conditions.
Sample Composite material of cement and Polyamide12
Instrument GPC and polymer laboratory „Cirrus‟ software
Columns PL HFIP gel guard plus two 300x7.7mm, 9µm
Solvent 1,1,1,3,3,3-hexafluoro-2-propanol with 25 mM NaTFAc
Flow-rate 0.8 mL/min (nominal)
Temperature 40º C
Detector Refractive index

Chapter 3 Experimental techniques
70
3.5 Equipment used for measurements of mechanical properties
The tests for the mechanical properties of the SLS specimens were carried out using a
Testomeric M500 machine, with a load range of 0 to 25 KN, accuracy +/- 0.5% and
speed range of 0.001 to 1000 mm/min. The machine was connected with the
controller system to choose the test type, to adjust the test speed and enter the
dimensions of the sample. In addition, the readout screen showed real time test curves
of calculated results. The Young‟s modulus was tested using an extensometer capable
of measuring strain or elongation for certain materials when they are subjected to
loading in a tensile testing machine. The tensile specimens were dog-bone shaped and
the test speed was 5mm/min, according to ISO 527.2. The dimensions of the flexural
specimens were 80mm x 10mm x 4 mm thick, the span was 60 mm and the test speed
used was 2mm/min, consistent with ISO 178. The dimensions of the compression
specimens were 10mm x 10mm x 4mm thick and the test speed was 5mm/min, in
agreement with ISO 604. All tests were conducted at room temperature. The Izod
impact specimens were tested using a Pendulum impact W&T AVERY machine, and
determined with reference to ISO 180. The dimensions of the cross-sectional area
(CSA) value of the specimens were obtained using a micrometer.

Chapter 3 Experimental techniques
71
3.6 Summary
This chapter describes the materials Portland cement and Polyamide 12, used in this
research as composite material, in addition to explaining the equipment and
experimental procedures used for the preparation and production of all specimens
employed in this research. The equipment and experimental procedures used for
obtaining of the thermal and physical properties of composite material as powder
were described. Devices for measuring powder particles and sintered specimens, and
the equipment used for measuring the mechanical properties of composite material as
sintered components were also presented.

Chapter 4 Thermal properties of composite material of cement and polymide12 in SLS process
72
Chapter 4
Thermal Properties of Cement and Polyamide 12 Composite in the
Selective Laser Sintering Process
4.1 Preliminaries
SLS employs powder-processing in the construction of parts and SLS parameters,
depending on the thermal properties of the powder. An average of 80% to 90% of the
powder in the build chamber is not sintered during the SLS process and could be
reused in relation to its properties. However, the properties of un-sintered powder
deteriorate due to exposure to various temperatures for extended periods of time
during the SLS system material build-process.
This takes place in three stages, starting from the warm up stage, the build stage,
where the powder is exposed to just below the melting point of the material, and the
cool-down stage. This chapter discusses the properties of cement and Polyamide 12
composite, as well as the thermal behaviour, melt flow rate, and molecular weight of
this material. The influence of temperature and time on these properties is
investigated.
Chapter 4 Thermal properties of composite material of cement and polymide12 in SLS process
73
The main purpose of this research is to develop a methodology for controlling the
SLS parameters by studying the thermal properties of different proportions of
composite material of cement and PA12 of the virgin powder, together with the input
material properties from un-sintered powder, in order to obtain consistent and good
quality fabricated SLS specimens.
4.2 Characterisation of composite material of cement and Polyamide 12 powder
One of the factors which make thermoplastics attractive for applications in
engineering is the possibility of improving properties through reinforcement.
Composites have therefore enabled thermoplastics to become acceptable in the
demanding aerospace and automobile industries (Crawford, 1987). As mentioned
before, the cement used is Portland cement, defined as an adhesive material capable
of joining fragments or masses of solid substance to a compact whole. The raw
materials commonly used to make Portland cement are limestone or chalk and clay or
shale. Limestone and chalk usually contain significant quantities of component CaO
which represents most of the composition of Portland cement clinker. Clay and shale,
however, normally contain major quantities of compounds of SiO2, Al2O3, Fe2O3.
Portland cement is a fine powder with tiny particle size and irregular shape.
Widespread availability of limestone and shale suppresses the cost of Portland
cement (Lea, 1970; Barnes, 1983; Shirley, 1986).

Chapter 4 Thermal properties of composite material of cement and polymide12 in SLS process
74
The polyamide used, Polyamide 12, is a thermoplastic that is derived from polymers.
Polyamide 12 consists of 12 carbon atoms and an amide group (-CONH-) as a
recurring part of the chain. Most polyamides are partially crystalline polymers and
usually described in terms of having two parts: amorphous and crystalline
components in a spherulitic microstructure. In an amorphous state, the distribution of
polymer chains is completely random, while in the crystalline state, the chains are in
a regular order, so that polymers do not form 100% crystalline structures in the same
way as metals and ceramics (see Figure 4.1) (Mangonon, 1999). They display their
most useful properties in the range between glass transition temperature Tg and
melting temperature, Tm. Furthermore, they are designed so that the temperature of
operation comes within this range (Young, 1981). Consequently, semi-crystalline
polymers have distinct melting points and solidify when cooled down. Furthermore,
Polyamide 12 is an ultrafine powder with a narrow particle size distribution and
nearly round particle shape (Kohan, 1995).
As mentioned before, the material specifications for both PA12 and Portland cement
are listed in Table 3.1 while Figure 3.1 shows scanning electron microscopy (SEM)
micrographs of both types of powder to demonstrate irregularity. It can also be seen
that Portland cement is more angular in shape when compared to PA12.
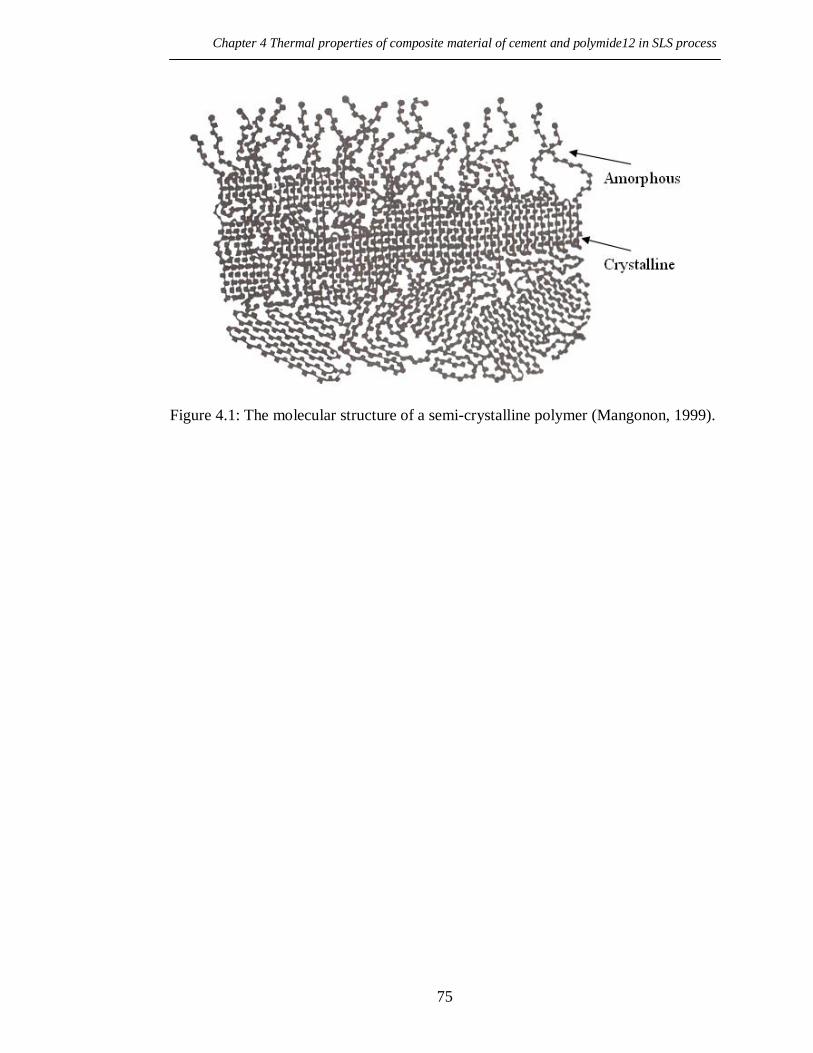
Chapter 4 Thermal properties of composite material of cement and polymide12 in SLS process
75
Figure 4.1: The molecular structure of a semi-crystalline polymer (Mangonon, 1999).
Chapter 4 Thermal properties of composite material of cement and polymide12 in SLS process
76
Most SLS technologies can be classified according to the binding mechanisms
involved. The SLS of material-reinforced polymers can be seen as liquid phase
sintering of composite powder particles, where the polymer is a binder and the
material-reinforced particles represent structural material. The polymer does not just
act as binder material but constitutes the main phase of the structural material, and
basically a structural material that is fully molten, while the material reinforced
particles remain solid (Kruth et al., 2005).
4.3 Thermal properties of the powder
In the SLS process, where the fabrication parameters involve using composite powder
as a reinforced-polymer powder, the polymer acts as a binder within the reinforced
powder, so the fabrication parameters are mainly dependent on the properties of
polymers. As shown in Figure 4.2, the most important characteristics determining the
application of thermoplastic polymers constitute glass transition temperature Tg,
melting temperature Tm and crystallisation temperature Tc (Cowie, 1973; Gibson &
Shi, 1996).

Chapter 4 Thermal properties of composite material of cement and polymide12 in SLS process
77
Figure 4.2: Characteristics that determine the application of thermoplastic polymers
(Cowie, 1973).

Chapter 4 Thermal properties of composite material of cement and polymide12 in SLS process
78
4.3.1 Glass transition temperature Tg
The glass transition temperature, Tg, is the temperature where a rapid decrease in
elastic modulus occurs. It varies with different polymers and takes place in an
amorphous region of the semi-crystalline polymers. At ambient temperature, the
amorphous regions are solid and the polymer is in a glassy state which causes it to be
very hard and brittle. Tg occurs due to an increase in motion of large segments of
molecular chains caused by heating from below Tg. When a certain amount of heat is
applied, there is a point where the behaviour of the polymer rapidly changes due to
breaks in the van der Waal bonds. At this point, the mechanical behaviour of the
polymer changes from being glassy and brittle and becomes less rigid and more
rubbery. However the crystalline regions are maintained, due to stronger covalence
bonds, so melting does not occur until a higher temperature is applied (Cowie, 1973;
Crawford, 1990; Gibson & Shi, 1996; Mangonon, 1999).
There are a number of structural features which have a bearing on the value of glass
transition temperature. As Tg depends largely on the amount of thermal energy
required to keep the polymer chains moving, a number of factors influence Tg,
including chain flexibility, molecular structure, molecular weight, branching and
cross-linking. Flexible chains have a low Tg whereas a rigid chain has a high Tg.
Molecular structure and the size of the group attached to the main chain carbon atom
can influence the glass transition point. In this case, the steric factor affects the
flexibility of the chain and these arise when bulky pendant groups hinder the rotation

Chapter 4 Thermal properties of composite material of cement and polymide12 in SLS process
79
around the backbone and cause Tg to increase. The molecular weight of a polymer
will have some effect on the Tg, so an increase in molecular weight causes an
increase in the glass transition temperature. Cross-links will also have an impact on
the Tg when they are introduced into a polymer. The density of the sample is
increased proportionally and this leads to a restriction of the molecular motion in the
sample and a rise in Tg (Cowie, 1973; Kohan, 1995).
4.3.2 Melting temperature Tm
The melting temperature is the temperature where the polymers eventually obtain
sufficient thermal energy as the temperature rises to enable their chains to move
freely enough and to behave like a viscous liquid. The melting temperature is
typically in the order of 100ºC above the glass transition temperature, Tg, or 50ºC
above crystalline temperature, Tc. This varies for different polymers (Cowie, 1973).
When the temperature rises from Tg to about 30K above Tg, the molecular motion
starts to increase and this causes the modulus of elasticity to go down, with
continuance in temperature rising to just above Tm. Here, the polymer becomes liquid
and the chains are all tangled up with their neighbours (Gibson & Shi, 1996). The
viscosity of the molten polymer depends significantly on the temperature; as the
temperature increases, the viscosity of the polymer decreases considerably and can be
expressed in its form (Cowie, 1973; Beamam et al., 1997; Brydson, 1999):
)/(
0 exp RTEA (Eq. 4.1)

Chapter 4 Thermal properties of composite material of cement and polymide12 in SLS process
80
where E is the activation energy for viscous flow, 0 is the viscosity; A , a
constant specific to molecule mobility; R , the gas constant, and T , the absolute
temperature.
As the melting temperature, Tm, depends largely on the amount of thermal energy
required to keep the polymer chains moving, a number of factors influence Tm, i.e.
symmetry, intermolecular bonding, branching and molar mass. The symmetry of the
chain shape influences the Tm. More thermal energy is required for polymers that are
sufficiently symmetrical to be considered as smooth, stiff cylindrical rods and this
leads to raised Tm. Intermolecular bonding will affect the melting temperature, so any
interaction between chains in the crystal lattice will help to hold the structure together
more firmly and raise the melting temperature. The branching in the side group tends
to stiffen the chain and raise the melting temperature. The last factor is molar mass
which can change Tm. This is where, if the molar mass in the sample increases, the
melting temperature will rise (Cowie, 1973; Young, 1981; Kohan, 1995; Brydson,
1999).
4.3.3 Crystallisation Temperature Tc
Crystallisation temperature occurs between melting temperature Tm and glass
transition temperature Tg. Usually, the rate of crystallisation is seen between 10K
below melting point and 30K above glass transition temperature (Cowie, 1973). At
temperatures close to melting point, the crystallisation rate is low and large crystal
sizes can be obtained, while at temperatures far below melting point and near Tg, the
Chapter 4 Thermal properties of composite material of cement and polymide12 in SLS process
81
melt is so viscous that molecular motion is extremely slow, thus leading to a faster
crystallisation rate.
The maximum rate of crystallisation takes place at Tc (see Figure 4.3) (Young, 1981)
and this is influenced by molecular mass. The sample with the lower molecular mass
crystallises faster. In addition to this, the presence of homogeneous or heterogeneous
nuclei affects the overall crystallisation rate by facilitating the initial nucleation step.
The reason for this is that even in the melts, some hydrogen bonds remain fixed and
result in effective nucleation sites on cooling. The thermal history should therefore be
erased and all homogeneous nuclei destroyed by holding the product for a sufficient
time in the melt before crystallisation kinetics can take place (Cowie, 1973; Young,
1981; Kohan, 1995).
The growth of a crystal nucleus can take shape in one, two or three dimensions with
the crystals in the form of rods, discs or spheres, respectively. The crystal growth rate
is strongly dependent upon the crystallisation temperature. When the crystallisation
temperature Tc remains just below the melting temperature of the polymer, the
growth rate is relatively low. As mentioned early in Equation 1, when the temperature
is reduced, there will be an increase in viscosity and transport of material to the
growth point will be more difficult. Growth rate therefore peaks, and as the
temperature decreases to close to glass transition temperature, the growth rate
decreases. The growth rate also depends upon the molar mass, M. As M is reduced,
the growth rate increases (see Figure 4.3) (Young, 1981).

Chapter 4 Thermal properties of composite material of cement and polymide12 in SLS process
82
Figure 4.3: Crystallisation temperature Tc with crystal growth rate ν for different
molar mass in g molֿ ¹ (Young, 1981).
Chapter 4 Thermal properties of composite material of cement and polymide12 in SLS process
83
4.4 Molecular weight
The most important property for describing the characteristics of polymers is
molecular weight, which influences the thermal properties of polymers through the
melting viscosity. This is due to the fact that high molecular weight can lead to
difficulties in forming the material, given the high viscosities involved. The common
effects of molecular weight which affect viscosity largely are caused by the amount
of entanglement between the molecules. Consequently an increase in the
entanglement, increases viscosity. Viscosity is directly proportional to the average
molecular weight when the molecular weights fall below a critical molecular weight
value Mc from 5000-1500, but beyond this point viscosity depends on greater power
(see Figure 4.4) (Cowie, 1973; Beamam et al., 1997; Brydson, 1999). It has been
found that melting viscosity varies greatly with changes in the molecular weight for
many polymers, as shown in the equation:
0 = K (Mw)n (Eq.4.2)
where 0 is viscosity and Mw is molecular weight, K is a constant that depends upon
the type of polymer and exponent n=3.4-3.5.
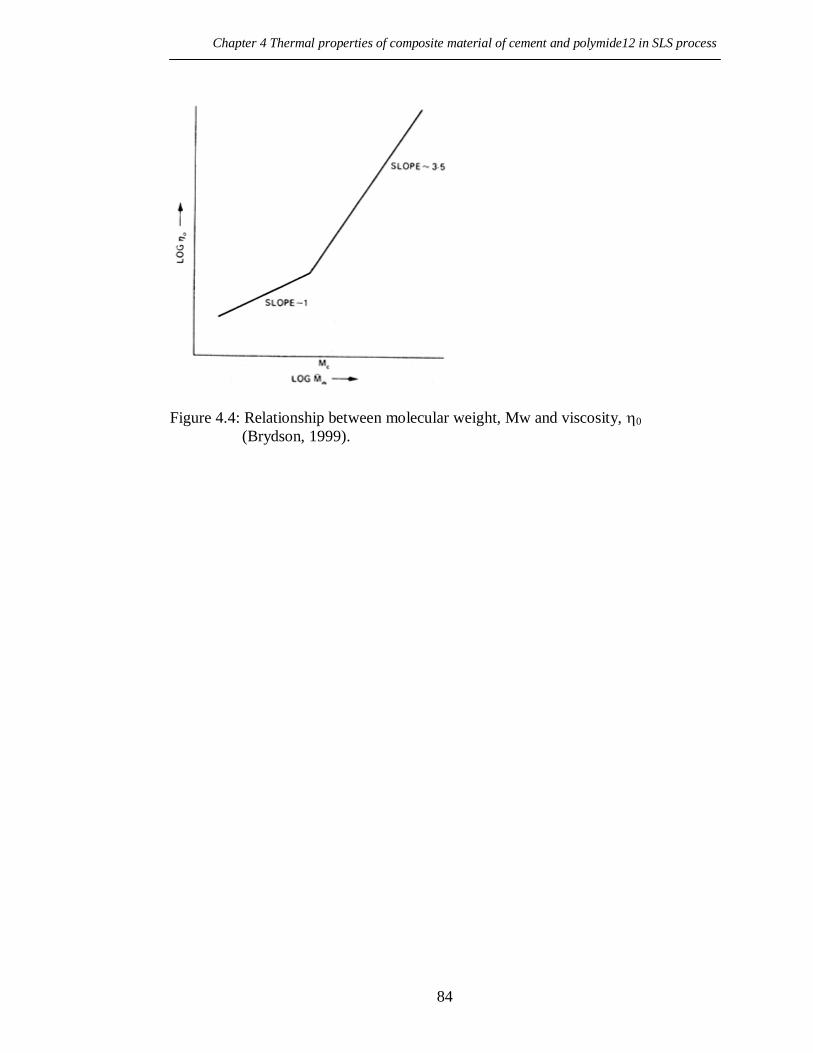
Chapter 4 Thermal properties of composite material of cement and polymide12 in SLS process
84
Figure 4.4: Relationship between molecular weight, Mw and viscosity, 0
(Brydson, 1999).

Chapter 4 Thermal properties of composite material of cement and polymide12 in SLS process
85
4.5 Additives
Additives are commonly used in nylon and these include reinforcements, such as
ceramic and glass fibres. Reinforcements play an essential role in composite material.
They can produce a number of attractive effects in the mechanical properties of
specimens, such as increased flexural strength, compression, stiffness, improvement
in fracture toughness, creep resistance and, in some cases, tensile strength. To be a
candidate for reinforcing nylon, a product must have a melting point above that of
nylon (Kohan, 1995; Gill & Hon, 2004). Additives of filler to polyamide directly
affect viscosity. As the fillers increase, the viscosity of the composite material
increases proportionally (see Figure 4.5). The Einstein equation declares that the filler
increases viscosity in a consistent manner:
(Eq.4.3)
while the Guth equation declares a simple extension of Einstein‟s relationship to
higher concentration (Kohan, 1995):
(Eq.4.4)
Here, c represents the viscosity of the filled polymer at the volume concentration, ,
and 0 consists of the zero shear rate melt viscosity of the unfilled polymer.
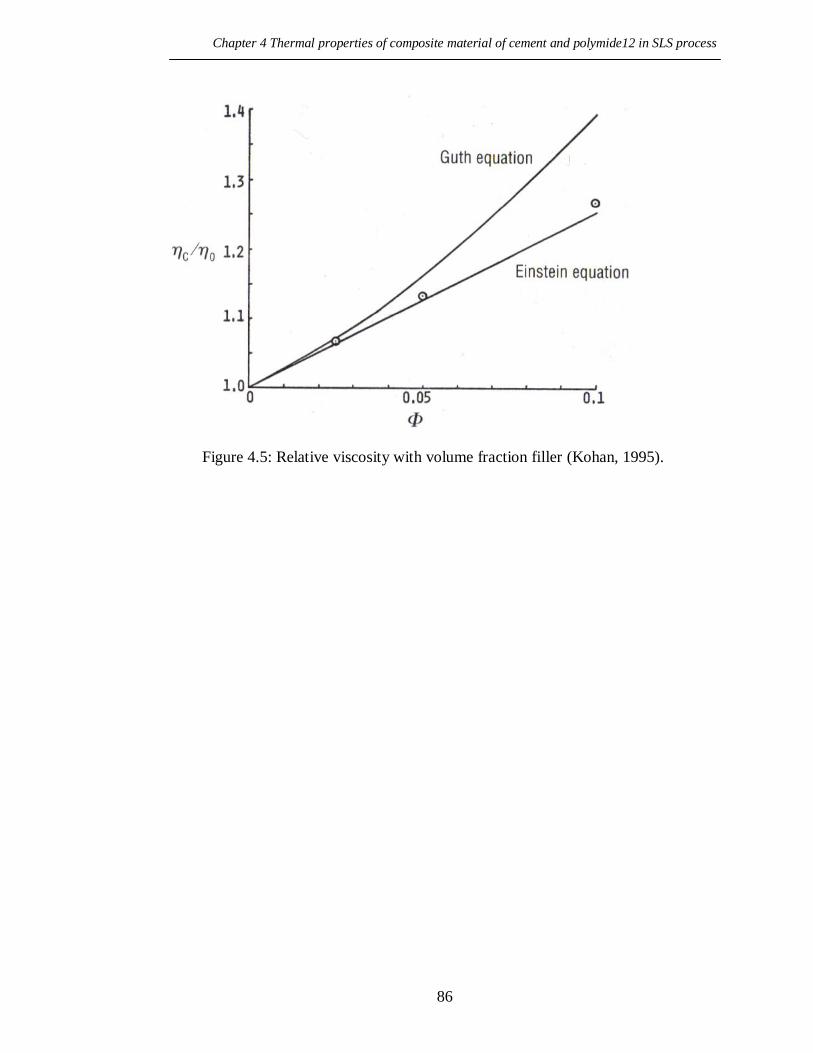
Chapter 4 Thermal properties of composite material of cement and polymide12 in SLS process
86
Figure 4.5: Relative viscosity with volume fraction filler (Kohan, 1995).

Chapter 4 Thermal properties of composite material of cement and polymide12 in SLS process
87
4.6 Experimental work
4.6.1 Methodology
In order to simulate the conditions of the SLS process, the samples were set in the
Oven Heraeus Instruments Vacutherm, Type 6060M, in an optimal nitrogen
atmosphere to prevent the powders from oxidising (yellowing), and heated at a
specified temperature for varying periods. The samples were heated at temperatures
100ºC and 180ºC, the reason being that 100ºC is considered the minimum degree to
which the powder in the left and right cartridges can be exposed through the SLS
process, while 180ºC is considered the maximum degree to which the powder may be
exposed through the SLS process while located in the bed part. The samples were
kept for 20, 40, 60, 80, and 100 hours at each temperature. They were heated using
two methods, continuous heating and cyclic heating. The first method was used to
simulate the SLS process for one build and the second method for simulating the SLS
process for a number of builds by taking out the samples from the oven to cool down
to room temperature before returning them to the oven. Samples of new and recycled
grade powder were tested, and the results analysed to investigate the effect of the
temperature, time and number of builds on the powder properties.

Chapter 4 Thermal properties of composite material of cement and polymide12 in SLS process
88
4.6.2 Results and discussion
4.6.2.1 Effect of the cement proportion on viscosity, melt flow rate, thermal
behaviour and molecular weight of Polyamide 12
Graphs relating to viscosity, melt flow rate, thermal behaviour and molecular weight
values of cement/PA12 composite in relation to various proportions of cement are
shown in Figures 4.6 to 4.9. As mentioned earlier in Section 4.5, and Equations 3 and
4, the direct addition of filler to Polyamide 12 theoretically affects viscosity. As the
fillers increase, the viscosity of the composite material increases proportionally. In
this experiment, viscosity and melt flow rate of cement/PA12 composite is affected
via different proportions of cement added to Polyamide 12. Figures 4.6 and 4.7 show
that average, minimum and maximum results were tested using the Melt Flow Rate
Indexer. From Figure 4.6, the relationship between the viscosity of the composite and
weight fraction (wt%) of the cement can be observed. It can be seen that the viscosity
increases gradually with an increase in the weight fraction (wt%) of the cement. From
the results obtained, this suggests that cement particles can affect the melt viscosity of
the composite. This means that the addition of rigid particles such as cement to
Polyamide 12 can increase viscosity due to the decrease in melted Polyamide 12 and
the fact that the gap between the cement particles becomes narrower. This leads to
stickier extruded material.
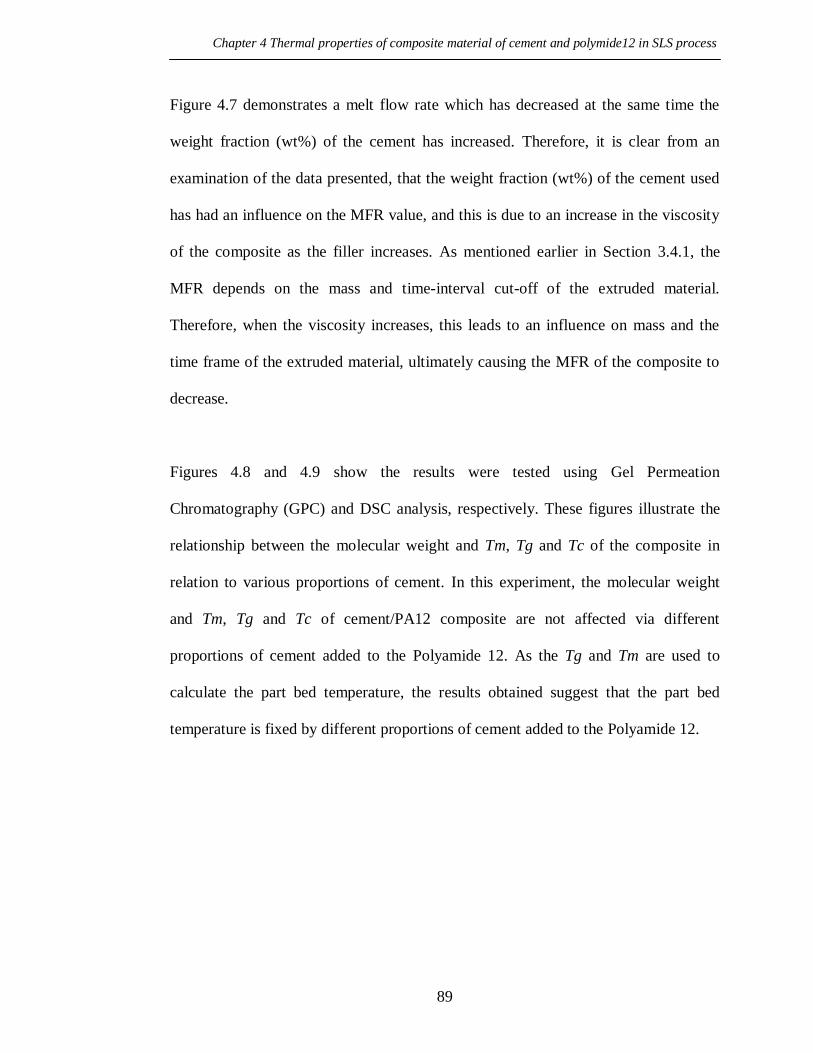
Chapter 4 Thermal properties of composite material of cement and polymide12 in SLS process
89
Figure 4.7 demonstrates a melt flow rate which has decreased at the same time the
weight fraction (wt%) of the cement has increased. Therefore, it is clear from an
examination of the data presented, that the weight fraction (wt%) of the cement used
has had an influence on the MFR value, and this is due to an increase in the viscosity
of the composite as the filler increases. As mentioned earlier in Section 3.4.1, the
MFR depends on the mass and time-interval cut-off of the extruded material.
Therefore, when the viscosity increases, this leads to an influence on mass and the
time frame of the extruded material, ultimately causing the MFR of the composite to
decrease.
Figures 4.8 and 4.9 show the results were tested using Gel Permeation
Chromatography (GPC) and DSC analysis, respectively. These figures illustrate the
relationship between the molecular weight and Tm, Tg and Tc of the composite in
relation to various proportions of cement. In this experiment, the molecular weight
and Tm, Tg and Tc of cement/PA12 composite are not affected via different
proportions of cement added to the Polyamide 12. As the Tg and Tm are used to
calculate the part bed temperature, the results obtained suggest that the part bed
temperature is fixed by different proportions of cement added to the Polyamide 12.

Chapter 4 Thermal properties of composite material of cement and polymide12 in SLS process
90
1
1.5
2
2.5
3
3.5
4
0 5 10 15 20 25 30
Wt%
Vis
cosi
ty X
E2
(P
a.S
)
Figure 4.6: Variation of viscosity with cement content added to Polyamide 12.
20
25
30
35
40
45
50
55
60
0 5 10 15 20 25 30
Wt%
Mel
t F
low
Rat
e (g
/10m
in)
Figure 4.7: Variation of MFR with cement content added to Polyamide 12.
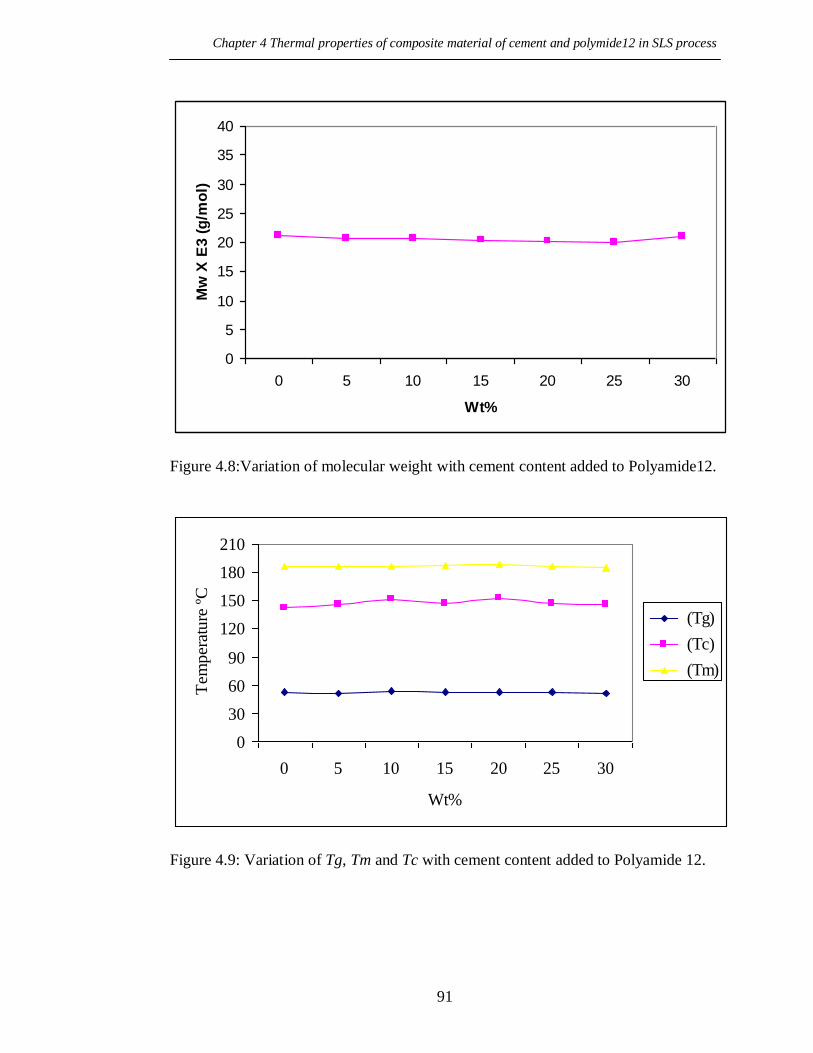
Chapter 4 Thermal properties of composite material of cement and polymide12 in SLS process
91
0
5
10
15
20
25
30
35
40
0 5 10 15 20 25 30
Wt%
Mw
X E
3 (
g/m
ol)
Figure 4.8:Variation of molecular weight with cement content added to Polyamide12.
0
30
60
90
120
150
180
210
0 5 10 15 20 25 30
Wt%
Tem
per
ature
ºC
(Tg)
(Tc)
(Tm)
Figure 4.9: Variation of Tg, Tm and Tc with cement content added to Polyamide 12.

Chapter 4 Thermal properties of composite material of cement and polymide12 in SLS process
92
4.6.2.2 Effect of temperature and time on molecular weight
In this experiment, composite material of cement/PA12 was exposed to 100ºC and
180ºC temperatures in an oven with a nitrogen atmosphere. The purpose was to
simulate the deterioration of the composite powder during the SLS process and after
that, arrive at the maximum proportion of used powder that can be re-used in the SLS
process.
Figure 4.10 show the results were tested using Gel Permeation Chromatography
(GPC). This figure illustrates the relationship between the molecular weight (Mw)
and the heating period. It can be seen from the figure that the powder heated to 100ºC
(considered to be the minimum degree the powder is exposed to during the SLS
process) has a lower molecular weight and experiences a leisurely increase compared
to the powder heated at 180ºC. For instance, the fastest change in molecular weight
takes place at 180ºC. Temperature plays an essential role in the Mw, as shown in
Figure 4.10. Mw at the high temperature of 180ºC increases rapidly for the first 25
hours from 20 E3 g/mol to 141 E3 g/mol. After a 25 hour heating period, the increase
in Mw is slower. From this Figure, it can be seen that temperature has a more
significant influence on the Mw of the powder than SLS time. It is therefore Mw
which affects the quality of SLS parts.
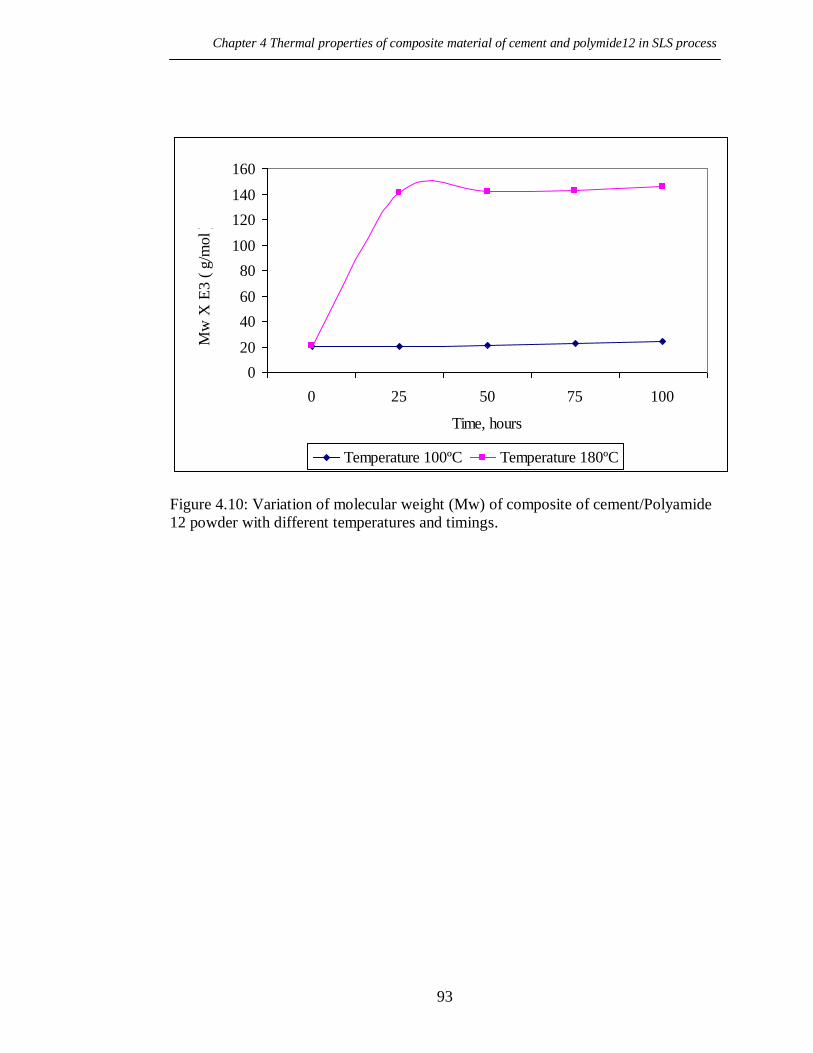
Chapter 4 Thermal properties of composite material of cement and polymide12 in SLS process
93
0
20
40
60
80
100
120
140
160
0 25 50 75 100
Time, hours
M
w X
E3
( g
/mo
l )
Temperature 100ºC Temperature 180ºC
Figure 4.10: Variation of molecular weight (Mw) of composite of cement/Polyamide
12 powder with different temperatures and timings.

Chapter 4 Thermal properties of composite material of cement and polymide12 in SLS process
94
4.6.2.3 Effect of temperature and time on the viscosity and melt flow rate
As mentioned earlier in Section 4.4, Equation 2 theoretically demonstrates that the
viscosity of polyamide is affected by molecular weight. As molecular weight depends
on the exposure of the powder to various temperatures, the viscosity of the powder
directly increases (see Figure 4.11). In this experiment, the composite material of
cement/PA12 has been exposed to temperatures as described in Section 4.6.2.2 and
the results are presented in Figures 4.12 and 4.13.
Figures 4.12 and 4.13 demonstrate the results of viscosity and MFR, respectively, of
the composite material of cement/PA12. These have been through varying
temperatures and timings, and were tested using the Melt Flow Rate Indexer. From
these Figures, it is clear that temperature and heating time play an essential role in the
viscosity and MFR of the composite material. The largest increase in viscosity
appears to be at 180ºC in the first 25 hours, so it is clear from Figure 4.12 there is a
rapid increase in viscosity at 180ºC during the first 25 hours, and then a gradual
increase after that period. In contrast, at the same temperature of 180ºC and during
the same time period, the largest decrease in MFR occurs (see Figure 4.13). This has
been attributed to increased molecular weight, thus leading to an increase in viscosity,
followed by decreasing MFR. New powder unexposed to temperature has the lowest
viscosity and highest MFR, while powder exposed to the highest temperatures and
longest time periods has the highest viscosity and lowest MFR.
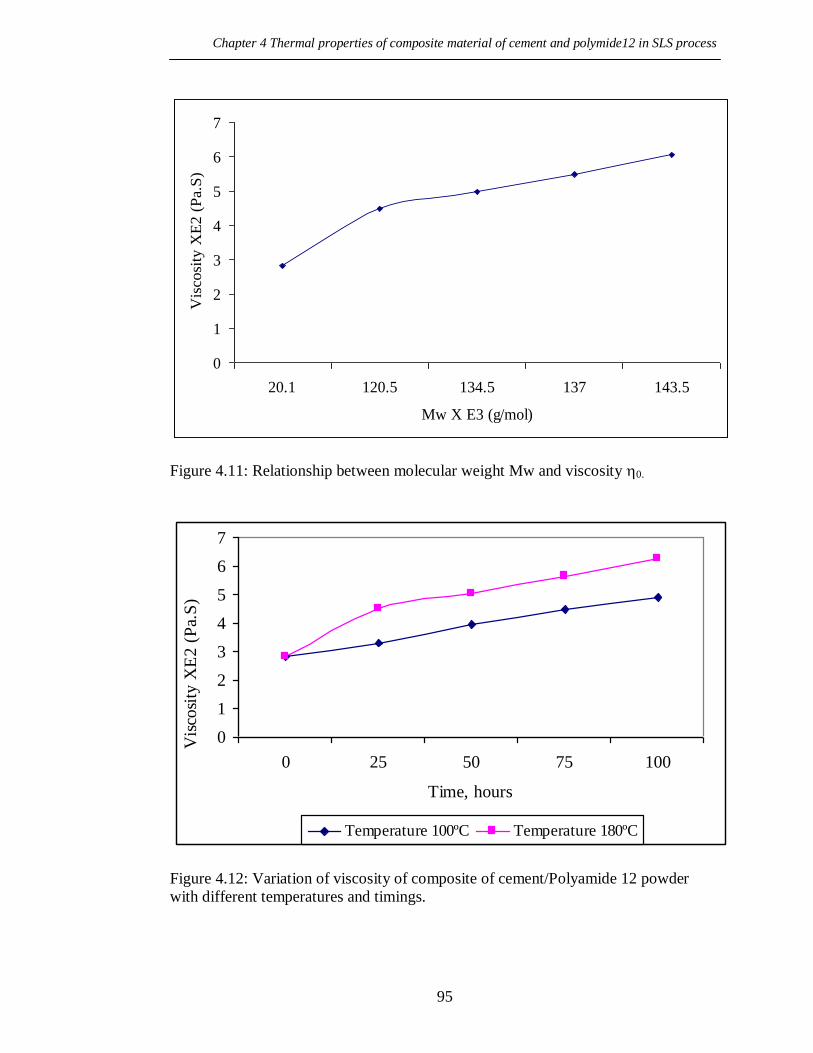
Chapter 4 Thermal properties of composite material of cement and polymide12 in SLS process
95
0
1
2
3
4
5
6
7
20.1 120.5 134.5 137 143.5
Mw X E3 (g/mol)
Vis
cosi
ty X
E2
(P
a.S
)
Figure 4.11: Relationship between molecular weight Mw and viscosity 0.
0
1
2
3
4
5
6
7
0 25 50 75 100
Time, hours
Vis
cosi
ty X
E2
(P
a.S
)
Temperature 100ºC Temperature 180ºC
Figure 4.12: Variation of viscosity of composite of cement/Polyamide 12 powder
with different temperatures and timings.

Chapter 4 Thermal properties of composite material of cement and polymide12 in SLS process
96
0
5
10
15
20
25
30
35
40
45
0 25 50 75 100
Time, hours
Mel
t F
low
Rat
e g
/10m
in
Temperature 100ºC Temperature 180ºC
Figure 4.13: Variation of MFR of composite of cement/Polyamide 12 powder with
different temperatures and timings.

Chapter 4 Thermal properties of composite material of cement and polymide12 in SLS process
97
4.6.2.4 Effect of continuous and cyclic heat on MFR and molecular weight
In the following experiments, the samples of composite material of cement/PA12
were exposed to a temperature of 180ºC in an oven with a nitrogen atmosphere, and a
heating method referred to as „continuous‟ and „cyclic‟ heating. In the cyclic heating
method, the powder samples were placed in the oven at a temperature of 180ºC and
heated for 25 hours. They were then taken out and cooled to room temperature. After
a small amount of the powder was taken to measure and record MFR and molecular
weight, they were returned to the oven for another 25 hours. This procedure was
repeated in 25 hour periods for up to 100 hours in total. The results of these
experiments are shown in a bar chart format in Figures 4.14 and 4.15. The purpose is
to explore whether cyclic heating would have a different effect on composite powder
deterioration from SLS time alone.
Figure 4.14 and 4.15 show the molecular weight and MFR, respectively, of composite
material of cement/PA12, obtained through two methods of heating, continuous and
cyclic. These results show a clear trend of slightly faster deterioration of the samples
subjected to continuous heating, compared with those subjected to cyclic heating.
Generally, the difference between these methods does not have as significant an
effect on molecular weight and MFR as the influence of temperature and heating
period do on material deterioration.

Chapter 4 Thermal properties of composite material of cement and polymide12 in SLS process
98
0
20
40
60
80
100
120
140
160
0 25 50 75 100
Time, hours
Mw
X E
3 (
g/m
ol )-
Cyclic Continuous
Figure 4.14: Effect of continuous and cyclic heat on Mw of composite of
cement/Polyamide 12 powder.
10
15
20
25
30
35
40
45
0 25 50 75 100
Time, hours
Mel
t Flo
w R
ate
(g/1
0min
)-
Cyclic Continuous
Figure 4.15: Effect of continuous and cyclic heat on MFR of composite of
cement/Polyamide 12 powder.
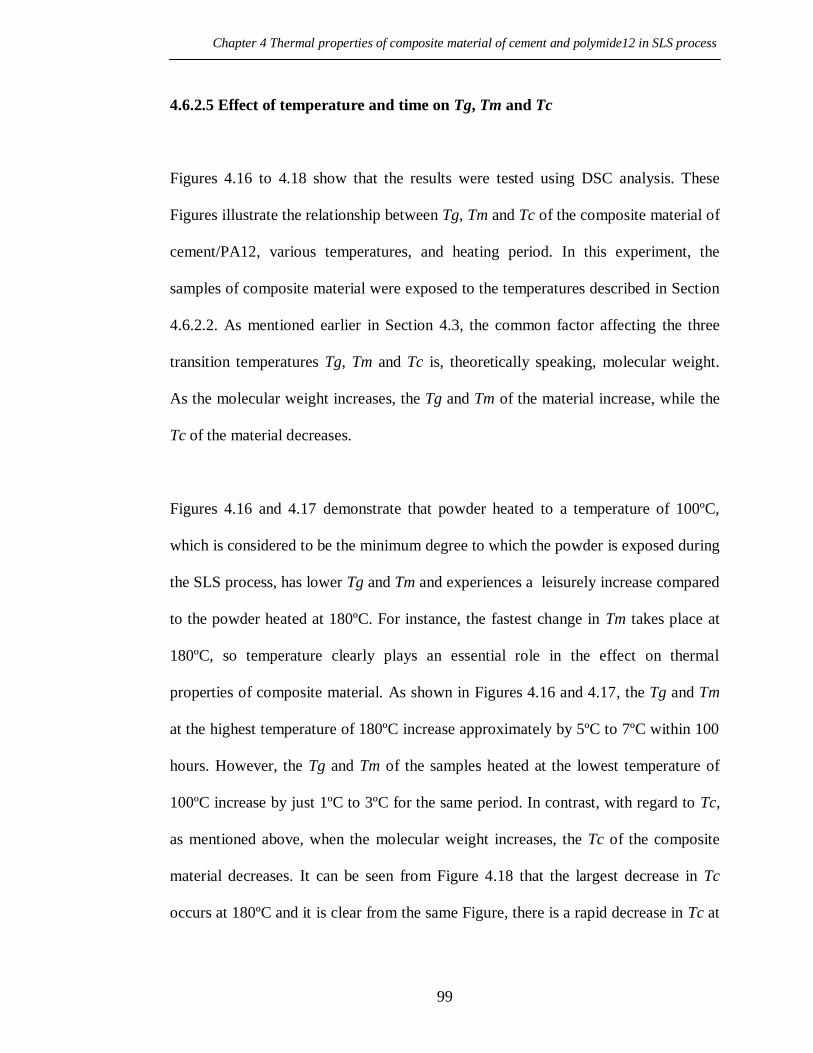
Chapter 4 Thermal properties of composite material of cement and polymide12 in SLS process
99
4.6.2.5 Effect of temperature and time on Tg, Tm and Tc
Figures 4.16 to 4.18 show that the results were tested using DSC analysis. These
Figures illustrate the relationship between Tg, Tm and Tc of the composite material of
cement/PA12, various temperatures, and heating period. In this experiment, the
samples of composite material were exposed to the temperatures described in Section
4.6.2.2. As mentioned earlier in Section 4.3, the common factor affecting the three
transition temperatures Tg, Tm and Tc is, theoretically speaking, molecular weight.
As the molecular weight increases, the Tg and Tm of the material increase, while the
Tc of the material decreases.
Figures 4.16 and 4.17 demonstrate that powder heated to a temperature of 100ºC,
which is considered to be the minimum degree to which the powder is exposed during
the SLS process, has lower Tg and Tm and experiences a leisurely increase compared
to the powder heated at 180ºC. For instance, the fastest change in Tm takes place at
180ºC, so temperature clearly plays an essential role in the effect on thermal
properties of composite material. As shown in Figures 4.16 and 4.17, the Tg and Tm
at the highest temperature of 180ºC increase approximately by 5ºC to 7ºC within 100
hours. However, the Tg and Tm of the samples heated at the lowest temperature of
100ºC increase by just 1ºC to 3ºC for the same period. In contrast, with regard to Tc,
as mentioned above, when the molecular weight increases, the Tc of the composite
material decreases. It can be seen from Figure 4.18 that the largest decrease in Tc
occurs at 180ºC and it is clear from the same Figure, there is a rapid decrease in Tc at

Chapter 4 Thermal properties of composite material of cement and polymide12 in SLS process
100
180ºC and 100ºC within the first 25 hours, and then a gradual decrease after that
period. From these results, the Tg, Tm and Tc are used to calculate the part bed
temperature and thermal properties of the selected samples and these indicate that the
thermal properties of the composite material of cement/PA12 change with
reprocessing, thus affecting the properties of SLS parts.

Chapter 4 Thermal properties of composite material of cement and polymide12 in SLS process
101
48
50
52
54
56
58
60
62
0 25 50 75 100
Time, hours
Gla
ss T
ransi
tion T
emper
ature
(T
g),
ºC
.
Temperature 100ºC Temperature 180ºC
Figure 4.16: Effect of temperature and time on Tg of composite of cement/Polyamide
12 powder.
183
184
185
186
187
188
189
190
0 25 50 75 100
Time, hours
Mel
tin
g T
emp
erat
ure
(T
m),
ºC-
Temperature 100ºC Temperature 180ºC
Figure 4.17: Effect of temperature and time on Tm of composite of cement/Polyamide
12 powder.

Chapter 4 Thermal properties of composite material of cement and polymide12 in SLS process
102
143
144
145
146
147
148
149
150
151
152
153
0 25 50 75 100
Time, hours
Cry
stal
lisa
tion T
emper
ature
(Tc)
,ºC
-
Temperature 100ºC Temperature 180ºC
Figure 4.18: Effect of temperature and time on Tc of composite of cement/Polyamide
12 powder.

Chapter 4 Thermal properties of composite material of cement and polymide12 in SLS process
103
4.7 Discussion
A better understanding of the thermal properties of composite material of cement and
PA12 of both virgin powder, and used, un-sintered powder, is an enormous help in
controlling SLS parameters and maintaining consistent quality of the fabricated SLS
specimens.
The combined indications of the differential scanning calorimeter suggest that the
different proportions of cement added to the Polyamide 12 are not change the glass
transition temperature Tg, melting temperature Tm or crystallisation temperature, Tc.
This can lead to fixing the part bed temperature with different proportions of cement
added to the Polyamide 12, while the melt flow rate index test proposes that the
addition of cement particles to Polyamide 12 affects the melt flow rate of the
composite. As the proportion of cement increases, so does its viscosity, due to the
decrease in melted Polyamide 12 and the fact that the gap between the cement
particles becomes narrower. This leads to the extruded material becoming stickier,
which is a sign of a decrease in the MFR index. It ultimately affects the quality and
surface finish of the fabricated SLS specimens.
Huge amounts of powder left un-sintered during SLS could be reused depending on
their properties. However, the properties of un-sintered powder deteriorate due to
exposure to high temperatures, e.g. just below the melting point of the composite
material for an extended period of time during SLS building and the cool-down stage.
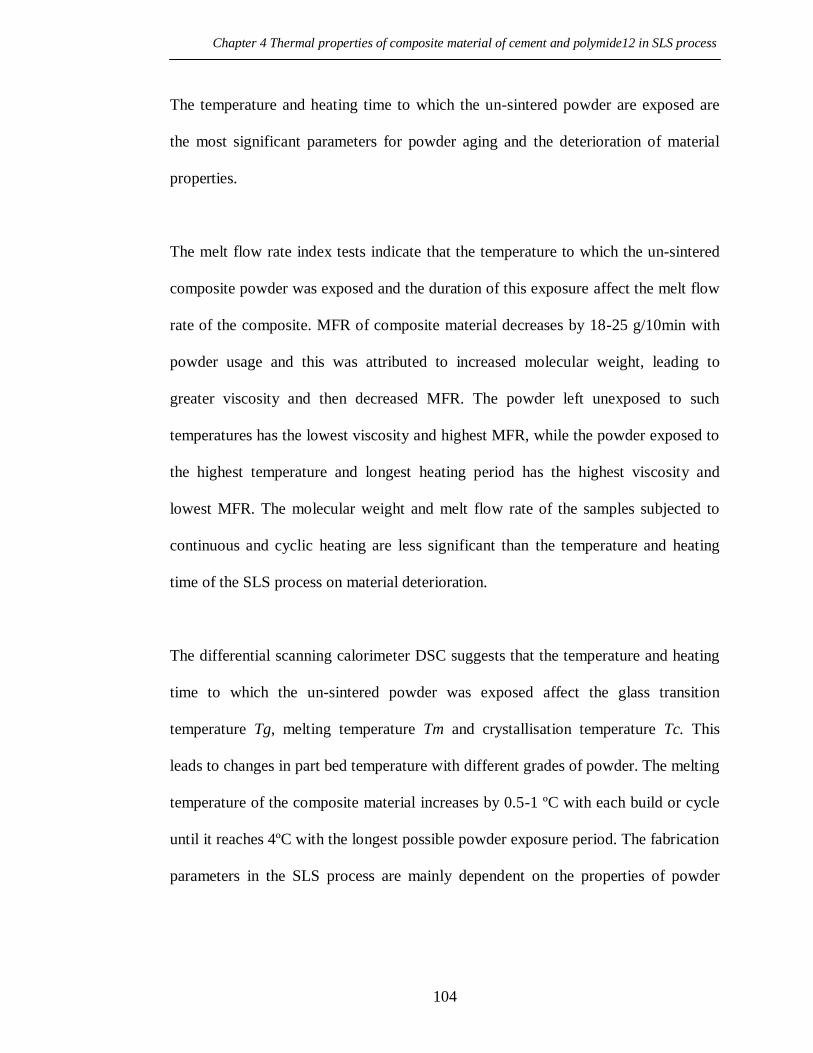
Chapter 4 Thermal properties of composite material of cement and polymide12 in SLS process
104
The temperature and heating time to which the un-sintered powder are exposed are
the most significant parameters for powder aging and the deterioration of material
properties.
The melt flow rate index tests indicate that the temperature to which the un-sintered
composite powder was exposed and the duration of this exposure affect the melt flow
rate of the composite. MFR of composite material decreases by 18-25 g/10min with
powder usage and this was attributed to increased molecular weight, leading to
greater viscosity and then decreased MFR. The powder left unexposed to such
temperatures has the lowest viscosity and highest MFR, while the powder exposed to
the highest temperature and longest heating period has the highest viscosity and
lowest MFR. The molecular weight and melt flow rate of the samples subjected to
continuous and cyclic heating are less significant than the temperature and heating
time of the SLS process on material deterioration.
The differential scanning calorimeter DSC suggests that the temperature and heating
time to which the un-sintered powder was exposed affect the glass transition
temperature Tg, melting temperature Tm and crystallisation temperature Tc. This
leads to changes in part bed temperature with different grades of powder. The melting
temperature of the composite material increases by 0.5-1 ºC with each build or cycle
until it reaches 4ºC with the longest possible powder exposure period. The fabrication
parameters in the SLS process are mainly dependent on the properties of powder

Chapter 4 Thermal properties of composite material of cement and polymide12 in SLS process
105
used, so changing the fabrication parameters as the powder aged, gives consistently
and high quality fabricated SLS specimens.
As the powder degrades due to exposure to high temperatures for an extended period
in the SLS system, the quality and surface finish of the fabricated SLS specimens
become poorer. Therefore the amount of virgin power to be added to achieve the
target melt index range appears too vary from 25% to 42% depending on the length
of time the powder was exposed to the respective temperature. The melt flow rate
index has therefore proved to be a good indicator of powder fitness.
4.8 Summary
This chapter focuses on understanding the thermal properties of different proportions
of composite material of cement/PA12 to determine the optimum parameters of the
SLS process. In addition, it examines the thermal and physical properties of used or
un-sintered powder in order to develop a methodology for controlling SLS
parameters, and so, in turn, to obtain consistent, good quality fabricated SLS
specimens. The most significant factors affecting the aging or deterioration of
composite material of cement/PA12 are the temperatures and heating times to which
the un-sintered powder was exposed.

Chapter 5 Mechanical properties of sintered components
106
Chapter 5
Mechanical Properties of Selective Laser Sintered
Cement and Polyamide 12 Composite
5.1 Preliminaries
In the work reported in this chapter, selective laser sintering is used to produce
mechanical specimens of composite material made up of cement and Polyamide 12.
The chapter discusses the interactions between cement and Polyamide 12 particles
and between Polyamide 12 themselves. It describes an experimental investigation of
tensile, Young's modulus, flexural, compression, impact strengths and density, to
determine the effects of varying the energy density (ED) generated by the laser and
the proportion of cement additive to Polyamide 12 on the physical and mechanical
properties of sintered specimens.
The effect of using un-sintered powder on MFR and mechanical properties is
investigated to determine the usability of the powder. In addition, the mechanical
properties of actual parts produced using SLS are compared with data-sheet values
for PA12 material, in order to generate confidence in its mechanical properties. The
effects of varying ED on composite material properties is explained by examining the
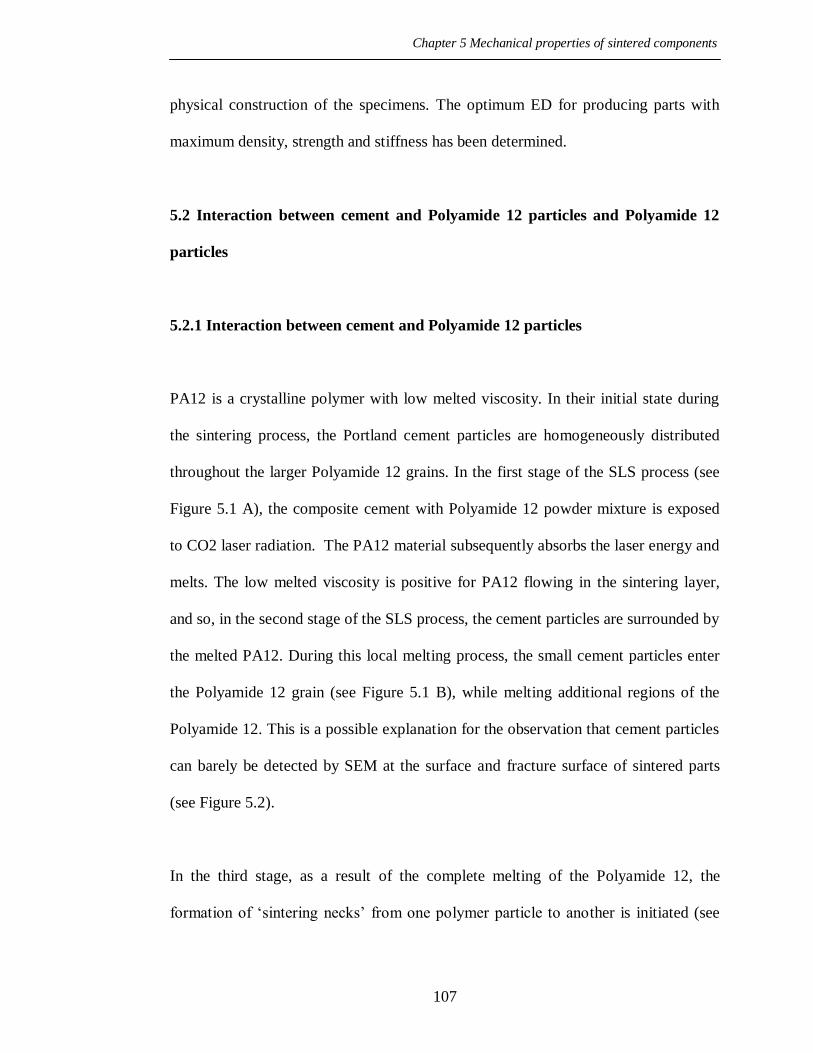
Chapter 5 Mechanical properties of sintered components
107
physical construction of the specimens. The optimum ED for producing parts with
maximum density, strength and stiffness has been determined.
5.2 Interaction between cement and Polyamide 12 particles and Polyamide 12
particles
5.2.1 Interaction between cement and Polyamide 12 particles
PA12 is a crystalline polymer with low melted viscosity. In their initial state during
the sintering process, the Portland cement particles are homogeneously distributed
throughout the larger Polyamide 12 grains. In the first stage of the SLS process (see
Figure 5.1 A), the composite cement with Polyamide 12 powder mixture is exposed
to CO2 laser radiation. The PA12 material subsequently absorbs the laser energy and
melts. The low melted viscosity is positive for PA12 flowing in the sintering layer,
and so, in the second stage of the SLS process, the cement particles are surrounded by
the melted PA12. During this local melting process, the small cement particles enter
the Polyamide 12 grain (see Figure 5.1 B), while melting additional regions of the
Polyamide 12. This is a possible explanation for the observation that cement particles
can barely be detected by SEM at the surface and fracture surface of sintered parts
(see Figure 5.2).
In the third stage, as a result of the complete melting of the Polyamide 12, the
formation of „sintering necks‟ from one polymer particle to another is initiated (see
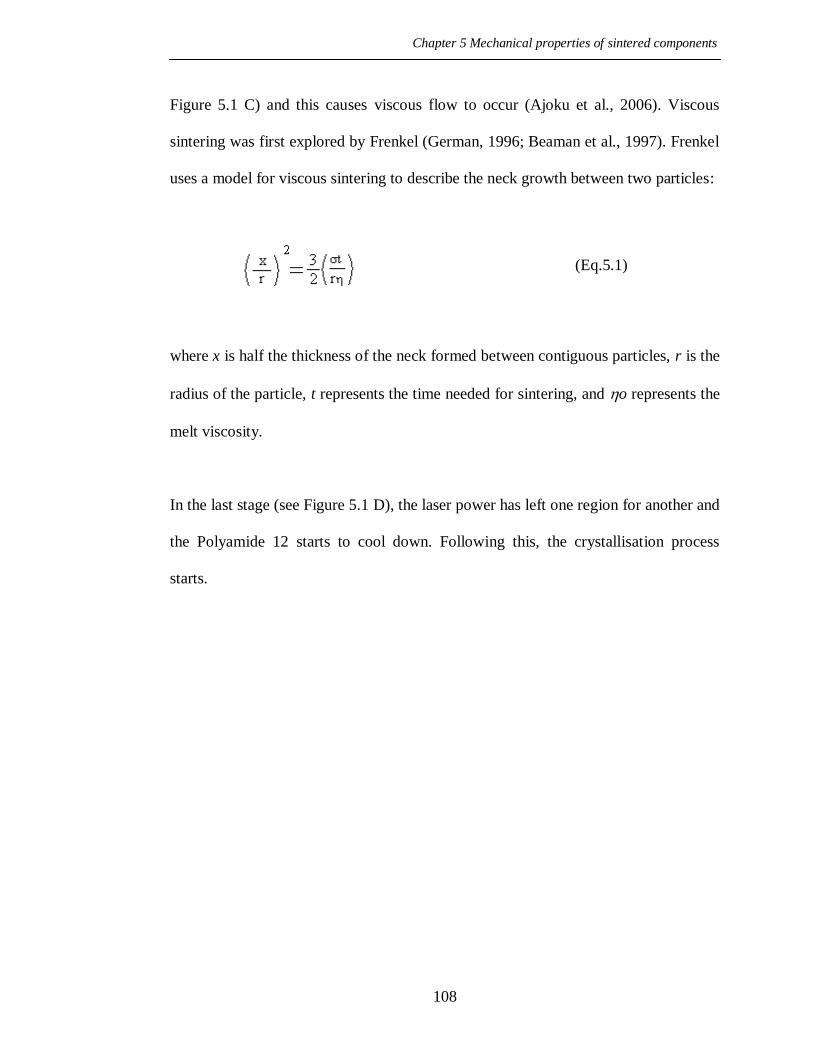
Chapter 5 Mechanical properties of sintered components
108
Figure 5.1 C) and this causes viscous flow to occur (Ajoku et al., 2006). Viscous
sintering was first explored by Frenkel (German, 1996; Beaman et al., 1997). Frenkel
uses a model for viscous sintering to describe the neck growth between two particles:
where x is half the thickness of the neck formed between contiguous particles, r is the
radius of the particle, t represents the time needed for sintering, and o represents the
melt viscosity.
In the last stage (see Figure 5.1 D), the laser power has left one region for another and
the Polyamide 12 starts to cool down. Following this, the crystallisation process
starts.
(Eq.5.1)

Chapter 5 Mechanical properties of sintered components
109
Figure 5.1 illustrates the various states of the sintering process for SLS.
(A) State one: laser energy absorption by PA12 particles; (B) State two: cement
particles are surrounded by the PA12 melt; (C) State three: the PA12 particles are
completely melted and sintering necks start to form; (D) Final state: laser exposure is
carried out and the sintered layer has begun to form.
Figure 5.2: Electron micrograph scans of the fracture surface of
the PA12 and cement specimen.

Chapter 5 Mechanical properties of sintered components
110
5.2.2 Interaction between Polyamide 12 particles themselves
During the SLS process, the higher ED leads to an increase in neck radius between
sintered particles, reducing porosity and consequently promoting greater bonding
between the particles as well as increased density. The sintering process is considered
to be a thermal treatment for bonding particles which often takes place on an atomic
scale (German, 1996; Ajoku et al., 2006).
The bond between the particles forms in three directions, X, Y and Z. During the first
stage, after they have been exposed to a laser beam, the particles bond together with a
neck which begins in the X axis (see Figure 5.3 A). After that, the laser beam moves
in the Y axis to scan the next vector and the particles bond together with a neck
which starts in the Y axis (see Figure 5.3 B). A new layer of powder is spread when
the first layer has been sintered completely and particles bond together with a neck
which starts in the Z axis (see Figure 5.3 C). The bond strength between the particles
depends totally on the temperature, and consequently the size of the neck radius in
the X axis is considered to be the maximum size, while the smallest neck radius is
found on the Z axis because the particles in the previous layer have cooled and led to
a reduction in the neck radius between sintered particles. The thickness of the neck
formed between contiguous particles in the Y axis is less than in the X axis due to the
fact that particles in the vector along the X axis are of a higher temperature than the
particles between vectors in the Y axis (see Figure 5.3 B).

Chapter 5 Mechanical properties of sintered components
111
A high-quality SLS part requires careful control of parameters that determine particle
fusion. The major build parameters in the SLS process are laser power, scan-spacing,
laser scanning speed, bed temperature, layer thickness and part-build orientation. ED
equals energy transferred to the surface of the part bed and can be calculated from the
laser power, scan-spacing and laser scanning speed, which are considered to have
relatively greater effect on ED than other factors. To produce high-quality functional
SLS parts, it is important that the powder on the surface of the part-bed receives a
sufficient amount of ED through the laser sintering process. This can be calculated by
using the following equation:
ED = (Eq.5.2)
where P is the laser power during scanning exposure, SCSP is the scan-spacing and
LS is the laser speed during scanning exposure. However, the high ED of a laser
beam results in better fusion of the Polyamide 12 particles, consequently leading to a
decrease in porosity and enabling a more compact structure to be built. Excessively
high ED will cause degradation of the Polyamide 12, hard part cake, difficulty in
taking parts out of the build, roughness, and a part surface which is light brown due to
overheating. On the other hand, at low ED levels, the part is likely to have
insufficient bonding between powder particles, thus leading to higher porosity and a
weak part (Caulfield et al., 2007).
P
LS * SCSP
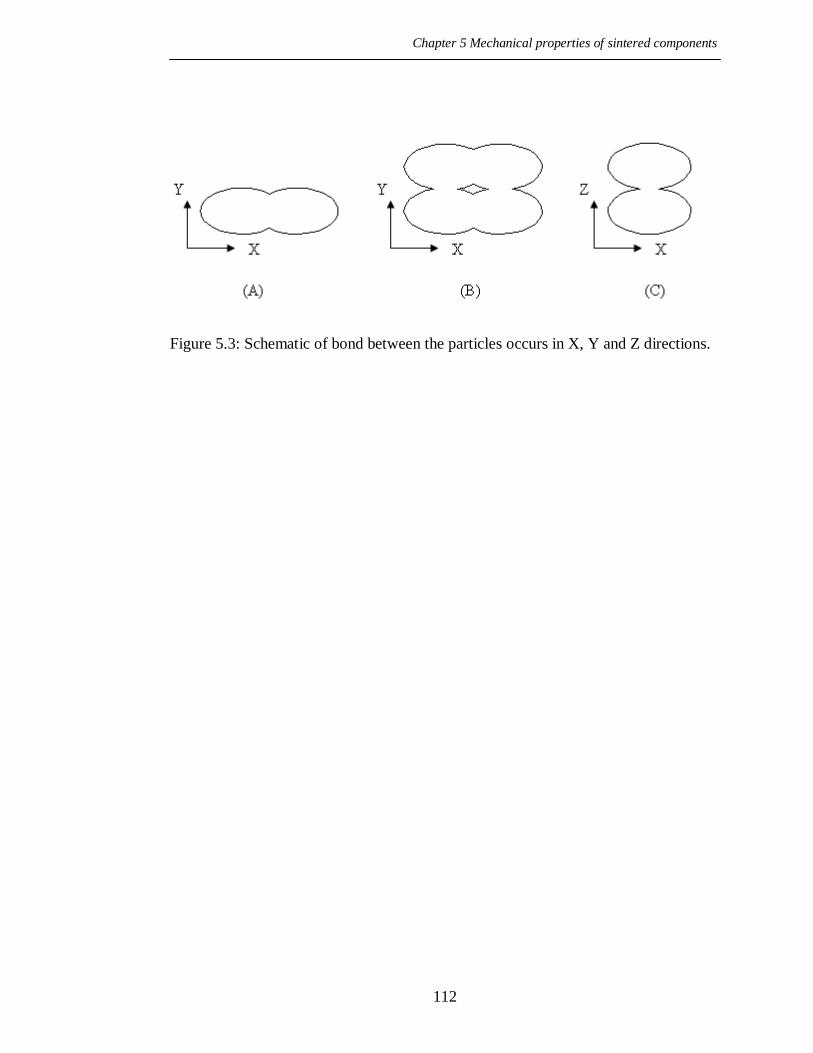
Chapter 5 Mechanical properties of sintered components
112
Figure 5.3: Schematic of bond between the particles occurs in X, Y and Z directions.

Chapter 5 Mechanical properties of sintered components
113
5.3 Experimentation
5.3.1 Sample preparation
Composite of cement and PA12 was sifted by an intensive shaking procedure using a
VORTI-SIV sifter to avoid agglomerates of powder. After this, composite powder
was mechanically mixed in a determinate formulation (see Table 5.1) using a high-
speed mixer for 20 minutes to obtain homogeneous powder mixtures of uniform
colour. The blended powder is then transferred onto the Sinterstation 2000 into two
feed cartridges. The sintering condition is adjusted by changing the applied laser
power between 4.5 and 8 Watts, with a laser scanning speed of 914 mm/s, scan-
spacing of 0.15 mm, layer thickness of 0.1 mm and a part bed temperature of 177-
178 C. When the parts have been sintered, they are removed from the parts cake and
manually cleaned using a brush, before being sandblasted and passed under
pressurised air to remove remnants of the powder on the surface of part. The EDs
applied to the SLS parts are calculated using Eq. (2) and this is indicated in Table 5.2.
The sintered parts are then observed using an SEM. As the samples are not made of
conductive material, gold coating is needed to improve electron conductivity before
capturing images with the Cam Scan.
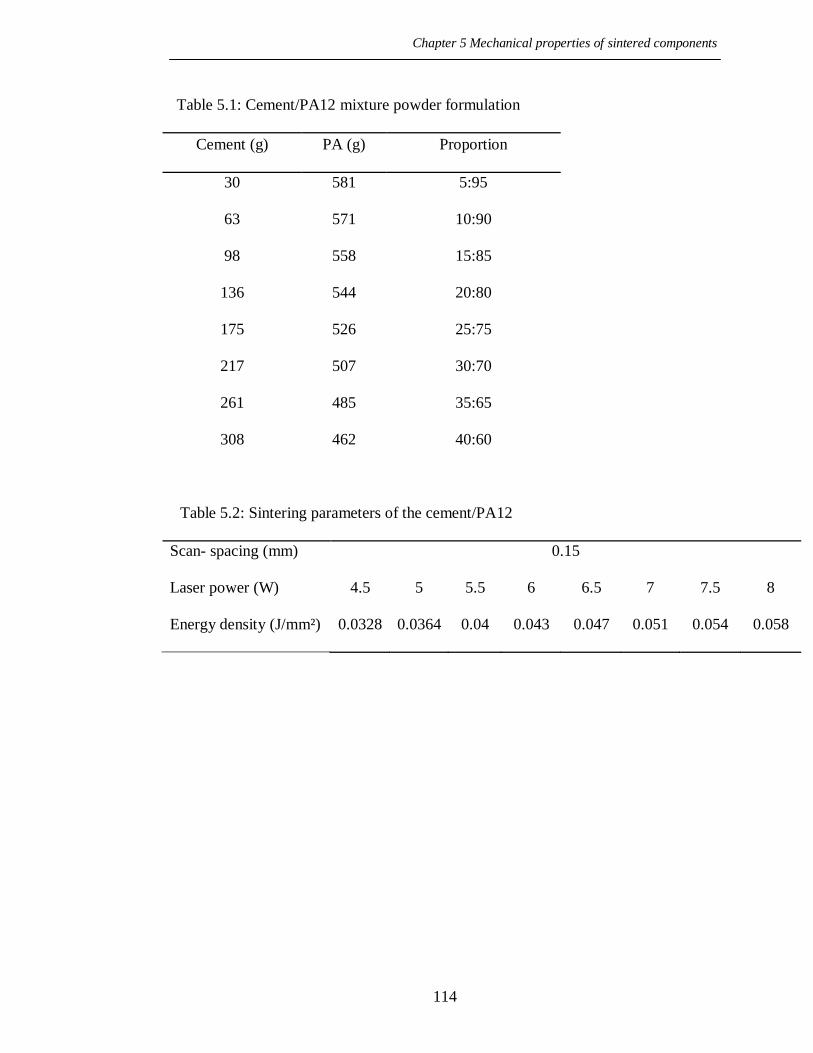
Chapter 5 Mechanical properties of sintered components
114
Table 5.1: Cement/PA12 mixture powder formulation
Cement (g) PA (g) Proportion
30 581 5:95
63 571 10:90
98 558 15:85
136 544 20:80
175 526 25:75
217 507 30:70
261 485 35:65
308 462 40:60
Table 5.2: Sintering parameters of the cement/PA12
Scan- spacing (mm) 0.15
Laser power (W) 4.5 5 5.5 6 6.5 7 7.5 8
Energy density (J/mm²) 0.0328 0.0364 0.04 0.043 0.047 0.051 0.054 0.058

Chapter 5 Mechanical properties of sintered components
115
5.3.2 Measurement and test specimens
The tensile, flexural and compression specimens were tested using a Testomeric
M500 machine and were determined with reference to ISO 527.2, ISO 178 and ISO
604, respectively. The tensile specimens were dog-bone shaped (see Figure 5.4) and
the test speed was 5mm/min.; the flexural specimens were 80-10-4 mm; the span, 60
mm and the test speed, 2mm/min. Finally, the compression specimens were 10-10-4
mm and test speed, 5mm/min. The Izod impact specimens were tested using a
Pendulum impact W&T AVERY machine and determined with reference to ISO 180.
The density of the material was assessed by building density specimens. The density
specimens were 30-10-4 mm determined with reference to ISO 1183-3. The
dimensions of the specimens were obtained using a micrometer, with each dimension
being measured three times and an average dimension connected with each part. Once
the density specimens were measured and weighed, the salient density was calculated
through dividing mass by volume. The cross-sectional area (CSA) value was
developed from the average part thickness and width per ED. The CSA of the part is
therefore important as it is required in calculating the tensile and flexural specimens.
The intended CSA for all the parts was 40mm².

Chapter 5 Mechanical properties of sintered components
116
Figure 5.4: Building and dimensions of tensile test specimen.

Chapter 5 Mechanical properties of sintered components
117
5.4 Results and discussion
5.4.1 Sintering part dimensions and density
Figures 5.5 to 5.7 show the part length, width, thickness and density results obtained,
as opposed to their ED. To investigate the effect of the ED on the dimensions and
density of the test specimens, three different measurements of the specimens were
taken: length, width and thickness. Figure 5.5 shows the part length increased by
raising ED. All parts were somewhat smaller than the intended part length of 30 mm
except when the highest ED level, 0.058 J/mm², was exceeded. As shown in Figure
5.6, the required width of 10mm was reached and exceeded by the ED > 0.043 J/mm²,
and in a similar way, part widths increased with rising ED. Figure 5.7 shows the part
thickness on the verge of reaching the intended target of 4mm but discontinued at a
maximum value with 0.051 J/mm² of ED, consequently initiating a decrease relative
to increased ED. Figure 5.8 displays variations in density amongst the samples,
correlating to ED. When ED < 0.051 J/mm², the density of the composite increased
with rising ED, and then gradually decreased with increasing ED.
From the results, it can be concluded that ED has an effect on the dimensions and
density of the SLS parts of composite material. The parts‟ dimensions increased
relative to increased ED. The parts‟ thickness yielded values closer to the desired
thickness of 4 mm. However, the desired thickness was not reached due to shrinkage
of the sintering part during cooling. In addition, the thickness dimensions were
Chapter 5 Mechanical properties of sintered components
118
controlled by the height of the powder layer. While the parts‟ length and width were
unlike the part thickness, the length and width values reached and exceeded their
desired values due to the laser, which controlled the length and width dimensions. In
general, the increase in part dimensions as a result of ED may be explained by the
increase in ED leading to growth in the amount of conduction through the powder,
thus causing excess powder particles to melt and fuse, resulting in extra length, width
and, to some extent, thickness.
Where the density of the parts was concerned, their dimensions increased through
raised ED, which to some extent causes density to increase at optimum ED and then
decrease with raised ED. At ED levels in excess of the optimum, the binder in the
composite material degrades and evaporates due to excess heat from the laser power,
or longer heating time.

Chapter 5 Mechanical properties of sintered components
119
29.3
29.5
29.7
29.9
30.1
30.3
0.0328 0.0364 0.04 0.043 0.047 0.051 0.054 0.058
Energy density (J/mm²)
Par
t le
ng
th (
mm
)-
Figure 5.5: Variation of length with energy density.
9.4
9.6
9.8
10
10.2
10.4
0.0328 0.0364 0.04 0.043 0.047 0.051 0.054 0.058
Energy density (J/mm²)
Par
t w
idth
(mm
)-
Figure 5.6: Variation of width with energy density.

Chapter 5 Mechanical properties of sintered components
120
3.6
3.7
3.8
3.9
4
0.0328 0.0364 0.04 0.043 0.047 0.051 0.054 0.058
Energy density (J/mm²)
Par
t th
ich
nes
s (m
m)-
Figure 5.7: Variation of thickness with energy density.
0.9
0.95
1
1.05
1.1
0.0328 0.0364 0.04 0.043 0.047 0.051 0.054 0.058
Energy density (J/mm²)
Den
sity
(g/c
m³)
-
Figure 5.8: Variation of density with energy density.
Chapter 5 Mechanical properties of sintered components
121
5.4.2 Mechanical properties
The effects of various EDs and proportions of cement on the mechanical properties of
SLS parts are shown in Tables 5.3 and 5.4, respectively. These show the average
results in terms of ultimate tensile strength (UTS), elongation at break, flexural
modulus, flexural yield strength, compressive strength, impact strength and Young‟s
modulus from 5 test parts built in the SLS machine (five tensile, five flexural, five
impact and five compression). A massive amount of the powder remained un-sintered
during the SLS process and could be reused, depending on its properties.
The effect of using un-sintered powder on the MFR and mechanical properties is
examined and shown in Figures 5.23 to 5.25. A comparison of the mechanical
properties of actual parts produced using SLS, along with data-sheet values for PA12
material, is shown in Table 5.5.

Chapter 5 Mechanical properties of sintered components
122
Table 5.3: The mechanical properties of SLS parts according to various energy
densities.
Mechanical Properties ED
0.0328
ED
0.0364
ED
0.04
ED
0.043
ED
0.047
ED
0.051
ED
0.054
ED
0.058
Tensile Strength, Ultimate(MPa) 36.4 38.05 41.15 44.72 49.01 50.58 49.52 48.9
Young's Modulus (Mpa) 1830 1895 1990 2115 2240 2350 2260 2125
Elongation at break (%) 2.16 3.4 4.98 6 6.96 7.8 7.68 7.5
Flexural Modulus (GPa) 1.52 1.59 1.65 1.73 1.85 2.07 1.88 1.75
Flexural Yield Strength (MPa) 39.4 44.28 45.33 47.75 48.71 52.56 48.91 48.05
Compression Strength (MPa) 30.15 34.48 42.16 47.44 51.93 54.44 52.67 51.31
Notched impact strength (KJ/m²) 10.56 11.12 11.83 12.62 13.12 13.71 12.63 11.64
Table 5.4: The mechanical properties of SLS parts with various proportions of
cement.
Mechanical Properties PA12 PA12-
cement
(5wt%
PA12-
cement
(10wt%
PA12-
cement
(15wt%
PA12-
cement
(20wt%
PA12-
cement
(25wt%
PA12-
cement
(30wt%
PA12-
cement
(35wt%
PA12-
cement
(40wt%
Tensile Strength, Ultimate(MPa) 49.49 49.9 50.6 49.1 48.36 47.95 47.26 46.56 45.94
Young's Modulus (Mpa) 1975 2205 2350 2480 2575 2670 2760 2790 2810
Elongation at break (%) 9.6 8.6 7.8 5.4 3 2 1.8 1.5 1.1
Flexural Modulus (GPa) 1.71 1.92 2.07 2.24 2.32 2.34 2.38 2.42 2.44
Flexural Yield Strength (MPa) 46.72 50.06 52.56 55.48 57.26 57.85 58.1 58.44 58.77
Compression Strength (MPa) 47 52.15 54.44 56.03 57.87 58.35 58.84 59.26 59.55
Notched impact strength (KJ/m²) 15.33 14.67 13.71 12.65 11.57 10.39 9.28 8.1 6.9

Chapter 5 Mechanical properties of sintered components
123
5.4.2.1 Tensile properties
Figures 5.9 and 5.10 show the ultimate tensile strength (UTS) and results obtained in
relation to various EDs and proportions of filler. From Figure 5.9, it is clear that UTS
increases rapidly with an increase in ED, except at the highest ED level when the
tensile strength decreases steadily. Judging from the results obtained, the UTS is
directly influenced by part-density, which is in turn affected by ED. Density and
tensile strength are in direct proportion to each other. Therefore, as the part-density
increases, so does the tensile strength, resulting in enhanced fusion of Polyamide 12
particles and a decrease in porosity to produce a more compact structure and
consequently greater tensile strength. With degradation of the Polyamide 12 particles
due to excessively high ED, the tensile strength declines directly.
Figure 5.10 illustrates the dependence of the UTS in the samples on the weight
fraction (wt%) of the cement. When wt% is < 10%, the UTS of the composite
increases steadily with the addition of wt%, and then decreases gradually with
increasing wt%. This suggests that the cement particles can enhance the ultimate
tensile strength to some extent and continue to do so as the filler is increased. This is
explained by He & Jaing who have presented the percolation theory, which states that
a matrix zone around each particle of filler is affected by stress concentration.
Consequently, if the particles are fine, well distributed and the distance between them
is small enough, it leads to the merging of zones, which increases strength (Mareri,

Chapter 5 Mechanical properties of sintered components
124
1998; Unal, 2004). When the filler increases by more than 10%, the gap between the
Polyamide 12 particles increases, and so the adhesion between the particles will
decrease, leading to a reduction in UTS.
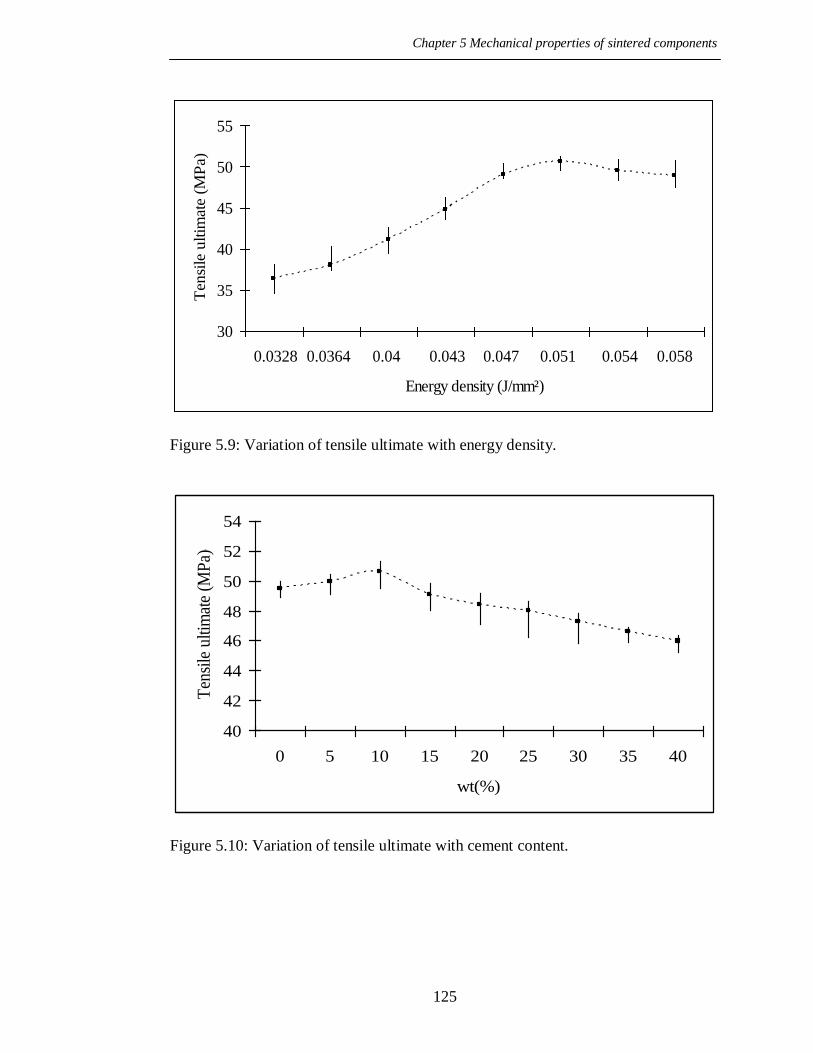
Chapter 5 Mechanical properties of sintered components
125
30
35
40
45
50
55
0.0328 0.0364 0.04 0.043 0.047 0.051 0.054 0.058
Energy density (J/mm²)
Ten
sile
ultim
ate
(MP
a)-
Figure 5.9: Variation of tensile ultimate with energy density.
40
42
44
46
48
50
52
54
0 5 10 15 20 25 30 35 40
wt(%)
Ten
sile
ultim
ate
(MP
a)-
Figure 5.10: Variation of tensile ultimate with cement content.

Chapter 5 Mechanical properties of sintered components
126
5.4.2.2 Young’s modulus
The resulting stress-strain curve is obtained using an extensometer to find the
corresponding Young‟s modulus. Figures 5.11 and 5.12 demonstrate the Young‟s
modulus results plotted against the ED level used to create the specimens and
proportions of filler. From Figure 5.11, it can be seen from an examination of data
that the ED level used to create the parts has a strong influence on the resultant
Young‟s modulus value. When sintering at higher ED levels, the bonds between the
powder particles become stronger, which leads to greater ductile behaviour with large
plastic regions in the stress-strain curves. This can be seen in the relationship between
the modulus and density of the parts. As the density of the part increases, so does
Young‟s modulus. There is, therefore, a strong connection between the shape of the
curves in Figure 5.11 and the density curves shown in Figure 5.8. The stiffness of the
composite beyond the optimum level of the ED starts to decline due to the
degradation of Polyamide 12 particles binder.
Figure 5.12 displays the influence of various weight fractions (wt%) of cement on the
Young‟s modulus of the composite specimen. As shown in the Figure, the modulus of
composite elasticity increases in relation to increased wt% of filler, namely from
1722 MPa at 0% of filler to 2810 MPa at 40%, where the influence is significant.
This result confirms that the addition of rigid particles to Polyamide 12 enhances the
stiffness of the composite, and that due to the interfacial adhesion between the filler
and matrix, it is good and strong. With the addition of rigid particles to the

Chapter 5 Mechanical properties of sintered components
127
Polyamide12 and the difference in modulus between the particles, some physical
cross-linking points might be generated and the movement of the molecular chains of
the matrix is to some extent blocked, leading to improved stiffness of the composite.
In addition, the stiffness of the composite depends on adequate dispersion of the
particles in the matrix and the interfacial bonding between the matrix and the filler
(Gill & Hon, 2004; Liang, 2005). On the other hand, in the tensile process, there will
be stress concentration which causes the matrix to form shells around the filler
particles. If the distance between the particles is small enough, there will be shear
stress between the nearest neighbouring particles, thus causing them to connect to
each other and form percolation pathways. As the volume fraction of particles
increase, the distance between shells around the filler decreases, leading to an
increase in the number of percolation pathways, thus ultimately raising the elasticity
modulus (He & Jiang, 1993).

Chapter 5 Mechanical properties of sintered components
128
1500
1600
1700
1800
1900
2000
2100
2200
2300
2400
0.0328 0.0364 0.04 0.043 0.047 0.051 0.054 0.058
Energy density (J/mm²)
Young's
modulu
s (M
pa)
-
Figure 5.11: Variation of Young‟s modulus with energy density.
1700
1900
2100
2300
2500
2700
2900
0 5 10 15 20 25 30 35 40
Filler content wt(%)
Young's
modulu
s (M
pa)
-
Figure 5.12: Variation of Young‟s modulus with cement content.

Chapter 5 Mechanical properties of sintered components
129
5.4.2.3 Elongation at break
Figures 5.13 and 5.14 show elongation at break and the results obtained in relation to
various ED, and proportions of filler. Elongation at break is an important factor for
the characterisation of the tensile fracture toughness of materials. From Figure 5.13, it
is clear that elongation at break increases significantly with increasing ED, except for
the highest ED level. From the results obtained, it becomes clear that the increase in
elongation in relation to increased ED levels can again be attributed to the increase in
part density and particle fusion. Enhanced material integrity and greater adhesion of
particles to each other clearly results in a reduction in material brittleness. As the ED
is increased beyond the optimum level, the elongation at break begins to decrease and
this can be attributed to the powder particle of binder becoming damaged or burnt by
excess heat from the laser.
In Figure 5.14, the elongation at break curve shows a considerable influence from
various weight fractions (wt%) of the cement filler. It decreases at a leisurely rate
with an increase in wt% of up to 10%, then continues more rapidly than before up to
25%, before gradually persisting. From the results obtained, this suggests that the
addition of cement particles to Polyamide 12 diminishes the elongation of the
composite. This is due to the immobilisation of macromolecular chains by the filler,
which increases the brittleness of the composite.

Chapter 5 Mechanical properties of sintered components
130
0
1
2
3
4
5
6
7
8
9
0.0328 0.0364 0.04 0.043 0.047 0.051 0.054 0.058
Energy density (J/mm²)
Elo
ngation a
t bre
ak (
%)-
Figure 5.13: Variation of elongation at break in relation to energy density.
0
2
4
6
8
10
12
0 5 10 15 20 25 30 35 40
Filler content wt(%)
Elo
ngatio
n a
t b
reak
(%
)-
Figure 5.14: Variation of elongation at break in relation to cement content.
Chapter 5 Mechanical properties of sintered components
131
5.4.2.4 Flexural properties
Graphs of the flexural modulus and flexural yield strength values in relation to
various EDs and proportions of filler are shown in Figures 5.15 to 5.18. The flexural
modulus and flexural yield strength values are effectively dependent on the ED, so
Figures 5.15 and 5.16 demonstrate flexural modulus and flexural strength
respectively, which have increased rapidly, more or less in relation to ED, and then
decreased in inverse proportion to increases in ED. Therefore, it is clear from an
examination of the data presented, that the ED level used to produce the parts has had
a physically powerful influence on the resultant flexural modulus and flexural
strength values, which can be related back to their density. As the density of the part
increases, the flexural properties increase; if the density of the part decreases, the
flexural properties also decrease in direct proportion. As a matter of fact, there is a
substantial similarity between the figures for flexural and density curves shown in
Figure 5.8.
From the results obtained, it would appear that both the flexural modulus and flexural
yield strength have been influenced directly by the part-density, which is itself
affected by ED. As ED increases, therefore, there is greater fusion of the Polyamide
12 particles, causing higher density and enabling a more compact structure, with
consequently greater flexural properties. When the ED is increased beyond the
optimum level as a consequence of binder degradation, however, this leads to a
decline in strength.

Chapter 5 Mechanical properties of sintered components
132
Figures 5.17 and 5.18 display the relationship between the flexural modulus and
flexural strength, respectively, alongside the weight fraction (wt%) of the cement. It
can be seen that flexural modulus and flexural strength increase speedily with the
increase of wt% when wt% is < 15%, and then rises gradually. From the results
obtained, this suggests that the cement particles can enhance both flexural modulus
and flexural strength. The addition of rigid particles, such as cement to polyamide,
can increase the stiffness (Gill & Hon, 2004). This means that for the flexural
modulus, the flexural strength not only depends on the adhesion of particles to each
other, but also on the strength of the particles. Flexural modulus and flexural strength
would therefore seem to increase with a rise in the proportion of cement (wt%).

Chapter 5 Mechanical properties of sintered components
133
1
1.2
1.4
1.6
1.8
2
2.2
0.0328 0.0364 0.04 0.043 0.047 0.051 0.054 0.058
Energy density (J/mm²)
Fle
xura
l m
odulu
s (G
Pa)-
Figure 5.15: Variation of flexural modulus with energy density.
30
35
40
45
50
55
0.0328 0.0364 0.04 0.043 0.047 0.051 0.054 0.058
Energy density (J/mm²)
Fle
xura
l yie
ld s
tren
gth
(M
Pa)-
Figure 5.16: Variation of flexural yield strength with energy density.
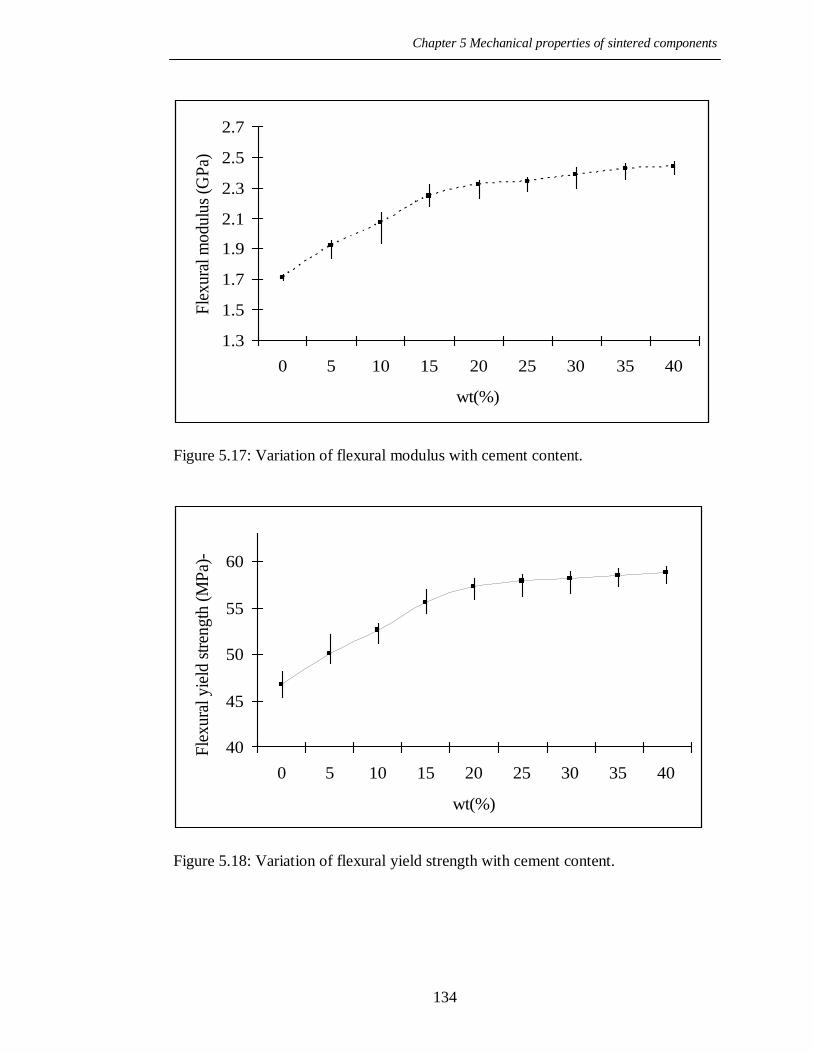
Chapter 5 Mechanical properties of sintered components
134
1.3
1.5
1.7
1.9
2.1
2.3
2.5
2.7
0 5 10 15 20 25 30 35 40
wt(%)
Fle
xura
l m
odu
lus
(GP
a) -
Figure 5.17: Variation of flexural modulus with cement content.
40
45
50
55
60
0 5 10 15 20 25 30 35 40
wt(%)
Fle
xura
l yie
ld s
tren
gth
(M
Pa)
--
Figure 5.18: Variation of flexural yield strength with cement content.

Chapter 5 Mechanical properties of sintered components
135
5.4.2.5 Compression properties
The compression test results are presented in Figures 5.19 and 5.20. Figure 5.19 is a
chart of compressive yield strength values obtained against various EDs, where ED is
shown to have an effect on the compressive yield strength. It can be seen that the
compressive strength quickly increases with an increase in ED when ED is < 0.051,
and then decreases slowly. This demonstrates the strength of the relationship between
compressive yield strength and density. As the density of the part increases, so does
the compressive yield strength, due to more binder particles melting, subsequent to a
certain degree of increase in ED. The compressive yield strength then starts to
decrease as ED is increased because of the degradation of binder.
In Figure 5.20, the compressive yield strength curve shows considerable influence
from various weight fractions (wt%) of the cement. The compressive strength initially
increases rapidly with an increase in wt% of up to 5% and then continues more
gradually than before. This result confirms that the addition of rigid particles to
Polyamide 12 enhances rigidity as stated earlier. Consequently, as the (wt%) of the
cement increases, so does the compressive yield strength.

Chapter 5 Mechanical properties of sintered components
136
25
30
35
40
45
50
55
60
0.0328 0.0364 0.04 0.043 0.047 0.051 0.054 0.058
Energy density (J/mm²)
Co
mp
ers
sio
n s
tren
gth
(M
Pa)-
Figure 5.19: Variation of compression strength with energy density.
4042444648505254565860
0 5 10 15 20 25 30 35 40
wt(%)
Com
pre
ssio
n s
tren
gth
(M
Pa)
-
Figure 5.20: Variation of compression strength with cement content.
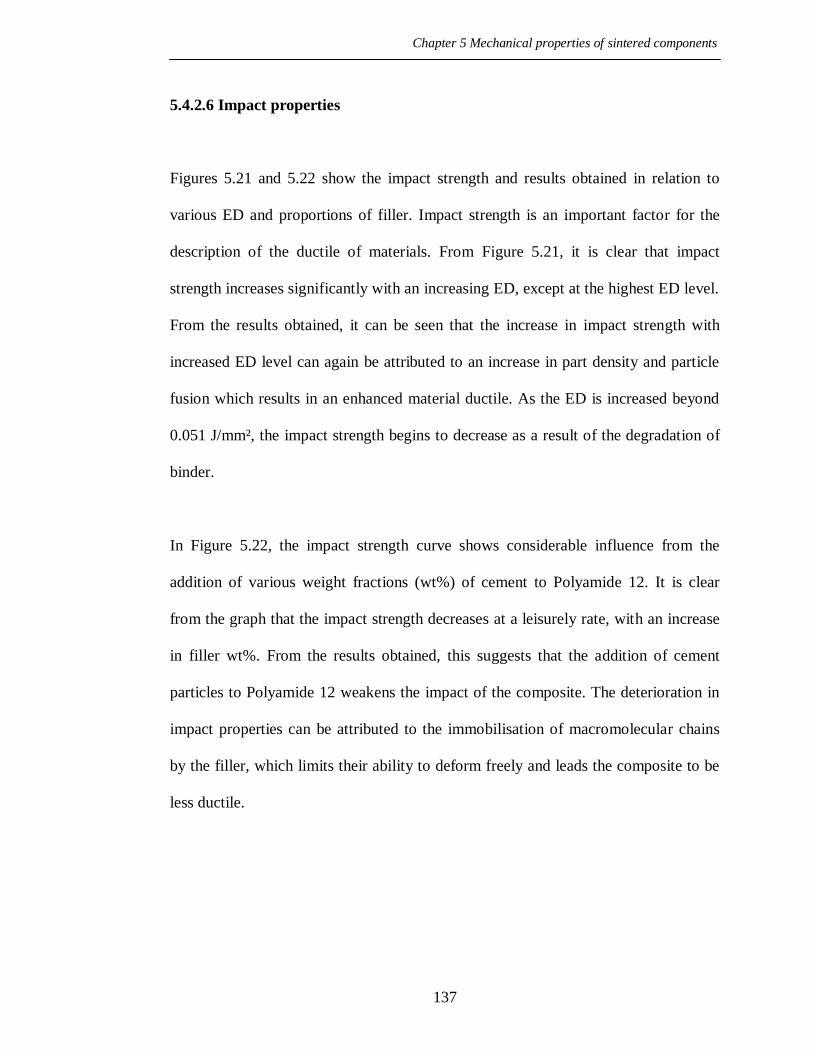
Chapter 5 Mechanical properties of sintered components
137
5.4.2.6 Impact properties
Figures 5.21 and 5.22 show the impact strength and results obtained in relation to
various ED and proportions of filler. Impact strength is an important factor for the
description of the ductile of materials. From Figure 5.21, it is clear that impact
strength increases significantly with an increasing ED, except at the highest ED level.
From the results obtained, it can be seen that the increase in impact strength with
increased ED level can again be attributed to an increase in part density and particle
fusion which results in an enhanced material ductile. As the ED is increased beyond
0.051 J/mm², the impact strength begins to decrease as a result of the degradation of
binder.
In Figure 5.22, the impact strength curve shows considerable influence from the
addition of various weight fractions (wt%) of cement to Polyamide 12. It is clear
from the graph that the impact strength decreases at a leisurely rate, with an increase
in filler wt%. From the results obtained, this suggests that the addition of cement
particles to Polyamide 12 weakens the impact of the composite. The deterioration in
impact properties can be attributed to the immobilisation of macromolecular chains
by the filler, which limits their ability to deform freely and leads the composite to be
less ductile.
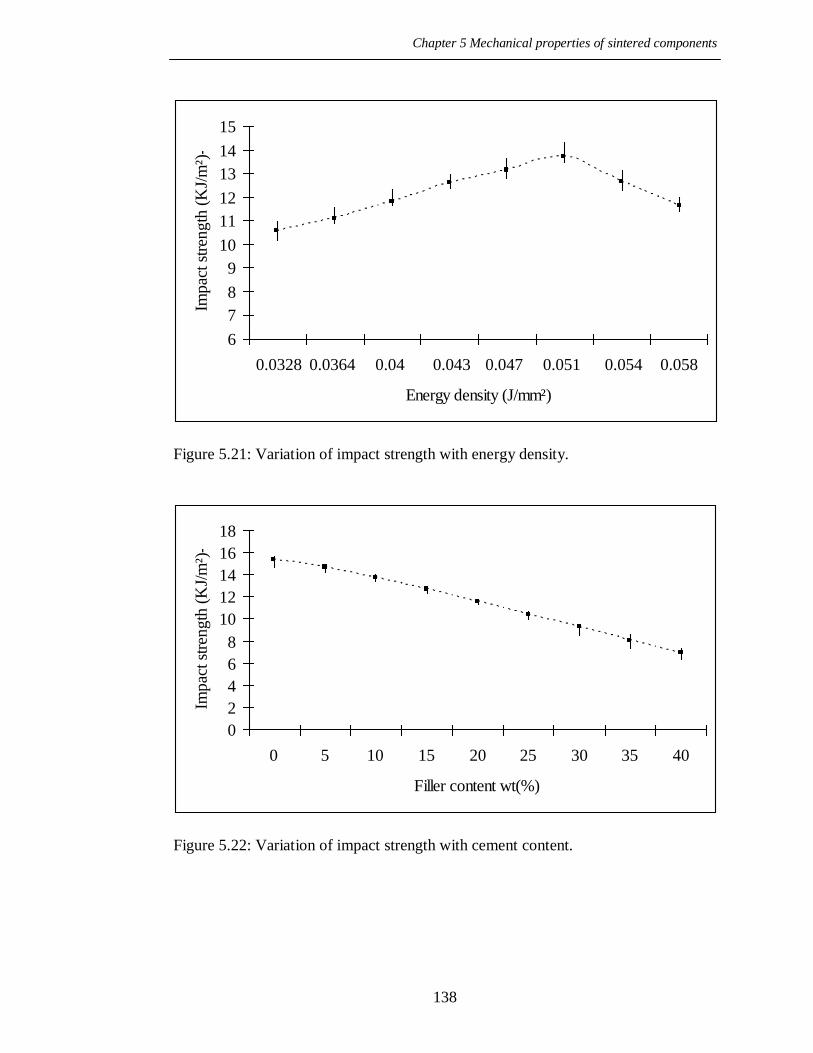
Chapter 5 Mechanical properties of sintered components
138
6
7
8
9
10
11
12
13
14
15
0.0328 0.0364 0.04 0.043 0.047 0.051 0.054 0.058
Energy density (J/mm²)
Imp
act st
ren
gth
(K
J/m
²)-
Figure 5.21: Variation of impact strength with energy density.
0
2
4
6
8
10
12
14
16
18
0 5 10 15 20 25 30 35 40
Filler content wt(%)
Impac
t st
rength
(K
J/m
²)-
Figure 5.22: Variation of impact strength with cement content.

Chapter 5 Mechanical properties of sintered components
139
5.4.2.7 Effect of using un-sintered powder on the MFR and mechanical
properties.
In the following experiments, the samples of composite material of cement/PA12
were built on a DTM Sinterstation 2000 machine. After running the first build, it was
necessary to break out the parts and separate the un-sintered powder that could be
easily broken up as used powder. Because a huge amount of powder remained un-
sintered during the SLS, this powder and overflow powder from the same build was
sifted by an intensive shaking procedure, using a manual sifter to avoid powder
agglomerates. The powder was then mixed mechanically in a Drum mixer, BS 125
with a mixing speed of 30 r.p.m. for 5 minutes. Later, the tensile and compressive
parts were examined using a Testomeric M500 machine with a small amount of the
un-sintered powder from the first build taken to measure and record their MFR. The
powder was returned to the SLS for another build. This procedure was repeated for
six builds.
The results of these experiments are shown in a bar chart format in Figures 5.23 to
5.25. Figure 5.23 illustrates the relationship between the MFR of the composite
material of cement/PA12 and the number of builds via SLS. The results prove to be
similar to those obtained from simulating the deterioration of the composite powder
during the SLS process, as mentioned earlier in 4.6.2.3. This indicates that the
powder exposed to oven temperatures with a nitrogen atmosphere can simulate the
powder run by SLS. It is therefore clear from the figures there is a rapid decrease in

Chapter 5 Mechanical properties of sintered components
140
MFR with repeated heat exposures during the SLS process for the first two builds,
and then a leisurely decline. As molecular weight increases through exposure of the
powder to temperatures, the viscosity of the powder increases directly, thus finally
leading to decreased melt flow rate. Figures 5.24 and 5.25 show the cement/PA12
tensile and compressive strength, respectively, as opposed to the number of builds.
These results show a clear trend of substantial decline in tensile and compressive
strength following the new builds, then a reduction for the next three builds, before
quickly dropping. As shown from these Figures, tensile and compressive strength are
in direct proportion to MFR. Therefore, with the degradation of the powder due to
exposure to various temperatures for an extended period of time through the SLS
system, a decline in tensile and compressive strength is observed.
The indications of the mechanical properties and MFR tests recommend that there is
a relationship between results obtained from the melt flow rate index and tensile and
compressive strength. As the powder degrades following exposure to temperatures
for prolonged period through the SLS system, the tensile and compressive strength
weakens. In addition, quality and surface finish of specimens become poorer. Tensile
and compressive assessment and visual evaluation of components from the six builds
indicate that the first two builds are excellent, the next three builds are acceptable and
the rest builds are unacceptable. Consequently the amount of virgin power to be
added to achieve the target melt index has therefore varied from 25 to 42 per cent.
The melt flow rate index has ultimately proved to be a good indicator of mechanical
properties.
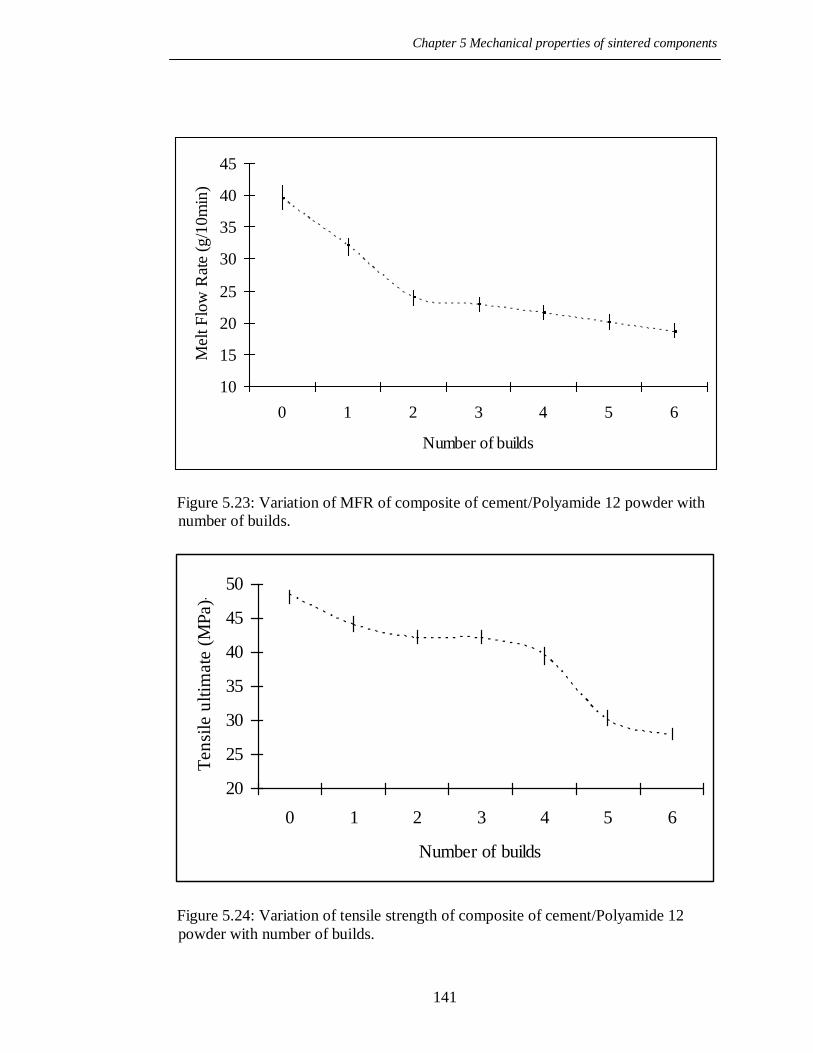
Chapter 5 Mechanical properties of sintered components
141
10
15
20
25
30
35
40
45
0 1 2 3 4 5 6
Number of builds
Mel
t F
low
Rat
e (g
/10m
in)-
Figure 5.23: Variation of MFR of composite of cement/Polyamide 12 powder with
number of builds.
20
25
30
35
40
45
50
0 1 2 3 4 5 6
Number of builds
Ten
sile
ult
imate
(M
Pa)-
Figure 5.24: Variation of tensile strength of composite of cement/Polyamide 12
powder with number of builds.

Chapter 5 Mechanical properties of sintered components
142
20
25
30
35
40
45
50
55
60
0 1 2 3 4 5 6
Number of builds
Co
mp
ress
ive S
tren
gth
(Mp
a)-
Figure 5.25: Variation of compressive strength of composite of cement/Polyamide
12 powder with number of builds.
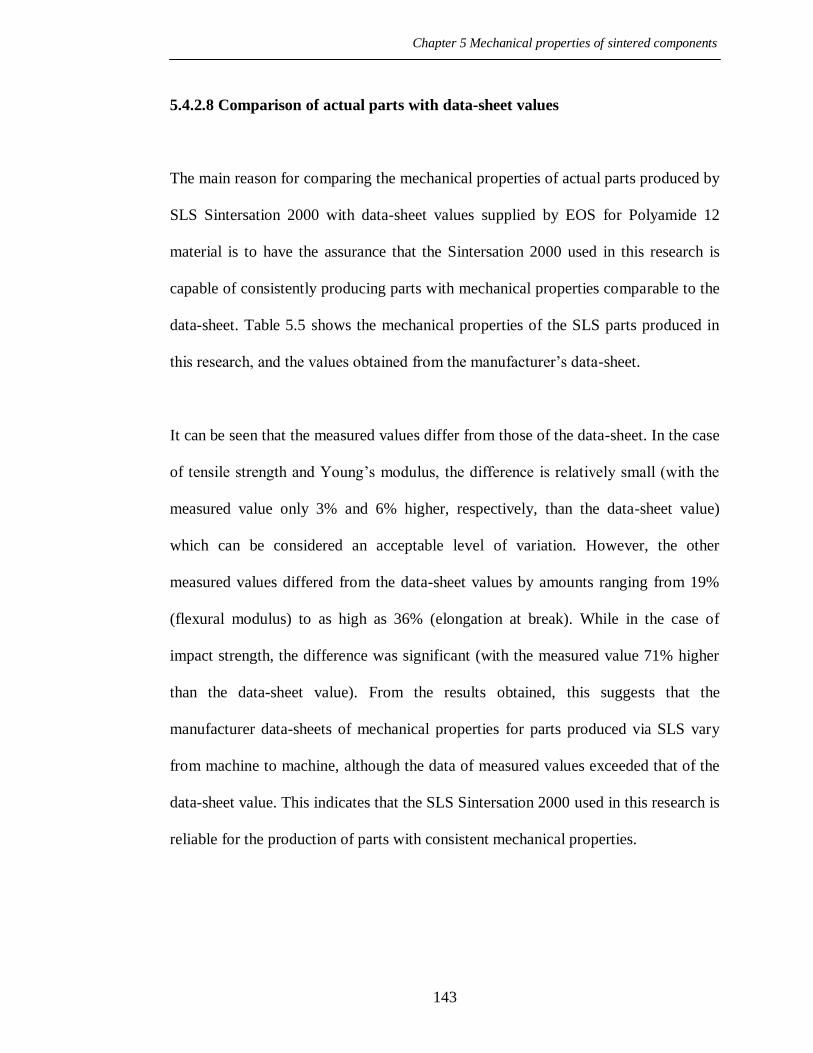
Chapter 5 Mechanical properties of sintered components
143
5.4.2.8 Comparison of actual parts with data-sheet values
The main reason for comparing the mechanical properties of actual parts produced by
SLS Sintersation 2000 with data-sheet values supplied by EOS for Polyamide 12
material is to have the assurance that the Sintersation 2000 used in this research is
capable of consistently producing parts with mechanical properties comparable to the
data-sheet. Table 5.5 shows the mechanical properties of the SLS parts produced in
this research, and the values obtained from the manufacturer‟s data-sheet.
It can be seen that the measured values differ from those of the data-sheet. In the case
of tensile strength and Young‟s modulus, the difference is relatively small (with the
measured value only 3% and 6% higher, respectively, than the data-sheet value)
which can be considered an acceptable level of variation. However, the other
measured values differed from the data-sheet values by amounts ranging from 19%
(flexural modulus) to as high as 36% (elongation at break). While in the case of
impact strength, the difference was significant (with the measured value 71% higher
than the data-sheet value). From the results obtained, this suggests that the
manufacturer data-sheets of mechanical properties for parts produced via SLS vary
from machine to machine, although the data of measured values exceeded that of the
data-sheet value. This indicates that the SLS Sintersation 2000 used in this research is
reliable for the production of parts with consistent mechanical properties.
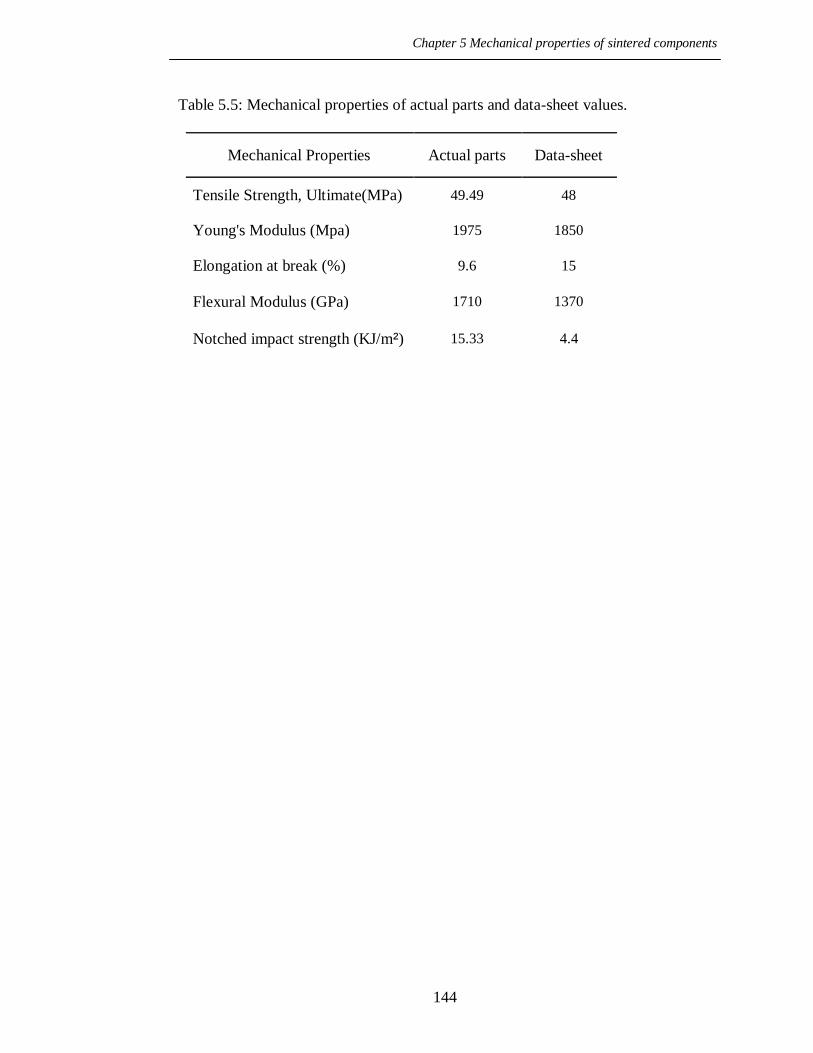
Chapter 5 Mechanical properties of sintered components
144
Table 5.5: Mechanical properties of actual parts and data-sheet values.
Mechanical Properties Actual parts Data-sheet
Tensile Strength, Ultimate(MPa) 49.49 48
Young's Modulus (Mpa) 1975 1850
Elongation at break (%) 9.6 15
Flexural Modulus (GPa) 1710 1370
Notched impact strength (KJ/m²) 15.33 4.4

Chapter 5 Mechanical properties of sintered components
145
5.4.3 Morphology and microstructure
In order to carry out this investigation, the material morphology of parts produced
from a composite of Polyamide 12 and cement SLS has been explored using different
EDs. The research explains the effects of various EDs on composite material
properties by examining the physical construction of the specimens.
Figure 5.26 shows surface images of samples made from composite material
PA12/cement with different EDs. The ED used to produce the SLS specimens is
shown underneath each image. The surface of the specimen built under an ED
0.043 J/mm² is porous. These porosities are formed due to low ED exposure to the
powder and consequently, the part is likely to have insufficient bonds between
Polyamide 12 particles, thus causing voids and weak parts (see Figure 5.26 A). If the
ED level increases to a level between 0.047 J/mm² and 0.051 J/mm², the fusion of
Polyamide 12 particles is better from the outset. It results in decreased porosity, thus
enabling a more compact structure to be built (see Figure 5.26 B and C). Excessively
high EDs of over 0.054 J/mm² lead to degradation of the Polyamide 12, roughness,
cracks and a dark colour on the surface of the part through overheating (see Figure
5.26D).

Chapter 5 Mechanical properties of sintered components
146
Figure 5.26: Surface image sintered specimens built at energy densities of
(a) 0.043, (b) 0.047, (c) 0.051 and (d) 0.058 J/mm².

Chapter 5 Mechanical properties of sintered components
147
Fracture surface images are presented in Figure 5.27. These fracture surface images
of the parts reveal how ED affects the material morphology. From Figure 5.27 A, it
can be observed that at lowered EDs, there are partially melted Polyamide 12
particles but the majority of particles can be recognised individually because they
have maintained their original shape rather than melting. This confirms findings with
respect to the surface image at low ED, which resulted in the production of a
composite part with defects and porosities and so would influence a preference for
the stronger specimens.
When ED increases beyond 0.047 J/mm², the fusion of particles seems to be
homogeneous and particles cannot be seen independently (see Figure 5.27 B and C).
Due to excessive exposure of the ED to the powder at a level above 0.054 J/mm²,
Figure 5.27 D shows degradation of the powder and when the images are enlarged x
200, it is also clear that the fracture surfaces are rough. This therefore confirms that
findings which relate to surface images where ED is excessively high, displaying
degradation of the Polyamide 12 and a dark colour on the surface of the part from
overheating with high ED.

Chapter 5 Mechanical properties of sintered components
148
Figure 5.27: Fracture surface image sintered specimens built at energy densities of
(a) 0.043, (b) 0.047, (c) 0.051 and (d) 0.054 J/mm².

Chapter 5 Mechanical properties of sintered components
149
5.5 Summary
The comparison of the mechanical properties of the measured and data-sheet values
for pure Polyamide 12 has shown that, values for the actual parts produced by SLS
Sintersation 2000 demonstrate values which exceed those of the data-sheet. This
indicates that the SLS Sintersation 2000 used in this research is reliable for producing
parts with consistent mechanical properties. The results from the data of the
mechanical properties of parts produced by SLS reveal that the composite material
has a significant effect on the mechanical properties of sintered specimens.
Additionally, the energy density (ED) of the laser beam has a major influence effect
on the dimensions, density and mechanical properties of sintered parts.
The comparison between pure Polyamide 12 powder and the composite material has
demonstrated that there is an improvement from addition of cement filler to PA12, in
terms of Young‟s modulus, flexural strength, compression strength and tensile
strength in the sintered specimens. However, the addition of cement particles to
Polyamide 12 weakens the impact strength of the composite. Density and mechanical
properties are observed to increase as ED is increased. They peak at ED 0.051 J/mm²
and then decrease as ED is increased even further.
It has been found that the amount of virgin power that must be added to used powder
to achieve good, consistent mechanical properties of the fabricated SLS specimens
can vary from 25% to 42%. The melt flow rate index has also proved to be a good
indicator of mechanical properties. Sintered parts are porous and weak if the ED is

Chapter 5 Mechanical properties of sintered components
150
low, but become denser and stronger as ED increases to a specific point and then are
weakened through degradation of the binder at excessive ED. This is confirmed by
examining the physical construction of the sintered specimens.
Chapter 6 Simulating the mechanical properties of SLS parts by using the casting method
151
Chapter 6
Mechanical Properties of Cast Parts Cement and Polyamide 12
Composite
6.1 Preliminaries
Selective Laser Sintering can be expensive and time-consuming when testing new
materials (e.g. because of machine set-up, preheating, building, cool-down and
cleaning the machine properly to avoid corruption when swapping materials). In
addition, the large amount of material required to produce parts using SLS leads to
high costs for the powder material, even when producing a test part (Majewski et al.,
2008). This chapter presents a method of casting to produce parts with mechanical
properties similar to those achieved by SLS in order to reduce the amounts of time
and material required. This method was used to produce parts for tensile, Young's
modulus, flexural and compression tests to assess the effects of varying the
proportion of composite material of cement additive to Polyamide 12 on the
mechanical properties of specimens. The mechanical properties of parts produced
using the casting method are compared with the parts manufactured using SLS with
the same materials. The main purpose of work reported in this chapter is to
investigate whether or not a correlation could be made between the mechanical
Chapter 6 Simulating the mechanical properties of SLS parts by using the casting method
152
properties of parts produced via the casting method and those manufactured with
SLS.
6.2 Casting Process
A variety of processes, such as tape casting, slip casting, moulding, extrusion and
injection moulding are used to produce parts with powder and require a firing
treatment to instil strength in the shaped powder, which is known as sintering.
Sintering may be considered the process by which an assembly of particles,
compacted under pressure or simply confined in a container, chemically bond
themselves into a cohesive body under the influence of elevated temperature
(Hirschhorn, 1969; German, 1996; Majewski et al., 2008). The casting method was
used in this research, without externally applied pressure to support the internal
structure, so that it was most like pressureless sintering, i.e. the sintering of a powder
compact (sometimes at very high temperatures, depending on the powder) without
applied pressure.
In many cases, sintering is associated with an increase in compact density due to
lowered surface energy, and this through a reduction in the surface area and
concomitant formation of interparticle bonds. The bonds grow through various
mechanisms that occur at the atomic level. The bonding between the particles of
many metals and ceramics occurs through solid state diffusion, while with other
materials, melting particles appear during liquid phase sintering, resulting in a solid

Chapter 6 Simulating the mechanical properties of SLS parts by using the casting method
153
liquid mixture during the thermal cycle. Liquid phase bonding therefore contributes a
capillary force and usually enhances the rate of mass transport in comparison with
solid state processes (Hirschhorn, 1969; German, 1996).
During the stages of sintering, a basic step is completed at a constant temperature and
the time is varied to obtain certain results. Consequently, time plays an essential role
in describing the six possible stages of sintering.
The first stage is the initial bonding among particles, which takes place very early in
the sintering process as the material warms up. This is followed by the diffusion of
atoms, leading to the development of grain boundaries. During this stage, the
sintering does not lead to any changes in the dimensions of the material. Neck growth
is considered to be the second stage of the sintering process and is associated with the
first stage. The initial sintering stage therefore usually occurs during heating and is
characterised by rapid growth of the interparticle neck. Neck growth requires the
transport of material with sinter mass but does not involve any decrease in porosity,
so no shrinkage occurs at this stage (see Figure 6.1).
Pore channel closure is the third stage of sintering, and this stage explains changes in
the nature of the porosity of the sinter mass from interconnected to isolated porosity
(see Figure 6.2). Neck growth is considered to be one of the causes of pore channel
closure. In addition, pore shrinkage can also lead to channel closure, so blocking of
the tortuous and interconnected pore channels leads to the development of isolated

Chapter 6 Simulating the mechanical properties of SLS parts by using the casting method
154
porosity. There are several methods for determining isolated porosity, such as
measuring the density of the poured solid and also filling the interconnected porosity
with a fluid. The fourth stage is called „pore rounding‟ and it is considered to be a
natural consequence of neck growth. The pores become more rounded in the neck
region. In addition, the rounding process is associated with interconnected and
isolated porosity. Pore rounding starts to occur at a high sintering temperature. This
stage is considered to be one of the most important sintering stages in its effect on
mechanical properties.
The most important sintering stage is called „pore shrinkage‟ or „densification‟ and it
follows the pore rounding stage. This stage may well result in densification of the
sinter mass if it remains at the required temperature for sufficient time. The process
of pore shrinkage leads to a decrease in the volume of the sinter mass, which involves
movement of the solid into porosity. Any gas in the porosity is consequently
transferred to the external surfaces.
The final stage is called „pore coarsening‟. This stage usually occurs when most of
the sintering stage has been completed. During this stage, the process includes the
shrinkage and elimination of small isolated pores (Hirschhorn, 1969; German, 1996;
Pacheco & Campos, 2009).

Chapter 6 Simulating the mechanical properties of SLS parts by using the casting method
155
Figure 6.1: Three sphere sintering model (A) original point contacts; (B) neck
growth, (C), and (D) pore rounding (Hirschhorn, 1969).

Chapter 6 Simulating the mechanical properties of SLS parts by using the casting method
156
Figure 6.2: Photomicrographic illustration of change from interconnected to isolated
porosity, (A) early phase with interconnected porosity; (B) later phase with closed
porosity (Hirschhorn, 1969).

Chapter 6 Simulating the mechanical properties of SLS parts by using the casting method
157
The casting structure strongly depends on the thermal properties of the material, the
mould, the temperature of the mould, superheats of the mould, grain shape and grain
size. Three distinct regions or zones with different grain structures can be recognised
in most cast polycrystalline solids (Davies, 1973; Flood & Hunt, 1988; Martin, 2006).
These zones are the chill zone, the intermediate columnar zone, and the central
equiaxed zone, as shown in Figure 6.3.
The chill zone is placed in a boundary layer, near the mould wall with small equiaxed
crystals and random orientation. This zone is known as the „chill‟ zone because the
mould wall chills the material. The fastest solidification therefore begins with cast
polycrystalline solids in this zone. The chill zone is considered to form as a result of
numerous nucleation observed in the undercooling region next to the mould wall.
Thermal conditions at the mould wall, together with the efficiency of the mould wall
as a substrate for heterogeneous nucleation, are mostly responsible for the extent of
nucleation.
The second zone of columnar crystals develops from the chill zone. As the
temperature decreases, the grains grow towards the centre of the casting until growth
is interrupted by central equiaxed grains. Columnar structures are normally long
columns with dendritic growth, perpendicular to the mould wall and parallel with the
heat flow direction. As shown in Figure 6.3, the spread in orientation decreases as the
columnar zone extends and at the same time the average size of the grain increases.
Chapter 6 Simulating the mechanical properties of SLS parts by using the casting method
158
The equiaxed zone is located in the centre of the casting, as shown in Figure 6.3. The
crystals in this zone usually have a grain size larger than that of the chill zone because
the temperature in this zone is higher, thus leading to a decrease in the number of
equiaxed grains and an increase in the size of the grain. The equiaxed zone has
spherical crystals and their orientation is effectively random. The relationship
between the degree of superheat and the equiaxed grain is only valid in small ingots.

Chapter 6 Simulating the mechanical properties of SLS parts by using the casting method
159
Figure 6.3: Schematic illustration of the casting structure (Davies, 1973).
Chapter 6 Simulating the mechanical properties of SLS parts by using the casting method
160
6.3 Methodology
6.3.1 Sample preparation
An aluminium die to cast specimens was machined using the AGIE AGIECUT
EXCELLENCE wire cutting machine, (see Figure 3.10, Ch. 3). The die consists of
two pieces, with a base 4 mm thick and cavities for the cast specimens, machined to
obtain tensile, flexural and compression specimen parts, as shown in Figure 6.4.
Three dies were used and each die had two specimens of each kind. In order to
correct shrinkage, the cavities were made twice and the depth was 14mm. The
specimens were then post-machined to 4mm thickness using XYZ MACHINE
TOOLS LIMITED EDGE 3000 (see Figure 3.11, Ch. 3) to meet British Standard
specifications, reference ISO 527.2 for tensile specimens; ISO 178 for flexural
specimens, and ISO 604 for compression specimens.
Composite of cement additive with Polyamide 12 was sifted to avoid agglomerates of
powder. After this, composite powder was mechanically mixed according to a
determinate formulation (see Table 5.1, Ch 5) in a high-speed mixer for 20 minutes,
to obtain homogeneous powder mixtures and uniform colour. The blended powder
was poured into the die cavities, which were then vibrated manually and compacted
using a specimen of the same geometry as the cavity itself. Additional powder was
then added to fill the cavity, before being compacted one final time.
Chapter 6 Simulating the mechanical properties of SLS parts by using the casting method
161
6.3.2 Casting experiments
In order to simulate the conditions of the SLS process to produce the mechanical
properties of specimens, three aluminium dies were filled with the composite material
of cement filler with Polyamide 12, using varying filler content of cement from 0
wt% to 40 wt%, which was then placed in the oven (Heraeus Instruments Vacutherm,
Type 6060M) without any externally applied pressure to assist in part formation. This
took place in an atmosphere with optimum levels of nitrogen, in order to prevent the
powders from oxidising (yellowing) and at a specified temperature of approximately
190ºC to ensure that the particles attracted each other and self-compressed to
eliminate pores. However, the melting temperature of Polyamide 12 powder is about
185 ºC (see Section 3. 3.2). The thermocouple was embedded in the powder in order
to monitor the temperature of parts so that the powder was held above its melting
point. After many samples had been heated in the oven for different periods, the most
effective timeframe was ascertained as at least 6 hours for powder melt, and so after
this period, the oven was switched off and the powder allowed to cool naturally
before the die was removed from the oven.
6.3.3 SLS experiments
Specimens were produced using Sinterstation 2000. The SLS process begins with the
transfer of CAD data files in STL file format to the SLS machine, where they are
sliced to produce a sintering component. Build parameters are controlled by data
Chapter 6 Simulating the mechanical properties of SLS parts by using the casting method
162
processed by a computer system. In this chapter, the optimum parameters for
producing the mechanical properties of SLS parts are cited, as shown in Table 6.1.
The SLS process applies nitrogen, which creates an inert atmosphere that prevents
powder oxidation. The powder in the part-bed is heated to just below the melting
point of the Polyamide 12 material and laser power (7w) is used to fuse particles in
each consecutive layer during the construction of components. The sintered powder
forms the parts while a huge amount (about 80% to 90% of the powder) remains un-
sintered in the part-build during fabrication to surround and support the parts. It could
be reused, depending on its properties. Once the fabricated parts are completed, the
temperature starts to drop and the parts are removed from the un-sintered powder.
6.3.4 Measurement and test specimens
The tensile, flexural and compression cast specimens were measured using a
micrometer and tested using a Testomeric M500 machine, determined with reference
to ISO 527.2, ISO 178 and ISO 604 respectively, with the same conditions as the
SLS specimens described in Chapter 5 (3.4).

Chapter 6 Simulating the mechanical properties of SLS parts by using the casting method
163
Table 6.1: Sintering parameters.
Scan spacing (mm) 0.15
Laser power (W) 7
Spot size (mm) 0.4
Scan speed (m/s) 0.914
Layer thickness (mm) 0.1
Part bed temperature (C) 177
Right and left feed temperature (C) 95
Figure 6.4: Die for the production of cast specimens.

Chapter 6 Simulating the mechanical properties of SLS parts by using the casting method
164
6.4 Results and discussion
6.4.1 Tensile strength
Figure 6.5 displays a comparison of the ultimate tensile strength of the composite
specimen for various wt% of cement filler added to Polyamide 12, produced via SLS
and the casting method. It can be seen that the measured values of tensile strength for
both methods indicate only a relatively small difference. The biggest discrepancy is a
value 3.853565% higher than that of the SLS method at 5% cement filler, while the
smallest difference is 0.929752% higher than for the SLS method at 25% cement
filler. The average difference in measured values of tensile strength between the SLS
and the casting methods for all weight fractions of cement additive with Polyamide
12 is 1.56393%, which can be considered an acceptable level of variation.
In order to prove the correlation between the results for SLS and cast specimens of
ultimate tensile strength, Figure 6.6 plots all data to show a trendline. The trendline
has been plotted through the entire data set, as displayed in the relevant graph. The
coefficient of determination (R²) value for tensile property has also been displayed.
The R² value is used in statistical models to predict future outcomes on the basis of
other related information, where the values vary from 0 to 1. A value of 0 signifies
that there is absolutely no linear relationship between the independent and dependent
variables, and a value of 1 indicates that the relationship between independent and
dependent variables is perfectly linear. It can be seen from Figure 6.6 that all tensile
Chapter 6 Simulating the mechanical properties of SLS parts by using the casting method
165
strength data from both the SLS and cast specimens fits the trendline with an R² value
of 0.947265, indicating that the trendline produces a relatively accurate linear
illustration of the effect of increasing cement filler in specimens created using both
methods. From the results obtained, this suggests that the tensile strength value
produced by the casting method would allow for acceptably accurate predictions of
the SLS method.
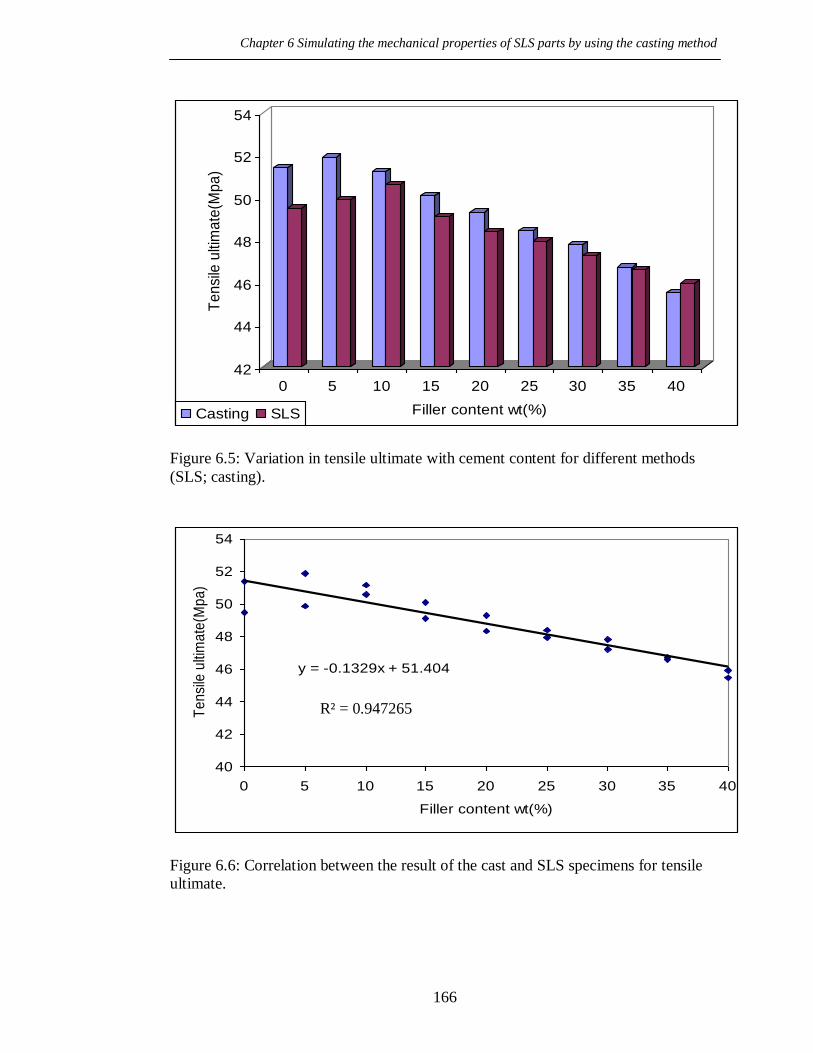
Chapter 6 Simulating the mechanical properties of SLS parts by using the casting method
166
42
44
46
48
50
52
54
Te
nsi
le u
ltim
ate
(Mp
a)
0 5 10 15 20 25 30 35 40
Filler content wt(%)Casting SLS
Figure 6.5: Variation in tensile ultimate with cement content for different methods
(SLS; casting).
y = -0.1329x + 51.404
40
42
44
46
48
50
52
54
0 5 10 15 20 25 30 35 40
Filler content wt(%)
Te
nsi
le u
ltim
ate
(Mp
a)
Figure 6.6: Correlation between the result of the cast and SLS specimens for tensile
ultimate.
R² = 0.947265

Chapter 6 Simulating the mechanical properties of SLS parts by using the casting method
167
6.4.2 Elongation at break
In Figure 6.7, the elongation at break curve shows considerable influence from
various wt% of cement filler for both SLS and the casting method. The elongation at
break decreases with an increase in wt% of cement filler. This Figure also illustrates a
comparison of the elongation at break of the samples produced using SLS and
casting methods for various wt% of cement filler added to Polyamide 12. It can be
seen from the Figure that the data of elongation at break for both sets does not differ
greatly. The biggest disparity was a value 1.1% higher than that of the SLS method at
5%, 15% and 20% of cement filler, while the smallest dissimilarity was in a value
0.02% higher than that of the casting method at 40% of cement filler. The average
difference in the elongation at break value between SLS and the casting method for
various weight fractions (from 0% to 40%) of cement filler is 0.492222% and this
indicates an acceptable level of variation for both sets.
Figure 6.8 shows a single trendline plotted through all data-points for elongation at
break of the specimens produced using SLS and the casting method, with an R² value
of 0.988102 to confirm the correlation between the elongation at break results
obtained from both methods. This suggests that the effect on elongation at break
when amounts of cement filler are increased in both the cast and SLS specimens is
comparatively similar and the casting method used to produce the tensile samples is
acceptable for predicting specimens produced through the SLS method.
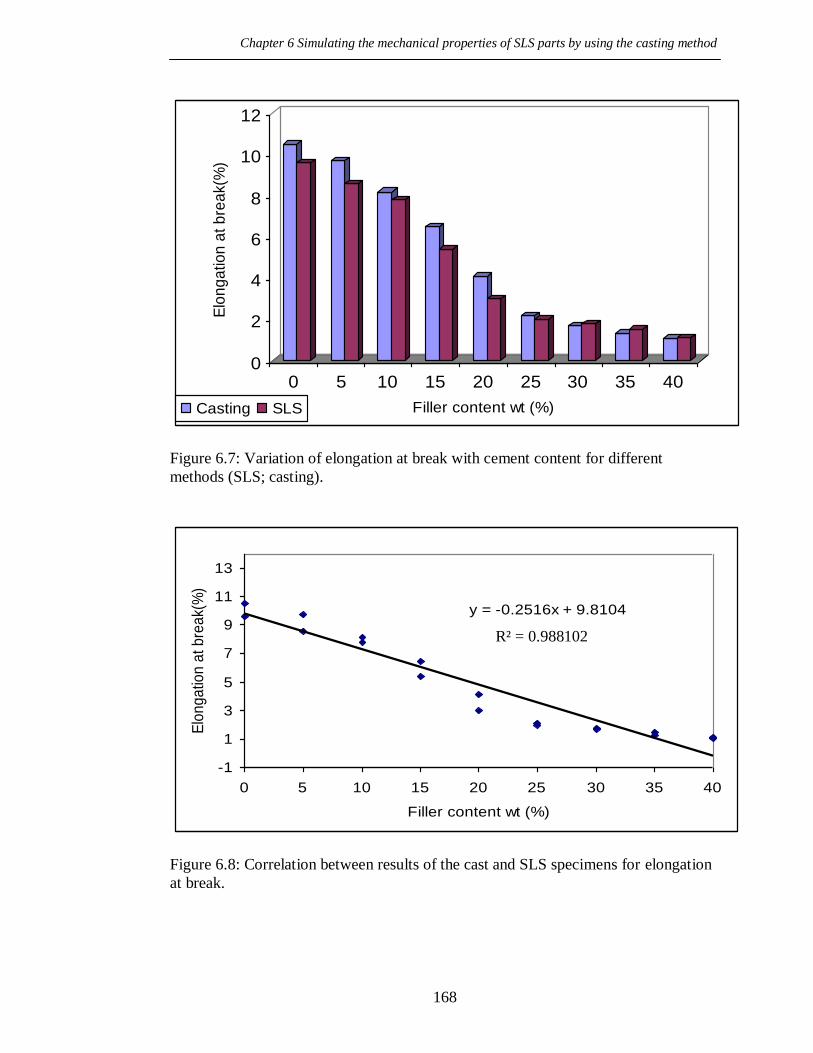
Chapter 6 Simulating the mechanical properties of SLS parts by using the casting method
168
0
2
4
6
8
10
12
Elo
ng
atio
n a
t b
rea
k(%
)
0 5 10 15 20 25 30 35 40
Filler content wt (%)Casting SLS
Figure 6.7: Variation of elongation at break with cement content for different
methods (SLS; casting).
y = -0.2516x + 9.8104
-1
1
3
5
7
9
11
13
0 5 10 15 20 25 30 35 40
Filler content wt (%)
Elo
ng
atio
n a
t b
rea
k(%
)
Figure 6.8: Correlation between results of the cast and SLS specimens for elongation
at break.
R² = 0.988102
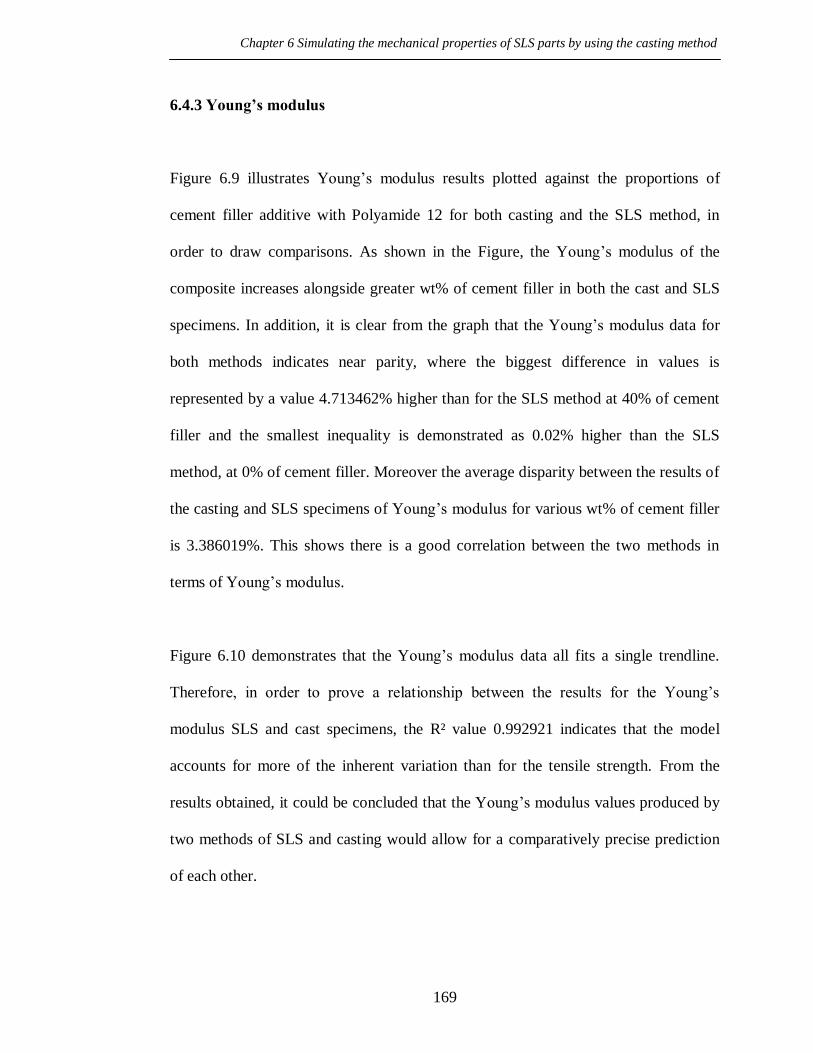
Chapter 6 Simulating the mechanical properties of SLS parts by using the casting method
169
6.4.3 Young’s modulus
Figure 6.9 illustrates Young‟s modulus results plotted against the proportions of
cement filler additive with Polyamide 12 for both casting and the SLS method, in
order to draw comparisons. As shown in the Figure, the Young‟s modulus of the
composite increases alongside greater wt% of cement filler in both the cast and SLS
specimens. In addition, it is clear from the graph that the Young‟s modulus data for
both methods indicates near parity, where the biggest difference in values is
represented by a value 4.713462% higher than for the SLS method at 40% of cement
filler and the smallest inequality is demonstrated as 0.02% higher than the SLS
method, at 0% of cement filler. Moreover the average disparity between the results of
the casting and SLS specimens of Young‟s modulus for various wt% of cement filler
is 3.386019%. This shows there is a good correlation between the two methods in
terms of Young‟s modulus.
Figure 6.10 demonstrates that the Young‟s modulus data all fits a single trendline.
Therefore, in order to prove a relationship between the results for the Young‟s
modulus SLS and cast specimens, the R² value 0.992921 indicates that the model
accounts for more of the inherent variation than for the tensile strength. From the
results obtained, it could be concluded that the Young‟s modulus values produced by
two methods of SLS and casting would allow for a comparatively precise prediction
of each other.

Chapter 6 Simulating the mechanical properties of SLS parts by using the casting method
170
0
500
1000
1500
2000
2500
3000
Yo
un
g's
mo
du
lus(M
pa
)
0 5 10 15 20 25 30 35 40
Filller content wt(%)Casting SLS
Figure 6.9: Variation of Young‟s modulus with cement content for different methods
(SLS; casting).
y = 21.068x + 2136.2
500
1000
1500
2000
2500
3000
3500
0 5 10 15 20 25 30 35 40
Filller content wt(%)
Yo
un
g's
mo
du
lus(M
pa
)
Figure 6.10: Correlation between the results of the cast and SLS specimens for
Young‟s modulus.
R² = 0.988102

Chapter 6 Simulating the mechanical properties of SLS parts by using the casting method
171
6.4.4 Flexural modulus
Figure 6.11 displays the influence of various weight fractions (wt%) of cement filler
on flexural modulus for SLS and the casting method. In addition, a comparison of the
flexural modulus of samples was made between the casting and SLS methods. It can
be seen from the Figure that flexural modulus increases with greater wt% and the
difference in measured values of flexural modulus for both methods is comparatively
small. The greatest difference in value is demonstrated by 4.612979 at 40% of cement
filer, whilst the lowest discrepancy in value is found to be 0.854701 at 20% of cement
filler. Furthermore the average difference in measured values of flexural modulus
between the SLS and casting methods for all weight fractions ranging from 0% to
40% of the cement additive with Polyamide 12 is 1.56393, thus indicating an
excellent interrelation between both methods.
It can be seen from Figure 6.12 that a single trendline through all data-points for
flexural modulus specimens was produced by SLS and the casting method, with an R²
value of 0.983307 to demonstrate the relationship in terms of flexural modulus
between the results obtained through both methods. From the results obtained, it is
suggested that the effect of increasing amounts of cement filler on the flexural
modulus of cast and SLS specimens is comparatively analogous and the casting
method used to produce samples of flexural modulus is admissible to predict
specimens produced using the SLS method.

Chapter 6 Simulating the mechanical properties of SLS parts by using the casting method
172
0
500
1000
1500
2000
2500
3000
Fle
xu
ral m
od
ulu
s (
MP
a)
0 5 10 15 20 25 30 35 40
Filller content wt(%)Casting SLS
Figure 6.11: Variation of flexural modulus with cement content for different methods
(SLS; casting).
y = 17.195x + 1892.7
500
1000
1500
2000
2500
3000
0 5 10 15 20 25 30 35 40
Filller content wt(%)
Fle
xu
ral m
od
ulu
s (
MP
a)
Figure 6.12: Correlation between the results of the cast and SLS specimens for
flexural modulus.
R² = 0.983307

Chapter 6 Simulating the mechanical properties of SLS parts by using the casting method
173
6.4.5 Flexural yield strength
From Figure 6.13, the various wt% of cement filler‟s influence on flexural yield
strength of the samples produced through SLS and the casting method may be
observed. As the wt% of cement filler increases, so does the flexural yield strength.
From the Figure, what can also be seen is a comparison of flexural yield strength for
both methods across various wt% of cement filler added to Polyamide 12. The
difference in measured values is almost equivalent. The greatest disparity is a value
4.97979% higher than for the SLS method at 40% of cement filler, while the smallest
variation is 1.642105% higher than for the casting method at 0% of cement filler. The
average difference in flexural yield strength values between SLS and the casting
method for all wt% of cement filler is 3.137744%, signifying an acceptable level of
variation for both sets in terms of flexural yield strength.
It can be seen from Figure 6.14 that flexural yield strength data from the specimens
produced through SLS and the casting method fits the trendline with an R² value of
0.97009, demonstrating that the trendline produces a relatively precise linear
illustration of the effect of increasing cement filler in both methods of manufacturing
specimens. This suggests that the effect of increasing amounts of cement filler on the
flexural yield strength of both the cast and SLS specimens is comparatively similar
and the casting method used to produce flexural yield samples is acceptable to predict
specimens produced using the SLS method.

Chapter 6 Simulating the mechanical properties of SLS parts by using the casting method
174
0
10
20
30
40
50
60
70
Fle
xu
ral y
ield
str
en
gth
(M
Pa
)
0 5 10 15 20 25 30 35 40
Filller content wt(%)Casting SLS
Figure 6.13: Variation of flexural yield strength with cement content for different
methods (SLS; casting).
y = 0.313x + 49.675
30
35
40
45
50
55
60
65
0 5 10 15 20 25 30 35 40
Filller content wt(%)
Fle
xura
l yie
ld s
trength
(M
Pa)
Figure 6.14: Correlation between the results of the cast and SLS specimens for
flexural yield strength.
R² = 0.97009

Chapter 6 Simulating the mechanical properties of SLS parts by using the casting method
175
6.4.6 Compressive strength
For the purposes of comparison, Figure 6.15 demonstrates that compressive strength
results were schemed against the proportions of cement filler additive with Polyamide
12 for specimens produced via the casting and SLS methods. As shown in the Figure,
the compressive strength of the composite specimens increases with greater wt% of
cement filler for both the cast and SLS methods and from the same Figure. It is clear
from the results for compressive strength in both methods that the difference is
comparatively small. The greatest difference in values for compressive strength
between both methods is indicated for the SLS method with a value 4.8583% higher
at 0% of cement filler, whilst the lowest disparity is a value 1.197822 % less than in
the SLS method at 10% of cement filler. Furthermore the average difference between
all results of compressive strength for the casting and SLS methods is 2.579453%,
which indicates that there is a good correlation between the two methods in terms of
compressive strength.
Figure 6.16 shows a schemata with a single trendline through all data-points for the
compressive strength of samples manufactured using the casting and SLS methods,
with an R² value of 0.98196 to corroborate the correlation between the results
obtained for compressive strength in both methods. From these results, it may be
suggested that the effect of increasing amounts wt% of cement filler on the
compressive strength for both methods is relatively similar. This allows for an
acceptably accurate prediction regarding the SLS and casting methods.
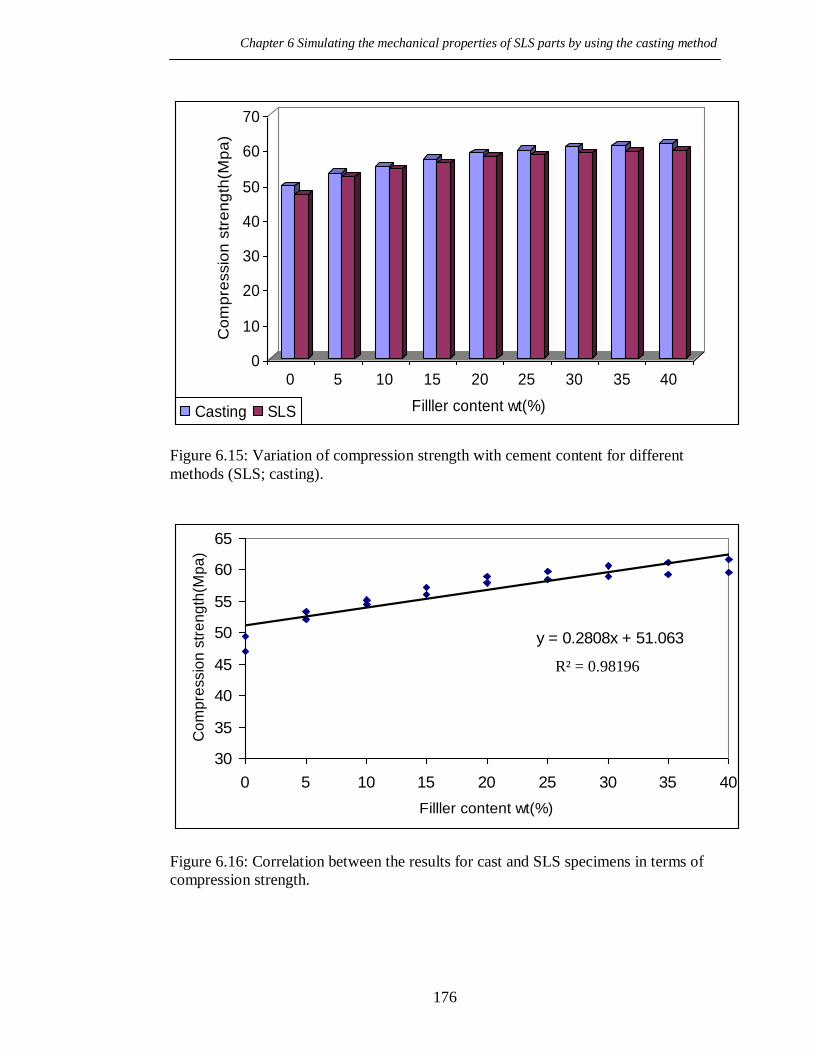
Chapter 6 Simulating the mechanical properties of SLS parts by using the casting method
176
0
10
20
30
40
50
60
70
Co
mp
ressio
n s
tre
ng
th(M
pa
)
0 5 10 15 20 25 30 35 40
Filller content wt(%)Casting SLS
Figure 6.15: Variation of compression strength with cement content for different
methods (SLS; casting).
y = 0.2808x + 51.063
30
35
40
45
50
55
60
65
0 5 10 15 20 25 30 35 40
Filller content wt(%)
Co
mp
ressio
n s
tre
ng
th(M
pa
)
Figure 6.16: Correlation between the results for cast and SLS specimens in terms of
compression strength.
R² = 0.98196
Chapter 6 Simulating the mechanical properties of SLS parts by using the casting method
177
6.5 Summary
This chapter presents a comparison between data on the mechanical properties of
specimens produced through SLS and casting at atmospheric pressure, in order to
investigate whether the latter method is suitable for producing parts with mechanical
properties similar to those of SLS specimens in the same material. The comparison of
the cast and SLS data-sets has shown that the tensile strength, elongation at break,
Young‟s modulus, flexural modulus, flexural yield modulus and compressive strength
obtained from specimens produced using casting were greater than in the SLS
specimens. In addition, the data for the mechanical properties of both methods
indicated a relatively small difference. This was proved by statistical models of
coefficient of determination, indicating that cast specimens could be used to predict
the properties of SLS parts produced in the same material. This would reduce the
length of time consumed and save large amounts of material.

Chapter 7 Contributions, conclusions and future work
178
Chapter 7
Contributions, Conclusions and Future Work
7.1 Contributions
The development of a new composite material from cement additive with Polyamide
12 has been performed, in order to improve the mechanical properties of the sintered
specimen and reduce the cost of the Polyamide 12 through the addition of cement.
An investigation of the thermal properties of composite material of cement and
Polyamide 12 of the virgin powder has been carried out with different proportions of
cement filler for controlling SLS parameters and obtaining consistent quality of
fabricated SLS specimens.
A method of casting to produce specimens with properties similar to those of SLS
parts has been examined with the aim of reducing the amount of time consumed and
the large amounts of material used.
A methodology for controlling the proportion of additive cement filler to Polyamide
12 has been projected.
Chapter 7 Contributions, conclusions and future work
179
The possibility of using un-sintered powder exposed to high temperature for an
extended period in the SLS system has been examined, and the development of a
methodology for controlling the amount of virgin powder to be added to used powder
has been investigated.
The relationship between mechanical properties and the melt flow rate (MFR)
indicates that MFR is a proven good indicator of powder fitness and mechanical
properties.
7.2 Conclusions
Applications of rapid prototyping are expanding to new domains. This is particularly
true of the selective laser sintering (SLS) process. In order for that process to be
competitive and become a strong candidate for new applications, such as rapid
manufacturing, the material used needs to be improved. This research attempts to
bring about SLS material improvement by creating new composite material from
cement additive with Polyamide 12, so as to reduce the cost of Polyamide 12, as well
as considerably improving the mechanical properties of the sintered specimen
through the addition of cement.
The thermal properties of the powder play an essential role in obtaining proper SLS
parameters, so a better understanding of the thermal properties of composite material
of cement with PA12 of the virgin and used (un-sintered) powder is helpful in

Chapter 7 Contributions, conclusions and future work
180
controlling SLS parameters and obtaining consistent quality in the fabricated SLS
specimens. In addition, the physical properties of virgin and used or un-sintered
powder are studied to expand a methodology for controlling the proportion of filler
additives to Polyamide 12 and organising the amount of virgin powder to be added to
the used powder, in order to obtain consistent, good quality and fine mechanical
properties.
The combined indications of the differential scanning calorimeter (DSC) suggest that
the different proportions of cement added to the Polyamide 12 do not affect the glass
transition temperature, Tg, melting temperature, Tm, or crystallisation temperature, Tc
and this leads to a part-bed temperature fixed at 177 C with different proportions of
cement added to the Polyamide 12, while the melt flow rate index test proposes that
the addition of cement particles to Polyamide 12 affects the melt flow rate of the
composite. As the proportion of cement increases, so does the viscosity of the
composite, due to a decrease in melted Polyamide 12. In addition, the gap between
the cement particles becomes narrower, so that the extruded material becomes more
viscous. This is a sign of a decrease in the MFR index and it ultimately affects the
quality of surface finish of the fabricated SLS specimens. Therefore, an acceptable
proportion of additive filler of cement to Polyamide 12 was established as 30%. This
was found to be the maximum proportion required to produce sufficient surface finish
of sintered specimens.

Chapter 7 Contributions, conclusions and future work
181
Large amounts (80% to 90%) of powder, remain un-sintered during the SLS process
and could be reused, depending on its properties. However, the properties of un-
sintered powder deteriorate through exposure to high temperatures, just below the
melting point of the composite material for an extended period throughout SLS
building and cool-down stage. The temperature and heating time to which the un-
sintered powder are exposed are the most significant parameters for powder aging
and deterioration of material properties.
The melt flow rate index tests intend that the temperature at which the un-sintered
composite powder was exposed and the duration of this exposure affect the melt flow
rate of the composite. The MFR of the composite material decreases by 18-25
g/10min with powder usage and this was attributed to the increased molecular weight,
which leads to increased viscosity and then decreasing MFR. The powder without
exposure to temperature has the lowest viscosity and highest MFR, while the powder
exposed to the highest temperatures over the longest periods has the highest viscosity
and lowest MFR. The molecular weight and melt flow rate of the samples subjected
to continuous and cyclic heating is less significant than the temperature and heating
time of the SLS process on material deterioration.
The differential scanning calorimeter DSC suggests that the temperature and heating
time at which the un-sintered powder is exposed affect the glass transition
temperature, Tg, melting temperature, Tm and crystallisation temperature, Tc and this
generates changes in the part-bed temperature with different grades of powder. The
Chapter 7 Contributions, conclusions and future work
182
melting temperature of the composite material increases by 0.5-1 ºC with each build
or cycle until it reaches 4ºC at the longest period of exposure of the powder to the
part-bed temperature. The fabrication parameters in the SLS process are mainly
dependent on the properties of powder used, so changing the fabrication parameters
as the aging powder changes can give consistent and good quality fabricated SLS
specimens.
The indications of the mechanical properties and MFR tests recommend that there is
a relationship between results obtained from the melt flow rate index and tensile and
compressive strength measures. As the powder degrades due to exposure to high
temperatures for an extended period through the SLS system, the tensile and
compressive strength deteriorates. Therefore, the amount of virgin power to be added
to achieve the target melt index has varied from 25% to 42%. The melt flow rate
index has proved to be a good indicator of powder fitness and mechanical properties.
It was also found that optimum energy density (ED) was obtained using a
Sintersation 2000 machine with composite material from cement additive with
Polyamide 12 at 0.051 J/mm². It was clear that ED has a major effect on the density
and mechanical properties of sintered parts.
The density of sintered parts increases as ED increases until it reaches optimum
energy density and then decreases as ED is increased even further. Sintered parts are
porous and weak if the ED is inferior, but become denser and stronger as ED

Chapter 7 Contributions, conclusions and future work
183
increases to a certain degree and then are weakened through degradation of the binder
at excessive exposure to ED.
In order to carry out and confirm the effect of ED on the density of sintered parts
produced from composite material of cement additive with Polyamide 12, the
research has endeavored to explain the effects of various ED on the density of
composite material by examining the physical construction of the specimens through
using scanning electron microscopy (SEM).
SEM discloses that sintered specimens built with low ED under 0.043 J/mm² have
partially melted Polyamide 12 particles but the majority of these particles can be
recognised individually because they have maintained their original shape rather than
melting, thus leading to defects and porosities. SEM illustrates that the sintered parts
built with higher levels of ED between 0.047 J/mm² and 0.051 J/mm² become denser
and the fusion of the Polyamide 12 particles is better; the particles seem to be
homogeneous and cannot be seen independently, which results in decreased porosity,
therefore enabling a more compact structure to be built. Due to excessive exposure of
ED to the powder at a level above 0.054 J/mm², SEM explains the degradation of the
Polyamide 12 and a dark colour on the surface of the part due to overheating caused
by ED.
A comparison was applied between the mechanical properties of measured values of
actual parts produced by SLS Sintersation 2000, and data-sheet values supplied by

Chapter 7 Contributions, conclusions and future work
184
EOS for pure Polyamide 12, in order to ensure that Sintersation 2000 was capable of
producing consistent parts. Compared with the data-sheet, results confirmed that the
Sintersation 2000 used in this research was reliable to produce parts with consistent
mechanical properties.
Composite material of cement additive with Polyamide 12 plays an essential role in
the development of mechanical properties of sintered parts built using SLS
Sintersation 2000. To a certain extent, adding cement filler to Polyamide 12 gives
superior Young‟s modulus, flexural strength, compression strength and tensile
strength to some extent in sintered specimens, but in terms of impact strength, the
addition of cement particles to Polyamide 12 weakens the impact of the composite.
To obtain consistency, good surface quality and fine mechanical properties in the
fabricated SLS specimens, the suitable proportion of cement added to the Polyamide
12 proved to be 30% by weight, illustrated in the production of the garlic crusher.
Numerous materials and certainly, any material that can be triturated, may be used in
the SLS process. However, with continuity and the increase of new powder and
composite materials for use in SLS, limitations could arise, caused by the time-
consuming nature of the SLS process itself when testing new materials (machine set-
up, preheating, building, cool-down and cleaning the machine properly). In addition,
there is the problem of the enormous amount of material required to produce parts
using SLS. The casting method is therefore used in this research to simulate the
mechanical properties of SLS parts, while reducing the amount of time and massive

Chapter 7 Contributions, conclusions and future work
185
amount of material involved when testing new materials. It was found that the casting
method was suitable for predicting the mechanical properties of SLS specimens in the
same material, as the data of mechanical properties for both methods does not differ a
great deal, as proven by statistical models of the coefficient of determination.
The research mainly focused on the mechanical properties of the new composite
material and specimens made from that material, but it should be obvious that the
new material will be cheaper than pure Polyamide 12, as cement is much less
expensive than Polyamide 12 (see Appendix C for a brief analysis of the cost of
different materials).
7.3 Future work
One possible future research direction is the study of a phenomenon termed „curling‟,
which occurs due to temperature differences in different regions of the fabricated
part, leading to uneven shrinkage. Shrinkage causes the surfaces of the part to display
a curved profile when they are supposed to be flat.
In the SLS process, the sintered parts also exhibit varying degrees of inherent
porosity, due to the nature of layer-by-layer construction. Through the sintering
process, bonds between particles occur. Therefore, blocking tortuous and
interconnected pore channels leads to the development of isolated porosity. This is
usually an undesired trait, as the part integrity decreases with increased porosity. The
Chapter 7 Contributions, conclusions and future work
186
porosity phenomena could generate further work to investigate, eliminate or reduce
the porosity in sintered components.
Finally, another possible further investigation course is the study of the effect of
proportion of cement additive to Polyamide 12 and SLS processing parameters on the
surface quality of sintered components. The most important factors considered to be
an influence on the surface roughness are layer thickness (powder thickness of each
layer in the part-cylinder) which leads to „stair-stepping‟, laser power, laser beam
speed, laser beam offset, beam diameter, scan spacing and part bed temperature.

Appendix
187
Appendix A Equations used to find the value of mechanical
properties
Equations used to find the value of mechanical properties

Appendix
188
A.1 Flexural stress
Where:
ζ f is the flexural stress expressed in megapascals.
F is the force applied concerned in Newton.
L is the span expressed in millimetres.
b is the width of the specimen expressed in millimetres.
h is the thickness of the specimen expressed in millimetres (BS EN 2746, 1998).
A.2 Flexural modulus
Where:
E f is the modulus expressed in megapascals.
ΔF is a chosen difference in force concerned, in Newton.
Δd is the difference in deflection corresponding to the difference in force ΔF
expressed in millimetres (BS EN 2746, 1998).
A.3 Stress calculations of tensile and compressive

Appendix
189
Ec
h . bN
Where:
ζ f is the stress expressed in megapascals.
F is the measured force concerned, in Newton.
A is the initial cross-sectional area of the specimen expressed in square millimetres
(ISO 527.2, 1996).
A.4 Elongation
ε (%) = ΔLo × 100
Lo
Where:
ε is the strain value expressed as a dimensionless ratio, or in percentage.
Lo is the original length of the test specimen expressed in millimeters.
ΔLo is the increase in the specimen length between the gauge marks, expressed in
millimetres (ISO 527.2, 1996).
A.5 Izod impact strength of notched specimens
aiN = × 10 ³
Where:
aiN is the Izod impact strength of notched specimens expressed in kilojoules per
square metre.

Appendix
190
Ec is the corrected energy absorbed by breaking the test specimen expressed in
joules.
h is the thickness of the test specimen in millimetres expressed in millimeters.
bN is the remaining width of the test specimen expressed in millimeters (ISO 180,
2001).
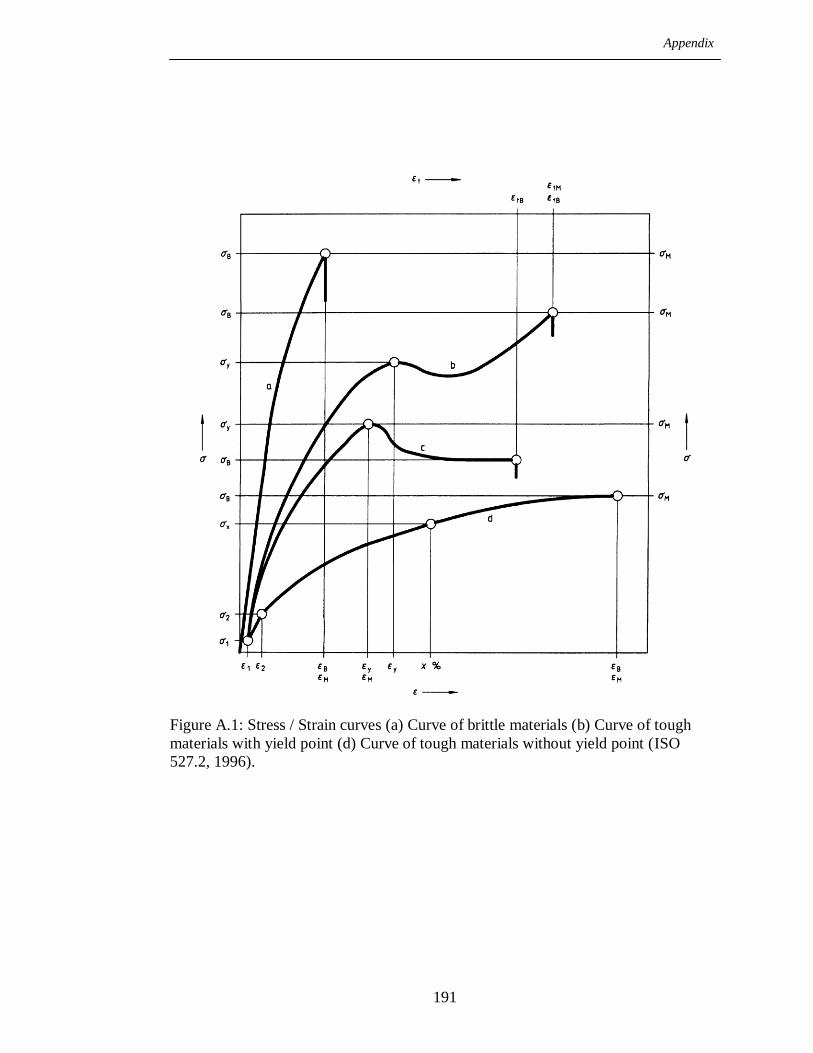
Appendix
191
Figure A.1: Stress / Strain curves (a) Curve of brittle materials (b) Curve of tough
materials with yield point (d) Curve of tough materials without yield point (ISO
527.2, 1996).

Appendix
192
Appendix B The history and manufacture of Portland cement
Appendix
193
Portland cement was developed from natural cements in the early part of the
nineteenth century by Joseph Aspdin, and its name is derived from the place Isle of
Portland in Dorset located in South West England.
Portland cement is considered the common type of cement used at present. It is made
by heating raw materials of limestone and clay to high temperature to form clinker,
and then the particles of clinker are ground down to small particles. Usually the
Portland cement is manufactured in a four step process.
The first step is quarrying limestone or chalk and clay or shale and brought them to
the cement plant with smash the limestone to small pieces less than 25 mm. These
raw materials contain significant quantities of component of lime (CaCO3), silica
(SiO2), alumina (Al2O3) and ferrous oxide (Fe2O3).
The second process is considered raw material preparation to form a consistent
clinker. So the proportions of limestone and clay should be chosen by high precision
to get good composite to form high-quality clinker after burn them.
The third step is heat treatment whereas the raw materials are fed into a rotating kiln
and then they are started to dry and heat by high temperature of around 1200-1400
ºC. After that the chemical reactions start to occur to form clinker which contains four
main minerals are tricalcium silicate (C3S) formed 65% of cement, dicalcium silicate
(C2S) formed 15% of cement, tricalcium aluminate (C3A) formed 7% of cement and
Appendix
194
last one tetracalcium alumino-ferrate (C4AF) formed 8% of cement. Once the clinker
is produced the cool down stage started and then transport to a storage area.
Last step is called cement milling in this process the particles of clinker is big size. So
it is ground to get a fine powder, and then mixed with gypsum (hydrated calcium
sulphate) which acts as a set regulator (retarder) (Barnes, 1983; Varas et al., 2005;
Bramante et al., 2008).

Appendix
195
Appendix C Cost of materials

Appendix
196
C.1 Effect of cement additive on the price of Polyamide 12.
Figure C.1 illustrates the cost of cement filler composite material with Polyamide 12
in various types of cement filler content from 0 wt% to 40 wt%. It is clear from the
graph representation that the cost of composite material is influenced by various
weight fractions (wt%) of cement. It can be seen that the percentage of money saved
on composite material increases with a rise in weight fractions of cement. This result
confirms that the addition of cement particles to Polyamide 12 saves money by over
20% when 40wt% cement filler is added and this satisfies the market demand for
cost-cutting on sintered components.
C.2 Comparison of the cost between composite material of (cement/PA12) and
(GF)
Figure C.2 demonstrates how percentage cost results were plotted against different
composite materials. The first composite material is cement filler additive with
Polyamide 12 and the second composite is glass bead filler additive with Polyamide
12 for the purpose of comparison. As shown in the Figure, the cost decreases as
weight fractions (wt%) of cement filler are increased and the cost increases with a
rise in the proportion of glass bead filler. It is clear from the graph that the data on
percentage costs differs between both composite materials. The cost of glass filler is
always higher than that of composite material of cement filler with added Polyamide
12. This percentage difference in cost starts from 7% at proportion 5 and continues to

Appendix
197
increase until it reaches 45.1% at weight fraction 40, thus demonstrating that the cost
of composite material of cement additive with Polyamide 12 is cheaper than that of
glass bead filler.

Appendix
198
0
5
10
15
20
25
0 5 10 15 20 25 30 35 40
Filler content wt(%)
Perc
en
tag
e o
f sa
vin
g m
on
ey
Figure C 1: Effect of cement filler and Polyamide 12 on relative cost.
45.1%40.4%35.5%30.5%25.2%19.6%13.6%7%
0
10
20
30
40
50
5 10 15 20 25 30 35 40
Filler content wt(%)
Per
cen
tag
e o
f co
stin
g m
oney
Cement
&PA
Glass
filled
Figure C 2: Comparison of the cost of composite material of cement & PA12 and GF.

Appendix
199
Appendix D Case study
Appendix
200
D.1 Case study
The purpose of this experiment is to implement the optimal parameters of SLS and
the highest proportion of cement additive composite material with Polyamide 12 to
produce part of a garlic crusher with consistent, good quality and at a low cost. For
this reason, the optimal energy density of 0.051 J/mm² and the highest proportion of
30%-40% of composite material weight fractions were employed in this experiment.
The SLS Sintersation 2000 was employed to produce three parts of a garlic crusher,
each one in a separate run with the same parameters and varying proportions (see
Figure D.1). The surface quality of the sintered parts of the garlic crusher was
assessed through observation and touch on the part surface. It was found from the
three components that all parts were classified as having acceptable consistent, good
quality surface finish. However, it was seen that the roughness of the surface finish of
components increased alongside increases in the proportion of cement filler.
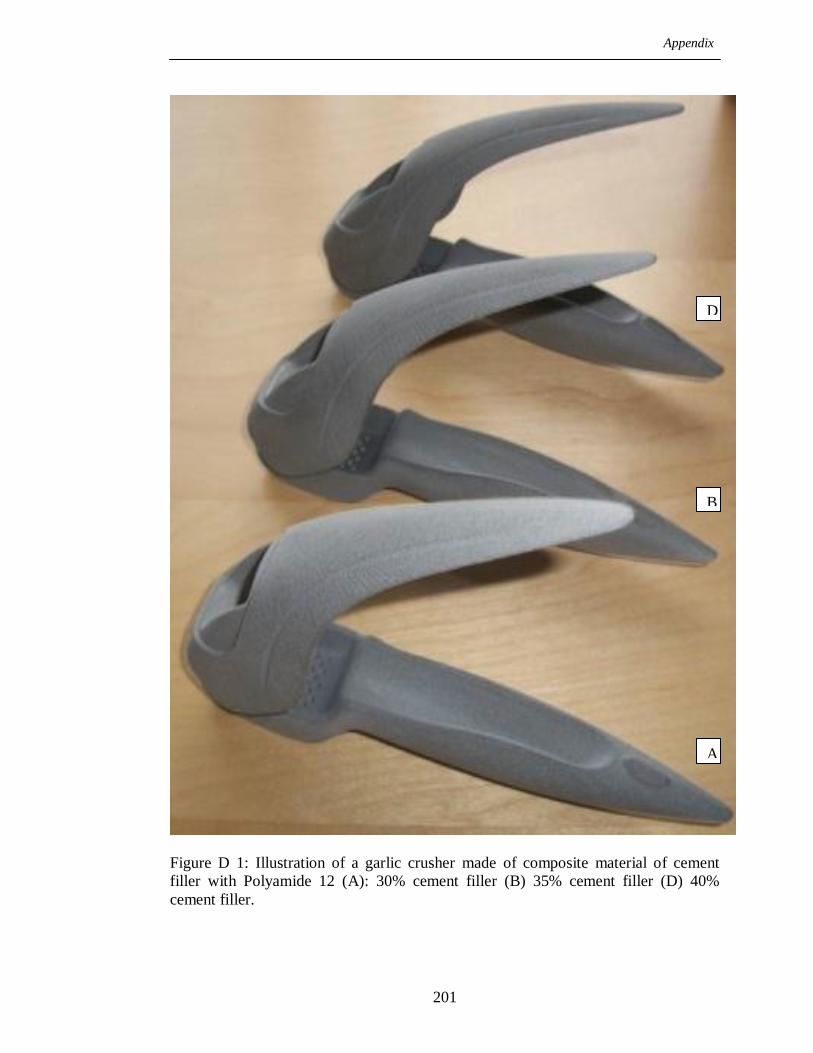
Appendix
201
Figure D 1: Illustration of a garlic crusher made of composite material of cement
filler with Polyamide 12 (A): 30% cement filler (B) 35% cement filler (D) 40%
cement filler.
A
B
D
References
202
References
Abid, M. 2009, Investigation of orange peel phenomenon related to powder
deterioration and relevant process parameters. PhD Thesis, Cardiff University.
Ajoku, U. Saleh, N. Hopkinson, N. Hague, R. and Erasenthiran, P. 2006.
Investigating mechanical anisotropy and end-of-vector effect in laser-sintered nylon
parts. Journal of Engineering Manufacture. 220(7) pp 1077-1086.
Barnes, P. 1983. Structure and Performance of Cements. London: Applied Science.
Beal, V. E. Paggi, R. A. Salmoria, G. V. and Lago, A. 2009. Statistical evaluation of
laser energy density effect on mechanical properties of polyamide parts manufactured
by selective laser sintering. Journal of Applied Polymer Science. 113 (5) pp 2910-
2919.
BS EN 2746:1998. Glass fibre reinforced plastics — Flexural test — Three point
bend method. British Standard Aerospace Series.
Beaman, J.B. Barlow, J.W. Bourell, D.L. Crawford, R.H. and Marcus, H.L. 1997.
Solid Freeform Fabrication: A New Direction in Manufacturing. Dordrecht: Kluwer
Academic Publishers.
References
203
Bertrand, P. Bayle, F. Combe, C. Goeuriot, P. and Smurov, I. 2007. Ceramic
components manufacturing by selective laser sintering. Applied Surface Science.
254(4) pp 989-992.
Berzins, M. Childs, T.H.C. and Ryder, G.R. 2007. The Selective Laser Sintering of
Polycarbonate. CIRP Annals - Manufacturing Technology. 45(1) pp 187-190.
Boivie, K. 2000. SLS Application of the Fe-Cu-C System for Liquid Phase Sintering
[online]. Available at:
http://74.125.155.132/scholar?q=cache:fSQhHwoBHEYJ:scholar.google.com/&hl=e
n&as_sdt=2000 [Accessed: 15 June 2008].
Bramante, C. M. Demarchi, A. Moraes, I. G. and Bernadineli, N. 2008. Presence of
arsenic in different types of MTA and white and gray Portland cement. Mosby, Inc.
106(6) pp 909-913.
Brydson, J. 1999. Plastics Materials. 7th ed. Oxford: Butterworth Heinemann.
Castle, I. 2008. Fused Deposition Modelling [online]. Available at:
http://home.att.net/~castleisland/fdm_int.htm [Accessed: 5July2008].
References
204
Caulfield, B. McHugh, P.E. and Lohfeld, S. 2007. Dependence of mechanical
properties of polyamide components on build parameters in the SLS process. Journal
of Materials Processing Technology. 182(1-3) pp 477-488.
Chen, X. Wang, C. Xiao, Y. and Huang, S. 2001. Direct Slicing from PowerSHAPE
Models for Rapid Prototyping. The International Journal of Advanced Manufacturing
Technology. 17(7) pp 543-547.
Childs, T.H.C. Tontowi, A.E. 2001. Selective laser sintering of a crystalline and a
glass-filled crystalline polymer: experiments and simulations. Journal of Engineering
Manufacture. 215(11) pp 1481-1495.
Cooper, K.G. 2001. Rapid Prototyping Technology Selection and Application. New
York: Marcel Dekker, Inc.
Cowie, J.M.G. 1973. Polymer: Chemistry & Physics of Modern Materials. Guildford:
Billing.
Crawford, R.J. 1987. Plastics Engineering. 2nd
ed. Oxford: Pergamon Press.
Davies, G.J. 1973. Solidification and Casting. London: Applied Science Ltd.

References
205
Dewidar, M. M. Dalgarno, K. W. and Wright, C.S. 2003. Processing conditions and
mechanical properties of high-speed steel parts fabricated using direct selective laser
sintering. Journal of Engineering Manufacture part B. 217(12) pp 1651-16663.
Dewidar, M. M and Dalgarno, K. W. 2001. Direct selective laser sintering of high-
speed steel, 17th
National Conference on Manufacturing Research, pp 181-186.
Dimov, S.S. Pham, D.T. Dotchev, K.D. and Ivanov, A.I. (2005), Dimensional
accuracy of castform polystyrene patterns produced by selective laser sintering, Proc.
of the 2nd International Conference on Advanced Research in Virtual and Rapid
Prototyping, October 2005, Leiria, pp.229-304.
Doehler, H.H. 1951. Die Casting. New York: McGraw-Hill Book Company, Inc.
Dotchev, K. and Soe, S. 2006. Rapid manufacturing of patterns for investment
casting: improvement of quality and success rate. Rapid Prototyping Journal. 12(3)
pp 156-164.
DSC. 2005. Differential scanning calorimetry [Online]. Available at:
http://pslc.ws/macrog/dsc.htm [Accessed: 10 February 2009].
DTM Corporation. 1996. The Sinterstation@
System 2500, Guide to Materials for
Nylon Compounds. DCN:8001-10003.

References
206
DTM Corporation. 1997. The Sinterstation® System, Guide to materials:
DuraForm™ Polyamide, 1611 Headway Circle, Austin, Texas 78754. DCN:8001-
10014.
3D Systems. 2006. CastForm PS material for use with all selective laser
sintering(SLS)system[online].Availableat:http://www.3dsystems.com/products/datafi
les/lasersintering/datasheets/CastForm-PS-material-A4_UK.pdf [Accessed: 16 June
2008].
EOS, Electro Optical Systems GmbH [online].Available at:
http://www.eos.info/en/home.html [Accessed: 20 July 2008].
Fan, K.M. Cheung, W.L. and Gibson, I 2005. Movement of powder bed material
during the selective laser sintering of bisphenol-A polycarbonate. Rapid Prototyping
Journal. 11(4) pp 188-198.
Flood, S.C. and Hunt, J.D. 1988. Columnar to equiaxed transition. ASM
International, ASM Handbook. 15 pp 130-136.
German, R.M. 1996. Sintering Theory and Practice. New York: John Wiley & Sons,
Inc.

References
207
Gibson, I. and Shi, D. 1997. Material properties and fabrication parameters in
selective laser sintering process. Rapid Prototyping Journal. 13(4) pp 129-136.
Gill, T. J. and Hon, K. K. B. 2004. Experimental investigation into the selective laser
sintering of silicon carbide polyamide composites. Proc Instn Mech Engrs, Part B:
Journal of Engineering Manufacture, 218(10) pp 1249-1256.
Gubbels, F. Jerome, R. Vanlathem, E. Deltour, R, Calderone, V. Parente, J. and
Bredas, L. 1994. Selective Localization of Carbon Black in Immiscible Polymer
Blends: A Useful Tool To Design Electrical Conductive Composites.
Macromolecules. 27(7) pp 1972-1974.
He, D and Jiang, B. 1993. The Elastic Modulus of Filled Polymer Composites.
Journal of Applied Polymer Science. 49(4) pp 617-621.
Hirschhorn, J.S. 1969. Introduction to Powder Metallurgy. New York: American
Powder Metallurgy Institute.
Hon, K.K.B. and Gill, T.J. 2003. Selective Laser Sintering of SiC/Polyamide
Composites. Journal of CIRP Annals Manufacturing Technology. 52(1) pp 173-176.

References
208
Ho, H.C.H. Cheung, W.L. and Gibson, I. 2002. Effects of graphite powder on the
laser sintering behaviour of polycarbonate. Journal of Rapid Prototyping. 8(4) pp
233-242.
Ilkgun, O. 2005. Effects of Production Parameters on Porosity and Hole Properties
in Laser Sintering Rapid Prototyping Process. PhD Thesis, Middle East Technical
University.
ISO1133, 2005. Plastics Determination of the Melt Mass Flow Rate (MFR) and the
Melt Volume Flow Rate (MVR) of Thermoplastics. Cardiff: British Standard.
ISO11357-6, 2008. Plastics - Differential scanning calorimetry (DSC). Cardiff:
British Standard.
ISO16014, 2003. Plastics-Determination of average molecular mass and molecular
mass distribution of polymers using size-exclusion chromatography. Cardiff: British
Standard.
ISO 178, 2003. Plastics. Determination of flexural properties. Cardiff: British
Standard.
ISO 180, 2001. Plastics — Determination of Izod impact strength. Cardiff: British
Standard.

References
209
ISO 1183-3, 1999. Plastics. Methods for determining the density of non-cellular
plastics. Gas pyknometer method. Cardiff: British Standard.
ISO527-1, 1996. Plastics —Determination of tensile properties — Part 1: General
principles. Cardiff: British Standard.
ISO 604, 2003. Plastics. Determination of compressive properties. Cardiff: British
Standard.
Jain, P.K. Senthilkumaran, K. Pandey, P.M. and Rao, P.V.M. 2006. ADVANCES IN
MATERIALS FOR POWDER BASED RAPID PROTOTYPING. International
Conference on Recent Anvances in Materials and Processing. PSG-tech. Coimbatore,
INDIA. pp 1-8.
Jamal, N. M. 2001. Finite Element Analysis of Curl Development in the SLS process.
PhD Thesis, Leeds University.
Kai, C.C. and Fai, L.K. 1997. Rapid Prototyping: Principle & Application In
Manufacturing. New York: John Wiley & Sos, Inc.

References
210
Katstra, W. E. Palazzolo, R. D. Rowe, C. W. Giritlioglu, B. Teung, P. and Cima, M.
J. 2000. Oral Dosage Forms Fabricated by Three Dimensional Printing. Journal of
Controlled Release. 66(1) pp 1-9.
Kietzman, J. 1999. RAPID PROTOTYPING POLYMER PARTS VIA SHAPE
DEPOSITION MANUFACTURING. PhD Thesis, Stanford Unoversity.
King, D. and Tansey, T. 2003. Rapid Tooling: selective laser sintering injection
tooling. Journal of Materials Processing Technology. 132(1-3) pp 42-48.
King, D. and Tansey, T. 2002. Alternative materials for rapid tooling, Journal of
Materials Processing Technology, 121 pp 313-317.
Kohan, M.K. 1995. Nylon Plastic Handbook. New York: Hanser.
Kruth, J.P. Mercelis, P. Vaerenbergh, J. Froyen, L. and Rombouts, M. 2005. Binding
Mechanisms in Selective Laser Sintering and Selective Laser Melting, Rapid
Prototyping Journal, Emerald. 11 (1) pp 26-36.
Kruth, J. P. Wang, X. Laoui, T. and Froyen, L. 2003. Lasers and materials in
selective laser sintering. Journal of Assembly Automation. 23(4) pp 357-371.
References
211
Kumar, V. and Dutta, D. 1997. An assessment of data formats for layer
manufacturing. Journal of Adv. Engng Software 28(3), pp.151- 164.
Kumar, S. 2009. Manufacturing of WC–Co moulds using SLS machine. Journal of
Materials Processing Technology. 209(8) pp 3840-3848.
Lea, F.M. 1970. The Chemistry of Cement and Concrete. 3rd
ed. Glasgow: Edward
Arnold Ltd.
Levy, G.N. and Schindel, R. 2002. Overview of layer manufacturing technologies,
opportunities, options and applications for rapid tooling, Proc Instn Mech Engrs, Part
B: Journal of Engineering Manufacture, 216, pp 1621-1634.
Liang, J. Z. 2005. Tensile and Flexural Properties of Hollow Glass Bead-filled ABS
Composites. Journal of Elastomers and Plastic. 37(4), pp.361-370.
Liao, Y.S. Li, H.C. and Chiu, Y.Y. 2005. Study of laminated object manufacturing
with separately applied heating and pressing. The International Journal of Advanced
Manufacturing Technology. 27(7-8) pp 703-707.
Maeda, K. and Childs, T.H.C. 2004. Laser sintering (SLS) of hard metal powders for
abrasion resistant coatings. Journal of Materials Processing Technology. 149(1-3) pp
609–615.
References
212
Majewski, C.E. Zarringhalam, H. Toon, D. Ajoku, U. Hopkinson, N. Caine, M.P.
2008. The use of off-line part production to predict the tensile properties of parts
produced by Selective Laser Sintering. Journal of Materials Processing Technology.
209(6) pp 2855-2863.
Mangonon, P.L. 1999. The Principles of Materials Selection for Engineering Design.
New Jersey: Prentice Hall.
Mareri, P. Bastide, S. Binda, N. and Crespy A 1998. Mechanical Behaviour of
Polypropylene Composites Containing Fine Mineral Filler: Effect of Filler Surface
Treatment. Composites Science and Technology. 58(5) pp 747-752.
Martin, J.W. 2006. Materials for engineering. 3rd
ed. Cambridge: Woodhead
Publishing Ltd.
Mazzoli, A. Moriconi, G. Pauri, M. G. 2006. Characterization of an aluminum-filled
polyamide powder for applications in selective laser sintering. Journal of Materials
and Design. 28 pp 993-1000.
MettlerToledo. Thermal Analysis Excellence. [Online]. Available at:
http://us.mt.com/us/en/home/products/Laboratory_Analytics_Browse/TA_Family_Br
owse.html [Accessed: 2 July 2008].
References
213
Min Hur, S. Hyun, K. Hee, S and Keun, P. 2001. Determination of fabricating
orientation and packing in SLS process. Journal of Materials Processing Technology.
112(2-3) pp 236-243.
Mueller, B and Kochan, D. 1999. Laminated object manufacturing for rapid tooling
and patternmaking in the foundry industry. Journal of Computers in Industry 39(1)
pp 47-53.
Nakamoto, T. Shirakawa, N. Miyata, Y. and Inui, H. 2009. Selective laser sintering of
high carbon steel powders studied as a function of carbon content. Journal of
Materials Processing Technology. 209(15-16) pp 5653-5660.
Neal, P. J. 1994. Rapid Prototyping Using the Selective Laser Sintering Process.
Rapid Prototyping Journal. 14(2) pp 14-17.
Nelson, J.C. Xue, S. Barlow, J.W. and Beaman, J. 1993. Model of the selective laser
sintering of bisphenol-A polycarbonate. Industrial & Engineering Chemistry
Research. 32(10) pp 2305-2317.
Pacheco, L.F. and Campos, M. 2009. Bonding Evolution with Sintering
Temperature in Low Alloyed Steels with Chromium. Science of Sintering, 41 pp 161
173.

References
214
Paramount, 2009. SLS Material, Selective Laser Sintering Materials [online].
Available at: http://www.paramountind.com/selective-laser-sintering-material.html
[Accessed: 17 June 2009].
Parnes, P. 1983. Structure and Performance of Cements. London: Applied Science.
Partanen, J. P. Zheng, N. and Bishop, R. J. 2010. Laser sintering process chamber gas
curtain window cleansing in a laser sintering system. [online].Available at:
http://www.freepatentsonline.com/7807947.html [Accessed: 20 Jan 2011].
Pham, D.T. and Dimov, S.S. 2000. Rapid Manufacturing: The Technologies and
Applications of Rapid Prototyping and Rapid Tooling. London: Springer.
Pham, D. T. and Dimov, S. S. 2003. Rapid Prototyping and Rapid Tooling – the key
enablers for rapid manufacturing. Journal of Mechanical Engineering Science
217(1),pp. 1-23.
Pham, D. T. Dotchev, K. D. and Yusoff, W. A. Y. 2008. Deterioration of polyamide
powder properties in the laser sintering process. Journal of Mechanical Engineering
Science. 222(11) pp 2163-2176.

References
215
Pham, D.T. and Gault, R.S. 1998. A comparison of rapid prototyping technologies. Journal
of Machine Tools and Manufacture 38(10) 1275-1287.
Pintea, A. (no date) Heat Transfer Behaviour of the Parts Manufacturing by Selective
Laser Sintering (SLS). [online]. Available http://imtuoradea.ro/auo.fmte/files-
2006/TCM_files/Adina%20Pintea%201.pdf [Accessed: 22 June 2010].
Queijo, L. Rocha, J. Barreira, L. and Barbosa, T. 2010. A surgical training model
manufacture using rapid prototyping technology. CRC Press. [online]. Available at:
http://hdl.handle.net/10198/1800 [Accessed: 15 Jan 2011].
Salmoria, G. V. Leite, J. L. Ahrens, C. H. Lago, A. and Pires, A. T. N. 2007. Rapid
manufacturing of PA/HDPE blend specimens by selective laser sintering:
Microstructural Characterisation. Journal of Polymer Testing 26(3), pp. 361-368.
Salmoria, G. V. Leite, J. L. and Paggi, R. A. 2009. The microstructural
characterization of PA6/PA12 blend specimens fabricated by selective laser sintering.
Journal of Polymer Testing. 28 (7) pp 746-751.
Schmidt, M. Pohle, D. and Rechtenwald, T. 2007. Selective Laser Sintering of PEEK.
Journal of CIRP Annals Manufacturing Technology. 56(1) pp 205-208.

References
216
Shirley, D.E. 1986. Introduction to Concrete. 3rd
ed. Slough: Cement and Concrete
Association.
Shi, Y. Chen, J. Wang, Y. Li, Z. Huang, S. 2007. Study of the selective laser
sintering of polycarbonate and postprocess for parts reinforcement. Journal of
Materials: Design and Applications. 221(1) pp 37-42.
Sichina, W.J. 2000. DSC as Problem Solving Tool: Measurement of Percent
Crystallinity of Thermoplastics, PerkniEimer, Inc.
Subramanian, K. Vail, N. Barlow and Marcus, H. 1995. Selective laser sintering of
alumina with polymer binders. Rapid Prototyping Journal. 1(2) pp 24-35.
ThermoHaake. 2000. Instruction Manual SWO of Meltfiler MT.
3T RPD. 2008. Selective Laser Sintering (SLS) for Rapid Prototyping
[online].Available at: http://www.3trpd.co.uk/sls.htm [Accessed: 17 June 2008].
Unal, H. 2004. Morphology and mechanical properties of composites based on
polyamide 6 and mineral additives. Materials & Design. 25(6) pp 483-487.

References
217
Vail, N. K. Balasubramanian, B. Barlow, J.W. and Marcus, H.L. 1996. A thermal
model of polymer degradation during selective laser sintering of polymer coated
ceramic powders. Rapid Prototyping Journal. 2(3) pp 24-40.
Vail, N. K. Barlow, J. W. and Marcus, H. L. 1993. Silicon Carbide Preforms for
Metal Infiltration by Selective Laser Sintering (TM) of Polymer Encapsulated
Powders. Solid Freeform Fabrication Proceedings, The University of Texas, Austin.
pp 204-214.
Varas, M. J. Alvarez, M and Fort, R. 2005. Natural cement as the precursor of
Portland cement: Methodology for its identification. Cement and Concrete Research.
35(11) pp 2055-2065.
Wang, X. 1999. Calibration of shrinkage and beam offset in SLS process. Rapid
Prototyping Journal. 5(3) pp 129-133.
Xpress 3D . 2005 [online]. Available at:http://www.xpress3d.com/Zcorp3DP.aspx
[Accessed: 9 June 2008].
Yan, C. Z. Shi, Y. S. Yang, J. S. and Xu, L. 2009. Preparation and Selective Laser
Sintering of Nylon-12-Coated Aluminum Powders. Journal of Composite Materials.
43(17) pp 1835-1851.

References
218
Young, R.J. 1981. Introduction to Polymers. London: Chapman and Hall.
Yusoff, W.A.Y. 2007. An investigation of the “Orange Peel” Phenomenon. PhD
Thesis, Cardiff University.
Zein, I. Hutmacher, D.W. Tan, K. C. and Teoh, S. H. 2002. Fused deposition
modeling of novel scaffold architectures for tissue engineering applications. Journal
of Biomaterials. 23(4) pp 1169-1185.
Zhou, J. Zhang, Y. and Chen, J.K. 2009. Numerical Simulation of Random Packing
of Spherical Particles for Powder-Based Additive Manufacturing. Journal of
manufacturing science and engineering. 131(3) pp 1-8.
Zhou, W. Y. Lee, S. H. Wang, M. Cheung, W. L. and Lp, W. Y. 2007. Selective laser
sintering of porous tissue engineering scaffolds from poly(L lactide) /carbonated
hydroxyapatite nanocomposite microspheres. Journal of Material Science. 19(7) pp
2535-2540.