Embed Size (px)
Citation preview
PROCEEDINGS OF SPIE
SPIEDigitalLibrary.org/conference-proceedings-of-spie
Development of a new polarizedhyperspectral imaging microscope
Zhou, Ximing, Ma, Ling, Halicek, Martin, Dormer, James,Fei, Baowei
Ximing Zhou, Ling Ma, Martin Halicek, James Dormer, Baowei Fei,"Development of a new polarized hyperspectral imaging microscope," Proc.SPIE 11213, Imaging, Therapeutics, and Advanced Technology in Head andNeck Surgery and Otolaryngology 2020, 1121308 (19 February 2020); doi:10.1117/12.2549676
Event: SPIE BiOS, 2020, San Francisco, California, United States
Downloaded From: https://www.spiedigitallibrary.org/conference-proceedings-of-spie on 07 May 2020 Terms of Use: https://www.spiedigitallibrary.org/terms-of-use
Development of a new polarized hyperspectral imaging microscope
Ximing Zhou a, Ling Ma a, Martin Halicek a, James Dormer a, Baowei Fei a,b *
aThe University of Texas at Dallas, Department of Bioengineering, Richardson, TX b University of Texas Southwestern Medical Center, Department of Radiology, Dallas, TX
* Email: [email protected], Website: https://fei-lab.org
ABSTRACT
In this study, we proposed and designed a transmission mode polarized hyperspectral imaging microscope (PHSIM). The
hyperspectral imaging (HSI) component is based on the snapscan with a hyperspectral camera. The HSI wavelength range
is from 467-700 nm. Polarized light imaging is realized by the integration of two polarizers and two liquid crystal variable
retarders (LCVR), which is capable of full Stokes polarimetric imaging. The new imaging device was tested for the
detection of squamous cell carcinoma (SCC) in H&E stained oral tissue slides of 8 patients. One normal area and one
cancerous area on each slide are selected to make the comparison. The preliminary results indicated that the spectral curves
of the Stokes vector parameters (S0, S1, S2, S3) of the normal area on the H&E stained oral tissue slides are different from
those of SCC in certain wavelength range. Further work is required to apply the new polarized hyperspectral imaging
microscope to a large number of patient samples and to test the PHSIM system in different cancer types.
Keywords: Hyperspectral imaging, polarized light imaging, Stokes vector, head and neck cancer, machine learning.
1. INTRODUCTION
Polarization imaging is an effective optical imaging technique to explore the structure and morphology of biological tissues
through obtaining their polarization characteristics. It can acquire two-dimensional space polarization information of the
tissue, which reflects various physical properties of the tissue, including surface texture, surface roughness, and surface
morphology information [1, 2, 3, 4, 5]. Hyperspectral imaging, an optical imaging method, which originally was used in
remote sensing, recently has been extended to the application in several other promising fields, including biomedical
applications [6]. Hyperspectral imaging acquires the spectrum on the pixels of 2D images, then construct the 3D data cube,
where rich spatial and spectral information can be obtained. Polarized hyperspectral imaging is a combination of
polarization measurement, hyperspectral analysis, and space imaging technology, which can obtain the polarization,
spectral and image information of the object simultaneously [7, 8, 9]. Our group has developed several algorithms for the
head and neck cancer detection based on hyperspectral imaging methods, which include principle component analysis
(PCA) [10], tensor-based computation and modeling [11], the incorporation of SVM into a minimum spanning forest [12,
13], non-negative matrix factorization (NMF) [14], the combination of super pixels, PCA, and SVM [15], and
convolutional neural networks (CNN) [16, 17, 18]. Although polarized light imaging methods have also been adopted in
head and neck cancer detection [19, 20, 21, 22, 23], polarized hyperspectral imaging has not been reported for cancer
applications.
With the development of information processing technology, a single optical characteristic acquisition method has been
unable to satisfy the needs in biomedical imaging for diseases diagnosis. Therefore, the traditional optical imaging methods
are constantly improved, so that more information of the tissue can be obtained. This study aims at developing a novel
dual-modality microscope, combining polarized light imaging and hyperspectral imaging techniques, for head and neck
cancer detection.
Imaging, Therapeutics, and Advanced Technology in Head and Neck Surgery and Otolaryngology 2020, edited by Brian J. F. Wong, Justus F. Ilgner, Proc. of SPIE Vol. 11213, 1121308 · © 2020 SPIE
CCC code: 1605-7422/20/$21 · doi: 10.1117/12.2549676
Proc. of SPIE Vol. 11213 1121308-1Downloaded From: https://www.spiedigitallibrary.org/conference-proceedings-of-spie on 07 May 2020Terms of Use: https://www.spiedigitallibrary.org/terms-of-use
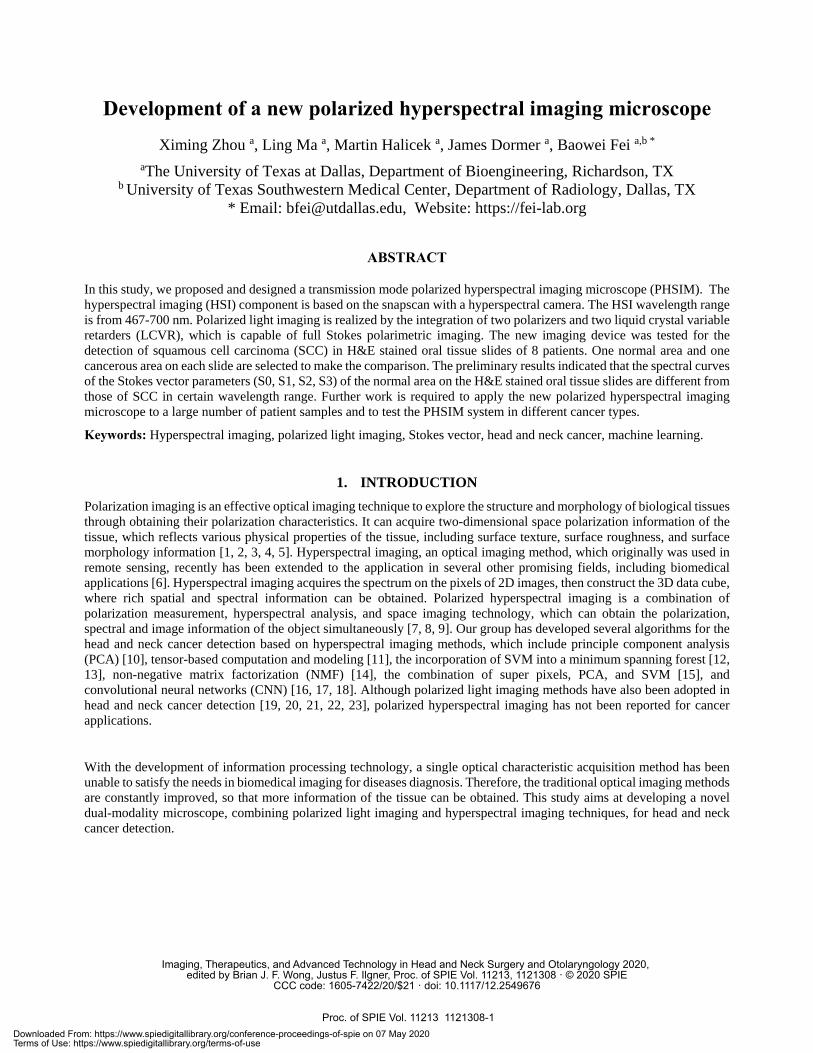
The home-made polarized hyperspectral microscopy operates in the visible spectral bands and was developed for
histopathologic analysis (Figure 1). Acquisition of hypercube is realized by a snapscan method. In the snapscan acquisition
method, the CCD detectors in the camera move while the sample stays still. Polarimetric imaging is realized by the two
polarizers and two liquid crystal variable retarders (LCVR). The system is capable of full Stokes polarimetric imaging,
which produces all four components of the Stokes vector. Thus, the system can completely define the transmitted light
regarding the intensity and polarization properties.
Fig 1. The setup of the polarized hyperspectral microscope.
2.2 Data acquisition and processing
Polarized light imaging is realized by the two polarizers and two LCVRs. The system is capable of full Stokes polarimetric
imaging, which produces all four components of the Stokes vector. Thus, the system can completely define the reflectance
regarding the intensity and polarization properties. The way to calculate the four elements of Stokes vector (S0, S1, S2,
S3) is expressed in the following equation:
𝑆0 = 𝐼ℎ + 𝐼𝑣
𝑆1 = 𝐼ℎ − 𝐼𝑣
𝑆2 = 𝐼ℎ + 𝐼𝑣 − 𝐼+45 (1)
𝑆3 = 𝐼𝑙𝑐 + 𝐼𝑟𝑐
where 𝐼ℎ represent the light intensity measured with a horizontal linear analyzer, in which the retardations of LCVR 1 and
LCVR 2 are both set at 0 rad. 𝐼𝑣 represents the light intensity measured with a vertical linear analyzer, in which LCVR 1
is set at 0 rad retardation and LCVR 2 is set at π rad retardation. 𝐼+45 represents the light intensity measured with a +45
degrees oriented linear analyzer, in which LCVR 1 and LCVR 2 are both set at π/2 rad retardation. 𝐼𝑙𝑐 represents the light
intensity measured with left circular analyzer, in which LCVR 1 is set at 0 rad retardation and LCVR 2 is set at π/2 rad
retardation. 𝐼𝑟𝑐 represents the light intensity measured with right circular analyzer, in which LCVR 1 is set at π rad
retardation and LCVR 2 is set at π/2 rad retardation.
2. METHODS
2.1 System setup
Proc. of SPIE Vol. 11213 1121308-2Downloaded From: https://www.spiedigitallibrary.org/conference-proceedings-of-spie on 07 May 2020Terms of Use: https://www.spiedigitallibrary.org/terms-of-use
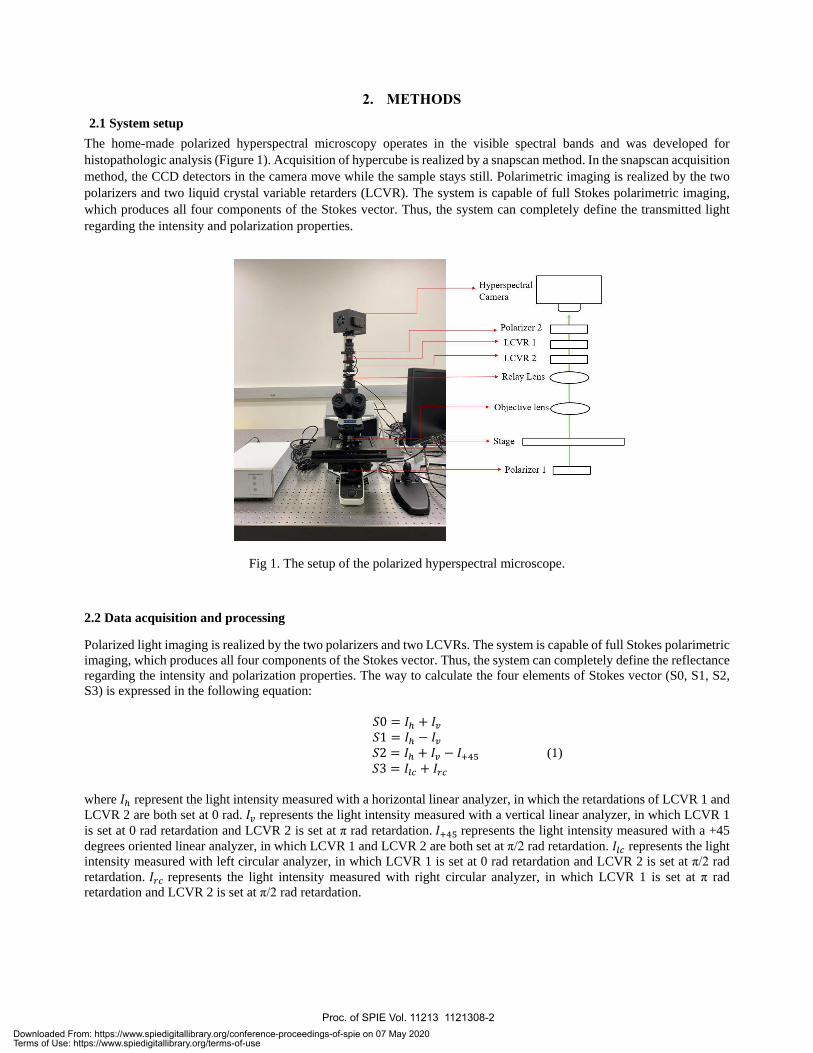
Hyperspectral imaging works simultaneously with polarized light imaging which is realized by snapscan, and the structure
of the acquired polarized hyperspectral data cube is shown in Figure 2.
Fig 2. Diagram of full-polarization hyperspectral imaging data cube.
2.3 Experimental Design
Before collecting the full-polarization hyperspectral imaging data cube of the tissue slides, validation of the imaging
system is a necessary step. We took a quarter wave plate and validated our polarized hyperspectral imaging microscope
according to the method proposed in [25]. In the validation experiment, we rotated the quarter wave plate from 0 to 180
degrees at 10 degrees increment, and acquired one polarized hyperspectral data cube under each orientation. As is
described in [24], fresh surgical tissue samples were obtained from patients who underwent surgical resection of head and
neck cancer. Of each patient, a sample of the tumor, a normal tissue sample, and a sample at the tumor-normal interface
were collected. There are totally 192 tissue specimens obtained from 84 patients. Fresh ex-vivo tissues are fixed, paraffin
embedded, sectioned, stained with haemotoxylin and eosin (H&E), and digitized using whole-slide scanning. A board-
certified pathologist with expertise in H&N pathology outlined the cancer margin on the digital slides using Aperio
ImageScope (Leica Biosystems Inc, Buffalo Grove, IL, USA).
We chose 8 slides from 8 patients in this preliminary experiment, in which one normal area and one cancerous area are
selected on each slide to be imaged under the polarized hyperspectral imaging microscope. The spectral curves of the
Stokes vector parameters (S0, S1, S2, S3) are extracted from the images of normal and cancerous areas to make the
comparison.
3. RESULTS
In order to validate the polarized hyperspectral imaging microscope, we measured the Stokes vector of a quarter wave
plate (Thorlabs, AQWP05M-600), and compared our results to the standard result in [25]. As shown in Figure 3, the results
demonstrated that the polarized hyperspectral imaging microscope is capable for measuring the Stokes vector of sample
under different wavelengths.
Proc. of SPIE Vol. 11213 1121308-3Downloaded From: https://www.spiedigitallibrary.org/conference-proceedings-of-spie on 07 May 2020Terms of Use: https://www.spiedigitallibrary.org/terms-of-use
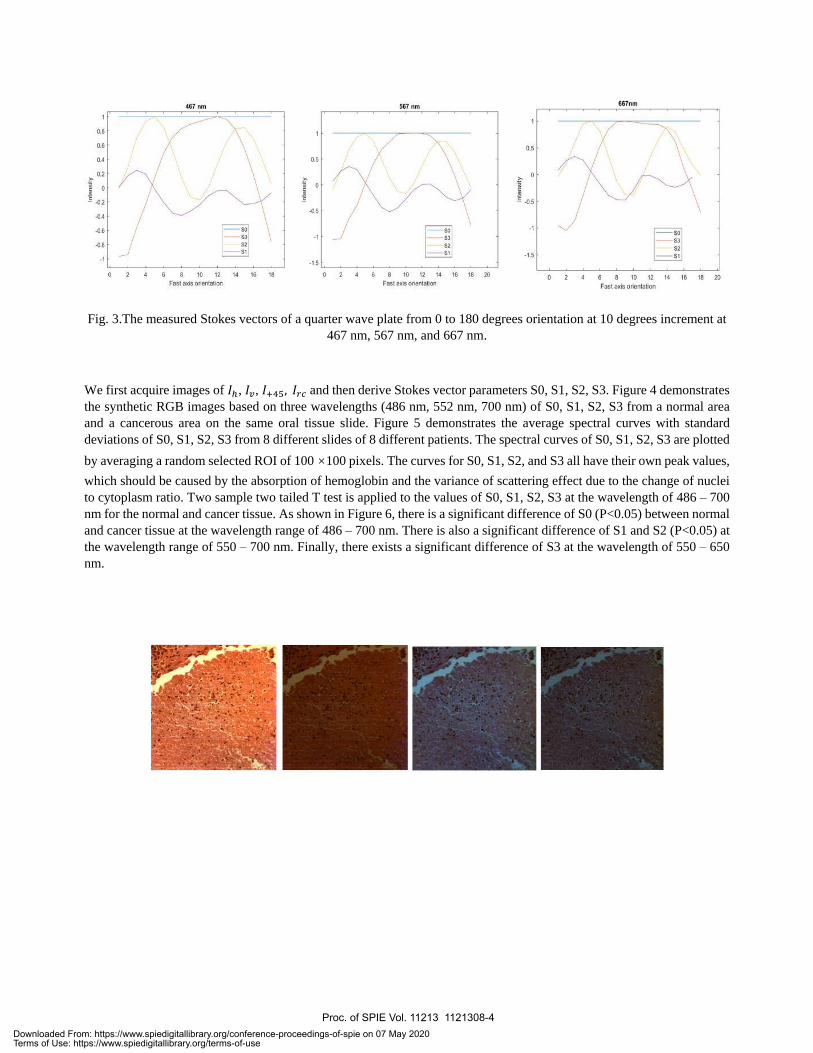
Fig. 3.The measured Stokes vectors of a quarter wave plate from 0 to 180 degrees orientation at 10 degrees increment at
467 nm, 567 nm, and 667 nm.
We first acquire images of 𝐼ℎ, 𝐼𝑣, 𝐼+45, 𝐼𝑟𝑐 and then derive Stokes vector parameters S0, S1, S2, S3. Figure 4 demonstrates
the synthetic RGB images based on three wavelengths (486 nm, 552 nm, 700 nm) of S0, S1, S2, S3 from a normal area
and a cancerous area on the same oral tissue slide. Figure 5 demonstrates the average spectral curves with standard
deviations of S0, S1, S2, S3 from 8 different slides of 8 different patients. The spectral curves of S0, S1, S2, S3 are plotted
by averaging a random selected ROI of 100 ×100 pixels. The curves for S0, S1, S2, and S3 all have their own peak values,
which should be caused by the absorption of hemoglobin and the variance of scattering effect due to the change of nuclei
to cytoplasm ratio. Two sample two tailed T test is applied to the values of S0, S1, S2, S3 at the wavelength of 486 – 700
nm for the normal and cancer tissue. As shown in Figure 6, there is a significant difference of S0 (P<0.05) between normal
and cancer tissue at the wavelength range of 486 – 700 nm. There is also a significant difference of S1 and S2 (P<0.05) at
the wavelength range of 550 – 700 nm. Finally, there exists a significant difference of S3 at the wavelength of 550 – 650
nm.
Proc. of SPIE Vol. 11213 1121308-4Downloaded From: https://www.spiedigitallibrary.org/conference-proceedings-of-spie on 07 May 2020Terms of Use: https://www.spiedigitallibrary.org/terms-of-use
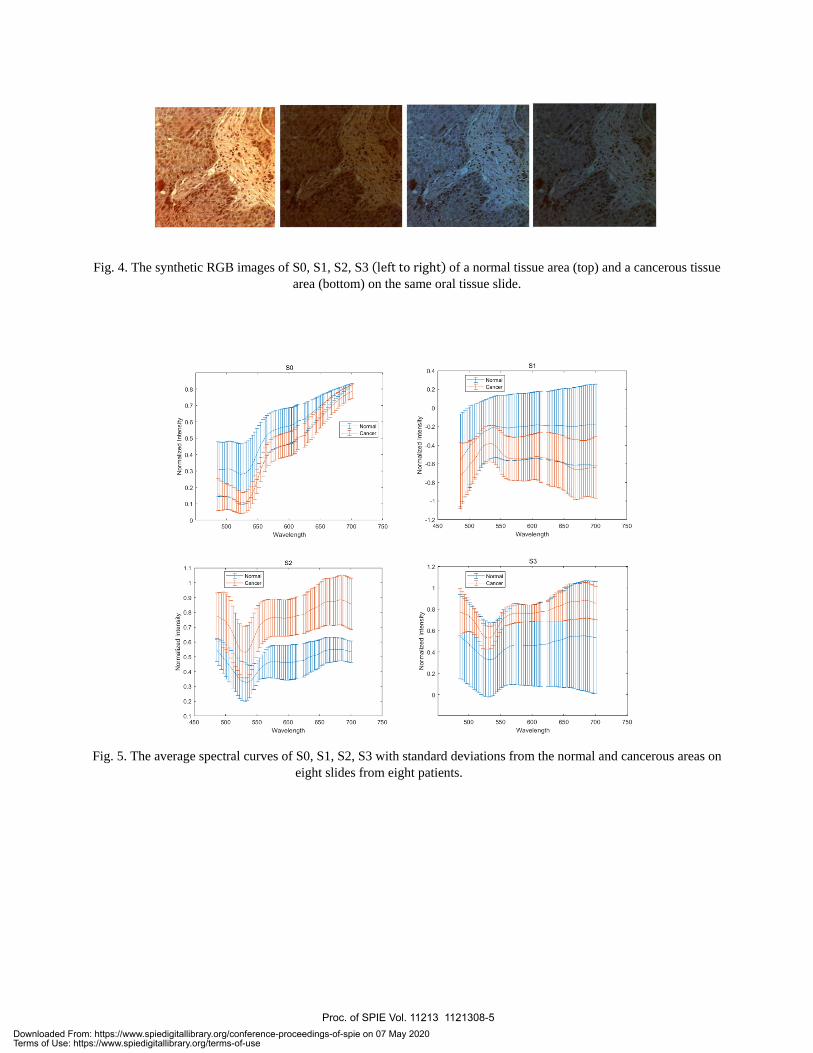
Fig. 4. The synthetic RGB images of S0, S1, S2, S3 (left to right) of a normal tissue area (top) and a cancerous tissue
area (bottom) on the same oral tissue slide.
Fig. 5. The average spectral curves of S0, S1, S2, S3 with standard deviations from the normal and cancerous areas on
eight slides from eight patients.
Proc. of SPIE Vol. 11213 1121308-5Downloaded From: https://www.spiedigitallibrary.org/conference-proceedings-of-spie on 07 May 2020Terms of Use: https://www.spiedigitallibrary.org/terms-of-use
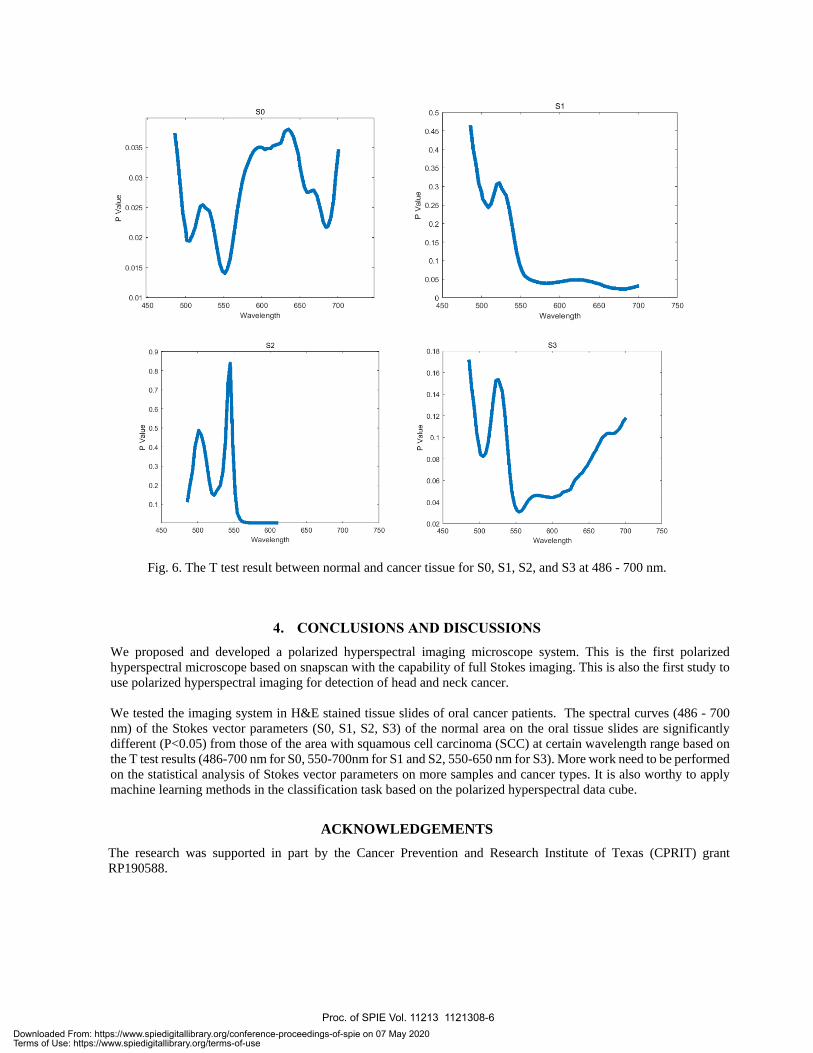
Fig. 6. The T test result between normal and cancer tissue for S0, S1, S2, and S3 at 486 - 700 nm.
4. CONCLUSIONS AND DISCUSSIONS
We proposed and developed a polarized hyperspectral imaging microscope system. This is the first polarized
hyperspectral microscope based on snapscan with the capability of full Stokes imaging. This is also the first study to
use polarized hyperspectral imaging for detection of head and neck cancer.
We tested the imaging system in H&E stained tissue slides of oral cancer patients. The spectral curves (486 - 700
nm) of the Stokes vector parameters (S0, S1, S2, S3) of the normal area on the oral tissue slides are significantly
different (P<0.05) from those of the area with squamous cell carcinoma (SCC) at certain wavelength range based on
the T test results (486-700 nm for S0, 550-700nm for S1 and S2, 550-650 nm for S3). More work need to be performed
on the statistical analysis of Stokes vector parameters on more samples and cancer types. It is also worthy to apply
machine learning methods in the classification task based on the polarized hyperspectral data cube.
ACKNOWLEDGEMENTS
The research was supported in part by the Cancer Prevention and Research Institute of Texas (CPRIT) grant
RP190588.
Proc. of SPIE Vol. 11213 1121308-6Downloaded From: https://www.spiedigitallibrary.org/conference-proceedings-of-spie on 07 May 2020Terms of Use: https://www.spiedigitallibrary.org/terms-of-use

REFERENCES
1. Anderson, R. Rox. "Polarized light examination and photography of the skin." Archives of dermatology 127.7 (1991):
1000-1005.
2. Pierangelo, Angelo, et al. "Polarimetric imaging of uterine cervix: a case study." Optics Express 21.12(2013): 14120.
3. Raković MJ, et al. "Light backscattering polarization patterns from turbid media: theory and experiment." Applied
Optics 38.15(1999):3399.
4. Liu, Bin, et al. "Mueller polarimetric imaging for characterizing the collagen microstructures of breast cancer tissues
in different genotypes." Optics Communications 433(2019):60-67.
5. Chang, Jintao, et al. "Division of focal plane polarimeter-based 3 × 4 Mueller matrix microscope: a potential tool for
quick diagnosis of human carcinoma tissues." Journal of Biomedical Optics 21.5(2016): 056002.
6. Lu, Guolan, and B. Fei. "Medical hyperspectral imaging: a review." Journal of Biomedical Optics 19.1(2014): 010901.
7. Dong, Yang, et al. "Quantitatively differentiating microstructural variations of skeletal muscle tissues by multispectral
Mueller matrix imaging." Optics in Health Care and Biomedical Optics VII. Vol. 10024. International Society for
Optics and Photonics, 2016.
8. Vasefi, Fartash, et al. "Polarization-sensitive hyperspectral imaging in vivo: a multimode dermoscope for skin
analysis." Scientific reports 4(2014): 4924.
9. Wang, Zi, et al. "Polarization-resolved hyperspectral stimulated Raman scattering microscopy for label-free
biomolecular imaging of the tooth." Applied Physics Letters 108.3(2016): 033701.
10. Lu, Guolan, et al. "Hyperspectral imaging for cancer surgical margin delineation: registration of hyperspectral and
histological images." Medical Imaging 2014: Image-Guided Procedures, Robotic Interventions, and Modeling. Vol.
9036. International Society for Optics and Photonics, 2014.
11. Lu, Guolan, et al. "Spectral-spatial classification using tensor modeling for cancer detection with hyperspectral
imaging." Medical Imaging 2014: Image Processing. Vol. 9034. International Society for Optics and Photonics, 2014.
12. Pike, Robert, et al. "A minimum spanning forest based hyperspectral image classification method for cancerous tissue
detection." Medical Imaging 2014: Image Processing. Vol. 9034. International Society for Optics and Photonics,
2014.
13. Pike, Robert, et al. "A minimum spanning forest-based method for noninvasive cancer detection with hyperspectral
imaging." IEEE Transactions on Biomedical Engineering 63.3 (2015): 653-663.
14. Lu, Guolan, et al. "Estimation of tissue optical parameters with hyperspectral imaging and spectral unmixing."
Medical Imaging 2015: Biomedical Applications in Molecular, Structural, and Functional Imaging. Vol. 9417.
International Society for Optics and Photonics, 2015.
15. Chung, Hyunkoo, et al. "Superpixel-based spectral classification for the detection of head and neck cancer with
hyperspectral imaging." Medical Imaging 2016: Biomedical Applications in Molecular, Structural, and Functional
Imaging. Vol. 9788. International Society for Optics and Photonics, 2016.
16. Halicek, Martin, et al. "Tumor margin classification of head and neck cancer using hyperspectral imaging and
convolutional neural networks." Medical Imaging 2018: Image-Guided Procedures, Robotic Interventions, and
Modeling. Vol. 10576. International Society for Optics and Photonics, 2018.
17. Halicek, Martin, et al. "Deep convolutional neural networks for classifying head and neck cancer using hyperspectral
imaging." Journal of biomedical optics 22.6 (2017): 060503.
18. Halicek, Martin, et al. "Optical biopsy of head and neck cancer using hyperspectral imaging and convolutional neural
networks." Journal of biomedical optics 24.3 (2019): 036007.
19. Lindeboom, Jerome A., K. R. Mathura, and C. Ince. "Orthogonal polarization spectral (OPS) imaging and
topographical characteristics of oral squamous cell carcinoma." Oral Oncology 42.6(2006): 581-585.
20. Pahernik, S, et al. "Orthogonal polarisation spectral imaging as a new tool for the assessment of antivascular tumour
treatment in vivo: a validation study." British Journal of Cancer 86.10(2002): 1622-1627.
21. Roblyer, Darren, et al. "Multispectral optical imaging device for in vivo detection of oral neoplasia." Journal of
Biomedical Optics 13.2(2008): 024019.
22. Manhas, Sandeep, et al. "Polarized diffuse reflectance measurements on cancerous and noncancerous tissues." Journal
of Biophotonics 2.10(2009): 581-587.
23. Jungrae, Chung, et al. "Use of polar decomposition for the diagnosis of oral precancer." Appl Opt 46.15(2007): 3038-
3045.
Proc. of SPIE Vol. 11213 1121308-7Downloaded From: https://www.spiedigitallibrary.org/conference-proceedings-of-spie on 07 May 2020Terms of Use: https://www.spiedigitallibrary.org/terms-of-use

24. Lu, Guolan, et al. "Detection of head and neck cancer in surgical specimens using quantitative hyperspectral imaging."
Clinical Cancer Research 23.18 (2017): 5426-5436.
25. González, Iván Montes, and Neil C. Bruce. "Design and calibration for a Full-Stokes imaging polarimeter."
Unconventional Optical Imaging. Vol. 10677. International Society for Optics and Photonics, 2018.
Proc. of SPIE Vol. 11213 1121308-8Downloaded From: https://www.spiedigitallibrary.org/conference-proceedings-of-spie on 07 May 2020Terms of Use: https://www.spiedigitallibrary.org/terms-of-use