Embed Size (px)
Citation preview

SURF0040-Simpson 1
DEVELOPMENT OF A PAVEMENT CONDITION ASSESMENT METHOD FOR THE INTERSTATE HIGHWAY SYSTEM
A. Simpson, J. Groeger & G. Rada
AMEC Environment & Infrastructure, Inc., USA [email protected], [email protected], [email protected]
J. Guerre Cambridge Systematics, Inc., USA
ABSTRACT As part of a project conducted by the United States Department of Transportation (US DOT) Federal Highway Administration (FHWA), methods are being developed to assess infrastructure condition and health with a focus on pavements on the Interstate Highway System. The project scope includes development of prototype tools to provide FHWA and State DOTs ready access to key information on pavement and bridge performance based on these methods for assessing condition and health. These tools are designed to allow a better and more complete view of infrastructure health nationally and form the foundation for a performance management system for the US highway system. In support of this goal, a pilot study was conducted on a three-state corridor to investigate and compare methods for assessing pavement condition and, subsequently, health. As part of the pilot, three sets of data were compiled, processed, and compared: National (Highway Performance Monitoring System), State (primarily State Pavement Management System data and supporting information), and field data collection using an automated multi-function vehicle. This paper explores the results on the approach for categorizing pavement condition as Good/Fair/Poor. A summary of the findings are presented along with recommendations for future activities necessary to develop a pavement condition performance indicator.
1. INTRODUCTION
Over the past several years, punctuated by isolated and sometimes catastrophic infrastructure failures (such as the collapse of the I-35W bridge in Minneapolis, Minnesota), and national reports on the poor condition of U.S. infrastructure in general, recognition of the importance of preserving the existing transportation infrastructure is at an all time high. A fundamental element of the performance of a transportation system is the physical condition of the assets that comprise it. Consequently, the preservation of existing assets will be a critical element of reauthorization and will require the identification of performance measures and targets designed to capture/communicate the physical condition of highway assets, including pavement and bridges. Although States and FHWA collect and track a variety of measures of pavement and bridge condition today, the degree of coverage, consistency of measures, and method and frequency of data collection varies. Furthermore, there is debate regarding which, if any, of the existing measures best capture the condition of these assets. Finally, there is the question of whether and how one or more measures of an asset’s physical condition might be considered, combined, and possibly supplemented with additional information to

SURF0040-Simpson 2
provide a more comprehensive assessment of an asset’s overall health. The point is that although a single measure of an asset’s physical condition is related to the asset’s overall physical health, it is unlikely to be sufficient to make a comprehensive assessment of the asset’s overall physical health. The primary objective of this project was to define a consistent and reliable method of assessing infrastructure health with a focus on pavements and bridges on the Interstate Highway System and to develop tools to provide FHWA and State DOTs ready access to key information that will allow for a better and more complete view of infrastructure health nationally. In addition, this project evaluated how asset condition and performance data can be used for corridor and system management and to facilitate analysis of condition and performance measures and system health for a multi-state Interstate corridor. This project, in combination with other FHWA, AASHTO and NCHRP efforts already underway, will help to develop improved methodologies for highway asset condition and performance measurement within a broader, performance-based Federal surface transportation program. As part of the broader study, this paper presents the specific process and findings related to establishing condition through pavement surface characteristics including roughness, cracking, rutting, and faulting. A pilot study was conducted to obtain National, State, and field data in an effort to determine the feasibility of using each data set as part of National performance measures. Some of the questions asked during this study were as follow:
How difficult is it to obtain each data set? Is the data all from the same time period (temporal consistency)? How consistent/complete is data collection between States? Is all data of similar quality (quality = fit for intended purpose)? How do various data sets compare? How much effort is it to gather and collect required information? Which data set has potential for use in National condition metric? What are the necessary improvements to data or tools needed for a National
condition measure? What would a condition metric look like? Does the condition metric reflect field conditions?
This paper describes the data collection activities conducted as well as a comparison of ride, cracking, rutting, and faulting data for various data sources. From this evaluation, a series of conclusions related to each condition measure are offered. The information presented in this paper is part of an ongoing project and enhanced observations and conclusions may become apparent in the future.
2. PILOT STUDY DATA COLLECTION
The objective of the pilot study was to test options for categorizing pavements as good/fair/poor and the recommended approach for assessing overall health. This section summarizes the process for selecting the pilot corridor, and describes the process used to compile data on it.
2.1. Pilot corridor selection
The first step in the pilot study process was to identify a 3-State pilot corridor. The corridor was selected based on a consideration a number of criteria, including the following:

SURF0040-Simpson 3
Do not consider I-95. The FHWA has conducted previous data pilots on the I-95
corridor. Adjacency. Ideally, the three states would be adjacent. However, this was not
mandatory. Data compilation expediency. To ensure adherence to the overall project
schedule, a major consideration was the extent to which data were readily available.
The potential good/fair/poor approaches for pavements rely on HPMS 2010+ data. Therefore, the pilot States should have already submitted HPMS 2010+ files to FHWA. In addition, to minimize data compilation requirements, the pilot selection focused on corridors solely owned and operated by DOTs, as opposed to a combination of DOTs and toll authorities. The I-90 corridor through Wisconsin, Minnesota, and South Dakota was selected because HPMS 2010+ data is available in all three States, and because no portion of it is operated by a tolling agency and pavement management system data was likely to be easily available. Figure 1 illustrates the pilot corridor in more detail.
Figure 1 – Location of corridor used in pilot study.
I-90 runs from Seattle to Boston. The pilot corridor portion of I-90 runs through South Dakota, Minnesota, and Wisconsin for a total of 1410 km (876 miles). I-90 has Average Annual Daily Traffic (AADT) in a broad range from about 5,000 to 90,000 vehicles per day. The pilot corridor carries about 24.8 million vehicles km (15.4 million vehicle miles) in an average day on close to 6,300 lane-km (3,900 lane-miles). Much of the corridor is rural (about 85 percent) but it links the urban areas of Rapid City, Souix Falls, Rochester, Winona, La Crosse, Madison, and Janesville among others. The pilot corridor is untolled and primarily surrounded by farmland and other rural land uses outside of the urban areas.

SURF0040-Simpson 4
2.2. Data collection
2.2.1 National
Data were collected from the Highway Performance Monitoring System (HPMS) in 2010+ format. These data included roughness, rutting, faulting, percent cracking, and length of cracking as performance indicators of the in-place pavement sections. Roughness data are presented in the terms of the International Roughness Index (IRI). The IRI is collected at varying intervals for the full extent of the Interstate. The other performance data (rutting, faulting, percent cracking, and crack length) are collected on a sample panel. Rutting is collected in the form of the average depth of rutting in each wheelpath. Faulting is the average vertical displacement between adjacent concrete slabs. The percent cracking is the percentage of wheelpaths that are cracked in asphalt-surfaced pavements or the percentage of slabs with cracking on concrete pavements. The cracking length is only collected on asphalt-surfaced pavements and represents the length per mile of transverse cracking. The data are presented at varying intervals along the corridor. These intervals range in length from 0.002 km (0.001 miles) to over 15 km (10 miles). The data obtained from the HPMS represented data collected in 2009 for both Minnesota and Wisconsin. The data from South Dakota were collected in 2010.
2.2.2 State data
A variety of data were requested from the State highway agencies. These data included documentation, inventory and pavement management data. The documentation requested included procedures, standards, and information on performance measures used in evaluating the pavement structure. The documentation was important in understanding what data were collected for pavement management. Inventory data on the corridor included basic descriptive information including items such as number of lanes; presence, type, and width of shoulders; year of last construction and/or resurfacing; linear referencing system; right of way images; and traffic data. Pavement management data were requested for both directions of travel along the corridor. These data were requested to include the pavement structure, performance data used by the State pavement management system, and any available construction cost data. Network-level falling weight deflectometer (FWD) data were requested from each State although none were able to provide either the FWD or cost data for their route.
2.2.3 Field data collection
Pavement condition data were collected during the summer of 2011 along the route using an automated multi-function data collection vehicle similar to that shown in figure 2. These data included right-of-way images, roughness, rutting, faulting, and cracking in accordance with HPMS 2010+ standards. Data were collected in the eastbound direction and summarized at 0.2-km (0.1-mile) intervals. The project team used the images of the pavement surface and the right-of-way to estimate the Pavement Condition Index (PCI) for 240 km (150 miles) of the corridor.

SURF0040-Simpson 5
Figure 2 – Multi-function pavement data collection vehicle.
2.2.4 Summary of key data issues
The following observations may be made from a review of the data collection process:
Temporal issues were identified within the data from HPMS. The data for South Dakota were collected in 2010 and the data for Wisconsin and Minnesota were collected in 2009. Obtaining data within the November/December time-frame may provide the most consistent data set (all data from the same year) for review based on the standard HPMS calendar.
HPMS data were summarized to fairly coarse intervals with some as large as 16 km (10 miles). This level of aggregation will mask some of the peaks and valleys in the performance data making it difficult to identify areas in good and poor condition.
When requesting data from the States, it is important to identify the appropriate person to whom the request should be addressed.
The data requested for this pilot study involved obtaining data from multiple departments within the Department of Transportation.
When data collection is performed, it is important to identify the appropriate standard and quality control standards that will be used.
3. EVALUATION OF RIDE DATA
Roughness data were obtained from all three data sources – HPMS, State, and field. In order to complete a comparison of the data, it was necessary to aggregate them to the same level. Both the State pavement management and field collected data sets were aggregated to the level of HPMS. Figures 3 and 4 illustrate the comparisons of the data for the asphalt and Portland cement concrete (PCC) surfaced pavements, respectively.

Figure 3 - Comparison of HPMS, State, and field IRI on asphalt surfaced pavement.
Figure 4 - Comparison of HPMS, State and field IRI on PCC surfaced pavements.
1 m/km = 63.36 in/mile
1 m/km = 63.36 in/mile
SURF0040-Simpson 7
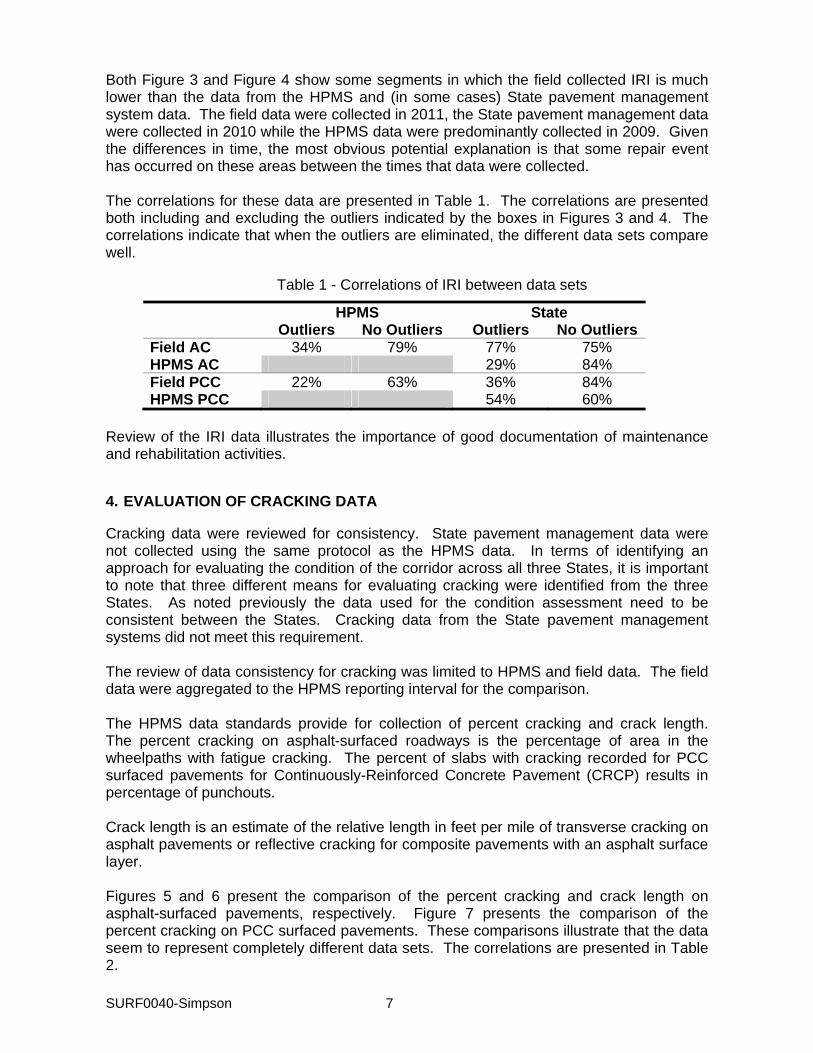
Both Figure 3 and Figure 4 show some segments in which the field collected IRI is much lower than the data from the HPMS and (in some cases) State pavement management system data. The field data were collected in 2011, the State pavement management data were collected in 2010 while the HPMS data were predominantly collected in 2009. Given the differences in time, the most obvious potential explanation is that some repair event has occurred on these areas between the times that data were collected. The correlations for these data are presented in Table 1. The correlations are presented both including and excluding the outliers indicated by the boxes in Figures 3 and 4. The correlations indicate that when the outliers are eliminated, the different data sets compare well.
Table 1 - Correlations of IRI between data sets
HPMS State Outliers No Outliers Outliers No Outliers
Field AC 34% 79% 77% 75% HPMS AC 29% 84% Field PCC 22% 63% 36% 84% HPMS PCC 54% 60%
Review of the IRI data illustrates the importance of good documentation of maintenance and rehabilitation activities.
4. EVALUATION OF CRACKING DATA
Cracking data were reviewed for consistency. State pavement management data were not collected using the same protocol as the HPMS data. In terms of identifying an approach for evaluating the condition of the corridor across all three States, it is important to note that three different means for evaluating cracking were identified from the three States. As noted previously the data used for the condition assessment need to be consistent between the States. Cracking data from the State pavement management systems did not meet this requirement. The review of data consistency for cracking was limited to HPMS and field data. The field data were aggregated to the HPMS reporting interval for the comparison. The HPMS data standards provide for collection of percent cracking and crack length. The percent cracking on asphalt-surfaced roadways is the percentage of area in the wheelpaths with fatigue cracking. The percent of slabs with cracking recorded for PCC surfaced pavements for Continuously-Reinforced Concrete Pavement (CRCP) results in percentage of punchouts. Crack length is an estimate of the relative length in feet per mile of transverse cracking on asphalt pavements or reflective cracking for composite pavements with an asphalt surface layer. Figures 5 and 6 present the comparison of the percent cracking and crack length on asphalt-surfaced pavements, respectively. Figure 7 presents the comparison of the percent cracking on PCC surfaced pavements. These comparisons illustrate that the data seem to represent completely different data sets. The correlations are presented in Table 2.

Figure 5 - Comparison of percent cracking on asphalt-surfaced pavements.
Figure 6 - Comparison of cracking length on asphalt-surfaced pavements.
1 m/km = 5.28 ft/mile

SURF0040-Simpson 9
Figure 7. Comparison of percent cracking on PCC surfaced pavements.
Table 2 - Correlation between HPMS and field cracking data.
Data Set Correlation between HPMS and
Field
Asphalt surface, percent cracking 6%
Asphalt surface, crack length 27%
PCC Surface, percent cracking 64%
When considering the differences in the data sets, it is important to recognize some of the key differences. First, the HPMS data were collected in 2009 while the field data were collected in 2011. The second is that the data were collected by two different vendors. Changes in data collection personnel will always increase the amount of variability in the data collected. Third, the HPMS data are collected on a sample while the field data were collected continuously along the corridor. Finally, it should be noted that other research (LTPP Distress Variability Study) has shown crack detection to be highly variable. Cracking will require further investigation to develop a more standardized approach to data collection before it is useful as an indicator of performance.
5. EVALUATION OF RUTTING DATA
Rutting information was obtained from all three data sources - HPMS, State and field. As was done with the roughness and cracking data, the data were all aggregated to the same interval as used in the HPMS data set.

Figure 8 presents a comparison of the rutting data from the HPMS, field and State data sets. As was observed with the IRI data, there are some segments for which the rut depth obtained from the field data are much lower than the rut depths obtained from the HPMS data. These outliers are from the same areas that were observed in the asphalt surfaced areas from the IRI analysis. The correlations for the rutting data are fairly high as presented in Table 3. The correlations illustrate that the data compare well.
Figure 8 - Comparison of rutting data from HPMS, State, and field data.
Table 8 – Rutting correlations.
HPMS Rut State Rut
Outliers No Outliers Outliers No Outliers
Field Rut 58% 86% 87% 87%
HPMS Rut 57% 92%
The rutting data compare well between the three data sets; however, it may be observed from Figure 8 that there is an offset between the field data and the HPMS and State pavement management data. This offset is an indication that there may be some change in the methodology of data collection or analysis between the field data and the HPMS and State data.
1 mm = 0.039 in.

6. EVALUATION OF FAULTING DATA
Faulting data were provided with the HPMS and field data. The State pavement management faulting data were not collected to the same standard as the HPMS data. Figure 9 illustrates the comparison between the HPMS and field collected faulting data.
Figure 9 - Comparison of HPMS and field collected faulting. The correlation coefficient between these data sets was 10 percent indicating a poor correlation which is readily observable from Figure 9. The temporal issues may describe some of the variability observed with these data. Further, faulting is also diurnal with changes occurring throughout the day. The specific date of data collection is not known with respect to the HPMS or State pavement management data. The time of data collection is definitely not known; therefore, identifying the impact of the diurnal changes on these data is not possible. Regardless of the cause of the differences observed, faulting is not a good candidate for condition assessment without improvements (standardization) in data collection methodology and/or data analysis mechanisms.
7. CONCLUSIONS AND RECOMENDATIONS
Through conduct of the study, several conclusions and recommendations were offered. These include:
HPMS data summary lengths should be investigated and set to a fixed length.
1 mm = 0.039 in

SURF0040-Simpson 12
Data collection frequency and processing time are issues resulting in data that is 1.5 years old being used to evaluate condition
HPMS cracking/faulting is not feasible for use as it currently stands. Gathering data from States could be made efficient, but would need to
standardize State data. Due to the wide variety of data collection and processing procedures cracking
data from States is not a feasible option for nationwide G/F/P condition metrics. Using State PMS data on a national scale could create serious temporal issues
due to the variety of data collection frequencies and system coverage. Having a good handle on the maintenance and rehabilitation activities might help
with temporal analysis of pavement condition data. The rut algorithm used to generate HPMS data should be codified so as to
promote consistency in application. HPMS cracking data collection should be better defined and a manual for
implementation prepared along with quality control / quality assurance (QC/QA) standards.
IRI is currently most feasible for use as a primary pavement good/fair/poor condition indicator.
Rutting could be used as a flag pavement Good/Fair/Poor indicator. Significant work is needed before cracking or faulting could be used as a National
good/fair/poor indicator.
Overall, it is concluded that, for the foreseeable future, IRI will be the most likely candidate for use as a National pavement condition indicator. The study team also recommends using rutting data as a flag for pavement condition measurement to indicate sections with good, fair, and poor rutting. It seems plausible that this data can be extracted from the HPMS 2010+ data submission. Using State PMS data as an input to establish a National condition metric does not seem feasible due to significant differences between State DOTs with respect to data collection equipment, procedures, analysis, and system coverage. Finally, performing nationwide field data collection on the Interstate system, while an option, does not seem feasible at this point in time.
Lastly, significant work is still required – specifically for cracking and faulting – in order to generate a National pavement condition index that incorporates more than ride. Some of the issues brought to light by this study have already entered a research and implementation phase. These efforts will require significant stakeholder discussion and consensus in order to implement standards, procedures, and analysis protocols in order to create a condition indicator that is robust, repeatable, and accepted in the industry.