Embed Size (px)
Citation preview

DEVELOPMENT OF A SOFTWARE FOR AUTOMATIC DESIGNNING OF PRESSURIZED IRRIGATION SYSTEMS
DÉVELOPPEMENT D'UN LOGICIEL POUR DESIGNNING AUTOMATIQUE DE SOUS PRESSION DES SYSTÈMES
D'IRRIGATION
Sa'eed Ojaghloo Shahabi1, Majid Vazifedoust2
ABSTRACT Agricultural water use in Iran is now faced with two major problems: lack of fresh water and low efficiency. In the agricultural sector, development of pressurized irrigation systems can be an appropriate policy in coping with these problems. With growing water scarcity, a large portion of Engineering - Technical development in the coming years will be assigned to the designing of pressurized irrigation systems. Development of under pressurized irrigation requires the development of various engineering tools. However, what is remarkable is role models and software engineering in speed of data analysis, design capability and minimizing human errors in calculation. This paper reflects the technical characteristics and capabilities of a developed model (FARMWAT) by irrigation students of Guilan University. The model automatically design pressurized irrigation systems with high efficiency. The programming language of model is written under windows Visual Basic 6.0. The model has capability of drawing the layout of irrigation system, receiving the required data in the design, receiving the land topography, data analyzing and reporting of designed parameters for the user. FARMWAT, using its graphics and editing tools, allows user to enter or edit the required input data of irrigation system. After drawing the desired system, by clicking on each tube, users are allowed to view and edit the user information of each tube. The design requirements are limited to the water, soil and plant characteristics (such as soil depth, soil salinity, final infiltration rate, total available moisture stored in the root zone, water use efficiency, during the growing season. ..), and profile system installations (such as available water and nominal pressure of sprinkling, base height of sprinkles, as well as, number and diameter of each pipe ..). Data analysis in the model is including: Determination of land's topography changes during each pipe, hydraulic calculations of system and computing of system parameters. Currently, this software is capable of designing a sprinkler irrigation system type wheelchair (wheel move). It is clear just by adding the subroutines related to data analysis, FARMWAT can be used to model all kinds of possibilities in irrigation systems. Model's outputs can be summarized as irrigation depth, irrigation interval, daily settlement period lateral, lateral number and number on them by sprinkling, discharge of each lateral, dynamic pressure and total incoming discharge for the whole system. Capabilities in precision applications such as AutoCAD and Excel show all of their facilities to serve for processing, editing and recording data received from the user.
1 - Student of Water Engineering, College of Agriculture, Guilan University, Iran; E- mail:[email protected] 2‐ Assistant Professor of Water Engineering, College of Agriculture, Guilan University, Iran; E- mail:[email protected]

Communicating with the user requires a mechanism that can be a first step in the success of any software. FARMWAT is claimed to be complete user friendly software. This model and its features improve the quality of irrigation designs and level of education in irrigation systems, as well as, enable students and experts to get benefit of its facilities.
RÉSUMÉ ET CONCLUSIONS
Utilisation de l'eau dans l'agriculture de l'Iran aujourd'hui confrontés à deux problèmes majeurs: le manque d'eau douce et une autre en prenant sa faible efficacité. Dans le développement du secteur agricole de la sous systèmes d'irrigation sous pression peut être une politique appropriée pour faire face à ces problèmes. Avec la raréfaction de l'eau, peuvent s'attendre à une grande partie de l'ingénierie - développement technique dans les prochaines années sera affecté à la conception de systèmes d'irrigation sous pression. Développement de l'irrigation sous pression nécessite le développement de divers outils d'ingénierie. Cependant, ce qui est remarquable, c'est des modèles d'ingénierie logiciel et de la vitesse d'analyse des données, la capacité de conception et de minimisation des erreurs humaines dans le calcul. Ce document reflète les caractéristiques techniques et les capacités d'un modèle élaboré (FARMWAT) par les étudiants de l'Université d'irrigation de Guilan. Le modèle est capable de concevoir automatiquement dans les systèmes d'irrigation sous pression avec une grande efficacité. Le langage de programmation du modèle est écrit sous les fenêtres de VisualBasic 6.0. Le modèle a une capacité de dessiner le schéma du système d'irrigation, de recevoir les données nécessaires à la conception, la réception de la topographie, l'analyse des données et la déclaration des paramètres conçus pour l'utilisateur. FARMWAT utilisant son graphisme et des outils d'édition permet à l'utilisateur d'entrer ou de modifier les données d'entrée nécessaire du système d'irrigation. Après avoir dessiné le système souhaité, en cliquant sur chaque tube, les utilisateurs sont autorisés à visualiser et modifier les informations utilisateur de chaque tube. Les exigences de conception sont limitées à l'eau, le sol et les caractéristiques des plantes (comme la profondeur du sol, la salinité du sol, le taux d'infiltration finale, l'humidité disponible total stocké dans la zone des racines, l'efficience d'utilisation de l'eau, et pendant la saison de croissance. ..), et des installations du système de profil (comme l'eau disponible et de la pression nominale de l'aspersion, hauteur de la base de vermicelles et le nombre et le diamètre de chaque tuyau ..). L'analyse des données dans le modèle est notamment: la détermination des changements de la topographie des terres au cours de chaque tuyau, les calculs hydrauliques et du système de calcul des paramètres du système. Actuellement, ce logiciel est capable de concevoir un type de système d'irrigation par aspersion en fauteuil roulant (déplacer la roue). Il est clair, en ajoutant simplement les sous-routines liées à l'analyse des données, FARMWAT peut être utilisé pour modéliser toutes sortes de possibilités des systèmes d'irrigation. Les résultats du modèle peuvent être résumées comme profondeur d'irrigation, l'intervalle d'irrigation, la période de règlement quotidien latérales, le nombre latérales et le numéro de leur par aspersion, la décharge de chaque partie latérale, et la pression dynamique et la décharge totale entrant ensemble du système. Réseau dans les applications de précision telles que AutoCAD et Excel montre l'ensemble de leurs installations servent à la transformation, l'édition et l'enregistrement des données reçues de l'utilisateur. Communiquer avec l'utilisateur a besoin d'un mécanisme qui peut être une première étape dans la réussite de n'importe quel logiciel. FARMWAT sont revendiquées un logiciel convivial d'utilisation complet. Ce modèle et ses caractéristiques peuvent améliorer la qualité des dessins

et modèles d'irrigation et le niveau de l'éducation dans les systèmes d'irrigation, et de permettre aux étudiants et experts pour obtenir des avantages de ses facilitis.
1. INTRODUCTION
FARMWAT is a software under windows which would develop with the goal of modeling irrigation systems under pressure. In the production of this software in one hand, in this system’s design, we try to add expertise calculations and in the other hand to allow the user to compare different designs by spending time and less cost and then choose the considered design. FARMWAT 1.0 (Figure 1) is written in more than 2400 hand writings in Visual Basic 6.0 language in 6 months. The needed raw information include:
▪ Plant, soil and consumed water properties data ▪ Farm image ▪ Farm topography ▪ Pipes network layout ▪ Hazen-Williams coefficient in pipes, number of diameter in multi-diameter pipes and friction reduction from the surface of the water to the pump centre.
Outcomes of data analysis will be saved in an Access information bank. In a research from the active firms in the area of studying and designing irrigation systems under pressure in Iran, we have concluded that there isn’t so much tendency for making use of them in Iran because of different causes such as the possibility of incompatibility of external software’s with standards, internal facilities and execution situations and their high provision cost. Hydraulic calculations of the pipe network would be mostly done with EPAnet and WaterGEMS which didn’t develop in spite of their extensive facilities for expertise study of irrigation systems under pressure. Perhaps we should say that Iranian masters and experts have tried greatly in this area in recent years and the outcomes include the production of “Ghatre Pardaz” software in drip irrigation area.
Figue 1. Software icon and its name, located on the "Help" menu (Icône du logiciel et de son nom, situé sur le menu "Help")
2. HOW TO INTRODUCE THE PLANT, SOIL AND CONSUMED WATER PROPERTIES DATA WITH SOFTWARE
For this, go to the “Input> plant, Soil,…” directory (Figure 2). The window naming “Input” will be opened (Figure 3, Table 1). The value of each parameter can be

entered into the front textbox. Moreover, the user can introduce data as a text file (Figure 4), to the software with pressing “insert from file…” button.
Figure 2. How to access the "Input" menu and its sub-menus (Comment accéder au menu "Input" et ses sous-menus)
Figure 3. Inserting plant, soil and consumed water properties data by "Inputs" menu (L'insertion des plantes, le sol et propriétés de l'eau consommée par les données
"Inputs" menu)
Table 1. Full name of the input data and them units (Nom complet des données d'entrée et les unités)
Parameter Unit Description
Dr m root Depth Tgs day growth season Term
ETcp mm/day Pick crop Evapo-Transpiration ECw ds/m water Electric Conductivity ECe ds/m earth Electric Conductivity Ds m soil Depth
TAM mm/m Total Available Moisture MAD % Maximum Allowable Deficiency
fc mm/hr final infiltration velocity Ea % application Efficiency Hsl m sprinkler leg Height Ls % squall(wind) Loss q0 lit/s nominal discharge of sprinkler p0 m nominal pressure of sprinkler Hfi m pump inlet frictional Head

Figure 4. Sample text file containing some of input data (Exemple de fichier texte contenant des données d'entrée)
3. INTERING FARM PICTURE INTO THE DRAWING SCREEN
One of the useful methods for user to study farm geometrical dimensions and consider its existent structures while designing, is to use ground picture in the drawing screen background. To do this we will go to “Input> Pictures” directory (Figure 2). After opening of “Open” window and selecting picture, we can see the farm image in the drawing screen with pressing “open” button.
4. HOW TO INTRODUCE FARM TOPOGRAPHY TO THE SOFTWARE
We know that the ground topography has a basic role determining the type of farm irrigation and hydraulic operation. Introducing farm topography to FARMWAT would be done with calling a txt file. This file is like a matrix in witch the value in “i” row and “j” column, would show the height value of (i,j) pixel in the image file. Different softwares would produce such outputs in txt or ASCII formats. Going to “Tools> topography> ASCII> import…” and choosing the regarded file, we can see the file content in ASCII table window. If this window got closed, it can be opened from “Tools> topography> ASCII> review” directory (Figure 5).
Figure 5. How to access topographical tools (Comment accéder aux outils topographiques)

Geo-referencing operation should be done on the farm picture to complete steps 2, 3 and adjusting the picture with the its topography. To do this we would go to “Tools> georeference> run process…” (Figure 6). Now 4 textboxes will be opened on the screen. Mouse cursor coordinate would be shown in X(mm) and Y(mm) textboxes. Content of this tow textboxes would change realtime with the movement of the mouse. Now with a left click on a point on the farm picture, the UTM coprdinate of which is apparent for the user, the software will focus on X(UTM). The geo-references process would be executed with entering X(UTM), Y(UTM) and doing operations similar to the second and third points (Figure 7). The result of the geo-reference operation can bee seen and edited in “geo-ref table” from “Tools> geo-reference> edit… directory” (Figure 8).
Figure 6. Geo-reference tools directory (Geo-reference répertoire tools)
Figure 7. FARMWAT in geo-reference operations (FARMWAT dans les opérations
de geo-reference)

Figure 8. Geo-reference editing table and its calculated Coefficients
(Table "géo-référence" d'édition et de ses coefficients calculés)
5. DRAWING NETWORK LAYOUT Going to “Draw> mainline\sub-main\manifold\lateral” directory (Figure 9). Mouse
cursor shape will become like . In this mode we can draw a pipe by clicking on tow points of the drawing screen (Figure 10).
Figure 9. "Draw" menu, as "FARMWAT" superiority with other similar models ("Draw"
menu, comme «FARMWAT" supériorité avec d'autres modèles similaires)
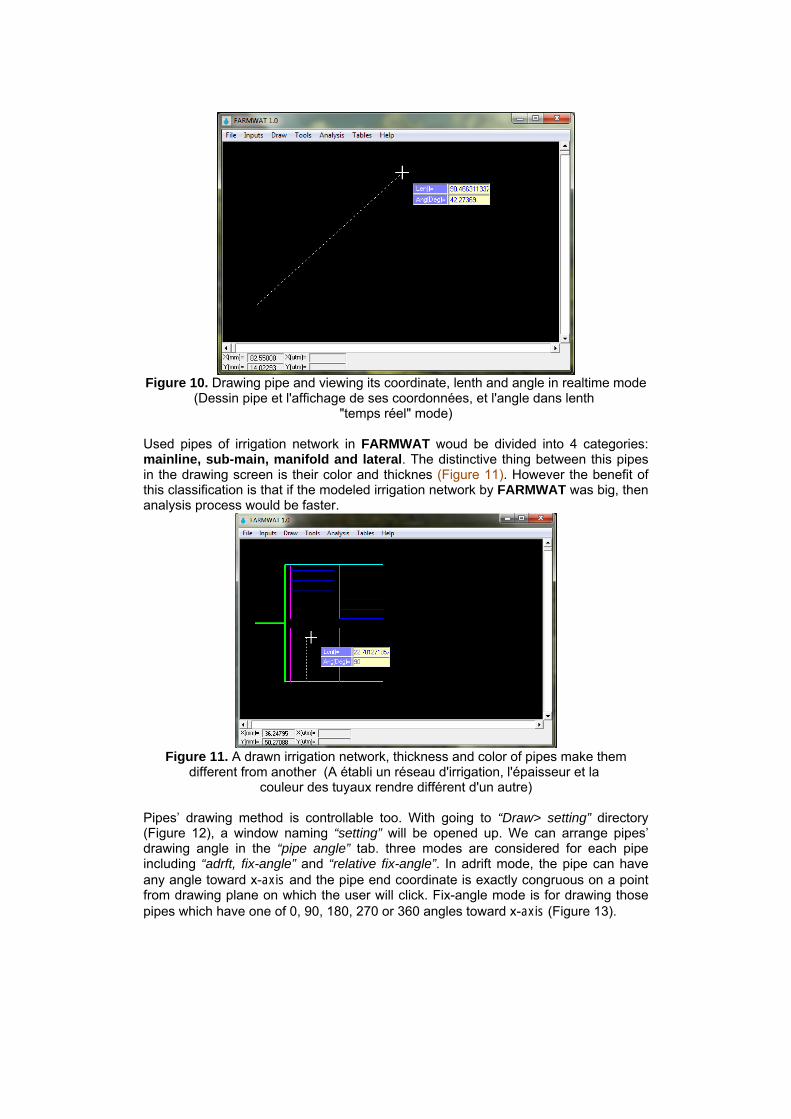
Figure 10. Drawing pipe and viewing its coordinate, lenth and angle in realtime mode
(Dessin pipe et l'affichage de ses coordonnées, et l'angle dans lenth "temps réel" mode)
Used pipes of irrigation network in FARMWAT woud be divided into 4 categories: mainline, sub-main, manifold and lateral. The distinctive thing between this pipes in the drawing screen is their color and thicknes (Figure 11). However the benefit of this classification is that if the modeled irrigation network by FARMWAT was big, then analysis process would be faster.
Figure 11. A drawn irrigation network, thickness and color of pipes make them different from another (A établi un réseau d'irrigation, l'épaisseur et la
couleur des tuyaux rendre différent d'un autre) Pipes’ drawing method is controllable too. With going to “Draw> setting” directory (Figure 12), a window naming “setting” will be opened up. We can arrange pipes’ drawing angle in the “pipe angle” tab. three modes are considered for each pipe including “adrft, fix-angle” and “relative fix-angle”. In adrift mode, the pipe can have any angle toward x-axis and the pipe end coordinate is exactly congruous on a point from drawing plane on which the user will click. Fix-angle mode is for drawing those pipes which have one of 0, 90, 180, 270 or 360 angles toward x-axis (Figure 13).

Figure 12. How to access the "setting" menu (Comment accéder au menu "setting")
Figure 13. The "setting" menu facilities (Le "setting" installations menu) Before explaining about “relative fix-angle” mode, we need to first examine the way of justifying software relative to the pipes joint. Going to “Tools> select object” (Figure
14), cursor mouse shape will become like . Now click on each of the pipes will cause “changeable records” window to open (Figure 15). There are 5 records in this window, which would be explained below.
Figure 14. How to run the "select object" tool (Comment faire pour exécuter l "select object" outil)

Figure 15. Using "select object" tool for editing pipe properties in "Changeable records" table (Utilisation de "select object" outil de propriétés des tuyaux d'édition
dans "Changeable records" table) 5.1 pipe name It shows the name of selected pipe in the project information bank. 5.2 junction It is the branchs distance in the selected pipe relative to each other or its outset. For example, attributing number 5 to “junction” parameter from a 27 meters pipe means that in spite of the two end of this pipe, we can join other pipes in every 5 meters from its length. Drawing connected pipes is possible just when in the “Draw> setting” directory and its “pipe joint” tab choose the “jointed” mode for the considered pipe. In this mode software will coincide the outset of drawing pipe to the nearest junction with clicking on every point of the drawing plane. But before clicking on the second point (end of the pipe) we can coincide the joint point of the two pipes on the junctions nearer to the pipe’s input or output, respectively, with pressing “i” and “o” on the keyboard. In another word, if the current junction number is 4, with pressing “i” in keyboard we will coincide the drawing pipe input coordinates on junctions with numbers 1, 2, 3, respectively. We can also coincide this coordinate on junctions number 5, 6, 7 respectively, with pressing “o” on the keyboard. Finally, with clicking on the pipe output point on the drawing board, its input and output coordinates will enter the information bank. 5.3 Chv Pipe’s Hazen-Williams coefficient 5.4 Chris-Prov Christianson provision determines the installation of irrigators on lateral pipes. Meaning that whether the distance of the first sprinkler on each lateral to its outset equals laterals distances from each other or half of it. 5.5 Dp Determines whether designer tends to design the pipe multi-diameter or not. For example with choosing number 3 for Dp, we can design the considered pipe in a way that 3 pipes with different diameter used in its length.

Moreover, in “Draw> setting” directory, with clicking on “erase pipe” button, we can delete the selected pipe from drawing screen.
6. OTHER FACILITIES 6.1 pipe database, an interim information bank In addition to “changeable records” window, by opening “pipe database” window we can see all the pipe data and edit them (Figure 16). This window is a temporary database in which there are six tabs. 4 The first tab contains pipes information. Tab “Z(m)” show height analysis results the pipes. This means that after drawing pipes and introduce the software ASCII file, by going to “Analysis> Z analysis” directory, FARMWAT calculate inlet, outlet, minimum and maximum Z-value of farm during the pipe and will report them in this table. Tab “L(m)” also contains results of diameter calculations in each pipe. For example, Figure 17 shows a project in which the diameter calculations for a lateral length 250 meters is done as Table 2.
Table 2. Pipe length distribution table
Diameter(mm) Length(m) 75 175.5833 90 54.1212 110 20.2955
If “pipe database” table be edited Access database containing project information can be updated by pressing “db comparison” button. Also, “layout comparison” button is used for comparing layout with interim bank (Figure 17).
Figure 16. Showing sample results of pipe diameter calculation in pipe interim database (Résultats de l'échantillon Liste de calcul diamètre du tuyau dans le tuyau
de base de données provisoires)

Figure 17. Showing pipe properties in pipe interim database (Propriétés des tuyaux affichage dans le tuyau de base de données provisoires)
6.2 output data Designing of FARMWAT model can be divided into two main steps: 1. Designing facilities to communicate with users such as "Inputs" and "Draw" menus 2. Designing analysis process of raw data in "Analysis" menu. Currently this software is capable of designing a sprinkler irrigation system type wheelchair (wheel move). It is clear just by adding the subroutines related to data analysis, FARMWAT can be used to model all kinds of possibilities irrigation systems. After inserting plant, soil and water properties data, introducing farm topography, doing geo-reference operation, drawing pipe network(system layout) and finally inserting pipe properties data to software, FARMWAT Will be prepared for calculating hydraulic and irrigation system parameters. Results of analysis process are shown in "outputs" window (Figure 18).
Figure 18. "FARMWAT" Outputs for "weelmove" irrigation system mode ("FARMWAT" Sorties pour "weelmove" mode système d'irrigation)
6.3 "File" menu In the “File” menu, has been considered some facilities for save, create new project and open the previous stored projects.

7. CONCLUSION AND RECOMMENDATIONS
As we have seen in the last parts, the product of this effort is software which can do the designing of a wheelchair (wheel move) irrigation system perfectly. Moreover, by adding necessary sub-routines to FARMWAT 1.0, we can convert it into a secure tool for designing different irrigation systems under pressure. While one of the goals of developing these irrigation systems is to increase water consume efficiency, such softwares can play their role of achieving to this goal effectively, by helping the designing of efficient irrigation systems. Other consequences of developing FARMWAT are allowing increasing the designing training of irrigation systems under pressure.
References
1. Jenson, M.E., ed., Design and Operation of Farm Irrigation Systems. St.Joseph, Michigan: American Society of Agricultural Engineers, Monograph Number 3, 1980.
2. Hansen, V.E., O. W. Israelsen, and G. E. Stringham, Irrigation Principles and Practices, 4th edition. New York: John Wiley and Sons, 1980.
3. Smedema, L. K. and D. W. Rycroft, land drainage. Ithaca, New York: Cornell University Press, 1983.
4. Warrick, A. W. and D. R. Nielsen, “Spetial Variability of Soil Physical Properties in the Field” in applications of soil physics, ed., D. Hillel. New York: academic press, 1980, pp. 319-344.