Embed Size (px)
Citation preview
Listening. Learning. Leading.®
Development of a Student Health Assessment System:
Health Knowledge, Attitudes, and Behaviors
in Middle-School Students
Carolyn MacCann
Richard D. Roberts
January 2010
ETS RR-10-04
Research Report
January 2010
Development of a Student Health Assessment System:
Health Knowledge, Attitudes, and Behaviors in Middle-School Students
Carolyn MacCann
Accelerated Learning Laboratory, University of New South Wales, Sydney, Australia
Richard D. Roberts
ETS, Princeton, New Jersey
Technical Review Editor: Dan Eignor
Technical Reviewers: Don Powers and Yasuyo Sawaki
Copyright © 2010 by Educational Testing Service. All rights reserved.
ETS, the ETS logo, and LISTENING. LEARNING. LEADING. are registered trademarks of Educational Testing
Service (ETS).
As part of its nonprofit mission, ETS conducts and disseminates the results of research to advance
quality and equity in education and assessment for the benefit of ETS’s constituents and the field.
To obtain a PDF or a print copy of a report, please visit:
http://www.ets.org/research/contact.html
i
Abstract
Newly developed assessments of nutrition and exercise knowledge, attitudes, and behavior were
administered to 383 eighth-graders. Evidence for the validity of assessment scores was evaluated
with five findings. First, parent- and self-reported behaviors were similar and congruent for
healthy eating and exercising but not for sedentary behaviors or unhealthy eating. Second, the
theory of planned behavior structural model was confirmed for exercise and nutrition attitudes:
Attitudes predicted exercising (R2=.34), healthy eating (R2=.21), sedentary behaviors (R2=.11),
and unhealthy eating (R2=.09). Third, gender differences replicated previous research: Girls have
better diets and nutrition attitudes whereas boys exercise more frequently. The assessments
distinguished normal-weight from obese individuals, and showed incremental validity in
predicting school grades. The paper concludes with a discussion of the assessments’ potential for
informing interventions.
Key words: theory of planned behavior, obesity, nutrition, exercise, academic achievement
ii
Acknowledgments
This paper was written while the first author was a recipient of a post-doctoral fellowship award
at ETS with data collection supported, in part, by both the Research and Development and
Interactive Learning Divisions of ETS. We would like to thank the following individuals for
supporting this research in a number of ways, from project management to data collection to
preparation of the manuscript to final technical review: Marjorie Biddle, Brent Bridgeman,
Chuck Cascio, Rosalea Courtney, Tim Davey, Neil Dorans, Marisa Farnum, Burt Fried,
Madeleine Goodman, Teresa Jackson, Teresa King, David Kuntz, Patrick Kyllonen, Ida
Lawrence, Mary Lucas, Jennifer Minsky, Debbie Pisacreta, Meg Powers, Frank Rijmen, Ralf
Schulze, Jonathan Steinberg, Namrata Tognatta, Jodi Underwood, Matthew Ventura, Cathy
Wendler, and Vincent Weng. We would especially like to thank the three reviewers, Dan Eignor,
Don Powers, and Yasuyo Sawaki, for their excellent suggestions. The views expressed are those
of the authors and do not represent the views of ETS.
iii
Table of Contents
Page
Background ..................................................................................................................................... 1
Background to Assessment Development: The Who-Am-I Assessment Suite ......................... 1
Theoretical Framework for Assessment of Nutrition and Exercise ........................................... 2
Evaluating Validity Evidence of the Health Assessment System .............................................. 5
Hypotheses ................................................................................................................................. 8
Method ...................................................................................................................................... 9
Procedure .................................................................................................................................... 9
Participants ................................................................................................................................. 9
Student Measures ....................................................................................................................... 9
Parent Measures ....................................................................................................................... 11
Body Mass Index (BMI) .......................................................................................................... 12
Data Analysis Plan ................................................................................................................... 12
Results .................................................................................................................................... 13
Structural Analysis of Health Knowledge ................................................................................ 13
Structural Analysis of Nutrition Attitudes ............................................................................... 14
Structural Analysis of Exercise Attitudes ................................................................................ 15
Structural Analysis of Nutrition Behaviors .............................................................................. 15
Structural Analysis of Exercise Behaviors ............................................................................... 19
Relationship Between Attitudes and Behaviors ....................................................................... 20
Relationships of Knowledge to Behaviors and Intentions ....................................................... 24
Descriptive Statistics for the Health Assessment System ........................................................ 25
Gender Differences on the Health Assessment System ........................................................... 25
Weight Differences on the Health Assessment System ........................................................... 27
Relationship of the Health Assessment System to Achievement at School ............................. 27
Discussion .................................................................................................................................... 27
1. The Health Knowledge Assessment Is Not Unidimensional ............................................... 28
2. Attitudes Conform to the TpB Structure .............................................................................. 28
3. Health Behaviors Have a Bifactor Structure ........................................................................ 30
4. Attitudes Predict Behaviors .................................................................................................. 30
iv
5. Knowledge Relates to Attitudes and Behaviors ................................................................... 31
6. Self- and Parent Reports of Behaviors Are Correlated and Similarly Structured ................ 31
7. Gender Differences Are Consistent With Previous Research .............................................. 32
8. The Health Assessment System Distinguishes Normal Weight From Overweight
and Obese Individuals .......................................................................................................... 33
9. The Health Assessment System Shows Some Relationship to School Grades .................... 34
Future Directions ...................................................................................................................... 34
How Research Findings Inform Future Development of the Who-Am-I
(WHAMI) Materials ............................................................................................................ 36
References .................................................................................................................................... 37
v
List of Tables
Page
Table 1. Factor Loadings and Factor Correlations for Exploratory Factor Analysis
(EFA) and Confirmatory Factor Analysis (CFA) of Self- and Parent-Reported
Nutrition Behavior ........................................................................................................ 18
Table 2. Factor Loadings and Factor Correlations for Exploratory Factor Analysis
(EFA) and Confirmatory Factor Analysis (CFA) of Self- and Parent-Reported
Exercise Behaviors ....................................................................................................... 19
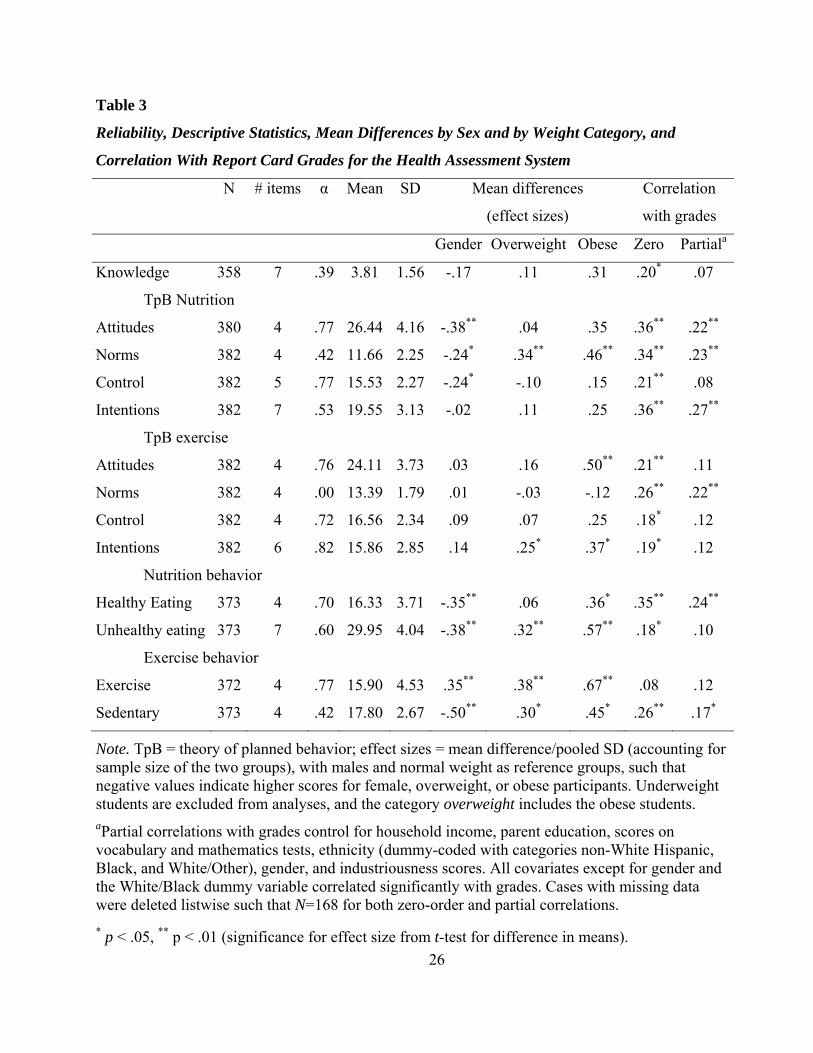
Table 3. Reliability, Descriptive Statistics, Mean Differences by Sex and by Weight Category,
and Correlation With Report Card Grades for the Health Assessment System ........... 26
vi
List of Figures
Page
Figure 1. Theory of planned behavior (TpB). ................................................................................ 3
Figure 2. Standardized loadings and path coefficients for a structural model of the theory of
planned behavior for nutrition (includes a reverse-scoring method factor). ................ 16
Figure 3. Standardized loadings and path coefficients for a structural model of the theory of
planned behavior for exercise (includes a reverse-scoring method factor). ................. 17
Figure 4. Standardized loadings and path coefficients for a model predicting parent-reported
healthy eating behaviors from attitudes to nutrition according to the theory of planned
behavior (includes a reverse-scoring method factor). .................................................. 21
Figure 5. Standardized loadings and path coefficients for a model predicting parent-reported
unhealthy eating behaviors from attitudes to nutrition according to the theory of
planned behavior (includes a reverse-scoring method factor). ..................................... 22
Figure 6. Standardized loadings and path coefficients for a model predicting parent-reported
exercise behaviors from attitudes to exercise according to the theory of planned
behavior (includes a reverse-scoring method factor). .................................................. 23
Figure 7. Standardized loadings and path coefficients for a model predicting parent-reported
sedentary behaviors from attitudes to exercise according to the theory of planned
behavior (includes a reverse-scoring method factor). .................................................. 24
1
Background
Background to Assessment Development: The Who-Am-I Assessment Suite
As part of its social mission, ETS is developing a set of formative assessments aimed at
middle school students: the Who-Am-I (WHAMI) assessment suite. The WHAMI comprises a set
of computerized assessments of noncognitive constructs (e.g., time management, test anxiety,
diurnal preferences). Students and their caregivers are provided with feedback on the students’
score level on these constructs and further provided with suggestions for change in light of these
scores. For example, a student whose time management profile indicated difficulty keeping track
of assignments and homework might be advised to use a planner, electronic or wall calendar, or
save reminders into a cell phone. Similarly, a student whose test anxiety profile indicates that
anxiety overwhelms their concentration during testing situations might be advised on some anxiety
reduction techniques. Students’ caregivers are also provided both descriptive and proscriptive
feedback for their child or ward.
This study concerns the possible inclusion of health and wellness measures as a component
in WHAMI. Preliminary items were developed to assess students’ nutrition and exercise
knowledge, attitudes to nutrition, nutrition-related behaviors, attitudes to exercise, and exercise-
related behaviors. These items were developed as a first step to determining whether these
constructs are meaningful for students (i.e., whether they relate to student obesity or students’
academic achievement) and whether they can be reliably assessed. Although student health is not
directly related to academic achievement, research and policy on U.S. middle school students
paints a stark picture of rising obesity, lack of physical activity, and corresponding chronic health
problems (e.g., Pyle et al., 2006; U.S. Department of Health and Human Services, 2007). Many
educational institutions, as well as numerous workplaces (including ETS’s own Strategic
Workforce Solutions), are responding by introducing programs that encourage a healthy lifestyle.
Taken together, these facts suggest that assessment and intervention in health are necessary and
may shortly become widespread and inevitable within the United States. Thus, the current study is
a preliminary step in considering whether psychometrically sound assessments of health and well-
being can properly be considered part of the domain of educational testing.
The primary research agenda for the WHAMI battery is to ensure that each assessment task
meets a set of psychometric and utility-related criteria. Each assessment task must meet three
broad criteria to be considered for inclusion in WHAMI: (a) generalizability (the tool’s structural
2
integrity, internal consistency, and test-retest reliability must be adequate); (b) validity evidence
for the assessments (scores derived from the tool must meaningfully relate to scores on similar
constructs and should, in principle, predict useful outcomes); and (c) validity evidence for
suggestions (suggestions are content-validated against research corpora and expert judgments, and
demonstrated to be useful in improving academic outcomes, broadly defined).
The current study concerns the first two steps of the research agenda as they apply to the
health assessment measures. This report describes the development of the assessment tools,
including structural analysis and item selection, and the evaluation of some preliminary indicators
of validity.
Theoretical Framework for Assessment of Nutrition and Exercise
The Knowledge-Attitude-Behavior (K-A-B) model is used as a theoretical framework for
assessment, with the attitudinal component based on the four belief systems of the theory of
planned behavior (TpB; Ajzen, 1991). In the K-A-B model, knowledge feeds into attitudes, which
feed into behaviors (see Baranowski, Cullen, Nicklas, Thompson, & Baranowski, 2003). For
example, if people are informed about the health consequences of tobacco use (knowledge), they
will form a negative view of smoking (attitude) and quit (behavior). Knowledge may additionally
act as an enabler of behavior (e.g., knowledge about nicotine patches or other methods for quitting
may be used to stop smoking).
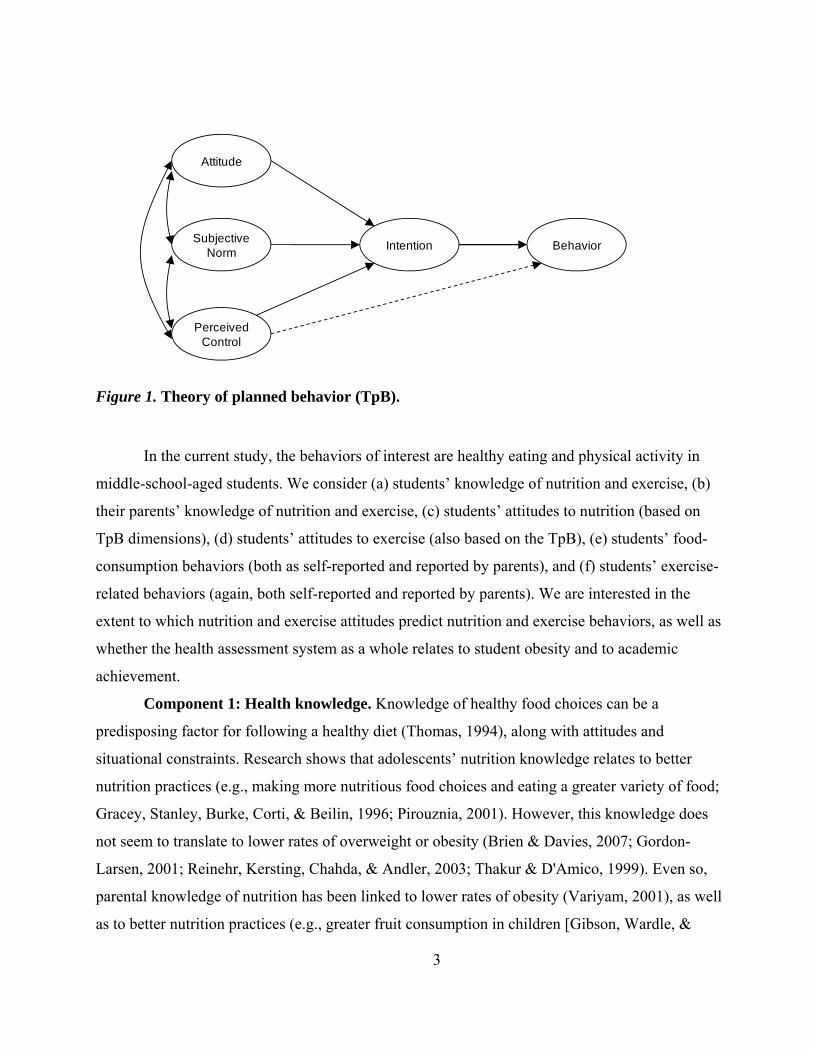
The TpB attitudinal dimensions are based on the earlier theory of reasoned action (Ajzen
& Fishbein, 1973), which proposes that behavior is determined by intentions, which are in turn
determined by attitudes and social norms. For example, if a person forms a negative view of
smoking (attitude) and their friends and family want them to quit (subjective norms), then they
will intend to quit (intention) and therefore stop smoking (behavior). The TpB additionally
considers the effect of perceived control on behavior, such that a person may have strong
intentions but low control (e.g., the physical addiction to nicotine may override attitudes, norms,
and intentions to predict smoking behavior). The theoretical model for the TpB is shown in
Figure 1. Although the TpB has been frequently used to study health behavior, very little of this
research has been conducted in children, or with ethnically diverse samples, as in the current
study (Baranowski et al., 2003).
3
Attitude
Subjective Norm
PerceivedControl
BehaviorIntention
Figure 1. Theory of planned behavior (TpB).
In the current study, the behaviors of interest are healthy eating and physical activity in
middle-school-aged students. We consider (a) students’ knowledge of nutrition and exercise, (b)
their parents’ knowledge of nutrition and exercise, (c) students’ attitudes to nutrition (based on
TpB dimensions), (d) students’ attitudes to exercise (also based on the TpB), (e) students’ food-
consumption behaviors (both as self-reported and reported by parents), and (f) students’ exercise-
related behaviors (again, both self-reported and reported by parents). We are interested in the
extent to which nutrition and exercise attitudes predict nutrition and exercise behaviors, as well as
whether the health assessment system as a whole relates to student obesity and to academic
achievement.
Component 1: Health knowledge. Knowledge of healthy food choices can be a
predisposing factor for following a healthy diet (Thomas, 1994), along with attitudes and
situational constraints. Research shows that adolescents’ nutrition knowledge relates to better
nutrition practices (e.g., making more nutritious food choices and eating a greater variety of food;
Gracey, Stanley, Burke, Corti, & Beilin, 1996; Pirouznia, 2001). However, this knowledge does
not seem to translate to lower rates of overweight or obesity (Brien & Davies, 2007; Gordon-
Larsen, 2001; Reinehr, Kersting, Chahda, & Andler, 2003; Thakur & D'Amico, 1999). Even so,
parental knowledge of nutrition has been linked to lower rates of obesity (Variyam, 2001), as well
as to better nutrition practices (e.g., greater fruit consumption in children [Gibson, Wardle, &
4
Watts, 1998]). Information from the Dietary Guidelines for Americans 2005 (U.S. Department of
Health and Human Services, 2005) was used to develop the health knowledge assessment.
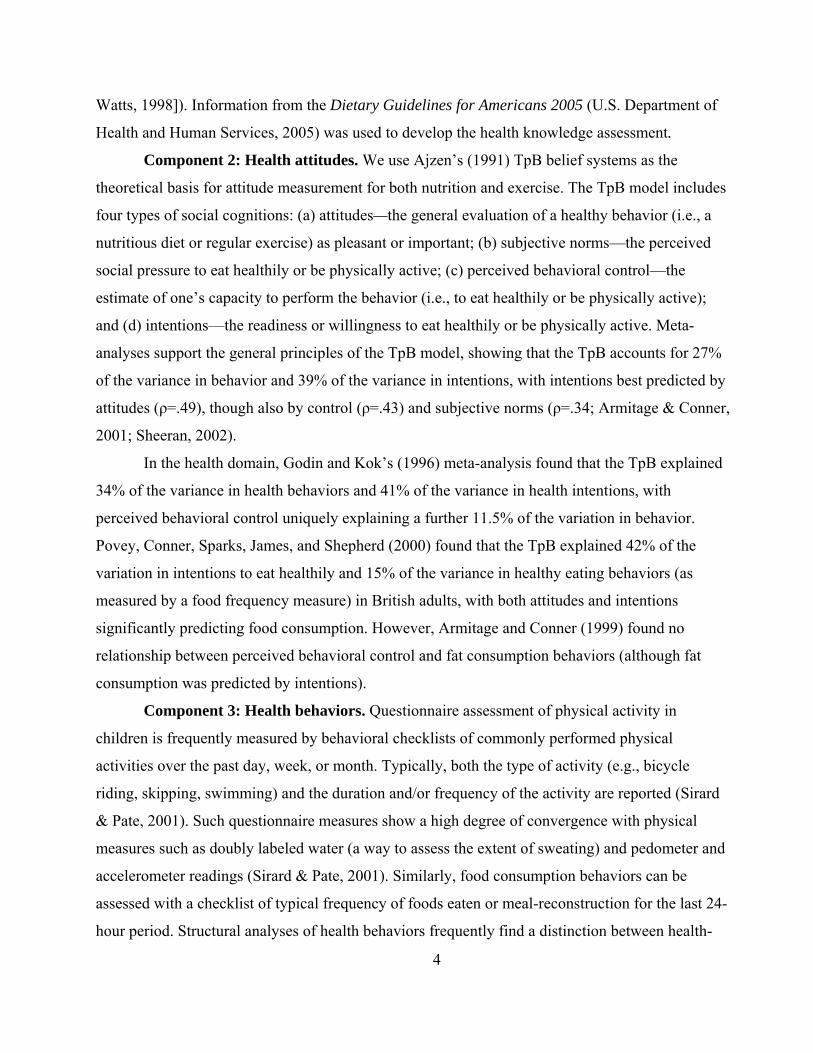
Component 2: Health attitudes. We use Ajzen’s (1991) TpB belief systems as the
theoretical basis for attitude measurement for both nutrition and exercise. The TpB model includes
four types of social cognitions: (a) attitudes—the general evaluation of a healthy behavior (i.e., a
nutritious diet or regular exercise) as pleasant or important; (b) subjective norms—the perceived
social pressure to eat healthily or be physically active; (c) perceived behavioral control—the
estimate of one’s capacity to perform the behavior (i.e., to eat healthily or be physically active);
and (d) intentions—the readiness or willingness to eat healthily or be physically active. Meta-
analyses support the general principles of the TpB model, showing that the TpB accounts for 27%
of the variance in behavior and 39% of the variance in intentions, with intentions best predicted by
attitudes (ρ=.49), though also by control (ρ=.43) and subjective norms (ρ=.34; Armitage & Conner,
2001; Sheeran, 2002).
In the health domain, Godin and Kok’s (1996) meta-analysis found that the TpB explained
34% of the variance in health behaviors and 41% of the variance in health intentions, with
perceived behavioral control uniquely explaining a further 11.5% of the variation in behavior.
Povey, Conner, Sparks, James, and Shepherd (2000) found that the TpB explained 42% of the
variation in intentions to eat healthily and 15% of the variance in healthy eating behaviors (as
measured by a food frequency measure) in British adults, with both attitudes and intentions
significantly predicting food consumption. However, Armitage and Conner (1999) found no
relationship between perceived behavioral control and fat consumption behaviors (although fat
consumption was predicted by intentions).
Component 3: Health behaviors. Questionnaire assessment of physical activity in
children is frequently measured by behavioral checklists of commonly performed physical
activities over the past day, week, or month. Typically, both the type of activity (e.g., bicycle
riding, skipping, swimming) and the duration and/or frequency of the activity are reported (Sirard
& Pate, 2001). Such questionnaire measures show a high degree of convergence with physical
measures such as doubly labeled water (a way to assess the extent of sweating) and pedometer and
accelerometer readings (Sirard & Pate, 2001). Similarly, food consumption behaviors can be
assessed with a checklist of typical frequency of foods eaten or meal-reconstruction for the last 24-
hour period. Structural analyses of health behaviors frequently find a distinction between health-
5
enhancing eating patterns, such as consuming fruit and vegetables, and health-degenerating
behaviors, such as eating junk food, indicating that food consumption behaviors might be better
considered as two characteristics rather than as overall calories consumed (Aarø, Laberg, & Wold,
1995; Nutbeam, Aarø, & Wold, 1991). To develop brief assessments of nutrition behaviors and of
exercise behaviors, we use the checklist approach, with students’ reporting how often they eat
particular foods and/or how often they perform a list of common physical activities.
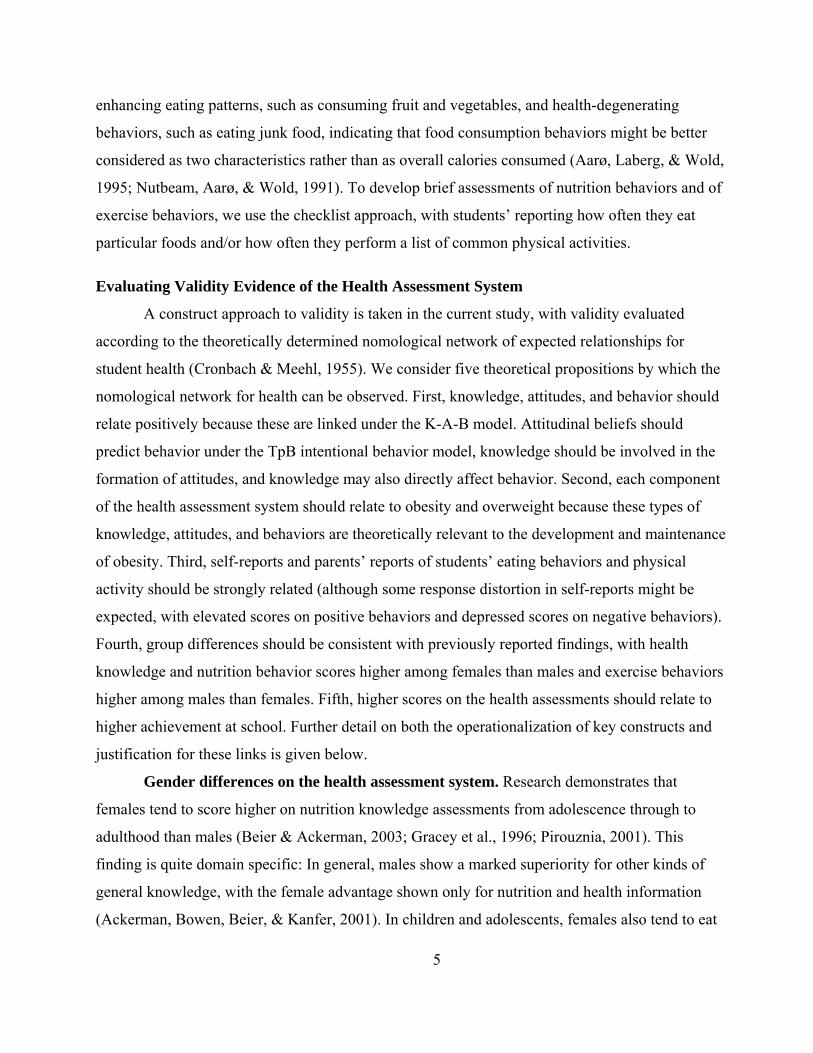
Evaluating Validity Evidence of the Health Assessment System
A construct approach to validity is taken in the current study, with validity evaluated
according to the theoretically determined nomological network of expected relationships for
student health (Cronbach & Meehl, 1955). We consider five theoretical propositions by which the
nomological network for health can be observed. First, knowledge, attitudes, and behavior should
relate positively because these are linked under the K-A-B model. Attitudinal beliefs should
predict behavior under the TpB intentional behavior model, knowledge should be involved in the
formation of attitudes, and knowledge may also directly affect behavior. Second, each component
of the health assessment system should relate to obesity and overweight because these types of
knowledge, attitudes, and behaviors are theoretically relevant to the development and maintenance
of obesity. Third, self-reports and parents’ reports of students’ eating behaviors and physical
activity should be strongly related (although some response distortion in self-reports might be
expected, with elevated scores on positive behaviors and depressed scores on negative behaviors).
Fourth, group differences should be consistent with previously reported findings, with health
knowledge and nutrition behavior scores higher among females than males and exercise behaviors
higher among males than females. Fifth, higher scores on the health assessments should relate to
higher achievement at school. Further detail on both the operationalization of key constructs and
justification for these links is given below.
Gender differences on the health assessment system. Research demonstrates that
females tend to score higher on nutrition knowledge assessments from adolescence through to
adulthood than males (Beier & Ackerman, 2003; Gracey et al., 1996; Pirouznia, 2001). This
finding is quite domain specific: In general, males show a marked superiority for other kinds of
general knowledge, with the female advantage shown only for nutrition and health information
(Ackerman, Bowen, Beier, & Kanfer, 2001). In children and adolescents, females also tend to eat
6
more healthily than males, although males engage in more physical activity (Cohen, Brownell, &
Felix, 1990; Loucaides & Jago, 2008; Milligan et al., 1998).
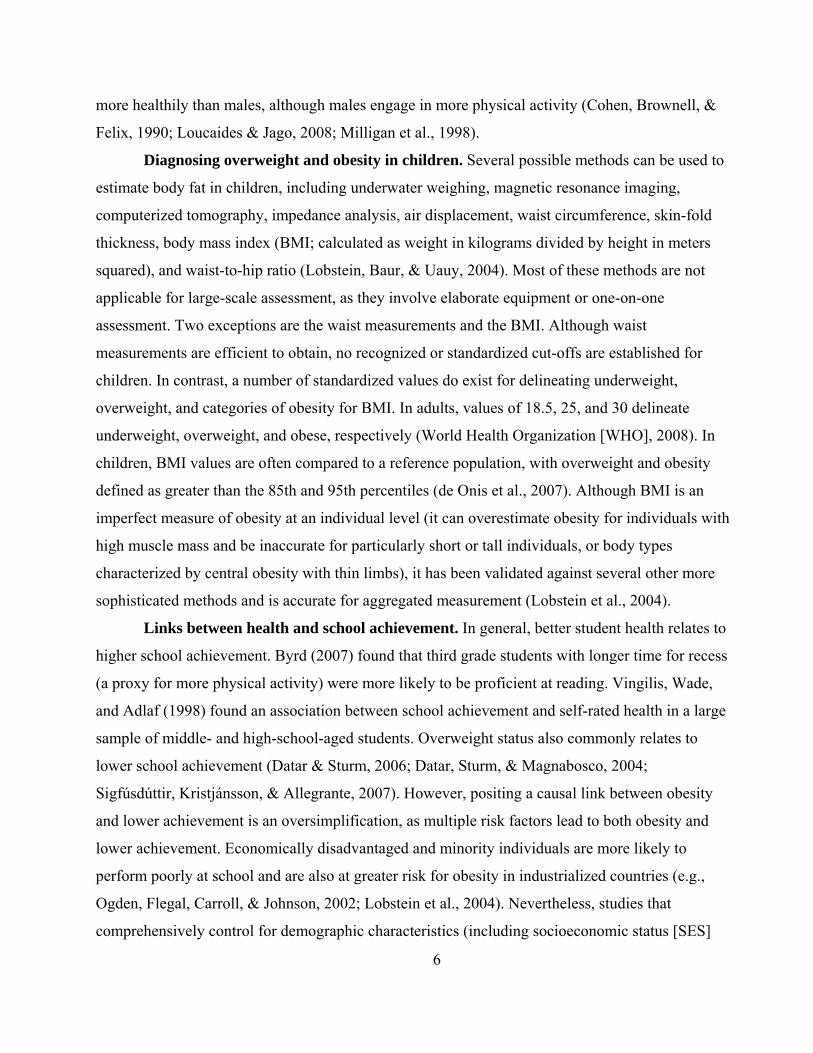
Diagnosing overweight and obesity in children. Several possible methods can be used to
estimate body fat in children, including underwater weighing, magnetic resonance imaging,
computerized tomography, impedance analysis, air displacement, waist circumference, skin-fold
thickness, body mass index (BMI; calculated as weight in kilograms divided by height in meters
squared), and waist-to-hip ratio (Lobstein, Baur, & Uauy, 2004). Most of these methods are not
applicable for large-scale assessment, as they involve elaborate equipment or one-on-one
assessment. Two exceptions are the waist measurements and the BMI. Although waist
measurements are efficient to obtain, no recognized or standardized cut-offs are established for
children. In contrast, a number of standardized values do exist for delineating underweight,
overweight, and categories of obesity for BMI. In adults, values of 18.5, 25, and 30 delineate
underweight, overweight, and obese, respectively (World Health Organization [WHO], 2008). In
children, BMI values are often compared to a reference population, with overweight and obesity
defined as greater than the 85th and 95th percentiles (de Onis et al., 2007). Although BMI is an
imperfect measure of obesity at an individual level (it can overestimate obesity for individuals with
high muscle mass and be inaccurate for particularly short or tall individuals, or body types
characterized by central obesity with thin limbs), it has been validated against several other more
sophisticated methods and is accurate for aggregated measurement (Lobstein et al., 2004).
Links between health and school achievement. In general, better student health relates to
higher school achievement. Byrd (2007) found that third grade students with longer time for recess
(a proxy for more physical activity) were more likely to be proficient at reading. Vingilis, Wade,
and Adlaf (1998) found an association between school achievement and self-rated health in a large
sample of middle- and high-school-aged students. Overweight status also commonly relates to
lower school achievement (Datar & Sturm, 2006; Datar, Sturm, & Magnabosco, 2004;
Sigfúsdúttir, Kristjánsson, & Allegrante, 2007). However, positing a causal link between obesity
and lower achievement is an oversimplification, as multiple risk factors lead to both obesity and
lower achievement. Economically disadvantaged and minority individuals are more likely to
perform poorly at school and are also at greater risk for obesity in industrialized countries (e.g.,
Ogden, Flegal, Carroll, & Johnson, 2002; Lobstein et al., 2004). Nevertheless, studies that
comprehensively control for demographic characteristics (including socioeconomic status [SES]
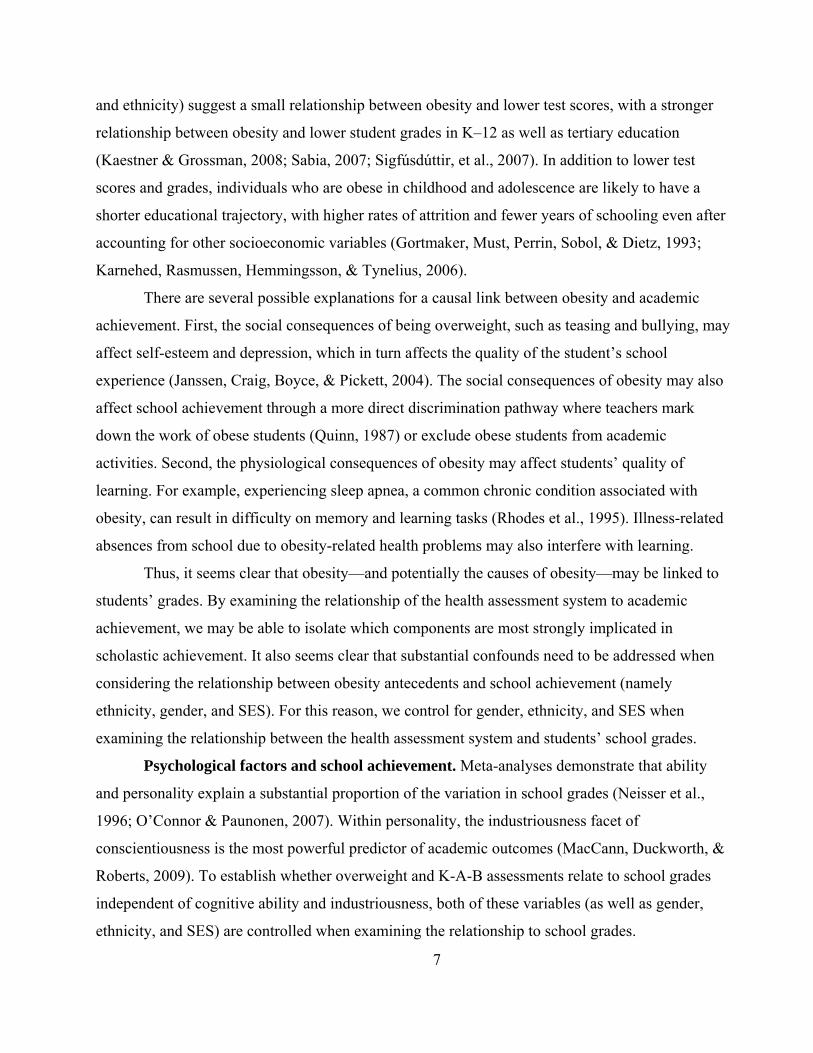
7
and ethnicity) suggest a small relationship between obesity and lower test scores, with a stronger
relationship between obesity and lower student grades in K–12 as well as tertiary education
(Kaestner & Grossman, 2008; Sabia, 2007; Sigfúsdúttir, et al., 2007). In addition to lower test
scores and grades, individuals who are obese in childhood and adolescence are likely to have a
shorter educational trajectory, with higher rates of attrition and fewer years of schooling even after
accounting for other socioeconomic variables (Gortmaker, Must, Perrin, Sobol, & Dietz, 1993;
Karnehed, Rasmussen, Hemmingsson, & Tynelius, 2006).
There are several possible explanations for a causal link between obesity and academic
achievement. First, the social consequences of being overweight, such as teasing and bullying, may
affect self-esteem and depression, which in turn affects the quality of the student’s school
experience (Janssen, Craig, Boyce, & Pickett, 2004). The social consequences of obesity may also
affect school achievement through a more direct discrimination pathway where teachers mark
down the work of obese students (Quinn, 1987) or exclude obese students from academic
activities. Second, the physiological consequences of obesity may affect students’ quality of
learning. For example, experiencing sleep apnea, a common chronic condition associated with
obesity, can result in difficulty on memory and learning tasks (Rhodes et al., 1995). Illness-related
absences from school due to obesity-related health problems may also interfere with learning.
Thus, it seems clear that obesity—and potentially the causes of obesity—may be linked to
students’ grades. By examining the relationship of the health assessment system to academic
achievement, we may be able to isolate which components are most strongly implicated in
scholastic achievement. It also seems clear that substantial confounds need to be addressed when
considering the relationship between obesity antecedents and school achievement (namely
ethnicity, gender, and SES). For this reason, we control for gender, ethnicity, and SES when
examining the relationship between the health assessment system and students’ school grades.
Psychological factors and school achievement. Meta-analyses demonstrate that ability
and personality explain a substantial proportion of the variation in school grades (Neisser et al.,
1996; O’Connor & Paunonen, 2007). Within personality, the industriousness facet of
conscientiousness is the most powerful predictor of academic outcomes (MacCann, Duckworth, &
Roberts, 2009). To establish whether overweight and K-A-B assessments relate to school grades
independent of cognitive ability and industriousness, both of these variables (as well as gender,
ethnicity, and SES) are controlled when examining the relationship to school grades.
8
Hypotheses
This paper has two broad goals: (a) to determine the structure of health knowledge,
attitudes, and behaviors among adolescents; and (b) to evaluate the validity evidence for health
knowledge, attitudes, and behaviors in line with the nomological net defining them. The specific
hypotheses used to evaluate validity evidence are given below.
Hypothesis 1. The health knowledge assessment will be unidimensional and internally
consistent in both student and parent samples.
Hypothesis 2. Assessments of both nutrition attitudes and exercise attitudes will conform
to the theoretical structure of the TpB.
Hypothesis 3. Assessments of both food consumption behaviors and exercise behaviors
will show a two-factor structure representing positive and negative behaviors.
Hypothesis 4. Nutrition attitudes will predict food consumption behaviors, while exercise
attitudes will predict exercise behaviors.
Hypothesis 5. Health knowledge will relate to nutrition attitudes, exercise attitudes, food
consumption behaviors, and exercise behaviors.
Hypothesis 6. Self-reports and parent reports of behavior will be consistent, showing a
congruent factorial structure and correlating positively with each other (with correlations in the .45
to .60 range, in line with meta-analyses of self-reports versus other reports of personality;
Connolly, Kavanagh, & Viswesvaran, 2007).
Hypothesis 7. Sex differences will be consistent with previous reports. That is, females
will score more highly on health knowledge and nutrition behaviors, and males on exercise
behaviors. Although sex differences in attitudes have not been examined, these are expected to be
similar to differences in behaviors: Females will have more positive attitudes to nutrition, while
males will have more positive attitudes to exercise.
Hypothesis 8. Normal weight students will show higher scores on the health assessment
system than overweight or obese students.
Hypothesis 9. Scores on the health assessments will relate to students’ school grades.
These relationships will hold after accounting for sex, ethnicity, SES, cognitive ability, and the
industriousness facet of personality.
9
Method
Procedure
Middle school students and a parent or guardian for each were recruited from five cities
across the United States (Atlanta, GA; Chicago, IL; Denver, CO; Fort Lee, NJ; and Los Angeles,
CA) to participate in a longitudinal study. The health assessment system and criterion measures
described in this study were administered as part of the third wave of this project (testing was
conducted in August 2006, March 2007, and December 2007), except for the vocabulary test,
which was administered in the first wave. Each student–parent pair was tested at a local site and
compensated for participation. Students were taken to a separate testing room to complete a paper-
and-pencil mathematics test, followed by a self-paced, proctored computerized test battery. In this
third session, testing took up to 90 minutes to complete, and students were encouraged to take a
rest break after 45 minutes.
Parents were given a consent form and a paper-and-pencil booklet of test protocols to
complete. Parents completed this booklet in a separate room while the students were in the testing
room. Students and parents were reimbursed for their participation after the students completed
their test battery. All tests and protocols were approved under the ETS human ethics review
committee and fairness review process.
Participants
Student sample. The student sample consisted of 383 middle school students (49% female)
who were halfway through the eighth grade. Participants ages ranged from 12 to 15 years, with most
aged 13 (73.6%) or 14 (22.7%) years. Reported ethnicities were 13.3% African-American, 15.1%
Hispanic, and 68.9% White non-Hispanic, with the remaining 2.3% indicating “Other.”
Parent sample. The parent sample consisted of 376 individuals (parent data was not
available for 7 students), most of whom were the mother (83.3%) or the father (12.5%) of the child
(the remaining 1.9% were extended family or legal guardians). Most of the parent group were aged
in their 30s (20.4%), 40s (58.5%), or 50s (17.5%).
Student Measures
1. Health knowledge. Ten multiple-choice items assessed students’ knowledge of nutrition
and exercise, with content drawn from the United States Department of Agriculture (USDA)
10
guidelines (U.S. Department of Health and Human Services, 2005). For example: Which food has
the most vitamin C? (a) An apple; (b) A glass of milk; (c) Low-fat cheese; or (d) A diet cola.
2. Nutrition attitudes. Students rated their level of agreement with 19 statements on a 5-
point scale from 1 (strongly disagree) to 5 (strongly agree). Items represented the four components
of the TpB: (a) attitudes (7 items; e.g., I like eating healthy food), (b) perceived behavioral control
(4 items; e.g., I know I could eat the right things if I tried to), (c) subjective norms (4 items; e.g.,
Most people I know are careful what they eat), and (d) intentions (4 items; e.g., In the future, I will
eat healthy foods). These nutrition attitudes items were intermixed with exercise attitude items.
3. Exercise attitudes. Students rated their level of agreement with 18 statements on a 5-
point scale from 1 (strongly disagree) to 5 (strongly agree). As for nutrition attitudes, items
represented the four components of the TpB: (a) attitudes (6 items; e.g., Exercise is exhausting
[reverse]), (b) perceived behavioral control (4 items; e.g., It’s up to me whether I exercise),
(c) subjective norms (4 items; e.g., My parents want me to keep fit), and (d) intentions (4 items;
e.g., I plan to be active every day). These exercise attitude items were intermixed with nutrition
attitude items.
4. Diet-related behaviors. Students rated how frequently they engaged in 18 possible diet-
related behaviors (e.g., drink soda or pop with a meal), on the following 6-point scale: 1 (hardly
ever), 2 (rarely; 1 to 2 times a month), 3 (sometimes; about 1 to 2 times a week), 4 (often; about
every second day), 5 (usually; just about every day), and 6 (always; more than once a day). These
diet-related behavior items were intermixed with exercise-related behavior items.
5. Exercise-related behaviors. Students rated how frequently they engaged in 8 possible
behaviors relating to physical activity (e.g., play outside for half an hour or more) on the following
6-point scale: 1 (hardly ever), 2 (rarely; 1 to 2 times a month), 3 (sometimes; about 1 to 2 times a
week), 4 (often; about every second day), 5 (usually; just about every day), and 6 (always; more
than once a day). These exercise-related behavior items were intermixed with the diet-related
items.
6. Math ability. Nineteen items, which are no longer in operational use, were drawn from
the National Assessment of Educational Progress (NAEP) math test (Lee, Grigg, & Dion, 2007).
For example: Which of the following numbers is five million eighty thousand? (a) 5,800,000; (b)
5,008,000; (c) 5,000,008; (d) 5,080,000; (e) 580,000. Cronbach’s alpha for this measure was .72 in
this sample.
11
7. Vocabulary test. A subset of 18 items was taken from the Vocabulary Levels Test
(Schmitt, Schmitt, & Clapham, 2001). Six items were taken from the 2000 level (i.e., the 2,000
most common words in the English language), six from the 3000 level (i.e., the next most common
1,000 words in English), and six from the 5000 level (i.e., the next most common 2,000 words in
English). Each item consisted of three words that had to be matched to one of six synonyms and
was scored out of three, such that scores could range from 0 to 54. This test was not timed. The
Cronbach alpha of this test was .85 in the current sample.
8. Industriousness. The industriousness facet scale of conscientiousness from MacCann et
al. (2009) was administered to students, who rated each of 10 items (e.g., I make an effort) on a 5-
point scale, from 1 (not at all like me) to 5 (very much like me).
9. Student grades. Each student reported their previous semester’s grade in English, math,
science, and social studies (from A+, A, A- etc. to fail). Grades were converted to a 13-point scale
from 0 (E or fail) to 12 (A+). Some reports of grades were missing or were not interpretable (e.g.,
“pass”) and had to be excluded from the conversion procedure (after exclusion, N = 354). An
overall grade variable was created by taking the first principal component of these four variables.
Parent Measures
1. Health knowledge. Parents completed the same 10-item health-knowledge questionnaire
as their children.
2. Diet-related behaviors. This instrument was identical to the self-reported diet-related
behaviors described previously, except that the instructions asked, “How often does your child…?”
rather than “How often do you…?”
3. Exercise-related behaviors. This instrument was identical to the self-reported exercise-
related behaviors described previously, except that the instructions asked, “How often does your
child…?” rather than “How often do you…?”
4. Student grades. Each parent also reported his or her child’s previous semester’s grades
with the same conversion and aggregation procedure as used for self-reported grades. There were
348 parent-reported aggregate grades available for analysis. Parent- and student-reported grades
correlated at .77. A dependent sample t-test found no significant differences between parent- and
self-reported grades (t[323] = .841, p = .401). In line with concerns about response distortion,
parent-reported grades are used as the grades criterion in all further analysis.
12
Body Mass Index (BMI)
Both parents and students reported the student’s height (in feet and inches) and weight (in
pounds). Student and parent reports for height correlated at .87, compared to .76 to .87 between
self-reported and measured height (Elgar, Roberts, Tudor-Smith, & Moore, 2005). Student and
parent reports of weight correlated at .91, compared to .94 to .95 between self-reported and
measured weight (Elgar et al., 2005). Students reported a significantly greater height than their
parents (MSelf = 163.02cm, SDSelf = 9.65cm, MParent = 162.43cm, SDParent = 9.45cm; t = 2.171,
p = .031) and a nonsignificantly lower weight (MSelf = 53.43kg, SDSelf = 11.84kg,
MParent = 53.57kg, SDParent = 12.95; t = -0.519, p = .604). These differences of 0.59cm and 0.14kg
are similar to reported differences between self-report and physical measurements (0.43cm and
0.53kg; Elgar et al., 2005). Student and parent values for height and weight were averaged before
calculating BMI. Comparing students’ BMI to the WHO Reference 2007 age-in-months BMI cut-
off values (de Onis et al., 2007), 17 participants were underweight (4.4%), 266 were normal
weight (69.5%), 60 were overweight (15.7%), and 36 were obese (9.4%).
Data Analysis Plan
Testing structural models. For the knowledge and behavior questionnaires where the
structure is essentially unknown, parallel analysis was used to determine the number of factors to
extract (comparing observed eigenvalues to the 95th percentile of eigenvalues obtained from 100
random runs; O’Connor, 2000), followed by exploratory factor analysis (EFA) with principal axis
factoring estimation and promax rotation. Poorly loading items were removed at this stage and the
remaining items subjected to confirmatory factor analysis (CFA). For the attitudes items where the
theoretical structure was known (the TpB structure was the basis for instrument development),
structural equation modeling (SEM) was used at the outset to test the fit of the item data to the TpB
theoretical model.
Prediction of behavior from attitudes and knowledge. The relationship between
attitudes and behavior was tested according to the TpB model (i.e., both intentions and perceived
behavioral control predict behavior, with attitudes, subjective norms, and perceived behavioral
control predicting intentions). The relationship of knowledge to behavior and attitudes was
assessed via Pearson correlations.
13
Convergence between self-reports and parent reports. The convergence between self-
and parent reports of behavior was assessed via congruence analysis of EFA loadings and by the
Pearson correlation between total scores.
Relationship of health assessments to overweight and obesity. Mean scores on the
components of the health assessment system were compared for normal weight versus overweight
and for normal weight versus obese participants by calculating the respective effect sizes. The
significance of the difference was assessed with the t-statistic.
Relationship of health assessments to grades. The relationship of the health assessment
system to student grades was calculated with zero-order and partial correlations. Partial
correlations account for gender, ethnicity (dummy-coded as White/Other, Black, and Hispanic
with White/Other as the reference group), household income, parental level of education,
industriousness, mathematics scores, and vocabulary scores.
All structural equation models (including CFA) were undertaken in LISREL (v8.8) using a
polychoric correlation matrix and asymptotic covariance matrix as input and using a diagonally
weighted least-squares estimator. The χ2 values reported thus included the Satorra-Bentler
adjustment for models calculated in this way. In interpreting fit statistics, the following set of
rough guidelines was considered, based on the range of different cut-off values for fit indexes
suggested in the structural equation modeling literature: (a) acceptable fit: root mean-squared error
of approximation (RMSEA) ≤ .08, standardized root mean square residual (SRMR) ≤ .09, and
comparative fit index (CFI) ≈ .90; (b) good fit: RMSEA ≤ .06, SRMR ≤ .09, and CFI ≥ .95
(Beauducel & Wittmann, 2005; Browne & Cudeck, 1992; Hu & Bentler, 1999; Marsh, Hau, &
Wen, 2004; McDonald & Ho, 2002).
Results
Structural Analysis of Health Knowledge
Exploratory factor analysis (EFA). For both the parent and the student knowledge test,
visual inspection of the scree plot suggested a one-factor solution. Although parallel analysis
suggested two factors for child knowledge and three factors for parent knowledge, multifactor
exploratory solutions did not make conceptual sense, so a one-factor solution was selected in each
case. For the student knowledge test, this factor accounted for 19.5% of the variation in item
scores. For the parent knowledge test, this factor accounted for 25.2% of the variation in item
14
scores. The small amount of variation explained may be due to ceiling effects of the test. Many
items appeared far too easy, especially for the parent sample (item 8 had a mean of .99 in the
parent sample, and item means ranged from .43 to .99 for parent knowledge, with three items
greater than .90).
Confirmatory factor analysis (CFA). A one-factor CFA of the student knowledge test
indicated overfitting of the model (i.e., χ2 < df): χ2 = 25.422, df = 34, RMSEA = .000 (90%
confidence interval [C.I.]: .000 to .022), CFI = 1.000, SRMR = .055, Akaike information criterion
(AIC) = 67.420. However, 3 of the 10 items did not load significantly on the factor. The seven
significantly loading items dealt with nutrition content, whereas the three nonsignificant items
dealt with sleep recommendations (one item) and exercise (two items). This outcome suggests that
health knowledge might be different for different subdomains such as exercise and diet, although
not enough items are present to test this structurally. For the parent knowledge test, a one-factor
CFA model (with item 8 excluded due to lack of variance) indicated reasonable fit to the data
(although the confidence internal for the RMSEA was very large, and the SRMR somewhat larger
than recommended rules of thumb): χ2= 39.73, df = 26, RMSEA = .039 (90% C.I.: .008 to .062),
CFI = 1.000, SRMR = .110, AIC=67.42. However, only two of the nine items loaded significantly
on the latent factor, meaning that the measurement model consists primarily of error variance. The
knowledge test seems clearly inappropriate for the parent sample, and the parent version will be
excluded from further analysis. In further analysis of the child knowledge test, a seven-item
summed score will be used (i.e., how many items out of the seven nutrition content items were
answered correctly).
Structural Analysis of Nutrition Attitudes
The fit of the nutrition attitudes items to the TpB model (shown in Figure 1) was tested
with structural equation modeling. When no cross-loadings or correlated errors were included in
the model, fit indexes were on the borderline for acceptable fit: χ2 = 560.12, df = 160,
RMSEA = .081 (90% C.I.: .074 to .089), CFI = .950, SRMR = .088, AIC = 660.12. However,
modification indexes indicated correlated error variance between several of the reverse-keyed
items, suggesting a reverse-key method factor. When a reverse-key method factor was also
modeled (constraining the loadings on the reverse-keyed factor to be equal), the model showed a
substantial improvement in fit (ΔAIC = 215.56; note that the χ2 difference test could not be used,
15
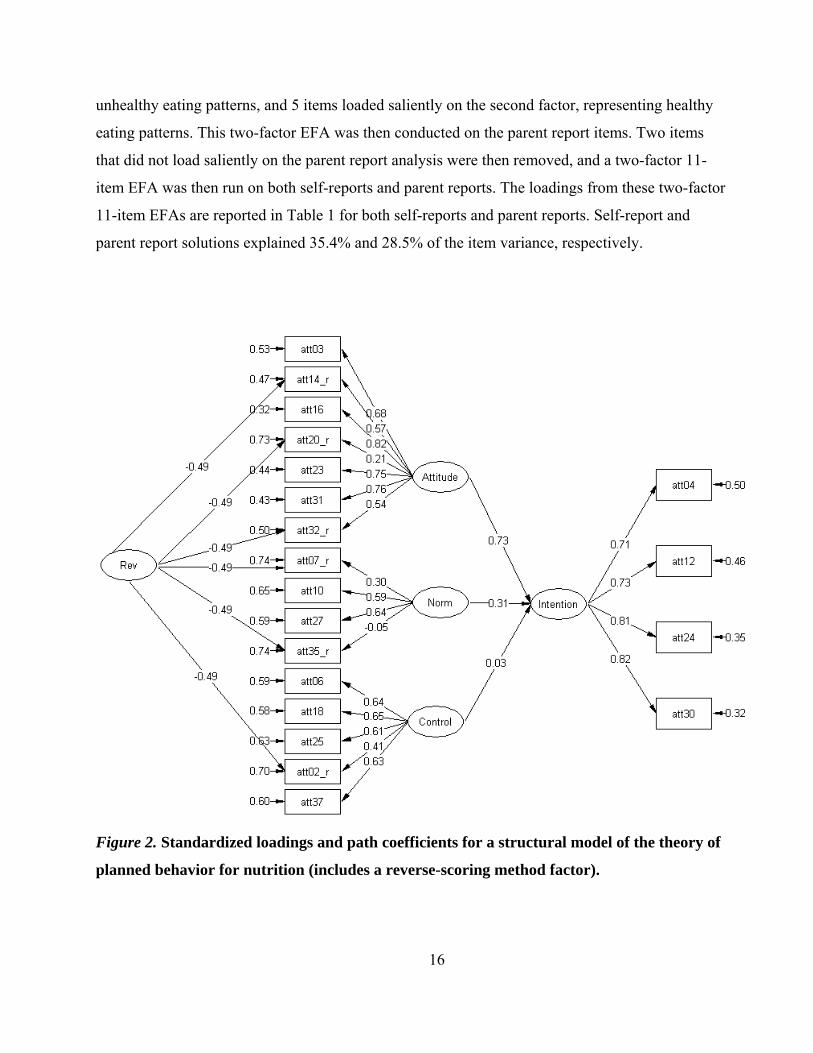
as these are not nested models). Loadings and path coefficients for this adjusted model are shown
in Figure 2. The data fit this model well: χ2 = 333.57, df = 150, RMSEA = .055 (90% C.I.: .047 to
.063), CFI = .978, SRMR = .063, AIC = 443.565. All but one of the item loadings were significant
at p < .05 (Item 35, “Kids mostly eat junk food,” did not significantly load on Norms). In all,
89.8% of the variance in Intentions was explained by Attitudes, Norms, and Control. Attitudes was
the strongest predictor of Intentions, with Norms also a significant predictor. However, Control did
not significantly predict intentions for Nutrition.
Structural Analysis of Exercise Attitudes
The same TpB theoretical model was tested for attitudes to exercise. When no cross-
loadings or correlated errors were included in the model, fit indexes indicated that the data fit the
model quite well: χ2 = 242.92, df = 125, RMSEA = .050 (90% C.I.: .040 to .059), CFI = .988,
SRMR = .059, AIC = 334.92. Although fit indexes were very good, modification indexes still
indicated substantial relationships among the error terms for reverse-keyed items. For this reason, a
reverse-scoring method factor was also included (constraining the loadings on the reverse-key
method factor to be equal, as was done for nutrition attitudes). This improved the fit of the model
(ΔAIC = 55.16, note that the χ2 difference could not be used as these are not nested models). Fit
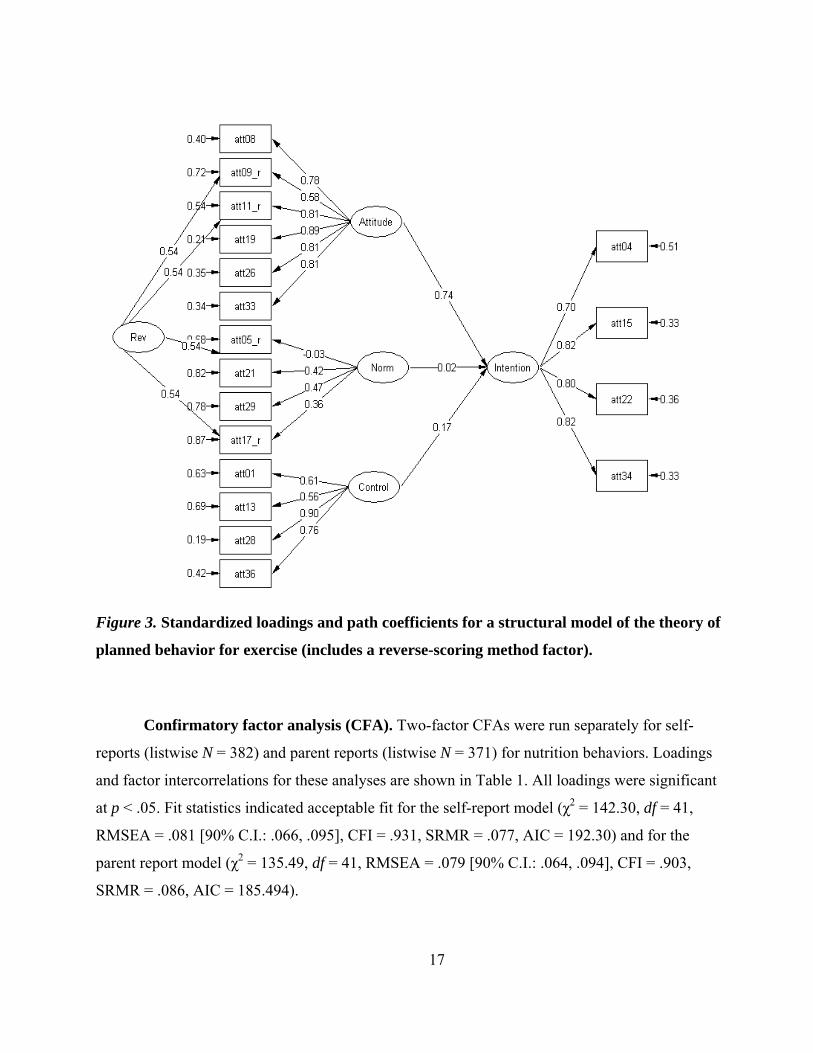
indexes for the revised model (shown in Figure 3) were also good: χ2= 177.76, df = 120, RMSEA
= .036 (90% C.I.: .024 to .047), CFI = .994, SRMR = .047, AIC=279.76. As for nutrition attitudes,
one of the reverse-coded Norms items did not load significantly on the Norms factor (Item 5,
“Most kids don’t get enough exercise”). All other loadings in the model were significant and
positive. Only Attitudes significantly predicted intentions for exercise, with paths from Norms and
Control not significantly different from zero. In total, 82.6% of the variance in Intentions was
explained by the other three components of the TpB.
Structural Analysis of Nutrition Behaviors
Exploratory factor analysis (EFA). Parallel analysis of the 18 self-reported nutrition
behaviors indicated a four-factor solution. However, a four-factor solution produced two doublet
factors (“skip a meal” and “eat less than three meals per day” defined a factor, and “drink a glass
or bottle of water” and “drink water with a meal” defined another factor). These 4 items, and
another item with a low loading on its intended factor, were removed, and a two-factor EFA was
conducted on the remaining 13 items. Eight items loaded saliently on the first factor, representing
16
unhealthy eating patterns, and 5 items loaded saliently on the second factor, representing healthy
eating patterns. This two-factor EFA was then conducted on the parent report items. Two items
that did not load saliently on the parent report analysis were then removed, and a two-factor 11-
item EFA was then run on both self-reports and parent reports. The loadings from these two-factor
11-item EFAs are reported in Table 1 for both self-reports and parent reports. Self-report and
parent report solutions explained 35.4% and 28.5% of the item variance, respectively.
Figure 2. Standardized loadings and path coefficients for a structural model of the theory of
planned behavior for nutrition (includes a reverse-scoring method factor).
17
Figure 3. Standardized loadings and path coefficients for a structural model of the theory of
planned behavior for exercise (includes a reverse-scoring method factor).
Confirmatory factor analysis (CFA). Two-factor CFAs were run separately for self-
reports (listwise N = 382) and parent reports (listwise N = 371) for nutrition behaviors. Loadings
and factor intercorrelations for these analyses are shown in Table 1. All loadings were significant
at p < .05. Fit statistics indicated acceptable fit for the self-report model (χ2 = 142.30, df = 41,
RMSEA = .081 [90% C.I.: .066, .095], CFI = .931, SRMR = .077, AIC = 192.30) and for the
parent report model (χ2 = 135.49, df = 41, RMSEA = .079 [90% C.I.: .064, .094], CFI = .903,
SRMR = .086, AIC = 185.494).
18
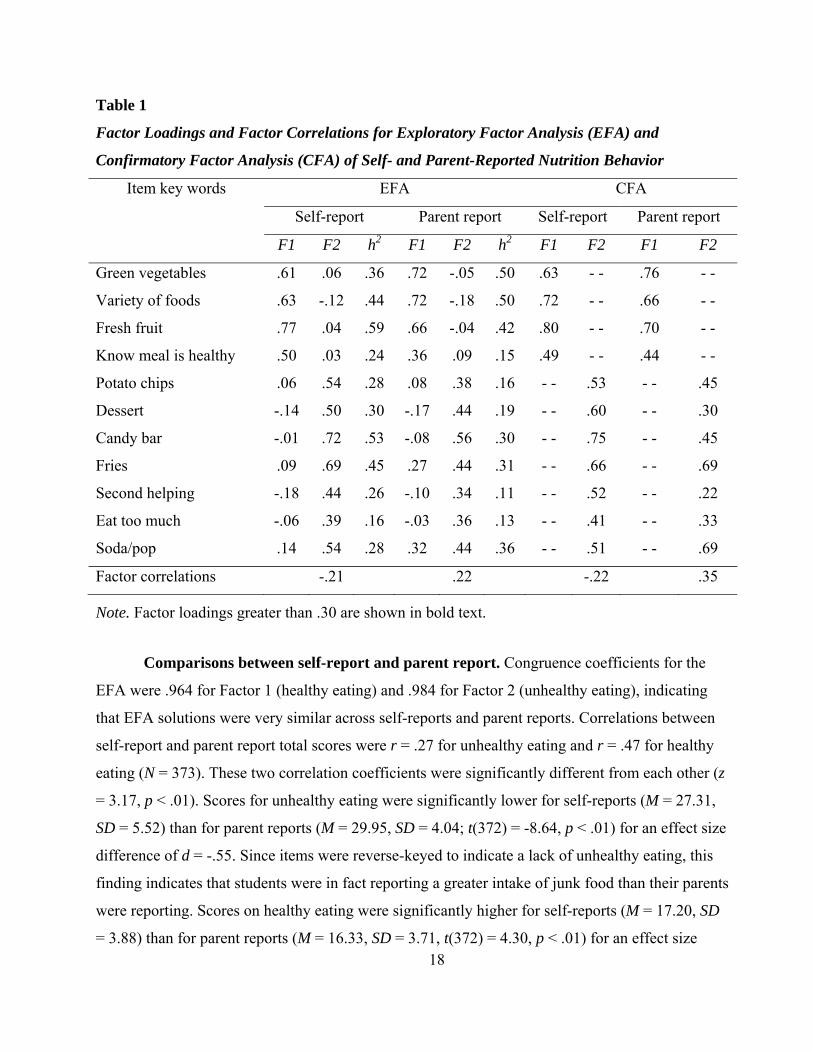
Table 1
Factor Loadings and Factor Correlations for Exploratory Factor Analysis (EFA) and
Confirmatory Factor Analysis (CFA) of Self- and Parent-Reported Nutrition Behavior
Item key words EFA CFA
Self-report Parent report Self-report Parent report
F1 F2 h2 F1 F2 h2 F1 F2 F1 F2
Green vegetables .61 .06 .36 .72 -.05 .50 .63 - - .76 - -
Variety of foods .63 -.12 .44 .72 -.18 .50 .72 - - .66 - -
Fresh fruit .77 .04 .59 .66 -.04 .42 .80 - - .70 - -
Know meal is healthy .50 .03 .24 .36 .09 .15 .49 - - .44 - -
Potato chips .06 .54 .28 .08 .38 .16 - - .53 - - .45
Dessert -.14 .50 .30 -.17 .44 .19 - - .60 - - .30
Candy bar -.01 .72 .53 -.08 .56 .30 - - .75 - - .45
Fries .09 .69 .45 .27 .44 .31 - - .66 - - .69
Second helping -.18 .44 .26 -.10 .34 .11 - - .52 - - .22
Eat too much -.06 .39 .16 -.03 .36 .13 - - .41 - - .33
Soda/pop .14 .54 .28 .32 .44 .36 - - .51 - - .69
Factor correlations -.21 .22 -.22 .35
Note. Factor loadings greater than .30 are shown in bold text.
Comparisons between self-report and parent report. Congruence coefficients for the
EFA were .964 for Factor 1 (healthy eating) and .984 for Factor 2 (unhealthy eating), indicating
that EFA solutions were very similar across self-reports and parent reports. Correlations between
self-report and parent report total scores were r = .27 for unhealthy eating and r = .47 for healthy
eating (N = 373). These two correlation coefficients were significantly different from each other (z
= 3.17, p < .01). Scores for unhealthy eating were significantly lower for self-reports (M = 27.31,
SD = 5.52) than for parent reports (M = 29.95, SD = 4.04; t(372) = -8.64, p < .01) for an effect size
difference of d = -.55. Since items were reverse-keyed to indicate a lack of unhealthy eating, this
finding indicates that students were in fact reporting a greater intake of junk food than their parents
were reporting. Scores on healthy eating were significantly higher for self-reports (M = 17.20, SD
= 3.88) than for parent reports (M = 16.33, SD = 3.71, t(372) = 4.30, p < .01) for an effect size
19
difference of d = .23, potentially suggesting response distortion for self-reports. Given that the
factor structure is virtually the same in self-report and parent report formats, parent-reported
behaviors will be used in further analysis (both to avoid using self-reports for the predictor and
criterion variable set, and due to the possibility of response distortion in self-report data).
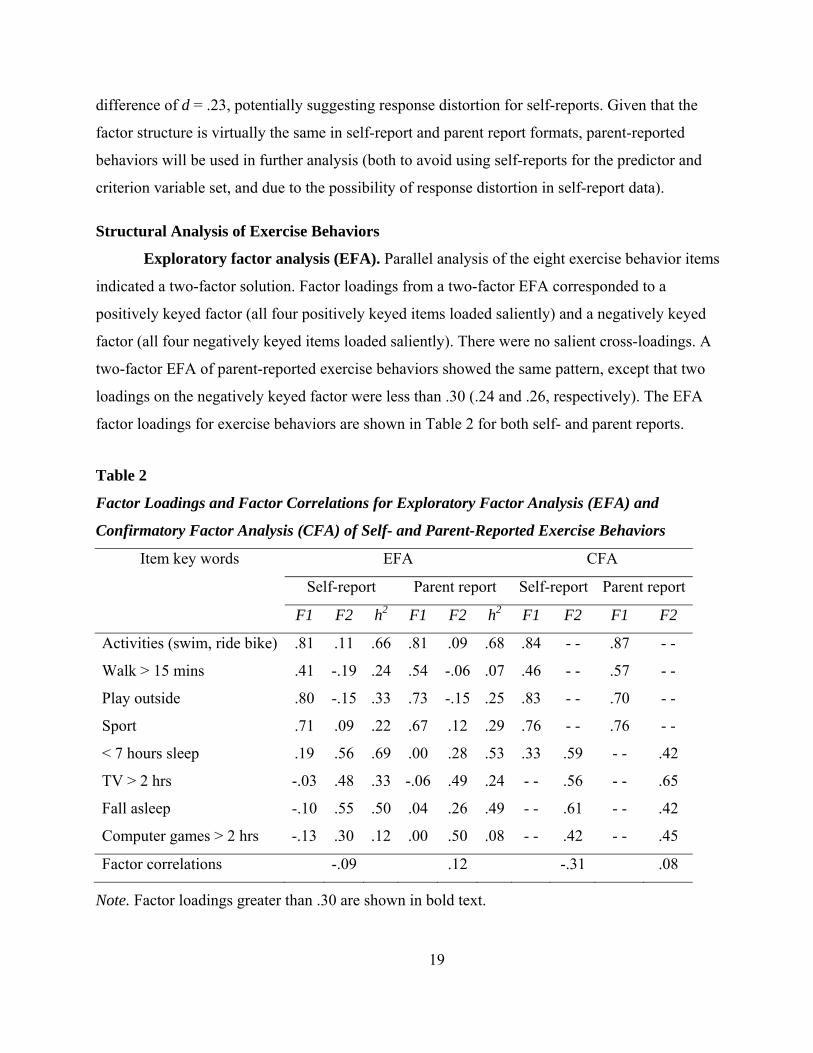
Structural Analysis of Exercise Behaviors
Exploratory factor analysis (EFA). Parallel analysis of the eight exercise behavior items
indicated a two-factor solution. Factor loadings from a two-factor EFA corresponded to a
positively keyed factor (all four positively keyed items loaded saliently) and a negatively keyed
factor (all four negatively keyed items loaded saliently). There were no salient cross-loadings. A
two-factor EFA of parent-reported exercise behaviors showed the same pattern, except that two
loadings on the negatively keyed factor were less than .30 (.24 and .26, respectively). The EFA
factor loadings for exercise behaviors are shown in Table 2 for both self- and parent reports.
Table 2
Factor Loadings and Factor Correlations for Exploratory Factor Analysis (EFA) and
Confirmatory Factor Analysis (CFA) of Self- and Parent-Reported Exercise Behaviors
Item key words EFA CFA
Self-report Parent report Self-report Parent report
F1 F2 h2 F1 F2 h2 F1 F2 F1 F2
Activities (swim, ride bike) .81 .11 .66 .81 .09 .68 .84 - - .87 - -
Walk > 15 mins .41 -.19 .24 .54 -.06 .07 .46 - - .57 - -
Play outside .80 -.15 .33 .73 -.15 .25 .83 - - .70 - -
Sport .71 .09 .22 .67 .12 .29 .76 - - .76 - -
< 7 hours sleep .19 .56 .69 .00 .28 .53 .33 .59 - - .42
TV > 2 hrs -.03 .48 .33 -.06 .49 .24 - - .56 - - .65
Fall asleep -.10 .55 .50 .04 .26 .49 - - .61 - - .42
Computer games > 2 hrs -.13 .30 .12 .00 .50 .08 - - .42 - - .45
Factor correlations -.09 .12 -.31 .08
Note. Factor loadings greater than .30 are shown in bold text.
20
Confirmatory factor analysis (CFA). CFA factor loadings for exercise behaviors are also
shown in Table 2. A two-factor CFA solution for self-reports demonstrated fit indexes slightly
below typical rules of thumb for good fit (χ2 = 74.715, df = 17, RMSEA = .094 [90% C.I.: .073,
.117], CFI = .938, SRMR = .091, AIC = 112.715). Modification indexes indicated a cross-loading
would significantly improve the fit of the model. When such a solution was trialed, the cross-
loading was salient and significant (see Table 2) and the fit improved to an acceptable level (χ2 =
53.351, df = 16, RMSEA = .078 [90% C.I.: .056, .102], CFI = .960, SRMR = .071, AIC = 72.000).
For the parent solution, fit was acceptable without this cross-loading and modification indexes did
not suggest that such a cross-loading needed to be added (χ2 = 56.564, df = 17, RMSEA = .078
[90% C.I.: .057, .103], CFI = .947, SRMR = .077, AIC = 94.564).
Comparisons between self-report and parent report. Congruence coefficients for the
EFA were .976 for Factor 1 (exercising) and .887 for Factor 2 (sedentary behaviors), indicating
that EFA solutions were congruent across self- and parent reports for exercise but were slightly
different for sedentary behaviors. Correlations between self- and parent-reported total scores were
r = .47 for sedentary behaviors and r = .48 for exercising (N = 373). Sedentary behavior scores
were significantly lower for self-reports (M = 16.52, SD = 3.69) than for parent reports (M = 17.80,
SD = 2.67; t(372) = -7.30, p < .01) for an effect size difference of d = -.40. Because sedentary
behavior items were reverse-keyed, students reported more frequent engagement in sedentary
behavior than was reported by their parents. Exercising scores were significantly higher for self-
reports (M = 17.44, SD = 4.44) than for parent reports (M = 15.90, SD = 4.53, t(372) = 6.48, p <
.01) for an effect size difference of d = .34, potentially indicating response distortion in the self-
reported data. As for nutrition, parent reports of exercise and sedentary behaviors will be used in
further analysis.
Relationship Between Attitudes and Behaviors
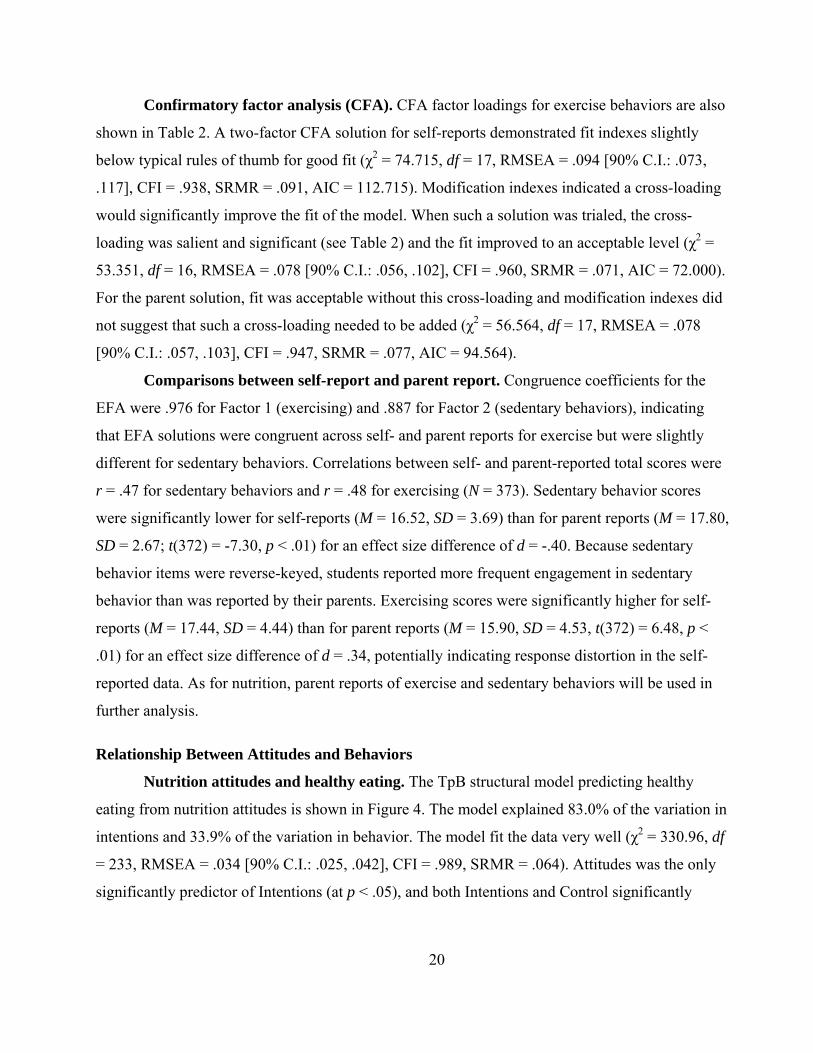
Nutrition attitudes and healthy eating. The TpB structural model predicting healthy
eating from nutrition attitudes is shown in Figure 4. The model explained 83.0% of the variation in
intentions and 33.9% of the variation in behavior. The model fit the data very well (χ2 = 330.96, df
= 233, RMSEA = .034 [90% C.I.: .025, .042], CFI = .989, SRMR = .064). Attitudes was the only
significantly predictor of Intentions (at p < .05), and both Intentions and Control significantly
21
predicted behavior. However, Control showed a negative relationship with Behavior, whereas the
TpB model posited a positive link (i.e., greater control should lead to more healthy eating).
Figure 4. Standardized loadings and path coefficients for a model predicting parent-reported
healthy eating behaviors from attitudes to nutrition according to the theory of planned
behavior (includes a reverse-scoring method factor).
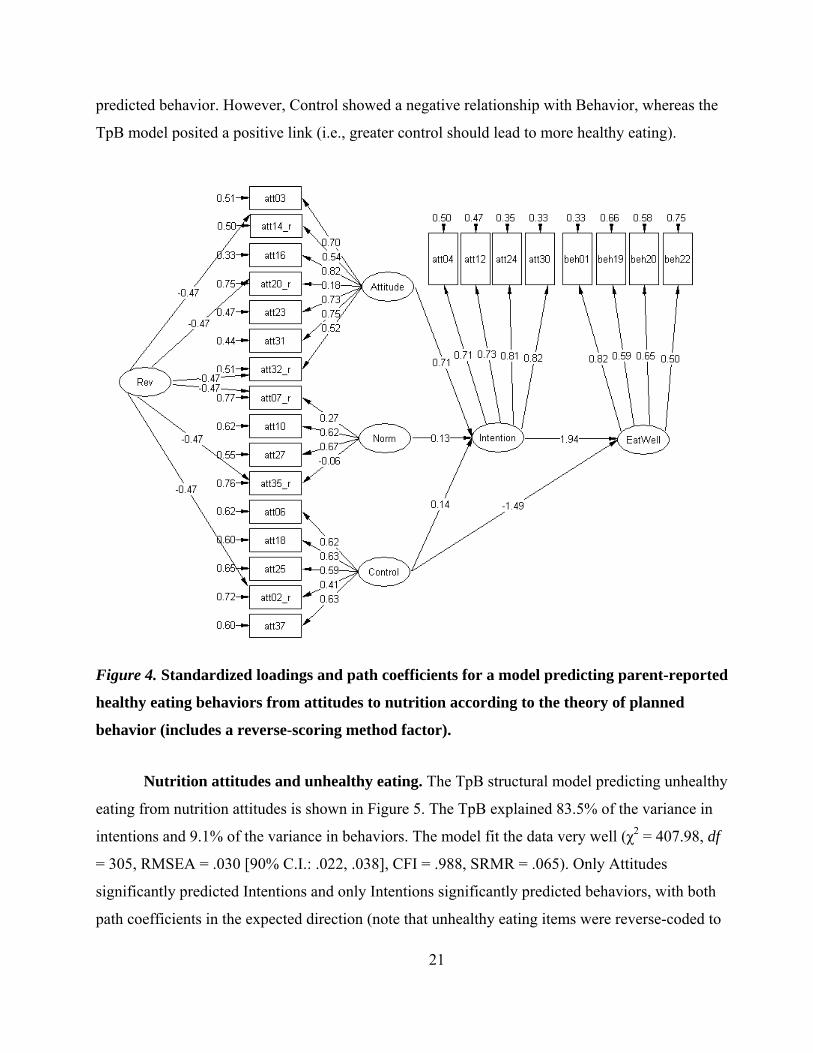
Nutrition attitudes and unhealthy eating. The TpB structural model predicting unhealthy
eating from nutrition attitudes is shown in Figure 5. The TpB explained 83.5% of the variance in
intentions and 9.1% of the variance in behaviors. The model fit the data very well (χ2 = 407.98, df
= 305, RMSEA = .030 [90% C.I.: .022, .038], CFI = .988, SRMR = .065). Only Attitudes
significantly predicted Intentions and only Intentions significantly predicted behaviors, with both
path coefficients in the expected direction (note that unhealthy eating items were reverse-coded to
22
represent lack of unhealthy eating). As in the previous model, the path from Control to Behavior
was negative (although not significant in this case)
Figure 5. Standardized loadings and path coefficients for a model predicting parent-reported
unhealthy eating behaviors from attitudes to nutrition according to the theory of planned
behavior (includes a reverse-scoring method factor).
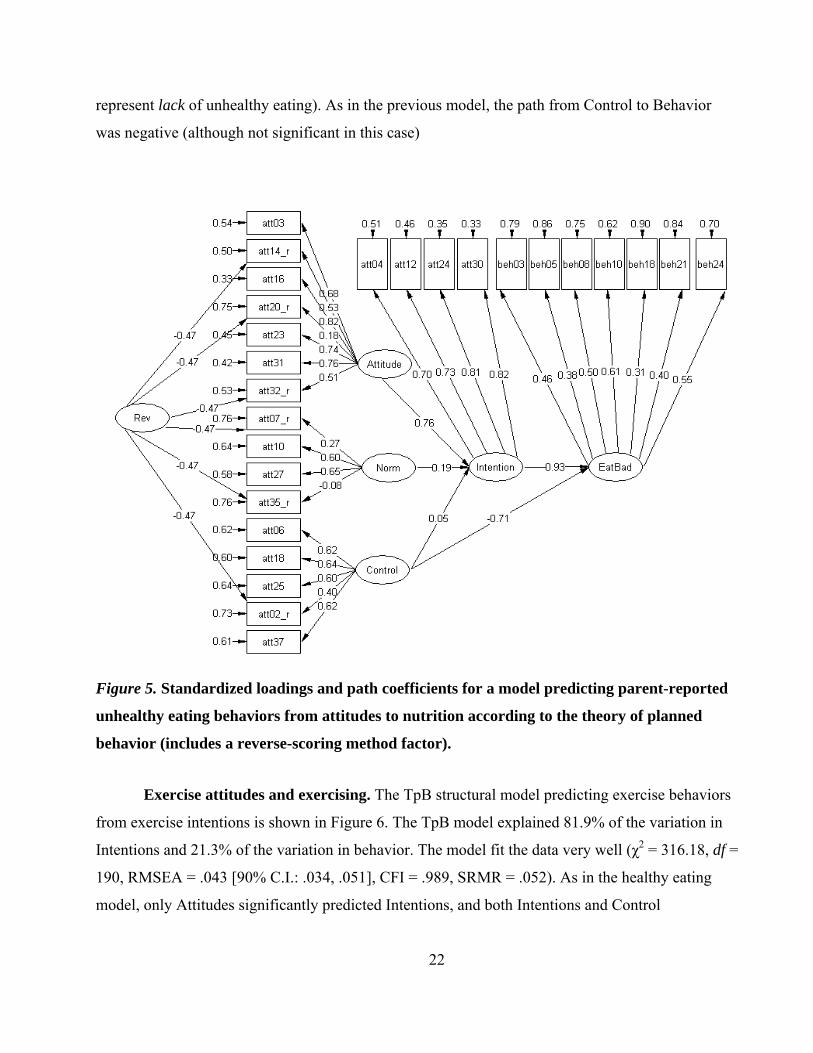
Exercise attitudes and exercising. The TpB structural model predicting exercise behaviors
from exercise intentions is shown in Figure 6. The TpB model explained 81.9% of the variation in
Intentions and 21.3% of the variation in behavior. The model fit the data very well (χ2 = 316.18, df =
190, RMSEA = .043 [90% C.I.: .034, .051], CFI = .989, SRMR = .052). As in the healthy eating
model, only Attitudes significantly predicted Intentions, and both Intentions and Control
23
significantly predicted behavior. However, the path from Control to Behavior was again in the
opposite direction to expectations (i.e., more control predicted significantly less exercise).
Figure 6. Standardized loadings and path coefficients for a model predicting parent-reported
exercise behaviors from attitudes to exercise according to the theory of planned behavior
(includes a reverse-scoring method factor).
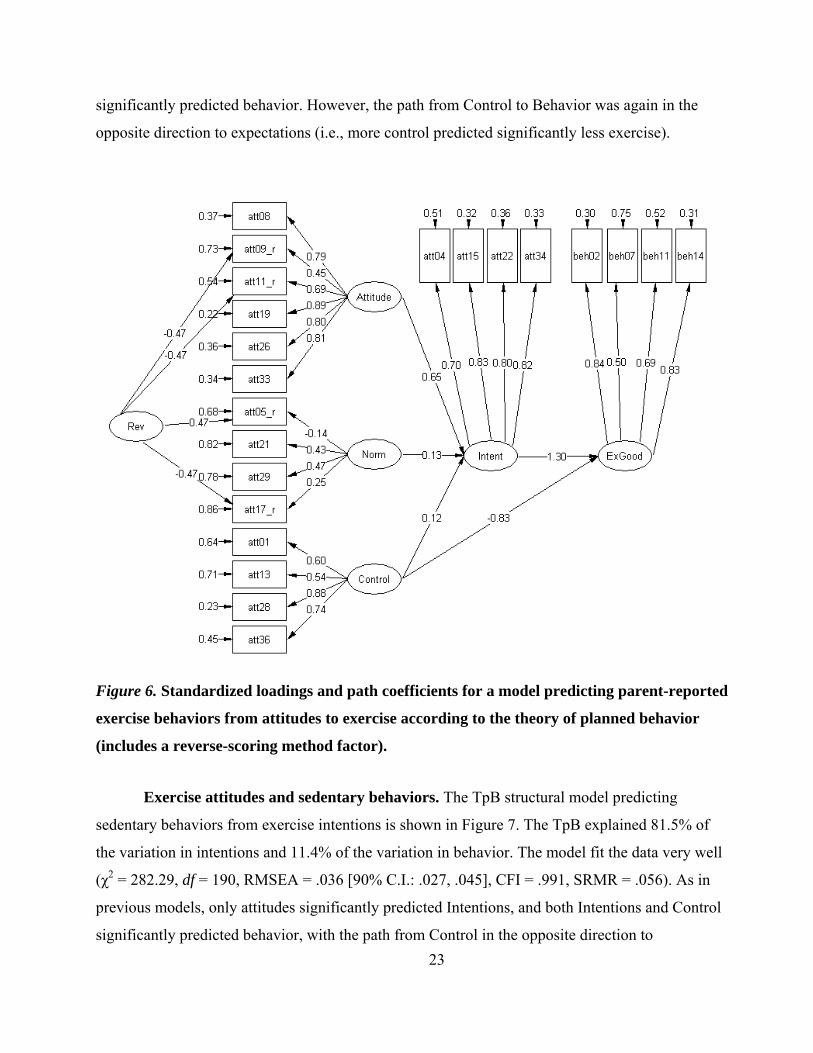
Exercise attitudes and sedentary behaviors. The TpB structural model predicting
sedentary behaviors from exercise intentions is shown in Figure 7. The TpB explained 81.5% of
the variation in intentions and 11.4% of the variation in behavior. The model fit the data very well
(χ2 = 282.29, df = 190, RMSEA = .036 [90% C.I.: .027, .045], CFI = .991, SRMR = .056). As in
previous models, only attitudes significantly predicted Intentions, and both Intentions and Control
significantly predicted behavior, with the path from Control in the opposite direction to
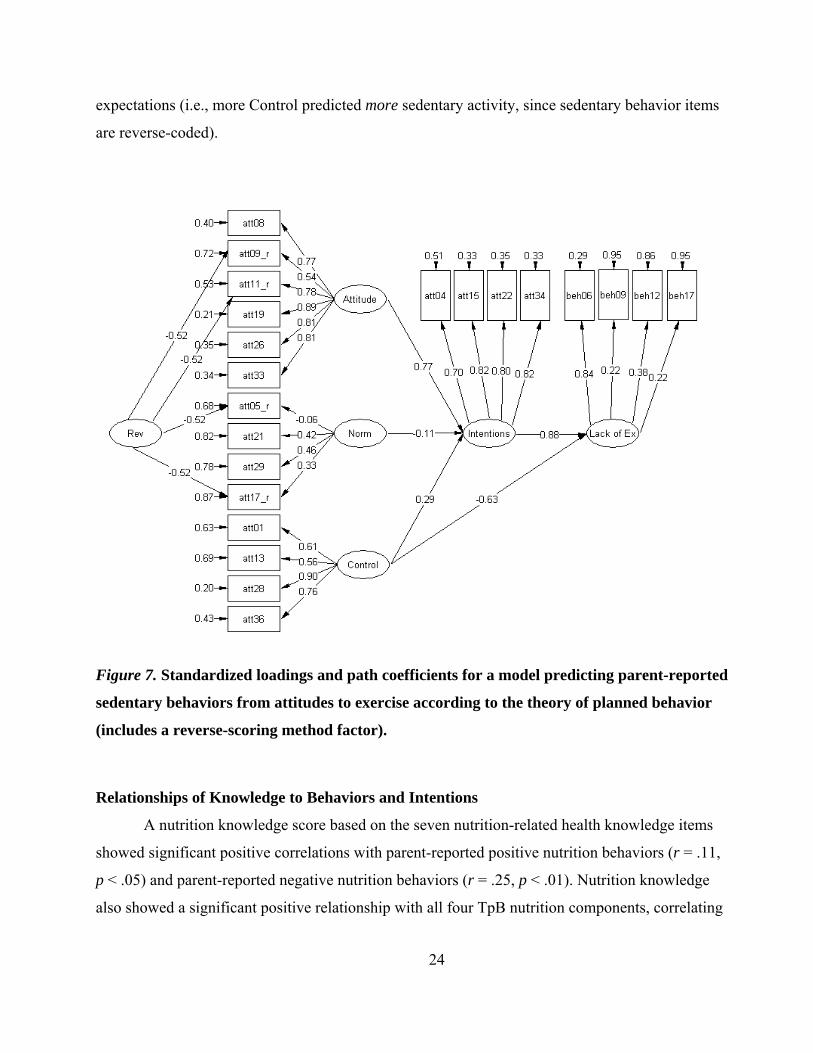
24
expectations (i.e., more Control predicted more sedentary activity, since sedentary behavior items
are reverse-coded).
Figure 7. Standardized loadings and path coefficients for a model predicting parent-reported
sedentary behaviors from attitudes to exercise according to the theory of planned behavior
(includes a reverse-scoring method factor).
Relationships of Knowledge to Behaviors and Intentions
A nutrition knowledge score based on the seven nutrition-related health knowledge items
showed significant positive correlations with parent-reported positive nutrition behaviors (r = .11,
p < .05) and parent-reported negative nutrition behaviors (r = .25, p < .01). Nutrition knowledge
also showed a significant positive relationship with all four TpB nutrition components, correlating
25
at .11, .22, .13, and .19 with Intentions, Attitudes, Norms, and Control respectively (p < .05 for all
four components).
Descriptive Statistics for the Health Assessment System
Reliability and descriptive statistics for the health assessment system (knowledge, attitudes,
and behaviors) are shown in Table 3. Internal consistency for the seven-item nutrition knowledge
assessment was quite low (.39), as might be expected from a seven-item measure. The internal
consistency of the norms scales (for both nutrition and exercise) was also low, probably due to the
two problematic items uncovered in structural analysis (“Kids mostly eat junk food” and “Most
kids don’t get enough exercise”), as well as the potential effect of the reverse-key method factor.
Other attitudes scales showed reasonable internal consistency, with the exception of nutrition
intentions (where a fairly low reliability was .53 was primarily due to the one reverse-keyed item
in the scale, which showed a very low item-total correlation). The negative behavior scales showed
lower reliability than the positive behavior scales. Means and standard deviations indicated a
reasonable degree of variability and no concerns regarding ceiling or floor effects.
Gender Differences on the Health Assessment System
Gender differences on the health assessment system are shown in Table 3. Gender
differences in behaviors were in the expected direction for three of the four cases: Females showed
significantly healthier eating and significantly less unhealthy eating, whereas males showed
significantly more frequent exercise. However, females spent significantly less time in sedentary
activities than males, where the opposite effect was hypothesized. This result may be due to the
item regarding computer gaming, as it is known that adolescent males spend more time on
computer gaming than females (Van den Bulck, 2004). No significant gender differences were
displayed on nutrition knowledge or exercise attitudes. However, females had significantly higher
scores on the nutrition attitudes, subjective norms, and perceived behavioral control TpB
components, as hypothesized. No significant differences occurred in the TpB attitudes to exercise.
All gender differences are of small to medium effect size (Cohen, 1988).
26
Table 3
Reliability, Descriptive Statistics, Mean Differences by Sex and by Weight Category, and
Correlation With Report Card Grades for the Health Assessment System
N # items α Mean SD Mean differences
(effect sizes)
Correlation
with grades
Gender Overweight Obese Zero Partiala
Knowledge 358 7 .39 3.81 1.56 -.17 .11 .31 .20* .07
TpB Nutrition
Attitudes 380 4 .77 26.44 4.16 -.38** .04 .35 .36** .22**
Norms 382 4 .42 11.66 2.25 -.24* .34** .46** .34** .23**
Control 382 5 .77 15.53 2.27 -.24* -.10 .15 .21** .08
Intentions 382 7 .53 19.55 3.13 -.02 .11 .25 .36** .27**
TpB exercise
Attitudes 382 4 .76 24.11 3.73 .03 .16 .50** .21** .11
Norms 382 4 .00 13.39 1.79 .01 -.03 -.12 .26** .22**
Control 382 4 .72 16.56 2.34 .09 .07 .25 .18* .12
Intentions 382 6 .82 15.86 2.85 .14 .25* .37* .19* .12
Nutrition behavior
Healthy Eating 373 4 .70 16.33 3.71 -.35** .06 .36* .35** .24**
Unhealthy eating 373 7 .60 29.95 4.04 -.38** .32** .57** .18* .10
Exercise behavior
Exercise 372 4 .77 15.90 4.53 .35** .38** .67** .08 .12
Sedentary 373 4 .42 17.80 2.67 -.50** .30* .45* .26** .17*
Note. TpB = theory of planned behavior; effect sizes = mean difference/pooled SD (accounting for sample size of the two groups), with males and normal weight as reference groups, such that negative values indicate higher scores for female, overweight, or obese participants. Underweight students are excluded from analyses, and the category overweight includes the obese students. aPartial correlations with grades control for household income, parent education, scores on vocabulary and mathematics tests, ethnicity (dummy-coded with categories non-White Hispanic, Black, and White/Other), gender, and industriousness scores. All covariates except for gender and the White/Black dummy variable correlated significantly with grades. Cases with missing data were deleted listwise such that N=168 for both zero-order and partial correlations.
* p < .05, ** p < .01 (significance for effect size from t-test for difference in means).
27
Weight Differences on the Health Assessment System
Mean differences in scores on the health assessment system variables (knowledge,
attitudes, and behaviors) for normal weight versus overweight and normal weight versus obese
participants are shown in Table 3 as effect sizes (i.e., the fraction of a standard deviation by which
groups differ). No significant differences were apparent on nutrition knowledge for overweight or
obese participants. Overweight participants had significantly less positive nutrition norms, and
lower exercise intentions, and showed unhealthier eating, less exercising, and more sedentary
behavior. These differences were of small to moderate magnitude (about a third of a standard
deviation), with the largest difference for exercising. Obese participants showed these same
differences from normal weight individuals and also showed poorer exercise attitudes and less
frequent healthy eating. Effect sizes were stronger for obese than overweight participants. The
strongest effect sizes were for unhealthy eating (d = 0.57) and for exercise (d = 0.67), suggesting
that unhealthy eating and lack of exercise may be more important factors in obesity than a lack of
healthy eating or sedentary behavior. Generally, results indicate some validity evidence for the
health assessment system, as it distinguishes between healthy weight students and overweight and
obese students.
Relationship of the Health Assessment System to Achievement at School
The correlations between the components of the health assessment system and parent-
reported school grades are given in Table 3 (partial correlations after controlling for gender,
ethnicity, SES, vocabulary and math ability, and industriousness are also provided). Before
controlling for covariates, all components of the health assessment system except exercising
related significantly to school grades, with small to moderate effect sizes. After controlling for
covariates, nutrition knowledge no longer significantly related to school grades. However, three of
the TpB nutrition components (attitudes, subjective norms, and intentions) and one of the TpB
exercise components (subjective norms) related to school grades. Eating healthily and (lack of)
sedentary behaviors were also significantly correlated with school grades.
Discussion
The broad aim of this paper was to explore whether the K-A-B health assessments were
psychometrically strong enough or practically useful enough to be included in the WHAMI
assessment and feedback suite. Although some psychometric shortcomings indicate that some of
28
the instruments will require further modification before operational use, results suggest that the
assessment of health-related constructs can feasibly be undertaken at this age group and that scores
meaningfully relate to health outcomes (i.e., obesity) and to student achievement. In the passages
that follow, results are discussed in terms of the nine experimental hypotheses (with the numbers
in the subtitle corresponding to each hypothesis).
1. The Health Knowledge Assessment Is Not Unidimensional
The health knowledge assessment component did not appear to be unidimensional, as
hypothesized. Parallel analysis suggested several factors, and results from the reported CFA
suggest that the various content domains (i.e., nutrition, exercise, and sleep habits) may form
separate factors. The small number of items and subsequent low internal consistency of the scale
prevented a full examination of the possible structure (with less than three items to assess
knowledge of sleep habits or exercise, structural analyses of these factors appeared inappropriate).
Despite low reliability, nutrition knowledge did relate to nutrition behavior and attitudes,
suggesting that the concept is meaningful. Clearly, however, further scale development is requisite
if the system is to go operational (e.g., lengthening the scale in order to increase reliability).
2. Attitudes Conform to the TpB Structure
For both nutrition and exercise attitudes, the data fit the TpB model well, with components
explaining between 83% and 90% of the variation in intentions. The variation in intentions
explained is a great deal higher than the 34% reported in previous meta-analysis of the TpB and
health behaviors, suggesting that there is little variation in intentions not explained by the other
factors (Godin & Kok, 1996). Perceived behavioral control did not significantly predict intentions
for either nutrition or exercise, replicating Armitage and Conner’s (1999) results for fat
consumption intentions. In addition, the subjective norms component of the TpB model did not
significantly predict exercise intentions and showed only a small relationship (.17) to nutrition
intentions. As in previous research studies, the attitudes component was the strongest predictor of
intentions for both exercise and nutrition. In combination with the very high amount of variation in
intentions explained by the model and the minimal contribution of the other two TpB components,
strong prediction of intentions by attitudes implies that attitudes and intentions are virtually
synonymous in this sample. The different components of the TpB system are discussed separately
below.
29
Subjective norms. Items assessing subjective norms for exercise appear psychometrically
problematic. Although three of the four items loaded significantly on the latent factor, near zero
alpha reliability suggested that the scale lacked internal consistency. As such, the lack of
relationship with exercise intentions may have represented a lack of reliability rather than a lack of
relationship between constructs. However, the lack of internal consistency may be due to the effect
of the reverse-keyed items included in the subjective norms scale. Benson and Hocevar (1985)
found that reliability of attitudes scales in elementary school children was much lower when
reverse-keyed items were included with positively keyed items. In the current study, the
improvement in fit statistics when a reverse-key method factor was modeled suggests that reverse-
keyed items impact the measurement of attitudes in this study. The only fully mixed scales (those
with 50% positively- and 50% negatively-keyed items) in the attitudes assessments constructed for
this study are the two subjective norms scales, which also have the two lowest alpha reliabilities.
As such, the low reliability and correspondingly low criterion correlations of the subjective norms
scales may be related to the inclusion of reverse-keyed items.
Perceived behavioral control. By contrast, the reliability of perceived behavioral control
was reasonable for both exercise and nutrition, ruling this out as a possible explanation for the lack
of relationship with intentions or behavior. According to Ajzen (2006), perceived behavioral
control consists of two aspects: capability, which refers to how difficult one believes the behavior
would be, and controllability, which refers to whether an individual feels performing the behavior
is or is not up to him or her. Both of these aspects might differ for 13-year-olds compared to adults.
First, both actual and perceived controllability might feasibly be lower for young adolescents than
for adults. Whereas adults tend to shop for their own groceries, prepare their own meals, and have
no mandated physical education components as part of their working week, middle school students
frequently have compulsory physical education classes as part of a school curriculum and are
much less likely to be responsible for grocery shopping or preparation of meals. Second,
evaluating one’s capabilities is a metacognitive task that children do not engage in as frequently as
adults (Flavell, 1979), such that decisions regarding capability may be less likely to guide
children’s decisions to act (i.e., perceived control would be less likely to relate to intentions). For
these reasons, perceived behavioral control may be a less influential factor in adolescents than in
adults.
30
Attitudes. Attitudes were by far the strongest predictor of intentions. In fact, the
strength of the attitude-intention relationship, combined with the very large amount of variation
in intention explained (greater than 80% in all models examined), suggests that attitudes could
be considered virtually equivalent to intentions in this sample. At this age, liking or valuing a
behavior may be a sufficient explanation for intentions to perform the behavior, with no
involvement of intervening thought processes such as evaluating capability, controllability, or
the expectations of others. Impulsivity is known to linearly decline from age 10 to age 30
(Steinberg et al., 2008), such that additional thought processes guiding intention formation may
be introduced as part of developmental increases of impulse control. That is, longer and more
complex models of intention formation may be introduced in line with a greater amount of time
for deliberation on an initial impulse.
3. Health Behaviors Have a Bifactor Structure
As hypothesized, a two-factor structure for nutrition behaviors and for exercise behaviors
was found for health behaviors, echoing the distinction between health-enhancing and health-
degenerating factors found in previous literatures (e.g., Aarø et al., 1995; Nutbeam et al., 1991).
However, this polarity may reflect a method effect of reverse-keyed items rather than content
concerns (healthy behaviors versus unhealthy behaviors). Several researchers have noted that
reverse-keyed items may form a separate factor even when measuring identical constructs to
positively keyed items (Eisenbach & Schriesheim, 1995; Marsh, 1996; Pilotte & Gable, 1990).
Two main findings support the interpretation of negative health behaviors as a reverse-key method
factor. First, a reverse-key method factor was found for attitudes in this sample. Second, the
negative behavior factors did not seem to be either as valid or as reliable as the positive factors:
Compared to positive behavior scales, the negative behavior scales had lower reliability and less
variation explained by attitudes, and (for exercise but not nutrition) they showed a lower
correlation between self- and parent reports.
4. Attitudes Predict Behaviors
Generally, the TpB model of attitudes predicted a significant and reasonably large amount
of variance in behaviors for both exercise and nutrition. However, much more variation was
explained for positive behaviors (34% and 21%) than for negative behaviors (9% and 11%),
supporting the idea that negative behavior factors might represent method rather than content
31
variance. The prediction of behavior departed from the theoretical TpB model in one primary way:
The path from perceived behavioral control to behavior was negative. After accounting for
intentions, greater control was associated with less positive behaviors and more negative
behaviors. Again, this finding may relate to the age of the students and the corresponding level of
external control over their behavior. That is, 13-year-olds who perceive that they have little control
over their diet and exercise may have little control because these factors are determined by parents,
teachers, and other authority figures (who make the student eat reasonably healthy food and ensure
they receive sufficient exercise). As such, 13-year-olds who correctly perceive that they have little
control over diet and exercise may actually have better diets and more frequent exercise. This
phenomenon of a negative influence of control among adolescents has previously been reported for
TpB modeling of attitudes toward mathematics predicting mathematics achievement (Lipnevich,
MacCann, Krumm, Burrus, & Roberts, 2009). Perceived behavioral control also showed no
significant relationship with weight status or with students’ grades (after accounting for
covariates), reinforcing the idea that perceptions of control may not be an important factor for
determining behavior in this age group.
5. Knowledge Relates to Attitudes and Behaviors
The nutrition knowledge scale was significantly correlated with all TpB nutrition
components as well as both healthy and unhealthy eating patterns. Although correlations were
small, they may have been attenuated due to the low reliability of the nutrition knowledge scale.
Nevertheless, the consistent positive and significant relationship augurs well for the nutrition
knowledge measure, pending further scale development.
6. Self- and Parent Reports of Behaviors Are Correlated and Similarly Structured
Correlations between self- and parent reports of behavior were in the expected range of
about r = .50 for three of the scales, but they were substantially lower for unhealthy eating (i.e., the
negative component of food consumption behaviors). However, congruence coefficients were
within the recommended guidelines for unhealthy eating, as well as for both of the positive
behavior scales: Healthy eating and exercising (Lorenzo-Seva & ten Berge, 2006). The sedentary
behavior scale showed a slightly lower congruence coefficient, indicating a slightly different
structure for parent report compared to self-report. Taken together, results provide greater evidence
for the validity of the positively keyed than negatively keyed behavior scales. In addition, mean
32
score differences between self-reports and parent reports were unusual for the negatively keyed but
not positively keyed scales. Specifically, students reported more frequent healthy eating, exercise,
unhealthy eating, and sedentary behaviors than their parents, where impression management by
students would have resulted in less frequent reporting of unhealthy eating and sedentary behaviors
(and no response distortion would have resulted in minimal or no difference). Such a result
emphasizes the difficulty that students in this age group may have with understanding reverse-
keyed items.
7. Gender Differences Are Consistent With Previous Research
Sex differences in the health assessments were mainly as hypothesized. Where gender
differences were found, girls were superior on nutrition and boys on exercise. Aside from
sedentary behaviors (which showed some validity problems, as outlined in the previous section),
girls showed better nutrition behaviors, as well as better nutrition attitudes, whereas boys showed
better exercise behaviors. Girls also had nonsignificantly higher scores on nutrition knowledge
(though the small effect size and corresponding nonsignificance may be due to low reliability of
the knowledge assessment). As such, results provide some evidence of validity for the scores
obtained from the health assessment system and also point to the importance of group differences
for the design of intervention programs. Since boys have poorer nutrition behaviors and attitudes,
interventions targeting nutrition attitudes may be most effective for boys (who generally have
higher prevalence of overweight than girls [Ogden et al., 2002]). Conversely, interventions
designed for girls might be more effective if they targeted physical activity rather than changes to
diet.
Gender differences in the structure of the TpB and the relationship of the health assessment
system to different criteria were not examined in this study due to the limitations of sample size for
structural equation modeling of ordinal data. However, it is feasible that the TpB structure may not
be equivalent across gender, especially given mean differences on most of the nutrition
components. Further research examining the structural invariance of the TpB models would be
useful to determine the most important factors for intention formation for boys and girls, or in
other groups (e.g., age groups, ethnicity). Such information would be important for tailoring any
intervention programs or feedback to different groups.
33
8. The Health Assessment System Distinguishes Normal Weight From Overweight and Obese
Individuals
In general, Hypothesis 8 (that the health assessments would relate to overweight
prevalence) was supported, although results differed for different health components. Knowledge
did not significantly relate to overweight or obesity, although this finding might again be due to the
test’s low reliability. In fact, the two components that most strongly distinguished between obese
and normal weight individuals were behavioral: unhealthy eating and exercising. Although the
separation of food consumption behaviors into positive and negative components might be partly
due to method variance (i.e., unhealthy eating is a reverse-key method effect), the strong
relationship between unhealthy eating and obesity provides evidence for the utility of the
unhealthy eating scale.
With regard to the TpB dimensions, different components distinguished between obese and
normal weight students for nutrition compared to exercise. For nutrition, subjective norms were
significantly higher for normal weight than overweight or obese individuals. For exercise,
subjective norms showed no significant difference, but attitudes and intentions were significantly
higher for normal weight than for overweight and obese individuals. Given that attitudes and
intentions predicted exercise behavior, and that exercising showed the strongest links with obesity,
it seems that attitudes and intentions to exercise may be the most useful components to target in
any attempt at intervention. One way to change attitudes would be to introduce new knowledge
about the importance of exercise, thus improving the instrumental attitudes toward exercise (which
may prove especially important for girls). Such an application has particular relevance for the
WHAMI system, which could easily incorporate pamphlets or information packages into the
existing protocol. Increasing the intrinsic attitudes toward exercise could occur via positive
reappraisal of exercise (e.g., that gym class is an opportunity to play with friends or to work out to
become strong, rather than the possibility of becoming injured or the irritation of becoming
sweaty), positive role models for exercising (e.g., sports stars, well-known actors, or musicians
who work out), or suggestions for making exercise more enjoyable (e.g., tailoring exercise to one’s
likes and dislikes, considering exercise as a friendly or social event, or considering exercise
activities such as yoga, surfing, skate-boarding or break-dancing that may be a more palatable
alternative for those who do not enjoy traditional team sports).
34
9. The Health Assessment System Shows Some Relationship to School Grades
In general, nutrition factors seemed more important than exercise factors in predicting
academic achievement. Three of the four nutrition attitude components and healthy eating
behaviors predicted school grades, whereas only one of the four exercise attitude components
predicted grades. Nutrition knowledge significantly predicted academic achievement only before
other covariates were controlled, perhaps suggesting that the knowledge test acted as a general
ability measure in predicting grades (with general mental ability completely mediating this
relationship). Although sedentary behaviors significantly predicted grades, this correlation was
small (<.20) and may relate to time spent watching television or computer gaming rather than
studying (i.e., this may be specific to the narrow item pool of sedentary behaviors sampled in this
study). The tentative conclusion is that a good diet and positive attitudes toward nutrition are
consequential for classroom learning, with higher grades for students who eat healthily and hold
positive attitudes, intentions, and subjective norms regarding nutrition. Much prior research has
shown that malnourished or food-insecure children show decrements in cognitive performance and
that these factors can frequently be reversed through nutritional supplements (e.g., Bellisle, 2004;
Jyoti, Frongillo, & Jones, 2005; Soemantri, Pollitt, & Kim, 1985). Current results suggest that
these findings might extend from severely deprived groups toward the normal population, as
students with healthy eating patterns showed higher achievement.
Future Directions
Longitudinal modeling. One important research issue is to establish the causal direction
for the relationship of attitudes, knowledge, and behavior to obesity and academic achievement. In
the current study, all measures were taken at the same time point, such that the direction of
causality from attitudes and knowledge to behavior, and from behavior to obesity and
achievement, is unproven. Longitudinal modeling with outcome variables at later time points
would address this issue. In addition, the collection of longitudinal data with a larger sample size
may make it feasible to test the overall structure of the battery as well as the relationships to
criterion variables within a single time-lagged structural equation model. Establishing these causal
links constitutes an important step in providing validity evidence for the WHAMI conceptual
model of assessment and intervention. Simply put, the logic of an intervention assumes that the
35
targeted construct plays a causal role on the desired outcome (e.g., nutrition attitudes are a causal
factor in healthy eating, obesity, and school achievement).
Increasing scale length. Research on these health constructs could also be usefully
expanded by enlarging the item pools for each of the constructs measured. A larger item pool
would allow (a) more rigorous testing of structural models, such that there are numerous indicators
per hypothesized factor, even after poorly performing items are removed; and (b) an increase in the
internal consistency reliability of the assessments. For example, the internal consistency of the
knowledge assessment is clearly too low for operational use as it currently stands. The knowledge
assessment questions covered both nutrition and exercise content, which are most probably
separate factors. Such multidimensionality may lower the internal consistency of the assessment.
Upward expansion. Poor diets, sedentary lifestyles, obesity, and consequent chronic
health problems are clearly not restricted to childhood and adolescents, with an estimated 64.5% of
U.S. adults classified as overweight or obese (Flegal, Carroll, Ogden, & Johnson, 2002). An
understanding of the knowledge, attitudinal, and behavioral causes of obesity among adults would
constitute an important research direction. Adults have greater autonomy over their diets, greater
pressure on their time (such that regular physical activity can be harder to get), and may have
greater knowledge of health and nutrition. As such, results obtained on a sample of young
teenagers are by no means certain to replicate to adults. To expand the health-assessment research
agenda to adult samples, data collection on a revised and expanded set of K-A-B assessments is
currently underway (using more items and item rephrasings for adult-appropriate content and for
increased difficulty on the knowledge assessment).
Expansion of criterion space. Currently, we have assessed health only in the domains of
nutrition and physical activity. Although important, particularly considering the role of these
factors in the obesity epidemic, health knowledge, attitudes, and behaviors might usefully be
expanded to cover a much wider range of content, particularly if adults rather than adolescents are
targeted. For example, health domains might incorporate risk-taking, addiction behaviors (e.g.,
consumption of caffeine, alcohol, nicotine, and other drugs), oral hygiene, and preventative health
practices.
36
How Research Findings Inform Future Development of the Who-Am-I (WHAMI) Materials
In addition to the content-specific findings, results of the current study show some general
trends that inform future development of WHAMI materials, not only in the health domain, but
also across multiple domains assessed in the middle school sector. First, theoretical models of
personal characteristics developed for high school, college, and adult samples may differ for the
middle school age group. The negative relationship of perceived behavioral control to intention
formation is a case in point and is supported by other studies with this age group (Lipnevich et al.,
2009). The distinction between attitudes and intentions also illustrates this point: In the current
sample, attitudes and intentions are almost synonymous, whereas the TpB model posits a clear
separation. In adult samples, greater autonomy and impulse control may change these effects, such
that model parameters are quite different for adults than children. Second, the reverse-keying of
items may be problematic for this age group, with structural analyses of both attitudes and of
behavior indicating a method factor of reverse-keyed items. The issue of whether to include
reverse-keyed items to control for acquiescent responding may need to be carefully considered and
balanced against concerns of potential method factors and lowered reliability.
Generally, current results suggest the importance of health-related factors for students’
school achievement and well-being, although the current assessments (particularly the knowledge
assessment) require additional development to improve the psychometric characteristics.
37
References
Aarø, L. E., Laberg, J. C., & Wold, B. (1995). Health behaviours among adolescents: Towards a
hypothesis of two dimensions. Health Education Research, 10, 83–93.
Ackerman, P. L., Bowen, K. R., Beier, M. E., & Kanfer, R. (2001). Determinants of individual
differences and gender differences in knowledge. Journal of Educational Psychology, 93,
797–825.
Ajzen, I. (1991). The theory of planned behavior. Organizational Behavior and Human Decision
Processes, 50, 179–211.
Ajzen, I. (2006). Constructing a TpB questionnaire: Conceptual and methodological
considerations. Retrieved January 10, 2008, from http://www-
unix.oit.umass.edu/~aizen/pdf/tpb.measurement.pdf
Ajzen, I., & Fishbein, M. (1973). Attitudinal and normative variables as predictors of specific
behavior. Journal of Personality and Social Psychology, 27, 41–57.
Armitage, C. J., & Conner, M. (1999). Distinguishing perceptions of control from self-efficacy:
Predicting consumption of a low-fat diet using the theory of planned behavior. Journal of
Applied Social Psychology, 29, 72–90.
Armitage, C., & Conner, M. (2001). Efficacy of the theory of planned behaviour: A meta-analytic
review. British Journal of Social Psychology, 40, 471–499.
Baranowski, T., Cullen, K. W., Nicklas, T., Thompson, D., & Baranowski, J. (2003). Are current
health behavioural change models helpful in guiding prevention of weight gain efforts?
Obesity Research, 11S, 23S–43S.
Beauducel, A., & Wittman, W. W. (2005). Simulation study on fit indices in confirmatory factor
analysis based on data with slightly distorted simple structure. Structural Equation
Modeling, 12, 41–75.
Beier, M. E. & Ackerman, P. L. (2003). Determinants of health knowledge: An investigation of
age, gender, abilities, personality, and interests. Journal of Personality and Social
Psychology, 84, 439–447.
Bellisle, F. (2004). Effects of diet on behaviour and cognition in children. British Journal of
Nutrition, 92S, 227–232.
Benson, J., & Hocevar, D. (1985). The impact of item phrasing on the validity of attitude scales for
elementary school children. Journal of Educational Measurement, 22, 231-240.
38
Brien, G. O., & Davies, M. (2007). Nutrition knowledge and body mass index. Health Education
Research, 22, 571–575.
Browne, M. W., & Cudeck, R. (1992). Alternative ways of assessing model fit. Sociological
Methods and Research, 21, 230–258.
Byrd, J. (2007, March 30). The impact of physical activity and obesity on academic achievement
among elementary students. Retrieved March 30, 2007, from the Connexions Web site:
http://cnx.org/content/m14420/1.1/
Cohen, J. (1988). Statistical power analysis for the behavioral sciences (2nd ed.). Hillsdale, NJ:
Lawrence Erlbaum Associates.
Cohen, R. Y., Brownell, K. D., & Felix, M. R. (1990). Age and sex differences in health habits and
beliefs of schoolchildren. Health Psychology, 9, 208–224.
Connolly, J. J., Kavanagh, E. J., & Viswesvaran, C. (2007). The convergent validity between self
and observer ratings of personality: A meta-analytic review. International Journal of
Selection and Assessment, 15, 110–117.
Cronbach, L. J., & Meehl, P. E. (1955). Construct validity in psychological tests. Psychological
Bulletin, 52, 281–302.
Datar, A., & Sturm, R. (2006). Childhood overweight and elementary school outcomes.
International Journal of Obesity, 30, 1449–1460.
Datar, A., Sturm, R., & Magnabosco, J. L. (2004). Childhood overweight and academic
performance: national study of Kindergartners and first-graders. Obesity Research, 12, 58–
68.
de Onis, M., Onyango, A. W., Borghi, E., Siyam, A., Nishida, C., & Siekmann, J. (2007).
Development of a WHO growth reference for school-aged children and adolescents.
Bulletin of the World Health Organization, 85, 660–667.
Eisenbach, R. J., & Schriesheim, C. A. (1995). An exploratory and confirmatory factor-analytic
investigation of item wording effects on the obtained factor structures of survey
questionnaire measure. Journal of Management, 21, 1177–1193.
Elgar, F. J., Roberts, C., Tudor-Smith, C., & Moore, L. (2005). Validity of self-reported height and
weight and predictors of bias in adolescents. Journal of Adolescent Health, 37, 371–375.
Flavell, J. H. (1979). Metacognition and cognitive monitoring: A new area of cognitive-
developmental inquiry. American Psychologist, 34, 906–911.
39
Flegal, K. M., Carroll, M. D., Ogden, C. L., & Johnson, C. L. (2002). Prevalence and trends in
obesity among US adults, 1999–2000. Journal of the American Medical Association, 288,
1723–1727.
Gibson, E. L., Wardle, J., & Watts, C. J. (1998). Fruit and vegetable consumption, nutritional
knowledge and beliefs in mothers and children. Appetite, 31, 205–228.
Godin, G., & Kok, G. (1996). The theory of planned behavior: A review of its applications to
health-related behaviors. American Journal of Health Promotion, 11, 87–98.
Gordon-Larsen, P. (2001). Obesity-related knowledge, attitudes, and behaviours in obese and non-
obese urban Philadelphia female adolescents. Obesity Research, 9, 112–118.
Gortmaker, S. L., Must, A., Perrin, J. M., Sobol, A. M., & Dietz, W. H. (1993). Social and
economic consequences of overweight in adolescence and young adulthood. New England
Journal of Medicine, 12, 1008–1012.
Gracey, D., Stanley, N., Burke, V., Corti, B., & Beilin, L. J. (1996). Nutrition knowledge, beliefs
and behaviours in teenage school students. Health Education Research, 11, 187–204.
Hu, L. T., & Bentler, P. M. (1999). Cutoff criteria for fit indices in covariance structure analysis:
Conventional criteria versus new alternatives. Structural Equation Modeling, 6, 1–55.
Janssen, I., Craig, W. M., Boyce, W. F., & Pickett, W. (2004). Associations between overweight
and obesity with bullying behaviors in school-aged children. Pediatrics, 113, 1189–1194.
Jyoti, D. F., Frongillo, E. A., & Jones, S. J. (2005). Food insecurity affects school children's
academic performance, weight gain, and social skills. Journal of Nutrition, 135, 2831 –
2839.
Kaestner, R., & Grossman, M. (2008). Effects of weight on children’s educational achievement.
NBER Working Paper Series, 13764, 1–35.
Karnehed, N., Rasmussen, F., Hemmingsson, T., & Tynelius, P. (2006). Obesity and attained
education: Cohort study of more than 700,000 Swedish men. Obesity, 14, 1421–1428.
Lee, J., Grigg, W. S., & Dion, G. S. (2007). The nation's report card: Mathematics 2007: (NCES
2007-494). Washington, DC: National Center for Education Statistics.
Lipnevich, A. A., MacCann, C., Krumm, S., Burrus, J., & Roberts, R. D. (2009). Mathematics
attitudes and mathematics outcomes in U.S. and Belarusian middle school students.
Journal of Educational Psychology. Manuscript submitted for publication.
40
Lobstein, T., Baur, L., & Uauy, R. (2004). Obesity in children and young people: A crisis in public
health. Obesity Reviews, 5S, 4–85.
Lorenzo-Seva, U., & ten Berge, J. M. F. (2006). Tucker's congruence coefficient as a meaningful
index of factor similarity. Methodology, 2, 57–64.
Loucaides, C. A., & Jago, L. (2008). Differences in physical activity by gender, weight status and
travel mode to school in Cypriot children. Preventative Medicine, 47, 107–111.
MacCann, C., Duckworth, A. L., & Roberts, R. D. (2009). Empirical identification of the major
facets of conscientiousness. Learning and Individual Differences, 19, 451–458.
Marsh, H. (1996). Positive and negative global self-esteem: A substantively meaningful distinction
or artifactors? Journal of Personality and Social Psychology, 70, 810–819.
Marsh, H. W., Hau, K. T., & Wen, Z. (2004). In search of golden rules: Comment on hypothesis-
testing approaches to setting cutoff values for fit indexes and dangers in overgeneralizing
Hu and Bentler's (1999) findings. Structural Equation Modeling, 11, 320–341.
McDonald, R. P., & Ho, M. R. (2002). Principles and practice in reporting structural equation
analyses. Psychological Methods, 7, 64–82.
Milligan, R. A., Burke, V., Beilin, L. J., Dunbar, D. L., Spencer, M. J., Balde, E., & Gracey, M. P.
(1998). Influence of gender and socio-economic status on dietary patterns and nutrient
intakes in 18-year-old Australians. Australian and New Zealand Journal of Public Health,
22, 485–493.
Neisser, U., Boodoo, G., Bouchard, T. J., Boykin, A. W., Brody, N., Ceci, S. J., Halpern, D. F.,
Loehlin, J. C., Perloff, R., Sternberg, R. J., & Urbina, S. (1996). Intelligence: Knowns and
unknowns. American Psychologist, 51, 77–101.
Nutbeam, D., Aarø, L. E., & Wold, B. (1991). The lifestyle concept and health education with
young people. Results from a WHO international survey. World Health Statistics
Quarterly, 44, 55–61.
O’Connor, B. P. (2000). SPSS and SAS programs for determining the number of components
using parallel analysis and Velicer’s MAP test. Behavior Research Methods, Instruments,
and Computers, 32, 396–402.
O’Connor, M., & Paunonen, S. V. (2007). Big Five personality predictors of post-secondary
academic performance. Personality and Individual Differences, 43, 971–990.
41
Ogden, C. L., Flegal, K. M., Carroll, M. D., & Johnson, C. L. (2002). Prevalence and trends in
overweight among US children and adolescents, 1999–2000. Journal of the American
Medical Association, 288, 1728–1732.
Pilotte, W., & Gable, R. K. (1990). The impact of positive and negative item stems on the validity
of a computer anxiety scale. Educational and Psychological Measurement, 50, 603–610.
Pirouznia, M. (2001). The association between nutrition knowledge and eating behaviour in male
and female adolescents in the US. International Journal of Food Sciences and Nutrition,
52, 127–132.
Povey R., Conner M., Sparks P., James R., & Shepherd R. (2000). Application of the theory of
planned behaviour to two dietary behaviours: Roles of perceived control and self-efficacy.
British Journal of Health Psychology, 5, 121–139
Pyle, S. A., Sharkey, J., Yetter, G., Felix, E., Furlong, M. J., & Poston, W. S. C. (2006). Fighting
an epidemic: The role of schools in reducing childhood obesity. Psychology in the Schools,
43, 361–376.
Quinn, B. H. (1987). Attitudinal ratings of educators toward normal weight, overweight, and obese
teenage girls. Dissertation Abstracts International 48/10–B.
Reinehr, T., Kersting, M., Chahda, C., & Andler, W. (2003). Nutritional knowledge of obese
compared to non obese children. Nutrition Research, 23, 645–649.
Rhodes, S. K., Shimoda, K. C., Waid, L. R., Mahlen, P., Oexmann, M. J., Collop, N. A., & Willi,
S. M. (1995). Neurocognitive deficits in morbidly obese children with obstructive sleep
apnea. Pediatrics, 127, 741–744.
Sabia, J. (2007). The effect of body weight on adolescent academic performance. Southern
Economic Journal, 73, 871–900.
Schmitt, N., Schmitt, D., & Clapham, C. (2001). Developing and exploring the behaviour of two
new versions of the Vocabulary Levels Test. Language Testing, 18, 55–88.
Sheeran, P. (2002). Intention-behavior relations: A conceptual and empirical review. European
Review of Social Psychology, 12, 1–36.
Sigfúsdúttir, I. D., Kristjánsson, A. L., & Allegrante, J. P. (2007). Health behaviour and academic
achievement in Icelandic school children. Health Education Research, 22, 70–80.
Sirard, J. R., & Pate, R. R. (2001). Physical activity assessment in children and adolescents. Sports
Medicine, 31, 439–454.
42
Soemantri, A. G., Pollitt, E., & Kim, I. (1985). Iron deficiency anemia and educational
achievement. American Journal of Clinical Nutrition, 42, 1221–1228.
Steinberg, L., Albert, D., Cauffman, E., Banich, M., Graham, S., & Woolard, J. (2008). Age
differences in sensation seeking and impulsivity as indexed by behavior and self-report:
Evidence for a duel systems model. Developmental Psychology, 44, 1764–1778.
Thakur, N., & D’Amico, F. (1999). Relationship of nutrition knowledge and obesity in
adolescence. Family Medicine, 31, 122–127.
Thomas, J. (1994). New approaches to achieving dietary change. Current Opinion in Lipidology, 5,
36–41.
U.S. Department of Health and Human Services. (2005). Dietary guidelines for Americans 2005.
Retrieved June 1, 2009, from
http://www.health.gov/dietaryguidelines/dga2005/document/pdf/DGA2005.pdf
U.S. Department of Health and Human Services. (2007). Physical activity and good nutrition:
Essential elements to prevent chronic diseases and obesity. Retrieved February 12, 2008,
from http://www.cdc.gov/nccdphp/publications/aag/pdf/dnpa.pdf
Van den Bulck, J. (2004). Television viewing, computer game playing, and internet use and self-
reported time to bed and time out of bed in secondary-school children. Sleep, 27, 101–104.
Variyam, J. N. (2001). Overweight children: Is parental nutrition knowledge a factor? Food
Review, 24, 18–22.
Vingilis, E., Wade, T. J., & Adlaf, E. (1998). What factors predict student self-rated physical
health? Journal of Adolescence, 21, 83–97.
World Health Organization. (2008). Global database on body mass index. Available from
http://www.who.int/bmi


![Diurnal and Nocturnal Animals. Diurnal Animals Diurnal is a tricky word! Let’s all say that word together. Diurnal [dahy-ur-nl] A diurnal animal is an](https://img.pdfslide.net/doc/110x75/56649dda5503460f94ad083f/diurnal-and-nocturnal-animals-diurnal-animals-diurnal-is-a-tricky-word-lets.jpg)