Embed Size (px)
Citation preview

O
D
ID
a
ARRA
KCCCS
1
sTot2ohg1p
macarsiWptfiov
1h
Ecological Indicators 34 (2013) 76– 86
Contents lists available at SciVerse ScienceDirect
Ecological Indicators
jou rn al hom epage: www.elsev ier .com/ locate /eco l ind
riginal articles
evelopment of a sustainable balanced scorecard framework
oannis E. Nikolaou ∗, Thomas A. Tsalisepartment of Environmental Engineering, Democritus University of Thrace, Vas Sofias 12, Xanthi 67100, Greece
r t i c l e i n f o
rticle history:eceived 4 February 2012eceived in revised form 18 March 2013ccepted 7 April 2013
a b s t r a c t
The balanced scorecard (BSC) has recently been considered a proper tool for evaluating and designingthe objectives of corporate sustainability. On the one hand, the theoretical body of literature providesnormative sustainable balanced scorecard (SBSC) frameworks to indicate ‘what should be measured’ or‘what should be done’ in order for firms to improve their sustainability performance. On the other hand, the
eywords:orporate environmental managementorporate sustainabilityorporate environmental performancecoring measurement systems
empirical body of literature examines the barriers and the challenges faced by the firms in their endeavorto adopt the proposed normative frameworks. This paper aims at contributing to the theoretical body ofliterature by developing a new SBSC scoring framework using Global Reporting Initiative (GRI) indicatorsand scoring–benchmarking techniques to measure the corporate sustainability performance by drawingdata from corporate sustainability reports. It also aims at contributing to the empirical body of literatureby applying this framework to a sample of Greek firms.
. Introduction
The business community has recently been considered respon-ible for a series of environmental, economic and social problems.hese problems are faced within the context of sustainable devel-pment where firms aim to undertake essential practices to attainhe main goals of sustainable development (Szekely and Knirsch,005). In order to design, measure and communicate the resultsf corporate sustainability performance, a range of frameworksave been proposed by many international governmental, non-overnmental and intergovernmental organizations such as ISO4031, the Global Reporting Initiative (GRI), and the Global Com-act (Atkinson, 2000; GRI, 2002).
This debate has lately been enriched by SBSC frameworks whichay be the tool needed in order for firms to design their man-
gement objectives, collect necessary information, and observe theauses and effects of different performance measures (Länsiluotond Järvenpää, 2010). One body of the SBSC literature provides aange of theoretical normative frameworks to demonstrate ‘whathould be measured’ or ‘what should be done’ by an organizationn order to improve its sustainability performance (Epstein and
isner, 2001; Figge et al., 2002). Epstein and Wisner (2001) pro-osed a social and environmentally balanced scorecard frameworkhat highlights the key performance factors that could facilitate
rms to prepare more effectively the main strategic objectivesf their sustainability management. Figge et al. (2002) also pro-ided detailed procedures and steps in order for firms to develop∗ Corresponding author. Tel.: +30 6972136319; fax: +30 2541079392.E-mail address: [email protected] (I.E. Nikolaou).
470-160X/$ – see front matter © 2013 Elsevier Ltd. All rights reserved.ttp://dx.doi.org/10.1016/j.ecolind.2013.04.005
© 2013 Elsevier Ltd. All rights reserved.
SBSC and to identify relationships between BSC and the sustaina-bility management literature. The other body of literature includesthe empirical studies that examine the current status of SBSC andmanager’s perceptions of SBSC issues. Dias-Sardinha and Reijnders(2005) examined the Portuguese firms’ attitudes toward SBSC,while Dias-Sardinha et al. (2002) studied the level of adoption ofSBSC in many different industrial sectors.
Hubbard (2009) pointed out that many earlier corporatesustainability measurement systems have presented various weak-nesses, such as the lack of connection between economic andenviro-social components of sustainability, the enormous numberof theoretical normative works which lack empirical verifica-tion, the absence of quantitative data for measuring the proposedSBSC, and the limited amount of necessary sustainability infor-mation in order to effectively address the stakeholders’ needs.Dias-Sardinha and Reijnders (2005) explained the failures ofmeasurement systems by providing explicit empirical results forcorporate sustainability performance as a result of the lack of nec-essary information. One of the aims of this paper is to overcomethe weaknesses of the present theoretical SBSC and the limitednumber of recent empirical studies by developing a new SBSC sco-ring framework and by implementing it in a sample of Greek firms.This framework is based on BSC’s thematic perspectives, GRI guide-lines and scoring–benchmarking techniques. It aims to contributeto the present literature as follows: (a) by designing a reliableand transparent scoring technique to evaluate corporate sus-tainability performance, (b) by verifying empirically sustainability
performance using a sample of Greek firms, (c) by measuring corpo-rate sustainability performance through sustainability reports, and(d) by evaluating the completeness of sustainability strategies offirms.
ologica
2tsnfti(
2
poab
2
dbsairHolsa
ibottpin
icrsaic(mptimU
frlgacv
I.E. Nikolaou, T.A. Tsalis / Ec
The rest of the paper is organized as follows: (a) Section presents the literature review, including a short presenta-ion of the key issues which are mentioned in the literature onustainability reporting, sustainable scoring–benchmarking tech-iques, and SBSC; (b) Section 3 illustrates a sustainability scoring
ramework that combines SBSC, GRI and scoring–benchmarkingechnique, (c) Section 4 provides an application of this frameworkn a sample of Greek firms that publish sustainability reports, andd) Section 5 describes the conclusions and discussions.
. Background
This section consists of three interfaced literature bodies of cor-orate sustainability management that are considered necessary inrder to build the proposed framework. Specifically, these bodiesre the literature on sustainability reporting, corporate sustaina-ility scoring–benchmarking techniques and SBSC.
.1. Sustainability reporting
Perrini and Tencati (2006) stated that the adoption of properlyesigned accounting sustainability tools (e.g. SBSC and sustaina-ility reports) would likely bring new challenges for corporateustainable management. The available information on suchccounting tools tends to cover the growing interest of stakeholdersn corporate environmental risks. Such risks could be corpo-ate environmental accidents and resultant remediation costs, theealth and Safety (H&S) risks either on the local communities orn the firms’ employees, the unexpected costs of environmentalegislation on the firms’ budgets, the gradual (or sometimes theharp) deterioration of the creditworthiness and firms’ reputations a result of worsening sustainability performance.
To explain the interests of stakeholders in foregoing risks and todentify how firms classify their priorities to respond to them, theurgeoning literature of sustainability reporting has been basedn various social and political theories, such as the stakeholderheory, legitimacy theory, accountability theory and institutionalheory. Such theories aim to clarify both the incentives of firms toublish voluntary sustainability reports and the explicit types of
nformation covered by sustainability reports (e.g. ‘good’ or ‘bad’ews).
The loose and voluntary character of published sustainabilitynformation and reports as explained by social-political theoriesause various weaknesses in the understanding of sustainabilityeports and thus in the techniques used to measure corporateustainability performance. Some examples of such weaknessesre the unclear and limited types of published sustainabilitynformation (e.g. economic, environmental and social) and the inac-urate types of measurement units (financial and non-financialNikolaou and Evangelions, 2010)). To overcome such weaknesses,
any international Non-Governmental Organizations (NGOs) haveublished guidelines to offer general instructions to facilitatehe procedures for firms to record and disclose sustainabilitynformation and improve the design of sustainable corporate
anagement following the triple-bottom-line thinking (e.g. GRI,NEP/Sustainability reports).
To this context, GRI guidelines have gained wide recognitionrom firms in their attempts to prepare voluntarily sustainabilityeports. Despite the fact that some authors have emphasized theack of confidence that various stakeholder groups have in GRI
uidelines (Moneva et al., 2006), GRI has been utilized by severaluthors and firms on the grounds that it provides a standardized,omparable, report on the sustainability performance (Hedberg andon Malmborg, 2003; Guthrie and Farneti, 2008).l Indicators 34 (2013) 76– 86 77
2.2. Corporate sustainability scoring–benchmarking techniques
The lack of well-defined measurement units and unifor-mity of disclosed sustainability information mainly as a resultof the absence of a generally accepted guideline for sus-tainability reports has led a number of authors to developa range of scoring–benchmarking techniques to homogenize(in some way) their content. Skouloudis et al. (2010) statedthat a scoring–benchmarking technique used for evaluatingsustainability reports could improve the stakeholder’s compre-hension of corporate sustainable management in a more simpleand systematic manner. Kolk (1999) pointed out that thosescoring–benchmarking techniques would also assist not only inquantifying the content of sustainability reports in standard andcomparable types of information, but also in improving the reliabil-ity, consistency and relevance of their contents. Cooper and Owen(2007) supported that scoring–benchmarking techniques primarilyassist in standardizing the published information and also satisfysome of the basic and generally accepted accounting principles(GAAP) such as materiality, completeness and responsiveness.
Several scoring–benchmarking techniques have been proposed(Morhardt, 2001; Skouloudis et al., 2009). Although differenti-ates among such techniques seems to be subtle, on analysis somesignificant variations emerge. Some indicative examples of sco-ring systems are as follows: the Davis-Walling and Battermanscoring–benchmarking technique includes 29 environmental andsocial topics that are scored in a 3-point scale (Davis-Walling andBatterman, 1997). Morhardt et al. (2002) criticized this techniquedue to the fact that it measured only what was being reportedand not what ought to have been reported with regards to cor-porate sustainable management. The Sustainability/UNEP (2006)scoring–benchmarking technique includes 50 topics classified insix general categories: management policies and systems, inputsand outputs, finance, stakeholders’ relations, sustainable develop-ment, and report design and accessibility. Morhardt (2001) andSkouloudis et al. (2009) stated that such techniques share a certainlevel of subjectivity because the use of scoring scales over 4-pointsincreases the possibility of (different) scholars providing differentresults for the same firm.
Another important scoring–benchmarking technique is theDeloitte Touche Tohmatsu (2002) which comprises 30 criteriagrouped into six parts and uses a 5-point scale. Although, Morhardt(2001) considered this technique to be less subjective than otherscoring–benchmarking techniques, Kolk (1999) supported that themain weakness of this technique lies in the fact that it lacks a thirdparty verification of the environmental reports.
To overcome accountability lacuna and identify the necessarytypes of information that should be reported, various scholarshave combined such scoring–benchmarking techniques with someinternationally accepted guidelines that provide standard types ofinformation, indicators and criteria (Daub, 2007). Morhardt et al.(2002) proposed GRI and ISO guidelines as they are more detailed,comprehensive and popular which are measured in a 4-point scale.Similarly, Skouloudis et al. (2009) developed an evaluation method-ology for triple bottom line reports using GRI guidelines whichmeasure in a 5-point scale.
2.3. SBSC
SBSC has lately been considered as an essential tool for design-ing and achieving the key objectives of corporate sustainabilitymanagement, while it could also constitute a suitable context
for recording necessary information in relation to corporate sus-tainability performance by combining financial and non financialinformation (Länsiluoto and Järvenpää, 2010). Epstein and Wisner(2001) recognized that a well-organized SBSC can assist firms in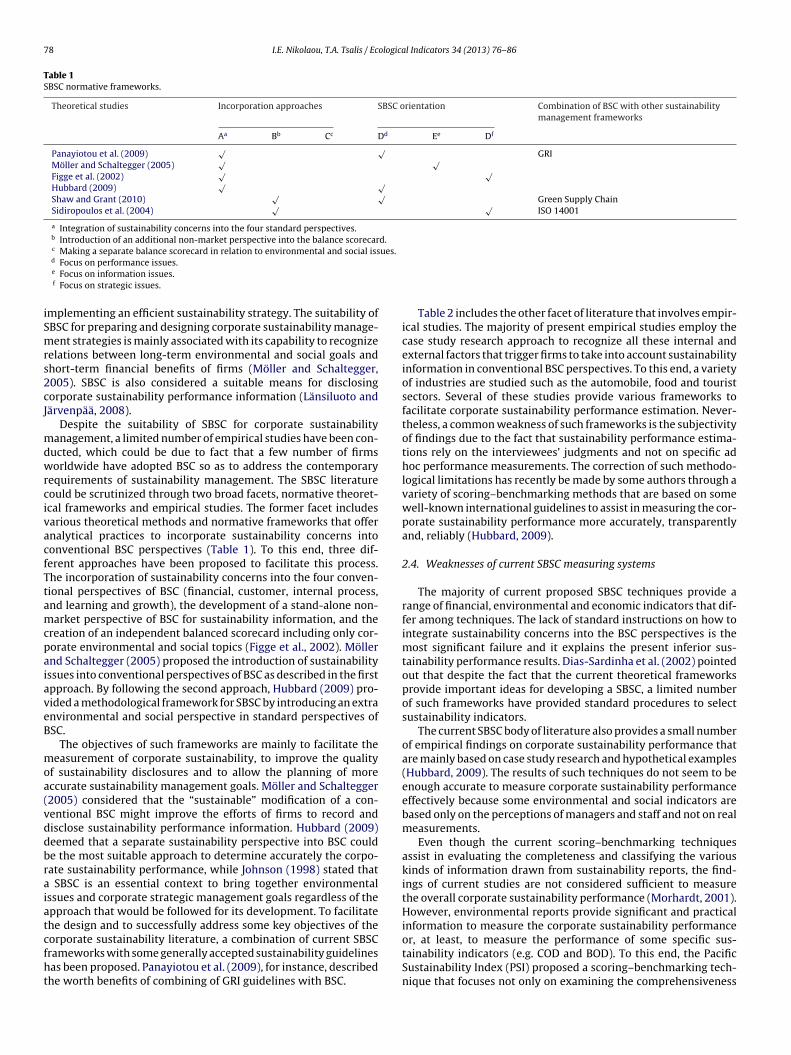
78 I.E. Nikolaou, T.A. Tsalis / Ecological Indicators 34 (2013) 76– 86
Table 1SBSC normative frameworks.
Theoretical studies Incorporation approaches SBSC orientation Combination of BSC with other sustainabilitymanagement frameworks
Aa Bb Cc Dd Ee Df
Panayiotou et al. (2009)√ √
GRIMöller and Schaltegger (2005)
√ √Figge et al. (2002)
√ √Hubbard (2009)
√ √Shaw and Grant (2010)
√ √Green Supply Chain
Sidiropoulos et al. (2004)√ √
ISO 14001
a Integration of sustainability concerns into the four standard perspectives.b Introduction of an additional non-market perspective into the balance scorecard.c Making a separate balance scorecard in relation to environmental and social issues.
iSmrs2cJ
mdwrcivacfTtamcpaiaveB
moa(vddbraiatcfht
d Focus on performance issues.e Focus on information issues.f Focus on strategic issues.
mplementing an efficient sustainability strategy. The suitability ofBSC for preparing and designing corporate sustainability manage-ent strategies is mainly associated with its capability to recognize
elations between long-term environmental and social goals andhort-term financial benefits of firms (Möller and Schaltegger,005). SBSC is also considered a suitable means for disclosingorporate sustainability performance information (Länsiluoto andärvenpää, 2008).
Despite the suitability of SBSC for corporate sustainabilityanagement, a limited number of empirical studies have been con-
ucted, which could be due to fact that a few number of firmsorldwide have adopted BSC so as to address the contemporary
equirements of sustainability management. The SBSC literatureould be scrutinized through two broad facets, normative theoret-cal frameworks and empirical studies. The former facet includesarious theoretical methods and normative frameworks that offernalytical practices to incorporate sustainability concerns intoonventional BSC perspectives (Table 1). To this end, three dif-erent approaches have been proposed to facilitate this process.he incorporation of sustainability concerns into the four conven-ional perspectives of BSC (financial, customer, internal process,nd learning and growth), the development of a stand-alone non-arket perspective of BSC for sustainability information, and the
reation of an independent balanced scorecard including only cor-orate environmental and social topics (Figge et al., 2002). Möllernd Schaltegger (2005) proposed the introduction of sustainabilityssues into conventional perspectives of BSC as described in the firstpproach. By following the second approach, Hubbard (2009) pro-ided a methodological framework for SBSC by introducing an extranvironmental and social perspective in standard perspectives ofSC.
The objectives of such frameworks are mainly to facilitate theeasurement of corporate sustainability, to improve the quality
f sustainability disclosures and to allow the planning of moreccurate sustainability management goals. Möller and Schaltegger2005) considered that the “sustainable” modification of a con-entional BSC might improve the efforts of firms to record andisclose sustainability performance information. Hubbard (2009)eemed that a separate sustainability perspective into BSC coulde the most suitable approach to determine accurately the corpo-ate sustainability performance, while Johnson (1998) stated that
SBSC is an essential context to bring together environmentalssues and corporate strategic management goals regardless of thepproach that would be followed for its development. To facilitatehe design and to successfully address some key objectives of the
orporate sustainability literature, a combination of current SBSCrameworks with some generally accepted sustainability guidelinesas been proposed. Panayiotou et al. (2009), for instance, describedhe worth benefits of combining of GRI guidelines with BSC.Table 2 includes the other facet of literature that involves empir-ical studies. The majority of present empirical studies employ thecase study research approach to recognize all these internal andexternal factors that trigger firms to take into account sustainabilityinformation in conventional BSC perspectives. To this end, a varietyof industries are studied such as the automobile, food and touristsectors. Several of these studies provide various frameworks tofacilitate corporate sustainability performance estimation. Never-theless, a common weakness of such frameworks is the subjectivityof findings due to the fact that sustainability performance estima-tions rely on the interviewees’ judgments and not on specific adhoc performance measurements. The correction of such methodo-logical limitations has recently be made by some authors through avariety of scoring–benchmarking methods that are based on somewell-known international guidelines to assist in measuring the cor-porate sustainability performance more accurately, transparentlyand, reliably (Hubbard, 2009).
2.4. Weaknesses of current SBSC measuring systems
The majority of current proposed SBSC techniques provide arange of financial, environmental and economic indicators that dif-fer among techniques. The lack of standard instructions on how tointegrate sustainability concerns into the BSC perspectives is themost significant failure and it explains the present inferior sus-tainability performance results. Dias-Sardinha et al. (2002) pointedout that despite the fact that the current theoretical frameworksprovide important ideas for developing a SBSC, a limited numberof such frameworks have provided standard procedures to selectsustainability indicators.
The current SBSC body of literature also provides a small numberof empirical findings on corporate sustainability performance thatare mainly based on case study research and hypothetical examples(Hubbard, 2009). The results of such techniques do not seem to beenough accurate to measure corporate sustainability performanceeffectively because some environmental and social indicators arebased only on the perceptions of managers and staff and not on realmeasurements.
Even though the current scoring–benchmarking techniquesassist in evaluating the completeness and classifying the variouskinds of information drawn from sustainability reports, the find-ings of current studies are not considered sufficient to measurethe overall corporate sustainability performance (Morhardt, 2001).However, environmental reports provide significant and practicalinformation to measure the corporate sustainability performance
or, at least, to measure the performance of some specific sus-tainability indicators (e.g. COD and BOD). To this end, the PacificSustainability Index (PSI) proposed a scoring–benchmarking tech-nique that focuses not only on examining the comprehensiveness
I.E. Nikolaou, T.A. Tsalis / Ecological Indicators 34 (2013) 76– 86 79
Table 2SBSC empirical studies.
Empirical studies Methodology Research questions Industry
Hsu and Liu (2010) Factor analysis Internal and external, financial andnon-financial, outcome and drivingfactors
Automobile
Laurinkeviciute et al. (2008) Indicators development The level of lithuania sustainabilityperformance
Furniture
Dias-Sardinha et al. (2002) Questionnaire survey Measuring eco-efficiency andsustainability performance of Portugalfirms
Portuguese firms
Länsiluoto and Järvenpää (2010) Case study approach Examining change factors such ashindering forces, momentum and theleaders of change
Finish firms
Länsiluoto and Järvenpää (2008) Longitudinal case study approach Internal and external driving forces Finish food manufacturing industryDias-Sardinha and Reijnders (2005) Case study approach Examining different driving forces and
rformPortuguese firms
stainarform
osn(aassSto
3
bssrpcastafi
3
fiqpsfiqcpsceptfi(m
of firms as emphasized by the literature on corporate sustainabilitymanagement (Munilla and Miles, 2005; Perrini and Tencati, 2006).This perspective includes 41 sustainability indicators from the GRIguidelines that are measured in non-financial terms. Similarly, the
Table 3The classification of GRI indicators in BSC perspectives.
Sustainability balancedscorecard
Number ofindicators
GRI indicators
Financial perspective 11 EC1, EC2, EC3, EC4, EC5, EC8,EN28, EN30, SO6, SO8, PR9.
Stakeholder perspective 41 EC6, EC7, EC9, EN9, EN11,EN12, EN13, EN14, EN15, EN25,LA1, LA2, LA3, LA4, LA5, LA6,LA7, LA9, LA12, LA13, LA14,HR1, HR2, HR4, HR5, HR6, HR7,HR9, SO1, SO2, SO4, SO5, SO7,PR1, PR2, PR3, PR4, PR5, PR6,PR7, PR8.
Internal perspective 21 EN1, EN2, EN3, EN4, EN5, EN6,EN7, EN8, EN10, EN16, EN17,EN18, EN19, EN20, EN21, EN22,
peder Woerd and den Brink (2004) Case study approach Su
pe
f sustainability reporting but also on measuring the corporateustainability performance. The PSI scoring–benchmarking tech-ique includes three general categories of criteria, environmentale.g. accountability, management, and vision policy), social (e.g.ccountability vision and policy, management, and labor issues)nd human rights (e.g. principles). This technique consists of twoub-indicators, reporting and performance indicators that are mea-ured in a 5-point scale including qualitative and quantitative data.kouloudis et al. (2009) criticized this technique because it excludeshe economic performance of firms, one of the three main aspectsf sustainability performance.
. The proposed SBSC scoring framework
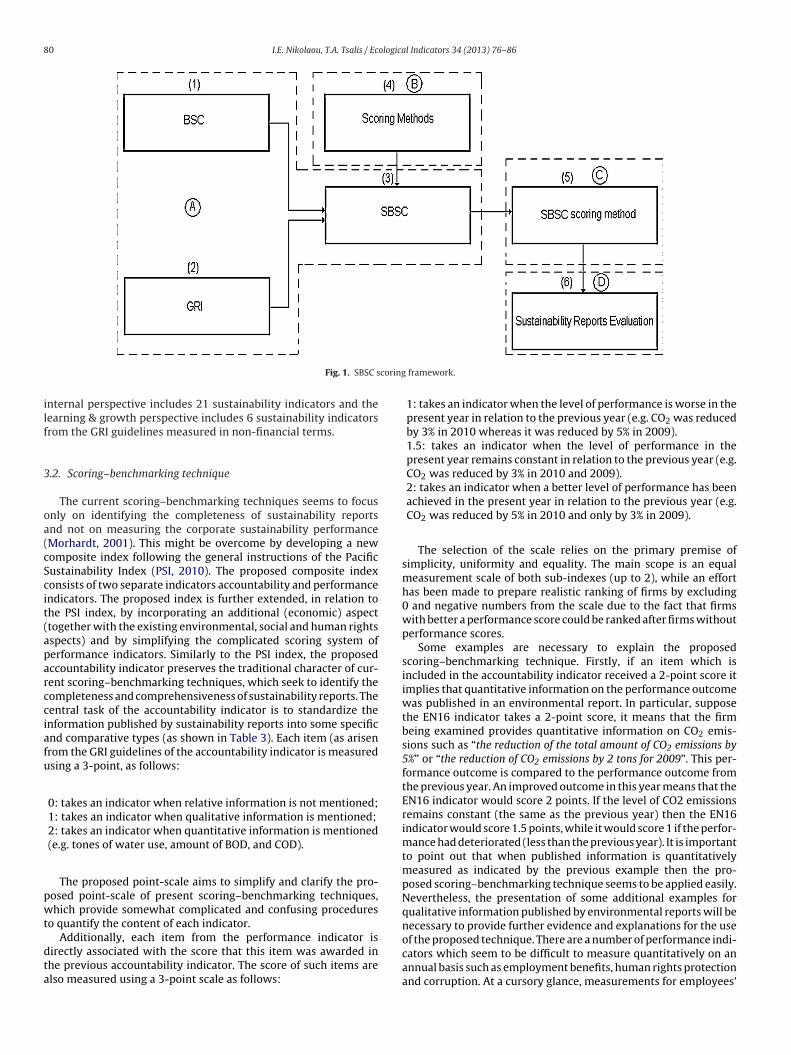
The proposed framework consists of three steps the com-ination of BSC and GRI guidelines, the development of acoring–benchmarking technique in order to build a SBSCcoring–benchmarking index, and the application of the SBSC sco-ing index through information drawn from sustainability reportsublished on the company’s website (Fig. 1). Firstly, the criti-al points of BSC and GRI guidelines are later combined in anttempt to develop a new SBSC. Secondly, a combination ofcoring–benchmarking techniques and SBSC are proposed. Thirdly,he proposed SBSC scoring–benchmarking technique is applied to
sample of sustainability reports that were published on the Greekrms’ websites.
.1. SBSC perspectives
In general, BSC is considered an effective tool to facilitaterms in achieving their strategic management goals and providinguantitative results in relation to their financial and managementerformance (Kaplan and Norton, 1996). Epstein and Roy (2001)tated that under suitable conditions the use of BSC might helprms to evaluate intangible and intellectual assets such as highuality products and employees skills, while it could also help theonnection of financial and non-financial information, a necessaryrocedure for measuring corporate sustainability performance. Aeries of benefits of the usefulness of BSC for the measurement oforporate sustainability have also been presented in the current lit-rature, which could be classified as follows: “(a) provide completeerformance measures and perspectives, (b) offer tighter and effec-
ive management system and tool, (c) take care of internal/external,nancial/non-financial, driving/outcome KPI in a ‘balanced’ way, andd) implement BSE and generate synergy with other corporate strategyanagement” (Hsu and Liu, 2010, p. 601).ance outcomesbility measurementance
Netherland tourist sector Italian food sector
A typical BSC is classified into four perspectives (Kaplan andNorton, 1996) as follows: (a) the financial perspectives, includingconventional financial and accounting indicators, (b) the customerperspectives, containing objectives, targets and indicators that areassociated with customer satisfaction and trust, (c) the internalprocess perspective, including internal corporate operational andproduction processes, and (d) the learning and growth perspec-tive. To introduce environmental and social issues into the fourperspectives of BSC, this paper proposes the popular GRI guide-line, which provides various standard indicators to audit corporatesustainability performance. The obvious advantage of the proposedcombination is to facilitate firms in various sectors to compare sus-tainability performance outcomes and inform more accurately andtransparently stakeholders about their sustainability performance.
Table 3 illustrates the proposed classification of GRI indicatorsper BSC perspective. In particular, the financial perspective includes11 sustainability indicators (economic, environmental, and social)from the GRI guidelines primarily on the basis that such indica-tors are measured in financial terms. Secondly, a revision of thetitle and naturally of the content of the customer perspective of thestandard BSC, which has been named the stakeholder perspective.This was done in order to meet the increasing needs of many otherstakeholders who pay close attention to the day-to-day operation
EN23, EN24, EN26, EN27, EN29.Learning and growth
perspective6 LA8, LA10, LA11, HR3, HR8,
SO3.
Total number 79
80 I.E. Nikolaou, T.A. Tsalis / Ecological Indicators 34 (2013) 76– 86
coring
ilf
3
oa(cScit(aparcciafu
pwt
dta
Fig. 1. SBSC s
nternal perspective includes 21 sustainability indicators and theearning & growth perspective includes 6 sustainability indicatorsrom the GRI guidelines measured in non-financial terms.
.2. Scoring–benchmarking technique
The current scoring–benchmarking techniques seems to focusnly on identifying the completeness of sustainability reportsnd not on measuring the corporate sustainability performanceMorhardt, 2001). This might be overcome by developing a newomposite index following the general instructions of the Pacificustainability Index (PSI, 2010). The proposed composite indexonsists of two separate indicators accountability and performancendicators. The proposed index is further extended, in relation tohe PSI index, by incorporating an additional (economic) aspecttogether with the existing environmental, social and human rightsspects) and by simplifying the complicated scoring system oferformance indicators. Similarly to the PSI index, the proposedccountability indicator preserves the traditional character of cur-ent scoring–benchmarking techniques, which seek to identify theompleteness and comprehensiveness of sustainability reports. Theentral task of the accountability indicator is to standardize thenformation published by sustainability reports into some specificnd comparative types (as shown in Table 3). Each item (as arisenrom the GRI guidelines of the accountability indicator is measuredsing a 3-point, as follows:
0: takes an indicator when relative information is not mentioned;1: takes an indicator when qualitative information is mentioned;2: takes an indicator when quantitative information is mentioned(e.g. tones of water use, amount of BOD, and COD).
The proposed point-scale aims to simplify and clarify the pro-osed point-scale of present scoring–benchmarking techniques,hich provide somewhat complicated and confusing procedures
o quantify the content of each indicator.
Additionally, each item from the performance indicator isirectly associated with the score that this item was awarded inhe previous accountability indicator. The score of such items arelso measured using a 3-point scale as follows:
framework.
1: takes an indicator when the level of performance is worse in thepresent year in relation to the previous year (e.g. CO2 was reducedby 3% in 2010 whereas it was reduced by 5% in 2009).1.5: takes an indicator when the level of performance in thepresent year remains constant in relation to the previous year (e.g.CO2 was reduced by 3% in 2010 and 2009).2: takes an indicator when a better level of performance has beenachieved in the present year in relation to the previous year (e.g.CO2 was reduced by 5% in 2010 and only by 3% in 2009).
The selection of the scale relies on the primary premise ofsimplicity, uniformity and equality. The main scope is an equalmeasurement scale of both sub-indexes (up to 2), while an efforthas been made to prepare realistic ranking of firms by excluding0 and negative numbers from the scale due to the fact that firmswith better a performance score could be ranked after firms withoutperformance scores.
Some examples are necessary to explain the proposedscoring–benchmarking technique. Firstly, if an item which isincluded in the accountability indicator received a 2-point score itimplies that quantitative information on the performance outcomewas published in an environmental report. In particular, supposethe EN16 indicator takes a 2-point score, it means that the firmbeing examined provides quantitative information on CO2 emis-sions such as “the reduction of the total amount of CO2 emissions by5%” or “the reduction of CO2 emissions by 2 tons for 2009”. This per-formance outcome is compared to the performance outcome fromthe previous year. An improved outcome in this year means that theEN16 indicator would score 2 points. If the level of CO2 emissionsremains constant (the same as the previous year) then the EN16indicator would score 1.5 points, while it would score 1 if the perfor-mance had deteriorated (less than the previous year). It is importantto point out that when published information is quantitativelymeasured as indicated by the previous example then the pro-posed scoring–benchmarking technique seems to be applied easily.Nevertheless, the presentation of some additional examples forqualitative information published by environmental reports will benecessary to provide further evidence and explanations for the use
of the proposed technique. There are a number of performance indi-cators which seem to be difficult to measure quantitatively on anannual basis such as employment benefits, human rights protectionand corruption. At a cursory glance, measurements for employees’
I.E. Nikolaou, T.A. Tsalis / Ecological Indicators 34 (2013) 76– 86 81
Table 4Number of indicators and maximum scoring of accountability and performance indexes.
Sustainability balanced scorecard Number ofindicators
Accountability index(maximum scoring)
Performance index(maximum scoring)
Total scoring perperspective
Financial perspective 11 22 22 44Stakeholder perspective 41 82 82 164Internal perspective 21 42 42 84
bebeetwteAttacriet
3
covtpiicicpt(tpmC
S
TS
Learning & growth perspective 6 12
Total 79 158
enefits might seem to only be qualitative but further analysis ofnvironmental reports has indicated that quantitative scores coulde possible. For instance, an accountability indicator for employ-es’ benefits will be quantitative (e.g. 2 points score) when annvironmental report records that “5 employees are employed full-ime” or “10 employees are employed part-time”. Now, in the casehere the environmental report recorded, in the previous year,
hat “6 employees are employed full-time” or “12 employees aremployed part time” then the performance indicator scores 1 point.nother blurry area is the corruption measurements. In this case,
he accountability indicator scores 2 points when the environmen-al report states that “50% of accountants and managers are trained innti-corruption policies” (SO2 indicator) and the performance indi-ator scores 2 points when in the previous year the environmentaleport recorded that “40% of accountants and managers are trainedn anti-corruption polices”. Table 4 shows the maximum score forach perspective of SBSC for both the accountability indicator andhe performance indicator.
.3. SBSC scoring technique
This section illustrates the mathematical formulas used to cal-ulate the overall sustainability performance score. Eq.1 consistsf two sub-indices, accountability and performance. Eq. (2) pro-ides the mathematical formula to calculate the total score forhe accountability indicator which ranges from 0 to 158 points. Inarticular, Eq. (2) is the sum of four sub-indicators, the accountabil-
ty financial indicator (AFinindicator), the accountability stakeholderndicator (Astakindicator), the accountability internal process indi-ator (AIPindicator) and, finally, the accountability learn and growthndicator (AL&Gindicator). The mathematical formulas of such indi-ators are presented in Appendix A: Column A. Similarly, Eq. (3)resents the mathematical formula of the performance indica-or that consist of the sum of the performance finance indicatorPFinindcator), the performance stakeholder indicator (Pstakindicator),he performance internal process indicator (PIPindicator) and theerformance learn & growth indicator (PL&Gindicator). The mathe-atical formulas of such indicators are presented in Appendix A:
olumn B.
BSCscoring index = Accountablityindicator + Performanceindicator (1)
able 5ustainability reports by sectors.
Sectors Number of firms Number of reports per y
2001 2002
Financial service industry 7 1 3
Telecommunication industry 4 1
Pipeline industry 3
Oil and petroleum industry 2 1 1
Mining and extractive industry 2 1 1
Food and beverage industry 2
Other industry sectors 4
Total 24 3 6
12 24
158 316
where 0 ≤ SBSCscoring indicator ≤ 316.
Accountabilityindicator
= AFindicator + AStakindicator + AIPindicator + AL&Gindicator (2)
where 0 ≤ Accountabilityindicator ≤ 158.
Performanceindicator
= PFinindicator + PStakindicator + PIPindicator + PL&Gindicator (3)
where 0 ≤ Perforomanceindicator ≤ 158.
4. A case study application
4.1. Data collection
This section presents an application of the proposed SBSC sco-ring index in a sample of Greek firms. The data are drawn fromsustainability reports published by the selected Greek firms ontheir web pages. The current experience of corporate sustainabilityreporting in Greece indicates that various alternative methodo-logical approaches are selected by firms in their attempt to recordand disclose information on their sustainability performance. Thesample of Greek firms contains 24 firms operating in differentindustry sectors which publish stand-alone sustainability reports.Table 5 shows the sectors where Greek firms operate and their sus-tainability reports per year. The collection of sustainability reportswere found through Internet research on the web pages of firms,the Hellenic Network for Corporate Social Responsibility database(available in September of 2010) and the Quality Net Foundation(which was available in September of 2010).
4.2. Results and discussion
Table 6 and Fig. 2 show the final scores of the financial perspec-tive for the examined sectors. The majority of sectors have provideda low level of information regarding the financial perspective. Inparticular, firms that operate in the financial sector, mining and
extractive industry and food and beverage industry attained betterscores in the financial perspective as shown Table 6 (means 7.2, 8.16and 8.5 correspondingly) than other industry sectors. Similarly, VanStaden and Hooks (2007) identified that even though a restrictedear
2003 2004 2005 2006 2007 2008 2009
3 3 4 5 6 7 51 1 3 3 4 4 3
3 12 2 2 2 2 2 31 1 1 1 1 2 2
1 2 11 1 2 2 2 2 2
8 8 12 13 16 22 17

82 I.E. Nikolaou, T.A. Tsalis / Ecological Indicators 34 (2013) 76– 86
Table 6Scoring of financial perspective.
Total score per sector Years Total score per year
N Min Max Mean SD Min Max Mean SD
Financial services 7 2 17 7.2 4.61 2001 1 2 1.3 0.57Telecommunication 4 1 10 5.67 4.22 2002 1 7 8 2.96Pipe industry 3 5 14 8.16 3.87 2003 2 13 5.9 4.29Oil and petroleum industry 2 1 19 6.06 5.61 2004 2 11 7 3.54Mining and extractive industry 2 1 24.5 12.85 5.76 2005 1 16 6.6 4.64Food and beverage industry 2 6 12 8.5 3 2006 2 15 6.8 3.33Other sectors 3 3 8 5.36 1.36 2007 1 15 7.4 3.54
Total number 24 2008 3 17 8.5 3.782009 1 24.5 11 6.63
ion of
noaiotdafi
tifctwcbweC
TS
Fig. 2. Mean and standard deviat
umber of financial information was published in annual reportsf their sampled firms, nevertheless the mining and mineral sectorchieved higher scores in financial disclosures than other sectors. Its worth noting also that during the years 2001–2009, the majorityf firms presented a steady progress in both the financial perspec-ive scores and amount of published information according to theiachronic evolution of means and standard deviation. Addition-lly, none of the selected sectors exceeded the average score of thenancial perspective (22).
Table 7 and Fig. 3 present the scores of selected sectors forhe stakeholder perspective. Firms from the mining and extractivendustry and oil and petroleum industry seem to attain better per-ormance in the stakeholder perspective (means 19.72 and 22.71orrespondingly). These findings are logical as such sectors arereated by local communities and governments with suspicionhen it comes to their environmental performance. These are also
onfirmed by Raar (2002), who identified a high score achieved
y a sample of Australian industries for information associatedith external stakeholders. However, none of the sectors examinedxceeded the average score for the stakeholder perspective (82).ertainly, the majority of firms from the sample improved their
able 7coring of stakeholder perspective.
Total score per sector
N Min Max Mean
Financial services 7 1 55 16.9
Telecommunication 4 1 56.5 32.9
Pipe industry 3 12 45 18.33
Oil and petroleum industry 2 3 75.5 21.57
Mining and extractive industry 2 9 79 36.92
Food and beverage industry 2 38 73 36.45
Other sectors 3 4 22 20.86
Total number 24
financial perspective per sector.
stakeholder performance during the years 2001–2009 as shown bythe diachronic increase in average scores.
The food and beverage industry and telecommunication indus-try have attained the higher scores among sectors examined for theinternal perspective (Table 8 and Fig. 4). This outcome is not sur-prising since the food industry and telecommunication industryoperate under a rigorous environmental regulatory regime (Cerin,2002; Guthrie et al., 2008). These findings are in line with Hollandand Foo (2003) who identified that many US and UK firms of differ-ent sectors were ranked at the top regarding disclosures of certainenvironmental; issues associated with the internal perspectives.
Table 9 and Fig. 5 show the scores for learning and growth. Thefinancial service sector achieved a better score than the other sec-tors for the perspective of learning and growth in 2009. Nakao et al.(2007) suggested that in the long-run term there could be a posi-tive relationship between environmental strategies and intangiblevalues of firms. The findings also confirm a range of theoretical
hypotheses about the positive relationship of environmental man-agement practices and learning and growth issues (Fernández et al.,2003). Furthermore, in the year 2006 and 2009, the majority of thefirms examined gradually improved their scores in the learning andYears Total score per year
SD Min Max Mean SD
13.59 2001 3 9 5.33 3.215.14 2002 1 15 7.83 516.02 2003 5 18.5 10 5.422.71 2004 6 19 10.87 5.719.72 2005 5 21.5 12.16 5.715.97 2006 1 26 13.65 7.6
5.16 2007 2 44 21.06 13
2008 4 73 29.13 182009 3 79 39.26 25

I.E. Nikolaou, T.A. Tsalis / Ecological Indicators 34 (2013) 76– 86 83
Fig. 3. Mean and standard deviation for stakeholder perspective per sector.
Table 8Scoring of internal perspective.
Total score per sector Years Total score per year
N Min Max Mean SD Min Max Mean SD
Financial services 7 1 34.5 10.84 9.23 2001 1 4 2.5 2.1Telecommunication 4 2 13 17.74 8.53 2002 1 4 3 1.2Pipe industry 3 11 30 16 8.52 2003 2 17 4.8 5.4Oil and petroleum industry 2 1 30 7.477 8.29 2004 1 26 6.71 8.6Mining and extractive industry 2 1 35 4.5 9.57 2005 1 23 6.58 6.3Food and beverage industry 2 11 29 20.25 8.22 2006 2 24 10.84 6.9Other sectors 3 2 21 7.733 7.32 2007 1 25 14.37 7.6
Total number 24 2008 2 29 15.61 8.32009 2 35 19.05 12
Fig. 4. Mean and standard deviation of internal perspective per sector.
Table 9Scoring of learning and growth perspective.
Total score per sector Years Total score per year
N Min Max Mean SD Min Max Mean SD
Financial services 7 1 9.5 4.42 2.46 2001 1 2 1.66 0.6Telecommunication 4 1 8 3.65 2.14 2002 1 5 3.2 1.6Pipe industry 3 2 2 2 1.5 2003 1 4 3.14 1.1Oil and petroleum industry 2 2 8 3.44 1.53 2004 1 5 3.75 1.5Mining and extractive industry 2 1 5 4.05 1.20 2005 1 7 3.04 1.6Food and beverage industry 2 3 5 4 0.81 2006 1 8.5 4.19 2.1Other sectors 3 2 6 4.15 1.07 2007 1 8 4.25 1.8
Total number 24 2008 1 9.5 4.5 22009 1 9.5 4.91 2.2

84 I.E. Nikolaou, T.A. Tsalis / Ecological Indicators 34 (2013) 76– 86
Fig. 5. Mean and standard deviation of learning and growth perspective per sector.
Table 10Scoring of total sustainability performance.
Total score per sector Years Total score per year
N Min Max Mean SD Min Max Mean SD
Financial services 7 6 93 38.36 23.91 2001 7 15 10 4.4Telecommunication 4 5 100.5 49.45 26.18 2002 5 30 17 9.1Pipe industry 3 34 35 45 29.21 2003 10 34.5 22.87 9.9Oil and petroleum industry 2 7 131.5 37.01 37.03 2004 14 56.5 27.5 14Mining and extractive industry 2 15 143.5 65.43 34.80 2005 9 62.5 28.41 13Food and beverage industry 2 58 117 86.75 24.77 2006 15 57.5 35.53 13Other sectors 3 10 45 29.5 12.91 2007 6 79 47.12 20
Total number 24 2008 12 117 57.84 262009 10 143.5 73.91 39
of su
gt
fitdb
5
rsFisa
Fig. 6. Mean and standard deviation
rowth issues. However, none of the firms exceeded the average ofhe total score (12).
Finally, Table 10 and Fig. 6 show the overall sustainability per-ormance score of the sectors examined. The mining and extractivendustry and food and beverage industry achieved better scoreshan the others sectors. The sustainability performance improveduring 2001–2009 for the majority of the sampled firms as it cane seen from the gradual increase in means per year.
. Conclusion
This paper hopes to contribute to the current literatureegarding corporate sustainability performance indicators andustainability scoring–benchmarking techniques in four ways.
irstly, a new corporate sustainability performance frameworks presented based on the combination of SBSC logic and thecoring–benchmarking techniques. Even though a number ofuthors have recently proposed that BSC could be a good tool forstainability performance per sector.
measuring sustainability performance, the majority of them onlypresent normative conceptual frameworks with a number of sus-tainability indicators without clear procedures for selecting suchindicators (Epstein and Wisner, 2001; Dias-Sardinha et al., 2002).The proposed framework aims at overcoming this weakness byproviding detailed procedures for selecting a specific number ofsustainability indicators for each BSC perspective based on GRIguidelines as previously proposed by Panayiotou et al. (2009). It alsocontributes by combining SBSC with the scoring–benchmarkingtechniques in order to quantify the inconsistent information pub-lished by sustainability reports of firms (Morhardt et al., 2002;Skouloudis et al., 2009) and to measure the SBSC through empir-ical data. Essentially, the data arisen from environmental reportscalculates economic, environmental and social aspects of sustaina-
bility in financial and non-financial terms. This information showshow firms’ operation contributes to environmental preservation(e.g. COD and BOD reduction), social cohesion (e.g. employment,working conditions and stakeholder relationships) and economic
ologica
dosmts
cpTist2pbainaptaccbmicebsmcslitsr
dhaeiaccstomthwta
pebtpet
I.E. Nikolaou, T.A. Tsalis / Ec
evelopment (e.g. profit maximizing). The proposed methodol-gy provides a technique for transforming this information in atandard numeric scale in order to assist interested parties (e.g.anagers, investors, financial sector, local societies) in attending
he contribution either of a firm or a set of firms (that operate inimilar or different sector) to sustainable development.
Secondly, the proposed framework intends to improve theurrent environmental scoring–benchmarking techniques in therospect of measuring the corporate sustainability performance.he present techniques which are commonly accepted only helpn evaluating the completeness and the comprehensiveness ofustainability reports and not in measuring the corporate sus-ainability performance (Skouloudis et al., 2009; Morhardt et al.,002). This framework aims at overcoming such weaknesses byresenting a new technique to measure the corporate sustaina-ility performance through published sustainability reports. Thus,
twofold index is proposed which consists of: (a) an accountabilityndicator that measures the comprehensiveness and complete-ess of sustainability information based on GRI indicators and (b)
performance indicator that presents the evolutionary route oferformance for each GRI indicator as obtained from published sus-ainability reports. In order to measure the former indicator, a shortnd comprehensive measurement scale is proposed to reduce theonfusion brought about by current measurement techniques. Theurrent benchmarking–scoring techniques are very complicatedecause they propose various ways to quantify sustainability infor-ation such as: 1 when information mentioned is generic, 2 when
nformation mentioned is valuable, 3 when information is morelearly mentioned, and 4 when information is fully disclosed. Themployment of such unclear techniques might increase the possi-ility of two different researchers providing different scores for theame indicator of a sustainability report. Actually, the proposedethodology makes a meta-analysis of real sustainability indi-
ators (through new-proposed performance index) making themuitable for interested parties without requiring expertise. To thisogic, the findings show that the mining and extractive industrymplement much more practices than other sectors to achievehe basic goals of sustainability (e.g. financial, environmental andocial), while the food industry seems to give more weight to envi-onmental topics.
Thirdly, this paper provides empirical findings since data wasrawn from published sustainability reports and not merely fromypothetical examples extracted from the interviews of managersbout the score of sustainability indicators. The majority of currentmpirical SBSC studies collect information from questionnaires ornterview surveys on corporate sustainability management (Hsund Liu, 2010). The analysis of empirical data shows that finan-ial, mining and extractive, and food and beverage industries haveontributed more than other sectors to the economic aspect ofustainability. Whilst the food and beverage and telecommunica-ion industries have contributed more to the environmental aspectf sustainability. These sectors have implemented more environ-ental management practices and better performance indicators
han other sectors. According to social aspects, the financial sectoras contributed more to learning and growth of human resources,hile mining and extractive industry and oil and petroleum indus-
ry have contributed more to an extended set of stakeholders suchs the local community, local municipalities and regulators.
Fourthly, the proposed framework also aims at providing a com-lete picture of the corporate sustainability strategy. This maynsure that many stakeholder groups know about the sustaina-ility performance of firms. SBSC could provide a priori signal of
he level of completeness of the corporate sustainability, under theremise that BSC provides an overall picture of the corporate strat-gy (Kaplan and Norton, 1996). The findings show that the firmshat operate in the mining and oil industry and banking sector havel Indicators 34 (2013) 76– 86 85
adopted a more complete sustainability strategy following the SBSCrequirements. These firms contribute more than others to sustain-able development goals. This is a rational finding since they areplaced at the forefront of a range of financial and environmentalproblems.
Finally, this study has some limitations as every other study.The proposed framework works well when published environ-mental reports exist for over one year. In the opposite case whenan environmental report has been published for one year, an ini-tial difficulty is presented to calculate the performance indicator.To face such a difficulty, the methodology suggests each relevantsub-indicator to be given a 0-point score as in the case when theperformance level does not exist for the previous year. However,if a firm is reluctant to provide further information on their previ-ous performance then a further analysis should be made throughresearch on the premises of firms.
Appendix A.
Accountability sub-indicators (A) Performance sub-indicators (B)
AFinindicator =11∑
n=1
AF
and0 ≤ AFinindicator ≤ 22
PFinindicator =11∑
n=1
PF
and0 ≤ PFinindicator ≤ 22
AStakindicator =41∑
n=1
AS
and0 ≤ AStakindicator ≤ 82
PStakindicator =41∑
n=1
PS
and0 ≤ PStakindicator ≤ 82
AIPindicator =21∑
n=1
AIP
and0 ≤ AIPindicator ≤ 42
PIPindicator =21∑
n=1
PS
and0 ≤ PIPindicator ≤ 42
AL&Gindicator =6∑
n=1
ALG
and0 ≤ AL&Gindicator ≤ 12
PL&Gindicator =6∑
n=1
PLG
and0 ≤ PL&Gindicator ≤ 12
References
Atkinson, G., 2000. Measuring corporate sustainability. J. Environ. Plan. Manage. 43(2), 235–252.
Cerin, P., 2002. Characteristics of environmental reporters on the OM Stockholmexchange. Bus. Strategy Environ. 11, 298–311.
Cooper, S.M., Owen, D.L., 2007. Corporate social reporting and stakeholder account-ability: the missing link. Acc. Organ. Soc. 32, 649–667.
Daub, C.-H., 2007. Assessing the quality of sustainability reporting: an alternativemethodological approach. J. Clean. Prod. 15, 75–85.
Davis-Walling, P., Batterman, S.A., 1997. Environmental reporting by the Fortune50 firms. Environ. Manage. 21 (6), 865–875.
Deloitte Touche Tohmatsu, 2002. Deloitte Sustainability Reporting Scorecard.Deloitte Touche Tohmatsu Global Sustainability Group.
der Woerd, F., den Brink, T., 2004. Feasibility of a responsive business scorecard—apilot study. J. Bus. Ethics 55, 173–186.
Dias-Sardinha, I., Reijnders, L., 2005. Evaluating environmental and social perfor-mance of large Portuguese companies: a balanced scorecard approach. Bus.Strategy Environ. 14, 73–91.
Dias-Sardinha, I., Reijders, L., Antunes, P., 2002. From environmental performanceevaluation to eco-efficiency and sustainability balanced scorecards. Environ.Qual. Manage., 51–64.
Epstein, M.J., Roy, M.-J., 2001. Sustainability in action: identifying and measuringthe key performance drivers. Long Range Plan. 34, 585–604.
Epstein, M.J., Wisner, P.S., 2001. Using a balanced scorecard to implement sustaina-bility. Environ. Qual. Manage., 1–10.
Fernández, E., Junquera, B., Ordiz, M., 2003. Organizational culture and humanresources in the environmental issue: a review of the literature. Int. J. Hum.Resour. Manage. 14 (4), 634–656.
Figge, F., Hahn, T., Schaltegger, S., Wagner, M., 2002. The sustainability balancedscorecard lining sustainability management to business strategy. Bus. StrategyEnviron. 11, 269–284.
GRI, 2002. Sustainability Reporting Guidelines, Global Reporting Initiative, Amster-dam, Netherlands.

8 ologica
G
G
H
H
H
H
J
K
K
L
L
L
M
M
M
M
6 I.E. Nikolaou, T.A. Tsalis / Ec
uthrie, J., Farneti, F., 2008. GRI sustainability by Australian public sector organiza-tions. Public Money Manage. 28 (6), 361–366.
uthrie, J., Cuganesan, S., Ward, L., 2008. Industry specific social and environmentalreporting: the Australian food and Beverage industry. Acc. Forum 32, 1–15.
edberg, C.J., von Malmborg, F., 2003. The global reporting initiative and corpo-rate sustainability reporting in Swedish companies. Corp. Soc. Respons. Environ.Manage. 10, 153–164.
olland, L., Foo, Y.B., 2003. Differences in environmental reporting practices in theUK and the US: the legal and regulatory context. Brit. Acc. Rev. 32, 1–18.
su, Y.-L., Liu, C.-C., 2010. Environmental performance evaluation and strategymanagement using balanced scorecard. Environ. Monit. Assess. 170, 599–670.
ubbard, G., 2009. Measuring organizational performance: beyond the triple bot-tom line. Bus. Strategy Environ. 19, 177–191.
ohnson, S.D., 1998. Identification and selection of environmental performance indi-cators: application of the balance scorecard approach. Corp. Environ. Strategy 5(4), 34–41.
aplan, R., Norton, D., 1996. The Strategy-Focused Organization: How BalancedScorecard Companies Thrive in the New Business Environment. Harvard Busi-ness School Press, Boston.
olk, A., 1999. Evaluating corporate environmental reporting. Bus. Strategy Environ.8, 225–237.
änsiluoto, A., Järvenpää, M., 2008. Environmental and performance managementforces: integrating “greenness” into balanced scorecards. Qual. Res. Acc. Manage.5 (3), 184–206.
änsiluoto, A., Järvenpää, M., 2010. Greening the balanced scorecard. Bus. Horiz. 53(4), 385–395.
aurinkeviciute, A., Kinderyte, L., Stasiskiene, Z., 2008. Corporate decision-makingin furniture industry: weight of EMA and sustainability balanced scorecard.Environ. Res. Eng. Manage. 43 (1), 69–79.
öller, A., Schaltegger, S., 2005. The sustainability balanced scorecard as a frame-work for eco-efficiency analysis. J. Ind. Ecol. 9 (4), 73–82.
oneva, J.M., Archel, P., Correa, C., 2006. GRI and the camouflaging of corporateunsustainability. Acc. Forum 30, 121–137.
orhardt, J.E., 2001. Scoring corporate environmental reports for comprehensive-ness: a comparison of three systems. Environ. Manage. 27 (6), 881–892.
orhardt, J.E., Barird, S., Kelly Freeman, K., 2002. Scoring corporate environmentaland sustainability reports using GRI 2000, ISO 14031 and other criteria. Corp.Soc. Respons. Environ. Manage. 9, 215–233.
l Indicators 34 (2013) 76– 86
Munilla, L.S., Miles, M.P., 2005. The corporate social responsibility continuum as acomponent of stakeholder theory. Bus. Soc. Rev. 110 (4), 371–387.
Nakao, Y., Amano, A., Matsumura, K., Genba, K., Nakano, M., 2007. Rela-tionship between environmental performance and financial performance:an empirical analysis of Japanese corporations. Bus. Strategy Environ. 16,106–118.
Nikolaou, E.I., Evangelions, K.I., 2010. Classifying current social responsibilityaccounting methods for assisting a dialogue between business and society. Soc.Respons. J. 6 (4), 562–579.
Panayiotou, N.A., Aravossis, K.G., Moschou, P., 2009. A new methodology approachfor measuring corporate social responsibility performance. Water Air Soil Pollut.9, 129–138.
Perrini, F., Tencati, A., 2006. Sustainability and stakeholder management: the needfor new corporate performance evaluation and reporting systems. Bus. StrategyEnviron. 15, 296–308.
PSI, 2010. The Pacific Sustainability Index Scoring System, Robert EnvironmentalCenter (accessed 12.12.10).
Raar, J., 2002. Environmental initiatives: towards triple-bottom line reporting. Corp.Commun. Int. J. 7 (3), 169–183.
Shaw, S., Grant, D.B., 2010. Developing environmental supply chain performancemeasures. Benchmarking Int. J. 17 (3), 320–339.
Sidiropoulos, M., Mouzakitis, Y., Adamides, E., Goutsos, S., 2004. Applying sustain-able indicators to corporate strategy: the eco-balanced scorecard. Environ. Res.Eng. Manage. 1 (27), 28–33.
Skouloudis, A., Evangelinos, K., Kourmousis, F., 2009. Development of an evaluationmethodology for triple bottom line reports using international standards onreporting. Environ. Manage. 44, 298–311.
Skouloudis, A., Evangelinos, K., Kourmousis, F., 2010. Assessing non-financial reportsaccording to the Global Reporting Initiative guidelines: evidence from Greece. J.Clean. Prod. 18, 426–438.
Sustainability/UNEP, 2006. Tomorrow’s value: the global reporters 2006 survey ofcorporate sustainability reporting, sustainability. London.
Szekely, F., Knirsch, M., 2005. Responsible leadership and corporate social
responsibility: metrics for sustainable performance. Eur. Manage. J. 23 (6),628–647.Van Staden, C.J., Hooks, J., 2007. A comprehensive comparison of cor-porate environmental reporting and responsiveness. Brit. Acc. Rev. 39,197–210.