Embed Size (px)
Citation preview
Paper ID #16580
Development of a Test Stand for Determining the Torsional Rigidity of a For-mula SAE Space Frame
Ms. Amy Elizabeth Chambers, The Cooper Union
I am a current senior Mechanical Engineering student at The Cooper Union for the Advancement ofScience and Art in the Albert Nerken School of Engineering. I have been involved in the Formula SAEprogram for over 3 years. I am now a co-captain of the 40 member team and responsible for all powertrainsubsystems.
Mr. Sergio Anibal Rodriguez, The Cooper Union
I am a senior mechanical engineering student at The Cooper Union. I have been a part of the FormulaSAE team for over 4 years now and I am the captain in charge of suspension systems.
Mr. Robert Michael Walsh, The Cooper Union
I am a current senior Mechanical Engineering student at The Cooper Union for the Advancement ofScience and Art, Albert Nerken School of Engineering. For my four undergraduate years, I have beenheavily involved in the Formula SAE team, working with various different subsystems on the car. For twoyears, I have been a co-captain of the team in charge of all the frame and body systems.
Dr. David Wootton, Cooper Union
Education BS Mechanical Engineering Cornell University, 1987 MS Mechanical Engineering MIT, 1990PhD Mechanical Engineering Georgia Tech, 1998 Postdoc Biomedical Engineering, Johns Hopkins,1998-2000
Professional Noise and Vibrations Consultant, Harris Miller Miller and Hanson, Lexington, MA, 1987-1990 Crashworthiness and Safety Engineer, General Motors Corporation, Warren, MI, 1990-1994 Assis-tant Professor, Mechanical Engineering, Drexel Univeristy, Philadelphia PA 2000-2006 Associate Pro-fessor, Mechanical Engineering, Cooper Union, New York, NY, 2006-2014 Professor, Mechanical Engi-neering, Cooper Union, New York, NY, 2014-present Director, Maurice Kanbar Center for BiomedicalEngineering, Cooper Union, 2007-present
c©American Society for Engineering Education, 2016
Development of a Test Stand for Determining the Torsional
Rigidity of a Formula SAE Space Frame
Abstract
This paper outlines the development of an economical and high-accuracy test stand to determine
the torsional rigidity of a Formula SAE space frame. Originating as a final project from the
Engineering Experimentation course at The Cooper Union, the student-designed and
manufactured torsional test-stand has become a permanent fixture in the Automotive Lab. The
test stand consisted of a lever arm rigidly attached to the front axle, which constrained it from
rotation about the axle, in order to apply a torque to simulate suspension loading. The rear axle
was fixed in all three degrees of translational freedom and two degrees of rotational freedom.
The instrumentation consisted of nine low cost laser pointers attached along the length of the
frame at key locations that projected onto graph paper to magnify the small angular deflections.
Using basic mechanics of materials, a model relating the angular deflection and the applied
torque was used in order to determine the torsional rigidity of the frame. The results include the
determination of the torsional rigidity along the frame, the calculated torsional rigidity at the
point of interest (the front axle), and a comparison to a finite-element model. The torsional
stiffness at the front axle was calculated experimentally to be 1187 ft-lb/degree. The FEA model
predicted a torsional stiffness of 1100 ft-lb/degree, which is within 10% of the experimentally
determined value. The cost of the entire experimental setup was approximately $375, making it a
low-cost solution to a typically expensive experiment. This experimental rig has become a
research platform in The Cooper Union’s Automotive Lab with uses in various courses and high
school level STEM outreach programs.
Motivation
The initial motivation for this experiment came from the ME160 Engineering Experimentation
course at The Cooper Union. Engineering Experimentation places emphasis on “data collection
and statistical reduction, computational methods, and written and oral presentation skills”1. The
course grading relies significantly on a student’s ability to design, manufacture, implement, and
present the results of a final experiment. The experiment itself was left open ended, allowing the
groups of three to four students free rein to explore systems that they were interested in. The
project team included three active members of the Formula SAE team at The Cooper Union, an
extracurricular team that designs and builds a Formula style racecar. Therefore, the project team
decided to pursue an experiment related to the suspension performance of the Formula SAE
vehicle: designing an experiment to determine the torsional rigidity of the vehicle’s space frame.
Theory
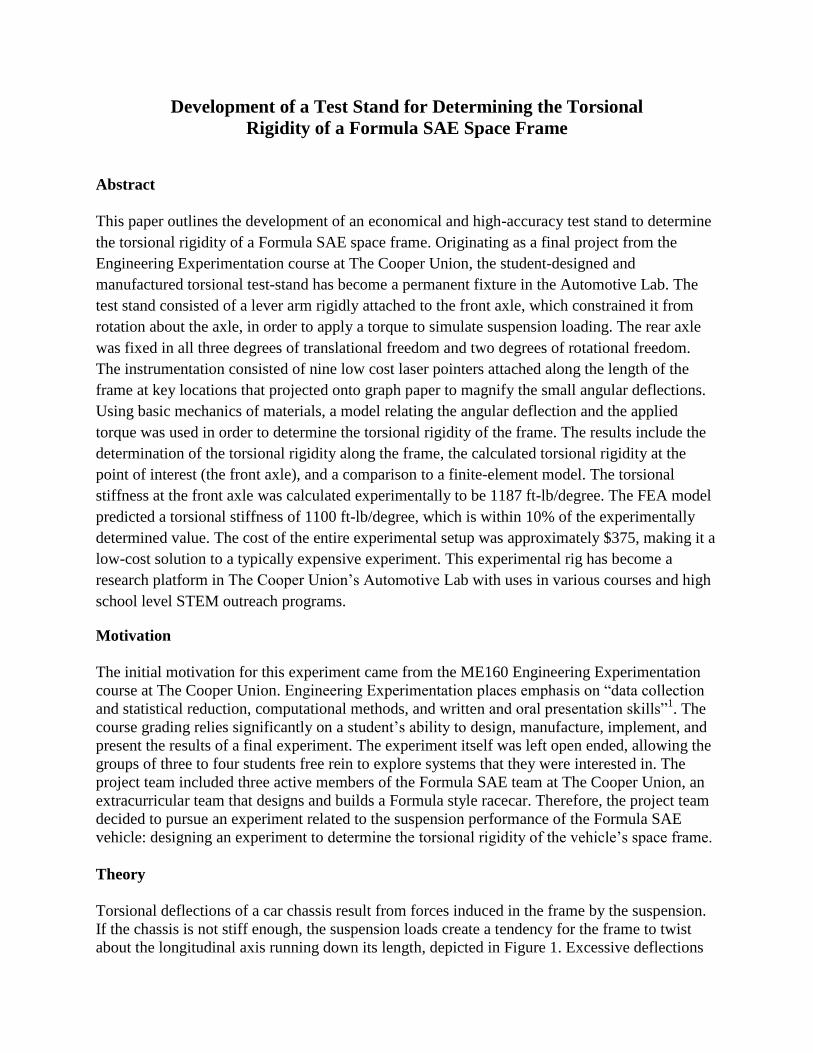
Torsional deflections of a car chassis result from forces induced in the frame by the suspension.
If the chassis is not stiff enough, the suspension loads create a tendency for the frame to twist
about the longitudinal axis running down its length, depicted in Figure 1. Excessive deflections
make control of lateral load transfer, one of the primary functions of a car’s suspension, difficult,
if not impossible2.Therefore, the torsional rigidity of the frame is critical to the dynamic
performance of the car.
Figure 1: Schematic showing torsion in chassis.
3
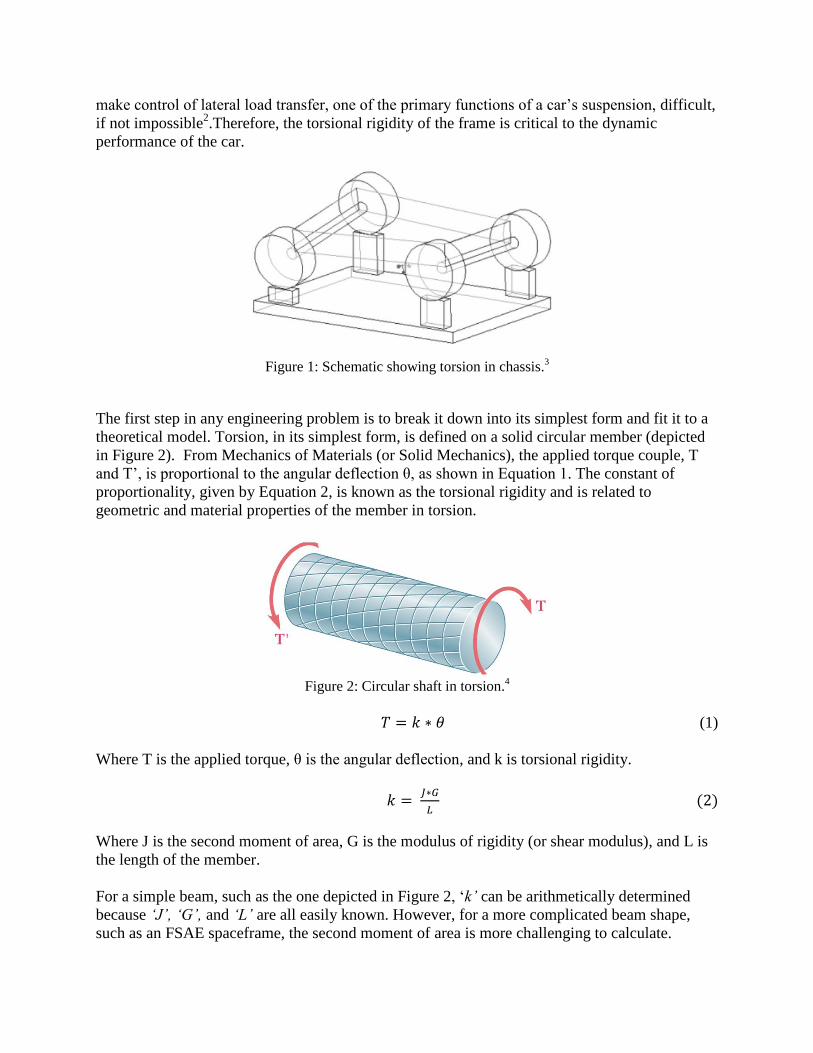
The first step in any engineering problem is to break it down into its simplest form and fit it to a
theoretical model. Torsion, in its simplest form, is defined on a solid circular member (depicted
in Figure 2). From Mechanics of Materials (or Solid Mechanics), the applied torque couple, T
and T’, is proportional to the angular deflection θ, as shown in Equation 1. The constant of
proportionality, given by Equation 2, is known as the torsional rigidity and is related to
geometric and material properties of the member in torsion.
Figure 2: Circular shaft in torsion.
4
𝑇 = 𝑘 ∗ 𝜃 (1)
Where T is the applied torque, θ is the angular deflection, and k is torsional rigidity.
𝑘 = 𝐽∗𝐺
𝐿 (2)
Where J is the second moment of area, G is the modulus of rigidity (or shear modulus), and L is
the length of the member.
For a simple beam, such as the one depicted in Figure 2, ‘k’ can be arithmetically determined
because ‘J’, ‘G’, and ‘L’ are all easily known. However, for a more complicated beam shape,
such as an FSAE spaceframe, the second moment of area is more challenging to calculate.
Instead, an experiment can be run in which different torques are used to measure angular
deflections. Theory says that these values plotted against each other should be linear as long as
the experiment remained within the elastic range of the material. A linear trend analysis is used
to determine torsional rigidity, which is no longer constant because ‘J’ becomes a function of
position for irregular beams.
Apparatus
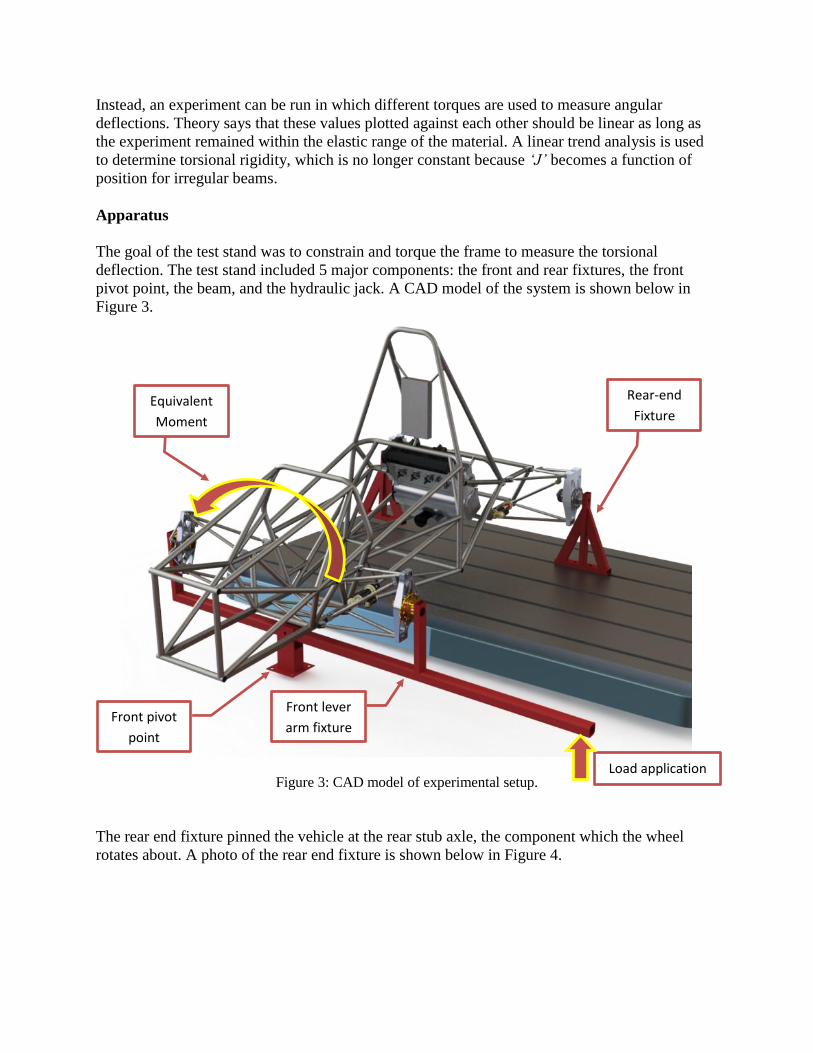
The goal of the test stand was to constrain and torque the frame to measure the torsional
deflection. The test stand included 5 major components: the front and rear fixtures, the front
pivot point, the beam, and the hydraulic jack. A CAD model of the system is shown below in
Figure 3.
Figure 3: CAD model of experimental setup.
The rear end fixture pinned the vehicle at the rear stub axle, the component which the wheel
rotates about. A photo of the rear end fixture is shown below in Figure 4.
Rear-end
Fixture
Front pivot
point
Front lever
arm fixture
Load application
Equivalent
Moment
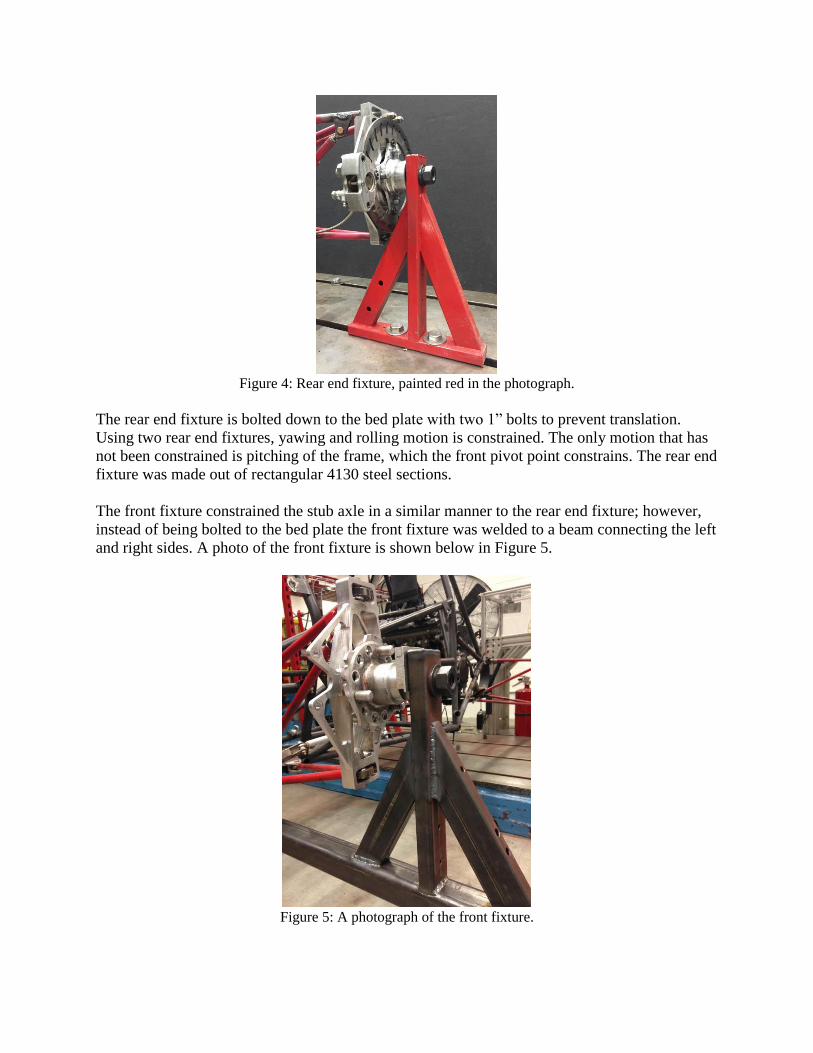
Figure 4: Rear end fixture, painted red in the photograph.
The rear end fixture is bolted down to the bed plate with two 1” bolts to prevent translation.
Using two rear end fixtures, yawing and rolling motion is constrained. The only motion that has
not been constrained is pitching of the frame, which the front pivot point constrains. The rear end
fixture was made out of rectangular 4130 steel sections.
The front fixture constrained the stub axle in a similar manner to the rear end fixture; however,
instead of being bolted to the bed plate the front fixture was welded to a beam connecting the left
and right sides. A photo of the front fixture is shown below in Figure 5.
Figure 5: A photograph of the front fixture.
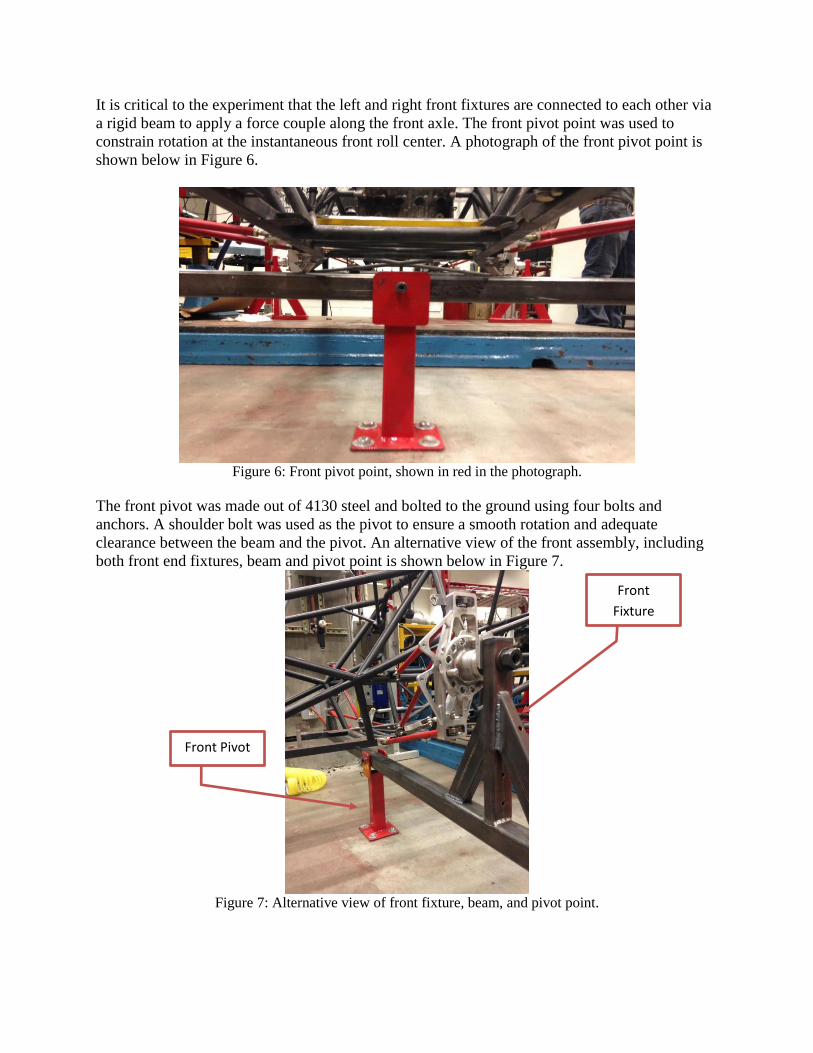
It is critical to the experiment that the left and right front fixtures are connected to each other via
a rigid beam to apply a force couple along the front axle. The front pivot point was used to
constrain rotation at the instantaneous front roll center. A photograph of the front pivot point is
shown below in Figure 6.
Figure 6: Front pivot point, shown in red in the photograph.
The front pivot was made out of 4130 steel and bolted to the ground using four bolts and
anchors. A shoulder bolt was used as the pivot to ensure a smooth rotation and adequate
clearance between the beam and the pivot. An alternative view of the front assembly, including
both front end fixtures, beam and pivot point is shown below in Figure 7.
Figure 7: Alternative view of front fixture, beam, and pivot point.
Front
Fixture
Front Pivot
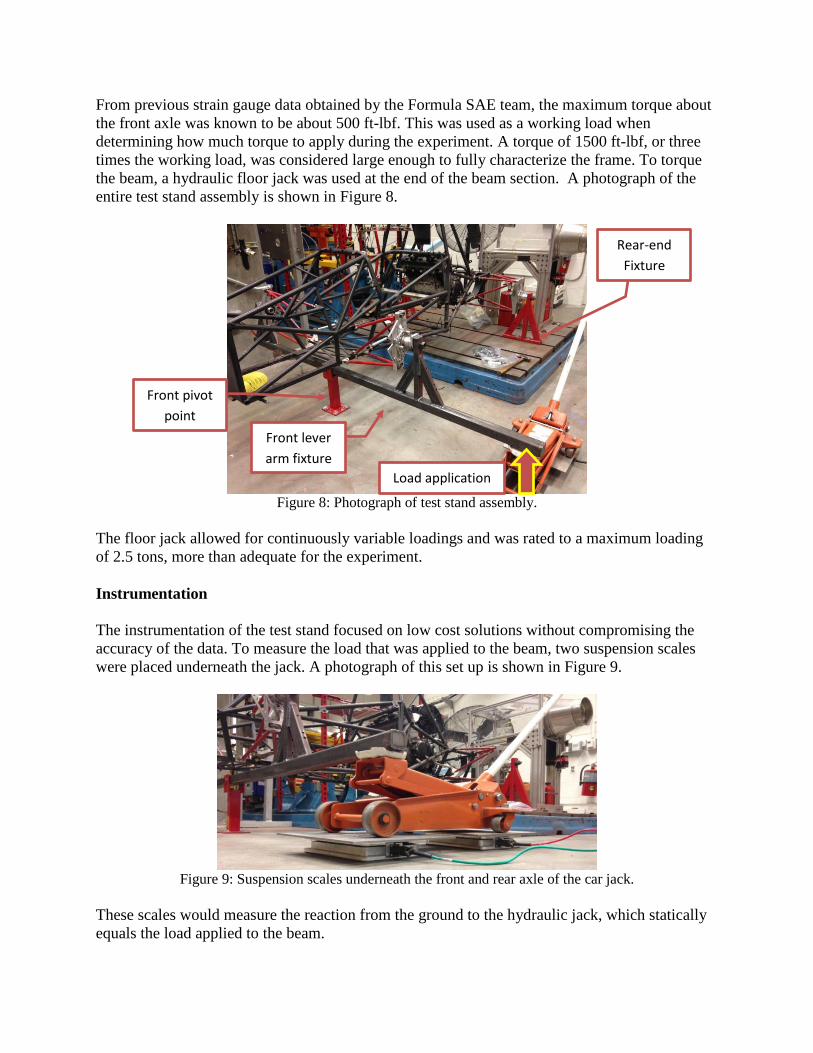
From previous strain gauge data obtained by the Formula SAE team, the maximum torque about
the front axle was known to be about 500 ft-lbf. This was used as a working load when
determining how much torque to apply during the experiment. A torque of 1500 ft-lbf, or three
times the working load, was considered large enough to fully characterize the frame. To torque
the beam, a hydraulic floor jack was used at the end of the beam section. A photograph of the
entire test stand assembly is shown in Figure 8.
Figure 8: Photograph of test stand assembly.
The floor jack allowed for continuously variable loadings and was rated to a maximum loading
of 2.5 tons, more than adequate for the experiment.
Instrumentation
The instrumentation of the test stand focused on low cost solutions without compromising the
accuracy of the data. To measure the load that was applied to the beam, two suspension scales
were placed underneath the jack. A photograph of this set up is shown in Figure 9.
Figure 9: Suspension scales underneath the front and rear axle of the car jack.
These scales would measure the reaction from the ground to the hydraulic jack, which statically
equals the load applied to the beam.
Rear-end
Fixture
Front pivot
point
Front lever
arm fixture
Load application
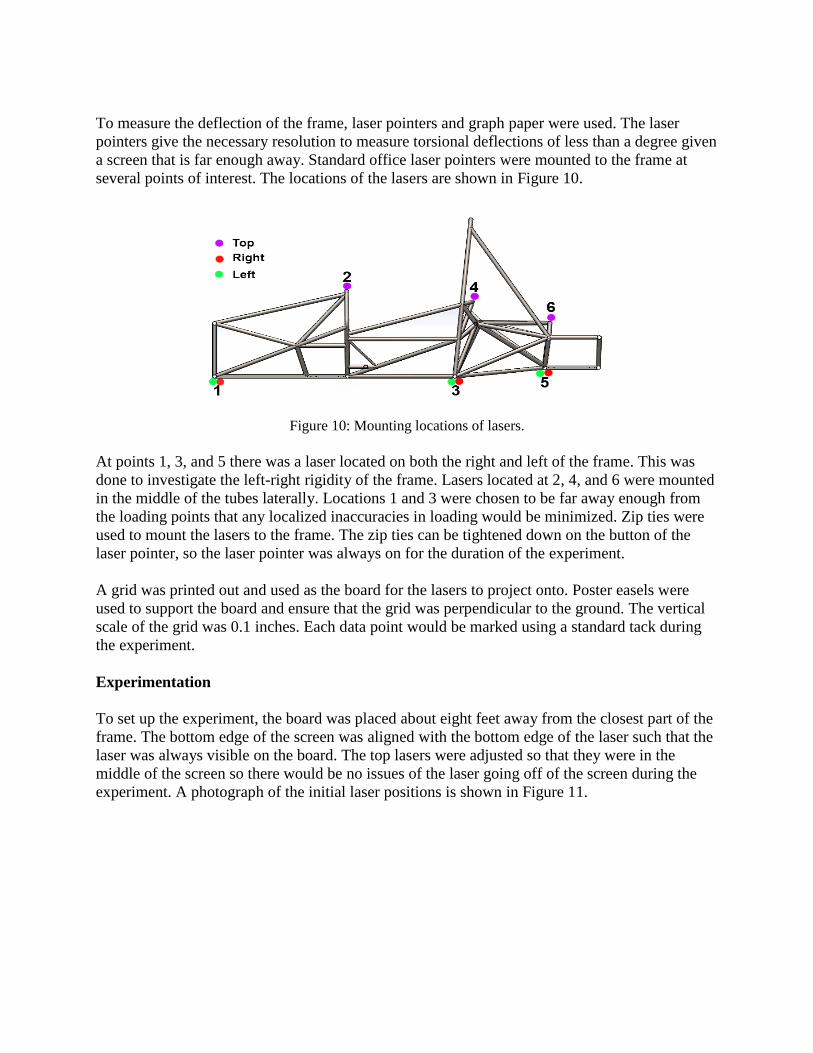
To measure the deflection of the frame, laser pointers and graph paper were used. The laser
pointers give the necessary resolution to measure torsional deflections of less than a degree given
a screen that is far enough away. Standard office laser pointers were mounted to the frame at
several points of interest. The locations of the lasers are shown in Figure 10.
Figure 10: Mounting locations of lasers.
At points 1, 3, and 5 there was a laser located on both the right and left of the frame. This was
done to investigate the left-right rigidity of the frame. Lasers located at 2, 4, and 6 were mounted
in the middle of the tubes laterally. Locations 1 and 3 were chosen to be far away enough from
the loading points that any localized inaccuracies in loading would be minimized. Zip ties were
used to mount the lasers to the frame. The zip ties can be tightened down on the button of the
laser pointer, so the laser pointer was always on for the duration of the experiment.
A grid was printed out and used as the board for the lasers to project onto. Poster easels were
used to support the board and ensure that the grid was perpendicular to the ground. The vertical
scale of the grid was 0.1 inches. Each data point would be marked using a standard tack during
the experiment.
Experimentation
To set up the experiment, the board was placed about eight feet away from the closest part of the
frame. The bottom edge of the screen was aligned with the bottom edge of the laser such that the
laser was always visible on the board. The top lasers were adjusted so that they were in the
middle of the screen so there would be no issues of the laser going off of the screen during the
experiment. A photograph of the initial laser positions is shown in Figure 11.
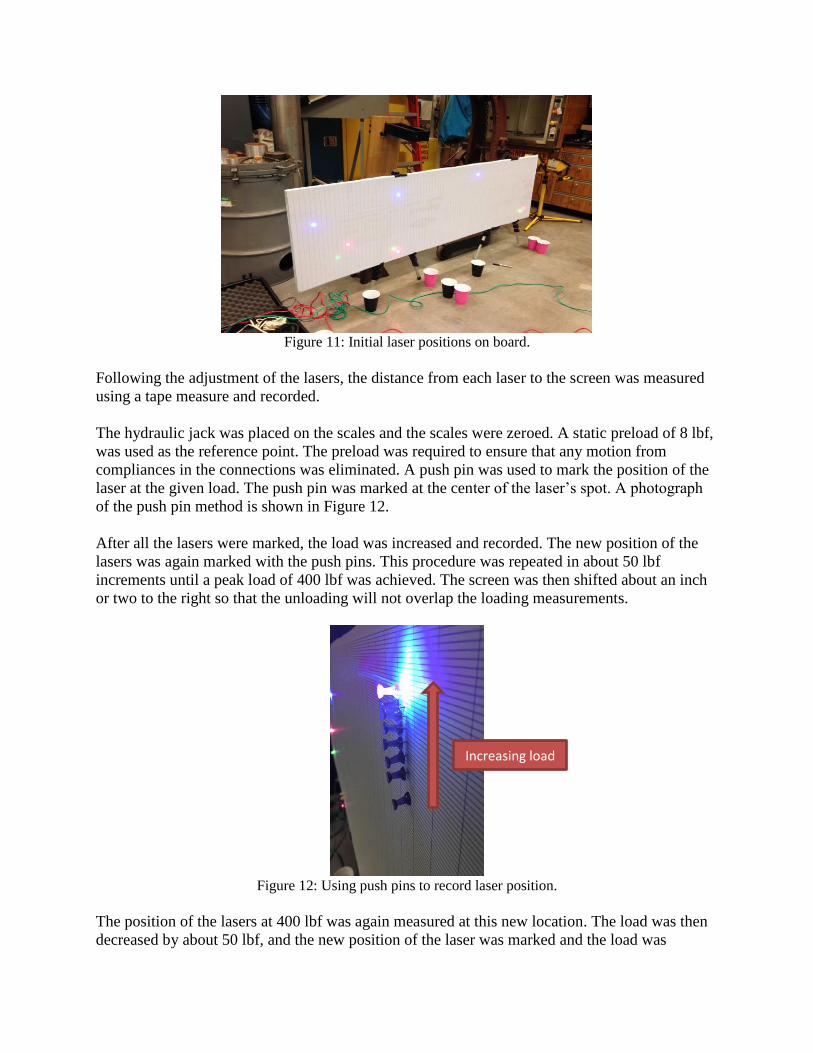
Figure 11: Initial laser positions on board.
Following the adjustment of the lasers, the distance from each laser to the screen was measured
using a tape measure and recorded.
The hydraulic jack was placed on the scales and the scales were zeroed. A static preload of 8 lbf,
was used as the reference point. The preload was required to ensure that any motion from
compliances in the connections was eliminated. A push pin was used to mark the position of the
laser at the given load. The push pin was marked at the center of the laser’s spot. A photograph
of the push pin method is shown in Figure 12.
After all the lasers were marked, the load was increased and recorded. The new position of the
lasers was again marked with the push pins. This procedure was repeated in about 50 lbf
increments until a peak load of 400 lbf was achieved. The screen was then shifted about an inch
or two to the right so that the unloading will not overlap the loading measurements.
Figure 12: Using push pins to record laser position.
The position of the lasers at 400 lbf was again measured at this new location. The load was then
decreased by about 50 lbf, and the new position of the laser was marked and the load was
Increasing load

recorded. This unloading scheme was continued in about 50 lbf increments until a loading
approximately equal to the first data point, not the preload, was achieved.
Data Collection and Calculation
The measured data included the vertical displacement of the lasers, various geometries of the
system, and the force applied to the lever arm. The geometries that were measured included the
length of the moment arm, the wheelbase, the distance of the lasers along the length of the frame,
and the distance from each laser to the board. Using these values, the angular deflection was
calculated using basic trigonometry. The triangle used to calculate the angular deflection is
shown in Figure 13.
Figure 13: Triangle used to calculate angular deflection.
As shown in Figure 13, the angular deflection can be calculated to be:
𝑎𝑛𝑔𝑢𝑙𝑎𝑟 𝑑𝑒𝑓𝑙𝑒𝑐𝑡𝑖𝑜𝑛 = 𝜃 = tan−1 (𝑣𝑒𝑟𝑡𝑖𝑐𝑎𝑙 𝑑𝑖𝑠𝑝𝑙𝑎𝑐𝑒𝑚𝑒𝑛𝑡 𝑜𝑓 𝑙𝑎𝑠𝑒𝑟
𝐷𝑖𝑠𝑡𝑎𝑛𝑐𝑒 𝑓𝑟𝑜𝑚 𝑙𝑎𝑠𝑒𝑟 𝑡𝑜 𝑏𝑜𝑎𝑟𝑑) (3)
After calculating the angular deflection, these points were then plotted against the torque applied
to the frame. The torque applied to the frame can be calculated from Equation 4:
𝑇𝑜𝑟𝑞𝑢𝑒 = 𝑇 = 𝑚𝑜𝑚𝑒𝑛𝑡 𝑎𝑟𝑚 ∗ 𝑓𝑜𝑟𝑐𝑒 𝑎𝑝𝑝𝑙𝑖𝑒𝑑 (4)
In this case, the moment arm is taken to be the distance between the applied load and the pivot
point. The force applied is taken to be the indicated force minus the weight of the hydraulic jack.
Data Presentation
Initially, the vertical deflection of the lasers was plotted against the laser position. This is shown
in Figure 14. The right side lasers were omitted in this graph.
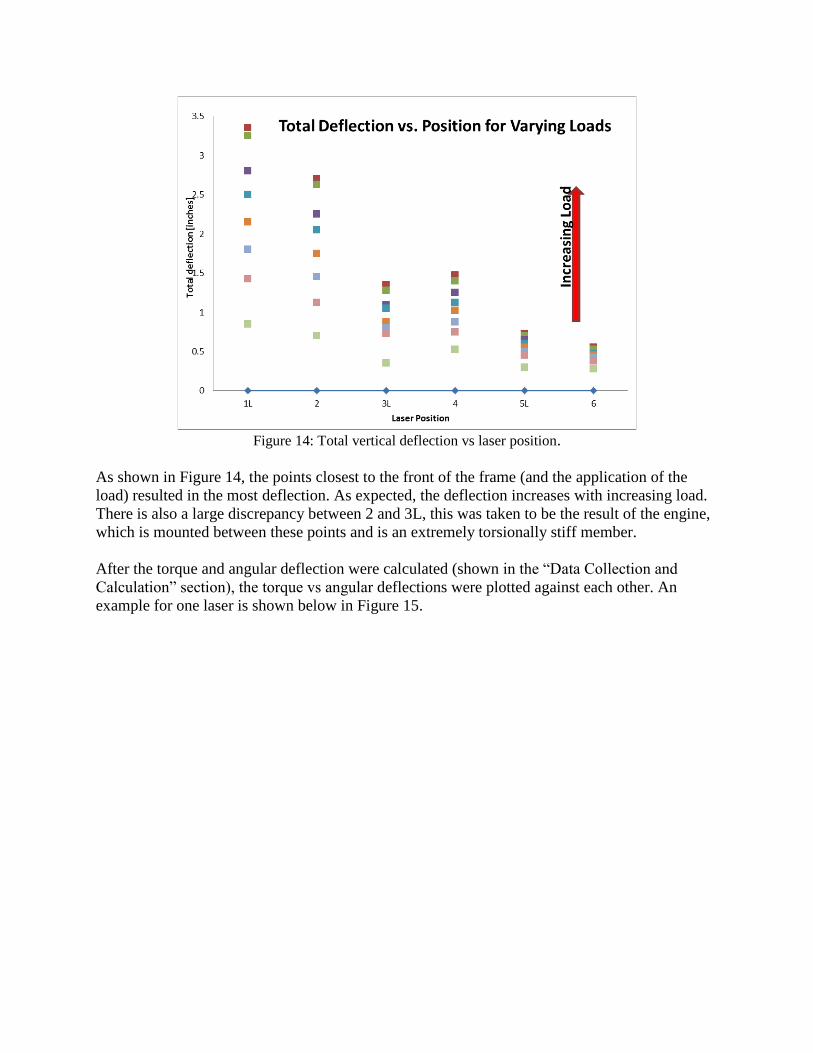
Figure 14: Total vertical deflection vs laser position.
As shown in Figure 14, the points closest to the front of the frame (and the application of the
load) resulted in the most deflection. As expected, the deflection increases with increasing load.
There is also a large discrepancy between 2 and 3L, this was taken to be the result of the engine,
which is mounted between these points and is an extremely torsionally stiff member.
After the torque and angular deflection were calculated (shown in the “Data Collection and
Calculation” section), the torque vs angular deflections were plotted against each other. An
example for one laser is shown below in Figure 15.
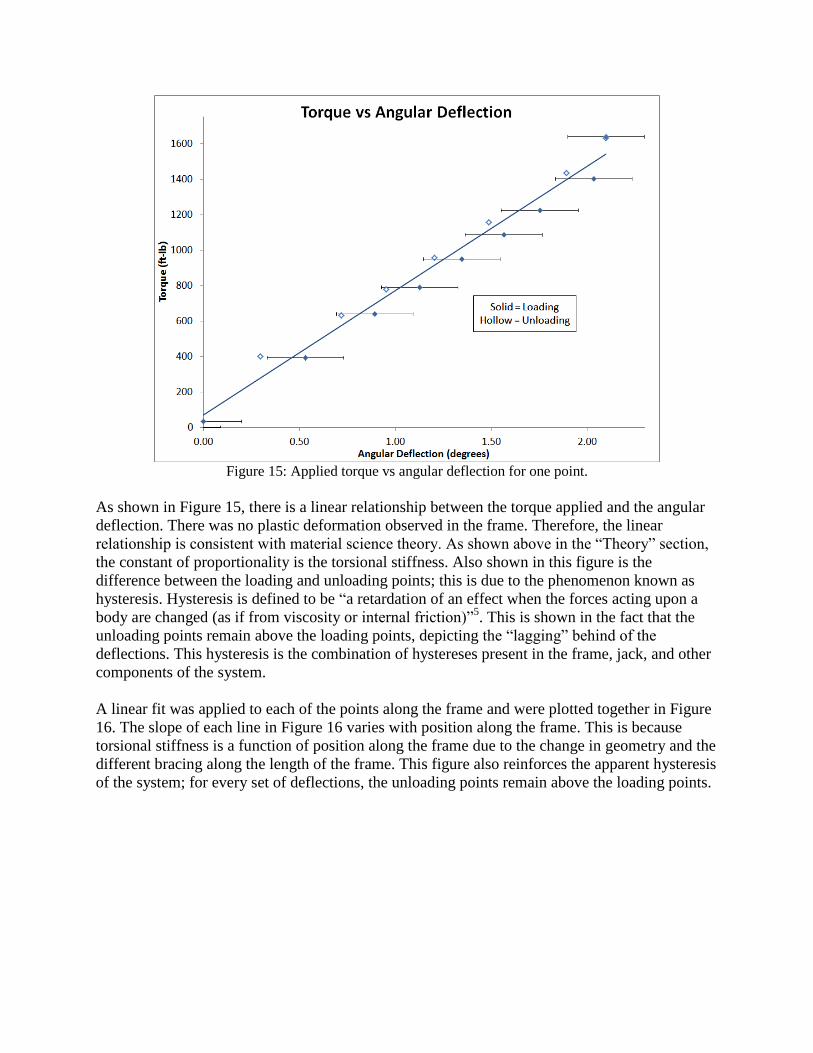
Figure 15: Applied torque vs angular deflection for one point.
As shown in Figure 15, there is a linear relationship between the torque applied and the angular
deflection. There was no plastic deformation observed in the frame. Therefore, the linear
relationship is consistent with material science theory. As shown above in the “Theory” section,
the constant of proportionality is the torsional stiffness. Also shown in this figure is the
difference between the loading and unloading points; this is due to the phenomenon known as
hysteresis. Hysteresis is defined to be “a retardation of an effect when the forces acting upon a
body are changed (as if from viscosity or internal friction)”5. This is shown in the fact that the
unloading points remain above the loading points, depicting the “lagging” behind of the
deflections. This hysteresis is the combination of hystereses present in the frame, jack, and other
components of the system.
A linear fit was applied to each of the points along the frame and were plotted together in Figure
16. The slope of each line in Figure 16 varies with position along the frame. This is because
torsional stiffness is a function of position along the frame due to the change in geometry and the
different bracing along the length of the frame. This figure also reinforces the apparent hysteresis
of the system; for every set of deflections, the unloading points remain above the loading points.
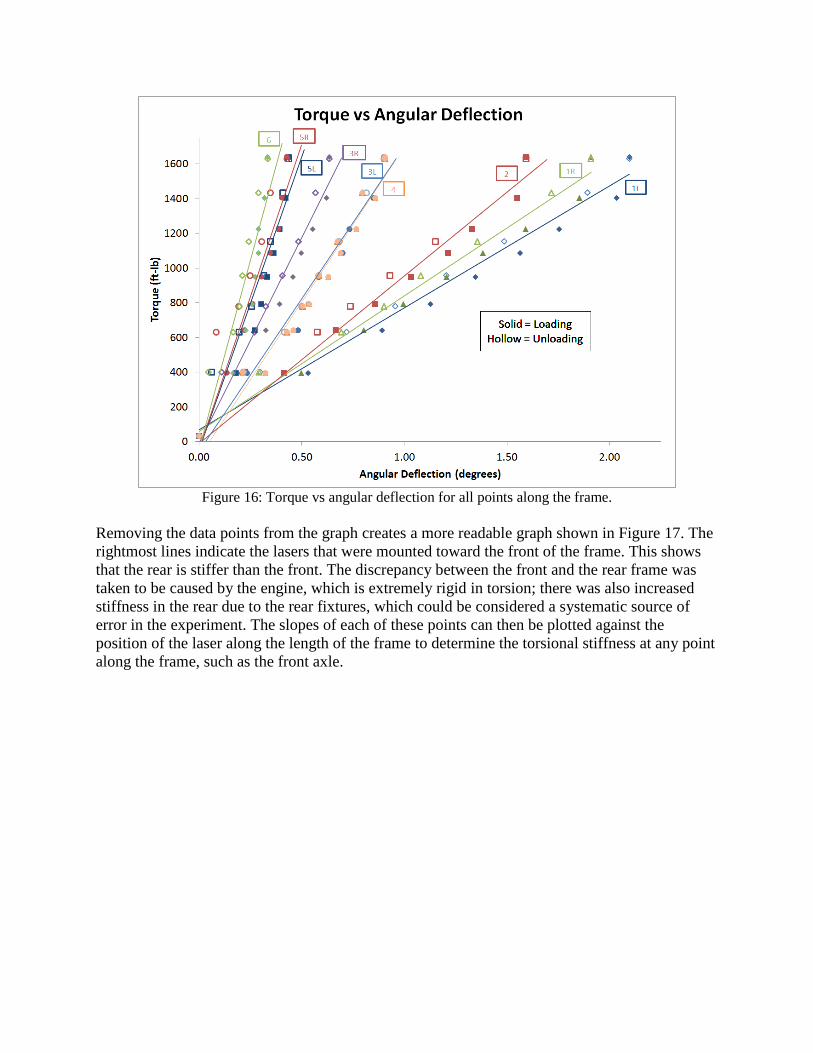
Figure 16: Torque vs angular deflection for all points along the frame.
Removing the data points from the graph creates a more readable graph shown in Figure 17. The
rightmost lines indicate the lasers that were mounted toward the front of the frame. This shows
that the rear is stiffer than the front. The discrepancy between the front and the rear frame was
taken to be caused by the engine, which is extremely rigid in torsion; there was also increased
stiffness in the rear due to the rear fixtures, which could be considered a systematic source of
error in the experiment. The slopes of each of these points can then be plotted against the
position of the laser along the length of the frame to determine the torsional stiffness at any point
along the frame, such as the front axle.
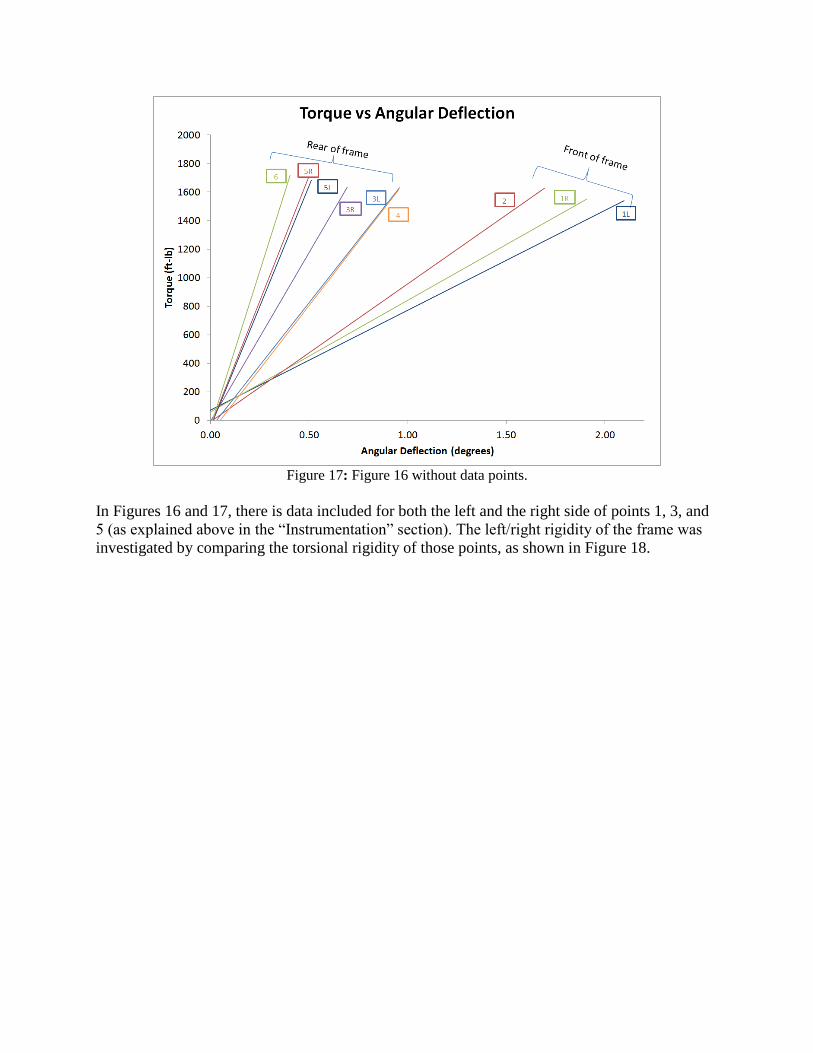
Figure 17: Figure 16 without data points.
In Figures 16 and 17, there is data included for both the left and the right side of points 1, 3, and
5 (as explained above in the “Instrumentation” section). The left/right rigidity of the frame was
investigated by comparing the torsional rigidity of those points, as shown in Figure 18.
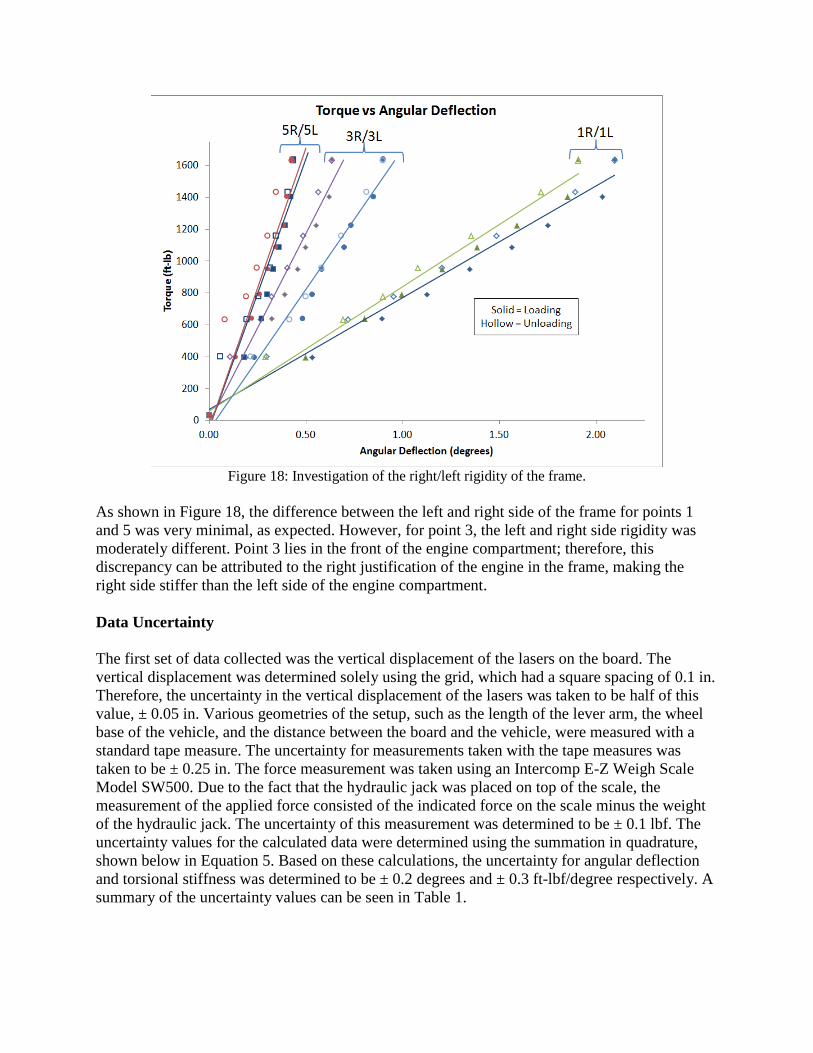
Figure 18: Investigation of the right/left rigidity of the frame.
As shown in Figure 18, the difference between the left and right side of the frame for points 1
and 5 was very minimal, as expected. However, for point 3, the left and right side rigidity was
moderately different. Point 3 lies in the front of the engine compartment; therefore, this
discrepancy can be attributed to the right justification of the engine in the frame, making the
right side stiffer than the left side of the engine compartment.
Data Uncertainty
The first set of data collected was the vertical displacement of the lasers on the board. The
vertical displacement was determined solely using the grid, which had a square spacing of 0.1 in.
Therefore, the uncertainty in the vertical displacement of the lasers was taken to be half of this
value, ± 0.05 in. Various geometries of the setup, such as the length of the lever arm, the wheel
base of the vehicle, and the distance between the board and the vehicle, were measured with a
standard tape measure. The uncertainty for measurements taken with the tape measures was
taken to be ± 0.25 in. The force measurement was taken using an Intercomp E-Z Weigh Scale
Model SW500. Due to the fact that the hydraulic jack was placed on top of the scale, the
measurement of the applied force consisted of the indicated force on the scale minus the weight
of the hydraulic jack. The uncertainty of this measurement was determined to be ± 0.1 lbf. The
uncertainty values for the calculated data were determined using the summation in quadrature,
shown below in Equation 5. Based on these calculations, the uncertainty for angular deflection
and torsional stiffness was determined to be ± 0.2 degrees and ± 0.3 ft-lbf/degree respectively. A
summary of the uncertainty values can be seen in Table 1.
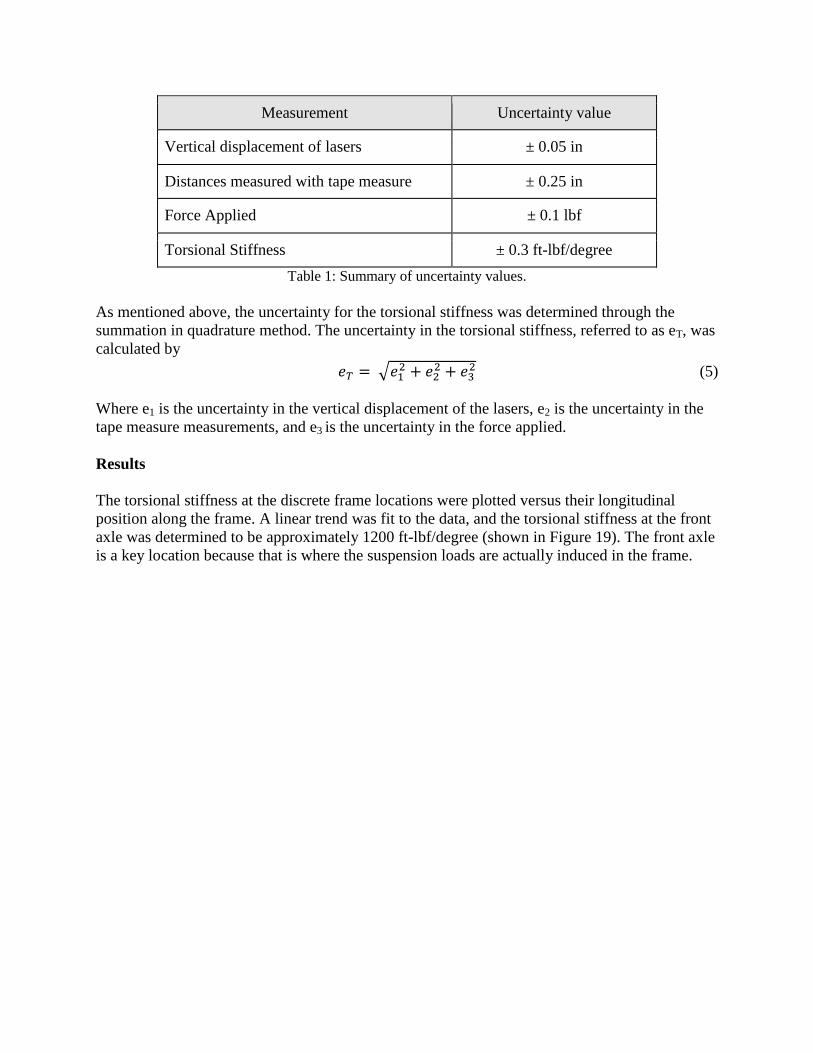
Measurement Uncertainty value
Vertical displacement of lasers ± 0.05 in
Distances measured with tape measure ± 0.25 in
Force Applied ± 0.1 lbf
Torsional Stiffness ± 0.3 ft-lbf/degree
Table 1: Summary of uncertainty values.
As mentioned above, the uncertainty for the torsional stiffness was determined through the
summation in quadrature method. The uncertainty in the torsional stiffness, referred to as eT, was
calculated by
𝑒𝑇 = √𝑒12 + 𝑒2
2 + 𝑒32 (5)
Where e1 is the uncertainty in the vertical displacement of the lasers, e2 is the uncertainty in the
tape measure measurements, and e3 is the uncertainty in the force applied.
Results
The torsional stiffness at the discrete frame locations were plotted versus their longitudinal
position along the frame. A linear trend was fit to the data, and the torsional stiffness at the front
axle was determined to be approximately 1200 ft-lbf/degree (shown in Figure 19). The front axle
is a key location because that is where the suspension loads are actually induced in the frame.
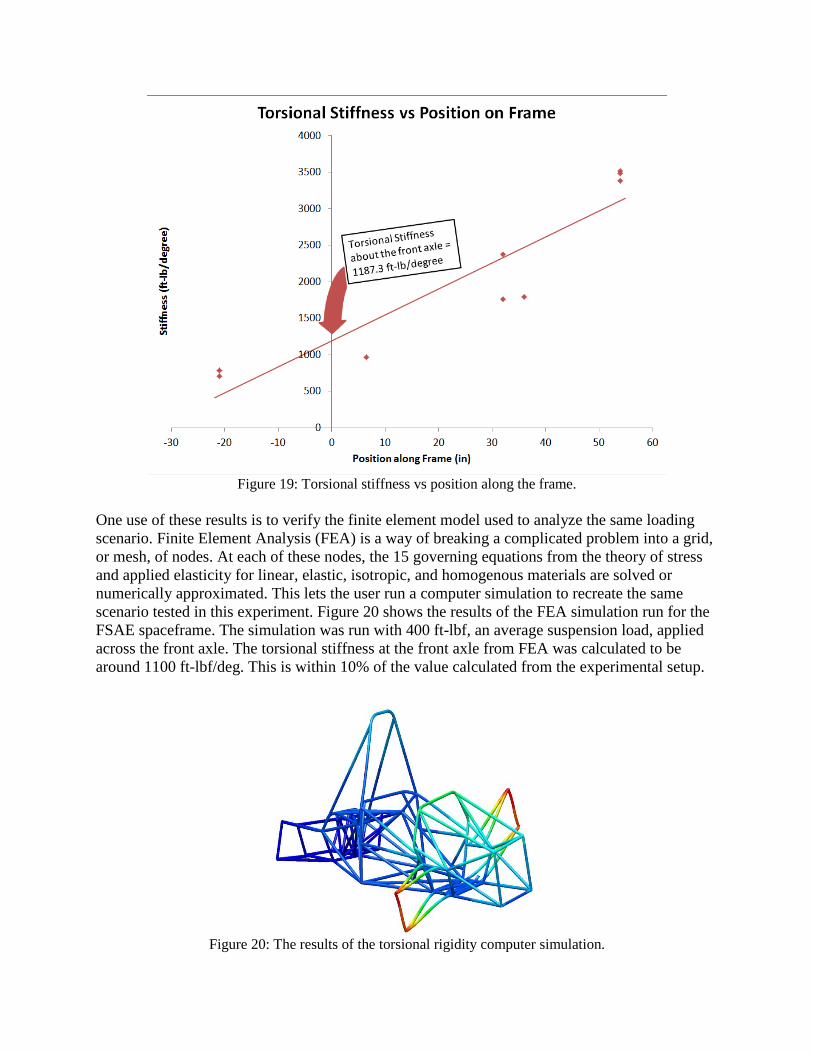
Figure 19: Torsional stiffness vs position along the frame.
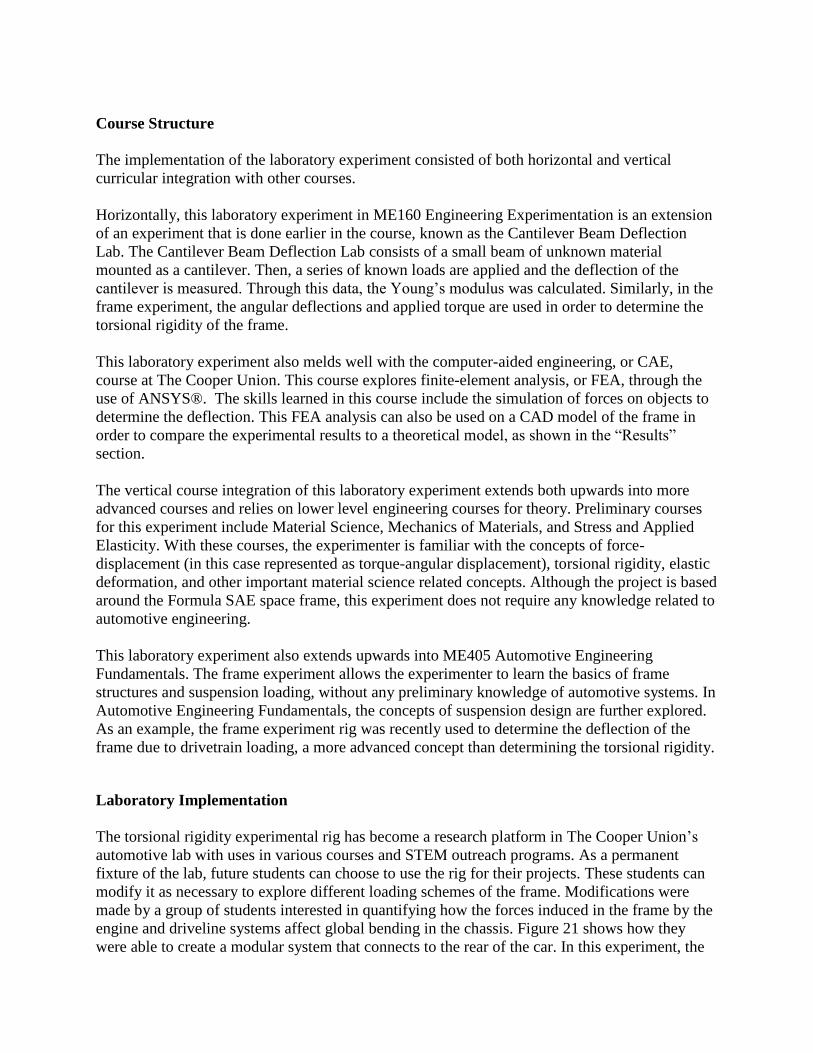
One use of these results is to verify the finite element model used to analyze the same loading
scenario. Finite Element Analysis (FEA) is a way of breaking a complicated problem into a grid,
or mesh, of nodes. At each of these nodes, the 15 governing equations from the theory of stress
and applied elasticity for linear, elastic, isotropic, and homogenous materials are solved or
numerically approximated. This lets the user run a computer simulation to recreate the same
scenario tested in this experiment. Figure 20 shows the results of the FEA simulation run for the
FSAE spaceframe. The simulation was run with 400 ft-lbf, an average suspension load, applied
across the front axle. The torsional stiffness at the front axle from FEA was calculated to be
around 1100 ft-lbf/deg. This is within 10% of the value calculated from the experimental setup.
Figure 20: The results of the torsional rigidity computer simulation.
Course Structure
The implementation of the laboratory experiment consisted of both horizontal and vertical
curricular integration with other courses.
Horizontally, this laboratory experiment in ME160 Engineering Experimentation is an extension
of an experiment that is done earlier in the course, known as the Cantilever Beam Deflection
Lab. The Cantilever Beam Deflection Lab consists of a small beam of unknown material
mounted as a cantilever. Then, a series of known loads are applied and the deflection of the
cantilever is measured. Through this data, the Young’s modulus was calculated. Similarly, in the
frame experiment, the angular deflections and applied torque are used in order to determine the
torsional rigidity of the frame.
This laboratory experiment also melds well with the computer-aided engineering, or CAE,
course at The Cooper Union. This course explores finite-element analysis, or FEA, through the
use of ANSYS®. The skills learned in this course include the simulation of forces on objects to
determine the deflection. This FEA analysis can also be used on a CAD model of the frame in
order to compare the experimental results to a theoretical model, as shown in the “Results”
section.
The vertical course integration of this laboratory experiment extends both upwards into more
advanced courses and relies on lower level engineering courses for theory. Preliminary courses
for this experiment include Material Science, Mechanics of Materials, and Stress and Applied
Elasticity. With these courses, the experimenter is familiar with the concepts of force-
displacement (in this case represented as torque-angular displacement), torsional rigidity, elastic
deformation, and other important material science related concepts. Although the project is based
around the Formula SAE space frame, this experiment does not require any knowledge related to
automotive engineering.
This laboratory experiment also extends upwards into ME405 Automotive Engineering
Fundamentals. The frame experiment allows the experimenter to learn the basics of frame
structures and suspension loading, without any preliminary knowledge of automotive systems. In
Automotive Engineering Fundamentals, the concepts of suspension design are further explored.
As an example, the frame experiment rig was recently used to determine the deflection of the
frame due to drivetrain loading, a more advanced concept than determining the torsional rigidity.
Laboratory Implementation
The torsional rigidity experimental rig has become a research platform in The Cooper Union’s
automotive lab with uses in various courses and STEM outreach programs. As a permanent
fixture of the lab, future students can choose to use the rig for their projects. These students can
modify it as necessary to explore different loading schemes of the frame. Modifications were
made by a group of students interested in quantifying how the forces induced in the frame by the
engine and driveline systems affect global bending in the chassis. Figure 21 shows how they
were able to create a modular system that connects to the rear of the car. In this experiment, the
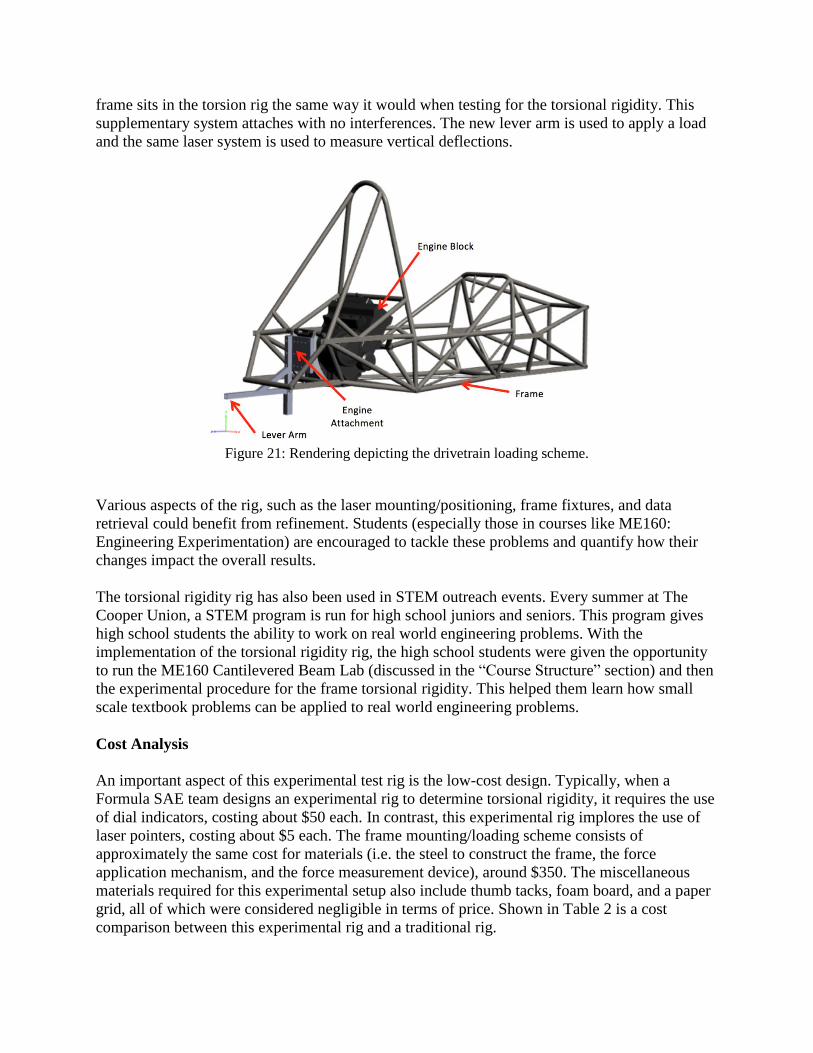
frame sits in the torsion rig the same way it would when testing for the torsional rigidity. This
supplementary system attaches with no interferences. The new lever arm is used to apply a load
and the same laser system is used to measure vertical deflections.
Figure 21: Rendering depicting the drivetrain loading scheme.
Various aspects of the rig, such as the laser mounting/positioning, frame fixtures, and data
retrieval could benefit from refinement. Students (especially those in courses like ME160:
Engineering Experimentation) are encouraged to tackle these problems and quantify how their
changes impact the overall results.
The torsional rigidity rig has also been used in STEM outreach events. Every summer at The
Cooper Union, a STEM program is run for high school juniors and seniors. This program gives
high school students the ability to work on real world engineering problems. With the
implementation of the torsional rigidity rig, the high school students were given the opportunity
to run the ME160 Cantilevered Beam Lab (discussed in the “Course Structure” section) and then
the experimental procedure for the frame torsional rigidity. This helped them learn how small
scale textbook problems can be applied to real world engineering problems.
Cost Analysis
An important aspect of this experimental test rig is the low-cost design. Typically, when a
Formula SAE team designs an experimental rig to determine torsional rigidity, it requires the use
of dial indicators, costing about $50 each. In contrast, this experimental rig implores the use of
laser pointers, costing about $5 each. The frame mounting/loading scheme consists of
approximately the same cost for materials (i.e. the steel to construct the frame, the force
application mechanism, and the force measurement device), around $350. The miscellaneous
materials required for this experimental setup also include thumb tacks, foam board, and a paper
grid, all of which were considered negligible in terms of price. Shown in Table 2 is a cost
comparison between this experimental rig and a traditional rig.
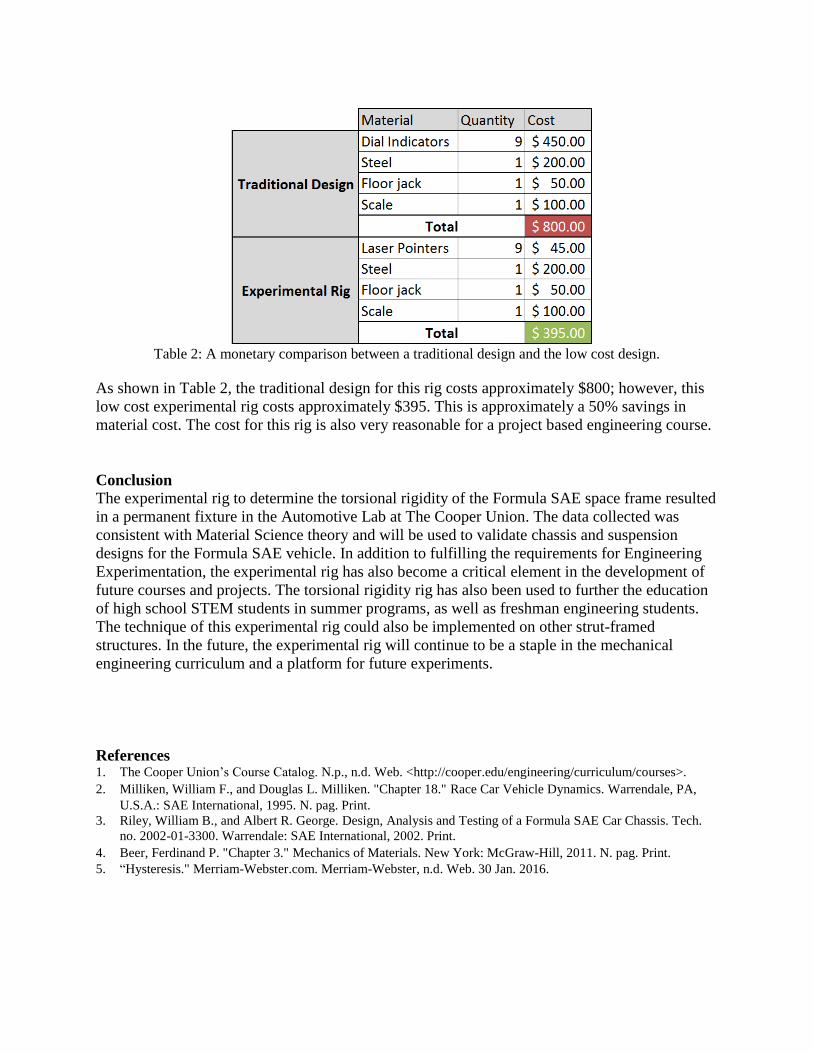
Table 2: A monetary comparison between a traditional design and the low cost design.
As shown in Table 2, the traditional design for this rig costs approximately $800; however, this
low cost experimental rig costs approximately $395. This is approximately a 50% savings in
material cost. The cost for this rig is also very reasonable for a project based engineering course.
Conclusion
The experimental rig to determine the torsional rigidity of the Formula SAE space frame resulted
in a permanent fixture in the Automotive Lab at The Cooper Union. The data collected was
consistent with Material Science theory and will be used to validate chassis and suspension
designs for the Formula SAE vehicle. In addition to fulfilling the requirements for Engineering
Experimentation, the experimental rig has also become a critical element in the development of
future courses and projects. The torsional rigidity rig has also been used to further the education
of high school STEM students in summer programs, as well as freshman engineering students.
The technique of this experimental rig could also be implemented on other strut-framed
structures. In the future, the experimental rig will continue to be a staple in the mechanical
engineering curriculum and a platform for future experiments.
References 1. The Cooper Union’s Course Catalog. N.p., n.d. Web. <http://cooper.edu/engineering/curriculum/courses>.
2. Milliken, William F., and Douglas L. Milliken. "Chapter 18." Race Car Vehicle Dynamics. Warrendale, PA,
U.S.A.: SAE International, 1995. N. pag. Print.
3. Riley, William B., and Albert R. George. Design, Analysis and Testing of a Formula SAE Car Chassis. Tech.
no. 2002-01-3300. Warrendale: SAE International, 2002. Print.
4. Beer, Ferdinand P. "Chapter 3." Mechanics of Materials. New York: McGraw-Hill, 2011. N. pag. Print.
5. “Hysteresis." Merriam-Webster.com. Merriam-Webster, n.d. Web. 30 Jan. 2016.