Embed Size (px)
Citation preview

Development of a Tier 1 National Reporting Statistic for New Zealandrsquos Marine Biodiversity New Zealand Aquatic Environment and Biodiversity Report No 147
C Lundquist K Julian M Costello D Gordon K Mackay S Mills K Neill W Nelson D Thompson
ISSN 1179-6480 (online) ISBN 978-0-477-10556-9 (online)
March 2015
Requests for further copies should be directed to
Publications Logistics Officer Ministry for Primary Industries PO Box 2526 WELLINGTON 6140
Email brandmpigovtnz Telephone 0800 00 83 33 Facsimile 04-894 0300
This publication is also available on the Ministry for Primary Industries websites at httpwwwmpigovtnznews-resourcespublicationsaspx httpfsfishgovtnz go to Document libraryResearch reports
copy Crown Copyright - Ministry for Primary Industries
TABLE OF CONTENTS
EXECUTIVE SUMMARY 1
1 INTRODUCTION 211 Background for Tier 1 Marine Biodiversity Reporting 2
12 Linkages with other Tier 1 Statistics and Environmental Monitoring programmes 3
121 Other Tier 1 Statistics 3
122 Other Environmental Monitoring and Reporting programmes 4
2 METHODS 421 Tier 1 National Reporting Statistics Principles and Protocols 4
22 Relevance of proposed marine biodiversity metrics 6
23 Workshop outcomes 6
24 Available datasets 7
241 Ocean Biogeographic Information System (OBIS) 7
242 World Register of Marine Species (WoRMS) 8
243 Databases held by NIWA 8
244 Macroalgal collections and herbarium data in New Zealand 9
245 Other datasets considered 10
25 Dataset workflow 10
251 OBIS 10
252 SPECIFY 13
3 SPECIES RICHNESS 1431 Spatial scale of reporting 15
32 Datasets to be included 21
33 Temporal scale of reporting 27
34 Taxonomic resolution 28
35 Reporting of Records instead of Species 36
36 Summary recommendations Species Richness 47
4 State of Knowledge Index 4741 Summary recommendations State of Knowledge 48
5 Endemic species metric 4851 Summary recommendations Endemic species 49
6 Threatened species metric 4961 Threatened species summary statistic 52
7 DISCUSSION 54
8 KEYPOINTS FOR POLICYMAKERS 54
9 ACKNOWLEDGMENTS 54
10 REFERENCES 55
11 APPENDICES 59
EXECUTIVE SUMMARY
Lundquist CJ Julian K Costello M Gordon D Mackay K Mills S Neill K Nelson W Thompson D (2015) Development of a Tier 1 National Reporting Statistic for New Zealandrsquos Marine Biodiversity New Zealand Aquatic Environment and Biodiversity Report No 147 61 p
In October 2012 the New Zealand Government signed off on a range of new environmental Tier 1 Statistics to be implemented or developed for national reporting The list included the development of a new marine Tier 1 statistic ldquoMarine Biodiversityrdquo to report on the wellbeing and knowledge state of marine biodiversity in New Zealand waters Here we evaluate the utility and feasibility of developing the variables published by Costello et al (2010) and recommend marine biodiversity statistics for Tier 1 National reporting on the state of marine biodiversity in New Zealand
New Zealand has made an international commitment under the Convention on Biological Diversity to halt the current decline in indigenous biodiversity The New Zealand Biodiversity Strategy also contains an explicit commitment to address the paucity of knowledge of biodiversity resulting in better more widely used information Early in the evaluation of marine biodiversity statistics it became apparent that there was not sufficient spatial coverage or repeated temporal sampling for increases and declines in species richness to be reported across New Zealand waters However reporting on the state of progress was worthy of further exploration as new species records are documented and gaps in the spatial coverage of biodiversity information are addressed As such we focussed on the process of gathering data as a way of reporting progress on New Zealandrsquos commitment to generating knowledge of the biodiversity of its marine estate Tier 1 statistics also aim to provide information that will improve understanding (eg by managers and the general public) of the lsquophenomenonrsquo itself in this case lsquoWhat is marine biodiversityrsquo Variations on the proposed marine biodiversity metrics can fulfil these requirements For example a species richness metric allows for presentation of broad scale spatial patterns in marine biodiversity knowledge and information on taxonomic diversity in the New Zealand EEZ Reporting on non-indigenous marine species and threatened species can indicate trends in the health of New Zealandrsquos marine biodiversity Broad-scale monitoring programmes would be required to document national trends in the health or integrity of marine biodiversity at a regional or national scale and are expected to be incorporated into a separate Ecological Integrity Tier 1 statistic
We recommend the following components to form the core of a new Marine Biodiversity Statistic
1 Species richness Increases in species richness are likely to be reported as taxonomic and spatial knowledge increases over the foreseeable reporting cycles for this statistic Thus we suggest a focus on Spatial distribution of the number of records in OBIS and other high quality
national databases per 100 km x 100 km grid cell for the NZ EEZ Number of species described from the NZ EEZ reported across broad taxonomic
categories
2 State of knowledge Number of new species identified during reporting period Changes in spatial coverage of biodiversity information
3 Endemic species lsquoStaticrsquo proportion of endemic species as a matter of general interest no reporting
of trends in the proportion of endemic species Number of new non-native species recorded
4 Threatened species Number of threatened species and changes in the threat status across broad
taxonomic categories using the full range of threat categories Changes in the number of species assessed or classified as data deficient
Ministry for Primary Industries Tier 1 Marine Biodiversity Statistic 1
1 INTRODUCTION
11 Background for Tier 1 Marine Biodiversity Reporting
In October 2012 Government signed off on a range of new Tier 1 Statistics to be implemented or developed under the Natural Resources Sector The Ministry for Primary Industries agreed to lead the development of a new marine Tier 1 statistic ldquoMarine Biodiversityrdquo that is intended to report on the wellbeing and knowledge state of marine biodiversity in New Zealand waters New Zealand has made an international commitment under the Convention on Biological Diversity to halt the current decline in indigenous biodiversity The New Zealand Biodiversity Strategy also contains an explicit commitment to address the paucity of knowledge of biodiversity resulting in better more widely used information The Ministry for Primary Industries has responsibility to maintain associated and dependent species in addition to sustainable use of fish stocks in New Zealand waters Primary productivity and marine biodiversity underpin goods and services provided by the marine environment and form a key area of investigation under the Ministry for Primary Industries Biodiversity Research Programme Ecosystem integrity (an indicator of the health of biodiversity and ecosystems) is key to the Department of Conservationrsquos lsquoecological integrityrsquo strategy to assess the health of species and ecosystems (httpwwwdocgovtnzabout-docpolicies-and-plansmanaging-natural-heritagea-national-system-to-monitor-and-report-on-biodiversity)
The marine ecosystem is New Zealandrsquos most biodiverse ecosystem and is a global hotspot for marine biodiversity (Gordon et al 2010 MacDiarmid 2007 Arnold 2005) New Zealandrsquos EEZ is the fourth largest national EEZ comprising roughly 42 million km2 spanning 30 degrees of latitude and covering depths ranging from shallow coastal and estuarine ecosystems to deep trenches approximately 10 km in depth Over half of the EEZ is deeper than 2000 m with limited surveys to document biodiversity both in these deeper areas as well as in many shallower subregions (Gordon et al 2010) New Zealandrsquos marine fauna and flora have a high level of endemism (over 50) with 6740 of 12 820 described species classified as endemic to New Zealandrsquos waters (Gordon et al 2010) Rates of endemism are particularly high for some taxonomic groups such as sponges molluscs ascidians and bryozoans A further 4315 species are housed in national collections awaiting formal taxonomic descriptions (Gordon et al 2010) taxonomic experts conservatively estimate a further 17 220 species are undescribed in the New Zealand EEZ based on proportions already described in other well-known areas of the world (Gordon et al 2010) Others have estimated much higher numbers of undescribed species with a total of 65 000 known and undescribed species suggested in one review of New Zealandrsquos marine biodiversity (MacDiarmid 2007) Diversity estimates based on eight intensively studied taxonomic groups suggest that New Zealand species biodiversity is equivalent to the ERMS (European Register of Marine Species) region which covers an area 55 times larger than New Zealandrsquos EEZ (Gordon et al 2010 Costello et al 2010)
Previously researchers have developed models of spatial patterns in biodiversity at national scales for New Zealand Arnold (2005) reviewed hotspots of species richness across broad taxonomic categories based on a series of expert workshops for a World Wide Fund for Nature ndash New Zealand report on the marine environment with a particular focus on vertebrate taxa A more detailed report summarised patterns of species distribution in the New Zealand EEZ across a broad range of taxa (MacDiarmid 2007) Taxonomic resolution varied with higher resolution information available for many vertebrate taxa eg for seabirds information generally included species spatial distributions and seasonalbreeding distributions For most invertebrate taxa this report opted to summarise information to family order or other lower resolution taxonomic groupings as spatial distributions of abundance were generally not available at the species level for invertebrate taxa Species distributions were presented as hotspots and 90 and 100 confidence intervals of spatial distributions Spatial distribution maps are publicly available on NABIS (wwwnabisgovtnz) A further series of reports lsquoMapping the Values of New Zealandrsquos Coastal Watersrsquo included a detailed spatial mapping of environmental measures into coastal cells of roughly 20 km in length environmental measures included overall and taxon-specific patterns in biodiversity and distributions of threatened species non-indigenous species habitats (including both biogenic habitats and physical habitats as described
2 Tier 1 Marine Biodiversity Statistic Ministry for Primary Industries
using the Marine Environments Classification) areas of special biologicalecological significance areas of protection and primary productivity (Beaumont et al 2008 2009 MacDiarmid et al 2008)
At an international scale Costello et al (2010) provided regional and national comparisons of biodiversity in terms of species numbers (per unit area) knowledge state and threat status using datasets primarily from the Census of Marine Life (wwwcomlorg) Information was also presented by taxonomic groupings and to reflect proportions of endemic and alien species in each of 26 international regions as defined by the Census (Costello et al 2010)
National indicators of biodiversity and ecosystem health have been investigated in a number of recent studies Tuck et al (2013) suggested a suite of ecosystem and environmental indicators that could be used to monitor and analyse the ecosystem changes in deepwater fisheries areas Pinkerton (2010) summarised key potential indicators to describe pressures on marine environments the state of ocean ecosystems and management responses to promote sustainability Thrush et al (2011) investigated potential ecological indicators for evaluating trends in ecosystem integrity in New Zealandrsquos marine protected areas for the Department of Conservation providing a hierarchy of metrics that are being field tested for their suitability Other national projects (eg the Marine Environmental Monitoring Programme (Hewitt et al 2014)) and collaborative activities across the Natural Resources Sector will improve data management across government organisations to support Tier 1 Statistics
Here we investigate the feasibility of utilising the variables published by Costello et al (2010) to report on the status of marine biodiversity in New Zealand We investigate four potential metrics 1) species richness per square km 2) state of knowledge index 3) proportion of endemic species and 4) number of threatened species Metric suitability was evaluated based on data availability and quality for calculating statistics likelihood of showing change over reporting periods and compatibility with international reporting statistics and official Tier 1 National Reporting Statistics protocols and principles Development of the statistics involved a collaborative and consultative approach and two workshops were held with Natural Resources Sector agency staff and biodiversity scientists to ensure that the statistics were developed in a robust manner included best available information and were relevant to agency requirements for reporting on biodiversity
12 Linkages with other Tier 1 Statistics and Environmental Monitoring programmes
121 Other Tier 1 Statistics
Existing Tier 1 Statistics that relate to the Oceans include annual reporting on lsquoFish Stocksrsquo (lead agency Ministry for Primary Industries) and on lsquoMarine Protected Areasrsquo (lead agency Department of Conservation) The Fish Stocks statistic reports on the status of commercial fish stocks but provides no information on biodiversity status of fishing areas The lsquoMarine Protected Areasrsquo statistic provides reporting on area (and trends in area) covered by both Type 1 (no-take Marine Protected Areas) and Type 2 protection (other management tools that meet the protection standard) but does not provide quantitative information on the overall well-being of marine biodiversity in New Zealand Information is reported annually and includes total area in protection in each of 14 coastal biogeographic regions
Other Tier 1 Statistics in development include lsquoCoastal and Recreational Coastal Water Qualityrsquo (lead agency Ministry for the Environment) and lsquoEcological Integrity and Diversityrsquo (lead agency Department of Conservation) A concurrent project to develop the oceanic component of lsquoAtmosphere and Ocean Climate Changersquo (joint lead agencies Ministry for the Environment and Ministry for Primary Industries) will evaluate metrics of physical variables that potentially drive patterns and changes in biodiversity (eg sea surface temperature ocean acidification net primary production and sea surface height)
Ministry for Primary Industries Tier 1 Marine Biodiversity Statistic 3
122 Other Environmental Monitoring and Reporting programmes
The Marine Environmental Monitoring Programme has developed a meta-database of existing long-term monitoring datasets in New Zealand that could provide data to support Tier 1 Statistics (Hewitt et al 2014) The Marine Environmental Monitoring Programme has recommended a number of guidelines for monitoring data to be used in statistics 1) monitoring data should represent or contribute to more than one State of the Environment aspect such as biodiversity health resilience or integrity or provide information on threats to these aspects 2) taxa or habitats should be chosen based on their known response to climate change or other major stressors in appropriate locations 3) monitored taxa or habitats should have low temporal variability in the absence of environmental stressors 4) monitoring data should preferably already be monitored nationally andor internationally providing a baseline or comparative international information with which to evaluate change and 5) monitoring data should be able to be well measured cost-effectively (Hewitt et al 2014)
The Ministry for the Environment is currently updating its Environmental Monitoring Report A number of regional monitoring programmes and report cards of ecosystem health are reported on regularly by regional councils (eg the Auckland Council lsquoState of Aucklandrsquo Marine Report Card which includes reporting on water quality contaminants ecology and bathing beach water quality)
13 Strategic Relevance
Within the Statistics New Zealand Environmental Domain Plan for the Coastal and Marine Environment a marine biodiversity reporting statistic will contribute to our understanding of the following lsquoenduring questionrsquo ldquoHow is the quality and use of our marine environment changing and what is the impact of human activity including resource use on the marine environmentrdquo The marine biodiversity statistic will also facilitate and contribute to international reporting requirements on biodiversity to platforms and multilateral environmental agreements such as the Convention on Biological Diversity (CBD) and the International Science-Policy Platform on Biodiversity and Ecosystem Services (IPBES) Reporting on the status of threatened taxa is also required under international agreements
14 Project Objective
The project objectives were
1 To evaluate the utility and feasibility of developing the variables published by Costello et al (2010) as a Tier 1 statistic reporting on the state of marine biodiversity in New Zealand The four proposed measures were
Species richness per square km
State of knowledge index
Proportion of endemic species and
Number of threatened species
2 To host a collaborative and consultative workshop to introduce and discuss each potential marine biodiversity indicator for its usefulness as a Tier 1 statistic
2 METHODS
21 Tier 1 National Reporting Statistics Principles and Protocols
The principles and protocols of Tier 1 statistics are presented as guidelines to underpin the development of new national reporting statistics (Table 1 Statistics New Zealand 2007) In developing
4 Tier 1 Marine Biodiversity Statistic Ministry for Primary Industries
new statistics for marine biodiversity we focussed on a number of key principles while recognising that all principles and protocols must be adhered to for Tier 1 National Reporting Statistics Firstly we strove to ensure that the statistics were lsquorelevantrsquo to user requirements both through collaborative workshops with relevant agencies and prospective users and through evaluation of the key underlying questions that a marine biodiversity metric might address A number of questions are proposed by Statistics New Zealand in their Environment Domain Plan 2013 for the Coastal and Marine Environment Ideally a marine biodiversity statistic should be designed to demonstrate if change is occurring in the marine environment and what spatial and temporal trends exist for any changes that are occurring Further a marine biodiversity statistic should impart knowledge to the general public on the phenomena itself ie lsquowhat is marine biodiversityrsquo Quality particularly the quality of data used to prepare the official statistics was also of particular importance for this marine biodiversity statistic and is discussed below in our description of proposed datasets for calculating the statistic Accessibility as it relates to proposed datasets and their long-term availability and accessibility is another important requirement as was maximising the use of existing data sources The final important component to be considered was efficiency and minimising respondent load that is demonstrating that the chosen metrics are the most efficient and cost-effective way to calculate a marine biodiversity statistic that answers key questions about changes in the state of New Zealandrsquos marine biodiversity
Table 1 Principles and protocols underlying Tier 1 Statistics (httpwwwstatispheregovtnztier1-statisticsprinciples-protocolsaspx)
Topic Description
1 Relevance Official statistics produced by government agencies are relevant to current and prospective user requirements in government and in the wider community
2 Integrity Official statistics gain public trust by being produced and released using objective and transparent methods
3 Quality Official statistics are produced using sound statistical methodology relevant and reliable data sources and are appropriate for the purpose
4 Coherence The value of statistical data is maximised through the use of common frameworks standards and classifications
5 Accessibility Access to official statistics is equal and open
6 Efficiency Official statistics agencies strive to be efficient and provide value for money
7 Protecting respondent Respondentsrsquo rights to privacy and confidentiality are respected and their information information is stored securely
8 Minimising The costs of compliance are kept to an acceptable level and data is collected only respondent load when the expected benefits of a statistical survey exceed the imposition on
providers
9 Maximising existing Maximise the use and value of existing data by integrating or aligning available data sources statistics and administrative resources
10 International Official statistics agencies make use of and contribute to international statistical participation developments
Ministry for Primary Industries Tier 1 Marine Biodiversity Statistic 5
22 Relevance of proposed marine biodiversity metrics
A key aspect of Tier 1 statistics is whether the statistics are relevant to user requirements For marine biodiversity we interpret potential users of marine biodiversity statistics to be broad including management agencies which require marine biodiversity statistics for national and international reporting both on the state of knowledge of the marine estate and on trends in threatened species abundance Trends in the abundance of endemic marine species (or their non-indigenous counterparts) are also indicators of the wellbeing of marine biodiversity A primary user of Tier 1 statistics is also the general public as such a marine biodiversity statistic can be interpreted as relevant if it provides information that reports on aspects of what marine biodiversity is and what makes New Zealandrsquos marine biodiversity unique
Features of marine biodiversity such as our relatively high national biodiversity and the high levels of endemism for many taxonomic groups are key aspects to incorporate in this statistic Reporting on changes in the status of threatened and non-indigenous marine taxa is also of interest to the general public with both threatened and non-indigenous taxa receiving widespread public attention Finally the state of knowledge indicator is relevant to broad public interest in reports of new species found on New Zealand scientific expeditions and general acknowledgement of the value of the quest for increasing the knowledge of New Zealandrsquos marine estate Finally information on biodiversity can also contribute to the marine economy through documenting presence and distribution of potential resources that can be extracted from the oceans and providing a baseline for assessment of sustainable use As such we suggest that each of the proposed metrics (the number of species that have been found in New Zealand waters (species richness) state of knowledge endemic species and threatened species) is relevant and meaningful as a Tier 1 marine biodiversity statistic We further evaluate these statistics with respect to our current ability to measure these metrics and suggest variations in the proposed metrics that provide more direct reporting with respect to changes in our state of knowledge and of the wellbeing of marine biodiversity
23 Workshop outcomes
This project required a collaborative and consultative approach to ensure that the statistics were developed in a robust manner and were in accordance with official Tier 1 statistic guidelines An initial workshop was held on 17 December 2013 to further develop the proposed statistics with other agency staff and discuss linkages with other Tier 1 statistics and national environmental monitoring programmes Organisations represented at the meeting included NIWA University of Auckland Ministry for Primary Industries Department of Conservation and Ministry for the Environment NIWA presented preliminary investigations into the suitability of the Costello et al (2010) metrics for use for reporting on marine biodiversity in the New Zealand marine region A second workshop was held on 11 March 2014 and included representatives from Ministry for Primary Industries Department of Conservation Ministry for the Environment Statistics NZ Auckland Council and NIWA The objective of this second workshop was to discuss and recommend final reporting statistics and confirm that the statistics were consistent with the guidelines and protocols for Tier 1 reporting statistics and were consistent with objectives for use by various national agencies
Key workshop discussion items included
1) Ability to report on changes in species richness Early in the evaluation it became apparent that reporting on changes in species richness would not be possible due to present data limitations and lack of broad-scale monitoring programmes Instead we focussed on recording the process of gathering data as representing New Zealandrsquos commitment to knowledge of the biodiversity of its marine estate
2) Appropriate scale for reporting on spatial patterns in records of species occurrences Spatial representations of data availability at 1 km times 1 km 10 km times 10 km and 100 km times 100 km grid cells were presented and general agreement was that the 100 km times 100 km grid cells were most useful at presenting patterns in species richness whereas the smaller grid cells resulted in a
6 Tier 1 Marine Biodiversity Statistic Ministry for Primary Industries
majority of empty cells and made visual patterns difficult to interpret Presentation of all three scales was requested for the contract report as demonstration of this decision-making of appropriate scale for data summation
3) Temporal scale of reporting Some metrics (eg endemic proportion) are unlikely to change significantly between five yearly reporting intervals Rather reporting on the number of newly recorded invasive species would be more appropriate to illustrate this concept of changes in native species proportions This contract report will present options for reporting on changes in taxonomic composition (endemic invasive etc) as well as suggesting ways to report on changes in state of knowledge over five year intervals
4) Level of taxonomic reporting The consensus was that while it is anticipated that a broad list of taxonomic categories would be chosen for the national statistic in this report we will present three options of different resolution for taxonomic resolution
5) Data availability It was agreed that while a number of records are in the Ocean Biogeographic Information System (OBIS) many of the national marine biodiversity collections (eg NIWA invertebrates FishAtlas Te Papa datasets) are either not in OBIS or have not been recently updated in OBIS While databases should continue to be updated in future in OBIS the consensus of workshop participants was that the national statistic should include best available information and not solely OBIS data The project team has further investigated all known datasets and presents in this report summaries of which datasets were included based on adherence to the Tier 1 National reporting standards in Table 1
6) Data quality Concerns were raised about the quality of data in OBIS and other datasets (both issues of taxonomic expertise and accuracy of point locations) challenges with overlaps between datasets and challenges due to changing taxonomic information and how these changes would be incorporated into a national statistic For all datasets used caveats are presented in this contract report to address issues of data quality
7) Threat classification It is recognised that threat classification and availability of assessments vary strongly among taxa for example mammals and birds may have higher proportions of assessed taxa than for example marine invertebrates and macroalgae Consensus was reached that reporting on threatened taxa was still valuable for the reporting statistic with expectation that the reporting would also include the proportion of taxa assessed within a taxonomic grouping
24 Available datasets
241 Ocean Biogeographic Information System (OBIS)
OBIS publishes datasets on marine species distribution in space and time Datasets may be from field surveys (eg plankton fishery trawl benthic cores whale and bird observations) specimen collections and other taxonomic observations OBIS originated as part of the information management component of the Census of Marine Life and is now housed within the Intergovernmental Oceanographic Commission (IOC) of UNESCO under its International Oceanographic Data and Information Exchange (IODE) programme As of December 2013 over 377 million records had been uploaded into OBIS including approximately 145 000 species and downloaded from 1456 different international datasets or organisations (httpiobisorg) OBIS data include all groups of organisms that are associated with marine (including estuarine) habitats ie marine vertebrates (fish marine mammals marine reptiles etc) marine invertebrates marine bacteria and marine plants (phytoplankton macroalgae seagrass mangroves) OBIS preferably works through linkages with a number of regional nodes the South Western Pacific Node is hosted by NIWA and manages twelve regional databases (Appendix 1) Other international databases (ie not part of the South Western Pacific Node) also contribute species records within the New Zealand EEZ All data are open access and responsibility for data quality including updating records is the responsibility of the data collector (Box 1) Data include only species name as taxonomic identification all further taxonomic information is accessed via the World Register of Marine Species (WoRMS) database
Ministry for Primary Industries Tier 1 Marine Biodiversity Statistic 7
Box 1 OBIS information relating to Data Quality of OBIS data records
Quality control of OBIS data (based on httpiobisorg)
Data published through OBIS must come from credible authoritative sources The scientists and institutions responsible for collecting and managing the data are clearly named Before publication the data must pass through a series of technical controls described below and these are repeated every time the data may be accessed again from its source Any errors such as species name misspellings names not recognised in OBIS and possible mapping errors are reported to the data provider to review and if necessary correct Thus the next time the data are published they are more correct and the source database quality is also improved Data use is a very important way of finding actual and possible errors in data Users may contact the data source directly or OBIS with such issues
The OBIS Quality Control protocol is as follows 1 If the required data fields are not properly filled notification will be sent to the Data Provider No further action will be taken until the required fields are filled
2 If fields have questionable values notification will be sent to Data Provider These questionable values will be set as empty in the data published
3 Data located on land will be reported to the Data Provider but will not be deleted unless instructed by the Data Provider because they may represent a species in an estuary or the centre point of a location If a Data Provider changes the values new values will show up after the next round of data upload
4 If species names cannot be (a) verified against known valid names in OBIS or (b) to the OBIS taxonomic hierarchy or (c) the World Register of Marine Species (WoRMS) the Data Provider will be notified so they can check they are current and correct Names that cannot be placed after checking with WoRMS and OBIS are where possible placed on the basis of other authoritative sources such as the Catalogue of Life or the Integrated Taxonomic Information System (ITIS) Some non-verified names may be assigned a position in the taxonomic hierarchy by virtue of their genus
5 The portal staff will communicate with data providers to inform them of any problems and improve data quality They will check that the data conform to the metadata description of the dataset ie it should have the correct number of records and species in the right geographic locations After the data is transferred to the server from where it will be published online a form email will be sent to the technical person and manager specified detailing number of records obtained and missing records if applicable time of next accessing and any errors identified
242 World Register of Marine Species (WoRMS)
The World Register of Marine Species (WoRMS) is the authority for names of all marine species including synonyms and standardised higher classification While the New Zealand Organism Register (NZOR) is the national source for taxonomic nomenclature discussion by experts at the initial project workshop suggested that NZOR will soon have a direct electronic link with WoRMS for updating any New Zealand species names or taxonomy As such the expert taxonomists suggested that WoRMS be used as the primary source for taxonomy to support the marine biodiversity statistic as it is regularly updated and is international in scope The OBIS toolbox includes a function that links species records to their corresponding taxonomic authority in WoRMS for updating to the current taxonomy
243 Databases held by NIWA
NIWA holds a number of national (New Zealand government funded) biodiversity collection records that have not been uploaded to OBIS many of these databases are scheduled for upload to OBIS in 2014 SPECIFY includes electronic data corresponding to all samples held within the NIWA marine invertebrate collection An earlier iteration of the SPECIFY dataset (2006) has been uploaded to OBIS AllSeaBio also on OBIS was an early iteration of SPECIFY and does contain some overlap of information However AllSeaBio also includes a number of records that are not held within SPECIFY (ie records for which samples were not preserved and stored in the NIWA marine invertebrate
8 Tier 1 Marine Biodiversity Statistic Ministry for Primary Industries
museum) many of these are historical species records
Other national taxonomic datasets hosted by NIWA some of which have been uploaded to OBIS include sponges arthropods bryozoans cold water corals coralline algae and asteroids Revised versions of many of these datasets exist at NIWA and are in the process of being uploaded to OBIS There is some but not complete overlap between specific taxonomic databases and SPECIFY depending on how many records were retained in the NIWA invertebrate collections this overlap varies among taxonomic datasets
NIWA also hosts the Ministry for Primary Industries research trawl database and observer databases (also known as the Fish Communities Databases COD and TRAWL) Records from COD and TRAWL are included in SPECIFY for any taxa that are provided to the NIWA invertebrate collection for further taxonomic resolution The Fish Communities Database (fish_comm) has previously been uploaded to OBIS (database listed as South Western Pacific Regional OBIS Data provider for the NIWA Marine Biodata Information System) with an updated database in the process of uploading to OBIS in 2014 Fish_comm though including only fishes and squids contains a majority of the species records in the New Zealand EEZ
244 Macroalgal collections and herbarium data in New Zealand
The major New Zealand macroalgal collections are held in the herbaria of the Museum of New Zealand Te Papa Tongarewa (WELT) Landcare Research Manaaki Whenua (CHR) and at the Auckland Museum (AK) (Thiers 2014) The herbarium at Te Papa (WELT) is the only collection in New Zealand where there has been consistent expert taxonomic attention to the macroalgae over the past 50 years The WELT collections have been databased over a period of about 15 years The recent focus within the herbarium has been on improving collection data and checking the dataset for errors particularly grooming collection date data and mapping and verifying locality data Because WELT collections have received expert identification and curation they have been used as the primary source of data on the distributions of marine macroalgae for a number of research projects and government databases (eg Booth et al 2006) WELT is also where voucher specimens have been deposited (eg for the Marine Invasives Taxonomic Service contracted to NIWA by the Ministry for Primary Industries) Nelson et al (2013) summarised the history of the collections in WELT and used these collections to review the state of knowledge of the New Zealand macroalgal flora
Much of New Zealand macroalgal taxonomic and biogeographic literature is based on the WELT collections including Adams (1994) and a series of regional floral lists (Adams 1972 Adams et al 1974 South amp Adams 1976 Nelson amp Adams 1984 Adams amp Nelson 1985 Hay et al 1985 Nelson amp Adams 1987 Nelson et al 1991 Nelson et al 1992 Neale amp Nelson 1998 Nelson et al 2002 also Nelson amp Dalen in press) based on targeted collections In addition some specific projects have been undertaken to improve collections and knowledge of the flora (eg coralline algae Broom et al 2008 Harvey et al 2005 Farr et al 2009 macroalgae from soft sediment environments Neill et al 2012 Ulvaceae Heesch et al 2007 2009) In the absence of a complete flora there has been considerable recent effort directed to compiling and updating lists of currently accepted names and the taxonomic hierarchy with published lists produced as part of the Species 2000 project documenting the New Zealand biota (Broady et al 2012 Harper et al 2012 Nelson 2012) and also updated current lists provided on the Te Papa website (eg Dalen amp Nelson 2013 a-c)
As this macroalgal dataset showed consistent taxonomic attention long-term viability and accessibility and high data quality this dataset was recommended to be included in the calculation of a marine biodiversity statistic Permission to use the existing groomed macroalgae dataset was requested from Te Papa and the dataset was provided
Ministry for Primary Industries Tier 1 Marine Biodiversity Statistic 9
245 Other datasets considered
A number of datasets that were used for previous biodiversity exercises (eg Beaumont et al 2008) were explored for their potential to be included in the Marine Biodiversity statistic Data quality and taxonomic resolution varied among datasets with many datasets consisting of taxonomic groupings (eg foliose macroalgae) rather than species records or consisting of modelled data outputs (Beaumont et al 2008) For this statistic we determined that modelled data should not be included and that individual species records rather than assessments of percent cover of broad taxonomic groups are required for inclusion (though in some cases taxonomic resolution of individual species is available only to Family or Order) Another key consideration was the ease of access and whether cost was involved to acquire a dataset We opted to exclude datasets for which funds had previously been required for access Rather it is hoped that future funding to support the Marine Biodiversity Statistic will include funding to support upload of high quality datasets to OBIS so that in future they may be included in this statistic
We recognise a few high quality datasets that should be prioritised for any potential funding
A large high quality database of mollusc records is held by Te Papa but is not yet uploaded to OBIS As this dataset was previously only available for purchase (Beaumont et al 2008) we opted to rely on the substantial existing information in OBIS and NIWA datasets to represent molluscs
The Marine High Risk Site Surveillance database contains data on invasive species presence as recorded in annual port surveys within selected harbours in New Zealand These surveys are designed to detect establishment of a pre-determined list of high risk species in a limited number of ports which are the most likely point of entry for most NIMS taxa
The Ornithological Society of New Zealand holds a large dataset containing records from regular surveys of wading birds in New Zealand in 150 estuaries nationwide As this dataset was previously only available for purchase (Beaumont et al 2008) we opted to rely on the substantial existing information in OBIS datasets to represent wading birds
Various datasets are available on marine mammal sightings including from research surveys Department of Conservation surveys tourism records and commercial surveys The Department of Conservation is currently developing a national database and information protocol for these records and in future this information could be uploaded to OBIS
25 Dataset workflow
251 OBIS
All taxonomic records from OBIS were extracted from within the New Zealand EEZ including all historical data to 31 December 2013 A total of 527 441 OBIS records were extracted representing 10 974 individual species of these approximately 20 were from databases not held within the South Western Pacific node (ie not databases held in New Zealand) (Table 2)
For further processing the following New Zealand datasets were excluded from the OBIS dataset as updated versions existed as part of the current SPECIFY database though not yet uploaded to OBIS South Western Pacific Regional OBIS Data SPECIFY Subset (2006 version) South Western Pacific Regional OBIS Data Asteroid Subset and South Western Pacific Regional OBIS Data Habitat-forming Cold Water Corals Subset Other NIWA taxonomic subsets (eg Bryozoa) were determined to not yet be fully registered within SPECIFY and the potential for overlap was preferred rather than loss of a large proportion of taxonomic records for this group For comparisons of records between national datasets and other international datasets all data hosted by NIWA for the South Western
10 Tier 1 Marine Biodiversity Statistic Ministry for Primary Industries
Pacific OBIS node was classified as lsquoNew Zealandrsquo data all other international datasets available on OBIS were classified as lsquoOBISrsquo datasets
Table 2 OBIS databases with species records within the New Zealand EEZ Datasets in italics were replaced with updated datasets as available with NIWA
OBIS Dataset records
East London Museum 124
South African Institute for Aquatic Biodiversity - Fish Collection
iziko South African Museum - Fish Collection
13
1
iziko South African Museum - Marine Mammal Collection
iziko South African Museum - Shark Collection
4
100
Polycystine Radiolarians from the water column and the surface sediments of the World Ocean
ABBBS Bird Banding records from the Australian Antarctic Territory and Heard Island
ARGOS Satellite Tracking of animals
780
4
64
Inventory of Antarctic seabird breeding sites 4
National Whale and Dolphin Sightings and Strandings Database
Seabirds of the Southern and South Indian Ocean
27
147
Southern Ocean Continuous Zooplankton Recorder (SO-CPR) Survey
Australian Institute of Marine Science - Bioresources Library
BOLD Marine Invertebrate Data
643
9
14
BOLD Public Fish Data 12
SeamountsOnline (Seamount Biota) 1 275
TOPP Fish (TOPP) 10
ZooGene A DNA Sequence Database for Calanoid Copepods and Euphausiids
CeDAMar database for benthic biological sampling on the abyssal plains
ChEssBase
20
135
1
Cold water corals 847
Galathea II Danish Deep Sea Expedition 1950ndash52 476
PANGAEA - Data from Christian-Albrechts-University Kiel
PANGAEA - Data from Climate Long-range investigation mapping and prediction (CLIMAP)
PANGAEA - Data from Leibniz Institute of Marine Sciences
PANGAEA - Data from paleoenvironmental reconstructions from marine sediments AWI
PANGAEA - Data from the Deep Sea Drilling Project (DSDP)
PANGAEA - Data from the Ocean Drilling Program (ODP)
PANGAEA - Data from various sources
162
1
473
121
19 350
7 426
859
taxa
80
12
1
2
13
141
1
1
1
11
28
28
9
7
6
262
1
10
84
1
103
301
19
1
21
24
605
263
126
Provider name
AfrOBIS
AfrOBIS
AfrOBIS
AfrOBIS
AfrOBIS
Argentinean RON
Australian Antarctic Data Centre Australian Antarctic Data Centre Australian Antarctic Data Centre Australian Antarctic Data Centre Australian Antarctic Data Centre Australian Antarctic Data Centre Australian Institute of Marine Science BOLD
BOLD
CoML
CoML
CoML
EurOBIS
EurOBIS
EurOBIS
EurOBIS
EurOBIS
EurOBIS
EurOBIS
EurOBIS
EurOBIS
EurOBIS
EurOBIS
Ministry for Primary Industries Tier 1 Marine Biodiversity Statistic 11
OBIS Dataset
Senckenbergs collection management system
Coleccion de referencia de otolitos Instituto de Ciencias del Mar-CSIC
Fish specimens
Fishbase occurrences hosted by GBIF-Sweden
Ichtyologie
Hexacorallians of the World
MICROBIS database
World Ocean Database 2009
Marine Biological Sample Database JAMSTEC
BIOMASS 1980ndash1985
Cemetery Beach Port Hedland Flatback Tracking Project 20092010
Historical distribution of whales shown by logbook records 1785ndash1913
SMRU Elephant Seal Pup Tracking 1995ndash1996
Stranded spade-toothed beaked whales in New Zealand in 2010
TOPP Summary of SSM-derived Telemetry
Bishop Museum Data (OBIS distribution)
CephBase
Ocean Genome Resource
Australian Museum
MV Ichthyology
MV Marine Invertebrates
MV Ornithology
Amphipoda Hyperiidea of the Southern Ocean catalogue and occurrences
Antarctic Amphipod Crustaceans AntPhipoda Database (BIANZO)
Antarctic Isopods
Antarctic Marine Species Sequence Data
Biogeographic distribution of Antarctic and sub-Antarctic Cumacea
Biogeographic distribution of the Antarctic and Sub-Antarctic brachiopods (living forms)
Collections data on ecology of bottom animal of the Southern ocean
Nemertina World Checklist
SO-Polylist
SOMBASE BIOCONSTRUCTORS
SOMBASE PYCNOGONIDS
NMNH Invertebrate Zoology Collections
NMNH Vertebrate Zoology Fishes Collections
NIWA plankton
New Zealand Coralline Algae
South Western Pacific Regional OBIS Data All Sea Bio Subset
South Western Pacific Regional OBIS Data Asteroid
records
70
2
11
343
77
1 280
64 880
1 662
96
42
1
1 094
47
1
230
6
22
529
55
26
41
38
47
83
2
3
1
64
4
1
1
1 644
217
2 969
188
4 200
557
32 597
2 023
taxa
39
2
9
178
47
189
602
251
30
15
1
3
1
1
1
6
8
74
11
14
23
14
16
45
2
1
1
9
4
1
1
592
73
1 119
113
200
30
2 457
114
Provider name
EurOBIS
FishBase
FishBase
FishBase
FishBase
Hexacorals
ICoMM
NODC
OBIS Japan
OBIS-SEAMAP
OBIS-SEAMAP
OBIS-SEAMAP
OBIS-SEAMAP
OBIS-SEAMAP
OBIS-SEAMAP
OBIS-USA
OBIS-USA
OBIS-USA
OZCAM
OZCAM
OZCAM
OZCAM
SCAR-MarBIN
SCAR-MarBIN
SCAR-MarBIN
SCAR-MarBIN
SCAR-MarBIN
SCAR-MarBIN
SCAR-MarBIN
SCAR-MarBIN
SCAR-MarBIN
SCAR-MarBIN
SCAR-MarBIN
Smithsonian Institute
Smithsonian Institute
South Western Pacific OBIS South Western Pacific OBIS South Western Pacific OBIS South Western Pacific
12 Tier 1 Marine Biodiversity Statistic Ministry for Primary Industries
OBIS Dataset
Subset
South Western Pacific Regional OBIS Data Bryozoan Subset
South Western Pacific Regional OBIS Data Habitat-forming Cold Water Corals Subset
South Western Pacific Regional OBIS Data Specify Subset
South Western Pacific Regional OBIS Data provider for the NIWA Marine Biodata Information System
Catalogue of Squat Lobsters
Academy of Natural Sciences OBIS Mollusc Database
records
5 545
588
7 212
365 775
20
45
taxa
558
5
1 467
435
19
31
Provider name
OBIS
South Western Pacific OBIS South Western Pacific OBIS South Western Pacific OBIS South Western Pacific OBIS
SquatLobsters
The Academy of Natural Sciences
Total (all OBIS data records) 527 441 10 974 Total South Western Pacific OBIS (New Zealand) 418 497 5 266
OBIS data columns include 97 available information categories ranging from record identification spatial position species name collector information physical parameters at the collection location and temporal information Key information required for analyses for a marine biodiversity indicator included record ID latitude longitude date collected date last modified on OBIS species name and source of record A tool exists to convert species names to complete taxonomic information (Phylum Class Order hellip) that links OBIS with WoRMS but this tool is limited to small datasets (fewer than 2000 records at a time) Because over 500 000 records in OBIS required conversion conversion of OBIS species information using WoRMS was not completed in this project (Table 2) Instead data records were downloaded from OBIS for taxonomic subsets (eg Porifera Cnidaria) providing for higher levels taxonomic groupings within ArcGIS analyses This also got around issues within the OBIS dataset where taxa were not identified to species and instead taxonomic information was available only at higher taxonomic levels
252 SPECIFY
All taxonomic records from SPECIFY were extracted from within the New Zealand EEZ including all historical data to 31 December 2013 A total of 66 690 SPECIFY records were extracted representing 7556 individual species Thirty seven SPECIFY data columns were extracted providing information on record identification number latitude longitude taxonomic information date of collection date of identification and modification and collector information It was assumed that all taxonomic information was current with information available in WoRMS and NZOR due to quality control within the SPECIFY database Commercially sensitive records (ie records logged relating to particular commercial ventures such as phosphate mining or oil and gas exploration) were excluded from the data extraction In some cases records in SPECIFY are recorded as lsquolotsrsquo ie where a sample container included more than one species All multiple record lots in SPECIFY were separated prior to extraction into individual records representing individual species
253 Macroalgal datasets
Macroalgal records were extracted from the database of the Te Papa herbarium All New Zealand marine algal records current to December 2011 were exported into Excel spreadsheets In the absence of a published flora a current species names list and taxonomic hierarchy is maintained on the Te Papa website (httpwwwtepapagovtnz - Dalen and Nelson 2013a-c) Changes to current taxonomic names and classification have been drawn from primary literature and updated into Te Paparsquos database and the application of name changes to the collections has also been part of this effort The number of taxa includes all recognised entities present in the collections including some that have been
Ministry for Primary Industries Tier 1 Marine Biodiversity Statistic 13
recognised as distinct at a family genus or species level but are currently unnamed It is important to note that the publicly accessible flora lists (Dalen and Nelson 2013a-c) include only published names including some published tag names
not all published taxa are represented in the WELT collections and there are more taxa recognised as being distinct than have been published currently
The Green algae or Division Chlorophyta includes data for three classes Prasinophyceae Ulvophyceae and Trebouxiophyceae (There are no marine macroalgal Chlorophyceae represented in Te Paparsquos collections) The Brown algae or Ochrophyta include members of the classes Chrysomerophyceae Xanthophyceae and Phaeophyceae and the Red algae or Rhodophyta are represented by members of four classes Compsopogonophyceae Stylonematophyceae Bangiophyceae and Florideophyceae Eleven data columns were extracted providing information on record and taxonomic identification collection location and date and collector for each of 19 422 records representing a total of 1028 individual species
254 Geoprocessing
Records were provided in the geospatial datum WGS84 (World Geodetic System 1984) which is a standard projection and used by GPS (Global Positioning System) with which the sampling location of many species records are located All records (OBIS SPECIFY Te Papa) were provided in WGS84 projection and no conversions were required A total of 608 280 records were available from the combined OBIS SPECIFY and Te Papa datasets
ArcGIS standard geoprocessing tools were used to calculate sums of records within a custom grid beginning at the northwest corner of the NZ EEZ Grids were created for 1 km times 1 km grid cells 10 km times 10 km grid cells and 100 km times 100 km grid cells To calculate the number of species from the record database we used the Marine Geospatial Ecology Toolbox (MGET) MGET is a collection of free open source software tools that provide standard geoprocessing for marine ecology including tools to convert OBIS records to species richness (httpmgelenvdukeedumget)
Additional calculations were investigated that could allow for evaluation of sampling effort bias when determining patterns of species richness We investigated ES50 (estimated species in random 50 samples) Chao statistics (estimates species richness based on samples in spatial unit) and calculation of the number of phyla per grid cell as ways of evaluating sampling effort bias and completeness of the species record
However we determined that additional calculations using any of these tools were not cost-effective based on current knowledge of biodiversity and were unlikely to provide information not already available in plots of spatial patterns in species richness which demonstrate nearly identical spatial patterns in species richness as those in species records (see Section 3) The sampling bias is substantially skewed with the majority of 100 km times 100 km cells having fewer than 100 total records and few areas (coastal areas Chatham Rise) with high sampling effort (more than 1000 records) As such the more complex metrics that reduce sampling bias are unable to overcome the substantial bias in sampling effort and would show similar patterns to that of the number of records and the number of species In future should sampling effort resolve gaps in spatial knowledge these additional calculations would be worth exploring
3 SPECIES RICHNESS
Costello et al (2010) reported species richness for New Zealand as the combined number of species recorded per total area of the New Zealand EEZ The proportion of all species within each of fourteen major taxonomic groupings (eg Crustacea Mollusca) was also reported showing similarities across most bioregions in dominance of marine biodiversity by Crustacea Mollusca and Pisces (Costello et al 2010) The proposed reporting statistic for species richness would thus adapt the Costello et al
14 Tier 1 Marine Biodiversity Statistic Ministry for Primary Industries
(2010) statistic to report on the number of records per area at a sub-national scale ideally 1 km times 1 km
For the species richness reporting statistic we determined that this metric could provide information relating to two aspects of marine biodiversity What are national estimates of marine biodiversity in terms of the total number of species accumulated since records start across taxonomic groups
What are spatial trends in this national estimate of biodiversity
For the species richness metric we were unable to determine temporal trends in biodiversity at the broader NZ EEZ scale as records of species are given as presence only records (ie not including information on what is not found during a sampling event) Temporal trends in biodiversity would require structured repeated sampling of species diversity to determine whether increases or decreases in species richness were occurring In effect the available data for species richness at a national scale is contributing information on our state of knowledge of marine biodiversity but it cannot currently provide information on the status or trends in marine biodiversity
To determine optimal reporting of species richness we discuss recommendations for Spatial scale of reporting Datasets to be included Temporal scale of reporting Taxonomic resolution Reporting of Records vs Species
31 Spatial scale of reporting
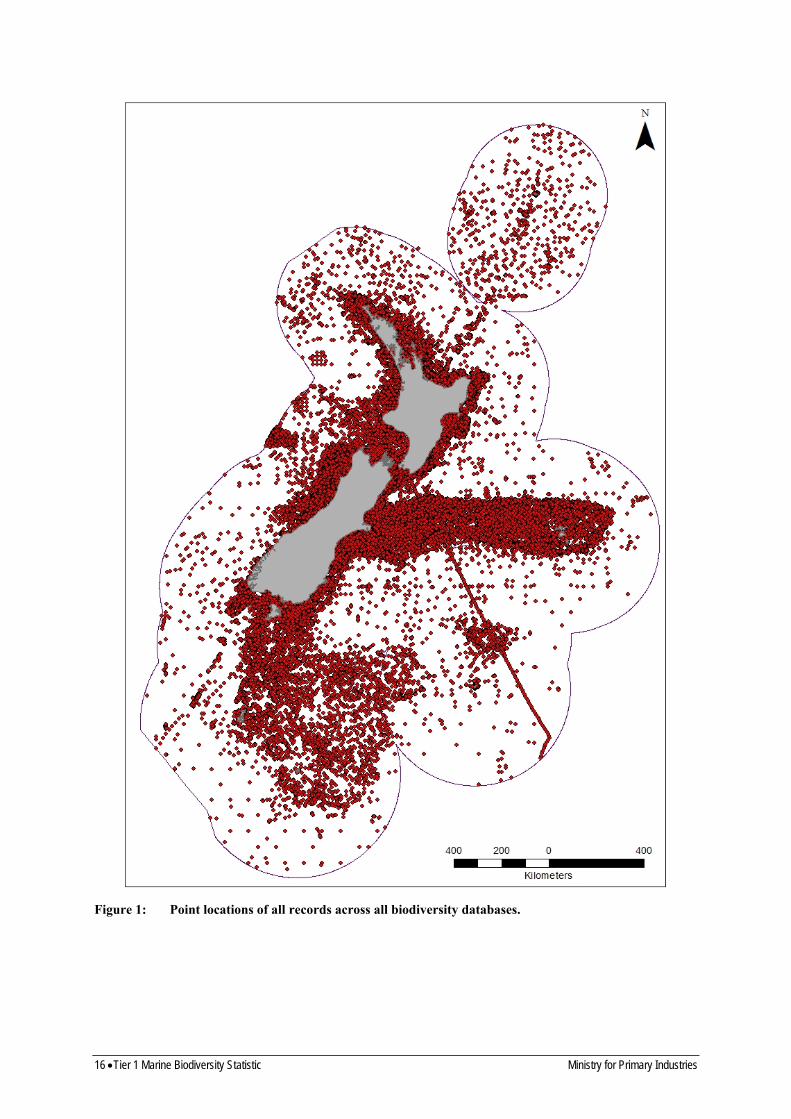
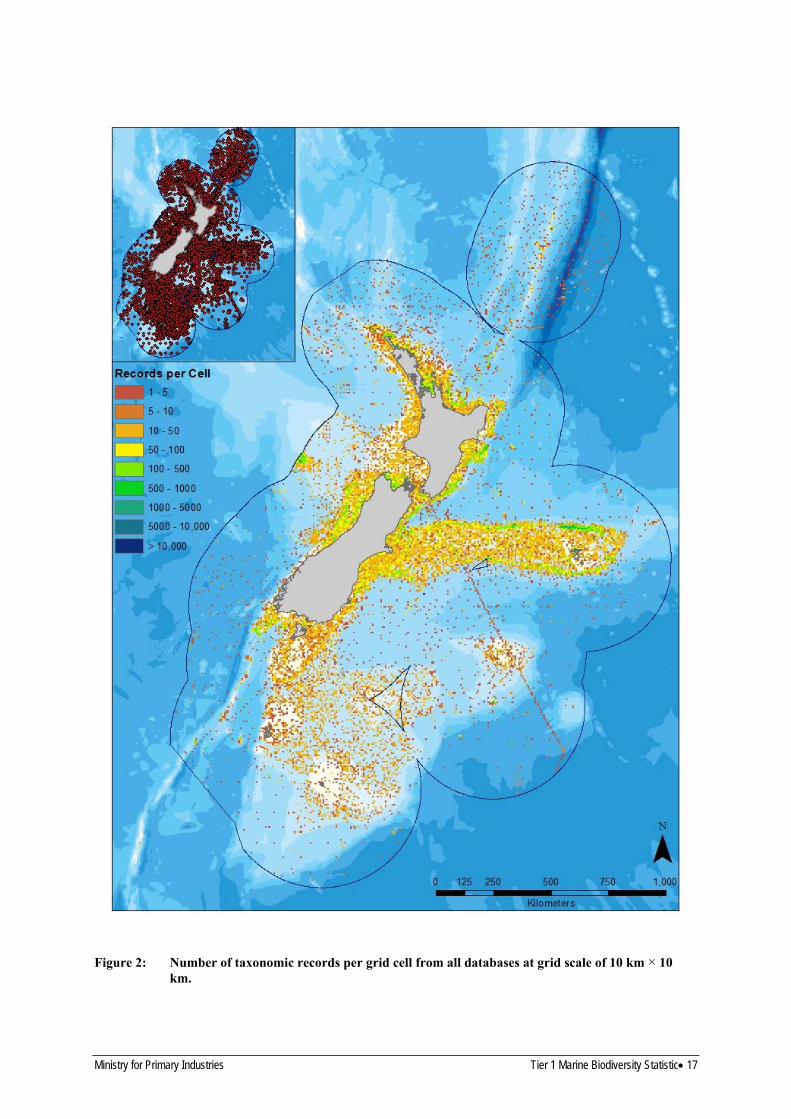
While the proposed reporting metric was for species richness within 1 km times 1 km grid cells the availability of species records suggested that coarser resolution was required in order to adequately quantify and view species richness due to the sparsity of records throughout much of the EEZ (Figure 1) Comparisons between spatial scales (10 km times 10 km Figure 2 100 km times 100 km Figure 3) suggest that species records are too sparse for adequate reporting at a scale less than 100 km times 100 km
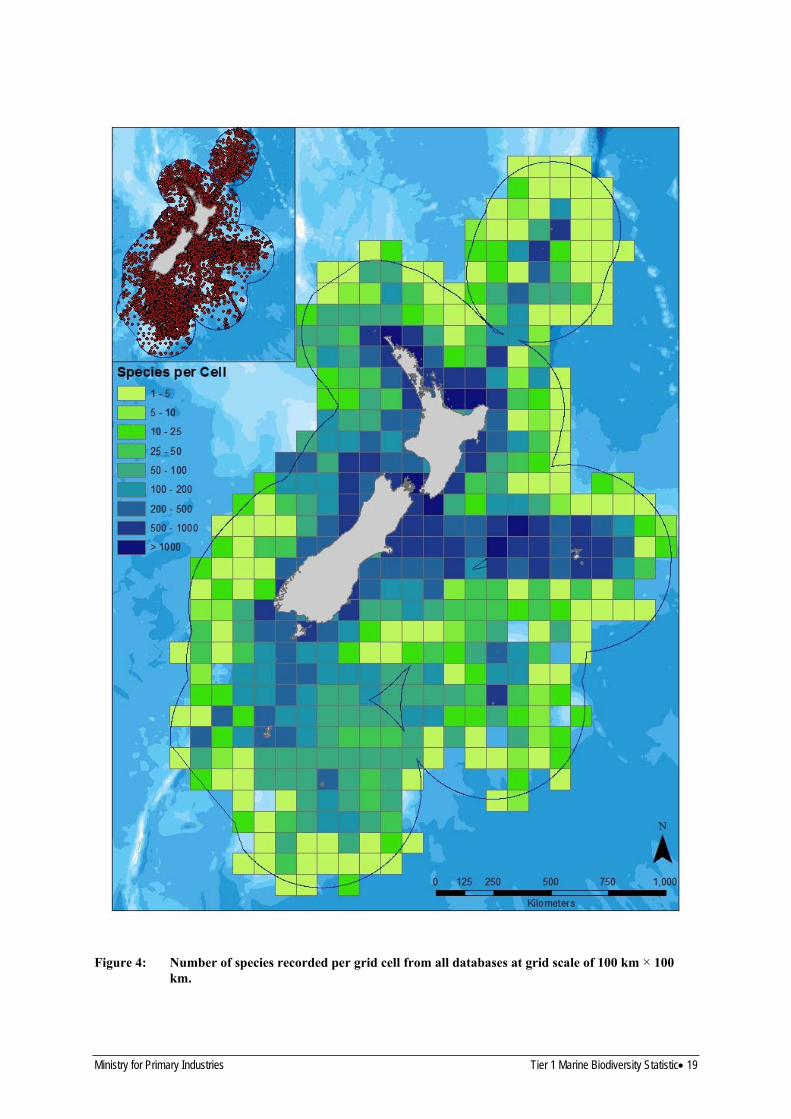
Even at the 100 km times 100 km scale roughly half (269 of 540 grid cells) had low numbers of species records (fewer than 50) and number of species (Figure 3 Figure 4 Table 3) however patterns of species richness in locations with high sampling effort (ie coastal cells Chatham Rise) were evident at this highest scale although these patterns are likely to be due primarily to sampling effort at this point in our understanding of New Zealandrsquos biodiversity Patterns were consistent between species records and species richness however because of the spatial bias in sampling effort it is premature at this stage to confirm that these patterns represent hotspots of biodiversity (Figure 3 Figure 4)
Comparisons between the number of species and the number of records in each cell indicate linear correlations between sampling effort and the number of species suggesting that species diversity information is not yet sufficient to reach asymptotic levels of species present for most taxa although it is likely that species richness is reaching an asymptote with increasing sampling effort for one better known group of ray-finned fishes (Actinypterygiae) (Table 3 Figure 5)
Ministry for Primary Industries Tier 1 Marine Biodiversity Statistic 15
Figure 1 Point locations of all records across all biodiversity databases
16 Tier 1 Marine Biodiversity Statistic Ministry for Primary Industries
Figure 2 Number of taxonomic records per grid cell from all databases at grid scale of 10 km times 10 km
Ministry for Primary Industries Tier 1 Marine Biodiversity Statistic 17
Figure 3 Number of taxonomic records per grid cell from all databases at grid scale of 100 km times 100 km
18 Tier 1 Marine Biodiversity Statistic Ministry for Primary Industries
Figure 4 Number of species recorded per grid cell from all databases at grid scale of 100 km times 100 km
Ministry for Primary Industries Tier 1 Marine Biodiversity Statistic 19
Table 3 Distribution of records and number of species from all databases across grid cells
Number Number of species Number of records
0 60 60
1 63 40
2 29 21
3 12 11
4 11 8
5 7 12
6ndash10 23 29
11ndash20 36 32
21ndash30 28 22
31ndash50 30 34
51ndash100 73 37
101ndash500 112 79
gt501ndash1000 48 49
gt1001ndash5000 8 61
gt5001ndash10000 0 34
gt10000 0 11
Total cells 540 540
Max value 1648 22986
20 Tier 1 Marine Biodiversity Statistic Ministry for Primary Industries
All taxa 1800
1600
1400s
1200
specie
1000
Numberof
800
600
400
200
0 0 5000 10000 15000 20000 25000
Number of records
Fish 180
160
140
120
100
80
60
40
20
0 0 5000 10000 15000 20000 25000
Number of records
Figure 5 Species richness (number of species recorded per grid cell) from all taxonomic records at grid scale of 100 km times 100 km versus number of records for all taxonomic groups (top) Actinypterygiae (ray-finned fishes) (bottom)
32 Datasets to be included
While the initial contract objectives suggested using datasets accessible using Census of Marine Life OBIS we recognised that a number of high quality national datasets either were not uploaded to OBIS or had updated versions held by NIWA or Te Papa that were planned for future upload Additional international datasets that may not be subject to the same quality control as New Zealand datasets (although see Box 1 for OBIS requirements for data quality) are available on OBIS while some national expert taxonomists were hesitant to include these datasets due to their uncertain quality plots of spatial distribution of records comparing New Zealand held datasets (including those held on OBIS) and other international datasets held on OBIS show differences in spatial coverage with other
Numberofspecies
Ministry for Primary Industries Tier 1 Marine Biodiversity Statistic 21
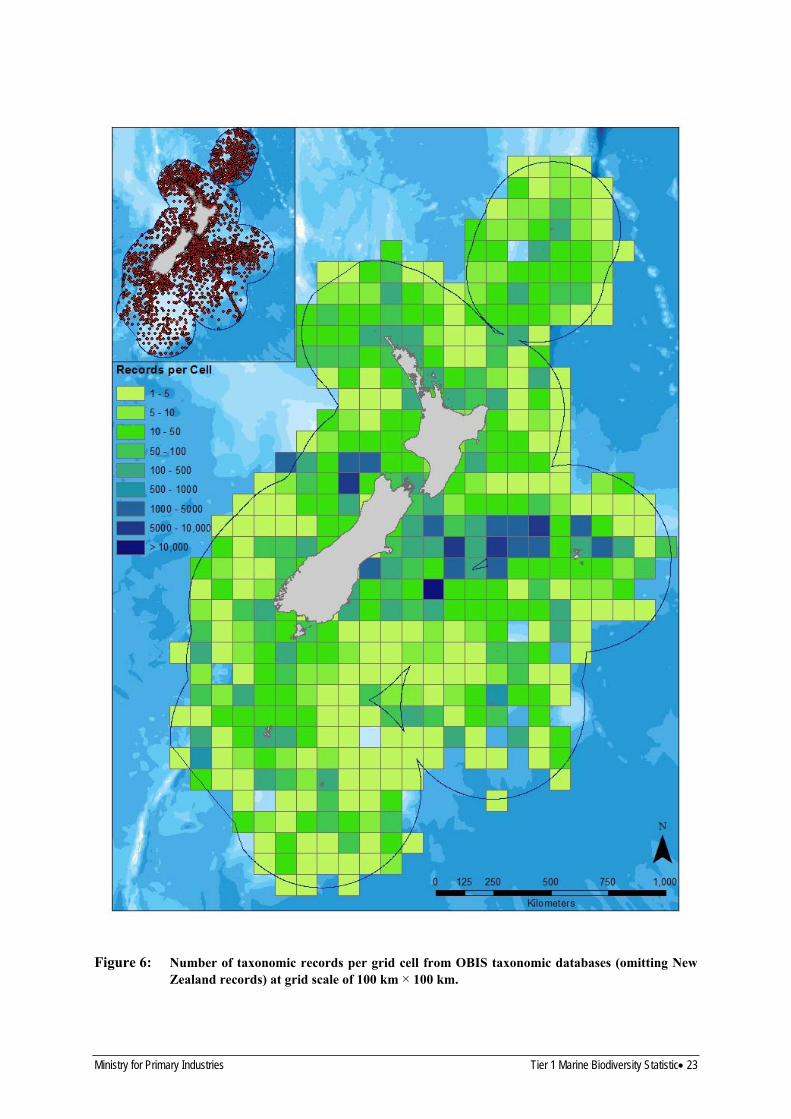
international OBIS datasets covering many regions of the EEZ that are not covered in New Zealand datasets (Figure 6 Figure 7)
International (non-New Zealand) OBIS records include approximately 20 of all species records in the New Zealand EEZ (Table 2) and most are described as being quality collections from other reputable national and international sources Patterns of species richness between New Zealand datasets and all international OBIS datasets were similar to those of number of records (Figure 8 Figure 9) As many New Zealand datasets are regularly updated and are planned for upload to OBIS it is assumed that future calculations of this statistic are likely to require only access of OBIS datasets making the data extraction process simpler In the meantime we opted to include both New Zealand and all other international datasets available on OBIS for the Tier 1 Marine Biodiversity calculations
22 Tier 1 Marine Biodiversity Statistic Ministry for Primary Industries
Figure 6 Number of taxonomic records per grid cell from OBIS taxonomic databases (omitting New Zealand records) at grid scale of 100 km times 100 km
Ministry for Primary Industries Tier 1 Marine Biodiversity Statistic 23
Figure 7 Number of taxonomic records per grid cell from New Zealand taxonomic databases at grid
scale of 100 km times 100 km
24 Tier 1 Marine Biodiversity Statistic Ministry for Primary Industries
Figure 8 Species richness (number of species recorded per grid cell) from OBIS taxonomic databases
(non-New Zealand records) at grid scale of 100 km times 100 km
Ministry for Primary Industries Tier 1 Marine Biodiversity Statistic 25
Figure 9 Species richness (number of species recorded per grid cell) from New Zealand taxonomic databases at grid scale of 100 km times 100 km
26 Tier 1 Marine Biodiversity Statistic Ministry for Primary Industries
33 Temporal scale of reporting
For a Tier 1 Marine Biodiversity statistic to be useful it must be able to show changes over the proposed scale of reporting in this case five yearly Again at this stage in our knowledge of marine biodiversity in New Zealand we are focussed on the process of gathering data as representing New Zealandrsquos commitment to knowledge of the biodiversity of its marine estate As such it is expected that for a number of five yearly reports only increases in our knowledge are likely ie it is impossible to get a decrease in biodiversity using either the number of records or the number of species as the data available are not designed to determine changes in species abundance or presenceabsence rather they are recording presence only records With increased focussed monitoring of the marine environmental realm it should be possible to incorporate changes in species diversity into this statistic at a later stage based on site-specific monitoring schemes
To investigate the likelihood of a five year reporting period being long enough to show differences in the species richness metric we investigated the number of records uploaded to OBIS (including some New Zealand datasets) to determine whether sufficient new records are provided over a roughly similar timeframe (eight yearly 2006ndash2013) (Table 4) The number of lsquonewrsquo records varied across taxa with particular groups (eg Bacteria Plantae) having large number of records uploaded in 2006ndash 2013 (Table 4) This pattern should be expected in the future for other groups (eg Bryozoa Mollusca Chordata (eg fish) when existing New Zealand datasets including some datasets previously not available on OBIS are revised and uploaded to OBIS with large instantaneous increases in the number of records for particular taxonomic groups
Table 4 Temporal distribution of records in OBIS comparing all records to more recently uploaded or modified records from 2006ndash2013
Taxonomic group No records on No records after 2005 of records uploaded OBIS Dec 2013 on OBIS Dec 2013 between 2006 and 2013
Kingdom Animalia 429 771 9 120 212 Annelida 7 327 60 082 Arthropoda 14 324 940 638 Brachiopoda 1 509 2 013 Bryozoa 8 121 2 002 Cephalorhynca 35 0 000 Chaetognatha 600 3 050 Chordata 354 109 7 134 201 Cnidaria 7 396 278 376 Ctenophora 36 0 000 Echinodermata 11 170 235 210 Echiura 20 0 000 Entoprocta 1 0 000 Hemichordata 16 0 000 Mollusca 23 199 413 178 Myxozoa 3 0 000 Nematoda 36 0 000 Nemertea 24 0 000 Phoronida 10 0 000 Plathyhelminthes 12 0 000 Porifera 1 254 60 478 Rotifera 24 0 000 Sipuncula 131 0 000
Domain Bacteria 64 812 64 811 9999 Kingdom Chromista 31 974 11 003 Kingdom Plantae 776 297 3827 Kingdom Protozoa 108 0 000
Ministry for Primary Industries Tier 1 Marine Biodiversity Statistic 27
34 Taxonomic resolution
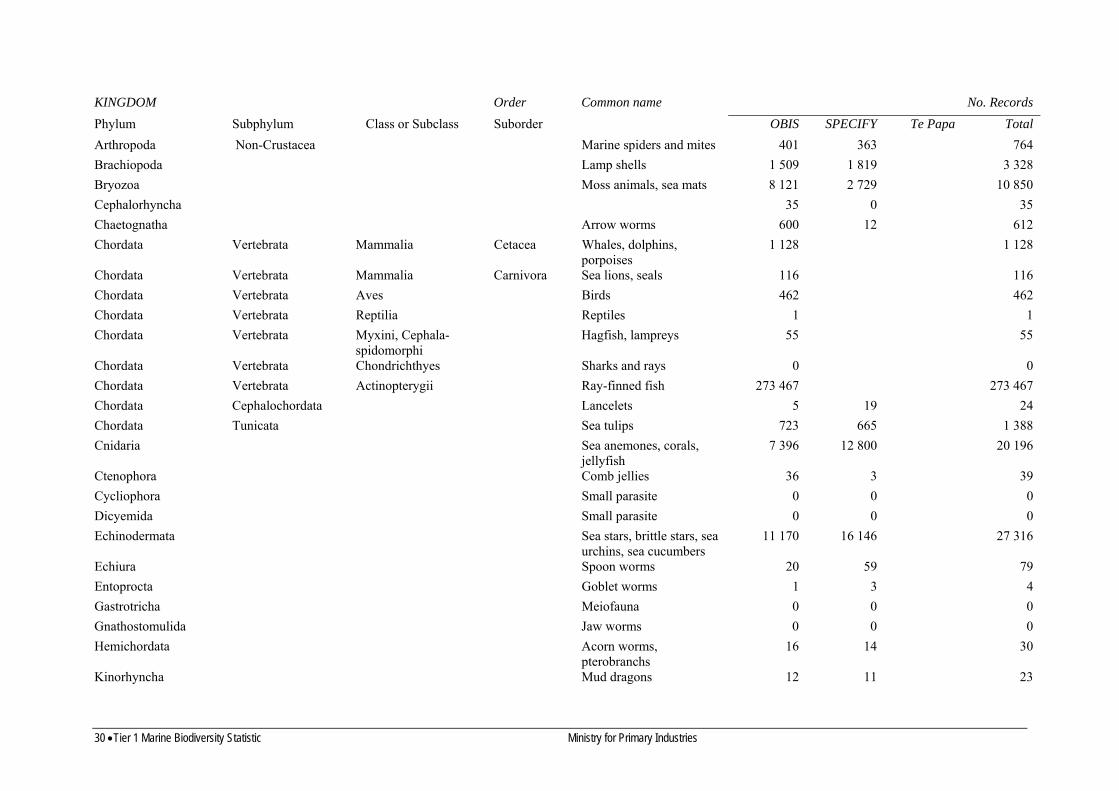
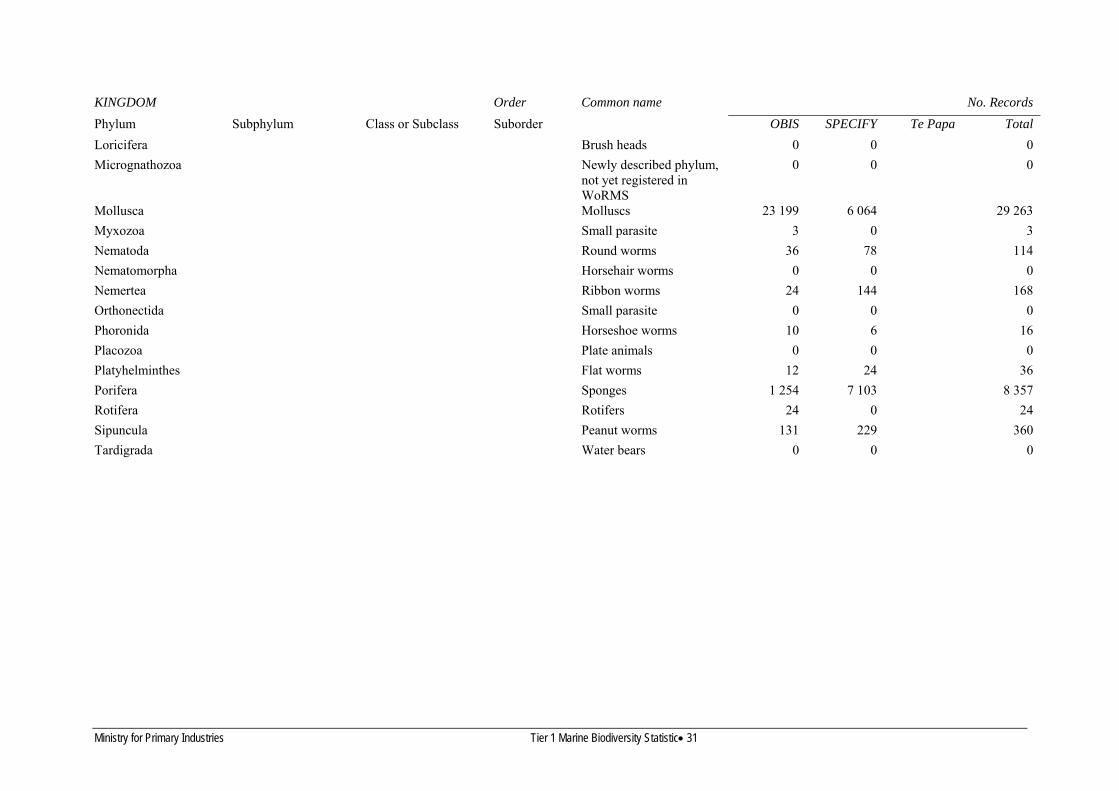
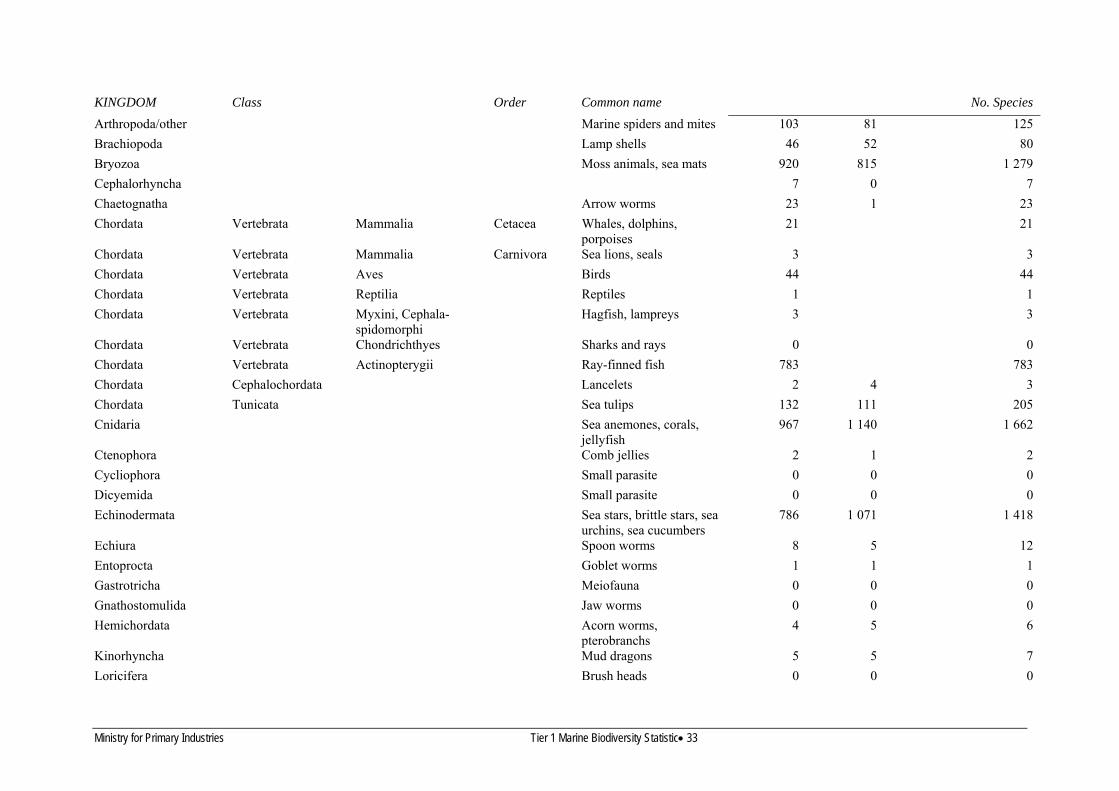
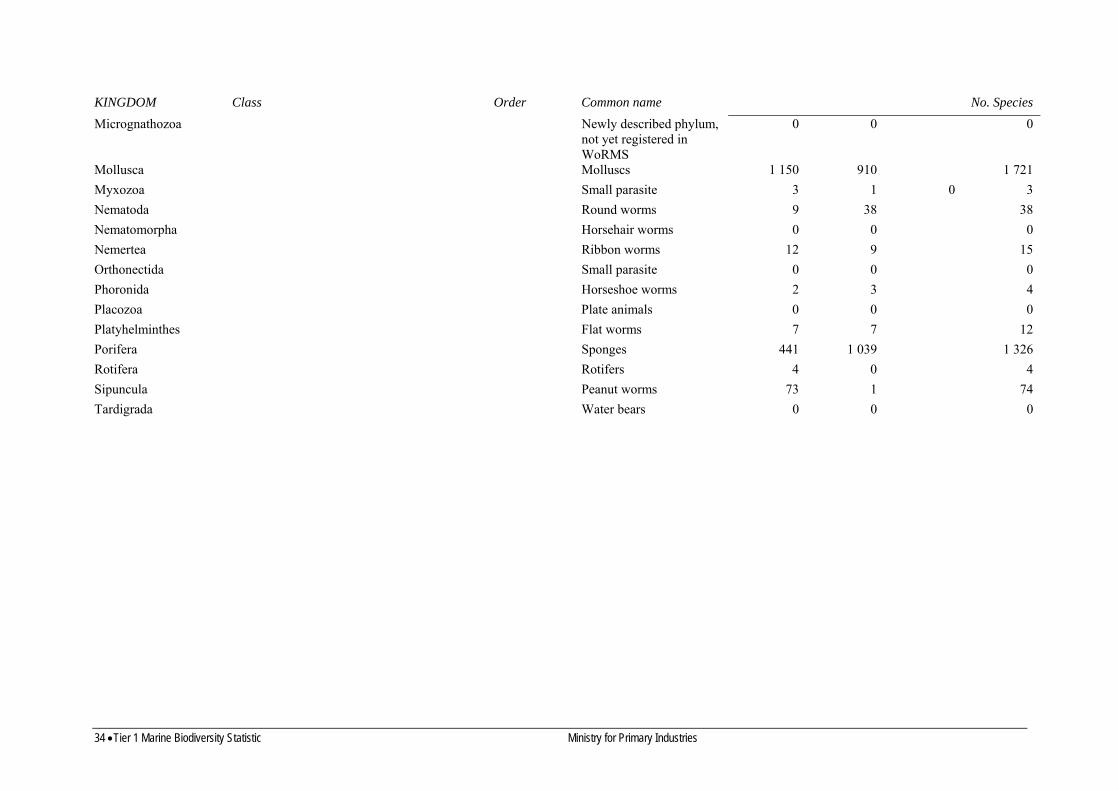
The number of records and number of species differ substantially between taxonomic groups with many smaller phyla having few or no records in the New Zealand EEZ (Table 5 Table 6) Dominant taxonomic groups in terms of number of total records include in order of abundance of species records 1) Chordata (primarily fishes) 2) Bacteria 3) Chromista (brown algae and other Chromista) 4) Arthropoda 5) Mollusca 6) Echinodermata 7) Cnidaria 8) Plantae (primarily red and green algae) 9) Bryozoa 10) Annelida 11) Porifera and 12) Brachiopoda All other taxonomic groups had fewer than 1000 total records across all datasets (Table 5) In terms of number of species the proportional representation of taxonomic groups showed different rankings with Chordata and Bacteria both having the highest numbers of records but ranked much lower in terms of number of species The ranking for total number of species were 1) Arthropoda 2) Mollusca 3) Cnidaria 4) Chromista (brown algae and other Chromista) 5) Echinodermata 6) Porifera 7) Bryozoa 8) Chordata (primarily fishes) 9) Annelida 10) Plantae (primarily red and green algae) 11) Bacteria and 12) Brachiopoda
28 Tier 1 Marine Biodiversity Statistic Ministry for Primary Industries
Table 5 Taxonomic distribution of records used in Marine Biodiversity Tier 1 Statistic calculations comparing contributions of records between broad database sources
KINGDOM
Phylum Subphylum Class or Subclass
Order
Suborder
Common name
OBIS SPECIFY Te Papa
No Records
Total
ARCHAEA 0 0 0 0
BACTERIA Bacteria including cyanobacteria
64 812 0 0 64 812
FUNGI 0 0 0 0
PROTOZOA Dinoflagellates foraminifera
108 171 0 279
PLANTAE
Chlorophyta
Rhodophyta
Other
Green algae
Red algae
Other flowering plants (eg mangrove seagrass saltmarsh)
776
121
647
8
0 14 842
2 213
12 629
0
15 618
2 334
13 276
8
CHROMISTA
Ochrophyta
Other
Brown algae
Other Chromista
31 974
569
31 405
0 4 584
4 580
4
36 558
5 149
31 409
ANIMALIA
Acanthocephala
Annelida
Arthropoda Crustacea
Thorny-headed worms
Segmented worms
Crustaceans
0
7 327
14 324
0
3 050
16 997
0
10 377
31 321
Ministry for Primary Industries Tier 1 Marine Biodiversity Statistic 29
KINGDOM Order Common name No Records
Phylum Subphylum Class or Subclass Suborder OBIS SPECIFY Te Papa Total
Arthropoda Non-Crustacea Marine spiders and mites 401 363 764
Brachiopoda Lamp shells 1 509 1 819 3 328
Bryozoa Moss animals sea mats 8 121 2 729 10 850
Cephalorhyncha 35 0 35
Chaetognatha Arrow worms 600 12 612
Chordata Vertebrata Mammalia Cetacea Whales dolphins 1 128 1 128 porpoises
Chordata Vertebrata Mammalia Carnivora Sea lions seals 116 116
Chordata Vertebrata Aves Birds 462 462
Chordata Vertebrata Reptilia Reptiles 1 1
Chordata Vertebrata Myxini Cephala- Hagfish lampreys 55 55 spidomorphi
Chordata Vertebrata Chondrichthyes Sharks and rays 0 0
Chordata Vertebrata Actinopterygii Ray-finned fish 273 467 273 467
Chordata Cephalochordata Lancelets 5 19 24
Chordata Tunicata Sea tulips 723 665 1 388
Cnidaria Sea anemones corals 7 396 12 800 20 196 jellyfish
Ctenophora Comb jellies 36 3 39
Cycliophora Small parasite 0 0 0
Dicyemida Small parasite 0 0 0
Echinodermata Sea stars brittle stars sea 11 170 16 146 27 316 urchins sea cucumbers
Echiura Spoon worms 20 59 79
Entoprocta Goblet worms 1 3 4
Gastrotricha Meiofauna 0 0 0
Gnathostomulida Jaw worms 0 0 0
Hemichordata Acorn worms 16 14 30 pterobranchs
Kinorhyncha Mud dragons 12 11 23
30 Tier 1 Marine Biodiversity Statistic Ministry for Primary Industries
KINGDOM Order Common name No Records
Phylum Subphylum Class or Subclass Suborder OBIS SPECIFY Te Papa Total
Loricifera Brush heads 0 0 0
Micrognathozoa Newly described phylum 0 0 0 not yet registered in WoRMS
Mollusca Molluscs 23 199 6 064 29 263
Myxozoa Small parasite 3 0 3
Nematoda Round worms 36 78 114
Nematomorpha Horsehair worms 0 0 0
Nemertea Ribbon worms 24 144 168
Orthonectida Small parasite 0 0 0
Phoronida Horseshoe worms 10 6 16
Placozoa Plate animals 0 0 0
Platyhelminthes Flat worms 12 24 36
Porifera Sponges 1 254 7 103 8 357
Rotifera Rotifers 24 0 24
Sipuncula Peanut worms 131 229 360
Tardigrada Water bears 0 0 0
Ministry for Primary Industries Tier 1 Marine Biodiversity Statistic 31
Table 6 Taxonomic distribution of species used in Marine Biodiversity Tier 1 Statistic calculations comparing contributions of species between broad databasesources
KINGDOM
Phylum
Class
Subphylum Subclass
Order
Suborder
Common name
OBIS SPECIFY Te Papa
No Species
Total
ARCHAEA 0 0 0 0
BACTERIA Bacteria including cyanobacteria
603 0 0 603
FUNGI 0 0 0 0
PROTOZOA Dinoflagellates foraminifera
8 32 0 40
PLANTAE
Chlorophyta
Rhodophyta
Spermatophyta
Green algae
Red algae
Other flowering plants (eg mangrove seagrass saltmarsh)
81
10
66
5
0 798
119
679
874
127
742
5
CHROMISTA
Ochrophyta
Other
Brown algae
Other Chromista
1 553
137
1 416
0 230
230
1 646
333
1 416
ANIMALIA
Acanthocephala
Annelida
ArthropodaCrustacea
Thorny-headed worms
Segmented worms
Crustaceans
7 787
0
671
1 457
7 577
411
1 866
12 213
0
932
2 399
32 Tier 1 Marine Biodiversity Statistic Ministry for Primary Industries
KINGDOM Class Order Common name No Species
Arthropodaother Marine spiders and mites 103 81 125
Brachiopoda Lamp shells 46 52 80
Bryozoa Moss animals sea mats 920 815 1 279
Cephalorhyncha 7 0 7
Chaetognatha Arrow worms 23 1 23
Chordata Vertebrata Mammalia Cetacea Whales dolphins 21 21 porpoises
Chordata Vertebrata Mammalia Carnivora Sea lions seals 3 3
Chordata Vertebrata Aves Birds 44 44
Chordata Vertebrata Reptilia Reptiles 1 1
Chordata Vertebrata Myxini Cephala- Hagfish lampreys 3 3 spidomorphi
Chordata Vertebrata Chondrichthyes Sharks and rays 0 0
Chordata Vertebrata Actinopterygii Ray-finned fish 783 783
Chordata Cephalochordata Lancelets 2 4 3
Chordata Tunicata Sea tulips 132 111 205
Cnidaria Sea anemones corals 967 1 140 1 662 jellyfish
Ctenophora Comb jellies 2 1 2
Cycliophora Small parasite 0 0 0
Dicyemida Small parasite 0 0 0
Echinodermata Sea stars brittle stars sea 786 1 071 1 418 urchins sea cucumbers
Echiura Spoon worms 8 5 12
Entoprocta Goblet worms 1 1 1
Gastrotricha Meiofauna 0 0 0
Gnathostomulida Jaw worms 0 0 0
Hemichordata Acorn worms 4 5 6 pterobranchs
Kinorhyncha Mud dragons 5 5 7
Loricifera Brush heads 0 0 0
Ministry for Primary Industries Tier 1 Marine Biodiversity Statistic 33
KINGDOM Class Order Common name No Species
Micrognathozoa Newly described phylum 0 0 0 not yet registered in WoRMS
Mollusca Molluscs 1 150 910 1 721
Myxozoa Small parasite 3 1 0 3
Nematoda Round worms 9 38 38
Nematomorpha Horsehair worms 0 0 0
Nemertea Ribbon worms 12 9 15
Orthonectida Small parasite 0 0 0
Phoronida Horseshoe worms 2 3 4
Placozoa Plate animals 0 0 0
Platyhelminthes Flat worms 7 7 12
Porifera Sponges 441 1 039 1 326
Rotifera Rotifers 4 0 4
Sipuncula Peanut worms 73 1 74
Tardigrada Water bears 0 0 0
34 Tier 1 Marine Biodiversity Statistic Ministry for Primary Industries
In determining an appropriate way to report taxonomic differences in species richness that is suitable and informative for the general public as well as for managers and policy makers we present three variations of potential taxonomic groupings varying in resolution of lesser known groups (ie Echiura Sipuncula Phoronida) and of groups often of particular interest to the public and for international reporting agreements (ie Chordata seabirds marine mammals marine reptiles) (Table 7) Other biodiversity summaries have varied in taxonomic resolution from very low resolution (eg Costello et al 2010) to high resolution (eg Supplementary tables available in Gordon et al 2010) A medium resolution grouping allows presentation of categories that may be of interest to the general public and important for international reporting statistics while lumping the large number of smaller invertebrate phyla
Table 7 Potential groupings for taxonomic representation to be used in Marine Biodiversity Tier 1 Statistic
Low resolution Medium resolution Highest resolution KINGDOM Phylum (SubphylumClassSubClass OrderSubOrder)
ARCHAEA ARCHAEA ARCHAEA BACTERIA BACTERIA BACTERIA FUNGI FUNGI FUNGI PROTOZOA PROTOZOA PROTOZOA PLANTAE PLANTAE PLANTAE
Chlorophyta Chlorophyta Rhodophyta Rhodophyta Other Other
CHROMISTA CHROMISTA CHROMISTA Ochrophyta Ochrophyta Other Other
ANIMALIA ANIMALIA ANIMALIA Chordata (Vertebrata Other) Chordata (Mammalia) Chordata (Vertebrata Mammalia
Cetacea) Chordata (Vertebrata Mammalia Carnivora)
Chordata (Vertebrata Aves) Chordata (Vertebrata Aves) Chordata (Vertebrata Chordata (Vertebrata Reptilia) Reptilia)
Chordata (Vertebrata Chordata (Vertebrata Other) Chordata (Vertebrata Actinypterigiae) Actinypterigiae)
Chordata (Vertebrata Chondrichthyes and other fish classes)
Chordata (Other) Chordata (Other) Chordata (Cephalochordata) Chordata (Tunicata)
Annelida Annelida Annelida Arthropoda Arthropoda Arthropoda (Crustacea)
Arthropoda (Other) Bryozoa Bryozoa Bryozoa Cnidaria Cnidaria Cnidaria Echinodermata Echinodermata Echinodermata Mollusca Mollusca Mollusca Porifera Porifera Porifera Other invertebrate phyla Brachiopoda Brachiopoda
Platyhelminthes Platyhelminthes Other invertebrate phyla Acanthocephala
Cephalorhyncha Chaetognatha Ctenophora Cycliophora Dicyemida
Ministry for Primary Industries Tier 1 Marine Biodiversity Statistic 35
Low resolution Medium resolution Highest resolution KINGDOM Phylum (SubphylumClassSubClass OrderSubOrder)
Echiura Entoprocta Gastrotricha Gnathostomulida Hemichordata Kinorhyncha Loricifera Micrognathozoa Myxozoa Nematoda Nematomorpha Nemertea Orthonectida Phoronida Placozoa Rotifera Sipuncula Tardigrada
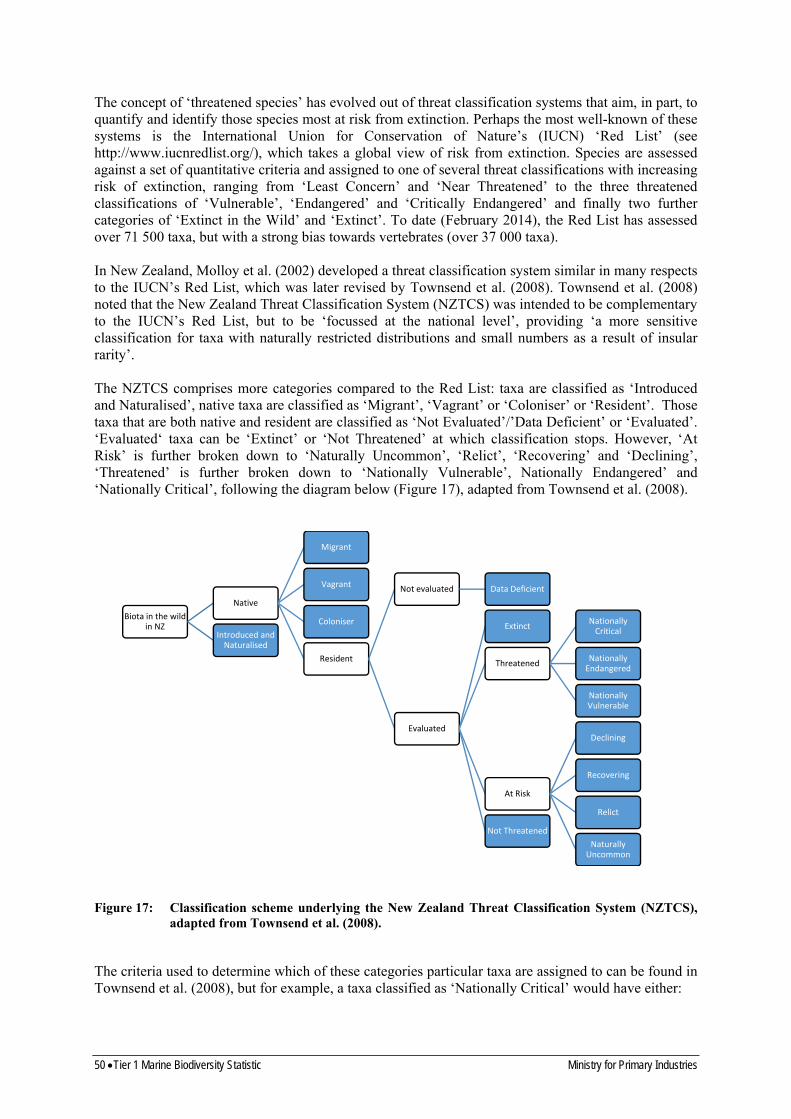
35 Reporting of Records instead of Species
In calculating spatial patterns in species richness the cost-effectiveness of developing metrics based on species records (ie immediately extracted from OBIS with minimal further manipulation required for geoprocessing to develop spatial patterns for the statistic) can be weighed against the substantial additional effort required to convert species records into spatial patterns of species richness using MGET or other complex geoprocessing algorithms Spatial patterns in species records and species richness are generally similar reflecting primarily patterns of sampling and taxonomic effort up to 2013 (Figure 3 Figure 4 Table 8) The similarities between spatial patterns based on records and species richness is consistent across taxa with plots of ray-finned fishes (Actinypterigiae) (Figure 10) Arthropoda (Figure 11) Annelida (Figure 12) Mollusca (Figure 13) Bryozoa (Figure 14) Chromista (Figure 15) and Plantae (Figure 16) all showing similar relative patterns of high middle low and empty cells This suggests that a statistic using the number of records can provide (at least at this point in our knowledge of marine biodiversity in the New Zealand EEZ) equivalent information to that of the more costly calculation of species richness
Using records instead of species also side-steps issues of changes in taxonomy As taxonomy is regularly evolving at levels from species to phyla (ie two phyla described in Gordon et al (2010) have been renamed) species records in OBIS and elsewhere are likely to be modified to reflect updated taxonomy Other challenges with some data records is that occasionally a taxonomic unit is only identified to higher taxonomic levels so a true species identity may not yet exist in OBIS or other databases for many records held in national collections As such the reports of higher numbers of species found from the combined OBISTe PapaNIWA datasets than reported as the number of described species for a particular taxonomic group is likely to be spurious for some groups (eg Porifera) that may be more likely to have species records not defined to genus and species It is expected that future revisions of this statistic will show more equitability between OBIS-derived measures of species richness to those estimated by Gordon et al (2010) and available from the New Zealand Inventory of Biodiversity (Gordon (2009) Gordon (2010) Gordon (2012))
It is still valuable to calculate the number of species described at a national level OBIS and other datasets do not include (as of 2013) the full complement of species described for the New Zealand EEZ and reported in Gordon et al (2010) (Table 8) Instead the number of records available to
36 Tier 1 Marine Biodiversity Statistic Ministry for Primary Industries
describe spatial patterns in species richness vary among taxonomic groupings (Table 8) Sampling effort as approximated by the records to species ratio also varies between groups with some taxonomic groups having substantially higher sampling effort relative to species described (eg fishes with about 348 times as many records as number of fish species) This is in contrast to even some relatively well described groups like Porifera and Bryozoa for which there are 6 and 8 records per species (on average) respectively (Table 8) Note that the distribution of records is not equivalent across species within a taxonomic group such that most species groups are represented by a smaller number of common species with more records and the majority of species are often rarer with only one or two records in the EEZ (eg macroalgae Nelson et al 2013)
Ministry for Primary Industries Tier 1 Marine Biodiversity Statistic 37
Table 8 Comparison of biodiversity information compiled by this report with the expert-derived estimates of marine biodiversity across taxonomic groups from Gordon et al (2010) supplementary information table revised to reflect updated taxonomy Note that there are more individual species recorded in OBIS than in Gordon et al ( in final column) this is likely to be due to records uploaded to OBIS but not identified to species level
No No Estd no No No No No Records Min no described undescribed undescribed endemic alien records species in per species not species in study study species in OBIS
BACTERIAARCHAEA 40 69 190 0 0 64 812 603 107
FUNGI 57 0 210 0 0 0 0 0 57
PROTOZOA 1 476 152 2 900 162 4 279 40 7 1 436
PLANTAE
Chlorophyta 142 0 90 36 0 2 334 127 18 15
Rhodophyta 419 101 150 189 12 13 276 742 18
Other 7 0 0 0 0 8 5 2 2
CHROMISTA
Ochrophyta 734 43 630 55 11 5 149 333 15 401
Other 83 0 25 1 0 31 409 1 416 22
ANIMALIA 0
Acanthocephala 24 5 50 1 0 0 0 0 24
Annelida 528 263 1 005 238 32 10 377 932 11
ArthropodaCrustacea 2 166 407 4 930 944 27 31 321 2 399 13
Arthropodaother 147 7 215 61 1 764 125 6 22
Brachiopoda 41 9 17 15 0 3 328 80 42
Bryozoa 622 331 295 581 24 10 850 1 279 8
Cephalorhyncha (prev Priapulida) 3 0 4 0 0 35 7 5
Chaetognatha 14 0 25 0 0 612 23 27
Chordata (VertebrataMammaliaCetacea) 41 0 0 1 0 1 128 21 54 20
Chordata (VertebrataMammaliaCarnivora) 8 0 0 1 0 116 3 39 5
Chordata (VertebrataAves) 122 2 0 41 0 462 44 11 78
Chordata (VertebrataReptilia) 6 0 0 0 0 1 1 1 5
Chordata (VertebrataAll fish classes) 1 313 74 762 242 6 273 522 786 348 527
Chordata (Cephalochordata) 1 0 0 1 0 24 3 8
38 Tier 1 Marine Biodiversity Statistic Ministry for Primary Industries
No No Estd no No No No No Records Min no described undescribed undescribed endemic alien records species in per species not species in study study species in OBIS
Chordata (Tunicata) 189 3 195 125 12 1 388 205 7
Cnidaria 794 322 630 258 23 20 196 1 662 12
Ctenophora 15 4 12 5 0 39 2 20 13
Cycliophora 0 0 0 0 0 0 0 0 0
Dicyemida 5 1 15 6 0 0 0 0 5
Echinodermata 557 66 45 237 0 27 316 1 418 19
Echiura 5 2 15 0 0 79 12 7
Entoprocta (prev Kamptozoa) 6 7 30 2 1 4 1 4 5
Gastrotricha 0 5 190 0 0 0 0 0 0
Gnathostomulida 2 10 12 4 0 0 0 0 2
Hemichordata 5 2 4 1 0 30 6 5
Kinorhyncha 6 39 30 6 0 23 7 3
Loricifera 0 4 10 2 0 0 0 0 0
Micrognathozoa 0 0 1 0 0 0 0 0 0
Mollusca 2 340 1 253 430 2 923 14 29 263 1 721 17 619
Myxozoa 0 0 0 0 0 3 1 3
Nematoda 155 52 1 430 25 0 114 47 2 108
Nematomorpha 1 0 0 1 0 0 0 0 1
Nemertea 28 26 350 28 0 168 15 11 13
Orthonectida 0 1 20 1 0 0 0 0 0
Phoronida 3 0 2 0 0 16 4 4
Placozoa 0 0 1 0 0 0 0 0 0
Platyhelminthes 229 95 1 810 91 2 36 12 3 217
Porifera 472 963 310 455 7 8 357 1 326 6
Rotifera 2 0 95 0 1 24 4 6
Sipuncula 26 0 10 2 0 360 74 5
Tardigrada 3 2 60 0 0 0 0 0 3
Xenacoelomorpha (prev Xenoturbellida) 0 0 0 0 0 0 0 0 0
Ministry for Primary Industries Tier 1 Marine Biodiversity Statistic 39
Figure 10 Demonstration of variation in spatial coverage between taxonomic groups Species richness of Actinypterigiae (bony fish) at grid scale of 100 km times 100 km across all datasets Left number of records Right number of individual species identified
40 Tier 1 Marine Biodiversity Statistic Ministry for Primary Industries
Figure 11 Demonstration of variation in spatial coverage between taxonomic groups Species richness of Arthropoda (primarily crustaceans) at grid scale of 100 km times 100 km across all datasets Left number of records Right number of individual species identified
Ministry for Primary Industries Tier 1 Marine Biodiversity Statistic 41
Figure 12 Demonstration of variation in spatial coverage between taxonomic groups Species richness of Annelida (primarily marine polychaetes) at grid scale of 100 km times 100 km across all datasets Left number of records Right number of individual species identified
42 Tier 1 Marine Biodiversity Statistic Ministry for Primary Industries
Figure 13 Demonstration of variation in spatial coverage between taxonomic groups Species richness of Mollusca (gastropods bivalves cephalopods) at grid scale of 100 km times 100 km across all datasets Left number of records Right number of individual species identified
Ministry for Primary Industries Tier 1 Marine Biodiversity Statistic 43
Figure 14 Demonstration of variation in spatial coverage between taxonomic groups Species richness of Bryozoa at grid scale of 100 km times 100 km across all datasets Left number of records Right number of individual species identified
44 Tier 1 Marine Biodiversity Statistic Ministry for Primary Industries
Figure 15 Demonstration of variation in spatial coverage between taxonomic groups Species richness of marine Chromista at grid scale of 100 km times 100 km across all datasets Left number of records Right number of individual species identified
Ministry for Primary Industries Tier 1 Marine Biodiversity Statistic 45
Figure 16 Demonstration of variation in spatial coverage between taxonomic groups Species richness of marine Plantae at a grid scale of 100 km times 100 km across all datasets Left number of records Right number of individual species identified
46 Tier 1 Marine Biodiversity Statistic Ministry for Primary Industries
36 Summary recommendations Species Richness
In summary reporting on species richness highlights a key factor relating to the development of a Tier 1 Marine Biodiversity Statistic our knowledge of marine biodiversity is low relative to other developed countries particularly in the ERMS (Europe) region where sampling has been undertaken for many more years As such any statistic relating to species richness is in reality a State of Knowledge index as changes in the spatial distribution and the number of taxa will initially represent increases in knowledge both in terms of increased sampling effort where gaps in spatial sampling coverage are currently evident and increased knowledge if additional sampling effort is focussed on the many under-represented groups in the marine biodiversity record particularly invertebrate groups Moreover data entering the databases is essentially for taxonomic purposes rather than monitoring and thus does not always include all species found in a sample ie if a species is not reported we do not know whether it is not there This complicates both qualitative and quantitative estimates of species richness Finally as there is no structured or coherent sampling design at present species richness can only increase there is no way of determining decreases over time
As our understanding of marine biodiversity increases we will be able to better assess hotspots of biodiversity and the features that they are associated with in the New Zealand EEZ Similarly with adequate knowledge of patterns in marine biodiversity we can better assess changes in species ranges decreases in abundance of common and rare taxa and other aspects that may reflect impacts of disturbances and climate change on marine biodiversity However it is more likely that changes in marine biodiversity would be better assessed from observed changes in directed monitoring across a number of locations while the information gleaned from OBIS and other taxonomic datasets would focus primarily on changes in our state of knowledge of marine biodiversity
From our initial assessment of available data to assess patterns in marine biodiversity we recommend a cost-effective statistic reporting on species richness should Have a spatial scale of reporting of 100 km times 100 km grid cells Include all datasets uploaded on OBIS Encourage (and provide funding for if necessary) data managers to regularly update New Zealand biodiversity datasets and upload them to OBIS including NIWA datasets Te Papa and other museum collections and other national datasets identified in this report Electronic linkages (currently being implemented) should be restored such that regular updates to OBIS from the South Western Pacific Node occur
Use WoRMS as the main source of taxonomic nomenclature and ensure that electronic linkages between NZOR and WoRMS are restored such that New Zealand based advances in taxonomy are included in the international taxonomic record
Have a temporal scale of reporting of five yearly Report number of species in total for the New Zealand EEZ to medium taxonomic resolution such that groups for which the public is familiar (eg vertebrates) have higher resolution and smaller uncommon phyla are combined
Report spatial patterns using the number of records extracted from OBIS as a proxy for patterns in species richness based on the number of individual species
Use gaps in spatial and taxonomic information to identify priorities for further sampling surveys in poorly studied regions and funding toward taxonomic training
Be considered as reporting on New Zealandrsquos commitment to advancing the nationrsquos knowledge of biodiversity rather than as an estimate of biodiversity per se
4 State of Knowledge Index
As discussed in Section 3 compilation of existing information on marine biodiversity in the New Zealand EEZ suggests that our biggest challenge is that of the poor state of knowledge both taxonomically and spatially Gordon et al (2010) estimated that only 31 of New Zealandrsquos marine biodiversity has been described quantifying a total of 17 135 known species including 4315 collected
Ministry for Primary Industries Tier 1 Marine Biodiversity Statistic 47
but as yet undescribed species and an estimated 17 220 (at minimum) further undescribed species In terms of our spatial understanding of marine biodiversity approximately 50 of cells had fewer than 50 biodiversity records and 38 of cells had 10 or fewer recorded species As such much of the increase in the state of knowledge will be revealed through increases in sampling effort in under-studied regions of the EEZ and efforts to reduce bias in taxonomic sampling and expertise and in formal taxonomic descriptions of lsquoknownrsquo undescribed species Plots of temporal (five yearly) subsets of the spatial distribution of new records can demonstrate increases in the state of the spatial knowledge of New Zealandrsquos marine biodiversity
Other biodiversity reviews have used expert-derived metrics to define the state of knowledge of marine biodiversity Data reported in Costello et al (2010) on the state of knowledge of marine biodiversity included metrics based on the number of taxonomic experts the age and number of identification guides and the percentage of taxa described summarised over broad national and international regions Gordon et al (2010) reported the metrics as in Costello et al (2010) and also included the number of collected and as yet not formally described species (labelled lsquoknown undescribedrsquo) in addition to an estimate of the number of undescribed taxa across phyla that have not yet been collected or described Outside of major museums and research institutes it will be potentially difficult in future to track down taxonomic experts and to track identification guides many of which are developed for amateur field identification by non-taxonomists
However the state of knowledge can be most adequately assessed by our knowledge of species biodiversity itself New species records can be found through reviews of peer-reviewed publications in key taxonomic literature including New Zealand local taxonomic journals which often include in their title lsquoNew record ofhelliprdquo For most taxa these new taxonomic records are uploaded to NZOR with data providers for marine taxa reported on the NZOR website (as at July 2012) to include
Marine algae data maintained by Tē Papa Digitised checklists from the New Zealand Inventory of Biodiversity Volumes 123 Edited by Dennis P Gordon (excluding plants and fungi)
State of knowledge is also relevant to the Threatened Species metric discussed in Section 6 Two categories within the New Zealand Threatened Species Classification (lsquonot assessedrsquo and lsquodata deficientrsquo) refer to taxa for which information has either not been compiled or is not yet available to determine whether a taxa is or is not threatened
41 Summary recommendations State of Knowledge
Report number of newly described species across taxonomic groups Report new species records in geographic context (as for methods for Species Richness but using a five yearly subset of recent data) as a measure of increased geographic knowledge
Use gaps in spatial and taxonomic information to identify priorities for further sampling surveys and decrease the number of areas that are poorly sampled
Use gaps in taxonomic information to identify priority databases to encourage upload to OBIS
5 Endemic species metric
Costello et al (2010) reported the number of endemic species across broad taxonomic categories (Plants Invertebrates Fish Other vertebrates) at a national scale New Zealandrsquos marine species have a high level of endemism with over 50 of described species reported as endemic to New Zealandrsquos EEZ (Costello et al 2010 Gordon et al 2010) While Gordon et al (2010) provides a starting point for estimates of the proportion of endemic species for higher resolution taxonomic groupings (Table 8) these proportions are unlikely to change in a significant way with new species described based on the small numbers of new taxa likely to be described on a five yearly basis relative to total species in most taxonomic groups As such statistics based on changes in the proportion of endemic species are unlikely to provide useful information on the status of New Zealandrsquos marine biodiversity However the static measure of endemicity is in itself an important aspect of New Zealandrsquos marine
48 Tier 1 Marine Biodiversity Statistic Ministry for Primary Industries
biodiversity and an important part of the conceptual understanding of the concept of biodiversity and one of the reasons that New Zealandrsquos marine (and terrestrial) fauna and flora is internationally known as a hotspot of biodiversity
While unlikely to individually result in a large change in the proportion of endemic species records of non-indigenous marine species (NIMS) and changes in their distribution are potentially useful indicators of the status of marine biodiversity as some NIMS are lsquoinvasive exoticsrsquo defined as those species that are present outside their natural distribution and have adverse impacts on native biodiversity It is assumed that reporting of the impacts of any NIMS taxa (ie resulting in decreases in native biodiversity) would be incorporated into the Tier 1 Ecological Integrity statistic which is proposed for reporting more directly on ecosystem health However basic information on the number of NIMS taxa is a useful metric to include to represent changes in biodiversity as related to endemicity of marine fauna and flora
Should NIMS be included as part of the Tier 1 marine biodiversity statistic this metric should include data on NIMS sourced from both OBIS and from the national Marine High Risk Site Surveillance (MHRSS) biosecurity database Data for MHRSS is held and managed by NIWA for the Ministry for Primary Industries (originally MAF Biosecurity) this database includes both transient (eg found on vessel hulls) and established NIMS taxa whereas only established NIMS taxa would be quantified for a Tier 1 marine biodiversity statistic 177 non-indigenous species were recorded as established in the New Zealand EEZ in 2010 (Gordon et al 2010) As of December 2013 a total of 334 recorded NIMS taxa had been discovered in New Zealand including many that were present only on vessel hulls Within OBIS records could be extracted for these NIMS taxa on a five yearly basis to determine whether there are changes in the spatial distribution of these taxa Using BIODS changes in the number of primary and secondary ports at which a NIMS are recorded could be used as an indicator of whether initiatives to reduce the influx of NIMS via ballast water and vessel hull cleaning initiatives are resulting in a reduction in transport of NIMS Similarly changes in the number of NIMS taxa could also be reported using information provided by Ministry for Primary Industries Biosecurity of any new NIMS taxa recorded within the five yearly update period or any new records on NIMS taxa recorded on NZOR or from the NIWA Marine Invasives Taxonomic Service (MITS)
51 Summary recommendations Endemic species
A statistic reporting on the proportion of endemic species is unlikely to demonstrate substantial change within a five year reporting period and is thus unlikely to be a useful indicator of changes in marine biodiversity Rather the presence and change in status of non-indigenous marine species (NIMS) would be a more useful indicator of changes in marine biodiversity as some NIMS taxa have negative impacts on native marine biodiversity If not overlapping the Ecological Integrity Tier 1 statistic or other national reporting programmes we recommend Report on the relatively static measure of the proportion of endemic species as an important aspect of New Zealandrsquos marine biodiversity
Do not report on changes in the proportion of endemic species Rather report on
o Change in spatial distribution of NIMS taxa o Changes in number of NIMS taxa recorded in the New Zealand EEZ
6 Threatened species metric
Costello et al (2010) reported on a ranked summary of the major threats to marine biodiversity at a national scale rather than on the number or presence of threatened species in the New Zealand EEZ Here we discuss a different metric that of the number of threatened species found in New Zealand and trends in their status
Ministry for Primary Industries Tier 1 Marine Biodiversity Statistic 49
The concept of lsquothreatened speciesrsquo has evolved out of threat classification systems that aim in part to quantify and identify those species most at risk from extinction Perhaps the most well-known of these systems is the International Union for Conservation of Naturersquos (IUCN) lsquoRed Listrsquo (see httpwwwiucnredlistorg) which takes a global view of risk from extinction Species are assessed against a set of quantitative criteria and assigned to one of several threat classifications with increasing risk of extinction ranging from lsquoLeast Concernrsquo and lsquoNear Threatenedrsquo to the three threatened classifications of lsquoVulnerablersquo lsquoEndangeredrsquo and lsquoCritically Endangeredrsquo and finally two further categories of lsquoExtinct in the Wildrsquo and lsquoExtinctrsquo To date (February 2014) the Red List has assessed over 71 500 taxa but with a strong bias towards vertebrates (over 37 000 taxa)
In New Zealand Molloy et al (2002) developed a threat classification system similar in many respects to the IUCNrsquos Red List which was later revised by Townsend et al (2008) Townsend et al (2008) noted that the New Zealand Threat Classification System (NZTCS) was intended to be complementary to the IUCNrsquos Red List but to be lsquofocussed at the national levelrsquo providing lsquoa more sensitive classification for taxa with naturally restricted distributions and small numbers as a result of insular rarityrsquo
The NZTCS comprises more categories compared to the Red List taxa are classified as lsquoIntroduced and Naturalisedrsquo native taxa are classified as lsquoMigrantrsquo lsquoVagrantrsquo or lsquoColoniserrsquo or lsquoResidentrsquo Those taxa that are both native and resident are classified as lsquoNot EvaluatedrsquorsquoData Deficientrsquo or lsquoEvaluatedrsquo lsquoEvaluatedlsquo taxa can be lsquoExtinctrsquo or lsquoNot Threatenedrsquo at which classification stops However lsquoAt Riskrsquo is further broken down to lsquoNaturally Uncommonrsquo lsquoRelictrsquo lsquoRecoveringrsquo and lsquoDecliningrsquo lsquoThreatenedrsquo is further broken down to lsquoNationally Vulnerablersquo Nationally Endangeredrsquo and lsquoNationally Criticalrsquo following the diagram below (Figure 17) adapted from Townsend et al (2008)
Biota in the wild in NZ
Native
Migrant
Vagrant
Coloniser
Resident
Not evaluated Data Deficient
Evaluated
Extinct
Threatened
Nationally Critical
Nationally Endangered
Nationally Vulnerable
At Risk
Declining
Recovering
Relict
Naturally Uncommon
Not Threatened
Introduced and Naturalised
Figure 17 Classification scheme underlying the New Zealand Threat Classification System (NZTCS) adapted from Townsend et al (2008)
The criteria used to determine which of these categories particular taxa are assigned to can be found in Townsend et al (2008) but for example a taxa classified as lsquoNationally Criticalrsquo would have either
50 Tier 1 Marine Biodiversity Statistic Ministry for Primary Industries
A a very small population A(1) fewer than 250 mature individuals A(2) no more than two sub-populations no more than 200 mature individuals in the larger sub-population A(3) Total area of occupancy no more than 1 ha
Or
B a small population with a high ongoing or predicted decline B(11) 250ndash1000 mature individuals predicted decline 50ndash70 B(21) no more than five sub-populations no more than 300 mature individuals in the largest sub-population predicted decline 50ndash70 B(31) Total area of occupancy no more than 10 ha predicted decline 50ndash70
Or
C a population (irrespective of size or number of sub-populations) with a very high ongoing or predicted decline of more than 70
The NZTCSrsquos long-term aim is to list all extant species by the threat of extinction Hitchmough (2013) lists 23 groups of taxa that have been reviewed to some extent additionally noting that algae freshwater invertebrates and marine fish had not been reviewed Taxonomic groups are assessed by a panel of experts It was suggested that each species group be assessed every three years although regular reporting has been inconsistent both within and between taxonomic groups Formal inclusion within a five yearly Tier 1 reporting statistic would provide both consistent funding and regularity of reporting across all taxonomic groups
A second concept lsquoprotected speciesrsquo is also used in New Zealand and includes most New Zealand seabirds marine mammals and marine reptiles nine fish including gropers sharks and rays and black corals stony corals hydrocorals and gorgonians These are generally taxa for which fishing or other human uses of the environment have the potential to reduce numbers through incidental capture habitat damage and modification or other direct or indirect effects The list of protected marine species in New Zealand includes taxa that have been assessed as threatened within the NZTCS but also many species that are not currently threatened Protected species are managed through the Fisheries Act 1996 (sections 8 9 and 15) the Marine Mammals Protection Act (1978) and the Wildlife Act (1953) A list of protected marine species is provided in Schedule 7A of the Wildlife Act with the most recent amendment to this list being in 2010 While outside the scope of a national reporting statistic this investigation highlights this disconnection between threatened and protected taxa better coordination of these lsquoconceptualrsquo listings is warranted for marine species with the suggestion that regular reporting cycles of Threatened species would lead to amendments to the Wildlife Act (1953) to add any new threatened species such that they receive the protections provided in this legislation
In the marine realm there have been reviews of marine mammals in 2009 (Baker et al 2010) seabirds as part of the birds reviews in 2008 (Miskelly et al 2008) and 2012 (Robertson et al 2013) marine reptiles as part of the reptiles reviews in 2009 (Hitchmough et al 2010) and 2012 (Hitchmough et al 2013) and marine invertebrates in 2009 (Freeman et al 2010) (Table 9) All New Zealand marine mammals seabirds and reptiles have been assessed (Baker et al 2010 Hitchmough et al 2013 Robertson et al 2013) but only 295 marine invertebrates were reviewed by Freeman et al (2010) (Table 9)
Although the coverage of marine taxa is currently very patchy and clearly biased towards the relatively large conspicuous taxa the NZTCS is both robust and valuable in terms of charting the long-term trends in conservation status of individual taxa and groups of taxa and also in terms of identifying taxa requiring specific conservation management Taken across the entire marine realm there are currently insufficient assessments across many taxonomic groups to justify the use of lsquonumber of threatened speciesrsquo as a Tier 1 statistic The challenge to assess every marine species as
Ministry for Primary Industries Tier 1 Marine Biodiversity Statistic 51
part of assessing all extant New Zealand taxa is truly daunting not least because there is simply insufficient reliable information on which to base an assessment for the vast majority of marine species ndash such taxa would be classified as lsquoData Deficientrsquo which would constitute the dominant classification Additionally it is difficult to see how the majority of marine taxa could be assessed in a timeframe of less than many decades without a substantial shift in resource allocation that would enable population sizes trends and distributions to be determined However theoretically and assuming that more taxonomic groups will be comprehensively assessed in the future the NZTCS and its concept of a lsquothreatened speciesrsquo could become a meaningful Tier 1 statistic for marine biodiversity perhaps restricting its use to well-defined species groups afforded comprehensive or near-comprehensive coverage
It is also worth noting that for the majority of marine taxa assessed to date which tend to be generally long-lived and slowly-reproducing species conservation status represents a relatively conservative statistic ndash the transition from one threat category to a lower threat category (ie an improvement in the conservation status of a particular taxa perhaps resulting in a reduction in the number of lsquothreatened speciesrsquo within a taxonomic group) would be likely to take many years perhaps even a few decades For such species the use of the number of threatened species as a useful Tier 1 statistic would only become valuable over similarly long timeframes
61 Threatened species summary statistic
We recommend for the threatened species metric that the number of threatened taxa in each threat category (both NZTCS and IUCN) is summarised for broad taxonomic groups (Marine mammals marine reptiles seabirds shorebirds marine fish marine invertebrates marine plants) including the proportion of each taxonomic group that have been assessed and the proportion of data deficient taxa (Table 9)
Five yearly reporting on this statistic should further include reporting on change in threat categories across taxonomic groups change in number of taxa evaluated change in number described as data deficient
52 Tier 1 Marine Biodiversity Statistic Ministry for Primary Industries
Table 9 Number of threatened marine taxa based on the New Zealand Threat Classification System
Taxonomic group Proportion or Extinct Data Nationally Nationally Nationally Declining Recovering Relict Naturally number assessed deficient critical endangered vulnerable uncommon
Marine mammals 100 (63) 13 5 3 Marine reptiles 100 (7) Seabirds 100 (145) 2 10 7 10 9 3 13 24 Shorebirds 100 (126) 13 1 7 3 6 4 3 4 Fish 218 37 2 52 Invertebrates 27 (307) 12 10 2 21 8 243 Algae 61 23 1 37
Taxonomic group Migrant Vagrant Coloniser Not Introduced and IUCN IUCN IUCN IUCN Critically threatened naturalised Combined Vulnerable Endangered Endangered
listings
Marine mammals 6 20 9 7 2 5 Marine reptiles 2 5 5 1 2 2 Seabirds 16 40 4 7 15 10 (9 Vagrant 1 5 (5 Vagrant)
Migrant) Shorebirds 7 65 2 10 1 1 1 (Vagrant) Fish 10 4 113 13 Invertebrates 11 Algae 2
Ministry for Primary Industries Tier 1 Marine Biodiversity Statistic 53
7 DISCUSSION
This preliminary investigation of marine biodiversity in New Zealand allows evaluation primarily of our current state of knowledge of marine biodiversity While more than 600 000 biodiversity records were available for this analysis it points out the bias in spatial coverage of our sampling of the marine environment with sampling coverage focussed on coastal areas and areas of particular interest for resource extraction (eg the Chatham Rise) This lack of information is in itself of interest for a publicly available statistic on New Zealandrsquos marine biodiversity in that it shows the public how much more there is to learn about our nationrsquos biodiversity Other aspects of New Zealandrsquos biodiversity such as high rates of endemism though unlikely to change are of interest to the general public in demonstrating why international experts consistently rank New Zealandrsquos waters as a hotspot for marine biodiversity
Statistical reporting on marine biodiversity at this early stage in the knowledge of our biodiversity can be used to prioritise areas for which we have poor information on biodiversity In addition some taxonomic groups are poorly covered in the biodiversity records in New Zealand and demonstration of this bias in spatial coverage can also be used to prioritise taxonomic expertise and training in areas for which there are gaps in New Zealandrsquos taxonomic expertise
Aspects of biodiversity that report on changes both increases in non-indigenous marine species and decreases (or increases) in abundance of particular taxa that result in change in threatened species classifications are also important metrics both for public consumption and for international reporting Elevation of these metrics to international reporting statistics will put higher priority on generation of this information and for integration of different New Zealand databases Public availability of government-funded datasets is mandated and Tier 1 reporting statistics can provide guidance on data format accessibility and quality control
8 KEYPOINTS FOR POLICYMAKERS
In general Tier 1 statistics should be of interest to the general public but also serve both an inward looking role for regional and national decision making and an outward role for international reporting and maintaining New Zealandrsquos reputation as a biodiverse and clean and green nation Most New Zealand citizens would be surprised to find out that New Zealand is the only OECD country that lacks regular national environmental reporting and the development of a marine biodiversity Tier 1 National Reporting statistics is one step toward providing consistent transparent reporting on our environment From a public perspective a Tier 1 Statistics also has the ability to assist the general public in understanding lsquowhat is marine biodiversityrsquo as well as why New Zealandrsquos marine biodiversity is internationally recognised for its high diversity and endemicity
Key management implications to support long-term cost-efficient generation of this statistic are in improved resourcing of New Zealand biodiversity databases and better integration across all New Zealand databases and data management portals within which they are stored and accessed For some metrics (eg threatened taxa) the change to a regular reporting schedule and synchronised reporting across different taxonomic groups will result in improved consistency among reporting standards and higher prioritisation of tasks to identify and report on threatened species trends Required for international reporting this will also contribute to New Zealandrsquos environmental reputation by resulting in fewer taxa which are labelled as either lsquonot assessedrsquo or lsquodata deficientrsquo
9 ACKNOWLEDGMENTS
This work was completed under Objective 1 of Ministry for Primary Industries project ZBD201201 We thank attendees of the December 2013 workshop and Mary Livingston (Ministry for Primary Industries) Debbie Freeman (Department of Conservation) Pierre Tellier (Ministry for the Environment) and David Harris (Statistics New Zealand) for further consultation during the course of
54 Tier 1 Marine Biodiversity Statistic Ministry for Primary Industries
the project We thank Judi Hewitt and Barb Hayden for consultation throughout the project We thank the Ministry for Primary Industries for thorough review of this report
10 REFERENCES
Adams NM (1972) The marine algae of the Wellington area Records of the Dominion Museum 8 43ndash98
Adams NM (1994) Seaweeds of New Zealand Canterbury University Press Christchurch New Zealand 360 p
Adams NM Conway E Norris RE (1974) The marine algae of Stewart Island Records of the Dominion Museum 8 185ndash245
Adams NM Nelson WA (1985) The marine algae of the Three Kings Islands National Museum of New Zealand Miscellaneous Series 13 1ndash29
Arnold A (2005) Shining a spotlight on the biodiversity of New Zealands marine ecoregion Experts workshop on marine biodiversity 27-28 May 2003 Wellington New Zealand World Wildlife Fund for Nature Wellington New Zealand 85 p
Baker CS Chilvers BL Constantine R du Fresne S Mattlin RH van Helden A Hitchmough R (2010) Conservation status of New Zealand marine mammals (suborders Cetacea and Pinnipedia) 2009 New Zealand Journal of Marine and Freshwater Research 44 101ndash115
Beaumont J Oliver M MacDiarmid A (2008) Mapping the values of New Zealands coastal waters 1 Environmental values Biosecurity New Zealand Technical Paper No 200816 73 p
Beaumont J Oliver M MacDiarmid A (2009) Mapping the values of New Zealands coastal waters 4 A meta-analysis of environmental values Biosecurity New Zealand Technical Paper No 201008 70 p
Booth J Nelson W Notman P (2006) NABIS Marine Plant Distributions Final Research Report for Ministry of Fisheries Research Project ZBD2004-05 Objective 1 NIWA April 2006 (Unpublished report held by Ministry for Primary Industries Wellington)
Broady PA Flint EA Nelson WA Cassie Cooper V de Winton MD Novis PM (2012) Phyla Chlorophyta and Charophyta green algae In Gordon DP (Ed) New Zealand Inventory of Biodiversity Volume Three Kingdoms Bacteria Protozoa Chromista Plantae Fungi Canterbury University Press pp 347ndash381
Broom JES Hart DR Farr TJ Nelson WA Neill KF Harvey AH Woelkerling WJ (2008) Utility of psbA and nSSU for phylogenetic reconstruction in the Corallinales based on New Zealand taxa Molecular Phylogenetics amp Evolution 46 958ndash973
Costello MJ Coll M Danovaro R Halpin P Ojaveer H Miloslavich P (2010) A Census of Marine Biodiversity Knowledge Resources and Future Challenges PLoS ONE 5(8) e12110 doi101371journalpone0012110
Dalen J Nelson WA (2013a) httpwwwtepapagovtnzSiteCollectionDocumentsTePapalist ofmarinemacroalgaeCHLOROPHYTApdf
Dalen J Nelson WA (2013b) httpwwwtepapagovtnzSiteCollectionDocumentsTePapalist ofmarinemacroalgaeOchrophytapdf
Dalen J Nelson WA (2013c) httpwwwtepapagovtnzSiteCollectionDocumentsTePapalist ofmarinemacroalgaeRhodophytapdf
Farr T Broom J Hart D Neill K Nelson W (2009) Common coralline algae of northern New Zealand an identification guide NIWA Information Series 70 249 p
Ministry for Primary Industries Tier 1 Marine Biodiversity Statistic 55
Freeman DJ Marshall BA Ahyong ST Wing SR Hitchmough RA (2010) Conservation status of New Zealand marine invertebrates 2009 New Zealand Journal of Marine and Freshwater Research 44 129ndash148
Gordon DP (ed) (2009) New Zealand inventory of biodiversity Volume 1 Kingdom Animalia Radiata Lopotrochozoa Deuteromstomia 648 p
Gordon DP (ed) (2010) New Zealand inventory of biodiversity Volume 2 Kingdom Animalia Chaetognatha Ecdysozoa Ichnofossils 528 p
Gordon DP (ed) (2012) New Zealand inventory of biodiversity Volume 3 Kingdoms Bacteria Protozoa Chromista Plantae Fungi 616 p
Gordon DP Beaumont J MacDiarmid A Robertson DA Ahyong ST (2010) Marine biodiversity of Aotearoa New Zealand PLoS ONE 5(8) e10905 Doi101371journalpone0010905
Harper M Cassie Cooper V Chang FH Nelson W Broady P (2012) Phylum Ochrophyta brown and golden-brown algae diatoms silicoflagellates and kin In Gordon DP (ed) New Zealand Inventory of Biodiversity Volume Three Kingdoms Bacteria Protozoa Chromista Plantae Fungi Canterbury University Press pp 114ndash163
Harvey A Woelkerling W Farr T Neill K Nelson W (2005) Coralline algae of central New Zealand an identification guide to common crustose species NIWA Information Series 57 145 p
Hay CH Adams NM Parsons MJ (1985) The marine algae of the subantarctic islands of New Zealand National Museum of New Zealand Miscellaneous Series 11 1ndash70
Heesch S Broom J Neill K Farr T Dalen J Nelson W (2007) Genetic diversity and possible origins of New Zealand populations of Ulva Final Research Report for Ministry of Fisheries Research Project ZBS2004-08 203 p (Unpublished report held by MPI Wellington)
Heesch S Broom JE Neill K Farr T Dalen J Nelson WA (2009) Ulva Umbraulva and Gemina genetic survey of New Zealand Ulvaceae reveals diversity and introduced species European Journal of Phycology 44 143ndash154
Hewitt JE Bell R Cummings V Currie K Ellis J Francis M Froude V Gorman R Hall J Inglis G MacDiarmid A Mills G Pinkerton M Schiel D Swales A Law C Smith M McBride G Thompson D Torres L Tuck I Wing S Wood B (2014) Development of a National Marine Environment Monitoring Programme (MEMP) New Zealand Aquatic Environment and Biodiversity Report No 141
Hitchmough R (2013) Summary of changes to the conservation status of taxa in the 2008ndash11 New Zealand threat classification system listing cycle New Zealand threat classification series 1 Department of Conservation Wellington 20 p
Hitchmough R Anderson P Barr B Monks J Lettink M Reardon J Tocher M Whitaker T (2013) Conservation status of New Zealand reptiles 2012 New Zealand threat classification series 2 Department of Conservation Wellington 16 p
Hitchmough RA Hoare JM Jamieson H Dewman D Tocher MD Anderson PJ Lettink M Whitaker AH (2010) Conservation status of New Zealand reptiles 2009 New Zealand Journal of Zoology 37 203ndash224
MacDiarmid A (editor) (2007) The Treasures of the Sea Ngā Taonga a Tangaroa A Summary of Biodiversity in the New Zealand Marine Ecoregion Wellington New Zealand WWF-New Zealand
MacDiarmid A Oliver M Beaumont J (2008) Environmental value mapping Supplementary information to MAF Biosecurity New Zealand Technical Paper No 200816 Biosecurity New Zealand Technical Paper No 200816 26 p
56 Tier 1 Marine Biodiversity Statistic Ministry for Primary Industries
Miskelly CM Dowding JE Elliott GP Hitchmough RA Powlesland RG Robertson HA Sagar PM Scofield RP Taylor GA (2008) Conservation status of New Zealand birds 2008 Notornis 55 117-135
Molloy J Bell B Clout M de Lange P Gibbs G Given D Norton D Smith N Stephens T (2002) Classifying species according to threat of extinction A system for New Zealand Threatened species occasional publication 22 Department of Conservation Wellington 26 p
Neale D Nelson W (1998) Marine algae of the west coast South Island New Zealand Tuhinga 10 87ndash118
Neill K DrsquoArchino R Farr T Nelson W (2012) Macroalgal diversity associated with soft sediment habitats in New Zealand New Zealand Aquatic Environment and Biodiversity Report 87 127 p
Nelson WA (2012) Phylum Rhodophyta red algae In Gordon DP (ed) New Zealand Inventory of Biodiversity Volume Three Kingdoms Bacteria Protozoa Chromista Plantae Fungi Canterbury University Press Pp 327ndash346
Nelson WA Adams NM (1984) Marine algae of the Kermadec Islands National Museum of New Zealand Miscellaneous Series 10 1ndash29
Nelson WA Adams NM (1987) Marine algae of the Bay of Islands area National Museum of New Zealand Miscellaneous Series 16 1ndash47
Nelson WA Adams NM Fox JM (1992) Marine algae of the northern South Island National Museum of New Zealand Miscellaneous Series 26 1ndash80
Nelson WA Adams NM Hay CH (1991) Marine algae of the Chatham Islands National Museum of New Zealand Miscellaneous Series 23 1ndash58
Nelson WA Dalen JL (in press) Marine macroalgae of the Kermadec Islands Bulletin of the Auckland Museum
Nelson WA Dalen J Neill KF (2013) Insights from natural history collections analysing the New Zealand macroalgal flora using herbarium data PhytoKeys 30 1ndash21
Nelson WA Villouta E Neill K Williams GC Adams NM Slivsgaard R (2002) Marine macroalgae of Fiordland Tuhinga 13 117ndash152
Pinkerton MH (2010) Headline indicators for the New Zealand ocean Research report for Coasts amp Oceans IO2 project NIWA Wellington 43 p
Robertson HA Dowding JE Elliott GP Hitchmough RA Miskelly CM OrsquoDonnell CFJ Powlesland RG Sagar PM Scofield RP Taylor GA (2013) Conservation status of New Zealand birds 2012 New Zealand threat classification series 4 Department of Conservation Wellington 22 p
South GR Adams NM (1976) Marine algae of the Kaikoura coast National Museum of New Zealand Miscellaneous Series 1 1ndash67
Statistics New Zealand 2007 Principles and protocols for producers of Tier 1 Statistics httpunstatsunorgunsddnssdocs-nqaftier1-principles-and-protocolspdf
Thiers B (2014 ndash continuously updated) Index herbariorum a global directory of public herbaria and associated staff New York Botanical Gardenrsquos Virtual Herbarium Available at httpsweetgumnybgorgih
Thrush SF Hewitt JE Lundquist C Townsend M Lohrer AM (2011) A strategy to assess trends in the ecological integrity of New Zealandrsquos marine ecosystems NIWA Client report No HAM2011-140 prepared for the Department of Conservation 58 p
Townsend AJ de Lange PJ Duffy CAJ Miskelly CM Molloy J Norton DA (2008) New Zealand threat classification system manual Department of Conservation Wellington 35 p
Ministry for Primary Industries Tier 1 Marine Biodiversity Statistic 57
Tuck ID Pinkerton MH Tracey DM Anderson OA Chiswell SM (2013) Ecosystem and environmental indicators for deepwater fisheries New Zealand Aquatic Environment and Biodiversity Report 127 p
58 Tier 1 Marine Biodiversity Statistic Ministry for Primary Industries
11 APPENDICES
List of datasets held within the OBIS South Western Pacific Node (httpiobisorg) Note that other international datasets have records within the New Zealand EEZ
Dataset name
Original Data Provider
Contact
Abstract
Geographic coverage
Temporal coverage
records
taxa
Dataset name
Original Data Provider
Contact
Abstract
Geographic coverage
Temporal coverage
records
taxa
Dataset name
Original Data Provider
Contact
Abstract
Geographic coverage
Temporal coverage
records
taxa
Dataset name
Citation
Original Data Provider
Contact
Abstract
Geographic coverage
Temporal coverage
records
International Polar Year and Census of Antarctic Marine Life subset (South Western Pacific OBIS)
NIWA
Kevin Mackay (kmackayniwaconz)
Biological data from the IPY-CAML voyage (TAN0802) by the RV Tangaroa The TAN0802 voyage departed from Wellington New Zealand on Jan 26th 2008 and returned to Wellington New Zealand on Mar 21st 2008 The survey was concentrated mainly on the Ross Sea and thee waters around Scott and the Balleny Islands Biological data was collected using a variety of gear including bottom trawls beam trawls epibenthic sleds Van Veen grabs and MOCNESS tows
Latitude -76833 to -66698 Longitude -17996 to 179989
2004 to 2008
7219
1285
Modern foraminifera in the New Zealand EEZ
NIWA
Kevin Mackay (kevinmackayniwaconz)
Biodiversity data of the modern foraminifera in the New Zealand EEZ sourced from Dr Bruce Hayward at Geomarine Research These data come from two projects (1) modern deep-sea (100-5000 m water depth) foraminifera and (2) a 7 year project (1991-1998) on the biodiversity and ecological distribution of modern brackish and shallow-water (0-100 m) foraminifera around New Zealand
Latitude -61767 to -294 Longitude -178818 to 179996
Could not be determined
16986
553
NIWA plankton
NIWA
Kevin Mackay (kevinmackayniwaconz)
Plankton (mainly zooplankton) observation data held at NIWA
Latitude -46273 to -3912 Longitude 1692 to 179168
1976 to 1993
4624
221
New Zealand Coralline Algae
Farr T Broom J Hart D Neill K Nelson W (2009) Common coralline algae of northern New Zealand an identification guide NIWA Information Series No 70
NIWA
Kevin Mackay (kmackayniwaconz)
Occurrence of New Zealands non-geniculate coralline flora This dataset is based on two identification guides published by NIWA and funded through the Ministry of Fisheries Biodiversity Programme in order to make information accessible to marine scientists and resource managers and to improve understanding of these algae
Latitude -5255 to -34418 Longitude 169183 to 178753
1916 to 2007
947
Ministry for Primary Industries Tier 1 Marine Biodiversity Statistic 59
taxa
Dataset name
Original Data Provider
Contact
Abstract
Geographic coverage
Temporal coverage
records
taxa
Dataset name
Original Data Provider
Contact
Abstract
Geographic coverage
Temporal coverage
records
taxa
Dataset name
Original Data Provider
Contact
Abstract
Geographic coverage
Temporal coverage
records
taxa
Dataset name
Original Data Provider
Contact
Abstract
Geographic coverage
Temporal coverage
records
Dataset name
Citation
Original Data Provider
Contact
Abstract
Geographic coverage
34
South Western Pacific Regional OBIS Data All Sea Bio Subset (South Western Pacific OBIS)
South Western Pacific OBIS
Steve Massey (smasseyniwaconz)
This is the All Sea Bio Subset of the Full OBIS Provider for NIWA For the Full dataset please refer to obismaster provider
Latitude -82375 to 5585 Longitude -180 to 180
1897 to 2005
41925
3488
South Western Pacific Regional OBIS Data Asteroid Subset (South Western Pacific OBIS)
South Western Pacific OBIS
Steve Massey (smasseyniwaconz)
This is the Asteroid Subset of the Full OBIS Provider for NIWA For the Full dataset please refer to obismaster provider
Latitude -5501 to -2522 Longitude -17999 to 180
1956 to 2003
2294
145
South Western Pacific Regional OBIS Data Bio Ross Subset (South Western Pacific OBIS)
South Western Pacific OBIS
Steve Massey (smasseyniwaconz)
This is the Ross Bio Subset of the Full OBIS Provider for NIWA For the Full dataset please refer to obismaster provider
Latitude -72343 to -65408 Longitude 160887 to 17332
2004 to 2004
1166
343
South Western Pacific Regional OBIS Data Bryozoan Subset (South Western Pacific OBIS)
South Western Pacific OBIS
Steve Massey (smasseyniwaconz)
This is the Bryozoan Subset of the Full OBIS Provider for NIWA
Latitude -53 to 33767 Longitude -179532 to 179668
1874 to 2003
6348
South Western Pacific Regional OBIS Data Habitat-forming Cold Water Corals Subset (South Western Pacific OBIS)
Tracey DM Rowden AA Mackay KA and Compton T 2011 Habitat-forming cold-water corals show affinity for seamounts in the New Zealand region Marine Ecology Progress Series Vol 430 1-22
South Western Pacific OBIS
Kevin Mackay (kmackayniwaconz)
This is the Habitat-forming Cold Water Corals Subset of the Full OBIS Provider for NIWA It contains field (observational) data from research surveys and fishing industry trawls conducted in waters around New Zealand
Latitude -56317 to -26715 Longitude -179991 to 180
60 Tier 1 Marine Biodiversity Statistic Ministry for Primary Industries
Temporal coverage
records
taxa
Dataset name
Original Data Provider
Abstract
Geographic coverage
Temporal coverage
records
taxa
Dataset name
Original Data Provider
Contact
Abstract
Geographic coverage
Temporal coverage
records
taxa
Dataset name
Citation
Original Data Provider
Contact
Abstract
Geographic coverage
Temporal coverage
records
taxa
1954 to 2009
631
5
South Western Pacific Regional OBIS Data Specify Subset (South Western Pacific OBIS)
South Western Pacific OBIS
This is the Specify Subset of the Full OBIS Provider for NIWA
Latitude -835 to 52033 Longitude -180808 to 180
1900 to 2006
14023
2371
South Western Pacific Regional OBIS Data provider for the NIWA Marine Biodata Information System (South Western Pacific OBIS)
South Western Pacific OBIS
Steve Massey (smasseyniwaconz)
This is the cut down provider for the NZOBIS provider As at November 2005 this is a work in progress - data is being compiled and added to the NIWA Marine Biodiversity Information System (MBIS - a data warehouse) The data will cover an area from Antarctica to Fiji Data so far available are primarily the results of a series of research trawl surveys carried out as part of New Zealands Ministry of Fisheries data collection to support fisheries management within the NZ Exclusive Economic Zone (EEZ) plus data from several decades of marine invertebrate research sampling in the NZ Exclusive Economic Zone
Latitude -54185 to 0041 Longitude -18095 to 179999
1961 to 2005
377927
437
Xanthichthys greenei a new species of triggerfish (Balistidae) from the Line Islands
Pyle R Earle J (2013) Xanthichthys greenei a new species of triggerfish (Balistidae) from the Line Islands Biodiversity Data Journal 1 e994 DOI 103897BDJ1e994
NIWA
Kevin Mackay (kmackayniwaconz)
Xanthichthys greenei n sp is described from six specimens 97-154 mm standard length (SL) collected from mesophotic coral ecosystems (90-100 m) at Kiritimati (Christmas Island) Line Islands part of the Republic of Kiribati in the Central Pacific Of the six species of Xanthichthys it is most similar to the Atlantic X ringens and the Indo-West Pacific X lineopunctatus sharing with these species the character of three pigmented cheek grooves It is distinctive in its low body scale row count (33-35 other Xanthichthys species with 39 or more) small size (maximum SL 154 mm other species over 225 mm) and color pattern of scattered dark spots sub-dorsally and no other spots or lines on body
Latitude 1888 to 2016 Longitude -157555 to -157486
2005 to 2005
5
1
Ministry for Primary Industries Tier 1 Marine Biodiversity Statistic 61

Requests for further copies should be directed to
Publications Logistics Officer Ministry for Primary Industries PO Box 2526 WELLINGTON 6140
Email brandmpigovtnz Telephone 0800 00 83 33 Facsimile 04-894 0300
This publication is also available on the Ministry for Primary Industries websites at httpwwwmpigovtnznews-resourcespublicationsaspx httpfsfishgovtnz go to Document libraryResearch reports
copy Crown Copyright - Ministry for Primary Industries
TABLE OF CONTENTS
EXECUTIVE SUMMARY 1
1 INTRODUCTION 211 Background for Tier 1 Marine Biodiversity Reporting 2
12 Linkages with other Tier 1 Statistics and Environmental Monitoring programmes 3
121 Other Tier 1 Statistics 3
122 Other Environmental Monitoring and Reporting programmes 4
2 METHODS 421 Tier 1 National Reporting Statistics Principles and Protocols 4
22 Relevance of proposed marine biodiversity metrics 6
23 Workshop outcomes 6
24 Available datasets 7
241 Ocean Biogeographic Information System (OBIS) 7
242 World Register of Marine Species (WoRMS) 8
243 Databases held by NIWA 8
244 Macroalgal collections and herbarium data in New Zealand 9
245 Other datasets considered 10
25 Dataset workflow 10
251 OBIS 10
252 SPECIFY 13
3 SPECIES RICHNESS 1431 Spatial scale of reporting 15
32 Datasets to be included 21
33 Temporal scale of reporting 27
34 Taxonomic resolution 28
35 Reporting of Records instead of Species 36
36 Summary recommendations Species Richness 47
4 State of Knowledge Index 4741 Summary recommendations State of Knowledge 48
5 Endemic species metric 4851 Summary recommendations Endemic species 49
6 Threatened species metric 4961 Threatened species summary statistic 52
7 DISCUSSION 54
8 KEYPOINTS FOR POLICYMAKERS 54
9 ACKNOWLEDGMENTS 54
10 REFERENCES 55
11 APPENDICES 59
EXECUTIVE SUMMARY
Lundquist CJ Julian K Costello M Gordon D Mackay K Mills S Neill K Nelson W Thompson D (2015) Development of a Tier 1 National Reporting Statistic for New Zealandrsquos Marine Biodiversity New Zealand Aquatic Environment and Biodiversity Report No 147 61 p
In October 2012 the New Zealand Government signed off on a range of new environmental Tier 1 Statistics to be implemented or developed for national reporting The list included the development of a new marine Tier 1 statistic ldquoMarine Biodiversityrdquo to report on the wellbeing and knowledge state of marine biodiversity in New Zealand waters Here we evaluate the utility and feasibility of developing the variables published by Costello et al (2010) and recommend marine biodiversity statistics for Tier 1 National reporting on the state of marine biodiversity in New Zealand
New Zealand has made an international commitment under the Convention on Biological Diversity to halt the current decline in indigenous biodiversity The New Zealand Biodiversity Strategy also contains an explicit commitment to address the paucity of knowledge of biodiversity resulting in better more widely used information Early in the evaluation of marine biodiversity statistics it became apparent that there was not sufficient spatial coverage or repeated temporal sampling for increases and declines in species richness to be reported across New Zealand waters However reporting on the state of progress was worthy of further exploration as new species records are documented and gaps in the spatial coverage of biodiversity information are addressed As such we focussed on the process of gathering data as a way of reporting progress on New Zealandrsquos commitment to generating knowledge of the biodiversity of its marine estate Tier 1 statistics also aim to provide information that will improve understanding (eg by managers and the general public) of the lsquophenomenonrsquo itself in this case lsquoWhat is marine biodiversityrsquo Variations on the proposed marine biodiversity metrics can fulfil these requirements For example a species richness metric allows for presentation of broad scale spatial patterns in marine biodiversity knowledge and information on taxonomic diversity in the New Zealand EEZ Reporting on non-indigenous marine species and threatened species can indicate trends in the health of New Zealandrsquos marine biodiversity Broad-scale monitoring programmes would be required to document national trends in the health or integrity of marine biodiversity at a regional or national scale and are expected to be incorporated into a separate Ecological Integrity Tier 1 statistic
We recommend the following components to form the core of a new Marine Biodiversity Statistic
1 Species richness Increases in species richness are likely to be reported as taxonomic and spatial knowledge increases over the foreseeable reporting cycles for this statistic Thus we suggest a focus on Spatial distribution of the number of records in OBIS and other high quality
national databases per 100 km x 100 km grid cell for the NZ EEZ Number of species described from the NZ EEZ reported across broad taxonomic
categories
2 State of knowledge Number of new species identified during reporting period Changes in spatial coverage of biodiversity information
3 Endemic species lsquoStaticrsquo proportion of endemic species as a matter of general interest no reporting
of trends in the proportion of endemic species Number of new non-native species recorded
4 Threatened species Number of threatened species and changes in the threat status across broad
taxonomic categories using the full range of threat categories Changes in the number of species assessed or classified as data deficient
Ministry for Primary Industries Tier 1 Marine Biodiversity Statistic 1
1 INTRODUCTION
11 Background for Tier 1 Marine Biodiversity Reporting
In October 2012 Government signed off on a range of new Tier 1 Statistics to be implemented or developed under the Natural Resources Sector The Ministry for Primary Industries agreed to lead the development of a new marine Tier 1 statistic ldquoMarine Biodiversityrdquo that is intended to report on the wellbeing and knowledge state of marine biodiversity in New Zealand waters New Zealand has made an international commitment under the Convention on Biological Diversity to halt the current decline in indigenous biodiversity The New Zealand Biodiversity Strategy also contains an explicit commitment to address the paucity of knowledge of biodiversity resulting in better more widely used information The Ministry for Primary Industries has responsibility to maintain associated and dependent species in addition to sustainable use of fish stocks in New Zealand waters Primary productivity and marine biodiversity underpin goods and services provided by the marine environment and form a key area of investigation under the Ministry for Primary Industries Biodiversity Research Programme Ecosystem integrity (an indicator of the health of biodiversity and ecosystems) is key to the Department of Conservationrsquos lsquoecological integrityrsquo strategy to assess the health of species and ecosystems (httpwwwdocgovtnzabout-docpolicies-and-plansmanaging-natural-heritagea-national-system-to-monitor-and-report-on-biodiversity)
The marine ecosystem is New Zealandrsquos most biodiverse ecosystem and is a global hotspot for marine biodiversity (Gordon et al 2010 MacDiarmid 2007 Arnold 2005) New Zealandrsquos EEZ is the fourth largest national EEZ comprising roughly 42 million km2 spanning 30 degrees of latitude and covering depths ranging from shallow coastal and estuarine ecosystems to deep trenches approximately 10 km in depth Over half of the EEZ is deeper than 2000 m with limited surveys to document biodiversity both in these deeper areas as well as in many shallower subregions (Gordon et al 2010) New Zealandrsquos marine fauna and flora have a high level of endemism (over 50) with 6740 of 12 820 described species classified as endemic to New Zealandrsquos waters (Gordon et al 2010) Rates of endemism are particularly high for some taxonomic groups such as sponges molluscs ascidians and bryozoans A further 4315 species are housed in national collections awaiting formal taxonomic descriptions (Gordon et al 2010) taxonomic experts conservatively estimate a further 17 220 species are undescribed in the New Zealand EEZ based on proportions already described in other well-known areas of the world (Gordon et al 2010) Others have estimated much higher numbers of undescribed species with a total of 65 000 known and undescribed species suggested in one review of New Zealandrsquos marine biodiversity (MacDiarmid 2007) Diversity estimates based on eight intensively studied taxonomic groups suggest that New Zealand species biodiversity is equivalent to the ERMS (European Register of Marine Species) region which covers an area 55 times larger than New Zealandrsquos EEZ (Gordon et al 2010 Costello et al 2010)
Previously researchers have developed models of spatial patterns in biodiversity at national scales for New Zealand Arnold (2005) reviewed hotspots of species richness across broad taxonomic categories based on a series of expert workshops for a World Wide Fund for Nature ndash New Zealand report on the marine environment with a particular focus on vertebrate taxa A more detailed report summarised patterns of species distribution in the New Zealand EEZ across a broad range of taxa (MacDiarmid 2007) Taxonomic resolution varied with higher resolution information available for many vertebrate taxa eg for seabirds information generally included species spatial distributions and seasonalbreeding distributions For most invertebrate taxa this report opted to summarise information to family order or other lower resolution taxonomic groupings as spatial distributions of abundance were generally not available at the species level for invertebrate taxa Species distributions were presented as hotspots and 90 and 100 confidence intervals of spatial distributions Spatial distribution maps are publicly available on NABIS (wwwnabisgovtnz) A further series of reports lsquoMapping the Values of New Zealandrsquos Coastal Watersrsquo included a detailed spatial mapping of environmental measures into coastal cells of roughly 20 km in length environmental measures included overall and taxon-specific patterns in biodiversity and distributions of threatened species non-indigenous species habitats (including both biogenic habitats and physical habitats as described
2 Tier 1 Marine Biodiversity Statistic Ministry for Primary Industries
using the Marine Environments Classification) areas of special biologicalecological significance areas of protection and primary productivity (Beaumont et al 2008 2009 MacDiarmid et al 2008)
At an international scale Costello et al (2010) provided regional and national comparisons of biodiversity in terms of species numbers (per unit area) knowledge state and threat status using datasets primarily from the Census of Marine Life (wwwcomlorg) Information was also presented by taxonomic groupings and to reflect proportions of endemic and alien species in each of 26 international regions as defined by the Census (Costello et al 2010)
National indicators of biodiversity and ecosystem health have been investigated in a number of recent studies Tuck et al (2013) suggested a suite of ecosystem and environmental indicators that could be used to monitor and analyse the ecosystem changes in deepwater fisheries areas Pinkerton (2010) summarised key potential indicators to describe pressures on marine environments the state of ocean ecosystems and management responses to promote sustainability Thrush et al (2011) investigated potential ecological indicators for evaluating trends in ecosystem integrity in New Zealandrsquos marine protected areas for the Department of Conservation providing a hierarchy of metrics that are being field tested for their suitability Other national projects (eg the Marine Environmental Monitoring Programme (Hewitt et al 2014)) and collaborative activities across the Natural Resources Sector will improve data management across government organisations to support Tier 1 Statistics
Here we investigate the feasibility of utilising the variables published by Costello et al (2010) to report on the status of marine biodiversity in New Zealand We investigate four potential metrics 1) species richness per square km 2) state of knowledge index 3) proportion of endemic species and 4) number of threatened species Metric suitability was evaluated based on data availability and quality for calculating statistics likelihood of showing change over reporting periods and compatibility with international reporting statistics and official Tier 1 National Reporting Statistics protocols and principles Development of the statistics involved a collaborative and consultative approach and two workshops were held with Natural Resources Sector agency staff and biodiversity scientists to ensure that the statistics were developed in a robust manner included best available information and were relevant to agency requirements for reporting on biodiversity
12 Linkages with other Tier 1 Statistics and Environmental Monitoring programmes
121 Other Tier 1 Statistics
Existing Tier 1 Statistics that relate to the Oceans include annual reporting on lsquoFish Stocksrsquo (lead agency Ministry for Primary Industries) and on lsquoMarine Protected Areasrsquo (lead agency Department of Conservation) The Fish Stocks statistic reports on the status of commercial fish stocks but provides no information on biodiversity status of fishing areas The lsquoMarine Protected Areasrsquo statistic provides reporting on area (and trends in area) covered by both Type 1 (no-take Marine Protected Areas) and Type 2 protection (other management tools that meet the protection standard) but does not provide quantitative information on the overall well-being of marine biodiversity in New Zealand Information is reported annually and includes total area in protection in each of 14 coastal biogeographic regions
Other Tier 1 Statistics in development include lsquoCoastal and Recreational Coastal Water Qualityrsquo (lead agency Ministry for the Environment) and lsquoEcological Integrity and Diversityrsquo (lead agency Department of Conservation) A concurrent project to develop the oceanic component of lsquoAtmosphere and Ocean Climate Changersquo (joint lead agencies Ministry for the Environment and Ministry for Primary Industries) will evaluate metrics of physical variables that potentially drive patterns and changes in biodiversity (eg sea surface temperature ocean acidification net primary production and sea surface height)
Ministry for Primary Industries Tier 1 Marine Biodiversity Statistic 3
122 Other Environmental Monitoring and Reporting programmes
The Marine Environmental Monitoring Programme has developed a meta-database of existing long-term monitoring datasets in New Zealand that could provide data to support Tier 1 Statistics (Hewitt et al 2014) The Marine Environmental Monitoring Programme has recommended a number of guidelines for monitoring data to be used in statistics 1) monitoring data should represent or contribute to more than one State of the Environment aspect such as biodiversity health resilience or integrity or provide information on threats to these aspects 2) taxa or habitats should be chosen based on their known response to climate change or other major stressors in appropriate locations 3) monitored taxa or habitats should have low temporal variability in the absence of environmental stressors 4) monitoring data should preferably already be monitored nationally andor internationally providing a baseline or comparative international information with which to evaluate change and 5) monitoring data should be able to be well measured cost-effectively (Hewitt et al 2014)
The Ministry for the Environment is currently updating its Environmental Monitoring Report A number of regional monitoring programmes and report cards of ecosystem health are reported on regularly by regional councils (eg the Auckland Council lsquoState of Aucklandrsquo Marine Report Card which includes reporting on water quality contaminants ecology and bathing beach water quality)
13 Strategic Relevance
Within the Statistics New Zealand Environmental Domain Plan for the Coastal and Marine Environment a marine biodiversity reporting statistic will contribute to our understanding of the following lsquoenduring questionrsquo ldquoHow is the quality and use of our marine environment changing and what is the impact of human activity including resource use on the marine environmentrdquo The marine biodiversity statistic will also facilitate and contribute to international reporting requirements on biodiversity to platforms and multilateral environmental agreements such as the Convention on Biological Diversity (CBD) and the International Science-Policy Platform on Biodiversity and Ecosystem Services (IPBES) Reporting on the status of threatened taxa is also required under international agreements
14 Project Objective
The project objectives were
1 To evaluate the utility and feasibility of developing the variables published by Costello et al (2010) as a Tier 1 statistic reporting on the state of marine biodiversity in New Zealand The four proposed measures were
Species richness per square km
State of knowledge index
Proportion of endemic species and
Number of threatened species
2 To host a collaborative and consultative workshop to introduce and discuss each potential marine biodiversity indicator for its usefulness as a Tier 1 statistic
2 METHODS
21 Tier 1 National Reporting Statistics Principles and Protocols
The principles and protocols of Tier 1 statistics are presented as guidelines to underpin the development of new national reporting statistics (Table 1 Statistics New Zealand 2007) In developing
4 Tier 1 Marine Biodiversity Statistic Ministry for Primary Industries
new statistics for marine biodiversity we focussed on a number of key principles while recognising that all principles and protocols must be adhered to for Tier 1 National Reporting Statistics Firstly we strove to ensure that the statistics were lsquorelevantrsquo to user requirements both through collaborative workshops with relevant agencies and prospective users and through evaluation of the key underlying questions that a marine biodiversity metric might address A number of questions are proposed by Statistics New Zealand in their Environment Domain Plan 2013 for the Coastal and Marine Environment Ideally a marine biodiversity statistic should be designed to demonstrate if change is occurring in the marine environment and what spatial and temporal trends exist for any changes that are occurring Further a marine biodiversity statistic should impart knowledge to the general public on the phenomena itself ie lsquowhat is marine biodiversityrsquo Quality particularly the quality of data used to prepare the official statistics was also of particular importance for this marine biodiversity statistic and is discussed below in our description of proposed datasets for calculating the statistic Accessibility as it relates to proposed datasets and their long-term availability and accessibility is another important requirement as was maximising the use of existing data sources The final important component to be considered was efficiency and minimising respondent load that is demonstrating that the chosen metrics are the most efficient and cost-effective way to calculate a marine biodiversity statistic that answers key questions about changes in the state of New Zealandrsquos marine biodiversity
Table 1 Principles and protocols underlying Tier 1 Statistics (httpwwwstatispheregovtnztier1-statisticsprinciples-protocolsaspx)
Topic Description
1 Relevance Official statistics produced by government agencies are relevant to current and prospective user requirements in government and in the wider community
2 Integrity Official statistics gain public trust by being produced and released using objective and transparent methods
3 Quality Official statistics are produced using sound statistical methodology relevant and reliable data sources and are appropriate for the purpose
4 Coherence The value of statistical data is maximised through the use of common frameworks standards and classifications
5 Accessibility Access to official statistics is equal and open
6 Efficiency Official statistics agencies strive to be efficient and provide value for money
7 Protecting respondent Respondentsrsquo rights to privacy and confidentiality are respected and their information information is stored securely
8 Minimising The costs of compliance are kept to an acceptable level and data is collected only respondent load when the expected benefits of a statistical survey exceed the imposition on
providers
9 Maximising existing Maximise the use and value of existing data by integrating or aligning available data sources statistics and administrative resources
10 International Official statistics agencies make use of and contribute to international statistical participation developments
Ministry for Primary Industries Tier 1 Marine Biodiversity Statistic 5
22 Relevance of proposed marine biodiversity metrics
A key aspect of Tier 1 statistics is whether the statistics are relevant to user requirements For marine biodiversity we interpret potential users of marine biodiversity statistics to be broad including management agencies which require marine biodiversity statistics for national and international reporting both on the state of knowledge of the marine estate and on trends in threatened species abundance Trends in the abundance of endemic marine species (or their non-indigenous counterparts) are also indicators of the wellbeing of marine biodiversity A primary user of Tier 1 statistics is also the general public as such a marine biodiversity statistic can be interpreted as relevant if it provides information that reports on aspects of what marine biodiversity is and what makes New Zealandrsquos marine biodiversity unique
Features of marine biodiversity such as our relatively high national biodiversity and the high levels of endemism for many taxonomic groups are key aspects to incorporate in this statistic Reporting on changes in the status of threatened and non-indigenous marine taxa is also of interest to the general public with both threatened and non-indigenous taxa receiving widespread public attention Finally the state of knowledge indicator is relevant to broad public interest in reports of new species found on New Zealand scientific expeditions and general acknowledgement of the value of the quest for increasing the knowledge of New Zealandrsquos marine estate Finally information on biodiversity can also contribute to the marine economy through documenting presence and distribution of potential resources that can be extracted from the oceans and providing a baseline for assessment of sustainable use As such we suggest that each of the proposed metrics (the number of species that have been found in New Zealand waters (species richness) state of knowledge endemic species and threatened species) is relevant and meaningful as a Tier 1 marine biodiversity statistic We further evaluate these statistics with respect to our current ability to measure these metrics and suggest variations in the proposed metrics that provide more direct reporting with respect to changes in our state of knowledge and of the wellbeing of marine biodiversity
23 Workshop outcomes
This project required a collaborative and consultative approach to ensure that the statistics were developed in a robust manner and were in accordance with official Tier 1 statistic guidelines An initial workshop was held on 17 December 2013 to further develop the proposed statistics with other agency staff and discuss linkages with other Tier 1 statistics and national environmental monitoring programmes Organisations represented at the meeting included NIWA University of Auckland Ministry for Primary Industries Department of Conservation and Ministry for the Environment NIWA presented preliminary investigations into the suitability of the Costello et al (2010) metrics for use for reporting on marine biodiversity in the New Zealand marine region A second workshop was held on 11 March 2014 and included representatives from Ministry for Primary Industries Department of Conservation Ministry for the Environment Statistics NZ Auckland Council and NIWA The objective of this second workshop was to discuss and recommend final reporting statistics and confirm that the statistics were consistent with the guidelines and protocols for Tier 1 reporting statistics and were consistent with objectives for use by various national agencies
Key workshop discussion items included
1) Ability to report on changes in species richness Early in the evaluation it became apparent that reporting on changes in species richness would not be possible due to present data limitations and lack of broad-scale monitoring programmes Instead we focussed on recording the process of gathering data as representing New Zealandrsquos commitment to knowledge of the biodiversity of its marine estate
2) Appropriate scale for reporting on spatial patterns in records of species occurrences Spatial representations of data availability at 1 km times 1 km 10 km times 10 km and 100 km times 100 km grid cells were presented and general agreement was that the 100 km times 100 km grid cells were most useful at presenting patterns in species richness whereas the smaller grid cells resulted in a
6 Tier 1 Marine Biodiversity Statistic Ministry for Primary Industries
majority of empty cells and made visual patterns difficult to interpret Presentation of all three scales was requested for the contract report as demonstration of this decision-making of appropriate scale for data summation
3) Temporal scale of reporting Some metrics (eg endemic proportion) are unlikely to change significantly between five yearly reporting intervals Rather reporting on the number of newly recorded invasive species would be more appropriate to illustrate this concept of changes in native species proportions This contract report will present options for reporting on changes in taxonomic composition (endemic invasive etc) as well as suggesting ways to report on changes in state of knowledge over five year intervals
4) Level of taxonomic reporting The consensus was that while it is anticipated that a broad list of taxonomic categories would be chosen for the national statistic in this report we will present three options of different resolution for taxonomic resolution
5) Data availability It was agreed that while a number of records are in the Ocean Biogeographic Information System (OBIS) many of the national marine biodiversity collections (eg NIWA invertebrates FishAtlas Te Papa datasets) are either not in OBIS or have not been recently updated in OBIS While databases should continue to be updated in future in OBIS the consensus of workshop participants was that the national statistic should include best available information and not solely OBIS data The project team has further investigated all known datasets and presents in this report summaries of which datasets were included based on adherence to the Tier 1 National reporting standards in Table 1
6) Data quality Concerns were raised about the quality of data in OBIS and other datasets (both issues of taxonomic expertise and accuracy of point locations) challenges with overlaps between datasets and challenges due to changing taxonomic information and how these changes would be incorporated into a national statistic For all datasets used caveats are presented in this contract report to address issues of data quality
7) Threat classification It is recognised that threat classification and availability of assessments vary strongly among taxa for example mammals and birds may have higher proportions of assessed taxa than for example marine invertebrates and macroalgae Consensus was reached that reporting on threatened taxa was still valuable for the reporting statistic with expectation that the reporting would also include the proportion of taxa assessed within a taxonomic grouping
24 Available datasets
241 Ocean Biogeographic Information System (OBIS)
OBIS publishes datasets on marine species distribution in space and time Datasets may be from field surveys (eg plankton fishery trawl benthic cores whale and bird observations) specimen collections and other taxonomic observations OBIS originated as part of the information management component of the Census of Marine Life and is now housed within the Intergovernmental Oceanographic Commission (IOC) of UNESCO under its International Oceanographic Data and Information Exchange (IODE) programme As of December 2013 over 377 million records had been uploaded into OBIS including approximately 145 000 species and downloaded from 1456 different international datasets or organisations (httpiobisorg) OBIS data include all groups of organisms that are associated with marine (including estuarine) habitats ie marine vertebrates (fish marine mammals marine reptiles etc) marine invertebrates marine bacteria and marine plants (phytoplankton macroalgae seagrass mangroves) OBIS preferably works through linkages with a number of regional nodes the South Western Pacific Node is hosted by NIWA and manages twelve regional databases (Appendix 1) Other international databases (ie not part of the South Western Pacific Node) also contribute species records within the New Zealand EEZ All data are open access and responsibility for data quality including updating records is the responsibility of the data collector (Box 1) Data include only species name as taxonomic identification all further taxonomic information is accessed via the World Register of Marine Species (WoRMS) database
Ministry for Primary Industries Tier 1 Marine Biodiversity Statistic 7
Box 1 OBIS information relating to Data Quality of OBIS data records
Quality control of OBIS data (based on httpiobisorg)
Data published through OBIS must come from credible authoritative sources The scientists and institutions responsible for collecting and managing the data are clearly named Before publication the data must pass through a series of technical controls described below and these are repeated every time the data may be accessed again from its source Any errors such as species name misspellings names not recognised in OBIS and possible mapping errors are reported to the data provider to review and if necessary correct Thus the next time the data are published they are more correct and the source database quality is also improved Data use is a very important way of finding actual and possible errors in data Users may contact the data source directly or OBIS with such issues
The OBIS Quality Control protocol is as follows 1 If the required data fields are not properly filled notification will be sent to the Data Provider No further action will be taken until the required fields are filled
2 If fields have questionable values notification will be sent to Data Provider These questionable values will be set as empty in the data published
3 Data located on land will be reported to the Data Provider but will not be deleted unless instructed by the Data Provider because they may represent a species in an estuary or the centre point of a location If a Data Provider changes the values new values will show up after the next round of data upload
4 If species names cannot be (a) verified against known valid names in OBIS or (b) to the OBIS taxonomic hierarchy or (c) the World Register of Marine Species (WoRMS) the Data Provider will be notified so they can check they are current and correct Names that cannot be placed after checking with WoRMS and OBIS are where possible placed on the basis of other authoritative sources such as the Catalogue of Life or the Integrated Taxonomic Information System (ITIS) Some non-verified names may be assigned a position in the taxonomic hierarchy by virtue of their genus
5 The portal staff will communicate with data providers to inform them of any problems and improve data quality They will check that the data conform to the metadata description of the dataset ie it should have the correct number of records and species in the right geographic locations After the data is transferred to the server from where it will be published online a form email will be sent to the technical person and manager specified detailing number of records obtained and missing records if applicable time of next accessing and any errors identified
242 World Register of Marine Species (WoRMS)
The World Register of Marine Species (WoRMS) is the authority for names of all marine species including synonyms and standardised higher classification While the New Zealand Organism Register (NZOR) is the national source for taxonomic nomenclature discussion by experts at the initial project workshop suggested that NZOR will soon have a direct electronic link with WoRMS for updating any New Zealand species names or taxonomy As such the expert taxonomists suggested that WoRMS be used as the primary source for taxonomy to support the marine biodiversity statistic as it is regularly updated and is international in scope The OBIS toolbox includes a function that links species records to their corresponding taxonomic authority in WoRMS for updating to the current taxonomy
243 Databases held by NIWA
NIWA holds a number of national (New Zealand government funded) biodiversity collection records that have not been uploaded to OBIS many of these databases are scheduled for upload to OBIS in 2014 SPECIFY includes electronic data corresponding to all samples held within the NIWA marine invertebrate collection An earlier iteration of the SPECIFY dataset (2006) has been uploaded to OBIS AllSeaBio also on OBIS was an early iteration of SPECIFY and does contain some overlap of information However AllSeaBio also includes a number of records that are not held within SPECIFY (ie records for which samples were not preserved and stored in the NIWA marine invertebrate
8 Tier 1 Marine Biodiversity Statistic Ministry for Primary Industries
museum) many of these are historical species records
Other national taxonomic datasets hosted by NIWA some of which have been uploaded to OBIS include sponges arthropods bryozoans cold water corals coralline algae and asteroids Revised versions of many of these datasets exist at NIWA and are in the process of being uploaded to OBIS There is some but not complete overlap between specific taxonomic databases and SPECIFY depending on how many records were retained in the NIWA invertebrate collections this overlap varies among taxonomic datasets
NIWA also hosts the Ministry for Primary Industries research trawl database and observer databases (also known as the Fish Communities Databases COD and TRAWL) Records from COD and TRAWL are included in SPECIFY for any taxa that are provided to the NIWA invertebrate collection for further taxonomic resolution The Fish Communities Database (fish_comm) has previously been uploaded to OBIS (database listed as South Western Pacific Regional OBIS Data provider for the NIWA Marine Biodata Information System) with an updated database in the process of uploading to OBIS in 2014 Fish_comm though including only fishes and squids contains a majority of the species records in the New Zealand EEZ
244 Macroalgal collections and herbarium data in New Zealand
The major New Zealand macroalgal collections are held in the herbaria of the Museum of New Zealand Te Papa Tongarewa (WELT) Landcare Research Manaaki Whenua (CHR) and at the Auckland Museum (AK) (Thiers 2014) The herbarium at Te Papa (WELT) is the only collection in New Zealand where there has been consistent expert taxonomic attention to the macroalgae over the past 50 years The WELT collections have been databased over a period of about 15 years The recent focus within the herbarium has been on improving collection data and checking the dataset for errors particularly grooming collection date data and mapping and verifying locality data Because WELT collections have received expert identification and curation they have been used as the primary source of data on the distributions of marine macroalgae for a number of research projects and government databases (eg Booth et al 2006) WELT is also where voucher specimens have been deposited (eg for the Marine Invasives Taxonomic Service contracted to NIWA by the Ministry for Primary Industries) Nelson et al (2013) summarised the history of the collections in WELT and used these collections to review the state of knowledge of the New Zealand macroalgal flora
Much of New Zealand macroalgal taxonomic and biogeographic literature is based on the WELT collections including Adams (1994) and a series of regional floral lists (Adams 1972 Adams et al 1974 South amp Adams 1976 Nelson amp Adams 1984 Adams amp Nelson 1985 Hay et al 1985 Nelson amp Adams 1987 Nelson et al 1991 Nelson et al 1992 Neale amp Nelson 1998 Nelson et al 2002 also Nelson amp Dalen in press) based on targeted collections In addition some specific projects have been undertaken to improve collections and knowledge of the flora (eg coralline algae Broom et al 2008 Harvey et al 2005 Farr et al 2009 macroalgae from soft sediment environments Neill et al 2012 Ulvaceae Heesch et al 2007 2009) In the absence of a complete flora there has been considerable recent effort directed to compiling and updating lists of currently accepted names and the taxonomic hierarchy with published lists produced as part of the Species 2000 project documenting the New Zealand biota (Broady et al 2012 Harper et al 2012 Nelson 2012) and also updated current lists provided on the Te Papa website (eg Dalen amp Nelson 2013 a-c)
As this macroalgal dataset showed consistent taxonomic attention long-term viability and accessibility and high data quality this dataset was recommended to be included in the calculation of a marine biodiversity statistic Permission to use the existing groomed macroalgae dataset was requested from Te Papa and the dataset was provided
Ministry for Primary Industries Tier 1 Marine Biodiversity Statistic 9
245 Other datasets considered
A number of datasets that were used for previous biodiversity exercises (eg Beaumont et al 2008) were explored for their potential to be included in the Marine Biodiversity statistic Data quality and taxonomic resolution varied among datasets with many datasets consisting of taxonomic groupings (eg foliose macroalgae) rather than species records or consisting of modelled data outputs (Beaumont et al 2008) For this statistic we determined that modelled data should not be included and that individual species records rather than assessments of percent cover of broad taxonomic groups are required for inclusion (though in some cases taxonomic resolution of individual species is available only to Family or Order) Another key consideration was the ease of access and whether cost was involved to acquire a dataset We opted to exclude datasets for which funds had previously been required for access Rather it is hoped that future funding to support the Marine Biodiversity Statistic will include funding to support upload of high quality datasets to OBIS so that in future they may be included in this statistic
We recognise a few high quality datasets that should be prioritised for any potential funding
A large high quality database of mollusc records is held by Te Papa but is not yet uploaded to OBIS As this dataset was previously only available for purchase (Beaumont et al 2008) we opted to rely on the substantial existing information in OBIS and NIWA datasets to represent molluscs
The Marine High Risk Site Surveillance database contains data on invasive species presence as recorded in annual port surveys within selected harbours in New Zealand These surveys are designed to detect establishment of a pre-determined list of high risk species in a limited number of ports which are the most likely point of entry for most NIMS taxa
The Ornithological Society of New Zealand holds a large dataset containing records from regular surveys of wading birds in New Zealand in 150 estuaries nationwide As this dataset was previously only available for purchase (Beaumont et al 2008) we opted to rely on the substantial existing information in OBIS datasets to represent wading birds
Various datasets are available on marine mammal sightings including from research surveys Department of Conservation surveys tourism records and commercial surveys The Department of Conservation is currently developing a national database and information protocol for these records and in future this information could be uploaded to OBIS
25 Dataset workflow
251 OBIS
All taxonomic records from OBIS were extracted from within the New Zealand EEZ including all historical data to 31 December 2013 A total of 527 441 OBIS records were extracted representing 10 974 individual species of these approximately 20 were from databases not held within the South Western Pacific node (ie not databases held in New Zealand) (Table 2)
For further processing the following New Zealand datasets were excluded from the OBIS dataset as updated versions existed as part of the current SPECIFY database though not yet uploaded to OBIS South Western Pacific Regional OBIS Data SPECIFY Subset (2006 version) South Western Pacific Regional OBIS Data Asteroid Subset and South Western Pacific Regional OBIS Data Habitat-forming Cold Water Corals Subset Other NIWA taxonomic subsets (eg Bryozoa) were determined to not yet be fully registered within SPECIFY and the potential for overlap was preferred rather than loss of a large proportion of taxonomic records for this group For comparisons of records between national datasets and other international datasets all data hosted by NIWA for the South Western
10 Tier 1 Marine Biodiversity Statistic Ministry for Primary Industries
Pacific OBIS node was classified as lsquoNew Zealandrsquo data all other international datasets available on OBIS were classified as lsquoOBISrsquo datasets
Table 2 OBIS databases with species records within the New Zealand EEZ Datasets in italics were replaced with updated datasets as available with NIWA
OBIS Dataset records
East London Museum 124
South African Institute for Aquatic Biodiversity - Fish Collection
iziko South African Museum - Fish Collection
13
1
iziko South African Museum - Marine Mammal Collection
iziko South African Museum - Shark Collection
4
100
Polycystine Radiolarians from the water column and the surface sediments of the World Ocean
ABBBS Bird Banding records from the Australian Antarctic Territory and Heard Island
ARGOS Satellite Tracking of animals
780
4
64
Inventory of Antarctic seabird breeding sites 4
National Whale and Dolphin Sightings and Strandings Database
Seabirds of the Southern and South Indian Ocean
27
147
Southern Ocean Continuous Zooplankton Recorder (SO-CPR) Survey
Australian Institute of Marine Science - Bioresources Library
BOLD Marine Invertebrate Data
643
9
14
BOLD Public Fish Data 12
SeamountsOnline (Seamount Biota) 1 275
TOPP Fish (TOPP) 10
ZooGene A DNA Sequence Database for Calanoid Copepods and Euphausiids
CeDAMar database for benthic biological sampling on the abyssal plains
ChEssBase
20
135
1
Cold water corals 847
Galathea II Danish Deep Sea Expedition 1950ndash52 476
PANGAEA - Data from Christian-Albrechts-University Kiel
PANGAEA - Data from Climate Long-range investigation mapping and prediction (CLIMAP)
PANGAEA - Data from Leibniz Institute of Marine Sciences
PANGAEA - Data from paleoenvironmental reconstructions from marine sediments AWI
PANGAEA - Data from the Deep Sea Drilling Project (DSDP)
PANGAEA - Data from the Ocean Drilling Program (ODP)
PANGAEA - Data from various sources
162
1
473
121
19 350
7 426
859
taxa
80
12
1
2
13
141
1
1
1
11
28
28
9
7
6
262
1
10
84
1
103
301
19
1
21
24
605
263
126
Provider name
AfrOBIS
AfrOBIS
AfrOBIS
AfrOBIS
AfrOBIS
Argentinean RON
Australian Antarctic Data Centre Australian Antarctic Data Centre Australian Antarctic Data Centre Australian Antarctic Data Centre Australian Antarctic Data Centre Australian Antarctic Data Centre Australian Institute of Marine Science BOLD
BOLD
CoML
CoML
CoML
EurOBIS
EurOBIS
EurOBIS
EurOBIS
EurOBIS
EurOBIS
EurOBIS
EurOBIS
EurOBIS
EurOBIS
EurOBIS
Ministry for Primary Industries Tier 1 Marine Biodiversity Statistic 11
OBIS Dataset
Senckenbergs collection management system
Coleccion de referencia de otolitos Instituto de Ciencias del Mar-CSIC
Fish specimens
Fishbase occurrences hosted by GBIF-Sweden
Ichtyologie
Hexacorallians of the World
MICROBIS database
World Ocean Database 2009
Marine Biological Sample Database JAMSTEC
BIOMASS 1980ndash1985
Cemetery Beach Port Hedland Flatback Tracking Project 20092010
Historical distribution of whales shown by logbook records 1785ndash1913
SMRU Elephant Seal Pup Tracking 1995ndash1996
Stranded spade-toothed beaked whales in New Zealand in 2010
TOPP Summary of SSM-derived Telemetry
Bishop Museum Data (OBIS distribution)
CephBase
Ocean Genome Resource
Australian Museum
MV Ichthyology
MV Marine Invertebrates
MV Ornithology
Amphipoda Hyperiidea of the Southern Ocean catalogue and occurrences
Antarctic Amphipod Crustaceans AntPhipoda Database (BIANZO)
Antarctic Isopods
Antarctic Marine Species Sequence Data
Biogeographic distribution of Antarctic and sub-Antarctic Cumacea
Biogeographic distribution of the Antarctic and Sub-Antarctic brachiopods (living forms)
Collections data on ecology of bottom animal of the Southern ocean
Nemertina World Checklist
SO-Polylist
SOMBASE BIOCONSTRUCTORS
SOMBASE PYCNOGONIDS
NMNH Invertebrate Zoology Collections
NMNH Vertebrate Zoology Fishes Collections
NIWA plankton
New Zealand Coralline Algae
South Western Pacific Regional OBIS Data All Sea Bio Subset
South Western Pacific Regional OBIS Data Asteroid
records
70
2
11
343
77
1 280
64 880
1 662
96
42
1
1 094
47
1
230
6
22
529
55
26
41
38
47
83
2
3
1
64
4
1
1
1 644
217
2 969
188
4 200
557
32 597
2 023
taxa
39
2
9
178
47
189
602
251
30
15
1
3
1
1
1
6
8
74
11
14
23
14
16
45
2
1
1
9
4
1
1
592
73
1 119
113
200
30
2 457
114
Provider name
EurOBIS
FishBase
FishBase
FishBase
FishBase
Hexacorals
ICoMM
NODC
OBIS Japan
OBIS-SEAMAP
OBIS-SEAMAP
OBIS-SEAMAP
OBIS-SEAMAP
OBIS-SEAMAP
OBIS-SEAMAP
OBIS-USA
OBIS-USA
OBIS-USA
OZCAM
OZCAM
OZCAM
OZCAM
SCAR-MarBIN
SCAR-MarBIN
SCAR-MarBIN
SCAR-MarBIN
SCAR-MarBIN
SCAR-MarBIN
SCAR-MarBIN
SCAR-MarBIN
SCAR-MarBIN
SCAR-MarBIN
SCAR-MarBIN
Smithsonian Institute
Smithsonian Institute
South Western Pacific OBIS South Western Pacific OBIS South Western Pacific OBIS South Western Pacific
12 Tier 1 Marine Biodiversity Statistic Ministry for Primary Industries
OBIS Dataset
Subset
South Western Pacific Regional OBIS Data Bryozoan Subset
South Western Pacific Regional OBIS Data Habitat-forming Cold Water Corals Subset
South Western Pacific Regional OBIS Data Specify Subset
South Western Pacific Regional OBIS Data provider for the NIWA Marine Biodata Information System
Catalogue of Squat Lobsters
Academy of Natural Sciences OBIS Mollusc Database
records
5 545
588
7 212
365 775
20
45
taxa
558
5
1 467
435
19
31
Provider name
OBIS
South Western Pacific OBIS South Western Pacific OBIS South Western Pacific OBIS South Western Pacific OBIS
SquatLobsters
The Academy of Natural Sciences
Total (all OBIS data records) 527 441 10 974 Total South Western Pacific OBIS (New Zealand) 418 497 5 266
OBIS data columns include 97 available information categories ranging from record identification spatial position species name collector information physical parameters at the collection location and temporal information Key information required for analyses for a marine biodiversity indicator included record ID latitude longitude date collected date last modified on OBIS species name and source of record A tool exists to convert species names to complete taxonomic information (Phylum Class Order hellip) that links OBIS with WoRMS but this tool is limited to small datasets (fewer than 2000 records at a time) Because over 500 000 records in OBIS required conversion conversion of OBIS species information using WoRMS was not completed in this project (Table 2) Instead data records were downloaded from OBIS for taxonomic subsets (eg Porifera Cnidaria) providing for higher levels taxonomic groupings within ArcGIS analyses This also got around issues within the OBIS dataset where taxa were not identified to species and instead taxonomic information was available only at higher taxonomic levels
252 SPECIFY
All taxonomic records from SPECIFY were extracted from within the New Zealand EEZ including all historical data to 31 December 2013 A total of 66 690 SPECIFY records were extracted representing 7556 individual species Thirty seven SPECIFY data columns were extracted providing information on record identification number latitude longitude taxonomic information date of collection date of identification and modification and collector information It was assumed that all taxonomic information was current with information available in WoRMS and NZOR due to quality control within the SPECIFY database Commercially sensitive records (ie records logged relating to particular commercial ventures such as phosphate mining or oil and gas exploration) were excluded from the data extraction In some cases records in SPECIFY are recorded as lsquolotsrsquo ie where a sample container included more than one species All multiple record lots in SPECIFY were separated prior to extraction into individual records representing individual species
253 Macroalgal datasets
Macroalgal records were extracted from the database of the Te Papa herbarium All New Zealand marine algal records current to December 2011 were exported into Excel spreadsheets In the absence of a published flora a current species names list and taxonomic hierarchy is maintained on the Te Papa website (httpwwwtepapagovtnz - Dalen and Nelson 2013a-c) Changes to current taxonomic names and classification have been drawn from primary literature and updated into Te Paparsquos database and the application of name changes to the collections has also been part of this effort The number of taxa includes all recognised entities present in the collections including some that have been
Ministry for Primary Industries Tier 1 Marine Biodiversity Statistic 13
recognised as distinct at a family genus or species level but are currently unnamed It is important to note that the publicly accessible flora lists (Dalen and Nelson 2013a-c) include only published names including some published tag names
not all published taxa are represented in the WELT collections and there are more taxa recognised as being distinct than have been published currently
The Green algae or Division Chlorophyta includes data for three classes Prasinophyceae Ulvophyceae and Trebouxiophyceae (There are no marine macroalgal Chlorophyceae represented in Te Paparsquos collections) The Brown algae or Ochrophyta include members of the classes Chrysomerophyceae Xanthophyceae and Phaeophyceae and the Red algae or Rhodophyta are represented by members of four classes Compsopogonophyceae Stylonematophyceae Bangiophyceae and Florideophyceae Eleven data columns were extracted providing information on record and taxonomic identification collection location and date and collector for each of 19 422 records representing a total of 1028 individual species
254 Geoprocessing
Records were provided in the geospatial datum WGS84 (World Geodetic System 1984) which is a standard projection and used by GPS (Global Positioning System) with which the sampling location of many species records are located All records (OBIS SPECIFY Te Papa) were provided in WGS84 projection and no conversions were required A total of 608 280 records were available from the combined OBIS SPECIFY and Te Papa datasets
ArcGIS standard geoprocessing tools were used to calculate sums of records within a custom grid beginning at the northwest corner of the NZ EEZ Grids were created for 1 km times 1 km grid cells 10 km times 10 km grid cells and 100 km times 100 km grid cells To calculate the number of species from the record database we used the Marine Geospatial Ecology Toolbox (MGET) MGET is a collection of free open source software tools that provide standard geoprocessing for marine ecology including tools to convert OBIS records to species richness (httpmgelenvdukeedumget)
Additional calculations were investigated that could allow for evaluation of sampling effort bias when determining patterns of species richness We investigated ES50 (estimated species in random 50 samples) Chao statistics (estimates species richness based on samples in spatial unit) and calculation of the number of phyla per grid cell as ways of evaluating sampling effort bias and completeness of the species record
However we determined that additional calculations using any of these tools were not cost-effective based on current knowledge of biodiversity and were unlikely to provide information not already available in plots of spatial patterns in species richness which demonstrate nearly identical spatial patterns in species richness as those in species records (see Section 3) The sampling bias is substantially skewed with the majority of 100 km times 100 km cells having fewer than 100 total records and few areas (coastal areas Chatham Rise) with high sampling effort (more than 1000 records) As such the more complex metrics that reduce sampling bias are unable to overcome the substantial bias in sampling effort and would show similar patterns to that of the number of records and the number of species In future should sampling effort resolve gaps in spatial knowledge these additional calculations would be worth exploring
3 SPECIES RICHNESS
Costello et al (2010) reported species richness for New Zealand as the combined number of species recorded per total area of the New Zealand EEZ The proportion of all species within each of fourteen major taxonomic groupings (eg Crustacea Mollusca) was also reported showing similarities across most bioregions in dominance of marine biodiversity by Crustacea Mollusca and Pisces (Costello et al 2010) The proposed reporting statistic for species richness would thus adapt the Costello et al
14 Tier 1 Marine Biodiversity Statistic Ministry for Primary Industries
(2010) statistic to report on the number of records per area at a sub-national scale ideally 1 km times 1 km
For the species richness reporting statistic we determined that this metric could provide information relating to two aspects of marine biodiversity What are national estimates of marine biodiversity in terms of the total number of species accumulated since records start across taxonomic groups
What are spatial trends in this national estimate of biodiversity
For the species richness metric we were unable to determine temporal trends in biodiversity at the broader NZ EEZ scale as records of species are given as presence only records (ie not including information on what is not found during a sampling event) Temporal trends in biodiversity would require structured repeated sampling of species diversity to determine whether increases or decreases in species richness were occurring In effect the available data for species richness at a national scale is contributing information on our state of knowledge of marine biodiversity but it cannot currently provide information on the status or trends in marine biodiversity
To determine optimal reporting of species richness we discuss recommendations for Spatial scale of reporting Datasets to be included Temporal scale of reporting Taxonomic resolution Reporting of Records vs Species
31 Spatial scale of reporting
While the proposed reporting metric was for species richness within 1 km times 1 km grid cells the availability of species records suggested that coarser resolution was required in order to adequately quantify and view species richness due to the sparsity of records throughout much of the EEZ (Figure 1) Comparisons between spatial scales (10 km times 10 km Figure 2 100 km times 100 km Figure 3) suggest that species records are too sparse for adequate reporting at a scale less than 100 km times 100 km
Even at the 100 km times 100 km scale roughly half (269 of 540 grid cells) had low numbers of species records (fewer than 50) and number of species (Figure 3 Figure 4 Table 3) however patterns of species richness in locations with high sampling effort (ie coastal cells Chatham Rise) were evident at this highest scale although these patterns are likely to be due primarily to sampling effort at this point in our understanding of New Zealandrsquos biodiversity Patterns were consistent between species records and species richness however because of the spatial bias in sampling effort it is premature at this stage to confirm that these patterns represent hotspots of biodiversity (Figure 3 Figure 4)
Comparisons between the number of species and the number of records in each cell indicate linear correlations between sampling effort and the number of species suggesting that species diversity information is not yet sufficient to reach asymptotic levels of species present for most taxa although it is likely that species richness is reaching an asymptote with increasing sampling effort for one better known group of ray-finned fishes (Actinypterygiae) (Table 3 Figure 5)
Ministry for Primary Industries Tier 1 Marine Biodiversity Statistic 15
Figure 1 Point locations of all records across all biodiversity databases
16 Tier 1 Marine Biodiversity Statistic Ministry for Primary Industries
Figure 2 Number of taxonomic records per grid cell from all databases at grid scale of 10 km times 10 km
Ministry for Primary Industries Tier 1 Marine Biodiversity Statistic 17
Figure 3 Number of taxonomic records per grid cell from all databases at grid scale of 100 km times 100 km
18 Tier 1 Marine Biodiversity Statistic Ministry for Primary Industries
Figure 4 Number of species recorded per grid cell from all databases at grid scale of 100 km times 100 km
Ministry for Primary Industries Tier 1 Marine Biodiversity Statistic 19
Table 3 Distribution of records and number of species from all databases across grid cells
Number Number of species Number of records
0 60 60
1 63 40
2 29 21
3 12 11
4 11 8
5 7 12
6ndash10 23 29
11ndash20 36 32
21ndash30 28 22
31ndash50 30 34
51ndash100 73 37
101ndash500 112 79
gt501ndash1000 48 49
gt1001ndash5000 8 61
gt5001ndash10000 0 34
gt10000 0 11
Total cells 540 540
Max value 1648 22986
20 Tier 1 Marine Biodiversity Statistic Ministry for Primary Industries
All taxa 1800
1600
1400s
1200
specie
1000
Numberof
800
600
400
200
0 0 5000 10000 15000 20000 25000
Number of records
Fish 180
160
140
120
100
80
60
40
20
0 0 5000 10000 15000 20000 25000
Number of records
Figure 5 Species richness (number of species recorded per grid cell) from all taxonomic records at grid scale of 100 km times 100 km versus number of records for all taxonomic groups (top) Actinypterygiae (ray-finned fishes) (bottom)
32 Datasets to be included
While the initial contract objectives suggested using datasets accessible using Census of Marine Life OBIS we recognised that a number of high quality national datasets either were not uploaded to OBIS or had updated versions held by NIWA or Te Papa that were planned for future upload Additional international datasets that may not be subject to the same quality control as New Zealand datasets (although see Box 1 for OBIS requirements for data quality) are available on OBIS while some national expert taxonomists were hesitant to include these datasets due to their uncertain quality plots of spatial distribution of records comparing New Zealand held datasets (including those held on OBIS) and other international datasets held on OBIS show differences in spatial coverage with other
Numberofspecies
Ministry for Primary Industries Tier 1 Marine Biodiversity Statistic 21
international OBIS datasets covering many regions of the EEZ that are not covered in New Zealand datasets (Figure 6 Figure 7)
International (non-New Zealand) OBIS records include approximately 20 of all species records in the New Zealand EEZ (Table 2) and most are described as being quality collections from other reputable national and international sources Patterns of species richness between New Zealand datasets and all international OBIS datasets were similar to those of number of records (Figure 8 Figure 9) As many New Zealand datasets are regularly updated and are planned for upload to OBIS it is assumed that future calculations of this statistic are likely to require only access of OBIS datasets making the data extraction process simpler In the meantime we opted to include both New Zealand and all other international datasets available on OBIS for the Tier 1 Marine Biodiversity calculations
22 Tier 1 Marine Biodiversity Statistic Ministry for Primary Industries
Figure 6 Number of taxonomic records per grid cell from OBIS taxonomic databases (omitting New Zealand records) at grid scale of 100 km times 100 km
Ministry for Primary Industries Tier 1 Marine Biodiversity Statistic 23
Figure 7 Number of taxonomic records per grid cell from New Zealand taxonomic databases at grid
scale of 100 km times 100 km
24 Tier 1 Marine Biodiversity Statistic Ministry for Primary Industries
Figure 8 Species richness (number of species recorded per grid cell) from OBIS taxonomic databases
(non-New Zealand records) at grid scale of 100 km times 100 km
Ministry for Primary Industries Tier 1 Marine Biodiversity Statistic 25
Figure 9 Species richness (number of species recorded per grid cell) from New Zealand taxonomic databases at grid scale of 100 km times 100 km
26 Tier 1 Marine Biodiversity Statistic Ministry for Primary Industries
33 Temporal scale of reporting
For a Tier 1 Marine Biodiversity statistic to be useful it must be able to show changes over the proposed scale of reporting in this case five yearly Again at this stage in our knowledge of marine biodiversity in New Zealand we are focussed on the process of gathering data as representing New Zealandrsquos commitment to knowledge of the biodiversity of its marine estate As such it is expected that for a number of five yearly reports only increases in our knowledge are likely ie it is impossible to get a decrease in biodiversity using either the number of records or the number of species as the data available are not designed to determine changes in species abundance or presenceabsence rather they are recording presence only records With increased focussed monitoring of the marine environmental realm it should be possible to incorporate changes in species diversity into this statistic at a later stage based on site-specific monitoring schemes
To investigate the likelihood of a five year reporting period being long enough to show differences in the species richness metric we investigated the number of records uploaded to OBIS (including some New Zealand datasets) to determine whether sufficient new records are provided over a roughly similar timeframe (eight yearly 2006ndash2013) (Table 4) The number of lsquonewrsquo records varied across taxa with particular groups (eg Bacteria Plantae) having large number of records uploaded in 2006ndash 2013 (Table 4) This pattern should be expected in the future for other groups (eg Bryozoa Mollusca Chordata (eg fish) when existing New Zealand datasets including some datasets previously not available on OBIS are revised and uploaded to OBIS with large instantaneous increases in the number of records for particular taxonomic groups
Table 4 Temporal distribution of records in OBIS comparing all records to more recently uploaded or modified records from 2006ndash2013
Taxonomic group No records on No records after 2005 of records uploaded OBIS Dec 2013 on OBIS Dec 2013 between 2006 and 2013
Kingdom Animalia 429 771 9 120 212 Annelida 7 327 60 082 Arthropoda 14 324 940 638 Brachiopoda 1 509 2 013 Bryozoa 8 121 2 002 Cephalorhynca 35 0 000 Chaetognatha 600 3 050 Chordata 354 109 7 134 201 Cnidaria 7 396 278 376 Ctenophora 36 0 000 Echinodermata 11 170 235 210 Echiura 20 0 000 Entoprocta 1 0 000 Hemichordata 16 0 000 Mollusca 23 199 413 178 Myxozoa 3 0 000 Nematoda 36 0 000 Nemertea 24 0 000 Phoronida 10 0 000 Plathyhelminthes 12 0 000 Porifera 1 254 60 478 Rotifera 24 0 000 Sipuncula 131 0 000
Domain Bacteria 64 812 64 811 9999 Kingdom Chromista 31 974 11 003 Kingdom Plantae 776 297 3827 Kingdom Protozoa 108 0 000
Ministry for Primary Industries Tier 1 Marine Biodiversity Statistic 27
34 Taxonomic resolution
The number of records and number of species differ substantially between taxonomic groups with many smaller phyla having few or no records in the New Zealand EEZ (Table 5 Table 6) Dominant taxonomic groups in terms of number of total records include in order of abundance of species records 1) Chordata (primarily fishes) 2) Bacteria 3) Chromista (brown algae and other Chromista) 4) Arthropoda 5) Mollusca 6) Echinodermata 7) Cnidaria 8) Plantae (primarily red and green algae) 9) Bryozoa 10) Annelida 11) Porifera and 12) Brachiopoda All other taxonomic groups had fewer than 1000 total records across all datasets (Table 5) In terms of number of species the proportional representation of taxonomic groups showed different rankings with Chordata and Bacteria both having the highest numbers of records but ranked much lower in terms of number of species The ranking for total number of species were 1) Arthropoda 2) Mollusca 3) Cnidaria 4) Chromista (brown algae and other Chromista) 5) Echinodermata 6) Porifera 7) Bryozoa 8) Chordata (primarily fishes) 9) Annelida 10) Plantae (primarily red and green algae) 11) Bacteria and 12) Brachiopoda
28 Tier 1 Marine Biodiversity Statistic Ministry for Primary Industries
Table 5 Taxonomic distribution of records used in Marine Biodiversity Tier 1 Statistic calculations comparing contributions of records between broad database sources
KINGDOM
Phylum Subphylum Class or Subclass
Order
Suborder
Common name
OBIS SPECIFY Te Papa
No Records
Total
ARCHAEA 0 0 0 0
BACTERIA Bacteria including cyanobacteria
64 812 0 0 64 812
FUNGI 0 0 0 0
PROTOZOA Dinoflagellates foraminifera
108 171 0 279
PLANTAE
Chlorophyta
Rhodophyta
Other
Green algae
Red algae
Other flowering plants (eg mangrove seagrass saltmarsh)
776
121
647
8
0 14 842
2 213
12 629
0
15 618
2 334
13 276
8
CHROMISTA
Ochrophyta
Other
Brown algae
Other Chromista
31 974
569
31 405
0 4 584
4 580
4
36 558
5 149
31 409
ANIMALIA
Acanthocephala
Annelida
Arthropoda Crustacea
Thorny-headed worms
Segmented worms
Crustaceans
0
7 327
14 324
0
3 050
16 997
0
10 377
31 321
Ministry for Primary Industries Tier 1 Marine Biodiversity Statistic 29
KINGDOM Order Common name No Records
Phylum Subphylum Class or Subclass Suborder OBIS SPECIFY Te Papa Total
Arthropoda Non-Crustacea Marine spiders and mites 401 363 764
Brachiopoda Lamp shells 1 509 1 819 3 328
Bryozoa Moss animals sea mats 8 121 2 729 10 850
Cephalorhyncha 35 0 35
Chaetognatha Arrow worms 600 12 612
Chordata Vertebrata Mammalia Cetacea Whales dolphins 1 128 1 128 porpoises
Chordata Vertebrata Mammalia Carnivora Sea lions seals 116 116
Chordata Vertebrata Aves Birds 462 462
Chordata Vertebrata Reptilia Reptiles 1 1
Chordata Vertebrata Myxini Cephala- Hagfish lampreys 55 55 spidomorphi
Chordata Vertebrata Chondrichthyes Sharks and rays 0 0
Chordata Vertebrata Actinopterygii Ray-finned fish 273 467 273 467
Chordata Cephalochordata Lancelets 5 19 24
Chordata Tunicata Sea tulips 723 665 1 388
Cnidaria Sea anemones corals 7 396 12 800 20 196 jellyfish
Ctenophora Comb jellies 36 3 39
Cycliophora Small parasite 0 0 0
Dicyemida Small parasite 0 0 0
Echinodermata Sea stars brittle stars sea 11 170 16 146 27 316 urchins sea cucumbers
Echiura Spoon worms 20 59 79
Entoprocta Goblet worms 1 3 4
Gastrotricha Meiofauna 0 0 0
Gnathostomulida Jaw worms 0 0 0
Hemichordata Acorn worms 16 14 30 pterobranchs
Kinorhyncha Mud dragons 12 11 23
30 Tier 1 Marine Biodiversity Statistic Ministry for Primary Industries
KINGDOM Order Common name No Records
Phylum Subphylum Class or Subclass Suborder OBIS SPECIFY Te Papa Total
Loricifera Brush heads 0 0 0
Micrognathozoa Newly described phylum 0 0 0 not yet registered in WoRMS
Mollusca Molluscs 23 199 6 064 29 263
Myxozoa Small parasite 3 0 3
Nematoda Round worms 36 78 114
Nematomorpha Horsehair worms 0 0 0
Nemertea Ribbon worms 24 144 168
Orthonectida Small parasite 0 0 0
Phoronida Horseshoe worms 10 6 16
Placozoa Plate animals 0 0 0
Platyhelminthes Flat worms 12 24 36
Porifera Sponges 1 254 7 103 8 357
Rotifera Rotifers 24 0 24
Sipuncula Peanut worms 131 229 360
Tardigrada Water bears 0 0 0
Ministry for Primary Industries Tier 1 Marine Biodiversity Statistic 31
Table 6 Taxonomic distribution of species used in Marine Biodiversity Tier 1 Statistic calculations comparing contributions of species between broad databasesources
KINGDOM
Phylum
Class
Subphylum Subclass
Order
Suborder
Common name
OBIS SPECIFY Te Papa
No Species
Total
ARCHAEA 0 0 0 0
BACTERIA Bacteria including cyanobacteria
603 0 0 603
FUNGI 0 0 0 0
PROTOZOA Dinoflagellates foraminifera
8 32 0 40
PLANTAE
Chlorophyta
Rhodophyta
Spermatophyta
Green algae
Red algae
Other flowering plants (eg mangrove seagrass saltmarsh)
81
10
66
5
0 798
119
679
874
127
742
5
CHROMISTA
Ochrophyta
Other
Brown algae
Other Chromista
1 553
137
1 416
0 230
230
1 646
333
1 416
ANIMALIA
Acanthocephala
Annelida
ArthropodaCrustacea
Thorny-headed worms
Segmented worms
Crustaceans
7 787
0
671
1 457
7 577
411
1 866
12 213
0
932
2 399
32 Tier 1 Marine Biodiversity Statistic Ministry for Primary Industries
KINGDOM Class Order Common name No Species
Arthropodaother Marine spiders and mites 103 81 125
Brachiopoda Lamp shells 46 52 80
Bryozoa Moss animals sea mats 920 815 1 279
Cephalorhyncha 7 0 7
Chaetognatha Arrow worms 23 1 23
Chordata Vertebrata Mammalia Cetacea Whales dolphins 21 21 porpoises
Chordata Vertebrata Mammalia Carnivora Sea lions seals 3 3
Chordata Vertebrata Aves Birds 44 44
Chordata Vertebrata Reptilia Reptiles 1 1
Chordata Vertebrata Myxini Cephala- Hagfish lampreys 3 3 spidomorphi
Chordata Vertebrata Chondrichthyes Sharks and rays 0 0
Chordata Vertebrata Actinopterygii Ray-finned fish 783 783
Chordata Cephalochordata Lancelets 2 4 3
Chordata Tunicata Sea tulips 132 111 205
Cnidaria Sea anemones corals 967 1 140 1 662 jellyfish
Ctenophora Comb jellies 2 1 2
Cycliophora Small parasite 0 0 0
Dicyemida Small parasite 0 0 0
Echinodermata Sea stars brittle stars sea 786 1 071 1 418 urchins sea cucumbers
Echiura Spoon worms 8 5 12
Entoprocta Goblet worms 1 1 1
Gastrotricha Meiofauna 0 0 0
Gnathostomulida Jaw worms 0 0 0
Hemichordata Acorn worms 4 5 6 pterobranchs
Kinorhyncha Mud dragons 5 5 7
Loricifera Brush heads 0 0 0
Ministry for Primary Industries Tier 1 Marine Biodiversity Statistic 33
KINGDOM Class Order Common name No Species
Micrognathozoa Newly described phylum 0 0 0 not yet registered in WoRMS
Mollusca Molluscs 1 150 910 1 721
Myxozoa Small parasite 3 1 0 3
Nematoda Round worms 9 38 38
Nematomorpha Horsehair worms 0 0 0
Nemertea Ribbon worms 12 9 15
Orthonectida Small parasite 0 0 0
Phoronida Horseshoe worms 2 3 4
Placozoa Plate animals 0 0 0
Platyhelminthes Flat worms 7 7 12
Porifera Sponges 441 1 039 1 326
Rotifera Rotifers 4 0 4
Sipuncula Peanut worms 73 1 74
Tardigrada Water bears 0 0 0
34 Tier 1 Marine Biodiversity Statistic Ministry for Primary Industries
In determining an appropriate way to report taxonomic differences in species richness that is suitable and informative for the general public as well as for managers and policy makers we present three variations of potential taxonomic groupings varying in resolution of lesser known groups (ie Echiura Sipuncula Phoronida) and of groups often of particular interest to the public and for international reporting agreements (ie Chordata seabirds marine mammals marine reptiles) (Table 7) Other biodiversity summaries have varied in taxonomic resolution from very low resolution (eg Costello et al 2010) to high resolution (eg Supplementary tables available in Gordon et al 2010) A medium resolution grouping allows presentation of categories that may be of interest to the general public and important for international reporting statistics while lumping the large number of smaller invertebrate phyla
Table 7 Potential groupings for taxonomic representation to be used in Marine Biodiversity Tier 1 Statistic
Low resolution Medium resolution Highest resolution KINGDOM Phylum (SubphylumClassSubClass OrderSubOrder)
ARCHAEA ARCHAEA ARCHAEA BACTERIA BACTERIA BACTERIA FUNGI FUNGI FUNGI PROTOZOA PROTOZOA PROTOZOA PLANTAE PLANTAE PLANTAE
Chlorophyta Chlorophyta Rhodophyta Rhodophyta Other Other
CHROMISTA CHROMISTA CHROMISTA Ochrophyta Ochrophyta Other Other
ANIMALIA ANIMALIA ANIMALIA Chordata (Vertebrata Other) Chordata (Mammalia) Chordata (Vertebrata Mammalia
Cetacea) Chordata (Vertebrata Mammalia Carnivora)
Chordata (Vertebrata Aves) Chordata (Vertebrata Aves) Chordata (Vertebrata Chordata (Vertebrata Reptilia) Reptilia)
Chordata (Vertebrata Chordata (Vertebrata Other) Chordata (Vertebrata Actinypterigiae) Actinypterigiae)
Chordata (Vertebrata Chondrichthyes and other fish classes)
Chordata (Other) Chordata (Other) Chordata (Cephalochordata) Chordata (Tunicata)
Annelida Annelida Annelida Arthropoda Arthropoda Arthropoda (Crustacea)
Arthropoda (Other) Bryozoa Bryozoa Bryozoa Cnidaria Cnidaria Cnidaria Echinodermata Echinodermata Echinodermata Mollusca Mollusca Mollusca Porifera Porifera Porifera Other invertebrate phyla Brachiopoda Brachiopoda
Platyhelminthes Platyhelminthes Other invertebrate phyla Acanthocephala
Cephalorhyncha Chaetognatha Ctenophora Cycliophora Dicyemida
Ministry for Primary Industries Tier 1 Marine Biodiversity Statistic 35
Low resolution Medium resolution Highest resolution KINGDOM Phylum (SubphylumClassSubClass OrderSubOrder)
Echiura Entoprocta Gastrotricha Gnathostomulida Hemichordata Kinorhyncha Loricifera Micrognathozoa Myxozoa Nematoda Nematomorpha Nemertea Orthonectida Phoronida Placozoa Rotifera Sipuncula Tardigrada
35 Reporting of Records instead of Species
In calculating spatial patterns in species richness the cost-effectiveness of developing metrics based on species records (ie immediately extracted from OBIS with minimal further manipulation required for geoprocessing to develop spatial patterns for the statistic) can be weighed against the substantial additional effort required to convert species records into spatial patterns of species richness using MGET or other complex geoprocessing algorithms Spatial patterns in species records and species richness are generally similar reflecting primarily patterns of sampling and taxonomic effort up to 2013 (Figure 3 Figure 4 Table 8) The similarities between spatial patterns based on records and species richness is consistent across taxa with plots of ray-finned fishes (Actinypterigiae) (Figure 10) Arthropoda (Figure 11) Annelida (Figure 12) Mollusca (Figure 13) Bryozoa (Figure 14) Chromista (Figure 15) and Plantae (Figure 16) all showing similar relative patterns of high middle low and empty cells This suggests that a statistic using the number of records can provide (at least at this point in our knowledge of marine biodiversity in the New Zealand EEZ) equivalent information to that of the more costly calculation of species richness
Using records instead of species also side-steps issues of changes in taxonomy As taxonomy is regularly evolving at levels from species to phyla (ie two phyla described in Gordon et al (2010) have been renamed) species records in OBIS and elsewhere are likely to be modified to reflect updated taxonomy Other challenges with some data records is that occasionally a taxonomic unit is only identified to higher taxonomic levels so a true species identity may not yet exist in OBIS or other databases for many records held in national collections As such the reports of higher numbers of species found from the combined OBISTe PapaNIWA datasets than reported as the number of described species for a particular taxonomic group is likely to be spurious for some groups (eg Porifera) that may be more likely to have species records not defined to genus and species It is expected that future revisions of this statistic will show more equitability between OBIS-derived measures of species richness to those estimated by Gordon et al (2010) and available from the New Zealand Inventory of Biodiversity (Gordon (2009) Gordon (2010) Gordon (2012))
It is still valuable to calculate the number of species described at a national level OBIS and other datasets do not include (as of 2013) the full complement of species described for the New Zealand EEZ and reported in Gordon et al (2010) (Table 8) Instead the number of records available to
36 Tier 1 Marine Biodiversity Statistic Ministry for Primary Industries
describe spatial patterns in species richness vary among taxonomic groupings (Table 8) Sampling effort as approximated by the records to species ratio also varies between groups with some taxonomic groups having substantially higher sampling effort relative to species described (eg fishes with about 348 times as many records as number of fish species) This is in contrast to even some relatively well described groups like Porifera and Bryozoa for which there are 6 and 8 records per species (on average) respectively (Table 8) Note that the distribution of records is not equivalent across species within a taxonomic group such that most species groups are represented by a smaller number of common species with more records and the majority of species are often rarer with only one or two records in the EEZ (eg macroalgae Nelson et al 2013)
Ministry for Primary Industries Tier 1 Marine Biodiversity Statistic 37
Table 8 Comparison of biodiversity information compiled by this report with the expert-derived estimates of marine biodiversity across taxonomic groups from Gordon et al (2010) supplementary information table revised to reflect updated taxonomy Note that there are more individual species recorded in OBIS than in Gordon et al ( in final column) this is likely to be due to records uploaded to OBIS but not identified to species level
No No Estd no No No No No Records Min no described undescribed undescribed endemic alien records species in per species not species in study study species in OBIS
BACTERIAARCHAEA 40 69 190 0 0 64 812 603 107
FUNGI 57 0 210 0 0 0 0 0 57
PROTOZOA 1 476 152 2 900 162 4 279 40 7 1 436
PLANTAE
Chlorophyta 142 0 90 36 0 2 334 127 18 15
Rhodophyta 419 101 150 189 12 13 276 742 18
Other 7 0 0 0 0 8 5 2 2
CHROMISTA
Ochrophyta 734 43 630 55 11 5 149 333 15 401
Other 83 0 25 1 0 31 409 1 416 22
ANIMALIA 0
Acanthocephala 24 5 50 1 0 0 0 0 24
Annelida 528 263 1 005 238 32 10 377 932 11
ArthropodaCrustacea 2 166 407 4 930 944 27 31 321 2 399 13
Arthropodaother 147 7 215 61 1 764 125 6 22
Brachiopoda 41 9 17 15 0 3 328 80 42
Bryozoa 622 331 295 581 24 10 850 1 279 8
Cephalorhyncha (prev Priapulida) 3 0 4 0 0 35 7 5
Chaetognatha 14 0 25 0 0 612 23 27
Chordata (VertebrataMammaliaCetacea) 41 0 0 1 0 1 128 21 54 20
Chordata (VertebrataMammaliaCarnivora) 8 0 0 1 0 116 3 39 5
Chordata (VertebrataAves) 122 2 0 41 0 462 44 11 78
Chordata (VertebrataReptilia) 6 0 0 0 0 1 1 1 5
Chordata (VertebrataAll fish classes) 1 313 74 762 242 6 273 522 786 348 527
Chordata (Cephalochordata) 1 0 0 1 0 24 3 8
38 Tier 1 Marine Biodiversity Statistic Ministry for Primary Industries
No No Estd no No No No No Records Min no described undescribed undescribed endemic alien records species in per species not species in study study species in OBIS
Chordata (Tunicata) 189 3 195 125 12 1 388 205 7
Cnidaria 794 322 630 258 23 20 196 1 662 12
Ctenophora 15 4 12 5 0 39 2 20 13
Cycliophora 0 0 0 0 0 0 0 0 0
Dicyemida 5 1 15 6 0 0 0 0 5
Echinodermata 557 66 45 237 0 27 316 1 418 19
Echiura 5 2 15 0 0 79 12 7
Entoprocta (prev Kamptozoa) 6 7 30 2 1 4 1 4 5
Gastrotricha 0 5 190 0 0 0 0 0 0
Gnathostomulida 2 10 12 4 0 0 0 0 2
Hemichordata 5 2 4 1 0 30 6 5
Kinorhyncha 6 39 30 6 0 23 7 3
Loricifera 0 4 10 2 0 0 0 0 0
Micrognathozoa 0 0 1 0 0 0 0 0 0
Mollusca 2 340 1 253 430 2 923 14 29 263 1 721 17 619
Myxozoa 0 0 0 0 0 3 1 3
Nematoda 155 52 1 430 25 0 114 47 2 108
Nematomorpha 1 0 0 1 0 0 0 0 1
Nemertea 28 26 350 28 0 168 15 11 13
Orthonectida 0 1 20 1 0 0 0 0 0
Phoronida 3 0 2 0 0 16 4 4
Placozoa 0 0 1 0 0 0 0 0 0
Platyhelminthes 229 95 1 810 91 2 36 12 3 217
Porifera 472 963 310 455 7 8 357 1 326 6
Rotifera 2 0 95 0 1 24 4 6
Sipuncula 26 0 10 2 0 360 74 5
Tardigrada 3 2 60 0 0 0 0 0 3
Xenacoelomorpha (prev Xenoturbellida) 0 0 0 0 0 0 0 0 0
Ministry for Primary Industries Tier 1 Marine Biodiversity Statistic 39
Figure 10 Demonstration of variation in spatial coverage between taxonomic groups Species richness of Actinypterigiae (bony fish) at grid scale of 100 km times 100 km across all datasets Left number of records Right number of individual species identified
40 Tier 1 Marine Biodiversity Statistic Ministry for Primary Industries
Figure 11 Demonstration of variation in spatial coverage between taxonomic groups Species richness of Arthropoda (primarily crustaceans) at grid scale of 100 km times 100 km across all datasets Left number of records Right number of individual species identified
Ministry for Primary Industries Tier 1 Marine Biodiversity Statistic 41
Figure 12 Demonstration of variation in spatial coverage between taxonomic groups Species richness of Annelida (primarily marine polychaetes) at grid scale of 100 km times 100 km across all datasets Left number of records Right number of individual species identified
42 Tier 1 Marine Biodiversity Statistic Ministry for Primary Industries
Figure 13 Demonstration of variation in spatial coverage between taxonomic groups Species richness of Mollusca (gastropods bivalves cephalopods) at grid scale of 100 km times 100 km across all datasets Left number of records Right number of individual species identified
Ministry for Primary Industries Tier 1 Marine Biodiversity Statistic 43
Figure 14 Demonstration of variation in spatial coverage between taxonomic groups Species richness of Bryozoa at grid scale of 100 km times 100 km across all datasets Left number of records Right number of individual species identified
44 Tier 1 Marine Biodiversity Statistic Ministry for Primary Industries
Figure 15 Demonstration of variation in spatial coverage between taxonomic groups Species richness of marine Chromista at grid scale of 100 km times 100 km across all datasets Left number of records Right number of individual species identified
Ministry for Primary Industries Tier 1 Marine Biodiversity Statistic 45
Figure 16 Demonstration of variation in spatial coverage between taxonomic groups Species richness of marine Plantae at a grid scale of 100 km times 100 km across all datasets Left number of records Right number of individual species identified
46 Tier 1 Marine Biodiversity Statistic Ministry for Primary Industries
36 Summary recommendations Species Richness
In summary reporting on species richness highlights a key factor relating to the development of a Tier 1 Marine Biodiversity Statistic our knowledge of marine biodiversity is low relative to other developed countries particularly in the ERMS (Europe) region where sampling has been undertaken for many more years As such any statistic relating to species richness is in reality a State of Knowledge index as changes in the spatial distribution and the number of taxa will initially represent increases in knowledge both in terms of increased sampling effort where gaps in spatial sampling coverage are currently evident and increased knowledge if additional sampling effort is focussed on the many under-represented groups in the marine biodiversity record particularly invertebrate groups Moreover data entering the databases is essentially for taxonomic purposes rather than monitoring and thus does not always include all species found in a sample ie if a species is not reported we do not know whether it is not there This complicates both qualitative and quantitative estimates of species richness Finally as there is no structured or coherent sampling design at present species richness can only increase there is no way of determining decreases over time
As our understanding of marine biodiversity increases we will be able to better assess hotspots of biodiversity and the features that they are associated with in the New Zealand EEZ Similarly with adequate knowledge of patterns in marine biodiversity we can better assess changes in species ranges decreases in abundance of common and rare taxa and other aspects that may reflect impacts of disturbances and climate change on marine biodiversity However it is more likely that changes in marine biodiversity would be better assessed from observed changes in directed monitoring across a number of locations while the information gleaned from OBIS and other taxonomic datasets would focus primarily on changes in our state of knowledge of marine biodiversity
From our initial assessment of available data to assess patterns in marine biodiversity we recommend a cost-effective statistic reporting on species richness should Have a spatial scale of reporting of 100 km times 100 km grid cells Include all datasets uploaded on OBIS Encourage (and provide funding for if necessary) data managers to regularly update New Zealand biodiversity datasets and upload them to OBIS including NIWA datasets Te Papa and other museum collections and other national datasets identified in this report Electronic linkages (currently being implemented) should be restored such that regular updates to OBIS from the South Western Pacific Node occur
Use WoRMS as the main source of taxonomic nomenclature and ensure that electronic linkages between NZOR and WoRMS are restored such that New Zealand based advances in taxonomy are included in the international taxonomic record
Have a temporal scale of reporting of five yearly Report number of species in total for the New Zealand EEZ to medium taxonomic resolution such that groups for which the public is familiar (eg vertebrates) have higher resolution and smaller uncommon phyla are combined
Report spatial patterns using the number of records extracted from OBIS as a proxy for patterns in species richness based on the number of individual species
Use gaps in spatial and taxonomic information to identify priorities for further sampling surveys in poorly studied regions and funding toward taxonomic training
Be considered as reporting on New Zealandrsquos commitment to advancing the nationrsquos knowledge of biodiversity rather than as an estimate of biodiversity per se
4 State of Knowledge Index
As discussed in Section 3 compilation of existing information on marine biodiversity in the New Zealand EEZ suggests that our biggest challenge is that of the poor state of knowledge both taxonomically and spatially Gordon et al (2010) estimated that only 31 of New Zealandrsquos marine biodiversity has been described quantifying a total of 17 135 known species including 4315 collected
Ministry for Primary Industries Tier 1 Marine Biodiversity Statistic 47
but as yet undescribed species and an estimated 17 220 (at minimum) further undescribed species In terms of our spatial understanding of marine biodiversity approximately 50 of cells had fewer than 50 biodiversity records and 38 of cells had 10 or fewer recorded species As such much of the increase in the state of knowledge will be revealed through increases in sampling effort in under-studied regions of the EEZ and efforts to reduce bias in taxonomic sampling and expertise and in formal taxonomic descriptions of lsquoknownrsquo undescribed species Plots of temporal (five yearly) subsets of the spatial distribution of new records can demonstrate increases in the state of the spatial knowledge of New Zealandrsquos marine biodiversity
Other biodiversity reviews have used expert-derived metrics to define the state of knowledge of marine biodiversity Data reported in Costello et al (2010) on the state of knowledge of marine biodiversity included metrics based on the number of taxonomic experts the age and number of identification guides and the percentage of taxa described summarised over broad national and international regions Gordon et al (2010) reported the metrics as in Costello et al (2010) and also included the number of collected and as yet not formally described species (labelled lsquoknown undescribedrsquo) in addition to an estimate of the number of undescribed taxa across phyla that have not yet been collected or described Outside of major museums and research institutes it will be potentially difficult in future to track down taxonomic experts and to track identification guides many of which are developed for amateur field identification by non-taxonomists
However the state of knowledge can be most adequately assessed by our knowledge of species biodiversity itself New species records can be found through reviews of peer-reviewed publications in key taxonomic literature including New Zealand local taxonomic journals which often include in their title lsquoNew record ofhelliprdquo For most taxa these new taxonomic records are uploaded to NZOR with data providers for marine taxa reported on the NZOR website (as at July 2012) to include
Marine algae data maintained by Tē Papa Digitised checklists from the New Zealand Inventory of Biodiversity Volumes 123 Edited by Dennis P Gordon (excluding plants and fungi)
State of knowledge is also relevant to the Threatened Species metric discussed in Section 6 Two categories within the New Zealand Threatened Species Classification (lsquonot assessedrsquo and lsquodata deficientrsquo) refer to taxa for which information has either not been compiled or is not yet available to determine whether a taxa is or is not threatened
41 Summary recommendations State of Knowledge
Report number of newly described species across taxonomic groups Report new species records in geographic context (as for methods for Species Richness but using a five yearly subset of recent data) as a measure of increased geographic knowledge
Use gaps in spatial and taxonomic information to identify priorities for further sampling surveys and decrease the number of areas that are poorly sampled
Use gaps in taxonomic information to identify priority databases to encourage upload to OBIS
5 Endemic species metric
Costello et al (2010) reported the number of endemic species across broad taxonomic categories (Plants Invertebrates Fish Other vertebrates) at a national scale New Zealandrsquos marine species have a high level of endemism with over 50 of described species reported as endemic to New Zealandrsquos EEZ (Costello et al 2010 Gordon et al 2010) While Gordon et al (2010) provides a starting point for estimates of the proportion of endemic species for higher resolution taxonomic groupings (Table 8) these proportions are unlikely to change in a significant way with new species described based on the small numbers of new taxa likely to be described on a five yearly basis relative to total species in most taxonomic groups As such statistics based on changes in the proportion of endemic species are unlikely to provide useful information on the status of New Zealandrsquos marine biodiversity However the static measure of endemicity is in itself an important aspect of New Zealandrsquos marine
48 Tier 1 Marine Biodiversity Statistic Ministry for Primary Industries
biodiversity and an important part of the conceptual understanding of the concept of biodiversity and one of the reasons that New Zealandrsquos marine (and terrestrial) fauna and flora is internationally known as a hotspot of biodiversity
While unlikely to individually result in a large change in the proportion of endemic species records of non-indigenous marine species (NIMS) and changes in their distribution are potentially useful indicators of the status of marine biodiversity as some NIMS are lsquoinvasive exoticsrsquo defined as those species that are present outside their natural distribution and have adverse impacts on native biodiversity It is assumed that reporting of the impacts of any NIMS taxa (ie resulting in decreases in native biodiversity) would be incorporated into the Tier 1 Ecological Integrity statistic which is proposed for reporting more directly on ecosystem health However basic information on the number of NIMS taxa is a useful metric to include to represent changes in biodiversity as related to endemicity of marine fauna and flora
Should NIMS be included as part of the Tier 1 marine biodiversity statistic this metric should include data on NIMS sourced from both OBIS and from the national Marine High Risk Site Surveillance (MHRSS) biosecurity database Data for MHRSS is held and managed by NIWA for the Ministry for Primary Industries (originally MAF Biosecurity) this database includes both transient (eg found on vessel hulls) and established NIMS taxa whereas only established NIMS taxa would be quantified for a Tier 1 marine biodiversity statistic 177 non-indigenous species were recorded as established in the New Zealand EEZ in 2010 (Gordon et al 2010) As of December 2013 a total of 334 recorded NIMS taxa had been discovered in New Zealand including many that were present only on vessel hulls Within OBIS records could be extracted for these NIMS taxa on a five yearly basis to determine whether there are changes in the spatial distribution of these taxa Using BIODS changes in the number of primary and secondary ports at which a NIMS are recorded could be used as an indicator of whether initiatives to reduce the influx of NIMS via ballast water and vessel hull cleaning initiatives are resulting in a reduction in transport of NIMS Similarly changes in the number of NIMS taxa could also be reported using information provided by Ministry for Primary Industries Biosecurity of any new NIMS taxa recorded within the five yearly update period or any new records on NIMS taxa recorded on NZOR or from the NIWA Marine Invasives Taxonomic Service (MITS)
51 Summary recommendations Endemic species
A statistic reporting on the proportion of endemic species is unlikely to demonstrate substantial change within a five year reporting period and is thus unlikely to be a useful indicator of changes in marine biodiversity Rather the presence and change in status of non-indigenous marine species (NIMS) would be a more useful indicator of changes in marine biodiversity as some NIMS taxa have negative impacts on native marine biodiversity If not overlapping the Ecological Integrity Tier 1 statistic or other national reporting programmes we recommend Report on the relatively static measure of the proportion of endemic species as an important aspect of New Zealandrsquos marine biodiversity
Do not report on changes in the proportion of endemic species Rather report on
o Change in spatial distribution of NIMS taxa o Changes in number of NIMS taxa recorded in the New Zealand EEZ
6 Threatened species metric
Costello et al (2010) reported on a ranked summary of the major threats to marine biodiversity at a national scale rather than on the number or presence of threatened species in the New Zealand EEZ Here we discuss a different metric that of the number of threatened species found in New Zealand and trends in their status
Ministry for Primary Industries Tier 1 Marine Biodiversity Statistic 49
The concept of lsquothreatened speciesrsquo has evolved out of threat classification systems that aim in part to quantify and identify those species most at risk from extinction Perhaps the most well-known of these systems is the International Union for Conservation of Naturersquos (IUCN) lsquoRed Listrsquo (see httpwwwiucnredlistorg) which takes a global view of risk from extinction Species are assessed against a set of quantitative criteria and assigned to one of several threat classifications with increasing risk of extinction ranging from lsquoLeast Concernrsquo and lsquoNear Threatenedrsquo to the three threatened classifications of lsquoVulnerablersquo lsquoEndangeredrsquo and lsquoCritically Endangeredrsquo and finally two further categories of lsquoExtinct in the Wildrsquo and lsquoExtinctrsquo To date (February 2014) the Red List has assessed over 71 500 taxa but with a strong bias towards vertebrates (over 37 000 taxa)
In New Zealand Molloy et al (2002) developed a threat classification system similar in many respects to the IUCNrsquos Red List which was later revised by Townsend et al (2008) Townsend et al (2008) noted that the New Zealand Threat Classification System (NZTCS) was intended to be complementary to the IUCNrsquos Red List but to be lsquofocussed at the national levelrsquo providing lsquoa more sensitive classification for taxa with naturally restricted distributions and small numbers as a result of insular rarityrsquo
The NZTCS comprises more categories compared to the Red List taxa are classified as lsquoIntroduced and Naturalisedrsquo native taxa are classified as lsquoMigrantrsquo lsquoVagrantrsquo or lsquoColoniserrsquo or lsquoResidentrsquo Those taxa that are both native and resident are classified as lsquoNot EvaluatedrsquorsquoData Deficientrsquo or lsquoEvaluatedrsquo lsquoEvaluatedlsquo taxa can be lsquoExtinctrsquo or lsquoNot Threatenedrsquo at which classification stops However lsquoAt Riskrsquo is further broken down to lsquoNaturally Uncommonrsquo lsquoRelictrsquo lsquoRecoveringrsquo and lsquoDecliningrsquo lsquoThreatenedrsquo is further broken down to lsquoNationally Vulnerablersquo Nationally Endangeredrsquo and lsquoNationally Criticalrsquo following the diagram below (Figure 17) adapted from Townsend et al (2008)
Biota in the wild in NZ
Native
Migrant
Vagrant
Coloniser
Resident
Not evaluated Data Deficient
Evaluated
Extinct
Threatened
Nationally Critical
Nationally Endangered
Nationally Vulnerable
At Risk
Declining
Recovering
Relict
Naturally Uncommon
Not Threatened
Introduced and Naturalised
Figure 17 Classification scheme underlying the New Zealand Threat Classification System (NZTCS) adapted from Townsend et al (2008)
The criteria used to determine which of these categories particular taxa are assigned to can be found in Townsend et al (2008) but for example a taxa classified as lsquoNationally Criticalrsquo would have either
50 Tier 1 Marine Biodiversity Statistic Ministry for Primary Industries
A a very small population A(1) fewer than 250 mature individuals A(2) no more than two sub-populations no more than 200 mature individuals in the larger sub-population A(3) Total area of occupancy no more than 1 ha
Or
B a small population with a high ongoing or predicted decline B(11) 250ndash1000 mature individuals predicted decline 50ndash70 B(21) no more than five sub-populations no more than 300 mature individuals in the largest sub-population predicted decline 50ndash70 B(31) Total area of occupancy no more than 10 ha predicted decline 50ndash70
Or
C a population (irrespective of size or number of sub-populations) with a very high ongoing or predicted decline of more than 70
The NZTCSrsquos long-term aim is to list all extant species by the threat of extinction Hitchmough (2013) lists 23 groups of taxa that have been reviewed to some extent additionally noting that algae freshwater invertebrates and marine fish had not been reviewed Taxonomic groups are assessed by a panel of experts It was suggested that each species group be assessed every three years although regular reporting has been inconsistent both within and between taxonomic groups Formal inclusion within a five yearly Tier 1 reporting statistic would provide both consistent funding and regularity of reporting across all taxonomic groups
A second concept lsquoprotected speciesrsquo is also used in New Zealand and includes most New Zealand seabirds marine mammals and marine reptiles nine fish including gropers sharks and rays and black corals stony corals hydrocorals and gorgonians These are generally taxa for which fishing or other human uses of the environment have the potential to reduce numbers through incidental capture habitat damage and modification or other direct or indirect effects The list of protected marine species in New Zealand includes taxa that have been assessed as threatened within the NZTCS but also many species that are not currently threatened Protected species are managed through the Fisheries Act 1996 (sections 8 9 and 15) the Marine Mammals Protection Act (1978) and the Wildlife Act (1953) A list of protected marine species is provided in Schedule 7A of the Wildlife Act with the most recent amendment to this list being in 2010 While outside the scope of a national reporting statistic this investigation highlights this disconnection between threatened and protected taxa better coordination of these lsquoconceptualrsquo listings is warranted for marine species with the suggestion that regular reporting cycles of Threatened species would lead to amendments to the Wildlife Act (1953) to add any new threatened species such that they receive the protections provided in this legislation
In the marine realm there have been reviews of marine mammals in 2009 (Baker et al 2010) seabirds as part of the birds reviews in 2008 (Miskelly et al 2008) and 2012 (Robertson et al 2013) marine reptiles as part of the reptiles reviews in 2009 (Hitchmough et al 2010) and 2012 (Hitchmough et al 2013) and marine invertebrates in 2009 (Freeman et al 2010) (Table 9) All New Zealand marine mammals seabirds and reptiles have been assessed (Baker et al 2010 Hitchmough et al 2013 Robertson et al 2013) but only 295 marine invertebrates were reviewed by Freeman et al (2010) (Table 9)
Although the coverage of marine taxa is currently very patchy and clearly biased towards the relatively large conspicuous taxa the NZTCS is both robust and valuable in terms of charting the long-term trends in conservation status of individual taxa and groups of taxa and also in terms of identifying taxa requiring specific conservation management Taken across the entire marine realm there are currently insufficient assessments across many taxonomic groups to justify the use of lsquonumber of threatened speciesrsquo as a Tier 1 statistic The challenge to assess every marine species as
Ministry for Primary Industries Tier 1 Marine Biodiversity Statistic 51
part of assessing all extant New Zealand taxa is truly daunting not least because there is simply insufficient reliable information on which to base an assessment for the vast majority of marine species ndash such taxa would be classified as lsquoData Deficientrsquo which would constitute the dominant classification Additionally it is difficult to see how the majority of marine taxa could be assessed in a timeframe of less than many decades without a substantial shift in resource allocation that would enable population sizes trends and distributions to be determined However theoretically and assuming that more taxonomic groups will be comprehensively assessed in the future the NZTCS and its concept of a lsquothreatened speciesrsquo could become a meaningful Tier 1 statistic for marine biodiversity perhaps restricting its use to well-defined species groups afforded comprehensive or near-comprehensive coverage
It is also worth noting that for the majority of marine taxa assessed to date which tend to be generally long-lived and slowly-reproducing species conservation status represents a relatively conservative statistic ndash the transition from one threat category to a lower threat category (ie an improvement in the conservation status of a particular taxa perhaps resulting in a reduction in the number of lsquothreatened speciesrsquo within a taxonomic group) would be likely to take many years perhaps even a few decades For such species the use of the number of threatened species as a useful Tier 1 statistic would only become valuable over similarly long timeframes
61 Threatened species summary statistic
We recommend for the threatened species metric that the number of threatened taxa in each threat category (both NZTCS and IUCN) is summarised for broad taxonomic groups (Marine mammals marine reptiles seabirds shorebirds marine fish marine invertebrates marine plants) including the proportion of each taxonomic group that have been assessed and the proportion of data deficient taxa (Table 9)
Five yearly reporting on this statistic should further include reporting on change in threat categories across taxonomic groups change in number of taxa evaluated change in number described as data deficient
52 Tier 1 Marine Biodiversity Statistic Ministry for Primary Industries
Table 9 Number of threatened marine taxa based on the New Zealand Threat Classification System
Taxonomic group Proportion or Extinct Data Nationally Nationally Nationally Declining Recovering Relict Naturally number assessed deficient critical endangered vulnerable uncommon
Marine mammals 100 (63) 13 5 3 Marine reptiles 100 (7) Seabirds 100 (145) 2 10 7 10 9 3 13 24 Shorebirds 100 (126) 13 1 7 3 6 4 3 4 Fish 218 37 2 52 Invertebrates 27 (307) 12 10 2 21 8 243 Algae 61 23 1 37
Taxonomic group Migrant Vagrant Coloniser Not Introduced and IUCN IUCN IUCN IUCN Critically threatened naturalised Combined Vulnerable Endangered Endangered
listings
Marine mammals 6 20 9 7 2 5 Marine reptiles 2 5 5 1 2 2 Seabirds 16 40 4 7 15 10 (9 Vagrant 1 5 (5 Vagrant)
Migrant) Shorebirds 7 65 2 10 1 1 1 (Vagrant) Fish 10 4 113 13 Invertebrates 11 Algae 2
Ministry for Primary Industries Tier 1 Marine Biodiversity Statistic 53
7 DISCUSSION
This preliminary investigation of marine biodiversity in New Zealand allows evaluation primarily of our current state of knowledge of marine biodiversity While more than 600 000 biodiversity records were available for this analysis it points out the bias in spatial coverage of our sampling of the marine environment with sampling coverage focussed on coastal areas and areas of particular interest for resource extraction (eg the Chatham Rise) This lack of information is in itself of interest for a publicly available statistic on New Zealandrsquos marine biodiversity in that it shows the public how much more there is to learn about our nationrsquos biodiversity Other aspects of New Zealandrsquos biodiversity such as high rates of endemism though unlikely to change are of interest to the general public in demonstrating why international experts consistently rank New Zealandrsquos waters as a hotspot for marine biodiversity
Statistical reporting on marine biodiversity at this early stage in the knowledge of our biodiversity can be used to prioritise areas for which we have poor information on biodiversity In addition some taxonomic groups are poorly covered in the biodiversity records in New Zealand and demonstration of this bias in spatial coverage can also be used to prioritise taxonomic expertise and training in areas for which there are gaps in New Zealandrsquos taxonomic expertise
Aspects of biodiversity that report on changes both increases in non-indigenous marine species and decreases (or increases) in abundance of particular taxa that result in change in threatened species classifications are also important metrics both for public consumption and for international reporting Elevation of these metrics to international reporting statistics will put higher priority on generation of this information and for integration of different New Zealand databases Public availability of government-funded datasets is mandated and Tier 1 reporting statistics can provide guidance on data format accessibility and quality control
8 KEYPOINTS FOR POLICYMAKERS
In general Tier 1 statistics should be of interest to the general public but also serve both an inward looking role for regional and national decision making and an outward role for international reporting and maintaining New Zealandrsquos reputation as a biodiverse and clean and green nation Most New Zealand citizens would be surprised to find out that New Zealand is the only OECD country that lacks regular national environmental reporting and the development of a marine biodiversity Tier 1 National Reporting statistics is one step toward providing consistent transparent reporting on our environment From a public perspective a Tier 1 Statistics also has the ability to assist the general public in understanding lsquowhat is marine biodiversityrsquo as well as why New Zealandrsquos marine biodiversity is internationally recognised for its high diversity and endemicity
Key management implications to support long-term cost-efficient generation of this statistic are in improved resourcing of New Zealand biodiversity databases and better integration across all New Zealand databases and data management portals within which they are stored and accessed For some metrics (eg threatened taxa) the change to a regular reporting schedule and synchronised reporting across different taxonomic groups will result in improved consistency among reporting standards and higher prioritisation of tasks to identify and report on threatened species trends Required for international reporting this will also contribute to New Zealandrsquos environmental reputation by resulting in fewer taxa which are labelled as either lsquonot assessedrsquo or lsquodata deficientrsquo
9 ACKNOWLEDGMENTS
This work was completed under Objective 1 of Ministry for Primary Industries project ZBD201201 We thank attendees of the December 2013 workshop and Mary Livingston (Ministry for Primary Industries) Debbie Freeman (Department of Conservation) Pierre Tellier (Ministry for the Environment) and David Harris (Statistics New Zealand) for further consultation during the course of
54 Tier 1 Marine Biodiversity Statistic Ministry for Primary Industries
the project We thank Judi Hewitt and Barb Hayden for consultation throughout the project We thank the Ministry for Primary Industries for thorough review of this report
10 REFERENCES
Adams NM (1972) The marine algae of the Wellington area Records of the Dominion Museum 8 43ndash98
Adams NM (1994) Seaweeds of New Zealand Canterbury University Press Christchurch New Zealand 360 p
Adams NM Conway E Norris RE (1974) The marine algae of Stewart Island Records of the Dominion Museum 8 185ndash245
Adams NM Nelson WA (1985) The marine algae of the Three Kings Islands National Museum of New Zealand Miscellaneous Series 13 1ndash29
Arnold A (2005) Shining a spotlight on the biodiversity of New Zealands marine ecoregion Experts workshop on marine biodiversity 27-28 May 2003 Wellington New Zealand World Wildlife Fund for Nature Wellington New Zealand 85 p
Baker CS Chilvers BL Constantine R du Fresne S Mattlin RH van Helden A Hitchmough R (2010) Conservation status of New Zealand marine mammals (suborders Cetacea and Pinnipedia) 2009 New Zealand Journal of Marine and Freshwater Research 44 101ndash115
Beaumont J Oliver M MacDiarmid A (2008) Mapping the values of New Zealands coastal waters 1 Environmental values Biosecurity New Zealand Technical Paper No 200816 73 p
Beaumont J Oliver M MacDiarmid A (2009) Mapping the values of New Zealands coastal waters 4 A meta-analysis of environmental values Biosecurity New Zealand Technical Paper No 201008 70 p
Booth J Nelson W Notman P (2006) NABIS Marine Plant Distributions Final Research Report for Ministry of Fisheries Research Project ZBD2004-05 Objective 1 NIWA April 2006 (Unpublished report held by Ministry for Primary Industries Wellington)
Broady PA Flint EA Nelson WA Cassie Cooper V de Winton MD Novis PM (2012) Phyla Chlorophyta and Charophyta green algae In Gordon DP (Ed) New Zealand Inventory of Biodiversity Volume Three Kingdoms Bacteria Protozoa Chromista Plantae Fungi Canterbury University Press pp 347ndash381
Broom JES Hart DR Farr TJ Nelson WA Neill KF Harvey AH Woelkerling WJ (2008) Utility of psbA and nSSU for phylogenetic reconstruction in the Corallinales based on New Zealand taxa Molecular Phylogenetics amp Evolution 46 958ndash973
Costello MJ Coll M Danovaro R Halpin P Ojaveer H Miloslavich P (2010) A Census of Marine Biodiversity Knowledge Resources and Future Challenges PLoS ONE 5(8) e12110 doi101371journalpone0012110
Dalen J Nelson WA (2013a) httpwwwtepapagovtnzSiteCollectionDocumentsTePapalist ofmarinemacroalgaeCHLOROPHYTApdf
Dalen J Nelson WA (2013b) httpwwwtepapagovtnzSiteCollectionDocumentsTePapalist ofmarinemacroalgaeOchrophytapdf
Dalen J Nelson WA (2013c) httpwwwtepapagovtnzSiteCollectionDocumentsTePapalist ofmarinemacroalgaeRhodophytapdf
Farr T Broom J Hart D Neill K Nelson W (2009) Common coralline algae of northern New Zealand an identification guide NIWA Information Series 70 249 p
Ministry for Primary Industries Tier 1 Marine Biodiversity Statistic 55
Freeman DJ Marshall BA Ahyong ST Wing SR Hitchmough RA (2010) Conservation status of New Zealand marine invertebrates 2009 New Zealand Journal of Marine and Freshwater Research 44 129ndash148
Gordon DP (ed) (2009) New Zealand inventory of biodiversity Volume 1 Kingdom Animalia Radiata Lopotrochozoa Deuteromstomia 648 p
Gordon DP (ed) (2010) New Zealand inventory of biodiversity Volume 2 Kingdom Animalia Chaetognatha Ecdysozoa Ichnofossils 528 p
Gordon DP (ed) (2012) New Zealand inventory of biodiversity Volume 3 Kingdoms Bacteria Protozoa Chromista Plantae Fungi 616 p
Gordon DP Beaumont J MacDiarmid A Robertson DA Ahyong ST (2010) Marine biodiversity of Aotearoa New Zealand PLoS ONE 5(8) e10905 Doi101371journalpone0010905
Harper M Cassie Cooper V Chang FH Nelson W Broady P (2012) Phylum Ochrophyta brown and golden-brown algae diatoms silicoflagellates and kin In Gordon DP (ed) New Zealand Inventory of Biodiversity Volume Three Kingdoms Bacteria Protozoa Chromista Plantae Fungi Canterbury University Press pp 114ndash163
Harvey A Woelkerling W Farr T Neill K Nelson W (2005) Coralline algae of central New Zealand an identification guide to common crustose species NIWA Information Series 57 145 p
Hay CH Adams NM Parsons MJ (1985) The marine algae of the subantarctic islands of New Zealand National Museum of New Zealand Miscellaneous Series 11 1ndash70
Heesch S Broom J Neill K Farr T Dalen J Nelson W (2007) Genetic diversity and possible origins of New Zealand populations of Ulva Final Research Report for Ministry of Fisheries Research Project ZBS2004-08 203 p (Unpublished report held by MPI Wellington)
Heesch S Broom JE Neill K Farr T Dalen J Nelson WA (2009) Ulva Umbraulva and Gemina genetic survey of New Zealand Ulvaceae reveals diversity and introduced species European Journal of Phycology 44 143ndash154
Hewitt JE Bell R Cummings V Currie K Ellis J Francis M Froude V Gorman R Hall J Inglis G MacDiarmid A Mills G Pinkerton M Schiel D Swales A Law C Smith M McBride G Thompson D Torres L Tuck I Wing S Wood B (2014) Development of a National Marine Environment Monitoring Programme (MEMP) New Zealand Aquatic Environment and Biodiversity Report No 141
Hitchmough R (2013) Summary of changes to the conservation status of taxa in the 2008ndash11 New Zealand threat classification system listing cycle New Zealand threat classification series 1 Department of Conservation Wellington 20 p
Hitchmough R Anderson P Barr B Monks J Lettink M Reardon J Tocher M Whitaker T (2013) Conservation status of New Zealand reptiles 2012 New Zealand threat classification series 2 Department of Conservation Wellington 16 p
Hitchmough RA Hoare JM Jamieson H Dewman D Tocher MD Anderson PJ Lettink M Whitaker AH (2010) Conservation status of New Zealand reptiles 2009 New Zealand Journal of Zoology 37 203ndash224
MacDiarmid A (editor) (2007) The Treasures of the Sea Ngā Taonga a Tangaroa A Summary of Biodiversity in the New Zealand Marine Ecoregion Wellington New Zealand WWF-New Zealand
MacDiarmid A Oliver M Beaumont J (2008) Environmental value mapping Supplementary information to MAF Biosecurity New Zealand Technical Paper No 200816 Biosecurity New Zealand Technical Paper No 200816 26 p
56 Tier 1 Marine Biodiversity Statistic Ministry for Primary Industries
Miskelly CM Dowding JE Elliott GP Hitchmough RA Powlesland RG Robertson HA Sagar PM Scofield RP Taylor GA (2008) Conservation status of New Zealand birds 2008 Notornis 55 117-135
Molloy J Bell B Clout M de Lange P Gibbs G Given D Norton D Smith N Stephens T (2002) Classifying species according to threat of extinction A system for New Zealand Threatened species occasional publication 22 Department of Conservation Wellington 26 p
Neale D Nelson W (1998) Marine algae of the west coast South Island New Zealand Tuhinga 10 87ndash118
Neill K DrsquoArchino R Farr T Nelson W (2012) Macroalgal diversity associated with soft sediment habitats in New Zealand New Zealand Aquatic Environment and Biodiversity Report 87 127 p
Nelson WA (2012) Phylum Rhodophyta red algae In Gordon DP (ed) New Zealand Inventory of Biodiversity Volume Three Kingdoms Bacteria Protozoa Chromista Plantae Fungi Canterbury University Press Pp 327ndash346
Nelson WA Adams NM (1984) Marine algae of the Kermadec Islands National Museum of New Zealand Miscellaneous Series 10 1ndash29
Nelson WA Adams NM (1987) Marine algae of the Bay of Islands area National Museum of New Zealand Miscellaneous Series 16 1ndash47
Nelson WA Adams NM Fox JM (1992) Marine algae of the northern South Island National Museum of New Zealand Miscellaneous Series 26 1ndash80
Nelson WA Adams NM Hay CH (1991) Marine algae of the Chatham Islands National Museum of New Zealand Miscellaneous Series 23 1ndash58
Nelson WA Dalen JL (in press) Marine macroalgae of the Kermadec Islands Bulletin of the Auckland Museum
Nelson WA Dalen J Neill KF (2013) Insights from natural history collections analysing the New Zealand macroalgal flora using herbarium data PhytoKeys 30 1ndash21
Nelson WA Villouta E Neill K Williams GC Adams NM Slivsgaard R (2002) Marine macroalgae of Fiordland Tuhinga 13 117ndash152
Pinkerton MH (2010) Headline indicators for the New Zealand ocean Research report for Coasts amp Oceans IO2 project NIWA Wellington 43 p
Robertson HA Dowding JE Elliott GP Hitchmough RA Miskelly CM OrsquoDonnell CFJ Powlesland RG Sagar PM Scofield RP Taylor GA (2013) Conservation status of New Zealand birds 2012 New Zealand threat classification series 4 Department of Conservation Wellington 22 p
South GR Adams NM (1976) Marine algae of the Kaikoura coast National Museum of New Zealand Miscellaneous Series 1 1ndash67
Statistics New Zealand 2007 Principles and protocols for producers of Tier 1 Statistics httpunstatsunorgunsddnssdocs-nqaftier1-principles-and-protocolspdf
Thiers B (2014 ndash continuously updated) Index herbariorum a global directory of public herbaria and associated staff New York Botanical Gardenrsquos Virtual Herbarium Available at httpsweetgumnybgorgih
Thrush SF Hewitt JE Lundquist C Townsend M Lohrer AM (2011) A strategy to assess trends in the ecological integrity of New Zealandrsquos marine ecosystems NIWA Client report No HAM2011-140 prepared for the Department of Conservation 58 p
Townsend AJ de Lange PJ Duffy CAJ Miskelly CM Molloy J Norton DA (2008) New Zealand threat classification system manual Department of Conservation Wellington 35 p
Ministry for Primary Industries Tier 1 Marine Biodiversity Statistic 57
Tuck ID Pinkerton MH Tracey DM Anderson OA Chiswell SM (2013) Ecosystem and environmental indicators for deepwater fisheries New Zealand Aquatic Environment and Biodiversity Report 127 p
58 Tier 1 Marine Biodiversity Statistic Ministry for Primary Industries
11 APPENDICES
List of datasets held within the OBIS South Western Pacific Node (httpiobisorg) Note that other international datasets have records within the New Zealand EEZ
Dataset name
Original Data Provider
Contact
Abstract
Geographic coverage
Temporal coverage
records
taxa
Dataset name
Original Data Provider
Contact
Abstract
Geographic coverage
Temporal coverage
records
taxa
Dataset name
Original Data Provider
Contact
Abstract
Geographic coverage
Temporal coverage
records
taxa
Dataset name
Citation
Original Data Provider
Contact
Abstract
Geographic coverage
Temporal coverage
records
International Polar Year and Census of Antarctic Marine Life subset (South Western Pacific OBIS)
NIWA
Kevin Mackay (kmackayniwaconz)
Biological data from the IPY-CAML voyage (TAN0802) by the RV Tangaroa The TAN0802 voyage departed from Wellington New Zealand on Jan 26th 2008 and returned to Wellington New Zealand on Mar 21st 2008 The survey was concentrated mainly on the Ross Sea and thee waters around Scott and the Balleny Islands Biological data was collected using a variety of gear including bottom trawls beam trawls epibenthic sleds Van Veen grabs and MOCNESS tows
Latitude -76833 to -66698 Longitude -17996 to 179989
2004 to 2008
7219
1285
Modern foraminifera in the New Zealand EEZ
NIWA
Kevin Mackay (kevinmackayniwaconz)
Biodiversity data of the modern foraminifera in the New Zealand EEZ sourced from Dr Bruce Hayward at Geomarine Research These data come from two projects (1) modern deep-sea (100-5000 m water depth) foraminifera and (2) a 7 year project (1991-1998) on the biodiversity and ecological distribution of modern brackish and shallow-water (0-100 m) foraminifera around New Zealand
Latitude -61767 to -294 Longitude -178818 to 179996
Could not be determined
16986
553
NIWA plankton
NIWA
Kevin Mackay (kevinmackayniwaconz)
Plankton (mainly zooplankton) observation data held at NIWA
Latitude -46273 to -3912 Longitude 1692 to 179168
1976 to 1993
4624
221
New Zealand Coralline Algae
Farr T Broom J Hart D Neill K Nelson W (2009) Common coralline algae of northern New Zealand an identification guide NIWA Information Series No 70
NIWA
Kevin Mackay (kmackayniwaconz)
Occurrence of New Zealands non-geniculate coralline flora This dataset is based on two identification guides published by NIWA and funded through the Ministry of Fisheries Biodiversity Programme in order to make information accessible to marine scientists and resource managers and to improve understanding of these algae
Latitude -5255 to -34418 Longitude 169183 to 178753
1916 to 2007
947
Ministry for Primary Industries Tier 1 Marine Biodiversity Statistic 59
taxa
Dataset name
Original Data Provider
Contact
Abstract
Geographic coverage
Temporal coverage
records
taxa
Dataset name
Original Data Provider
Contact
Abstract
Geographic coverage
Temporal coverage
records
taxa
Dataset name
Original Data Provider
Contact
Abstract
Geographic coverage
Temporal coverage
records
taxa
Dataset name
Original Data Provider
Contact
Abstract
Geographic coverage
Temporal coverage
records
Dataset name
Citation
Original Data Provider
Contact
Abstract
Geographic coverage
34
South Western Pacific Regional OBIS Data All Sea Bio Subset (South Western Pacific OBIS)
South Western Pacific OBIS
Steve Massey (smasseyniwaconz)
This is the All Sea Bio Subset of the Full OBIS Provider for NIWA For the Full dataset please refer to obismaster provider
Latitude -82375 to 5585 Longitude -180 to 180
1897 to 2005
41925
3488
South Western Pacific Regional OBIS Data Asteroid Subset (South Western Pacific OBIS)
South Western Pacific OBIS
Steve Massey (smasseyniwaconz)
This is the Asteroid Subset of the Full OBIS Provider for NIWA For the Full dataset please refer to obismaster provider
Latitude -5501 to -2522 Longitude -17999 to 180
1956 to 2003
2294
145
South Western Pacific Regional OBIS Data Bio Ross Subset (South Western Pacific OBIS)
South Western Pacific OBIS
Steve Massey (smasseyniwaconz)
This is the Ross Bio Subset of the Full OBIS Provider for NIWA For the Full dataset please refer to obismaster provider
Latitude -72343 to -65408 Longitude 160887 to 17332
2004 to 2004
1166
343
South Western Pacific Regional OBIS Data Bryozoan Subset (South Western Pacific OBIS)
South Western Pacific OBIS
Steve Massey (smasseyniwaconz)
This is the Bryozoan Subset of the Full OBIS Provider for NIWA
Latitude -53 to 33767 Longitude -179532 to 179668
1874 to 2003
6348
South Western Pacific Regional OBIS Data Habitat-forming Cold Water Corals Subset (South Western Pacific OBIS)
Tracey DM Rowden AA Mackay KA and Compton T 2011 Habitat-forming cold-water corals show affinity for seamounts in the New Zealand region Marine Ecology Progress Series Vol 430 1-22
South Western Pacific OBIS
Kevin Mackay (kmackayniwaconz)
This is the Habitat-forming Cold Water Corals Subset of the Full OBIS Provider for NIWA It contains field (observational) data from research surveys and fishing industry trawls conducted in waters around New Zealand
Latitude -56317 to -26715 Longitude -179991 to 180
60 Tier 1 Marine Biodiversity Statistic Ministry for Primary Industries
Temporal coverage
records
taxa
Dataset name
Original Data Provider
Abstract
Geographic coverage
Temporal coverage
records
taxa
Dataset name
Original Data Provider
Contact
Abstract
Geographic coverage
Temporal coverage
records
taxa
Dataset name
Citation
Original Data Provider
Contact
Abstract
Geographic coverage
Temporal coverage
records
taxa
1954 to 2009
631
5
South Western Pacific Regional OBIS Data Specify Subset (South Western Pacific OBIS)
South Western Pacific OBIS
This is the Specify Subset of the Full OBIS Provider for NIWA
Latitude -835 to 52033 Longitude -180808 to 180
1900 to 2006
14023
2371
South Western Pacific Regional OBIS Data provider for the NIWA Marine Biodata Information System (South Western Pacific OBIS)
South Western Pacific OBIS
Steve Massey (smasseyniwaconz)
This is the cut down provider for the NZOBIS provider As at November 2005 this is a work in progress - data is being compiled and added to the NIWA Marine Biodiversity Information System (MBIS - a data warehouse) The data will cover an area from Antarctica to Fiji Data so far available are primarily the results of a series of research trawl surveys carried out as part of New Zealands Ministry of Fisheries data collection to support fisheries management within the NZ Exclusive Economic Zone (EEZ) plus data from several decades of marine invertebrate research sampling in the NZ Exclusive Economic Zone
Latitude -54185 to 0041 Longitude -18095 to 179999
1961 to 2005
377927
437
Xanthichthys greenei a new species of triggerfish (Balistidae) from the Line Islands
Pyle R Earle J (2013) Xanthichthys greenei a new species of triggerfish (Balistidae) from the Line Islands Biodiversity Data Journal 1 e994 DOI 103897BDJ1e994
NIWA
Kevin Mackay (kmackayniwaconz)
Xanthichthys greenei n sp is described from six specimens 97-154 mm standard length (SL) collected from mesophotic coral ecosystems (90-100 m) at Kiritimati (Christmas Island) Line Islands part of the Republic of Kiribati in the Central Pacific Of the six species of Xanthichthys it is most similar to the Atlantic X ringens and the Indo-West Pacific X lineopunctatus sharing with these species the character of three pigmented cheek grooves It is distinctive in its low body scale row count (33-35 other Xanthichthys species with 39 or more) small size (maximum SL 154 mm other species over 225 mm) and color pattern of scattered dark spots sub-dorsally and no other spots or lines on body
Latitude 1888 to 2016 Longitude -157555 to -157486
2005 to 2005
5
1
Ministry for Primary Industries Tier 1 Marine Biodiversity Statistic 61
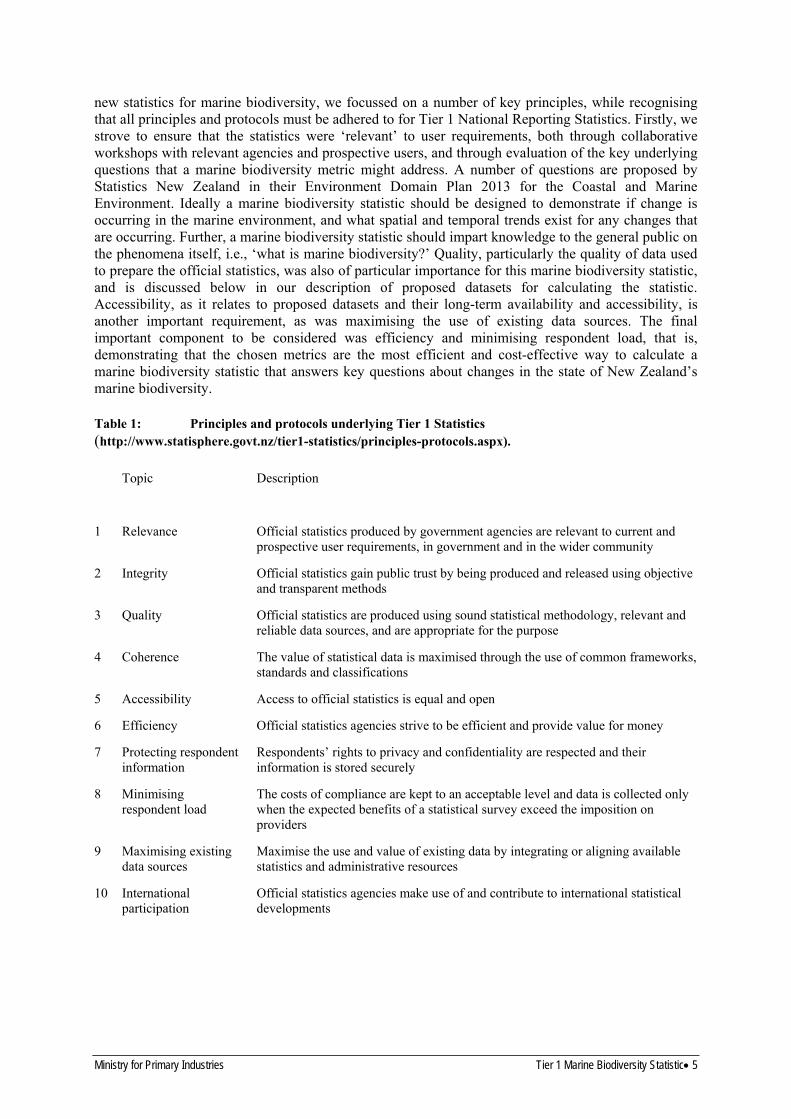
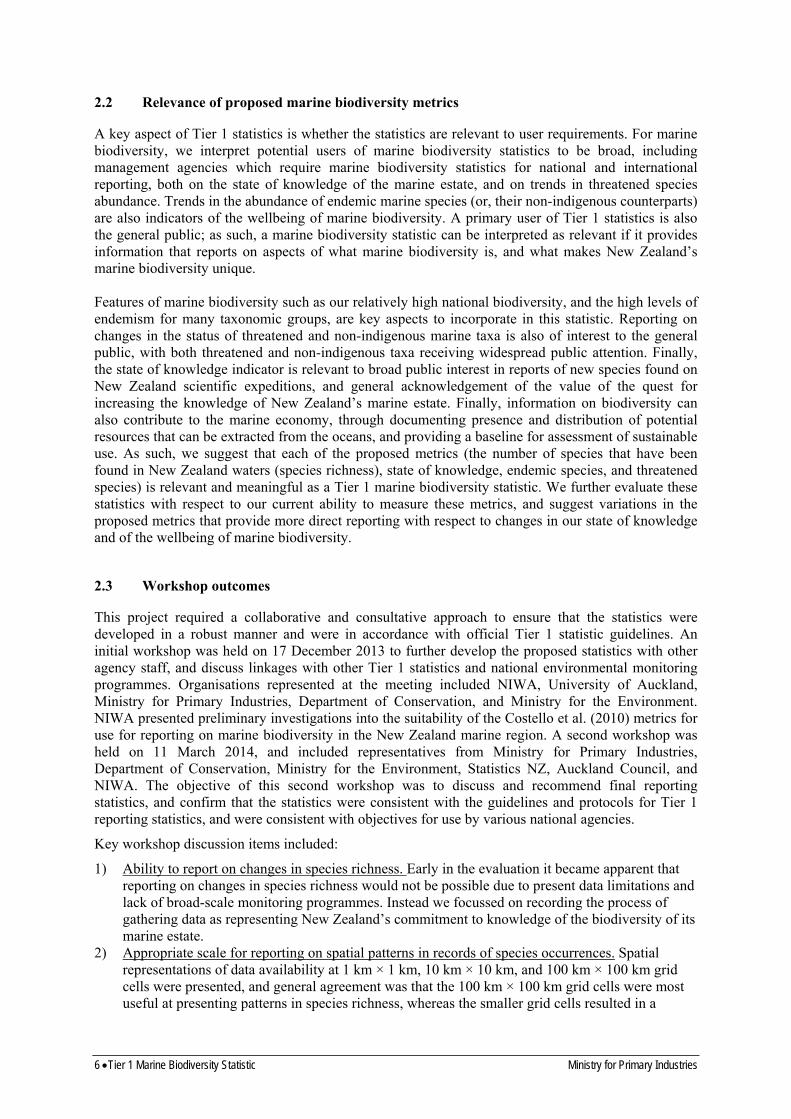
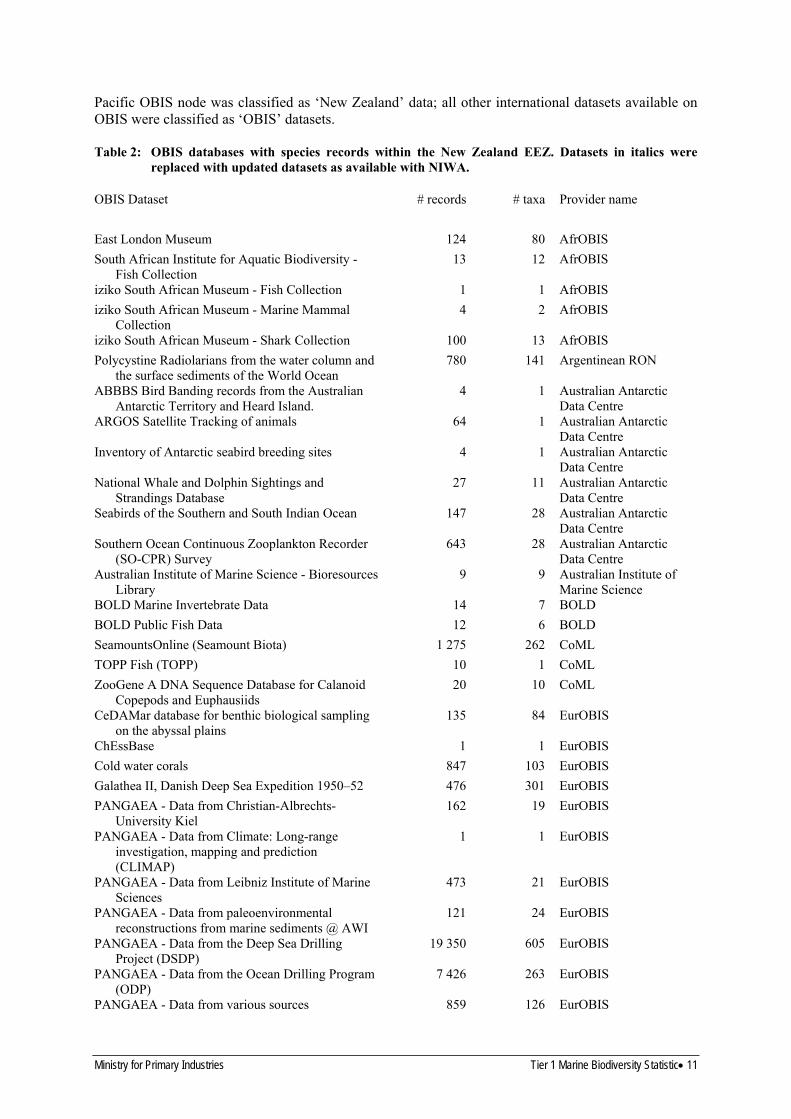

OBIS Dataset
Senckenbergs collection management system
Coleccion de referencia de otolitos Instituto de Ciencias del Mar-CSIC
Fish specimens
Fishbase occurrences hosted by GBIF-Sweden
Ichtyologie
Hexacorallians of the World
MICROBIS database
World Ocean Database 2009
Marine Biological Sample Database JAMSTEC
BIOMASS 1980ndash1985
Cemetery Beach Port Hedland Flatback Tracking Project 20092010
Historical distribution of whales shown by logbook records 1785ndash1913
SMRU Elephant Seal Pup Tracking 1995ndash1996
Stranded spade-toothed beaked whales in New Zealand in 2010
TOPP Summary of SSM-derived Telemetry
Bishop Museum Data (OBIS distribution)
CephBase
Ocean Genome Resource
Australian Museum
MV Ichthyology
MV Marine Invertebrates
MV Ornithology
Amphipoda Hyperiidea of the Southern Ocean catalogue and occurrences
Antarctic Amphipod Crustaceans AntPhipoda Database (BIANZO)
Antarctic Isopods
Antarctic Marine Species Sequence Data
Biogeographic distribution of Antarctic and sub-Antarctic Cumacea
Biogeographic distribution of the Antarctic and Sub-Antarctic brachiopods (living forms)
Collections data on ecology of bottom animal of the Southern ocean
Nemertina World Checklist
SO-Polylist
SOMBASE BIOCONSTRUCTORS
SOMBASE PYCNOGONIDS
NMNH Invertebrate Zoology Collections
NMNH Vertebrate Zoology Fishes Collections
NIWA plankton
New Zealand Coralline Algae
South Western Pacific Regional OBIS Data All Sea Bio Subset
South Western Pacific Regional OBIS Data Asteroid
records
70
2
11
343
77
1 280
64 880
1 662
96
42
1
1 094
47
1
230
6
22
529
55
26
41
38
47
83
2
3
1
64
4
1
1
1 644
217
2 969
188
4 200
557
32 597
2 023
taxa
39
2
9
178
47
189
602
251
30
15
1
3
1
1
1
6
8
74
11
14
23
14
16
45
2
1
1
9
4
1
1
592
73
1 119
113
200
30
2 457
114
Provider name
EurOBIS
FishBase
FishBase
FishBase
FishBase
Hexacorals
ICoMM
NODC
OBIS Japan
OBIS-SEAMAP
OBIS-SEAMAP
OBIS-SEAMAP
OBIS-SEAMAP
OBIS-SEAMAP
OBIS-SEAMAP
OBIS-USA
OBIS-USA
OBIS-USA
OZCAM
OZCAM
OZCAM
OZCAM
SCAR-MarBIN
SCAR-MarBIN
SCAR-MarBIN
SCAR-MarBIN
SCAR-MarBIN
SCAR-MarBIN
SCAR-MarBIN
SCAR-MarBIN
SCAR-MarBIN
SCAR-MarBIN
SCAR-MarBIN
Smithsonian Institute
Smithsonian Institute
South Western Pacific OBIS South Western Pacific OBIS South Western Pacific OBIS South Western Pacific
12 Tier 1 Marine Biodiversity Statistic Ministry for Primary Industries
OBIS Dataset
Subset
South Western Pacific Regional OBIS Data Bryozoan Subset
South Western Pacific Regional OBIS Data Habitat-forming Cold Water Corals Subset
South Western Pacific Regional OBIS Data Specify Subset
South Western Pacific Regional OBIS Data provider for the NIWA Marine Biodata Information System
Catalogue of Squat Lobsters
Academy of Natural Sciences OBIS Mollusc Database
records
5 545
588
7 212
365 775
20
45
taxa
558
5
1 467
435
19
31
Provider name
OBIS
South Western Pacific OBIS South Western Pacific OBIS South Western Pacific OBIS South Western Pacific OBIS
SquatLobsters
The Academy of Natural Sciences
Total (all OBIS data records) 527 441 10 974 Total South Western Pacific OBIS (New Zealand) 418 497 5 266
OBIS data columns include 97 available information categories ranging from record identification spatial position species name collector information physical parameters at the collection location and temporal information Key information required for analyses for a marine biodiversity indicator included record ID latitude longitude date collected date last modified on OBIS species name and source of record A tool exists to convert species names to complete taxonomic information (Phylum Class Order hellip) that links OBIS with WoRMS but this tool is limited to small datasets (fewer than 2000 records at a time) Because over 500 000 records in OBIS required conversion conversion of OBIS species information using WoRMS was not completed in this project (Table 2) Instead data records were downloaded from OBIS for taxonomic subsets (eg Porifera Cnidaria) providing for higher levels taxonomic groupings within ArcGIS analyses This also got around issues within the OBIS dataset where taxa were not identified to species and instead taxonomic information was available only at higher taxonomic levels
252 SPECIFY
All taxonomic records from SPECIFY were extracted from within the New Zealand EEZ including all historical data to 31 December 2013 A total of 66 690 SPECIFY records were extracted representing 7556 individual species Thirty seven SPECIFY data columns were extracted providing information on record identification number latitude longitude taxonomic information date of collection date of identification and modification and collector information It was assumed that all taxonomic information was current with information available in WoRMS and NZOR due to quality control within the SPECIFY database Commercially sensitive records (ie records logged relating to particular commercial ventures such as phosphate mining or oil and gas exploration) were excluded from the data extraction In some cases records in SPECIFY are recorded as lsquolotsrsquo ie where a sample container included more than one species All multiple record lots in SPECIFY were separated prior to extraction into individual records representing individual species
253 Macroalgal datasets
Macroalgal records were extracted from the database of the Te Papa herbarium All New Zealand marine algal records current to December 2011 were exported into Excel spreadsheets In the absence of a published flora a current species names list and taxonomic hierarchy is maintained on the Te Papa website (httpwwwtepapagovtnz - Dalen and Nelson 2013a-c) Changes to current taxonomic names and classification have been drawn from primary literature and updated into Te Paparsquos database and the application of name changes to the collections has also been part of this effort The number of taxa includes all recognised entities present in the collections including some that have been
Ministry for Primary Industries Tier 1 Marine Biodiversity Statistic 13
recognised as distinct at a family genus or species level but are currently unnamed It is important to note that the publicly accessible flora lists (Dalen and Nelson 2013a-c) include only published names including some published tag names
not all published taxa are represented in the WELT collections and there are more taxa recognised as being distinct than have been published currently
The Green algae or Division Chlorophyta includes data for three classes Prasinophyceae Ulvophyceae and Trebouxiophyceae (There are no marine macroalgal Chlorophyceae represented in Te Paparsquos collections) The Brown algae or Ochrophyta include members of the classes Chrysomerophyceae Xanthophyceae and Phaeophyceae and the Red algae or Rhodophyta are represented by members of four classes Compsopogonophyceae Stylonematophyceae Bangiophyceae and Florideophyceae Eleven data columns were extracted providing information on record and taxonomic identification collection location and date and collector for each of 19 422 records representing a total of 1028 individual species
254 Geoprocessing
Records were provided in the geospatial datum WGS84 (World Geodetic System 1984) which is a standard projection and used by GPS (Global Positioning System) with which the sampling location of many species records are located All records (OBIS SPECIFY Te Papa) were provided in WGS84 projection and no conversions were required A total of 608 280 records were available from the combined OBIS SPECIFY and Te Papa datasets
ArcGIS standard geoprocessing tools were used to calculate sums of records within a custom grid beginning at the northwest corner of the NZ EEZ Grids were created for 1 km times 1 km grid cells 10 km times 10 km grid cells and 100 km times 100 km grid cells To calculate the number of species from the record database we used the Marine Geospatial Ecology Toolbox (MGET) MGET is a collection of free open source software tools that provide standard geoprocessing for marine ecology including tools to convert OBIS records to species richness (httpmgelenvdukeedumget)
Additional calculations were investigated that could allow for evaluation of sampling effort bias when determining patterns of species richness We investigated ES50 (estimated species in random 50 samples) Chao statistics (estimates species richness based on samples in spatial unit) and calculation of the number of phyla per grid cell as ways of evaluating sampling effort bias and completeness of the species record
However we determined that additional calculations using any of these tools were not cost-effective based on current knowledge of biodiversity and were unlikely to provide information not already available in plots of spatial patterns in species richness which demonstrate nearly identical spatial patterns in species richness as those in species records (see Section 3) The sampling bias is substantially skewed with the majority of 100 km times 100 km cells having fewer than 100 total records and few areas (coastal areas Chatham Rise) with high sampling effort (more than 1000 records) As such the more complex metrics that reduce sampling bias are unable to overcome the substantial bias in sampling effort and would show similar patterns to that of the number of records and the number of species In future should sampling effort resolve gaps in spatial knowledge these additional calculations would be worth exploring
3 SPECIES RICHNESS
Costello et al (2010) reported species richness for New Zealand as the combined number of species recorded per total area of the New Zealand EEZ The proportion of all species within each of fourteen major taxonomic groupings (eg Crustacea Mollusca) was also reported showing similarities across most bioregions in dominance of marine biodiversity by Crustacea Mollusca and Pisces (Costello et al 2010) The proposed reporting statistic for species richness would thus adapt the Costello et al
14 Tier 1 Marine Biodiversity Statistic Ministry for Primary Industries
(2010) statistic to report on the number of records per area at a sub-national scale ideally 1 km times 1 km
For the species richness reporting statistic we determined that this metric could provide information relating to two aspects of marine biodiversity What are national estimates of marine biodiversity in terms of the total number of species accumulated since records start across taxonomic groups
What are spatial trends in this national estimate of biodiversity
For the species richness metric we were unable to determine temporal trends in biodiversity at the broader NZ EEZ scale as records of species are given as presence only records (ie not including information on what is not found during a sampling event) Temporal trends in biodiversity would require structured repeated sampling of species diversity to determine whether increases or decreases in species richness were occurring In effect the available data for species richness at a national scale is contributing information on our state of knowledge of marine biodiversity but it cannot currently provide information on the status or trends in marine biodiversity
To determine optimal reporting of species richness we discuss recommendations for Spatial scale of reporting Datasets to be included Temporal scale of reporting Taxonomic resolution Reporting of Records vs Species
31 Spatial scale of reporting
While the proposed reporting metric was for species richness within 1 km times 1 km grid cells the availability of species records suggested that coarser resolution was required in order to adequately quantify and view species richness due to the sparsity of records throughout much of the EEZ (Figure 1) Comparisons between spatial scales (10 km times 10 km Figure 2 100 km times 100 km Figure 3) suggest that species records are too sparse for adequate reporting at a scale less than 100 km times 100 km
Even at the 100 km times 100 km scale roughly half (269 of 540 grid cells) had low numbers of species records (fewer than 50) and number of species (Figure 3 Figure 4 Table 3) however patterns of species richness in locations with high sampling effort (ie coastal cells Chatham Rise) were evident at this highest scale although these patterns are likely to be due primarily to sampling effort at this point in our understanding of New Zealandrsquos biodiversity Patterns were consistent between species records and species richness however because of the spatial bias in sampling effort it is premature at this stage to confirm that these patterns represent hotspots of biodiversity (Figure 3 Figure 4)
Comparisons between the number of species and the number of records in each cell indicate linear correlations between sampling effort and the number of species suggesting that species diversity information is not yet sufficient to reach asymptotic levels of species present for most taxa although it is likely that species richness is reaching an asymptote with increasing sampling effort for one better known group of ray-finned fishes (Actinypterygiae) (Table 3 Figure 5)
Ministry for Primary Industries Tier 1 Marine Biodiversity Statistic 15
Figure 1 Point locations of all records across all biodiversity databases
16 Tier 1 Marine Biodiversity Statistic Ministry for Primary Industries
Figure 2 Number of taxonomic records per grid cell from all databases at grid scale of 10 km times 10 km
Ministry for Primary Industries Tier 1 Marine Biodiversity Statistic 17
Figure 3 Number of taxonomic records per grid cell from all databases at grid scale of 100 km times 100 km
18 Tier 1 Marine Biodiversity Statistic Ministry for Primary Industries
Figure 4 Number of species recorded per grid cell from all databases at grid scale of 100 km times 100 km
Ministry for Primary Industries Tier 1 Marine Biodiversity Statistic 19
Table 3 Distribution of records and number of species from all databases across grid cells
Number Number of species Number of records
0 60 60
1 63 40
2 29 21
3 12 11
4 11 8
5 7 12
6ndash10 23 29
11ndash20 36 32
21ndash30 28 22
31ndash50 30 34
51ndash100 73 37
101ndash500 112 79
gt501ndash1000 48 49
gt1001ndash5000 8 61
gt5001ndash10000 0 34
gt10000 0 11
Total cells 540 540
Max value 1648 22986
20 Tier 1 Marine Biodiversity Statistic Ministry for Primary Industries
All taxa 1800
1600
1400s
1200
specie
1000
Numberof
800
600
400
200
0 0 5000 10000 15000 20000 25000
Number of records
Fish 180
160
140
120
100
80
60
40
20
0 0 5000 10000 15000 20000 25000
Number of records
Figure 5 Species richness (number of species recorded per grid cell) from all taxonomic records at grid scale of 100 km times 100 km versus number of records for all taxonomic groups (top) Actinypterygiae (ray-finned fishes) (bottom)
32 Datasets to be included
While the initial contract objectives suggested using datasets accessible using Census of Marine Life OBIS we recognised that a number of high quality national datasets either were not uploaded to OBIS or had updated versions held by NIWA or Te Papa that were planned for future upload Additional international datasets that may not be subject to the same quality control as New Zealand datasets (although see Box 1 for OBIS requirements for data quality) are available on OBIS while some national expert taxonomists were hesitant to include these datasets due to their uncertain quality plots of spatial distribution of records comparing New Zealand held datasets (including those held on OBIS) and other international datasets held on OBIS show differences in spatial coverage with other
Numberofspecies
Ministry for Primary Industries Tier 1 Marine Biodiversity Statistic 21
international OBIS datasets covering many regions of the EEZ that are not covered in New Zealand datasets (Figure 6 Figure 7)
International (non-New Zealand) OBIS records include approximately 20 of all species records in the New Zealand EEZ (Table 2) and most are described as being quality collections from other reputable national and international sources Patterns of species richness between New Zealand datasets and all international OBIS datasets were similar to those of number of records (Figure 8 Figure 9) As many New Zealand datasets are regularly updated and are planned for upload to OBIS it is assumed that future calculations of this statistic are likely to require only access of OBIS datasets making the data extraction process simpler In the meantime we opted to include both New Zealand and all other international datasets available on OBIS for the Tier 1 Marine Biodiversity calculations
22 Tier 1 Marine Biodiversity Statistic Ministry for Primary Industries
Figure 6 Number of taxonomic records per grid cell from OBIS taxonomic databases (omitting New Zealand records) at grid scale of 100 km times 100 km
Ministry for Primary Industries Tier 1 Marine Biodiversity Statistic 23
Figure 7 Number of taxonomic records per grid cell from New Zealand taxonomic databases at grid
scale of 100 km times 100 km
24 Tier 1 Marine Biodiversity Statistic Ministry for Primary Industries
Figure 8 Species richness (number of species recorded per grid cell) from OBIS taxonomic databases
(non-New Zealand records) at grid scale of 100 km times 100 km
Ministry for Primary Industries Tier 1 Marine Biodiversity Statistic 25
Figure 9 Species richness (number of species recorded per grid cell) from New Zealand taxonomic databases at grid scale of 100 km times 100 km
26 Tier 1 Marine Biodiversity Statistic Ministry for Primary Industries
33 Temporal scale of reporting
For a Tier 1 Marine Biodiversity statistic to be useful it must be able to show changes over the proposed scale of reporting in this case five yearly Again at this stage in our knowledge of marine biodiversity in New Zealand we are focussed on the process of gathering data as representing New Zealandrsquos commitment to knowledge of the biodiversity of its marine estate As such it is expected that for a number of five yearly reports only increases in our knowledge are likely ie it is impossible to get a decrease in biodiversity using either the number of records or the number of species as the data available are not designed to determine changes in species abundance or presenceabsence rather they are recording presence only records With increased focussed monitoring of the marine environmental realm it should be possible to incorporate changes in species diversity into this statistic at a later stage based on site-specific monitoring schemes
To investigate the likelihood of a five year reporting period being long enough to show differences in the species richness metric we investigated the number of records uploaded to OBIS (including some New Zealand datasets) to determine whether sufficient new records are provided over a roughly similar timeframe (eight yearly 2006ndash2013) (Table 4) The number of lsquonewrsquo records varied across taxa with particular groups (eg Bacteria Plantae) having large number of records uploaded in 2006ndash 2013 (Table 4) This pattern should be expected in the future for other groups (eg Bryozoa Mollusca Chordata (eg fish) when existing New Zealand datasets including some datasets previously not available on OBIS are revised and uploaded to OBIS with large instantaneous increases in the number of records for particular taxonomic groups
Table 4 Temporal distribution of records in OBIS comparing all records to more recently uploaded or modified records from 2006ndash2013
Taxonomic group No records on No records after 2005 of records uploaded OBIS Dec 2013 on OBIS Dec 2013 between 2006 and 2013
Kingdom Animalia 429 771 9 120 212 Annelida 7 327 60 082 Arthropoda 14 324 940 638 Brachiopoda 1 509 2 013 Bryozoa 8 121 2 002 Cephalorhynca 35 0 000 Chaetognatha 600 3 050 Chordata 354 109 7 134 201 Cnidaria 7 396 278 376 Ctenophora 36 0 000 Echinodermata 11 170 235 210 Echiura 20 0 000 Entoprocta 1 0 000 Hemichordata 16 0 000 Mollusca 23 199 413 178 Myxozoa 3 0 000 Nematoda 36 0 000 Nemertea 24 0 000 Phoronida 10 0 000 Plathyhelminthes 12 0 000 Porifera 1 254 60 478 Rotifera 24 0 000 Sipuncula 131 0 000
Domain Bacteria 64 812 64 811 9999 Kingdom Chromista 31 974 11 003 Kingdom Plantae 776 297 3827 Kingdom Protozoa 108 0 000
Ministry for Primary Industries Tier 1 Marine Biodiversity Statistic 27
34 Taxonomic resolution
The number of records and number of species differ substantially between taxonomic groups with many smaller phyla having few or no records in the New Zealand EEZ (Table 5 Table 6) Dominant taxonomic groups in terms of number of total records include in order of abundance of species records 1) Chordata (primarily fishes) 2) Bacteria 3) Chromista (brown algae and other Chromista) 4) Arthropoda 5) Mollusca 6) Echinodermata 7) Cnidaria 8) Plantae (primarily red and green algae) 9) Bryozoa 10) Annelida 11) Porifera and 12) Brachiopoda All other taxonomic groups had fewer than 1000 total records across all datasets (Table 5) In terms of number of species the proportional representation of taxonomic groups showed different rankings with Chordata and Bacteria both having the highest numbers of records but ranked much lower in terms of number of species The ranking for total number of species were 1) Arthropoda 2) Mollusca 3) Cnidaria 4) Chromista (brown algae and other Chromista) 5) Echinodermata 6) Porifera 7) Bryozoa 8) Chordata (primarily fishes) 9) Annelida 10) Plantae (primarily red and green algae) 11) Bacteria and 12) Brachiopoda
28 Tier 1 Marine Biodiversity Statistic Ministry for Primary Industries
Table 5 Taxonomic distribution of records used in Marine Biodiversity Tier 1 Statistic calculations comparing contributions of records between broad database sources
KINGDOM
Phylum Subphylum Class or Subclass
Order
Suborder
Common name
OBIS SPECIFY Te Papa
No Records
Total
ARCHAEA 0 0 0 0
BACTERIA Bacteria including cyanobacteria
64 812 0 0 64 812
FUNGI 0 0 0 0
PROTOZOA Dinoflagellates foraminifera
108 171 0 279
PLANTAE
Chlorophyta
Rhodophyta
Other
Green algae
Red algae
Other flowering plants (eg mangrove seagrass saltmarsh)
776
121
647
8
0 14 842
2 213
12 629
0
15 618
2 334
13 276
8
CHROMISTA
Ochrophyta
Other
Brown algae
Other Chromista
31 974
569
31 405
0 4 584
4 580
4
36 558
5 149
31 409
ANIMALIA
Acanthocephala
Annelida
Arthropoda Crustacea
Thorny-headed worms
Segmented worms
Crustaceans
0
7 327
14 324
0
3 050
16 997
0
10 377
31 321
Ministry for Primary Industries Tier 1 Marine Biodiversity Statistic 29
KINGDOM Order Common name No Records
Phylum Subphylum Class or Subclass Suborder OBIS SPECIFY Te Papa Total
Arthropoda Non-Crustacea Marine spiders and mites 401 363 764
Brachiopoda Lamp shells 1 509 1 819 3 328
Bryozoa Moss animals sea mats 8 121 2 729 10 850
Cephalorhyncha 35 0 35
Chaetognatha Arrow worms 600 12 612
Chordata Vertebrata Mammalia Cetacea Whales dolphins 1 128 1 128 porpoises
Chordata Vertebrata Mammalia Carnivora Sea lions seals 116 116
Chordata Vertebrata Aves Birds 462 462
Chordata Vertebrata Reptilia Reptiles 1 1
Chordata Vertebrata Myxini Cephala- Hagfish lampreys 55 55 spidomorphi
Chordata Vertebrata Chondrichthyes Sharks and rays 0 0
Chordata Vertebrata Actinopterygii Ray-finned fish 273 467 273 467
Chordata Cephalochordata Lancelets 5 19 24
Chordata Tunicata Sea tulips 723 665 1 388
Cnidaria Sea anemones corals 7 396 12 800 20 196 jellyfish
Ctenophora Comb jellies 36 3 39
Cycliophora Small parasite 0 0 0
Dicyemida Small parasite 0 0 0
Echinodermata Sea stars brittle stars sea 11 170 16 146 27 316 urchins sea cucumbers
Echiura Spoon worms 20 59 79
Entoprocta Goblet worms 1 3 4
Gastrotricha Meiofauna 0 0 0
Gnathostomulida Jaw worms 0 0 0
Hemichordata Acorn worms 16 14 30 pterobranchs
Kinorhyncha Mud dragons 12 11 23
30 Tier 1 Marine Biodiversity Statistic Ministry for Primary Industries
KINGDOM Order Common name No Records
Phylum Subphylum Class or Subclass Suborder OBIS SPECIFY Te Papa Total
Loricifera Brush heads 0 0 0
Micrognathozoa Newly described phylum 0 0 0 not yet registered in WoRMS
Mollusca Molluscs 23 199 6 064 29 263
Myxozoa Small parasite 3 0 3
Nematoda Round worms 36 78 114
Nematomorpha Horsehair worms 0 0 0
Nemertea Ribbon worms 24 144 168
Orthonectida Small parasite 0 0 0
Phoronida Horseshoe worms 10 6 16
Placozoa Plate animals 0 0 0
Platyhelminthes Flat worms 12 24 36
Porifera Sponges 1 254 7 103 8 357
Rotifera Rotifers 24 0 24
Sipuncula Peanut worms 131 229 360
Tardigrada Water bears 0 0 0
Ministry for Primary Industries Tier 1 Marine Biodiversity Statistic 31
Table 6 Taxonomic distribution of species used in Marine Biodiversity Tier 1 Statistic calculations comparing contributions of species between broad databasesources
KINGDOM
Phylum
Class
Subphylum Subclass
Order
Suborder
Common name
OBIS SPECIFY Te Papa
No Species
Total
ARCHAEA 0 0 0 0
BACTERIA Bacteria including cyanobacteria
603 0 0 603
FUNGI 0 0 0 0
PROTOZOA Dinoflagellates foraminifera
8 32 0 40
PLANTAE
Chlorophyta
Rhodophyta
Spermatophyta
Green algae
Red algae
Other flowering plants (eg mangrove seagrass saltmarsh)
81
10
66
5
0 798
119
679
874
127
742
5
CHROMISTA
Ochrophyta
Other
Brown algae
Other Chromista
1 553
137
1 416
0 230
230
1 646
333
1 416
ANIMALIA
Acanthocephala
Annelida
ArthropodaCrustacea
Thorny-headed worms
Segmented worms
Crustaceans
7 787
0
671
1 457
7 577
411
1 866
12 213
0
932
2 399
32 Tier 1 Marine Biodiversity Statistic Ministry for Primary Industries
KINGDOM Class Order Common name No Species
Arthropodaother Marine spiders and mites 103 81 125
Brachiopoda Lamp shells 46 52 80
Bryozoa Moss animals sea mats 920 815 1 279
Cephalorhyncha 7 0 7
Chaetognatha Arrow worms 23 1 23
Chordata Vertebrata Mammalia Cetacea Whales dolphins 21 21 porpoises
Chordata Vertebrata Mammalia Carnivora Sea lions seals 3 3
Chordata Vertebrata Aves Birds 44 44
Chordata Vertebrata Reptilia Reptiles 1 1
Chordata Vertebrata Myxini Cephala- Hagfish lampreys 3 3 spidomorphi
Chordata Vertebrata Chondrichthyes Sharks and rays 0 0
Chordata Vertebrata Actinopterygii Ray-finned fish 783 783
Chordata Cephalochordata Lancelets 2 4 3
Chordata Tunicata Sea tulips 132 111 205
Cnidaria Sea anemones corals 967 1 140 1 662 jellyfish
Ctenophora Comb jellies 2 1 2
Cycliophora Small parasite 0 0 0
Dicyemida Small parasite 0 0 0
Echinodermata Sea stars brittle stars sea 786 1 071 1 418 urchins sea cucumbers
Echiura Spoon worms 8 5 12
Entoprocta Goblet worms 1 1 1
Gastrotricha Meiofauna 0 0 0
Gnathostomulida Jaw worms 0 0 0
Hemichordata Acorn worms 4 5 6 pterobranchs
Kinorhyncha Mud dragons 5 5 7
Loricifera Brush heads 0 0 0
Ministry for Primary Industries Tier 1 Marine Biodiversity Statistic 33
KINGDOM Class Order Common name No Species
Micrognathozoa Newly described phylum 0 0 0 not yet registered in WoRMS
Mollusca Molluscs 1 150 910 1 721
Myxozoa Small parasite 3 1 0 3
Nematoda Round worms 9 38 38
Nematomorpha Horsehair worms 0 0 0
Nemertea Ribbon worms 12 9 15
Orthonectida Small parasite 0 0 0
Phoronida Horseshoe worms 2 3 4
Placozoa Plate animals 0 0 0
Platyhelminthes Flat worms 7 7 12
Porifera Sponges 441 1 039 1 326
Rotifera Rotifers 4 0 4
Sipuncula Peanut worms 73 1 74
Tardigrada Water bears 0 0 0
34 Tier 1 Marine Biodiversity Statistic Ministry for Primary Industries
In determining an appropriate way to report taxonomic differences in species richness that is suitable and informative for the general public as well as for managers and policy makers we present three variations of potential taxonomic groupings varying in resolution of lesser known groups (ie Echiura Sipuncula Phoronida) and of groups often of particular interest to the public and for international reporting agreements (ie Chordata seabirds marine mammals marine reptiles) (Table 7) Other biodiversity summaries have varied in taxonomic resolution from very low resolution (eg Costello et al 2010) to high resolution (eg Supplementary tables available in Gordon et al 2010) A medium resolution grouping allows presentation of categories that may be of interest to the general public and important for international reporting statistics while lumping the large number of smaller invertebrate phyla
Table 7 Potential groupings for taxonomic representation to be used in Marine Biodiversity Tier 1 Statistic
Low resolution Medium resolution Highest resolution KINGDOM Phylum (SubphylumClassSubClass OrderSubOrder)
ARCHAEA ARCHAEA ARCHAEA BACTERIA BACTERIA BACTERIA FUNGI FUNGI FUNGI PROTOZOA PROTOZOA PROTOZOA PLANTAE PLANTAE PLANTAE
Chlorophyta Chlorophyta Rhodophyta Rhodophyta Other Other
CHROMISTA CHROMISTA CHROMISTA Ochrophyta Ochrophyta Other Other
ANIMALIA ANIMALIA ANIMALIA Chordata (Vertebrata Other) Chordata (Mammalia) Chordata (Vertebrata Mammalia
Cetacea) Chordata (Vertebrata Mammalia Carnivora)
Chordata (Vertebrata Aves) Chordata (Vertebrata Aves) Chordata (Vertebrata Chordata (Vertebrata Reptilia) Reptilia)
Chordata (Vertebrata Chordata (Vertebrata Other) Chordata (Vertebrata Actinypterigiae) Actinypterigiae)
Chordata (Vertebrata Chondrichthyes and other fish classes)
Chordata (Other) Chordata (Other) Chordata (Cephalochordata) Chordata (Tunicata)
Annelida Annelida Annelida Arthropoda Arthropoda Arthropoda (Crustacea)
Arthropoda (Other) Bryozoa Bryozoa Bryozoa Cnidaria Cnidaria Cnidaria Echinodermata Echinodermata Echinodermata Mollusca Mollusca Mollusca Porifera Porifera Porifera Other invertebrate phyla Brachiopoda Brachiopoda
Platyhelminthes Platyhelminthes Other invertebrate phyla Acanthocephala
Cephalorhyncha Chaetognatha Ctenophora Cycliophora Dicyemida
Ministry for Primary Industries Tier 1 Marine Biodiversity Statistic 35
Low resolution Medium resolution Highest resolution KINGDOM Phylum (SubphylumClassSubClass OrderSubOrder)
Echiura Entoprocta Gastrotricha Gnathostomulida Hemichordata Kinorhyncha Loricifera Micrognathozoa Myxozoa Nematoda Nematomorpha Nemertea Orthonectida Phoronida Placozoa Rotifera Sipuncula Tardigrada
35 Reporting of Records instead of Species
In calculating spatial patterns in species richness the cost-effectiveness of developing metrics based on species records (ie immediately extracted from OBIS with minimal further manipulation required for geoprocessing to develop spatial patterns for the statistic) can be weighed against the substantial additional effort required to convert species records into spatial patterns of species richness using MGET or other complex geoprocessing algorithms Spatial patterns in species records and species richness are generally similar reflecting primarily patterns of sampling and taxonomic effort up to 2013 (Figure 3 Figure 4 Table 8) The similarities between spatial patterns based on records and species richness is consistent across taxa with plots of ray-finned fishes (Actinypterigiae) (Figure 10) Arthropoda (Figure 11) Annelida (Figure 12) Mollusca (Figure 13) Bryozoa (Figure 14) Chromista (Figure 15) and Plantae (Figure 16) all showing similar relative patterns of high middle low and empty cells This suggests that a statistic using the number of records can provide (at least at this point in our knowledge of marine biodiversity in the New Zealand EEZ) equivalent information to that of the more costly calculation of species richness
Using records instead of species also side-steps issues of changes in taxonomy As taxonomy is regularly evolving at levels from species to phyla (ie two phyla described in Gordon et al (2010) have been renamed) species records in OBIS and elsewhere are likely to be modified to reflect updated taxonomy Other challenges with some data records is that occasionally a taxonomic unit is only identified to higher taxonomic levels so a true species identity may not yet exist in OBIS or other databases for many records held in national collections As such the reports of higher numbers of species found from the combined OBISTe PapaNIWA datasets than reported as the number of described species for a particular taxonomic group is likely to be spurious for some groups (eg Porifera) that may be more likely to have species records not defined to genus and species It is expected that future revisions of this statistic will show more equitability between OBIS-derived measures of species richness to those estimated by Gordon et al (2010) and available from the New Zealand Inventory of Biodiversity (Gordon (2009) Gordon (2010) Gordon (2012))
It is still valuable to calculate the number of species described at a national level OBIS and other datasets do not include (as of 2013) the full complement of species described for the New Zealand EEZ and reported in Gordon et al (2010) (Table 8) Instead the number of records available to
36 Tier 1 Marine Biodiversity Statistic Ministry for Primary Industries
describe spatial patterns in species richness vary among taxonomic groupings (Table 8) Sampling effort as approximated by the records to species ratio also varies between groups with some taxonomic groups having substantially higher sampling effort relative to species described (eg fishes with about 348 times as many records as number of fish species) This is in contrast to even some relatively well described groups like Porifera and Bryozoa for which there are 6 and 8 records per species (on average) respectively (Table 8) Note that the distribution of records is not equivalent across species within a taxonomic group such that most species groups are represented by a smaller number of common species with more records and the majority of species are often rarer with only one or two records in the EEZ (eg macroalgae Nelson et al 2013)
Ministry for Primary Industries Tier 1 Marine Biodiversity Statistic 37
Table 8 Comparison of biodiversity information compiled by this report with the expert-derived estimates of marine biodiversity across taxonomic groups from Gordon et al (2010) supplementary information table revised to reflect updated taxonomy Note that there are more individual species recorded in OBIS than in Gordon et al ( in final column) this is likely to be due to records uploaded to OBIS but not identified to species level
No No Estd no No No No No Records Min no described undescribed undescribed endemic alien records species in per species not species in study study species in OBIS
BACTERIAARCHAEA 40 69 190 0 0 64 812 603 107
FUNGI 57 0 210 0 0 0 0 0 57
PROTOZOA 1 476 152 2 900 162 4 279 40 7 1 436
PLANTAE
Chlorophyta 142 0 90 36 0 2 334 127 18 15
Rhodophyta 419 101 150 189 12 13 276 742 18
Other 7 0 0 0 0 8 5 2 2
CHROMISTA
Ochrophyta 734 43 630 55 11 5 149 333 15 401
Other 83 0 25 1 0 31 409 1 416 22
ANIMALIA 0
Acanthocephala 24 5 50 1 0 0 0 0 24
Annelida 528 263 1 005 238 32 10 377 932 11
ArthropodaCrustacea 2 166 407 4 930 944 27 31 321 2 399 13
Arthropodaother 147 7 215 61 1 764 125 6 22
Brachiopoda 41 9 17 15 0 3 328 80 42
Bryozoa 622 331 295 581 24 10 850 1 279 8
Cephalorhyncha (prev Priapulida) 3 0 4 0 0 35 7 5
Chaetognatha 14 0 25 0 0 612 23 27
Chordata (VertebrataMammaliaCetacea) 41 0 0 1 0 1 128 21 54 20
Chordata (VertebrataMammaliaCarnivora) 8 0 0 1 0 116 3 39 5
Chordata (VertebrataAves) 122 2 0 41 0 462 44 11 78
Chordata (VertebrataReptilia) 6 0 0 0 0 1 1 1 5
Chordata (VertebrataAll fish classes) 1 313 74 762 242 6 273 522 786 348 527
Chordata (Cephalochordata) 1 0 0 1 0 24 3 8
38 Tier 1 Marine Biodiversity Statistic Ministry for Primary Industries
No No Estd no No No No No Records Min no described undescribed undescribed endemic alien records species in per species not species in study study species in OBIS
Chordata (Tunicata) 189 3 195 125 12 1 388 205 7
Cnidaria 794 322 630 258 23 20 196 1 662 12
Ctenophora 15 4 12 5 0 39 2 20 13
Cycliophora 0 0 0 0 0 0 0 0 0
Dicyemida 5 1 15 6 0 0 0 0 5
Echinodermata 557 66 45 237 0 27 316 1 418 19
Echiura 5 2 15 0 0 79 12 7
Entoprocta (prev Kamptozoa) 6 7 30 2 1 4 1 4 5
Gastrotricha 0 5 190 0 0 0 0 0 0
Gnathostomulida 2 10 12 4 0 0 0 0 2
Hemichordata 5 2 4 1 0 30 6 5
Kinorhyncha 6 39 30 6 0 23 7 3
Loricifera 0 4 10 2 0 0 0 0 0
Micrognathozoa 0 0 1 0 0 0 0 0 0
Mollusca 2 340 1 253 430 2 923 14 29 263 1 721 17 619
Myxozoa 0 0 0 0 0 3 1 3
Nematoda 155 52 1 430 25 0 114 47 2 108
Nematomorpha 1 0 0 1 0 0 0 0 1
Nemertea 28 26 350 28 0 168 15 11 13
Orthonectida 0 1 20 1 0 0 0 0 0
Phoronida 3 0 2 0 0 16 4 4
Placozoa 0 0 1 0 0 0 0 0 0
Platyhelminthes 229 95 1 810 91 2 36 12 3 217
Porifera 472 963 310 455 7 8 357 1 326 6
Rotifera 2 0 95 0 1 24 4 6
Sipuncula 26 0 10 2 0 360 74 5
Tardigrada 3 2 60 0 0 0 0 0 3
Xenacoelomorpha (prev Xenoturbellida) 0 0 0 0 0 0 0 0 0
Ministry for Primary Industries Tier 1 Marine Biodiversity Statistic 39
Figure 10 Demonstration of variation in spatial coverage between taxonomic groups Species richness of Actinypterigiae (bony fish) at grid scale of 100 km times 100 km across all datasets Left number of records Right number of individual species identified
40 Tier 1 Marine Biodiversity Statistic Ministry for Primary Industries
Figure 11 Demonstration of variation in spatial coverage between taxonomic groups Species richness of Arthropoda (primarily crustaceans) at grid scale of 100 km times 100 km across all datasets Left number of records Right number of individual species identified
Ministry for Primary Industries Tier 1 Marine Biodiversity Statistic 41
Figure 12 Demonstration of variation in spatial coverage between taxonomic groups Species richness of Annelida (primarily marine polychaetes) at grid scale of 100 km times 100 km across all datasets Left number of records Right number of individual species identified
42 Tier 1 Marine Biodiversity Statistic Ministry for Primary Industries
Figure 13 Demonstration of variation in spatial coverage between taxonomic groups Species richness of Mollusca (gastropods bivalves cephalopods) at grid scale of 100 km times 100 km across all datasets Left number of records Right number of individual species identified
Ministry for Primary Industries Tier 1 Marine Biodiversity Statistic 43
Figure 14 Demonstration of variation in spatial coverage between taxonomic groups Species richness of Bryozoa at grid scale of 100 km times 100 km across all datasets Left number of records Right number of individual species identified
44 Tier 1 Marine Biodiversity Statistic Ministry for Primary Industries
Figure 15 Demonstration of variation in spatial coverage between taxonomic groups Species richness of marine Chromista at grid scale of 100 km times 100 km across all datasets Left number of records Right number of individual species identified
Ministry for Primary Industries Tier 1 Marine Biodiversity Statistic 45
Figure 16 Demonstration of variation in spatial coverage between taxonomic groups Species richness of marine Plantae at a grid scale of 100 km times 100 km across all datasets Left number of records Right number of individual species identified
46 Tier 1 Marine Biodiversity Statistic Ministry for Primary Industries
36 Summary recommendations Species Richness
In summary reporting on species richness highlights a key factor relating to the development of a Tier 1 Marine Biodiversity Statistic our knowledge of marine biodiversity is low relative to other developed countries particularly in the ERMS (Europe) region where sampling has been undertaken for many more years As such any statistic relating to species richness is in reality a State of Knowledge index as changes in the spatial distribution and the number of taxa will initially represent increases in knowledge both in terms of increased sampling effort where gaps in spatial sampling coverage are currently evident and increased knowledge if additional sampling effort is focussed on the many under-represented groups in the marine biodiversity record particularly invertebrate groups Moreover data entering the databases is essentially for taxonomic purposes rather than monitoring and thus does not always include all species found in a sample ie if a species is not reported we do not know whether it is not there This complicates both qualitative and quantitative estimates of species richness Finally as there is no structured or coherent sampling design at present species richness can only increase there is no way of determining decreases over time
As our understanding of marine biodiversity increases we will be able to better assess hotspots of biodiversity and the features that they are associated with in the New Zealand EEZ Similarly with adequate knowledge of patterns in marine biodiversity we can better assess changes in species ranges decreases in abundance of common and rare taxa and other aspects that may reflect impacts of disturbances and climate change on marine biodiversity However it is more likely that changes in marine biodiversity would be better assessed from observed changes in directed monitoring across a number of locations while the information gleaned from OBIS and other taxonomic datasets would focus primarily on changes in our state of knowledge of marine biodiversity
From our initial assessment of available data to assess patterns in marine biodiversity we recommend a cost-effective statistic reporting on species richness should Have a spatial scale of reporting of 100 km times 100 km grid cells Include all datasets uploaded on OBIS Encourage (and provide funding for if necessary) data managers to regularly update New Zealand biodiversity datasets and upload them to OBIS including NIWA datasets Te Papa and other museum collections and other national datasets identified in this report Electronic linkages (currently being implemented) should be restored such that regular updates to OBIS from the South Western Pacific Node occur
Use WoRMS as the main source of taxonomic nomenclature and ensure that electronic linkages between NZOR and WoRMS are restored such that New Zealand based advances in taxonomy are included in the international taxonomic record
Have a temporal scale of reporting of five yearly Report number of species in total for the New Zealand EEZ to medium taxonomic resolution such that groups for which the public is familiar (eg vertebrates) have higher resolution and smaller uncommon phyla are combined
Report spatial patterns using the number of records extracted from OBIS as a proxy for patterns in species richness based on the number of individual species
Use gaps in spatial and taxonomic information to identify priorities for further sampling surveys in poorly studied regions and funding toward taxonomic training
Be considered as reporting on New Zealandrsquos commitment to advancing the nationrsquos knowledge of biodiversity rather than as an estimate of biodiversity per se
4 State of Knowledge Index
As discussed in Section 3 compilation of existing information on marine biodiversity in the New Zealand EEZ suggests that our biggest challenge is that of the poor state of knowledge both taxonomically and spatially Gordon et al (2010) estimated that only 31 of New Zealandrsquos marine biodiversity has been described quantifying a total of 17 135 known species including 4315 collected
Ministry for Primary Industries Tier 1 Marine Biodiversity Statistic 47
but as yet undescribed species and an estimated 17 220 (at minimum) further undescribed species In terms of our spatial understanding of marine biodiversity approximately 50 of cells had fewer than 50 biodiversity records and 38 of cells had 10 or fewer recorded species As such much of the increase in the state of knowledge will be revealed through increases in sampling effort in under-studied regions of the EEZ and efforts to reduce bias in taxonomic sampling and expertise and in formal taxonomic descriptions of lsquoknownrsquo undescribed species Plots of temporal (five yearly) subsets of the spatial distribution of new records can demonstrate increases in the state of the spatial knowledge of New Zealandrsquos marine biodiversity
Other biodiversity reviews have used expert-derived metrics to define the state of knowledge of marine biodiversity Data reported in Costello et al (2010) on the state of knowledge of marine biodiversity included metrics based on the number of taxonomic experts the age and number of identification guides and the percentage of taxa described summarised over broad national and international regions Gordon et al (2010) reported the metrics as in Costello et al (2010) and also included the number of collected and as yet not formally described species (labelled lsquoknown undescribedrsquo) in addition to an estimate of the number of undescribed taxa across phyla that have not yet been collected or described Outside of major museums and research institutes it will be potentially difficult in future to track down taxonomic experts and to track identification guides many of which are developed for amateur field identification by non-taxonomists
However the state of knowledge can be most adequately assessed by our knowledge of species biodiversity itself New species records can be found through reviews of peer-reviewed publications in key taxonomic literature including New Zealand local taxonomic journals which often include in their title lsquoNew record ofhelliprdquo For most taxa these new taxonomic records are uploaded to NZOR with data providers for marine taxa reported on the NZOR website (as at July 2012) to include
Marine algae data maintained by Tē Papa Digitised checklists from the New Zealand Inventory of Biodiversity Volumes 123 Edited by Dennis P Gordon (excluding plants and fungi)
State of knowledge is also relevant to the Threatened Species metric discussed in Section 6 Two categories within the New Zealand Threatened Species Classification (lsquonot assessedrsquo and lsquodata deficientrsquo) refer to taxa for which information has either not been compiled or is not yet available to determine whether a taxa is or is not threatened
41 Summary recommendations State of Knowledge
Report number of newly described species across taxonomic groups Report new species records in geographic context (as for methods for Species Richness but using a five yearly subset of recent data) as a measure of increased geographic knowledge
Use gaps in spatial and taxonomic information to identify priorities for further sampling surveys and decrease the number of areas that are poorly sampled
Use gaps in taxonomic information to identify priority databases to encourage upload to OBIS
5 Endemic species metric
Costello et al (2010) reported the number of endemic species across broad taxonomic categories (Plants Invertebrates Fish Other vertebrates) at a national scale New Zealandrsquos marine species have a high level of endemism with over 50 of described species reported as endemic to New Zealandrsquos EEZ (Costello et al 2010 Gordon et al 2010) While Gordon et al (2010) provides a starting point for estimates of the proportion of endemic species for higher resolution taxonomic groupings (Table 8) these proportions are unlikely to change in a significant way with new species described based on the small numbers of new taxa likely to be described on a five yearly basis relative to total species in most taxonomic groups As such statistics based on changes in the proportion of endemic species are unlikely to provide useful information on the status of New Zealandrsquos marine biodiversity However the static measure of endemicity is in itself an important aspect of New Zealandrsquos marine
48 Tier 1 Marine Biodiversity Statistic Ministry for Primary Industries
biodiversity and an important part of the conceptual understanding of the concept of biodiversity and one of the reasons that New Zealandrsquos marine (and terrestrial) fauna and flora is internationally known as a hotspot of biodiversity
While unlikely to individually result in a large change in the proportion of endemic species records of non-indigenous marine species (NIMS) and changes in their distribution are potentially useful indicators of the status of marine biodiversity as some NIMS are lsquoinvasive exoticsrsquo defined as those species that are present outside their natural distribution and have adverse impacts on native biodiversity It is assumed that reporting of the impacts of any NIMS taxa (ie resulting in decreases in native biodiversity) would be incorporated into the Tier 1 Ecological Integrity statistic which is proposed for reporting more directly on ecosystem health However basic information on the number of NIMS taxa is a useful metric to include to represent changes in biodiversity as related to endemicity of marine fauna and flora
Should NIMS be included as part of the Tier 1 marine biodiversity statistic this metric should include data on NIMS sourced from both OBIS and from the national Marine High Risk Site Surveillance (MHRSS) biosecurity database Data for MHRSS is held and managed by NIWA for the Ministry for Primary Industries (originally MAF Biosecurity) this database includes both transient (eg found on vessel hulls) and established NIMS taxa whereas only established NIMS taxa would be quantified for a Tier 1 marine biodiversity statistic 177 non-indigenous species were recorded as established in the New Zealand EEZ in 2010 (Gordon et al 2010) As of December 2013 a total of 334 recorded NIMS taxa had been discovered in New Zealand including many that were present only on vessel hulls Within OBIS records could be extracted for these NIMS taxa on a five yearly basis to determine whether there are changes in the spatial distribution of these taxa Using BIODS changes in the number of primary and secondary ports at which a NIMS are recorded could be used as an indicator of whether initiatives to reduce the influx of NIMS via ballast water and vessel hull cleaning initiatives are resulting in a reduction in transport of NIMS Similarly changes in the number of NIMS taxa could also be reported using information provided by Ministry for Primary Industries Biosecurity of any new NIMS taxa recorded within the five yearly update period or any new records on NIMS taxa recorded on NZOR or from the NIWA Marine Invasives Taxonomic Service (MITS)
51 Summary recommendations Endemic species
A statistic reporting on the proportion of endemic species is unlikely to demonstrate substantial change within a five year reporting period and is thus unlikely to be a useful indicator of changes in marine biodiversity Rather the presence and change in status of non-indigenous marine species (NIMS) would be a more useful indicator of changes in marine biodiversity as some NIMS taxa have negative impacts on native marine biodiversity If not overlapping the Ecological Integrity Tier 1 statistic or other national reporting programmes we recommend Report on the relatively static measure of the proportion of endemic species as an important aspect of New Zealandrsquos marine biodiversity
Do not report on changes in the proportion of endemic species Rather report on
o Change in spatial distribution of NIMS taxa o Changes in number of NIMS taxa recorded in the New Zealand EEZ
6 Threatened species metric
Costello et al (2010) reported on a ranked summary of the major threats to marine biodiversity at a national scale rather than on the number or presence of threatened species in the New Zealand EEZ Here we discuss a different metric that of the number of threatened species found in New Zealand and trends in their status
Ministry for Primary Industries Tier 1 Marine Biodiversity Statistic 49
The concept of lsquothreatened speciesrsquo has evolved out of threat classification systems that aim in part to quantify and identify those species most at risk from extinction Perhaps the most well-known of these systems is the International Union for Conservation of Naturersquos (IUCN) lsquoRed Listrsquo (see httpwwwiucnredlistorg) which takes a global view of risk from extinction Species are assessed against a set of quantitative criteria and assigned to one of several threat classifications with increasing risk of extinction ranging from lsquoLeast Concernrsquo and lsquoNear Threatenedrsquo to the three threatened classifications of lsquoVulnerablersquo lsquoEndangeredrsquo and lsquoCritically Endangeredrsquo and finally two further categories of lsquoExtinct in the Wildrsquo and lsquoExtinctrsquo To date (February 2014) the Red List has assessed over 71 500 taxa but with a strong bias towards vertebrates (over 37 000 taxa)
In New Zealand Molloy et al (2002) developed a threat classification system similar in many respects to the IUCNrsquos Red List which was later revised by Townsend et al (2008) Townsend et al (2008) noted that the New Zealand Threat Classification System (NZTCS) was intended to be complementary to the IUCNrsquos Red List but to be lsquofocussed at the national levelrsquo providing lsquoa more sensitive classification for taxa with naturally restricted distributions and small numbers as a result of insular rarityrsquo
The NZTCS comprises more categories compared to the Red List taxa are classified as lsquoIntroduced and Naturalisedrsquo native taxa are classified as lsquoMigrantrsquo lsquoVagrantrsquo or lsquoColoniserrsquo or lsquoResidentrsquo Those taxa that are both native and resident are classified as lsquoNot EvaluatedrsquorsquoData Deficientrsquo or lsquoEvaluatedrsquo lsquoEvaluatedlsquo taxa can be lsquoExtinctrsquo or lsquoNot Threatenedrsquo at which classification stops However lsquoAt Riskrsquo is further broken down to lsquoNaturally Uncommonrsquo lsquoRelictrsquo lsquoRecoveringrsquo and lsquoDecliningrsquo lsquoThreatenedrsquo is further broken down to lsquoNationally Vulnerablersquo Nationally Endangeredrsquo and lsquoNationally Criticalrsquo following the diagram below (Figure 17) adapted from Townsend et al (2008)
Biota in the wild in NZ
Native
Migrant
Vagrant
Coloniser
Resident
Not evaluated Data Deficient
Evaluated
Extinct
Threatened
Nationally Critical
Nationally Endangered
Nationally Vulnerable
At Risk
Declining
Recovering
Relict
Naturally Uncommon
Not Threatened
Introduced and Naturalised
Figure 17 Classification scheme underlying the New Zealand Threat Classification System (NZTCS) adapted from Townsend et al (2008)
The criteria used to determine which of these categories particular taxa are assigned to can be found in Townsend et al (2008) but for example a taxa classified as lsquoNationally Criticalrsquo would have either
50 Tier 1 Marine Biodiversity Statistic Ministry for Primary Industries
A a very small population A(1) fewer than 250 mature individuals A(2) no more than two sub-populations no more than 200 mature individuals in the larger sub-population A(3) Total area of occupancy no more than 1 ha
Or
B a small population with a high ongoing or predicted decline B(11) 250ndash1000 mature individuals predicted decline 50ndash70 B(21) no more than five sub-populations no more than 300 mature individuals in the largest sub-population predicted decline 50ndash70 B(31) Total area of occupancy no more than 10 ha predicted decline 50ndash70
Or
C a population (irrespective of size or number of sub-populations) with a very high ongoing or predicted decline of more than 70
The NZTCSrsquos long-term aim is to list all extant species by the threat of extinction Hitchmough (2013) lists 23 groups of taxa that have been reviewed to some extent additionally noting that algae freshwater invertebrates and marine fish had not been reviewed Taxonomic groups are assessed by a panel of experts It was suggested that each species group be assessed every three years although regular reporting has been inconsistent both within and between taxonomic groups Formal inclusion within a five yearly Tier 1 reporting statistic would provide both consistent funding and regularity of reporting across all taxonomic groups
A second concept lsquoprotected speciesrsquo is also used in New Zealand and includes most New Zealand seabirds marine mammals and marine reptiles nine fish including gropers sharks and rays and black corals stony corals hydrocorals and gorgonians These are generally taxa for which fishing or other human uses of the environment have the potential to reduce numbers through incidental capture habitat damage and modification or other direct or indirect effects The list of protected marine species in New Zealand includes taxa that have been assessed as threatened within the NZTCS but also many species that are not currently threatened Protected species are managed through the Fisheries Act 1996 (sections 8 9 and 15) the Marine Mammals Protection Act (1978) and the Wildlife Act (1953) A list of protected marine species is provided in Schedule 7A of the Wildlife Act with the most recent amendment to this list being in 2010 While outside the scope of a national reporting statistic this investigation highlights this disconnection between threatened and protected taxa better coordination of these lsquoconceptualrsquo listings is warranted for marine species with the suggestion that regular reporting cycles of Threatened species would lead to amendments to the Wildlife Act (1953) to add any new threatened species such that they receive the protections provided in this legislation
In the marine realm there have been reviews of marine mammals in 2009 (Baker et al 2010) seabirds as part of the birds reviews in 2008 (Miskelly et al 2008) and 2012 (Robertson et al 2013) marine reptiles as part of the reptiles reviews in 2009 (Hitchmough et al 2010) and 2012 (Hitchmough et al 2013) and marine invertebrates in 2009 (Freeman et al 2010) (Table 9) All New Zealand marine mammals seabirds and reptiles have been assessed (Baker et al 2010 Hitchmough et al 2013 Robertson et al 2013) but only 295 marine invertebrates were reviewed by Freeman et al (2010) (Table 9)
Although the coverage of marine taxa is currently very patchy and clearly biased towards the relatively large conspicuous taxa the NZTCS is both robust and valuable in terms of charting the long-term trends in conservation status of individual taxa and groups of taxa and also in terms of identifying taxa requiring specific conservation management Taken across the entire marine realm there are currently insufficient assessments across many taxonomic groups to justify the use of lsquonumber of threatened speciesrsquo as a Tier 1 statistic The challenge to assess every marine species as
Ministry for Primary Industries Tier 1 Marine Biodiversity Statistic 51
part of assessing all extant New Zealand taxa is truly daunting not least because there is simply insufficient reliable information on which to base an assessment for the vast majority of marine species ndash such taxa would be classified as lsquoData Deficientrsquo which would constitute the dominant classification Additionally it is difficult to see how the majority of marine taxa could be assessed in a timeframe of less than many decades without a substantial shift in resource allocation that would enable population sizes trends and distributions to be determined However theoretically and assuming that more taxonomic groups will be comprehensively assessed in the future the NZTCS and its concept of a lsquothreatened speciesrsquo could become a meaningful Tier 1 statistic for marine biodiversity perhaps restricting its use to well-defined species groups afforded comprehensive or near-comprehensive coverage
It is also worth noting that for the majority of marine taxa assessed to date which tend to be generally long-lived and slowly-reproducing species conservation status represents a relatively conservative statistic ndash the transition from one threat category to a lower threat category (ie an improvement in the conservation status of a particular taxa perhaps resulting in a reduction in the number of lsquothreatened speciesrsquo within a taxonomic group) would be likely to take many years perhaps even a few decades For such species the use of the number of threatened species as a useful Tier 1 statistic would only become valuable over similarly long timeframes
61 Threatened species summary statistic
We recommend for the threatened species metric that the number of threatened taxa in each threat category (both NZTCS and IUCN) is summarised for broad taxonomic groups (Marine mammals marine reptiles seabirds shorebirds marine fish marine invertebrates marine plants) including the proportion of each taxonomic group that have been assessed and the proportion of data deficient taxa (Table 9)
Five yearly reporting on this statistic should further include reporting on change in threat categories across taxonomic groups change in number of taxa evaluated change in number described as data deficient
52 Tier 1 Marine Biodiversity Statistic Ministry for Primary Industries
Table 9 Number of threatened marine taxa based on the New Zealand Threat Classification System
Taxonomic group Proportion or Extinct Data Nationally Nationally Nationally Declining Recovering Relict Naturally number assessed deficient critical endangered vulnerable uncommon
Marine mammals 100 (63) 13 5 3 Marine reptiles 100 (7) Seabirds 100 (145) 2 10 7 10 9 3 13 24 Shorebirds 100 (126) 13 1 7 3 6 4 3 4 Fish 218 37 2 52 Invertebrates 27 (307) 12 10 2 21 8 243 Algae 61 23 1 37
Taxonomic group Migrant Vagrant Coloniser Not Introduced and IUCN IUCN IUCN IUCN Critically threatened naturalised Combined Vulnerable Endangered Endangered
listings
Marine mammals 6 20 9 7 2 5 Marine reptiles 2 5 5 1 2 2 Seabirds 16 40 4 7 15 10 (9 Vagrant 1 5 (5 Vagrant)
Migrant) Shorebirds 7 65 2 10 1 1 1 (Vagrant) Fish 10 4 113 13 Invertebrates 11 Algae 2
Ministry for Primary Industries Tier 1 Marine Biodiversity Statistic 53
7 DISCUSSION
This preliminary investigation of marine biodiversity in New Zealand allows evaluation primarily of our current state of knowledge of marine biodiversity While more than 600 000 biodiversity records were available for this analysis it points out the bias in spatial coverage of our sampling of the marine environment with sampling coverage focussed on coastal areas and areas of particular interest for resource extraction (eg the Chatham Rise) This lack of information is in itself of interest for a publicly available statistic on New Zealandrsquos marine biodiversity in that it shows the public how much more there is to learn about our nationrsquos biodiversity Other aspects of New Zealandrsquos biodiversity such as high rates of endemism though unlikely to change are of interest to the general public in demonstrating why international experts consistently rank New Zealandrsquos waters as a hotspot for marine biodiversity
Statistical reporting on marine biodiversity at this early stage in the knowledge of our biodiversity can be used to prioritise areas for which we have poor information on biodiversity In addition some taxonomic groups are poorly covered in the biodiversity records in New Zealand and demonstration of this bias in spatial coverage can also be used to prioritise taxonomic expertise and training in areas for which there are gaps in New Zealandrsquos taxonomic expertise
Aspects of biodiversity that report on changes both increases in non-indigenous marine species and decreases (or increases) in abundance of particular taxa that result in change in threatened species classifications are also important metrics both for public consumption and for international reporting Elevation of these metrics to international reporting statistics will put higher priority on generation of this information and for integration of different New Zealand databases Public availability of government-funded datasets is mandated and Tier 1 reporting statistics can provide guidance on data format accessibility and quality control
8 KEYPOINTS FOR POLICYMAKERS
In general Tier 1 statistics should be of interest to the general public but also serve both an inward looking role for regional and national decision making and an outward role for international reporting and maintaining New Zealandrsquos reputation as a biodiverse and clean and green nation Most New Zealand citizens would be surprised to find out that New Zealand is the only OECD country that lacks regular national environmental reporting and the development of a marine biodiversity Tier 1 National Reporting statistics is one step toward providing consistent transparent reporting on our environment From a public perspective a Tier 1 Statistics also has the ability to assist the general public in understanding lsquowhat is marine biodiversityrsquo as well as why New Zealandrsquos marine biodiversity is internationally recognised for its high diversity and endemicity
Key management implications to support long-term cost-efficient generation of this statistic are in improved resourcing of New Zealand biodiversity databases and better integration across all New Zealand databases and data management portals within which they are stored and accessed For some metrics (eg threatened taxa) the change to a regular reporting schedule and synchronised reporting across different taxonomic groups will result in improved consistency among reporting standards and higher prioritisation of tasks to identify and report on threatened species trends Required for international reporting this will also contribute to New Zealandrsquos environmental reputation by resulting in fewer taxa which are labelled as either lsquonot assessedrsquo or lsquodata deficientrsquo
9 ACKNOWLEDGMENTS
This work was completed under Objective 1 of Ministry for Primary Industries project ZBD201201 We thank attendees of the December 2013 workshop and Mary Livingston (Ministry for Primary Industries) Debbie Freeman (Department of Conservation) Pierre Tellier (Ministry for the Environment) and David Harris (Statistics New Zealand) for further consultation during the course of
54 Tier 1 Marine Biodiversity Statistic Ministry for Primary Industries
the project We thank Judi Hewitt and Barb Hayden for consultation throughout the project We thank the Ministry for Primary Industries for thorough review of this report
10 REFERENCES
Adams NM (1972) The marine algae of the Wellington area Records of the Dominion Museum 8 43ndash98
Adams NM (1994) Seaweeds of New Zealand Canterbury University Press Christchurch New Zealand 360 p
Adams NM Conway E Norris RE (1974) The marine algae of Stewart Island Records of the Dominion Museum 8 185ndash245
Adams NM Nelson WA (1985) The marine algae of the Three Kings Islands National Museum of New Zealand Miscellaneous Series 13 1ndash29
Arnold A (2005) Shining a spotlight on the biodiversity of New Zealands marine ecoregion Experts workshop on marine biodiversity 27-28 May 2003 Wellington New Zealand World Wildlife Fund for Nature Wellington New Zealand 85 p
Baker CS Chilvers BL Constantine R du Fresne S Mattlin RH van Helden A Hitchmough R (2010) Conservation status of New Zealand marine mammals (suborders Cetacea and Pinnipedia) 2009 New Zealand Journal of Marine and Freshwater Research 44 101ndash115
Beaumont J Oliver M MacDiarmid A (2008) Mapping the values of New Zealands coastal waters 1 Environmental values Biosecurity New Zealand Technical Paper No 200816 73 p
Beaumont J Oliver M MacDiarmid A (2009) Mapping the values of New Zealands coastal waters 4 A meta-analysis of environmental values Biosecurity New Zealand Technical Paper No 201008 70 p
Booth J Nelson W Notman P (2006) NABIS Marine Plant Distributions Final Research Report for Ministry of Fisheries Research Project ZBD2004-05 Objective 1 NIWA April 2006 (Unpublished report held by Ministry for Primary Industries Wellington)
Broady PA Flint EA Nelson WA Cassie Cooper V de Winton MD Novis PM (2012) Phyla Chlorophyta and Charophyta green algae In Gordon DP (Ed) New Zealand Inventory of Biodiversity Volume Three Kingdoms Bacteria Protozoa Chromista Plantae Fungi Canterbury University Press pp 347ndash381
Broom JES Hart DR Farr TJ Nelson WA Neill KF Harvey AH Woelkerling WJ (2008) Utility of psbA and nSSU for phylogenetic reconstruction in the Corallinales based on New Zealand taxa Molecular Phylogenetics amp Evolution 46 958ndash973
Costello MJ Coll M Danovaro R Halpin P Ojaveer H Miloslavich P (2010) A Census of Marine Biodiversity Knowledge Resources and Future Challenges PLoS ONE 5(8) e12110 doi101371journalpone0012110
Dalen J Nelson WA (2013a) httpwwwtepapagovtnzSiteCollectionDocumentsTePapalist ofmarinemacroalgaeCHLOROPHYTApdf
Dalen J Nelson WA (2013b) httpwwwtepapagovtnzSiteCollectionDocumentsTePapalist ofmarinemacroalgaeOchrophytapdf
Dalen J Nelson WA (2013c) httpwwwtepapagovtnzSiteCollectionDocumentsTePapalist ofmarinemacroalgaeRhodophytapdf
Farr T Broom J Hart D Neill K Nelson W (2009) Common coralline algae of northern New Zealand an identification guide NIWA Information Series 70 249 p
Ministry for Primary Industries Tier 1 Marine Biodiversity Statistic 55
Freeman DJ Marshall BA Ahyong ST Wing SR Hitchmough RA (2010) Conservation status of New Zealand marine invertebrates 2009 New Zealand Journal of Marine and Freshwater Research 44 129ndash148
Gordon DP (ed) (2009) New Zealand inventory of biodiversity Volume 1 Kingdom Animalia Radiata Lopotrochozoa Deuteromstomia 648 p
Gordon DP (ed) (2010) New Zealand inventory of biodiversity Volume 2 Kingdom Animalia Chaetognatha Ecdysozoa Ichnofossils 528 p
Gordon DP (ed) (2012) New Zealand inventory of biodiversity Volume 3 Kingdoms Bacteria Protozoa Chromista Plantae Fungi 616 p
Gordon DP Beaumont J MacDiarmid A Robertson DA Ahyong ST (2010) Marine biodiversity of Aotearoa New Zealand PLoS ONE 5(8) e10905 Doi101371journalpone0010905
Harper M Cassie Cooper V Chang FH Nelson W Broady P (2012) Phylum Ochrophyta brown and golden-brown algae diatoms silicoflagellates and kin In Gordon DP (ed) New Zealand Inventory of Biodiversity Volume Three Kingdoms Bacteria Protozoa Chromista Plantae Fungi Canterbury University Press pp 114ndash163
Harvey A Woelkerling W Farr T Neill K Nelson W (2005) Coralline algae of central New Zealand an identification guide to common crustose species NIWA Information Series 57 145 p
Hay CH Adams NM Parsons MJ (1985) The marine algae of the subantarctic islands of New Zealand National Museum of New Zealand Miscellaneous Series 11 1ndash70
Heesch S Broom J Neill K Farr T Dalen J Nelson W (2007) Genetic diversity and possible origins of New Zealand populations of Ulva Final Research Report for Ministry of Fisheries Research Project ZBS2004-08 203 p (Unpublished report held by MPI Wellington)
Heesch S Broom JE Neill K Farr T Dalen J Nelson WA (2009) Ulva Umbraulva and Gemina genetic survey of New Zealand Ulvaceae reveals diversity and introduced species European Journal of Phycology 44 143ndash154
Hewitt JE Bell R Cummings V Currie K Ellis J Francis M Froude V Gorman R Hall J Inglis G MacDiarmid A Mills G Pinkerton M Schiel D Swales A Law C Smith M McBride G Thompson D Torres L Tuck I Wing S Wood B (2014) Development of a National Marine Environment Monitoring Programme (MEMP) New Zealand Aquatic Environment and Biodiversity Report No 141
Hitchmough R (2013) Summary of changes to the conservation status of taxa in the 2008ndash11 New Zealand threat classification system listing cycle New Zealand threat classification series 1 Department of Conservation Wellington 20 p
Hitchmough R Anderson P Barr B Monks J Lettink M Reardon J Tocher M Whitaker T (2013) Conservation status of New Zealand reptiles 2012 New Zealand threat classification series 2 Department of Conservation Wellington 16 p
Hitchmough RA Hoare JM Jamieson H Dewman D Tocher MD Anderson PJ Lettink M Whitaker AH (2010) Conservation status of New Zealand reptiles 2009 New Zealand Journal of Zoology 37 203ndash224
MacDiarmid A (editor) (2007) The Treasures of the Sea Ngā Taonga a Tangaroa A Summary of Biodiversity in the New Zealand Marine Ecoregion Wellington New Zealand WWF-New Zealand
MacDiarmid A Oliver M Beaumont J (2008) Environmental value mapping Supplementary information to MAF Biosecurity New Zealand Technical Paper No 200816 Biosecurity New Zealand Technical Paper No 200816 26 p
56 Tier 1 Marine Biodiversity Statistic Ministry for Primary Industries
Miskelly CM Dowding JE Elliott GP Hitchmough RA Powlesland RG Robertson HA Sagar PM Scofield RP Taylor GA (2008) Conservation status of New Zealand birds 2008 Notornis 55 117-135
Molloy J Bell B Clout M de Lange P Gibbs G Given D Norton D Smith N Stephens T (2002) Classifying species according to threat of extinction A system for New Zealand Threatened species occasional publication 22 Department of Conservation Wellington 26 p
Neale D Nelson W (1998) Marine algae of the west coast South Island New Zealand Tuhinga 10 87ndash118
Neill K DrsquoArchino R Farr T Nelson W (2012) Macroalgal diversity associated with soft sediment habitats in New Zealand New Zealand Aquatic Environment and Biodiversity Report 87 127 p
Nelson WA (2012) Phylum Rhodophyta red algae In Gordon DP (ed) New Zealand Inventory of Biodiversity Volume Three Kingdoms Bacteria Protozoa Chromista Plantae Fungi Canterbury University Press Pp 327ndash346
Nelson WA Adams NM (1984) Marine algae of the Kermadec Islands National Museum of New Zealand Miscellaneous Series 10 1ndash29
Nelson WA Adams NM (1987) Marine algae of the Bay of Islands area National Museum of New Zealand Miscellaneous Series 16 1ndash47
Nelson WA Adams NM Fox JM (1992) Marine algae of the northern South Island National Museum of New Zealand Miscellaneous Series 26 1ndash80
Nelson WA Adams NM Hay CH (1991) Marine algae of the Chatham Islands National Museum of New Zealand Miscellaneous Series 23 1ndash58
Nelson WA Dalen JL (in press) Marine macroalgae of the Kermadec Islands Bulletin of the Auckland Museum
Nelson WA Dalen J Neill KF (2013) Insights from natural history collections analysing the New Zealand macroalgal flora using herbarium data PhytoKeys 30 1ndash21
Nelson WA Villouta E Neill K Williams GC Adams NM Slivsgaard R (2002) Marine macroalgae of Fiordland Tuhinga 13 117ndash152
Pinkerton MH (2010) Headline indicators for the New Zealand ocean Research report for Coasts amp Oceans IO2 project NIWA Wellington 43 p
Robertson HA Dowding JE Elliott GP Hitchmough RA Miskelly CM OrsquoDonnell CFJ Powlesland RG Sagar PM Scofield RP Taylor GA (2013) Conservation status of New Zealand birds 2012 New Zealand threat classification series 4 Department of Conservation Wellington 22 p
South GR Adams NM (1976) Marine algae of the Kaikoura coast National Museum of New Zealand Miscellaneous Series 1 1ndash67
Statistics New Zealand 2007 Principles and protocols for producers of Tier 1 Statistics httpunstatsunorgunsddnssdocs-nqaftier1-principles-and-protocolspdf
Thiers B (2014 ndash continuously updated) Index herbariorum a global directory of public herbaria and associated staff New York Botanical Gardenrsquos Virtual Herbarium Available at httpsweetgumnybgorgih
Thrush SF Hewitt JE Lundquist C Townsend M Lohrer AM (2011) A strategy to assess trends in the ecological integrity of New Zealandrsquos marine ecosystems NIWA Client report No HAM2011-140 prepared for the Department of Conservation 58 p
Townsend AJ de Lange PJ Duffy CAJ Miskelly CM Molloy J Norton DA (2008) New Zealand threat classification system manual Department of Conservation Wellington 35 p
Ministry for Primary Industries Tier 1 Marine Biodiversity Statistic 57
Tuck ID Pinkerton MH Tracey DM Anderson OA Chiswell SM (2013) Ecosystem and environmental indicators for deepwater fisheries New Zealand Aquatic Environment and Biodiversity Report 127 p
58 Tier 1 Marine Biodiversity Statistic Ministry for Primary Industries
11 APPENDICES
List of datasets held within the OBIS South Western Pacific Node (httpiobisorg) Note that other international datasets have records within the New Zealand EEZ
Dataset name
Original Data Provider
Contact
Abstract
Geographic coverage
Temporal coverage
records
taxa
Dataset name
Original Data Provider
Contact
Abstract
Geographic coverage
Temporal coverage
records
taxa
Dataset name
Original Data Provider
Contact
Abstract
Geographic coverage
Temporal coverage
records
taxa
Dataset name
Citation
Original Data Provider
Contact
Abstract
Geographic coverage
Temporal coverage
records
International Polar Year and Census of Antarctic Marine Life subset (South Western Pacific OBIS)
NIWA
Kevin Mackay (kmackayniwaconz)
Biological data from the IPY-CAML voyage (TAN0802) by the RV Tangaroa The TAN0802 voyage departed from Wellington New Zealand on Jan 26th 2008 and returned to Wellington New Zealand on Mar 21st 2008 The survey was concentrated mainly on the Ross Sea and thee waters around Scott and the Balleny Islands Biological data was collected using a variety of gear including bottom trawls beam trawls epibenthic sleds Van Veen grabs and MOCNESS tows
Latitude -76833 to -66698 Longitude -17996 to 179989
2004 to 2008
7219
1285
Modern foraminifera in the New Zealand EEZ
NIWA
Kevin Mackay (kevinmackayniwaconz)
Biodiversity data of the modern foraminifera in the New Zealand EEZ sourced from Dr Bruce Hayward at Geomarine Research These data come from two projects (1) modern deep-sea (100-5000 m water depth) foraminifera and (2) a 7 year project (1991-1998) on the biodiversity and ecological distribution of modern brackish and shallow-water (0-100 m) foraminifera around New Zealand
Latitude -61767 to -294 Longitude -178818 to 179996
Could not be determined
16986
553
NIWA plankton
NIWA
Kevin Mackay (kevinmackayniwaconz)
Plankton (mainly zooplankton) observation data held at NIWA
Latitude -46273 to -3912 Longitude 1692 to 179168
1976 to 1993
4624
221
New Zealand Coralline Algae
Farr T Broom J Hart D Neill K Nelson W (2009) Common coralline algae of northern New Zealand an identification guide NIWA Information Series No 70
NIWA
Kevin Mackay (kmackayniwaconz)
Occurrence of New Zealands non-geniculate coralline flora This dataset is based on two identification guides published by NIWA and funded through the Ministry of Fisheries Biodiversity Programme in order to make information accessible to marine scientists and resource managers and to improve understanding of these algae
Latitude -5255 to -34418 Longitude 169183 to 178753
1916 to 2007
947
Ministry for Primary Industries Tier 1 Marine Biodiversity Statistic 59
taxa
Dataset name
Original Data Provider
Contact
Abstract
Geographic coverage
Temporal coverage
records
taxa
Dataset name
Original Data Provider
Contact
Abstract
Geographic coverage
Temporal coverage
records
taxa
Dataset name
Original Data Provider
Contact
Abstract
Geographic coverage
Temporal coverage
records
taxa
Dataset name
Original Data Provider
Contact
Abstract
Geographic coverage
Temporal coverage
records
Dataset name
Citation
Original Data Provider
Contact
Abstract
Geographic coverage
34
South Western Pacific Regional OBIS Data All Sea Bio Subset (South Western Pacific OBIS)
South Western Pacific OBIS
Steve Massey (smasseyniwaconz)
This is the All Sea Bio Subset of the Full OBIS Provider for NIWA For the Full dataset please refer to obismaster provider
Latitude -82375 to 5585 Longitude -180 to 180
1897 to 2005
41925
3488
South Western Pacific Regional OBIS Data Asteroid Subset (South Western Pacific OBIS)
South Western Pacific OBIS
Steve Massey (smasseyniwaconz)
This is the Asteroid Subset of the Full OBIS Provider for NIWA For the Full dataset please refer to obismaster provider
Latitude -5501 to -2522 Longitude -17999 to 180
1956 to 2003
2294
145
South Western Pacific Regional OBIS Data Bio Ross Subset (South Western Pacific OBIS)
South Western Pacific OBIS
Steve Massey (smasseyniwaconz)
This is the Ross Bio Subset of the Full OBIS Provider for NIWA For the Full dataset please refer to obismaster provider
Latitude -72343 to -65408 Longitude 160887 to 17332
2004 to 2004
1166
343
South Western Pacific Regional OBIS Data Bryozoan Subset (South Western Pacific OBIS)
South Western Pacific OBIS
Steve Massey (smasseyniwaconz)
This is the Bryozoan Subset of the Full OBIS Provider for NIWA
Latitude -53 to 33767 Longitude -179532 to 179668
1874 to 2003
6348
South Western Pacific Regional OBIS Data Habitat-forming Cold Water Corals Subset (South Western Pacific OBIS)
Tracey DM Rowden AA Mackay KA and Compton T 2011 Habitat-forming cold-water corals show affinity for seamounts in the New Zealand region Marine Ecology Progress Series Vol 430 1-22
South Western Pacific OBIS
Kevin Mackay (kmackayniwaconz)
This is the Habitat-forming Cold Water Corals Subset of the Full OBIS Provider for NIWA It contains field (observational) data from research surveys and fishing industry trawls conducted in waters around New Zealand
Latitude -56317 to -26715 Longitude -179991 to 180
60 Tier 1 Marine Biodiversity Statistic Ministry for Primary Industries
Temporal coverage
records
taxa
Dataset name
Original Data Provider
Abstract
Geographic coverage
Temporal coverage
records
taxa
Dataset name
Original Data Provider
Contact
Abstract
Geographic coverage
Temporal coverage
records
taxa
Dataset name
Citation
Original Data Provider
Contact
Abstract
Geographic coverage
Temporal coverage
records
taxa
1954 to 2009
631
5
South Western Pacific Regional OBIS Data Specify Subset (South Western Pacific OBIS)
South Western Pacific OBIS
This is the Specify Subset of the Full OBIS Provider for NIWA
Latitude -835 to 52033 Longitude -180808 to 180
1900 to 2006
14023
2371
South Western Pacific Regional OBIS Data provider for the NIWA Marine Biodata Information System (South Western Pacific OBIS)
South Western Pacific OBIS
Steve Massey (smasseyniwaconz)
This is the cut down provider for the NZOBIS provider As at November 2005 this is a work in progress - data is being compiled and added to the NIWA Marine Biodiversity Information System (MBIS - a data warehouse) The data will cover an area from Antarctica to Fiji Data so far available are primarily the results of a series of research trawl surveys carried out as part of New Zealands Ministry of Fisheries data collection to support fisheries management within the NZ Exclusive Economic Zone (EEZ) plus data from several decades of marine invertebrate research sampling in the NZ Exclusive Economic Zone
Latitude -54185 to 0041 Longitude -18095 to 179999
1961 to 2005
377927
437
Xanthichthys greenei a new species of triggerfish (Balistidae) from the Line Islands
Pyle R Earle J (2013) Xanthichthys greenei a new species of triggerfish (Balistidae) from the Line Islands Biodiversity Data Journal 1 e994 DOI 103897BDJ1e994
NIWA
Kevin Mackay (kmackayniwaconz)
Xanthichthys greenei n sp is described from six specimens 97-154 mm standard length (SL) collected from mesophotic coral ecosystems (90-100 m) at Kiritimati (Christmas Island) Line Islands part of the Republic of Kiribati in the Central Pacific Of the six species of Xanthichthys it is most similar to the Atlantic X ringens and the Indo-West Pacific X lineopunctatus sharing with these species the character of three pigmented cheek grooves It is distinctive in its low body scale row count (33-35 other Xanthichthys species with 39 or more) small size (maximum SL 154 mm other species over 225 mm) and color pattern of scattered dark spots sub-dorsally and no other spots or lines on body
Latitude 1888 to 2016 Longitude -157555 to -157486
2005 to 2005
5
1
Ministry for Primary Industries Tier 1 Marine Biodiversity Statistic 61
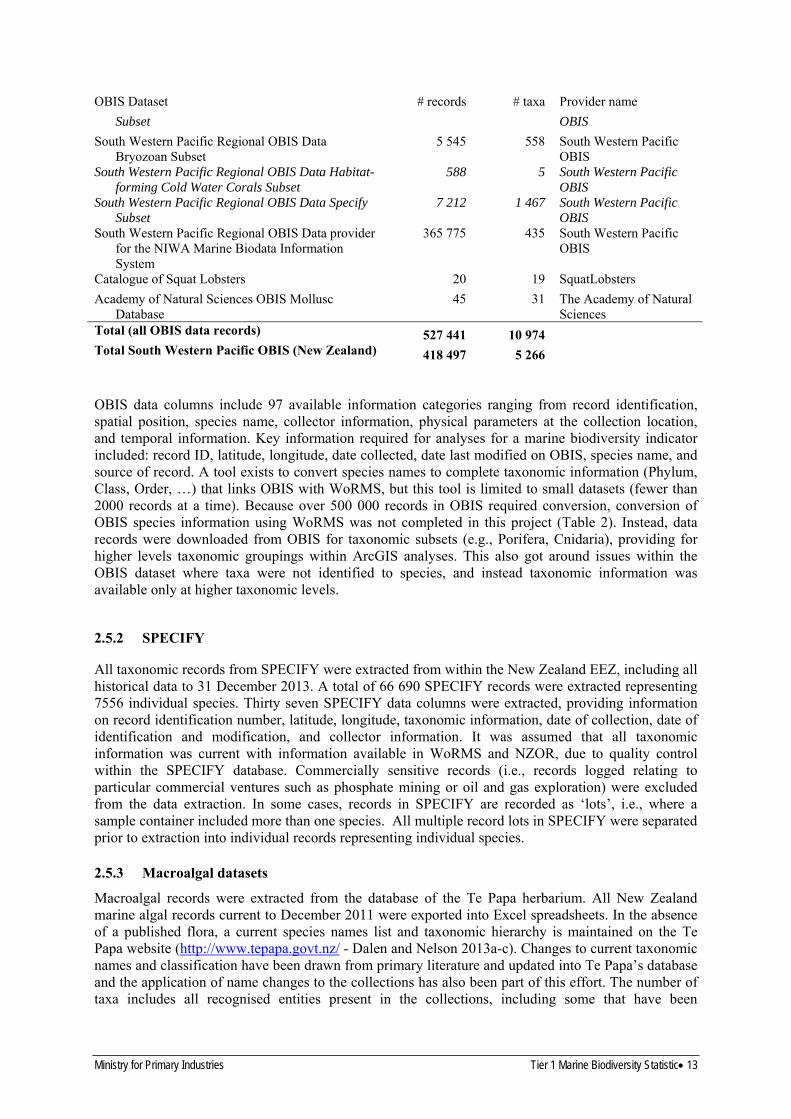
OBIS Dataset
Subset
South Western Pacific Regional OBIS Data Bryozoan Subset
South Western Pacific Regional OBIS Data Habitat-forming Cold Water Corals Subset
South Western Pacific Regional OBIS Data Specify Subset
South Western Pacific Regional OBIS Data provider for the NIWA Marine Biodata Information System
Catalogue of Squat Lobsters
Academy of Natural Sciences OBIS Mollusc Database
records
5 545
588
7 212
365 775
20
45
taxa
558
5
1 467
435
19
31
Provider name
OBIS
South Western Pacific OBIS South Western Pacific OBIS South Western Pacific OBIS South Western Pacific OBIS
SquatLobsters
The Academy of Natural Sciences
Total (all OBIS data records) 527 441 10 974 Total South Western Pacific OBIS (New Zealand) 418 497 5 266
OBIS data columns include 97 available information categories ranging from record identification spatial position species name collector information physical parameters at the collection location and temporal information Key information required for analyses for a marine biodiversity indicator included record ID latitude longitude date collected date last modified on OBIS species name and source of record A tool exists to convert species names to complete taxonomic information (Phylum Class Order hellip) that links OBIS with WoRMS but this tool is limited to small datasets (fewer than 2000 records at a time) Because over 500 000 records in OBIS required conversion conversion of OBIS species information using WoRMS was not completed in this project (Table 2) Instead data records were downloaded from OBIS for taxonomic subsets (eg Porifera Cnidaria) providing for higher levels taxonomic groupings within ArcGIS analyses This also got around issues within the OBIS dataset where taxa were not identified to species and instead taxonomic information was available only at higher taxonomic levels
252 SPECIFY
All taxonomic records from SPECIFY were extracted from within the New Zealand EEZ including all historical data to 31 December 2013 A total of 66 690 SPECIFY records were extracted representing 7556 individual species Thirty seven SPECIFY data columns were extracted providing information on record identification number latitude longitude taxonomic information date of collection date of identification and modification and collector information It was assumed that all taxonomic information was current with information available in WoRMS and NZOR due to quality control within the SPECIFY database Commercially sensitive records (ie records logged relating to particular commercial ventures such as phosphate mining or oil and gas exploration) were excluded from the data extraction In some cases records in SPECIFY are recorded as lsquolotsrsquo ie where a sample container included more than one species All multiple record lots in SPECIFY were separated prior to extraction into individual records representing individual species
253 Macroalgal datasets
Macroalgal records were extracted from the database of the Te Papa herbarium All New Zealand marine algal records current to December 2011 were exported into Excel spreadsheets In the absence of a published flora a current species names list and taxonomic hierarchy is maintained on the Te Papa website (httpwwwtepapagovtnz - Dalen and Nelson 2013a-c) Changes to current taxonomic names and classification have been drawn from primary literature and updated into Te Paparsquos database and the application of name changes to the collections has also been part of this effort The number of taxa includes all recognised entities present in the collections including some that have been
Ministry for Primary Industries Tier 1 Marine Biodiversity Statistic 13
recognised as distinct at a family genus or species level but are currently unnamed It is important to note that the publicly accessible flora lists (Dalen and Nelson 2013a-c) include only published names including some published tag names
not all published taxa are represented in the WELT collections and there are more taxa recognised as being distinct than have been published currently
The Green algae or Division Chlorophyta includes data for three classes Prasinophyceae Ulvophyceae and Trebouxiophyceae (There are no marine macroalgal Chlorophyceae represented in Te Paparsquos collections) The Brown algae or Ochrophyta include members of the classes Chrysomerophyceae Xanthophyceae and Phaeophyceae and the Red algae or Rhodophyta are represented by members of four classes Compsopogonophyceae Stylonematophyceae Bangiophyceae and Florideophyceae Eleven data columns were extracted providing information on record and taxonomic identification collection location and date and collector for each of 19 422 records representing a total of 1028 individual species
254 Geoprocessing
Records were provided in the geospatial datum WGS84 (World Geodetic System 1984) which is a standard projection and used by GPS (Global Positioning System) with which the sampling location of many species records are located All records (OBIS SPECIFY Te Papa) were provided in WGS84 projection and no conversions were required A total of 608 280 records were available from the combined OBIS SPECIFY and Te Papa datasets
ArcGIS standard geoprocessing tools were used to calculate sums of records within a custom grid beginning at the northwest corner of the NZ EEZ Grids were created for 1 km times 1 km grid cells 10 km times 10 km grid cells and 100 km times 100 km grid cells To calculate the number of species from the record database we used the Marine Geospatial Ecology Toolbox (MGET) MGET is a collection of free open source software tools that provide standard geoprocessing for marine ecology including tools to convert OBIS records to species richness (httpmgelenvdukeedumget)
Additional calculations were investigated that could allow for evaluation of sampling effort bias when determining patterns of species richness We investigated ES50 (estimated species in random 50 samples) Chao statistics (estimates species richness based on samples in spatial unit) and calculation of the number of phyla per grid cell as ways of evaluating sampling effort bias and completeness of the species record
However we determined that additional calculations using any of these tools were not cost-effective based on current knowledge of biodiversity and were unlikely to provide information not already available in plots of spatial patterns in species richness which demonstrate nearly identical spatial patterns in species richness as those in species records (see Section 3) The sampling bias is substantially skewed with the majority of 100 km times 100 km cells having fewer than 100 total records and few areas (coastal areas Chatham Rise) with high sampling effort (more than 1000 records) As such the more complex metrics that reduce sampling bias are unable to overcome the substantial bias in sampling effort and would show similar patterns to that of the number of records and the number of species In future should sampling effort resolve gaps in spatial knowledge these additional calculations would be worth exploring
3 SPECIES RICHNESS
Costello et al (2010) reported species richness for New Zealand as the combined number of species recorded per total area of the New Zealand EEZ The proportion of all species within each of fourteen major taxonomic groupings (eg Crustacea Mollusca) was also reported showing similarities across most bioregions in dominance of marine biodiversity by Crustacea Mollusca and Pisces (Costello et al 2010) The proposed reporting statistic for species richness would thus adapt the Costello et al
14 Tier 1 Marine Biodiversity Statistic Ministry for Primary Industries
(2010) statistic to report on the number of records per area at a sub-national scale ideally 1 km times 1 km
For the species richness reporting statistic we determined that this metric could provide information relating to two aspects of marine biodiversity What are national estimates of marine biodiversity in terms of the total number of species accumulated since records start across taxonomic groups
What are spatial trends in this national estimate of biodiversity
For the species richness metric we were unable to determine temporal trends in biodiversity at the broader NZ EEZ scale as records of species are given as presence only records (ie not including information on what is not found during a sampling event) Temporal trends in biodiversity would require structured repeated sampling of species diversity to determine whether increases or decreases in species richness were occurring In effect the available data for species richness at a national scale is contributing information on our state of knowledge of marine biodiversity but it cannot currently provide information on the status or trends in marine biodiversity
To determine optimal reporting of species richness we discuss recommendations for Spatial scale of reporting Datasets to be included Temporal scale of reporting Taxonomic resolution Reporting of Records vs Species
31 Spatial scale of reporting
While the proposed reporting metric was for species richness within 1 km times 1 km grid cells the availability of species records suggested that coarser resolution was required in order to adequately quantify and view species richness due to the sparsity of records throughout much of the EEZ (Figure 1) Comparisons between spatial scales (10 km times 10 km Figure 2 100 km times 100 km Figure 3) suggest that species records are too sparse for adequate reporting at a scale less than 100 km times 100 km
Even at the 100 km times 100 km scale roughly half (269 of 540 grid cells) had low numbers of species records (fewer than 50) and number of species (Figure 3 Figure 4 Table 3) however patterns of species richness in locations with high sampling effort (ie coastal cells Chatham Rise) were evident at this highest scale although these patterns are likely to be due primarily to sampling effort at this point in our understanding of New Zealandrsquos biodiversity Patterns were consistent between species records and species richness however because of the spatial bias in sampling effort it is premature at this stage to confirm that these patterns represent hotspots of biodiversity (Figure 3 Figure 4)
Comparisons between the number of species and the number of records in each cell indicate linear correlations between sampling effort and the number of species suggesting that species diversity information is not yet sufficient to reach asymptotic levels of species present for most taxa although it is likely that species richness is reaching an asymptote with increasing sampling effort for one better known group of ray-finned fishes (Actinypterygiae) (Table 3 Figure 5)
Ministry for Primary Industries Tier 1 Marine Biodiversity Statistic 15
Figure 1 Point locations of all records across all biodiversity databases
16 Tier 1 Marine Biodiversity Statistic Ministry for Primary Industries
Figure 2 Number of taxonomic records per grid cell from all databases at grid scale of 10 km times 10 km
Ministry for Primary Industries Tier 1 Marine Biodiversity Statistic 17
Figure 3 Number of taxonomic records per grid cell from all databases at grid scale of 100 km times 100 km
18 Tier 1 Marine Biodiversity Statistic Ministry for Primary Industries
Figure 4 Number of species recorded per grid cell from all databases at grid scale of 100 km times 100 km
Ministry for Primary Industries Tier 1 Marine Biodiversity Statistic 19
Table 3 Distribution of records and number of species from all databases across grid cells
Number Number of species Number of records
0 60 60
1 63 40
2 29 21
3 12 11
4 11 8
5 7 12
6ndash10 23 29
11ndash20 36 32
21ndash30 28 22
31ndash50 30 34
51ndash100 73 37
101ndash500 112 79
gt501ndash1000 48 49
gt1001ndash5000 8 61
gt5001ndash10000 0 34
gt10000 0 11
Total cells 540 540
Max value 1648 22986
20 Tier 1 Marine Biodiversity Statistic Ministry for Primary Industries
All taxa 1800
1600
1400s
1200
specie
1000
Numberof
800
600
400
200
0 0 5000 10000 15000 20000 25000
Number of records
Fish 180
160
140
120
100
80
60
40
20
0 0 5000 10000 15000 20000 25000
Number of records
Figure 5 Species richness (number of species recorded per grid cell) from all taxonomic records at grid scale of 100 km times 100 km versus number of records for all taxonomic groups (top) Actinypterygiae (ray-finned fishes) (bottom)
32 Datasets to be included
While the initial contract objectives suggested using datasets accessible using Census of Marine Life OBIS we recognised that a number of high quality national datasets either were not uploaded to OBIS or had updated versions held by NIWA or Te Papa that were planned for future upload Additional international datasets that may not be subject to the same quality control as New Zealand datasets (although see Box 1 for OBIS requirements for data quality) are available on OBIS while some national expert taxonomists were hesitant to include these datasets due to their uncertain quality plots of spatial distribution of records comparing New Zealand held datasets (including those held on OBIS) and other international datasets held on OBIS show differences in spatial coverage with other
Numberofspecies
Ministry for Primary Industries Tier 1 Marine Biodiversity Statistic 21
international OBIS datasets covering many regions of the EEZ that are not covered in New Zealand datasets (Figure 6 Figure 7)
International (non-New Zealand) OBIS records include approximately 20 of all species records in the New Zealand EEZ (Table 2) and most are described as being quality collections from other reputable national and international sources Patterns of species richness between New Zealand datasets and all international OBIS datasets were similar to those of number of records (Figure 8 Figure 9) As many New Zealand datasets are regularly updated and are planned for upload to OBIS it is assumed that future calculations of this statistic are likely to require only access of OBIS datasets making the data extraction process simpler In the meantime we opted to include both New Zealand and all other international datasets available on OBIS for the Tier 1 Marine Biodiversity calculations
22 Tier 1 Marine Biodiversity Statistic Ministry for Primary Industries
Figure 6 Number of taxonomic records per grid cell from OBIS taxonomic databases (omitting New Zealand records) at grid scale of 100 km times 100 km
Ministry for Primary Industries Tier 1 Marine Biodiversity Statistic 23
Figure 7 Number of taxonomic records per grid cell from New Zealand taxonomic databases at grid
scale of 100 km times 100 km
24 Tier 1 Marine Biodiversity Statistic Ministry for Primary Industries
Figure 8 Species richness (number of species recorded per grid cell) from OBIS taxonomic databases
(non-New Zealand records) at grid scale of 100 km times 100 km
Ministry for Primary Industries Tier 1 Marine Biodiversity Statistic 25
Figure 9 Species richness (number of species recorded per grid cell) from New Zealand taxonomic databases at grid scale of 100 km times 100 km
26 Tier 1 Marine Biodiversity Statistic Ministry for Primary Industries
33 Temporal scale of reporting
For a Tier 1 Marine Biodiversity statistic to be useful it must be able to show changes over the proposed scale of reporting in this case five yearly Again at this stage in our knowledge of marine biodiversity in New Zealand we are focussed on the process of gathering data as representing New Zealandrsquos commitment to knowledge of the biodiversity of its marine estate As such it is expected that for a number of five yearly reports only increases in our knowledge are likely ie it is impossible to get a decrease in biodiversity using either the number of records or the number of species as the data available are not designed to determine changes in species abundance or presenceabsence rather they are recording presence only records With increased focussed monitoring of the marine environmental realm it should be possible to incorporate changes in species diversity into this statistic at a later stage based on site-specific monitoring schemes
To investigate the likelihood of a five year reporting period being long enough to show differences in the species richness metric we investigated the number of records uploaded to OBIS (including some New Zealand datasets) to determine whether sufficient new records are provided over a roughly similar timeframe (eight yearly 2006ndash2013) (Table 4) The number of lsquonewrsquo records varied across taxa with particular groups (eg Bacteria Plantae) having large number of records uploaded in 2006ndash 2013 (Table 4) This pattern should be expected in the future for other groups (eg Bryozoa Mollusca Chordata (eg fish) when existing New Zealand datasets including some datasets previously not available on OBIS are revised and uploaded to OBIS with large instantaneous increases in the number of records for particular taxonomic groups
Table 4 Temporal distribution of records in OBIS comparing all records to more recently uploaded or modified records from 2006ndash2013
Taxonomic group No records on No records after 2005 of records uploaded OBIS Dec 2013 on OBIS Dec 2013 between 2006 and 2013
Kingdom Animalia 429 771 9 120 212 Annelida 7 327 60 082 Arthropoda 14 324 940 638 Brachiopoda 1 509 2 013 Bryozoa 8 121 2 002 Cephalorhynca 35 0 000 Chaetognatha 600 3 050 Chordata 354 109 7 134 201 Cnidaria 7 396 278 376 Ctenophora 36 0 000 Echinodermata 11 170 235 210 Echiura 20 0 000 Entoprocta 1 0 000 Hemichordata 16 0 000 Mollusca 23 199 413 178 Myxozoa 3 0 000 Nematoda 36 0 000 Nemertea 24 0 000 Phoronida 10 0 000 Plathyhelminthes 12 0 000 Porifera 1 254 60 478 Rotifera 24 0 000 Sipuncula 131 0 000
Domain Bacteria 64 812 64 811 9999 Kingdom Chromista 31 974 11 003 Kingdom Plantae 776 297 3827 Kingdom Protozoa 108 0 000
Ministry for Primary Industries Tier 1 Marine Biodiversity Statistic 27
34 Taxonomic resolution
The number of records and number of species differ substantially between taxonomic groups with many smaller phyla having few or no records in the New Zealand EEZ (Table 5 Table 6) Dominant taxonomic groups in terms of number of total records include in order of abundance of species records 1) Chordata (primarily fishes) 2) Bacteria 3) Chromista (brown algae and other Chromista) 4) Arthropoda 5) Mollusca 6) Echinodermata 7) Cnidaria 8) Plantae (primarily red and green algae) 9) Bryozoa 10) Annelida 11) Porifera and 12) Brachiopoda All other taxonomic groups had fewer than 1000 total records across all datasets (Table 5) In terms of number of species the proportional representation of taxonomic groups showed different rankings with Chordata and Bacteria both having the highest numbers of records but ranked much lower in terms of number of species The ranking for total number of species were 1) Arthropoda 2) Mollusca 3) Cnidaria 4) Chromista (brown algae and other Chromista) 5) Echinodermata 6) Porifera 7) Bryozoa 8) Chordata (primarily fishes) 9) Annelida 10) Plantae (primarily red and green algae) 11) Bacteria and 12) Brachiopoda
28 Tier 1 Marine Biodiversity Statistic Ministry for Primary Industries
Table 5 Taxonomic distribution of records used in Marine Biodiversity Tier 1 Statistic calculations comparing contributions of records between broad database sources
KINGDOM
Phylum Subphylum Class or Subclass
Order
Suborder
Common name
OBIS SPECIFY Te Papa
No Records
Total
ARCHAEA 0 0 0 0
BACTERIA Bacteria including cyanobacteria
64 812 0 0 64 812
FUNGI 0 0 0 0
PROTOZOA Dinoflagellates foraminifera
108 171 0 279
PLANTAE
Chlorophyta
Rhodophyta
Other
Green algae
Red algae
Other flowering plants (eg mangrove seagrass saltmarsh)
776
121
647
8
0 14 842
2 213
12 629
0
15 618
2 334
13 276
8
CHROMISTA
Ochrophyta
Other
Brown algae
Other Chromista
31 974
569
31 405
0 4 584
4 580
4
36 558
5 149
31 409
ANIMALIA
Acanthocephala
Annelida
Arthropoda Crustacea
Thorny-headed worms
Segmented worms
Crustaceans
0
7 327
14 324
0
3 050
16 997
0
10 377
31 321
Ministry for Primary Industries Tier 1 Marine Biodiversity Statistic 29
KINGDOM Order Common name No Records
Phylum Subphylum Class or Subclass Suborder OBIS SPECIFY Te Papa Total
Arthropoda Non-Crustacea Marine spiders and mites 401 363 764
Brachiopoda Lamp shells 1 509 1 819 3 328
Bryozoa Moss animals sea mats 8 121 2 729 10 850
Cephalorhyncha 35 0 35
Chaetognatha Arrow worms 600 12 612
Chordata Vertebrata Mammalia Cetacea Whales dolphins 1 128 1 128 porpoises
Chordata Vertebrata Mammalia Carnivora Sea lions seals 116 116
Chordata Vertebrata Aves Birds 462 462
Chordata Vertebrata Reptilia Reptiles 1 1
Chordata Vertebrata Myxini Cephala- Hagfish lampreys 55 55 spidomorphi
Chordata Vertebrata Chondrichthyes Sharks and rays 0 0
Chordata Vertebrata Actinopterygii Ray-finned fish 273 467 273 467
Chordata Cephalochordata Lancelets 5 19 24
Chordata Tunicata Sea tulips 723 665 1 388
Cnidaria Sea anemones corals 7 396 12 800 20 196 jellyfish
Ctenophora Comb jellies 36 3 39
Cycliophora Small parasite 0 0 0
Dicyemida Small parasite 0 0 0
Echinodermata Sea stars brittle stars sea 11 170 16 146 27 316 urchins sea cucumbers
Echiura Spoon worms 20 59 79
Entoprocta Goblet worms 1 3 4
Gastrotricha Meiofauna 0 0 0
Gnathostomulida Jaw worms 0 0 0
Hemichordata Acorn worms 16 14 30 pterobranchs
Kinorhyncha Mud dragons 12 11 23
30 Tier 1 Marine Biodiversity Statistic Ministry for Primary Industries
KINGDOM Order Common name No Records
Phylum Subphylum Class or Subclass Suborder OBIS SPECIFY Te Papa Total
Loricifera Brush heads 0 0 0
Micrognathozoa Newly described phylum 0 0 0 not yet registered in WoRMS
Mollusca Molluscs 23 199 6 064 29 263
Myxozoa Small parasite 3 0 3
Nematoda Round worms 36 78 114
Nematomorpha Horsehair worms 0 0 0
Nemertea Ribbon worms 24 144 168
Orthonectida Small parasite 0 0 0
Phoronida Horseshoe worms 10 6 16
Placozoa Plate animals 0 0 0
Platyhelminthes Flat worms 12 24 36
Porifera Sponges 1 254 7 103 8 357
Rotifera Rotifers 24 0 24
Sipuncula Peanut worms 131 229 360
Tardigrada Water bears 0 0 0
Ministry for Primary Industries Tier 1 Marine Biodiversity Statistic 31
Table 6 Taxonomic distribution of species used in Marine Biodiversity Tier 1 Statistic calculations comparing contributions of species between broad databasesources
KINGDOM
Phylum
Class
Subphylum Subclass
Order
Suborder
Common name
OBIS SPECIFY Te Papa
No Species
Total
ARCHAEA 0 0 0 0
BACTERIA Bacteria including cyanobacteria
603 0 0 603
FUNGI 0 0 0 0
PROTOZOA Dinoflagellates foraminifera
8 32 0 40
PLANTAE
Chlorophyta
Rhodophyta
Spermatophyta
Green algae
Red algae
Other flowering plants (eg mangrove seagrass saltmarsh)
81
10
66
5
0 798
119
679
874
127
742
5
CHROMISTA
Ochrophyta
Other
Brown algae
Other Chromista
1 553
137
1 416
0 230
230
1 646
333
1 416
ANIMALIA
Acanthocephala
Annelida
ArthropodaCrustacea
Thorny-headed worms
Segmented worms
Crustaceans
7 787
0
671
1 457
7 577
411
1 866
12 213
0
932
2 399
32 Tier 1 Marine Biodiversity Statistic Ministry for Primary Industries
KINGDOM Class Order Common name No Species
Arthropodaother Marine spiders and mites 103 81 125
Brachiopoda Lamp shells 46 52 80
Bryozoa Moss animals sea mats 920 815 1 279
Cephalorhyncha 7 0 7
Chaetognatha Arrow worms 23 1 23
Chordata Vertebrata Mammalia Cetacea Whales dolphins 21 21 porpoises
Chordata Vertebrata Mammalia Carnivora Sea lions seals 3 3
Chordata Vertebrata Aves Birds 44 44
Chordata Vertebrata Reptilia Reptiles 1 1
Chordata Vertebrata Myxini Cephala- Hagfish lampreys 3 3 spidomorphi
Chordata Vertebrata Chondrichthyes Sharks and rays 0 0
Chordata Vertebrata Actinopterygii Ray-finned fish 783 783
Chordata Cephalochordata Lancelets 2 4 3
Chordata Tunicata Sea tulips 132 111 205
Cnidaria Sea anemones corals 967 1 140 1 662 jellyfish
Ctenophora Comb jellies 2 1 2
Cycliophora Small parasite 0 0 0
Dicyemida Small parasite 0 0 0
Echinodermata Sea stars brittle stars sea 786 1 071 1 418 urchins sea cucumbers
Echiura Spoon worms 8 5 12
Entoprocta Goblet worms 1 1 1
Gastrotricha Meiofauna 0 0 0
Gnathostomulida Jaw worms 0 0 0
Hemichordata Acorn worms 4 5 6 pterobranchs
Kinorhyncha Mud dragons 5 5 7
Loricifera Brush heads 0 0 0
Ministry for Primary Industries Tier 1 Marine Biodiversity Statistic 33
KINGDOM Class Order Common name No Species
Micrognathozoa Newly described phylum 0 0 0 not yet registered in WoRMS
Mollusca Molluscs 1 150 910 1 721
Myxozoa Small parasite 3 1 0 3
Nematoda Round worms 9 38 38
Nematomorpha Horsehair worms 0 0 0
Nemertea Ribbon worms 12 9 15
Orthonectida Small parasite 0 0 0
Phoronida Horseshoe worms 2 3 4
Placozoa Plate animals 0 0 0
Platyhelminthes Flat worms 7 7 12
Porifera Sponges 441 1 039 1 326
Rotifera Rotifers 4 0 4
Sipuncula Peanut worms 73 1 74
Tardigrada Water bears 0 0 0
34 Tier 1 Marine Biodiversity Statistic Ministry for Primary Industries
In determining an appropriate way to report taxonomic differences in species richness that is suitable and informative for the general public as well as for managers and policy makers we present three variations of potential taxonomic groupings varying in resolution of lesser known groups (ie Echiura Sipuncula Phoronida) and of groups often of particular interest to the public and for international reporting agreements (ie Chordata seabirds marine mammals marine reptiles) (Table 7) Other biodiversity summaries have varied in taxonomic resolution from very low resolution (eg Costello et al 2010) to high resolution (eg Supplementary tables available in Gordon et al 2010) A medium resolution grouping allows presentation of categories that may be of interest to the general public and important for international reporting statistics while lumping the large number of smaller invertebrate phyla
Table 7 Potential groupings for taxonomic representation to be used in Marine Biodiversity Tier 1 Statistic
Low resolution Medium resolution Highest resolution KINGDOM Phylum (SubphylumClassSubClass OrderSubOrder)
ARCHAEA ARCHAEA ARCHAEA BACTERIA BACTERIA BACTERIA FUNGI FUNGI FUNGI PROTOZOA PROTOZOA PROTOZOA PLANTAE PLANTAE PLANTAE
Chlorophyta Chlorophyta Rhodophyta Rhodophyta Other Other
CHROMISTA CHROMISTA CHROMISTA Ochrophyta Ochrophyta Other Other
ANIMALIA ANIMALIA ANIMALIA Chordata (Vertebrata Other) Chordata (Mammalia) Chordata (Vertebrata Mammalia
Cetacea) Chordata (Vertebrata Mammalia Carnivora)
Chordata (Vertebrata Aves) Chordata (Vertebrata Aves) Chordata (Vertebrata Chordata (Vertebrata Reptilia) Reptilia)
Chordata (Vertebrata Chordata (Vertebrata Other) Chordata (Vertebrata Actinypterigiae) Actinypterigiae)
Chordata (Vertebrata Chondrichthyes and other fish classes)
Chordata (Other) Chordata (Other) Chordata (Cephalochordata) Chordata (Tunicata)
Annelida Annelida Annelida Arthropoda Arthropoda Arthropoda (Crustacea)
Arthropoda (Other) Bryozoa Bryozoa Bryozoa Cnidaria Cnidaria Cnidaria Echinodermata Echinodermata Echinodermata Mollusca Mollusca Mollusca Porifera Porifera Porifera Other invertebrate phyla Brachiopoda Brachiopoda
Platyhelminthes Platyhelminthes Other invertebrate phyla Acanthocephala
Cephalorhyncha Chaetognatha Ctenophora Cycliophora Dicyemida
Ministry for Primary Industries Tier 1 Marine Biodiversity Statistic 35
Low resolution Medium resolution Highest resolution KINGDOM Phylum (SubphylumClassSubClass OrderSubOrder)
Echiura Entoprocta Gastrotricha Gnathostomulida Hemichordata Kinorhyncha Loricifera Micrognathozoa Myxozoa Nematoda Nematomorpha Nemertea Orthonectida Phoronida Placozoa Rotifera Sipuncula Tardigrada
35 Reporting of Records instead of Species
In calculating spatial patterns in species richness the cost-effectiveness of developing metrics based on species records (ie immediately extracted from OBIS with minimal further manipulation required for geoprocessing to develop spatial patterns for the statistic) can be weighed against the substantial additional effort required to convert species records into spatial patterns of species richness using MGET or other complex geoprocessing algorithms Spatial patterns in species records and species richness are generally similar reflecting primarily patterns of sampling and taxonomic effort up to 2013 (Figure 3 Figure 4 Table 8) The similarities between spatial patterns based on records and species richness is consistent across taxa with plots of ray-finned fishes (Actinypterigiae) (Figure 10) Arthropoda (Figure 11) Annelida (Figure 12) Mollusca (Figure 13) Bryozoa (Figure 14) Chromista (Figure 15) and Plantae (Figure 16) all showing similar relative patterns of high middle low and empty cells This suggests that a statistic using the number of records can provide (at least at this point in our knowledge of marine biodiversity in the New Zealand EEZ) equivalent information to that of the more costly calculation of species richness
Using records instead of species also side-steps issues of changes in taxonomy As taxonomy is regularly evolving at levels from species to phyla (ie two phyla described in Gordon et al (2010) have been renamed) species records in OBIS and elsewhere are likely to be modified to reflect updated taxonomy Other challenges with some data records is that occasionally a taxonomic unit is only identified to higher taxonomic levels so a true species identity may not yet exist in OBIS or other databases for many records held in national collections As such the reports of higher numbers of species found from the combined OBISTe PapaNIWA datasets than reported as the number of described species for a particular taxonomic group is likely to be spurious for some groups (eg Porifera) that may be more likely to have species records not defined to genus and species It is expected that future revisions of this statistic will show more equitability between OBIS-derived measures of species richness to those estimated by Gordon et al (2010) and available from the New Zealand Inventory of Biodiversity (Gordon (2009) Gordon (2010) Gordon (2012))
It is still valuable to calculate the number of species described at a national level OBIS and other datasets do not include (as of 2013) the full complement of species described for the New Zealand EEZ and reported in Gordon et al (2010) (Table 8) Instead the number of records available to
36 Tier 1 Marine Biodiversity Statistic Ministry for Primary Industries
describe spatial patterns in species richness vary among taxonomic groupings (Table 8) Sampling effort as approximated by the records to species ratio also varies between groups with some taxonomic groups having substantially higher sampling effort relative to species described (eg fishes with about 348 times as many records as number of fish species) This is in contrast to even some relatively well described groups like Porifera and Bryozoa for which there are 6 and 8 records per species (on average) respectively (Table 8) Note that the distribution of records is not equivalent across species within a taxonomic group such that most species groups are represented by a smaller number of common species with more records and the majority of species are often rarer with only one or two records in the EEZ (eg macroalgae Nelson et al 2013)
Ministry for Primary Industries Tier 1 Marine Biodiversity Statistic 37
Table 8 Comparison of biodiversity information compiled by this report with the expert-derived estimates of marine biodiversity across taxonomic groups from Gordon et al (2010) supplementary information table revised to reflect updated taxonomy Note that there are more individual species recorded in OBIS than in Gordon et al ( in final column) this is likely to be due to records uploaded to OBIS but not identified to species level
No No Estd no No No No No Records Min no described undescribed undescribed endemic alien records species in per species not species in study study species in OBIS
BACTERIAARCHAEA 40 69 190 0 0 64 812 603 107
FUNGI 57 0 210 0 0 0 0 0 57
PROTOZOA 1 476 152 2 900 162 4 279 40 7 1 436
PLANTAE
Chlorophyta 142 0 90 36 0 2 334 127 18 15
Rhodophyta 419 101 150 189 12 13 276 742 18
Other 7 0 0 0 0 8 5 2 2
CHROMISTA
Ochrophyta 734 43 630 55 11 5 149 333 15 401
Other 83 0 25 1 0 31 409 1 416 22
ANIMALIA 0
Acanthocephala 24 5 50 1 0 0 0 0 24
Annelida 528 263 1 005 238 32 10 377 932 11
ArthropodaCrustacea 2 166 407 4 930 944 27 31 321 2 399 13
Arthropodaother 147 7 215 61 1 764 125 6 22
Brachiopoda 41 9 17 15 0 3 328 80 42
Bryozoa 622 331 295 581 24 10 850 1 279 8
Cephalorhyncha (prev Priapulida) 3 0 4 0 0 35 7 5
Chaetognatha 14 0 25 0 0 612 23 27
Chordata (VertebrataMammaliaCetacea) 41 0 0 1 0 1 128 21 54 20
Chordata (VertebrataMammaliaCarnivora) 8 0 0 1 0 116 3 39 5
Chordata (VertebrataAves) 122 2 0 41 0 462 44 11 78
Chordata (VertebrataReptilia) 6 0 0 0 0 1 1 1 5
Chordata (VertebrataAll fish classes) 1 313 74 762 242 6 273 522 786 348 527
Chordata (Cephalochordata) 1 0 0 1 0 24 3 8
38 Tier 1 Marine Biodiversity Statistic Ministry for Primary Industries
No No Estd no No No No No Records Min no described undescribed undescribed endemic alien records species in per species not species in study study species in OBIS
Chordata (Tunicata) 189 3 195 125 12 1 388 205 7
Cnidaria 794 322 630 258 23 20 196 1 662 12
Ctenophora 15 4 12 5 0 39 2 20 13
Cycliophora 0 0 0 0 0 0 0 0 0
Dicyemida 5 1 15 6 0 0 0 0 5
Echinodermata 557 66 45 237 0 27 316 1 418 19
Echiura 5 2 15 0 0 79 12 7
Entoprocta (prev Kamptozoa) 6 7 30 2 1 4 1 4 5
Gastrotricha 0 5 190 0 0 0 0 0 0
Gnathostomulida 2 10 12 4 0 0 0 0 2
Hemichordata 5 2 4 1 0 30 6 5
Kinorhyncha 6 39 30 6 0 23 7 3
Loricifera 0 4 10 2 0 0 0 0 0
Micrognathozoa 0 0 1 0 0 0 0 0 0
Mollusca 2 340 1 253 430 2 923 14 29 263 1 721 17 619
Myxozoa 0 0 0 0 0 3 1 3
Nematoda 155 52 1 430 25 0 114 47 2 108
Nematomorpha 1 0 0 1 0 0 0 0 1
Nemertea 28 26 350 28 0 168 15 11 13
Orthonectida 0 1 20 1 0 0 0 0 0
Phoronida 3 0 2 0 0 16 4 4
Placozoa 0 0 1 0 0 0 0 0 0
Platyhelminthes 229 95 1 810 91 2 36 12 3 217
Porifera 472 963 310 455 7 8 357 1 326 6
Rotifera 2 0 95 0 1 24 4 6
Sipuncula 26 0 10 2 0 360 74 5
Tardigrada 3 2 60 0 0 0 0 0 3
Xenacoelomorpha (prev Xenoturbellida) 0 0 0 0 0 0 0 0 0
Ministry for Primary Industries Tier 1 Marine Biodiversity Statistic 39
Figure 10 Demonstration of variation in spatial coverage between taxonomic groups Species richness of Actinypterigiae (bony fish) at grid scale of 100 km times 100 km across all datasets Left number of records Right number of individual species identified
40 Tier 1 Marine Biodiversity Statistic Ministry for Primary Industries
Figure 11 Demonstration of variation in spatial coverage between taxonomic groups Species richness of Arthropoda (primarily crustaceans) at grid scale of 100 km times 100 km across all datasets Left number of records Right number of individual species identified
Ministry for Primary Industries Tier 1 Marine Biodiversity Statistic 41
Figure 12 Demonstration of variation in spatial coverage between taxonomic groups Species richness of Annelida (primarily marine polychaetes) at grid scale of 100 km times 100 km across all datasets Left number of records Right number of individual species identified
42 Tier 1 Marine Biodiversity Statistic Ministry for Primary Industries
Figure 13 Demonstration of variation in spatial coverage between taxonomic groups Species richness of Mollusca (gastropods bivalves cephalopods) at grid scale of 100 km times 100 km across all datasets Left number of records Right number of individual species identified
Ministry for Primary Industries Tier 1 Marine Biodiversity Statistic 43
Figure 14 Demonstration of variation in spatial coverage between taxonomic groups Species richness of Bryozoa at grid scale of 100 km times 100 km across all datasets Left number of records Right number of individual species identified
44 Tier 1 Marine Biodiversity Statistic Ministry for Primary Industries
Figure 15 Demonstration of variation in spatial coverage between taxonomic groups Species richness of marine Chromista at grid scale of 100 km times 100 km across all datasets Left number of records Right number of individual species identified
Ministry for Primary Industries Tier 1 Marine Biodiversity Statistic 45
Figure 16 Demonstration of variation in spatial coverage between taxonomic groups Species richness of marine Plantae at a grid scale of 100 km times 100 km across all datasets Left number of records Right number of individual species identified
46 Tier 1 Marine Biodiversity Statistic Ministry for Primary Industries
36 Summary recommendations Species Richness
In summary reporting on species richness highlights a key factor relating to the development of a Tier 1 Marine Biodiversity Statistic our knowledge of marine biodiversity is low relative to other developed countries particularly in the ERMS (Europe) region where sampling has been undertaken for many more years As such any statistic relating to species richness is in reality a State of Knowledge index as changes in the spatial distribution and the number of taxa will initially represent increases in knowledge both in terms of increased sampling effort where gaps in spatial sampling coverage are currently evident and increased knowledge if additional sampling effort is focussed on the many under-represented groups in the marine biodiversity record particularly invertebrate groups Moreover data entering the databases is essentially for taxonomic purposes rather than monitoring and thus does not always include all species found in a sample ie if a species is not reported we do not know whether it is not there This complicates both qualitative and quantitative estimates of species richness Finally as there is no structured or coherent sampling design at present species richness can only increase there is no way of determining decreases over time
As our understanding of marine biodiversity increases we will be able to better assess hotspots of biodiversity and the features that they are associated with in the New Zealand EEZ Similarly with adequate knowledge of patterns in marine biodiversity we can better assess changes in species ranges decreases in abundance of common and rare taxa and other aspects that may reflect impacts of disturbances and climate change on marine biodiversity However it is more likely that changes in marine biodiversity would be better assessed from observed changes in directed monitoring across a number of locations while the information gleaned from OBIS and other taxonomic datasets would focus primarily on changes in our state of knowledge of marine biodiversity
From our initial assessment of available data to assess patterns in marine biodiversity we recommend a cost-effective statistic reporting on species richness should Have a spatial scale of reporting of 100 km times 100 km grid cells Include all datasets uploaded on OBIS Encourage (and provide funding for if necessary) data managers to regularly update New Zealand biodiversity datasets and upload them to OBIS including NIWA datasets Te Papa and other museum collections and other national datasets identified in this report Electronic linkages (currently being implemented) should be restored such that regular updates to OBIS from the South Western Pacific Node occur
Use WoRMS as the main source of taxonomic nomenclature and ensure that electronic linkages between NZOR and WoRMS are restored such that New Zealand based advances in taxonomy are included in the international taxonomic record
Have a temporal scale of reporting of five yearly Report number of species in total for the New Zealand EEZ to medium taxonomic resolution such that groups for which the public is familiar (eg vertebrates) have higher resolution and smaller uncommon phyla are combined
Report spatial patterns using the number of records extracted from OBIS as a proxy for patterns in species richness based on the number of individual species
Use gaps in spatial and taxonomic information to identify priorities for further sampling surveys in poorly studied regions and funding toward taxonomic training
Be considered as reporting on New Zealandrsquos commitment to advancing the nationrsquos knowledge of biodiversity rather than as an estimate of biodiversity per se
4 State of Knowledge Index
As discussed in Section 3 compilation of existing information on marine biodiversity in the New Zealand EEZ suggests that our biggest challenge is that of the poor state of knowledge both taxonomically and spatially Gordon et al (2010) estimated that only 31 of New Zealandrsquos marine biodiversity has been described quantifying a total of 17 135 known species including 4315 collected
Ministry for Primary Industries Tier 1 Marine Biodiversity Statistic 47
but as yet undescribed species and an estimated 17 220 (at minimum) further undescribed species In terms of our spatial understanding of marine biodiversity approximately 50 of cells had fewer than 50 biodiversity records and 38 of cells had 10 or fewer recorded species As such much of the increase in the state of knowledge will be revealed through increases in sampling effort in under-studied regions of the EEZ and efforts to reduce bias in taxonomic sampling and expertise and in formal taxonomic descriptions of lsquoknownrsquo undescribed species Plots of temporal (five yearly) subsets of the spatial distribution of new records can demonstrate increases in the state of the spatial knowledge of New Zealandrsquos marine biodiversity
Other biodiversity reviews have used expert-derived metrics to define the state of knowledge of marine biodiversity Data reported in Costello et al (2010) on the state of knowledge of marine biodiversity included metrics based on the number of taxonomic experts the age and number of identification guides and the percentage of taxa described summarised over broad national and international regions Gordon et al (2010) reported the metrics as in Costello et al (2010) and also included the number of collected and as yet not formally described species (labelled lsquoknown undescribedrsquo) in addition to an estimate of the number of undescribed taxa across phyla that have not yet been collected or described Outside of major museums and research institutes it will be potentially difficult in future to track down taxonomic experts and to track identification guides many of which are developed for amateur field identification by non-taxonomists
However the state of knowledge can be most adequately assessed by our knowledge of species biodiversity itself New species records can be found through reviews of peer-reviewed publications in key taxonomic literature including New Zealand local taxonomic journals which often include in their title lsquoNew record ofhelliprdquo For most taxa these new taxonomic records are uploaded to NZOR with data providers for marine taxa reported on the NZOR website (as at July 2012) to include
Marine algae data maintained by Tē Papa Digitised checklists from the New Zealand Inventory of Biodiversity Volumes 123 Edited by Dennis P Gordon (excluding plants and fungi)
State of knowledge is also relevant to the Threatened Species metric discussed in Section 6 Two categories within the New Zealand Threatened Species Classification (lsquonot assessedrsquo and lsquodata deficientrsquo) refer to taxa for which information has either not been compiled or is not yet available to determine whether a taxa is or is not threatened
41 Summary recommendations State of Knowledge
Report number of newly described species across taxonomic groups Report new species records in geographic context (as for methods for Species Richness but using a five yearly subset of recent data) as a measure of increased geographic knowledge
Use gaps in spatial and taxonomic information to identify priorities for further sampling surveys and decrease the number of areas that are poorly sampled
Use gaps in taxonomic information to identify priority databases to encourage upload to OBIS
5 Endemic species metric
Costello et al (2010) reported the number of endemic species across broad taxonomic categories (Plants Invertebrates Fish Other vertebrates) at a national scale New Zealandrsquos marine species have a high level of endemism with over 50 of described species reported as endemic to New Zealandrsquos EEZ (Costello et al 2010 Gordon et al 2010) While Gordon et al (2010) provides a starting point for estimates of the proportion of endemic species for higher resolution taxonomic groupings (Table 8) these proportions are unlikely to change in a significant way with new species described based on the small numbers of new taxa likely to be described on a five yearly basis relative to total species in most taxonomic groups As such statistics based on changes in the proportion of endemic species are unlikely to provide useful information on the status of New Zealandrsquos marine biodiversity However the static measure of endemicity is in itself an important aspect of New Zealandrsquos marine
48 Tier 1 Marine Biodiversity Statistic Ministry for Primary Industries
biodiversity and an important part of the conceptual understanding of the concept of biodiversity and one of the reasons that New Zealandrsquos marine (and terrestrial) fauna and flora is internationally known as a hotspot of biodiversity
While unlikely to individually result in a large change in the proportion of endemic species records of non-indigenous marine species (NIMS) and changes in their distribution are potentially useful indicators of the status of marine biodiversity as some NIMS are lsquoinvasive exoticsrsquo defined as those species that are present outside their natural distribution and have adverse impacts on native biodiversity It is assumed that reporting of the impacts of any NIMS taxa (ie resulting in decreases in native biodiversity) would be incorporated into the Tier 1 Ecological Integrity statistic which is proposed for reporting more directly on ecosystem health However basic information on the number of NIMS taxa is a useful metric to include to represent changes in biodiversity as related to endemicity of marine fauna and flora
Should NIMS be included as part of the Tier 1 marine biodiversity statistic this metric should include data on NIMS sourced from both OBIS and from the national Marine High Risk Site Surveillance (MHRSS) biosecurity database Data for MHRSS is held and managed by NIWA for the Ministry for Primary Industries (originally MAF Biosecurity) this database includes both transient (eg found on vessel hulls) and established NIMS taxa whereas only established NIMS taxa would be quantified for a Tier 1 marine biodiversity statistic 177 non-indigenous species were recorded as established in the New Zealand EEZ in 2010 (Gordon et al 2010) As of December 2013 a total of 334 recorded NIMS taxa had been discovered in New Zealand including many that were present only on vessel hulls Within OBIS records could be extracted for these NIMS taxa on a five yearly basis to determine whether there are changes in the spatial distribution of these taxa Using BIODS changes in the number of primary and secondary ports at which a NIMS are recorded could be used as an indicator of whether initiatives to reduce the influx of NIMS via ballast water and vessel hull cleaning initiatives are resulting in a reduction in transport of NIMS Similarly changes in the number of NIMS taxa could also be reported using information provided by Ministry for Primary Industries Biosecurity of any new NIMS taxa recorded within the five yearly update period or any new records on NIMS taxa recorded on NZOR or from the NIWA Marine Invasives Taxonomic Service (MITS)
51 Summary recommendations Endemic species
A statistic reporting on the proportion of endemic species is unlikely to demonstrate substantial change within a five year reporting period and is thus unlikely to be a useful indicator of changes in marine biodiversity Rather the presence and change in status of non-indigenous marine species (NIMS) would be a more useful indicator of changes in marine biodiversity as some NIMS taxa have negative impacts on native marine biodiversity If not overlapping the Ecological Integrity Tier 1 statistic or other national reporting programmes we recommend Report on the relatively static measure of the proportion of endemic species as an important aspect of New Zealandrsquos marine biodiversity
Do not report on changes in the proportion of endemic species Rather report on
o Change in spatial distribution of NIMS taxa o Changes in number of NIMS taxa recorded in the New Zealand EEZ
6 Threatened species metric
Costello et al (2010) reported on a ranked summary of the major threats to marine biodiversity at a national scale rather than on the number or presence of threatened species in the New Zealand EEZ Here we discuss a different metric that of the number of threatened species found in New Zealand and trends in their status
Ministry for Primary Industries Tier 1 Marine Biodiversity Statistic 49
The concept of lsquothreatened speciesrsquo has evolved out of threat classification systems that aim in part to quantify and identify those species most at risk from extinction Perhaps the most well-known of these systems is the International Union for Conservation of Naturersquos (IUCN) lsquoRed Listrsquo (see httpwwwiucnredlistorg) which takes a global view of risk from extinction Species are assessed against a set of quantitative criteria and assigned to one of several threat classifications with increasing risk of extinction ranging from lsquoLeast Concernrsquo and lsquoNear Threatenedrsquo to the three threatened classifications of lsquoVulnerablersquo lsquoEndangeredrsquo and lsquoCritically Endangeredrsquo and finally two further categories of lsquoExtinct in the Wildrsquo and lsquoExtinctrsquo To date (February 2014) the Red List has assessed over 71 500 taxa but with a strong bias towards vertebrates (over 37 000 taxa)
In New Zealand Molloy et al (2002) developed a threat classification system similar in many respects to the IUCNrsquos Red List which was later revised by Townsend et al (2008) Townsend et al (2008) noted that the New Zealand Threat Classification System (NZTCS) was intended to be complementary to the IUCNrsquos Red List but to be lsquofocussed at the national levelrsquo providing lsquoa more sensitive classification for taxa with naturally restricted distributions and small numbers as a result of insular rarityrsquo
The NZTCS comprises more categories compared to the Red List taxa are classified as lsquoIntroduced and Naturalisedrsquo native taxa are classified as lsquoMigrantrsquo lsquoVagrantrsquo or lsquoColoniserrsquo or lsquoResidentrsquo Those taxa that are both native and resident are classified as lsquoNot EvaluatedrsquorsquoData Deficientrsquo or lsquoEvaluatedrsquo lsquoEvaluatedlsquo taxa can be lsquoExtinctrsquo or lsquoNot Threatenedrsquo at which classification stops However lsquoAt Riskrsquo is further broken down to lsquoNaturally Uncommonrsquo lsquoRelictrsquo lsquoRecoveringrsquo and lsquoDecliningrsquo lsquoThreatenedrsquo is further broken down to lsquoNationally Vulnerablersquo Nationally Endangeredrsquo and lsquoNationally Criticalrsquo following the diagram below (Figure 17) adapted from Townsend et al (2008)
Biota in the wild in NZ
Native
Migrant
Vagrant
Coloniser
Resident
Not evaluated Data Deficient
Evaluated
Extinct
Threatened
Nationally Critical
Nationally Endangered
Nationally Vulnerable
At Risk
Declining
Recovering
Relict
Naturally Uncommon
Not Threatened
Introduced and Naturalised
Figure 17 Classification scheme underlying the New Zealand Threat Classification System (NZTCS) adapted from Townsend et al (2008)
The criteria used to determine which of these categories particular taxa are assigned to can be found in Townsend et al (2008) but for example a taxa classified as lsquoNationally Criticalrsquo would have either
50 Tier 1 Marine Biodiversity Statistic Ministry for Primary Industries
A a very small population A(1) fewer than 250 mature individuals A(2) no more than two sub-populations no more than 200 mature individuals in the larger sub-population A(3) Total area of occupancy no more than 1 ha
Or
B a small population with a high ongoing or predicted decline B(11) 250ndash1000 mature individuals predicted decline 50ndash70 B(21) no more than five sub-populations no more than 300 mature individuals in the largest sub-population predicted decline 50ndash70 B(31) Total area of occupancy no more than 10 ha predicted decline 50ndash70
Or
C a population (irrespective of size or number of sub-populations) with a very high ongoing or predicted decline of more than 70
The NZTCSrsquos long-term aim is to list all extant species by the threat of extinction Hitchmough (2013) lists 23 groups of taxa that have been reviewed to some extent additionally noting that algae freshwater invertebrates and marine fish had not been reviewed Taxonomic groups are assessed by a panel of experts It was suggested that each species group be assessed every three years although regular reporting has been inconsistent both within and between taxonomic groups Formal inclusion within a five yearly Tier 1 reporting statistic would provide both consistent funding and regularity of reporting across all taxonomic groups
A second concept lsquoprotected speciesrsquo is also used in New Zealand and includes most New Zealand seabirds marine mammals and marine reptiles nine fish including gropers sharks and rays and black corals stony corals hydrocorals and gorgonians These are generally taxa for which fishing or other human uses of the environment have the potential to reduce numbers through incidental capture habitat damage and modification or other direct or indirect effects The list of protected marine species in New Zealand includes taxa that have been assessed as threatened within the NZTCS but also many species that are not currently threatened Protected species are managed through the Fisheries Act 1996 (sections 8 9 and 15) the Marine Mammals Protection Act (1978) and the Wildlife Act (1953) A list of protected marine species is provided in Schedule 7A of the Wildlife Act with the most recent amendment to this list being in 2010 While outside the scope of a national reporting statistic this investigation highlights this disconnection between threatened and protected taxa better coordination of these lsquoconceptualrsquo listings is warranted for marine species with the suggestion that regular reporting cycles of Threatened species would lead to amendments to the Wildlife Act (1953) to add any new threatened species such that they receive the protections provided in this legislation
In the marine realm there have been reviews of marine mammals in 2009 (Baker et al 2010) seabirds as part of the birds reviews in 2008 (Miskelly et al 2008) and 2012 (Robertson et al 2013) marine reptiles as part of the reptiles reviews in 2009 (Hitchmough et al 2010) and 2012 (Hitchmough et al 2013) and marine invertebrates in 2009 (Freeman et al 2010) (Table 9) All New Zealand marine mammals seabirds and reptiles have been assessed (Baker et al 2010 Hitchmough et al 2013 Robertson et al 2013) but only 295 marine invertebrates were reviewed by Freeman et al (2010) (Table 9)
Although the coverage of marine taxa is currently very patchy and clearly biased towards the relatively large conspicuous taxa the NZTCS is both robust and valuable in terms of charting the long-term trends in conservation status of individual taxa and groups of taxa and also in terms of identifying taxa requiring specific conservation management Taken across the entire marine realm there are currently insufficient assessments across many taxonomic groups to justify the use of lsquonumber of threatened speciesrsquo as a Tier 1 statistic The challenge to assess every marine species as
Ministry for Primary Industries Tier 1 Marine Biodiversity Statistic 51
part of assessing all extant New Zealand taxa is truly daunting not least because there is simply insufficient reliable information on which to base an assessment for the vast majority of marine species ndash such taxa would be classified as lsquoData Deficientrsquo which would constitute the dominant classification Additionally it is difficult to see how the majority of marine taxa could be assessed in a timeframe of less than many decades without a substantial shift in resource allocation that would enable population sizes trends and distributions to be determined However theoretically and assuming that more taxonomic groups will be comprehensively assessed in the future the NZTCS and its concept of a lsquothreatened speciesrsquo could become a meaningful Tier 1 statistic for marine biodiversity perhaps restricting its use to well-defined species groups afforded comprehensive or near-comprehensive coverage
It is also worth noting that for the majority of marine taxa assessed to date which tend to be generally long-lived and slowly-reproducing species conservation status represents a relatively conservative statistic ndash the transition from one threat category to a lower threat category (ie an improvement in the conservation status of a particular taxa perhaps resulting in a reduction in the number of lsquothreatened speciesrsquo within a taxonomic group) would be likely to take many years perhaps even a few decades For such species the use of the number of threatened species as a useful Tier 1 statistic would only become valuable over similarly long timeframes
61 Threatened species summary statistic
We recommend for the threatened species metric that the number of threatened taxa in each threat category (both NZTCS and IUCN) is summarised for broad taxonomic groups (Marine mammals marine reptiles seabirds shorebirds marine fish marine invertebrates marine plants) including the proportion of each taxonomic group that have been assessed and the proportion of data deficient taxa (Table 9)
Five yearly reporting on this statistic should further include reporting on change in threat categories across taxonomic groups change in number of taxa evaluated change in number described as data deficient
52 Tier 1 Marine Biodiversity Statistic Ministry for Primary Industries
Table 9 Number of threatened marine taxa based on the New Zealand Threat Classification System
Taxonomic group Proportion or Extinct Data Nationally Nationally Nationally Declining Recovering Relict Naturally number assessed deficient critical endangered vulnerable uncommon
Marine mammals 100 (63) 13 5 3 Marine reptiles 100 (7) Seabirds 100 (145) 2 10 7 10 9 3 13 24 Shorebirds 100 (126) 13 1 7 3 6 4 3 4 Fish 218 37 2 52 Invertebrates 27 (307) 12 10 2 21 8 243 Algae 61 23 1 37
Taxonomic group Migrant Vagrant Coloniser Not Introduced and IUCN IUCN IUCN IUCN Critically threatened naturalised Combined Vulnerable Endangered Endangered
listings
Marine mammals 6 20 9 7 2 5 Marine reptiles 2 5 5 1 2 2 Seabirds 16 40 4 7 15 10 (9 Vagrant 1 5 (5 Vagrant)
Migrant) Shorebirds 7 65 2 10 1 1 1 (Vagrant) Fish 10 4 113 13 Invertebrates 11 Algae 2
Ministry for Primary Industries Tier 1 Marine Biodiversity Statistic 53
7 DISCUSSION
This preliminary investigation of marine biodiversity in New Zealand allows evaluation primarily of our current state of knowledge of marine biodiversity While more than 600 000 biodiversity records were available for this analysis it points out the bias in spatial coverage of our sampling of the marine environment with sampling coverage focussed on coastal areas and areas of particular interest for resource extraction (eg the Chatham Rise) This lack of information is in itself of interest for a publicly available statistic on New Zealandrsquos marine biodiversity in that it shows the public how much more there is to learn about our nationrsquos biodiversity Other aspects of New Zealandrsquos biodiversity such as high rates of endemism though unlikely to change are of interest to the general public in demonstrating why international experts consistently rank New Zealandrsquos waters as a hotspot for marine biodiversity
Statistical reporting on marine biodiversity at this early stage in the knowledge of our biodiversity can be used to prioritise areas for which we have poor information on biodiversity In addition some taxonomic groups are poorly covered in the biodiversity records in New Zealand and demonstration of this bias in spatial coverage can also be used to prioritise taxonomic expertise and training in areas for which there are gaps in New Zealandrsquos taxonomic expertise
Aspects of biodiversity that report on changes both increases in non-indigenous marine species and decreases (or increases) in abundance of particular taxa that result in change in threatened species classifications are also important metrics both for public consumption and for international reporting Elevation of these metrics to international reporting statistics will put higher priority on generation of this information and for integration of different New Zealand databases Public availability of government-funded datasets is mandated and Tier 1 reporting statistics can provide guidance on data format accessibility and quality control
8 KEYPOINTS FOR POLICYMAKERS
In general Tier 1 statistics should be of interest to the general public but also serve both an inward looking role for regional and national decision making and an outward role for international reporting and maintaining New Zealandrsquos reputation as a biodiverse and clean and green nation Most New Zealand citizens would be surprised to find out that New Zealand is the only OECD country that lacks regular national environmental reporting and the development of a marine biodiversity Tier 1 National Reporting statistics is one step toward providing consistent transparent reporting on our environment From a public perspective a Tier 1 Statistics also has the ability to assist the general public in understanding lsquowhat is marine biodiversityrsquo as well as why New Zealandrsquos marine biodiversity is internationally recognised for its high diversity and endemicity
Key management implications to support long-term cost-efficient generation of this statistic are in improved resourcing of New Zealand biodiversity databases and better integration across all New Zealand databases and data management portals within which they are stored and accessed For some metrics (eg threatened taxa) the change to a regular reporting schedule and synchronised reporting across different taxonomic groups will result in improved consistency among reporting standards and higher prioritisation of tasks to identify and report on threatened species trends Required for international reporting this will also contribute to New Zealandrsquos environmental reputation by resulting in fewer taxa which are labelled as either lsquonot assessedrsquo or lsquodata deficientrsquo
9 ACKNOWLEDGMENTS
This work was completed under Objective 1 of Ministry for Primary Industries project ZBD201201 We thank attendees of the December 2013 workshop and Mary Livingston (Ministry for Primary Industries) Debbie Freeman (Department of Conservation) Pierre Tellier (Ministry for the Environment) and David Harris (Statistics New Zealand) for further consultation during the course of
54 Tier 1 Marine Biodiversity Statistic Ministry for Primary Industries
the project We thank Judi Hewitt and Barb Hayden for consultation throughout the project We thank the Ministry for Primary Industries for thorough review of this report
10 REFERENCES
Adams NM (1972) The marine algae of the Wellington area Records of the Dominion Museum 8 43ndash98
Adams NM (1994) Seaweeds of New Zealand Canterbury University Press Christchurch New Zealand 360 p
Adams NM Conway E Norris RE (1974) The marine algae of Stewart Island Records of the Dominion Museum 8 185ndash245
Adams NM Nelson WA (1985) The marine algae of the Three Kings Islands National Museum of New Zealand Miscellaneous Series 13 1ndash29
Arnold A (2005) Shining a spotlight on the biodiversity of New Zealands marine ecoregion Experts workshop on marine biodiversity 27-28 May 2003 Wellington New Zealand World Wildlife Fund for Nature Wellington New Zealand 85 p
Baker CS Chilvers BL Constantine R du Fresne S Mattlin RH van Helden A Hitchmough R (2010) Conservation status of New Zealand marine mammals (suborders Cetacea and Pinnipedia) 2009 New Zealand Journal of Marine and Freshwater Research 44 101ndash115
Beaumont J Oliver M MacDiarmid A (2008) Mapping the values of New Zealands coastal waters 1 Environmental values Biosecurity New Zealand Technical Paper No 200816 73 p
Beaumont J Oliver M MacDiarmid A (2009) Mapping the values of New Zealands coastal waters 4 A meta-analysis of environmental values Biosecurity New Zealand Technical Paper No 201008 70 p
Booth J Nelson W Notman P (2006) NABIS Marine Plant Distributions Final Research Report for Ministry of Fisheries Research Project ZBD2004-05 Objective 1 NIWA April 2006 (Unpublished report held by Ministry for Primary Industries Wellington)
Broady PA Flint EA Nelson WA Cassie Cooper V de Winton MD Novis PM (2012) Phyla Chlorophyta and Charophyta green algae In Gordon DP (Ed) New Zealand Inventory of Biodiversity Volume Three Kingdoms Bacteria Protozoa Chromista Plantae Fungi Canterbury University Press pp 347ndash381
Broom JES Hart DR Farr TJ Nelson WA Neill KF Harvey AH Woelkerling WJ (2008) Utility of psbA and nSSU for phylogenetic reconstruction in the Corallinales based on New Zealand taxa Molecular Phylogenetics amp Evolution 46 958ndash973
Costello MJ Coll M Danovaro R Halpin P Ojaveer H Miloslavich P (2010) A Census of Marine Biodiversity Knowledge Resources and Future Challenges PLoS ONE 5(8) e12110 doi101371journalpone0012110
Dalen J Nelson WA (2013a) httpwwwtepapagovtnzSiteCollectionDocumentsTePapalist ofmarinemacroalgaeCHLOROPHYTApdf
Dalen J Nelson WA (2013b) httpwwwtepapagovtnzSiteCollectionDocumentsTePapalist ofmarinemacroalgaeOchrophytapdf
Dalen J Nelson WA (2013c) httpwwwtepapagovtnzSiteCollectionDocumentsTePapalist ofmarinemacroalgaeRhodophytapdf
Farr T Broom J Hart D Neill K Nelson W (2009) Common coralline algae of northern New Zealand an identification guide NIWA Information Series 70 249 p
Ministry for Primary Industries Tier 1 Marine Biodiversity Statistic 55
Freeman DJ Marshall BA Ahyong ST Wing SR Hitchmough RA (2010) Conservation status of New Zealand marine invertebrates 2009 New Zealand Journal of Marine and Freshwater Research 44 129ndash148
Gordon DP (ed) (2009) New Zealand inventory of biodiversity Volume 1 Kingdom Animalia Radiata Lopotrochozoa Deuteromstomia 648 p
Gordon DP (ed) (2010) New Zealand inventory of biodiversity Volume 2 Kingdom Animalia Chaetognatha Ecdysozoa Ichnofossils 528 p
Gordon DP (ed) (2012) New Zealand inventory of biodiversity Volume 3 Kingdoms Bacteria Protozoa Chromista Plantae Fungi 616 p
Gordon DP Beaumont J MacDiarmid A Robertson DA Ahyong ST (2010) Marine biodiversity of Aotearoa New Zealand PLoS ONE 5(8) e10905 Doi101371journalpone0010905
Harper M Cassie Cooper V Chang FH Nelson W Broady P (2012) Phylum Ochrophyta brown and golden-brown algae diatoms silicoflagellates and kin In Gordon DP (ed) New Zealand Inventory of Biodiversity Volume Three Kingdoms Bacteria Protozoa Chromista Plantae Fungi Canterbury University Press pp 114ndash163
Harvey A Woelkerling W Farr T Neill K Nelson W (2005) Coralline algae of central New Zealand an identification guide to common crustose species NIWA Information Series 57 145 p
Hay CH Adams NM Parsons MJ (1985) The marine algae of the subantarctic islands of New Zealand National Museum of New Zealand Miscellaneous Series 11 1ndash70
Heesch S Broom J Neill K Farr T Dalen J Nelson W (2007) Genetic diversity and possible origins of New Zealand populations of Ulva Final Research Report for Ministry of Fisheries Research Project ZBS2004-08 203 p (Unpublished report held by MPI Wellington)
Heesch S Broom JE Neill K Farr T Dalen J Nelson WA (2009) Ulva Umbraulva and Gemina genetic survey of New Zealand Ulvaceae reveals diversity and introduced species European Journal of Phycology 44 143ndash154
Hewitt JE Bell R Cummings V Currie K Ellis J Francis M Froude V Gorman R Hall J Inglis G MacDiarmid A Mills G Pinkerton M Schiel D Swales A Law C Smith M McBride G Thompson D Torres L Tuck I Wing S Wood B (2014) Development of a National Marine Environment Monitoring Programme (MEMP) New Zealand Aquatic Environment and Biodiversity Report No 141
Hitchmough R (2013) Summary of changes to the conservation status of taxa in the 2008ndash11 New Zealand threat classification system listing cycle New Zealand threat classification series 1 Department of Conservation Wellington 20 p
Hitchmough R Anderson P Barr B Monks J Lettink M Reardon J Tocher M Whitaker T (2013) Conservation status of New Zealand reptiles 2012 New Zealand threat classification series 2 Department of Conservation Wellington 16 p
Hitchmough RA Hoare JM Jamieson H Dewman D Tocher MD Anderson PJ Lettink M Whitaker AH (2010) Conservation status of New Zealand reptiles 2009 New Zealand Journal of Zoology 37 203ndash224
MacDiarmid A (editor) (2007) The Treasures of the Sea Ngā Taonga a Tangaroa A Summary of Biodiversity in the New Zealand Marine Ecoregion Wellington New Zealand WWF-New Zealand
MacDiarmid A Oliver M Beaumont J (2008) Environmental value mapping Supplementary information to MAF Biosecurity New Zealand Technical Paper No 200816 Biosecurity New Zealand Technical Paper No 200816 26 p
56 Tier 1 Marine Biodiversity Statistic Ministry for Primary Industries
Miskelly CM Dowding JE Elliott GP Hitchmough RA Powlesland RG Robertson HA Sagar PM Scofield RP Taylor GA (2008) Conservation status of New Zealand birds 2008 Notornis 55 117-135
Molloy J Bell B Clout M de Lange P Gibbs G Given D Norton D Smith N Stephens T (2002) Classifying species according to threat of extinction A system for New Zealand Threatened species occasional publication 22 Department of Conservation Wellington 26 p
Neale D Nelson W (1998) Marine algae of the west coast South Island New Zealand Tuhinga 10 87ndash118
Neill K DrsquoArchino R Farr T Nelson W (2012) Macroalgal diversity associated with soft sediment habitats in New Zealand New Zealand Aquatic Environment and Biodiversity Report 87 127 p
Nelson WA (2012) Phylum Rhodophyta red algae In Gordon DP (ed) New Zealand Inventory of Biodiversity Volume Three Kingdoms Bacteria Protozoa Chromista Plantae Fungi Canterbury University Press Pp 327ndash346
Nelson WA Adams NM (1984) Marine algae of the Kermadec Islands National Museum of New Zealand Miscellaneous Series 10 1ndash29
Nelson WA Adams NM (1987) Marine algae of the Bay of Islands area National Museum of New Zealand Miscellaneous Series 16 1ndash47
Nelson WA Adams NM Fox JM (1992) Marine algae of the northern South Island National Museum of New Zealand Miscellaneous Series 26 1ndash80
Nelson WA Adams NM Hay CH (1991) Marine algae of the Chatham Islands National Museum of New Zealand Miscellaneous Series 23 1ndash58
Nelson WA Dalen JL (in press) Marine macroalgae of the Kermadec Islands Bulletin of the Auckland Museum
Nelson WA Dalen J Neill KF (2013) Insights from natural history collections analysing the New Zealand macroalgal flora using herbarium data PhytoKeys 30 1ndash21
Nelson WA Villouta E Neill K Williams GC Adams NM Slivsgaard R (2002) Marine macroalgae of Fiordland Tuhinga 13 117ndash152
Pinkerton MH (2010) Headline indicators for the New Zealand ocean Research report for Coasts amp Oceans IO2 project NIWA Wellington 43 p
Robertson HA Dowding JE Elliott GP Hitchmough RA Miskelly CM OrsquoDonnell CFJ Powlesland RG Sagar PM Scofield RP Taylor GA (2013) Conservation status of New Zealand birds 2012 New Zealand threat classification series 4 Department of Conservation Wellington 22 p
South GR Adams NM (1976) Marine algae of the Kaikoura coast National Museum of New Zealand Miscellaneous Series 1 1ndash67
Statistics New Zealand 2007 Principles and protocols for producers of Tier 1 Statistics httpunstatsunorgunsddnssdocs-nqaftier1-principles-and-protocolspdf
Thiers B (2014 ndash continuously updated) Index herbariorum a global directory of public herbaria and associated staff New York Botanical Gardenrsquos Virtual Herbarium Available at httpsweetgumnybgorgih
Thrush SF Hewitt JE Lundquist C Townsend M Lohrer AM (2011) A strategy to assess trends in the ecological integrity of New Zealandrsquos marine ecosystems NIWA Client report No HAM2011-140 prepared for the Department of Conservation 58 p
Townsend AJ de Lange PJ Duffy CAJ Miskelly CM Molloy J Norton DA (2008) New Zealand threat classification system manual Department of Conservation Wellington 35 p
Ministry for Primary Industries Tier 1 Marine Biodiversity Statistic 57
Tuck ID Pinkerton MH Tracey DM Anderson OA Chiswell SM (2013) Ecosystem and environmental indicators for deepwater fisheries New Zealand Aquatic Environment and Biodiversity Report 127 p
58 Tier 1 Marine Biodiversity Statistic Ministry for Primary Industries
11 APPENDICES
List of datasets held within the OBIS South Western Pacific Node (httpiobisorg) Note that other international datasets have records within the New Zealand EEZ
Dataset name
Original Data Provider
Contact
Abstract
Geographic coverage
Temporal coverage
records
taxa
Dataset name
Original Data Provider
Contact
Abstract
Geographic coverage
Temporal coverage
records
taxa
Dataset name
Original Data Provider
Contact
Abstract
Geographic coverage
Temporal coverage
records
taxa
Dataset name
Citation
Original Data Provider
Contact
Abstract
Geographic coverage
Temporal coverage
records
International Polar Year and Census of Antarctic Marine Life subset (South Western Pacific OBIS)
NIWA
Kevin Mackay (kmackayniwaconz)
Biological data from the IPY-CAML voyage (TAN0802) by the RV Tangaroa The TAN0802 voyage departed from Wellington New Zealand on Jan 26th 2008 and returned to Wellington New Zealand on Mar 21st 2008 The survey was concentrated mainly on the Ross Sea and thee waters around Scott and the Balleny Islands Biological data was collected using a variety of gear including bottom trawls beam trawls epibenthic sleds Van Veen grabs and MOCNESS tows
Latitude -76833 to -66698 Longitude -17996 to 179989
2004 to 2008
7219
1285
Modern foraminifera in the New Zealand EEZ
NIWA
Kevin Mackay (kevinmackayniwaconz)
Biodiversity data of the modern foraminifera in the New Zealand EEZ sourced from Dr Bruce Hayward at Geomarine Research These data come from two projects (1) modern deep-sea (100-5000 m water depth) foraminifera and (2) a 7 year project (1991-1998) on the biodiversity and ecological distribution of modern brackish and shallow-water (0-100 m) foraminifera around New Zealand
Latitude -61767 to -294 Longitude -178818 to 179996
Could not be determined
16986
553
NIWA plankton
NIWA
Kevin Mackay (kevinmackayniwaconz)
Plankton (mainly zooplankton) observation data held at NIWA
Latitude -46273 to -3912 Longitude 1692 to 179168
1976 to 1993
4624
221
New Zealand Coralline Algae
Farr T Broom J Hart D Neill K Nelson W (2009) Common coralline algae of northern New Zealand an identification guide NIWA Information Series No 70
NIWA
Kevin Mackay (kmackayniwaconz)
Occurrence of New Zealands non-geniculate coralline flora This dataset is based on two identification guides published by NIWA and funded through the Ministry of Fisheries Biodiversity Programme in order to make information accessible to marine scientists and resource managers and to improve understanding of these algae
Latitude -5255 to -34418 Longitude 169183 to 178753
1916 to 2007
947
Ministry for Primary Industries Tier 1 Marine Biodiversity Statistic 59
taxa
Dataset name
Original Data Provider
Contact
Abstract
Geographic coverage
Temporal coverage
records
taxa
Dataset name
Original Data Provider
Contact
Abstract
Geographic coverage
Temporal coverage
records
taxa
Dataset name
Original Data Provider
Contact
Abstract
Geographic coverage
Temporal coverage
records
taxa
Dataset name
Original Data Provider
Contact
Abstract
Geographic coverage
Temporal coverage
records
Dataset name
Citation
Original Data Provider
Contact
Abstract
Geographic coverage
34
South Western Pacific Regional OBIS Data All Sea Bio Subset (South Western Pacific OBIS)
South Western Pacific OBIS
Steve Massey (smasseyniwaconz)
This is the All Sea Bio Subset of the Full OBIS Provider for NIWA For the Full dataset please refer to obismaster provider
Latitude -82375 to 5585 Longitude -180 to 180
1897 to 2005
41925
3488
South Western Pacific Regional OBIS Data Asteroid Subset (South Western Pacific OBIS)
South Western Pacific OBIS
Steve Massey (smasseyniwaconz)
This is the Asteroid Subset of the Full OBIS Provider for NIWA For the Full dataset please refer to obismaster provider
Latitude -5501 to -2522 Longitude -17999 to 180
1956 to 2003
2294
145
South Western Pacific Regional OBIS Data Bio Ross Subset (South Western Pacific OBIS)
South Western Pacific OBIS
Steve Massey (smasseyniwaconz)
This is the Ross Bio Subset of the Full OBIS Provider for NIWA For the Full dataset please refer to obismaster provider
Latitude -72343 to -65408 Longitude 160887 to 17332
2004 to 2004
1166
343
South Western Pacific Regional OBIS Data Bryozoan Subset (South Western Pacific OBIS)
South Western Pacific OBIS
Steve Massey (smasseyniwaconz)
This is the Bryozoan Subset of the Full OBIS Provider for NIWA
Latitude -53 to 33767 Longitude -179532 to 179668
1874 to 2003
6348
South Western Pacific Regional OBIS Data Habitat-forming Cold Water Corals Subset (South Western Pacific OBIS)
Tracey DM Rowden AA Mackay KA and Compton T 2011 Habitat-forming cold-water corals show affinity for seamounts in the New Zealand region Marine Ecology Progress Series Vol 430 1-22
South Western Pacific OBIS
Kevin Mackay (kmackayniwaconz)
This is the Habitat-forming Cold Water Corals Subset of the Full OBIS Provider for NIWA It contains field (observational) data from research surveys and fishing industry trawls conducted in waters around New Zealand
Latitude -56317 to -26715 Longitude -179991 to 180
60 Tier 1 Marine Biodiversity Statistic Ministry for Primary Industries
Temporal coverage
records
taxa
Dataset name
Original Data Provider
Abstract
Geographic coverage
Temporal coverage
records
taxa
Dataset name
Original Data Provider
Contact
Abstract
Geographic coverage
Temporal coverage
records
taxa
Dataset name
Citation
Original Data Provider
Contact
Abstract
Geographic coverage
Temporal coverage
records
taxa
1954 to 2009
631
5
South Western Pacific Regional OBIS Data Specify Subset (South Western Pacific OBIS)
South Western Pacific OBIS
This is the Specify Subset of the Full OBIS Provider for NIWA
Latitude -835 to 52033 Longitude -180808 to 180
1900 to 2006
14023
2371
South Western Pacific Regional OBIS Data provider for the NIWA Marine Biodata Information System (South Western Pacific OBIS)
South Western Pacific OBIS
Steve Massey (smasseyniwaconz)
This is the cut down provider for the NZOBIS provider As at November 2005 this is a work in progress - data is being compiled and added to the NIWA Marine Biodiversity Information System (MBIS - a data warehouse) The data will cover an area from Antarctica to Fiji Data so far available are primarily the results of a series of research trawl surveys carried out as part of New Zealands Ministry of Fisheries data collection to support fisheries management within the NZ Exclusive Economic Zone (EEZ) plus data from several decades of marine invertebrate research sampling in the NZ Exclusive Economic Zone
Latitude -54185 to 0041 Longitude -18095 to 179999
1961 to 2005
377927
437
Xanthichthys greenei a new species of triggerfish (Balistidae) from the Line Islands
Pyle R Earle J (2013) Xanthichthys greenei a new species of triggerfish (Balistidae) from the Line Islands Biodiversity Data Journal 1 e994 DOI 103897BDJ1e994
NIWA
Kevin Mackay (kmackayniwaconz)
Xanthichthys greenei n sp is described from six specimens 97-154 mm standard length (SL) collected from mesophotic coral ecosystems (90-100 m) at Kiritimati (Christmas Island) Line Islands part of the Republic of Kiribati in the Central Pacific Of the six species of Xanthichthys it is most similar to the Atlantic X ringens and the Indo-West Pacific X lineopunctatus sharing with these species the character of three pigmented cheek grooves It is distinctive in its low body scale row count (33-35 other Xanthichthys species with 39 or more) small size (maximum SL 154 mm other species over 225 mm) and color pattern of scattered dark spots sub-dorsally and no other spots or lines on body
Latitude 1888 to 2016 Longitude -157555 to -157486
2005 to 2005
5
1
Ministry for Primary Industries Tier 1 Marine Biodiversity Statistic 61