Embed Size (px)
Citation preview
City of Brantford
Development of a Transportation Model for the City of Brantford
August 2, 2006
Final August 2, 2006
City of Brantford Development of a Transportation Model for the City of Brantford
1 INTRODUCTION AND BACKGROUND The City of Brantford initiated an update to their Transportation Master Plan in July 2005. The Update will review the 25 year transportation needs of Brantford and provide recommendations to address potential deficiencies in all modes of transportation under current and projected conditions. The purpose of a comprehensive transportation master plan, which follows the Municipal Class Environmental Assessment Process, is to examine transportation demands and deficiencies, and develop and assess alternative solutions on a system-wide basis. As part of this type of project, the use of a transportation model allows for the examination of future transportation demands across an entire city or region, and allows for the testing of “What-If?” scenarios, to examine the benefits of different improvement strategies. A transportation model attempts to simulate the travel demands using the major infrastructure in a community based on existing observed travel patterns and forecasts of future growth. The model uses a series of Traffic Zones to represent areas with common land uses or areas that load traffic onto the road network at key points. Existing travel patterns (number of trips, trip purpose, mode of travel, etc) between traffic zones is typically obtained from travel surveys, either household travel surveys or on- road travel surveys. The surveys are usually designed to capture daily or peak hour travel patterns from a sample of the total population that is used to estimate the travel patterns of the entire population. For household surveys, the most common form of survey used to build an urban transportation model, the sample size is typically 5%. The City of Brantford is currently participating in the 2006 Transportation Tomorrow Survey, a large scale household travel survey of residents throughout the Greater Golden Horseshoe. This data, once made available for use in mid-late 2007, can be used to update the City’s Transportation model. The last travel survey undertaken in the City of Brantford was completed as part of the 1997 Transportation Study. For the purpose of this Transportation Master Plan Update, the original travel survey data was used and was updated with Census Place of Work data to estimate the base year travel demands. A full discussion about this methodology is contained within section 4 of this report. The model forecasts future traffic flows on the roadways by ‘assigning’ these travel demands to the road network, which represents the major collector and arterial roadways within a community, based on a series of travel characteristics that reflect how well each segment of the road (or link) performs in terms of travel time, speed, and capacity. The assignment procedure looks to minimize overall travel time for all trips by assigning traffic to the path, linking the origin traffic zone to the destination traffic zone, with the shortest overall travel time. As would be expected, the major roads with higher speeds and lower travel times are the first roads to become congested. As a road reaches its planning capacity, the speeds tend to drop as congestion builds, and low speed roadways become more competitive in attracting some of the trips. The transportation model uses an iterative approach to loading traffic onto the various roads in the model, forecasting the resulting travel times on those roads due to congestion, and reassigning the trips based on potential traffic congestion until an optimum solution is reached. This is referred to as ‘equilibrium’, which represents the point at which no trip can improve their overall travel time by changing their route.
Final - August 2, 2006 2
City of Brantford Development of a Transportation Model for the City of Brantford
While it is recognized the traffic volumes will change day to day, this ‘equilibrium’ condition is intended to represent a typical condition, averaged over a number of days, where motorists typically use the fastest route between their origin and destination based on their knowledge of the road network. Before a transportation model can be used to forecast future traffic flow conditions on the road network, the model must be calibrated and validated to ensure that base year traffic flow patterns can be accurately simulated by the model. Once the above procedures are completed, the model is ready to replicate existing transportation network performance. A well calibrated and validated transportation model can be a valuable tool to forecast travel demands in future and provide insight into the benefits of different transportation strategies and road network improvement alternatives. The development of the new transportation model and the forecasting of future travel demands for the City involved the following steps which are described in the following sections:
1. Update the Traffic Zone System 2. Update the Road Network Characteristics 3. Update the Home to Work Travel Patterns 4. Update the Travel Patterns for Other Trip Purposes 5. Develop Trip Generation Rates 6. Validation of Model 7. Forecast Future Travel Demands
2 OVERVIEW OF 1995 TRANSPORTATION MODEL A transportation model for the City of Brantford was developed as part of 1997 Brantford Transportation study using the System II modeling software. It was later converted to TransCAD in 2000 and the existing travel demands and road networks were maintained. The model was set up to simulate traffic patterns and flows during the PM peak hour, when traffic volumes are typically at there highest levels throughout the city on a recurring basis. The 1997 Transportation Study developed base year travel demands using 1995 land use data and the results of a household travel survey and an on-road cordon survey, capturing typical daily trip making patterns of City residents and external trips. The base year travel demands are contained in a ‘trip matrix’ which contains all trips recorded between each zone in the City, separated by trip purpose and mode of travel. Table 2.1, below, shows the share of PM Peak Hour trips made by each mode of travel from the 1995 travel survey.
Table 2.1 1995 PM Peak Hour Trips by Mode Mode % of Total TripsAuto 87 Bicycle 2 Auto Passenger 2 Transit 2 School Bus 1 Walk 6
Final - August 2, 2006 3
City of Brantford Development of a Transportation Model for the City of Brantford
Total 100 The 1995 Household Travel Survey also captured trip making patterns for three trip purposes; home based work (HBW), home based other (HBO) and non home based (NHB), and these trips are separated into different modes of travel, including – auto (driver and passenger separately), bicycle, public transit, school bus, taxi and walk. For the external trips, only trips made via the auto mode were captured in the on-road survey. The 1995 Transportation Model was set up to forecast auto vehicle trips on the City road network during the PM Peak Hour. Trip making patterns for the other modes of travel were used in the development of future mode split assumptions, however, transit and walk trips are not assigned using the model. To convert the daily travel demands into peak hour vehicle demands, the daily auto person trip matrix was converted to auto vehicle trips using observed average auto occupancies for each trip purpose, obtained from the travel survey results. Based on the 1997 Brantford Transportation Study the following breakdown of PM Peak Hour trips and auto occupancies were observed for each trip purpose.
Table 2.2 1995 PM Peak Hour Trips by Purpose
Trip Purpose % of Total Person Trips % of Auto Person Trips Auto Occupancy HBO 48 45 1.4 HBW 36 38 1.0 NHB 16 17 1.2
The above table shows that Home Based Work trips represent 38% of the total auto trips, and feature average auto occupancies of 1.0, indicating virtually no carpooling activity.
3 MODEL CHARACTERISTICS & UPDATES
3.1 Update Traffic Zone System A traffic zone is the unit of geography most commonly used in conventional transportation planning models, and is used to break down a community into a series of areas with similar land uses and travel patterns. The size and structure of the zone system has a definite impact on degree of accuracy of the travel demand forecasting model. As part of the model update, the existing City traffic zone system was expanded to include all the areas within Brant County. The purpose of this expansion is to build flexibility into the model to simulate and forecast trip making patterns between the City, County, and Provincial road network in the broader Brantford area. While the current model does not contain any existing travel pattern data for the areas outside of the City boundary, it is anticipated that the 2006 Transportation Tomorrow Survey (TTS) will collect travel data from Brant County residents, allowing for better estimates of inter-municipal travel demands. Once the full TTS data is released in Fall of 2007, the City should consider updating their model to include this broader coverage area.
Final - August 2, 2006 4
City of Brantford Development of a Transportation Model for the City of Brantford
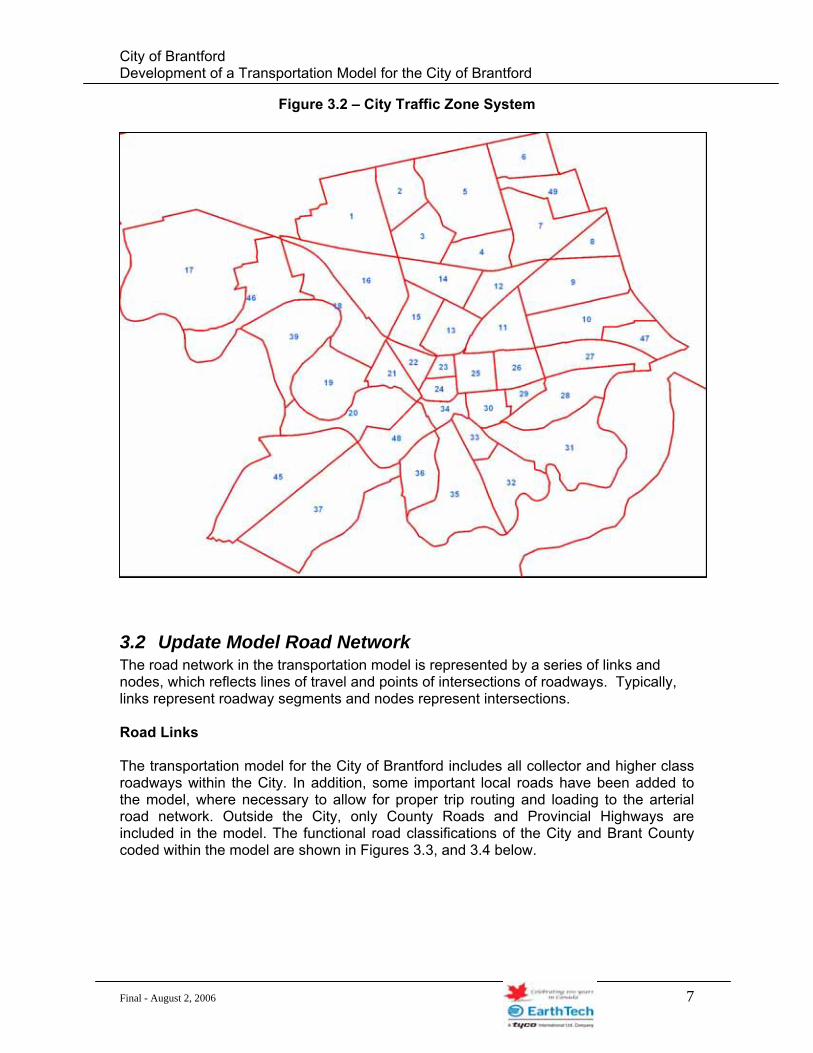
The current traffic zone system within the City has been kept intact within the new traffic zone system to maintain consistency with previous studies and ongoing monitoring within the Planning Department. For the purpose of the initial model update, the new traffic zones added outside the City are consistent with the boundaries used for the Census Sub-Divisions (CSD) within Brant County. These traffic zones may need to be refined in future as necessary based on the Transportation Tomorrow Survey (TTS) 2006 for Brant County and City of Brantford. The Traffic Zone system for the City is divided to 43 internal traffic analysis zones (TAZ), which are based on previous transportation studies for the City. The boundaries of the 43 traffic zones within the City are established by taking into consideration the Federal Government’s census zones, the City’s planning zones, and the City’s current geographic boundaries. Since the individual traffic zones are still relatively large in area, the traffic zone system is further disaggregated into 339 model analysis zones (MAZ). The MAZ are intended to provide a refined allocation of origin and destination locations in the model that replicate basic neighbourhoods and allow for more realistic loading of traffic onto the model road network. The numbering system of model analysis zones within the City traffic zones has been updated to more clearly correlate with the City traffic zones. The new model analysis zone number will have a 3 or 4 digit number with the first 1 or 2 digits representing the corresponding traffic zone number (e.g. 1 to 24) and last two digits representing the sequential numbering (starting with 01) of a model zone within that traffic zone. This is shown in the following Table:
Table 3.1 New MAZ Numbering System
TAZ New MAZ Old MAZ
1
101 102 ….. 111
1 2
….. 11
2
201 202 ….. 212
12 13 ….. 18
24
2401 2402 …..
2425
200 201 ….. 224
47
4701 4702 …..
4706
334 335 ….. 339
Final - August 2, 2006 5
City of Brantford Development of a Transportation Model for the City of Brantford
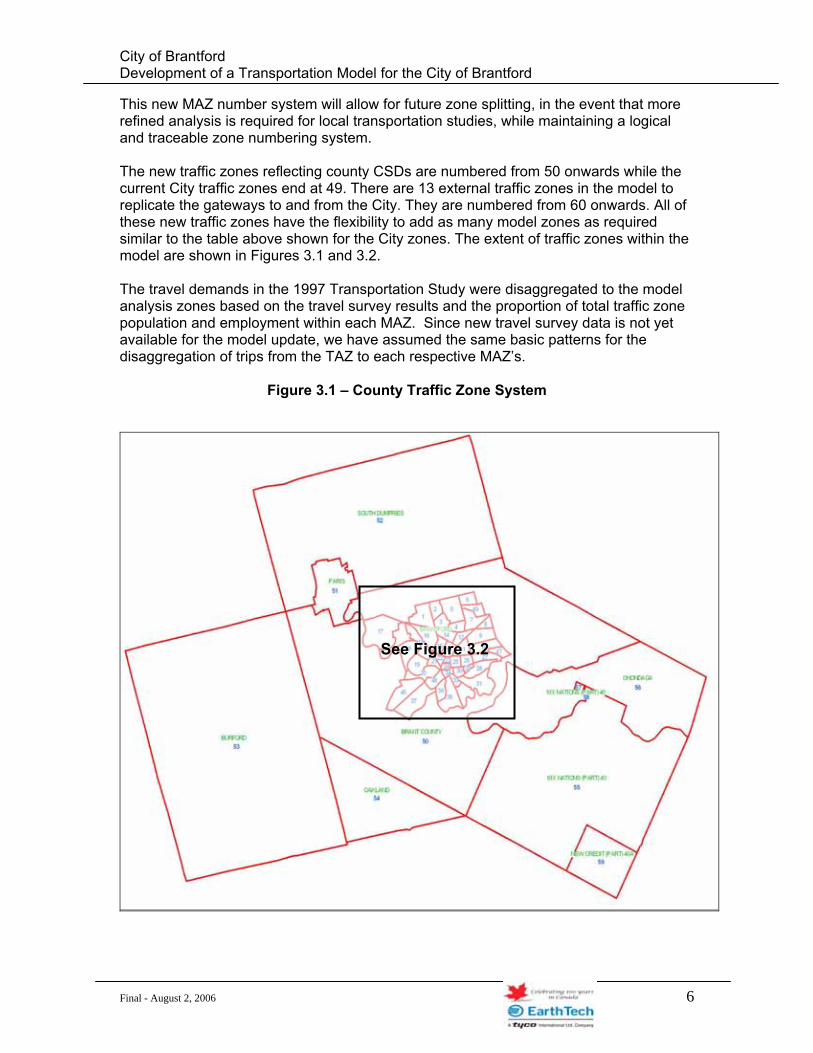
This new MAZ number system will allow for future zone splitting, in the event that more refined analysis is required for local transportation studies, while maintaining a logical and traceable zone numbering system. The new traffic zones reflecting county CSDs are numbered from 50 onwards while the current City traffic zones end at 49. There are 13 external traffic zones in the model to replicate the gateways to and from the City. They are numbered from 60 onwards. All of these new traffic zones have the flexibility to add as many model zones as required similar to the table above shown for the City zones. The extent of traffic zones within the model are shown in Figures 3.1 and 3.2. The travel demands in the 1997 Transportation Study were disaggregated to the model analysis zones based on the travel survey results and the proportion of total traffic zone population and employment within each MAZ. Since new travel survey data is not yet available for the model update, we have assumed the same basic patterns for the disaggregation of trips from the TAZ to each respective MAZ’s.
Figure 3.1 – County Traffic Zone System
See Figure 3.2
Final - August 2, 2006 6
City of Brantford Development of a Transportation Model for the City of Brantford
Figure 3.2 – City Traffic Zone System
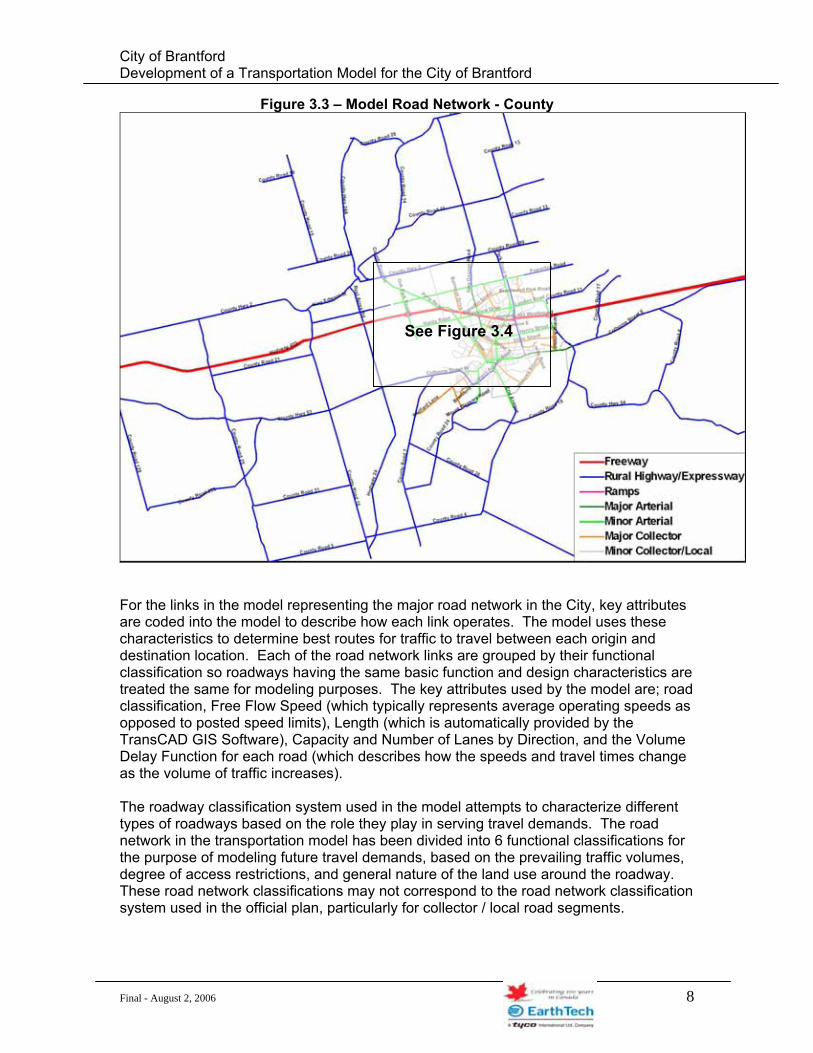
3.2 Update Model Road Network The road network in the transportation model is represented by a series of links and nodes, which reflects lines of travel and points of intersections of roadways. Typically, links represent roadway segments and nodes represent intersections. Road Links The transportation model for the City of Brantford includes all collector and higher class roadways within the City. In addition, some important local roads have been added to the model, where necessary to allow for proper trip routing and loading to the arterial road network. Outside the City, only County Roads and Provincial Highways are included in the model. The functional road classifications of the City and Brant County coded within the model are shown in Figures 3.3, and 3.4 below.
Final - August 2, 2006 7
City of Brantford Development of a Transportation Model for the City of Brantford
Figure 3.3 – Model Road Network - County
See Figure 3.4
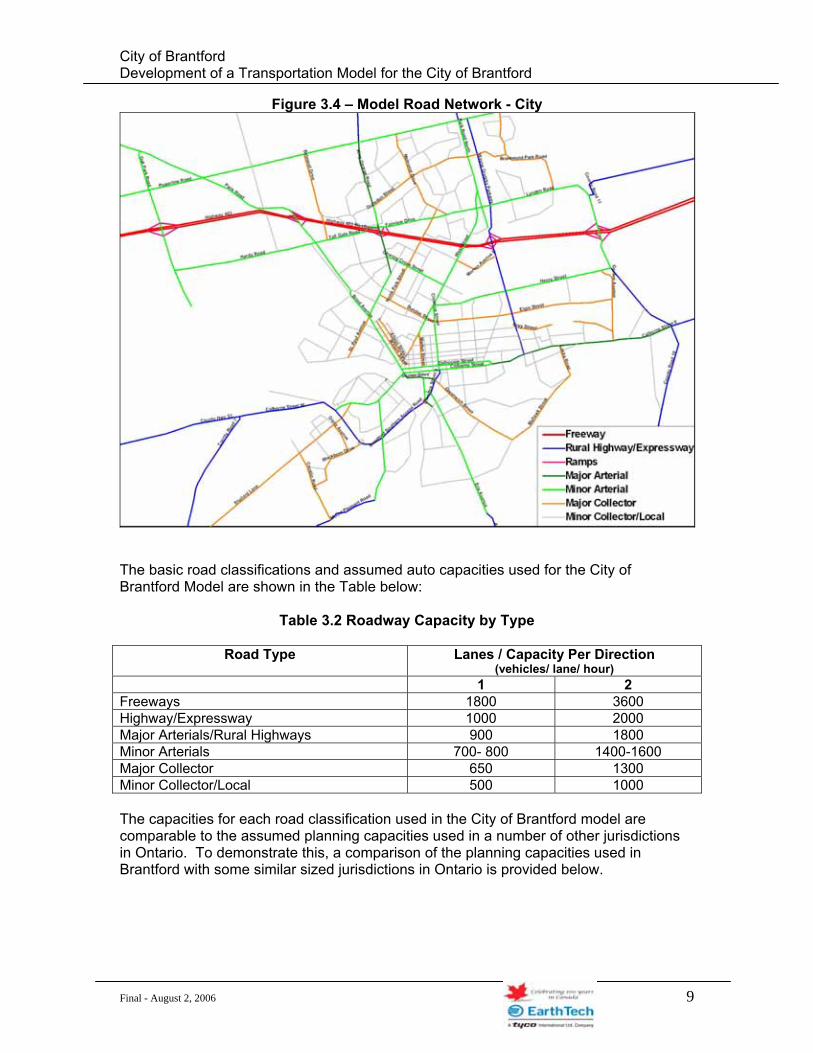
For the links in the model representing the major road network in the City, key attributes are coded into the model to describe how each link operates. The model uses these characteristics to determine best routes for traffic to travel between each origin and destination location. Each of the road network links are grouped by their functional classification so roadways having the same basic function and design characteristics are treated the same for modeling purposes. The key attributes used by the model are; road classification, Free Flow Speed (which typically represents average operating speeds as opposed to posted speed limits), Length (which is automatically provided by the TransCAD GIS Software), Capacity and Number of Lanes by Direction, and the Volume Delay Function for each road (which describes how the speeds and travel times change as the volume of traffic increases). The roadway classification system used in the model attempts to characterize different types of roadways based on the role they play in serving travel demands. The road network in the transportation model has been divided into 6 functional classifications for the purpose of modeling future travel demands, based on the prevailing traffic volumes, degree of access restrictions, and general nature of the land use around the roadway. These road network classifications may not correspond to the road network classification system used in the official plan, particularly for collector / local road segments.
Final - August 2, 2006 8
City of Brantford Development of a Transportation Model for the City of Brantford
Figure 3.4 – Model Road Network - City
The basic road classifications and assumed auto capacities used for the City of Brantford Model are shown in the Table below:
Table 3.2 Roadway Capacity by Type
Road Type Lanes / Capacity Per Direction (vehicles/ lane/ hour)
1 2 Freeways 1800 3600 Highway/Expressway 1000 2000 Major Arterials/Rural Highways 900 1800 Minor Arterials 700- 800 1400-1600 Major Collector 650 1300 Minor Collector/Local 500 1000 The capacities for each road classification used in the City of Brantford model are comparable to the assumed planning capacities used in a number of other jurisdictions in Ontario. To demonstrate this, a comparison of the planning capacities used in Brantford with some similar sized jurisdictions in Ontario is provided below.
Final - August 2, 2006 9
City of Brantford Development of a Transportation Model for the City of Brantford
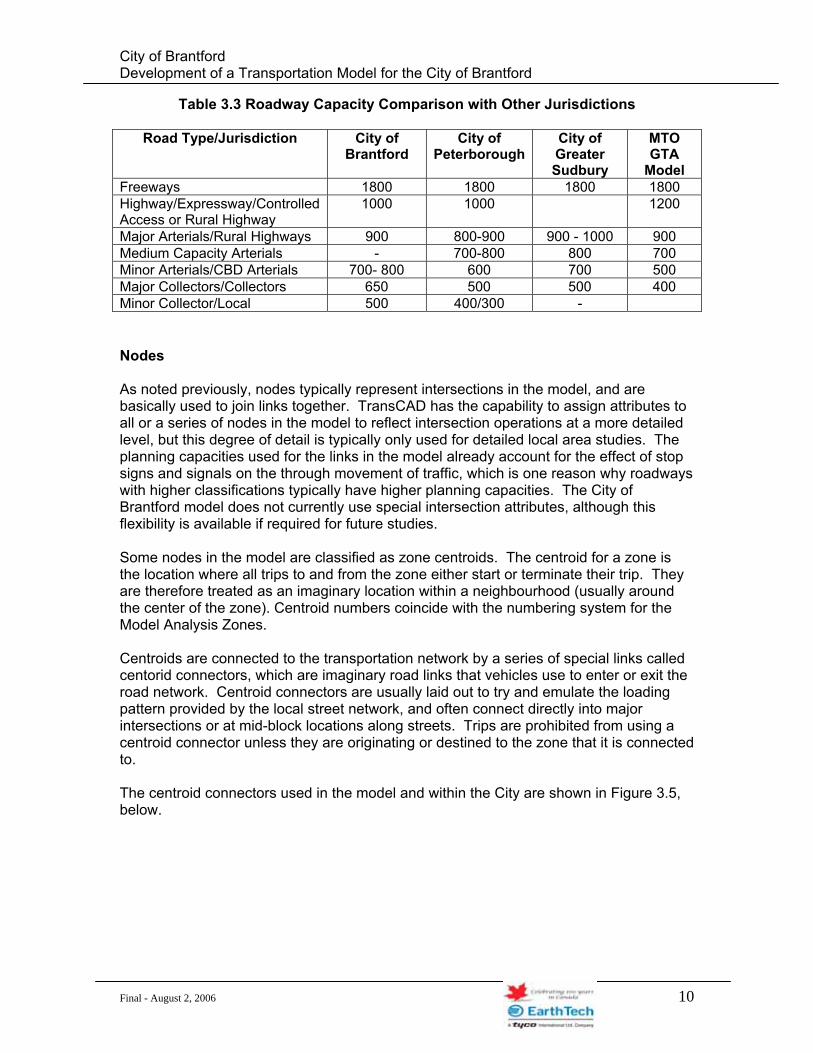
Table 3.3 Roadway Capacity Comparison with Other Jurisdictions
Road Type/Jurisdiction City of Brantford
City of Peterborough
City of Greater Sudbury
MTO GTA
Model Freeways 1800 1800 1800 1800 Highway/Expressway/Controlled Access or Rural Highway
1000 1000
1200
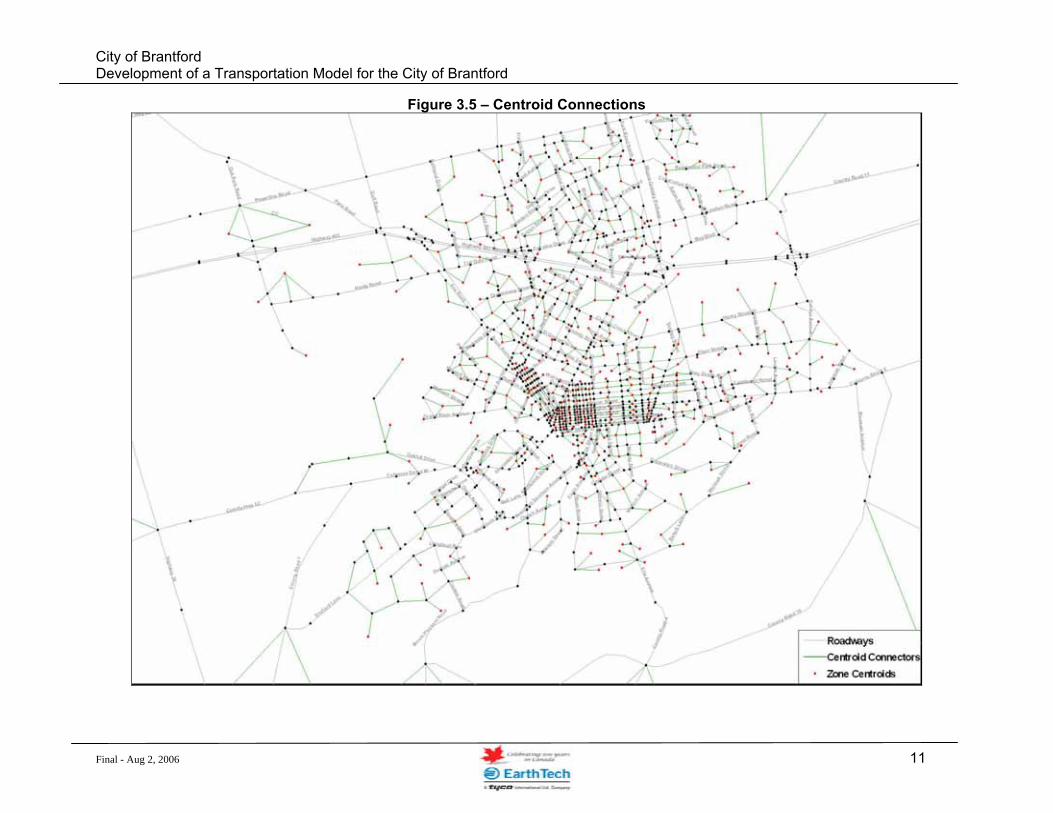
Major Arterials/Rural Highways 900 800-900 900 - 1000 900 Medium Capacity Arterials - 700-800 800 700 Minor Arterials/CBD Arterials 700- 800 600 700 500 Major Collectors/Collectors 650 500 500 400 Minor Collector/Local 500 400/300 - Nodes As noted previously, nodes typically represent intersections in the model, and are basically used to join links together. TransCAD has the capability to assign attributes to all or a series of nodes in the model to reflect intersection operations at a more detailed level, but this degree of detail is typically only used for detailed local area studies. The planning capacities used for the links in the model already account for the effect of stop signs and signals on the through movement of traffic, which is one reason why roadways with higher classifications typically have higher planning capacities. The City of Brantford model does not currently use special intersection attributes, although this flexibility is available if required for future studies. Some nodes in the model are classified as zone centroids. The centroid for a zone is the location where all trips to and from the zone either start or terminate their trip. They are therefore treated as an imaginary location within a neighbourhood (usually around the center of the zone). Centroid numbers coincide with the numbering system for the Model Analysis Zones. Centroids are connected to the transportation network by a series of special links called centorid connectors, which are imaginary road links that vehicles use to enter or exit the road network. Centroid connectors are usually laid out to try and emulate the loading pattern provided by the local street network, and often connect directly into major intersections or at mid-block locations along streets. Trips are prohibited from using a centroid connector unless they are originating or destined to the zone that it is connected to. The centroid connectors used in the model and within the City are shown in Figure 3.5, below.
Final - August 2, 2006 10
City of Brantford Development of a Transportation Model for the City of Brantford
Final - Aug 2, 2006 11
Figure 3.5 – Centroid Connections
City of Brantford Development of a Transportation Model for the City of Brantford
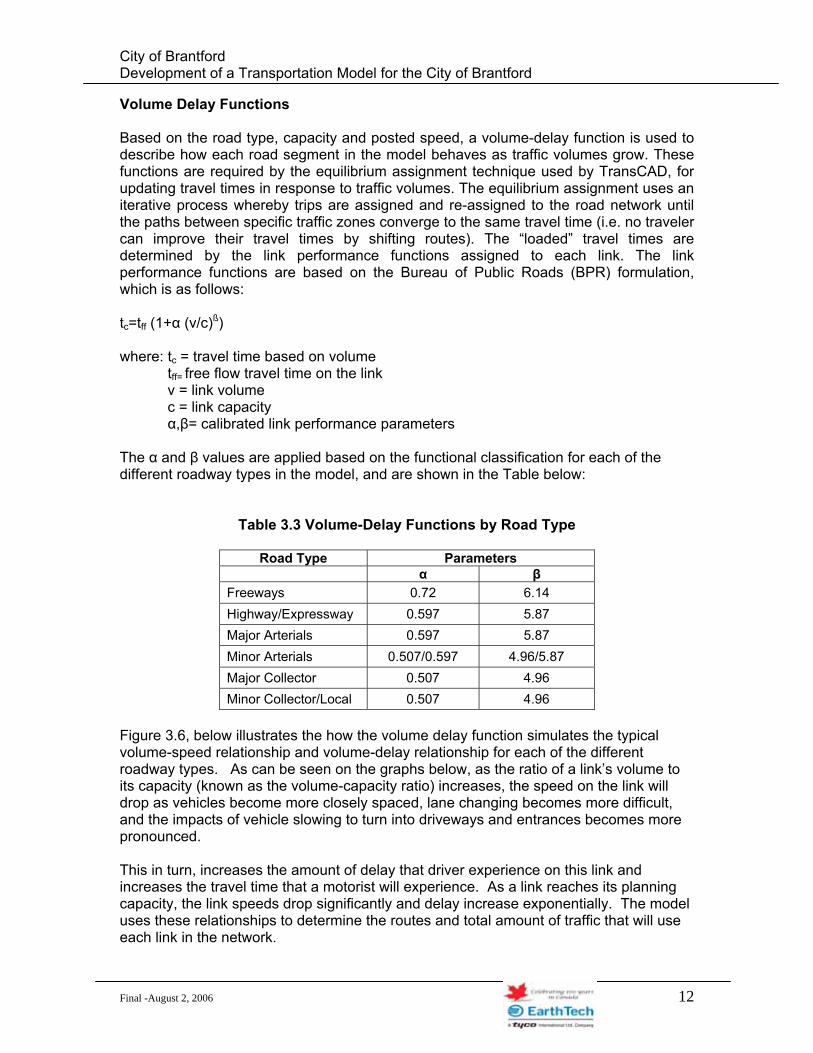
Volume Delay Functions Based on the road type, capacity and posted speed, a volume-delay function is used to describe how each road segment in the model behaves as traffic volumes grow. These functions are required by the equilibrium assignment technique used by TransCAD, for updating travel times in response to traffic volumes. The equilibrium assignment uses an iterative process whereby trips are assigned and re-assigned to the road network until the paths between specific traffic zones converge to the same travel time (i.e. no traveler can improve their travel times by shifting routes). The “loaded” travel times are determined by the link performance functions assigned to each link. The link performance functions are based on the Bureau of Public Roads (BPR) formulation, which is as follows: tc=tff (1+α (v/c)ß) where: tc = travel time based on volume tff= free flow travel time on the link v = link volume c = link capacity α,β= calibrated link performance parameters The α and β values are applied based on the functional classification for each of the different roadway types in the model, and are shown in the Table below:
Table 3.3 Volume-Delay Functions by Road Type
Road Type Parameters
α β Freeways 0.72 6.14 Highway/Expressway 0.597 5.87 Major Arterials 0.597 5.87 Minor Arterials 0.507/0.597 4.96/5.87 Major Collector 0.507 4.96 Minor Collector/Local 0.507 4.96
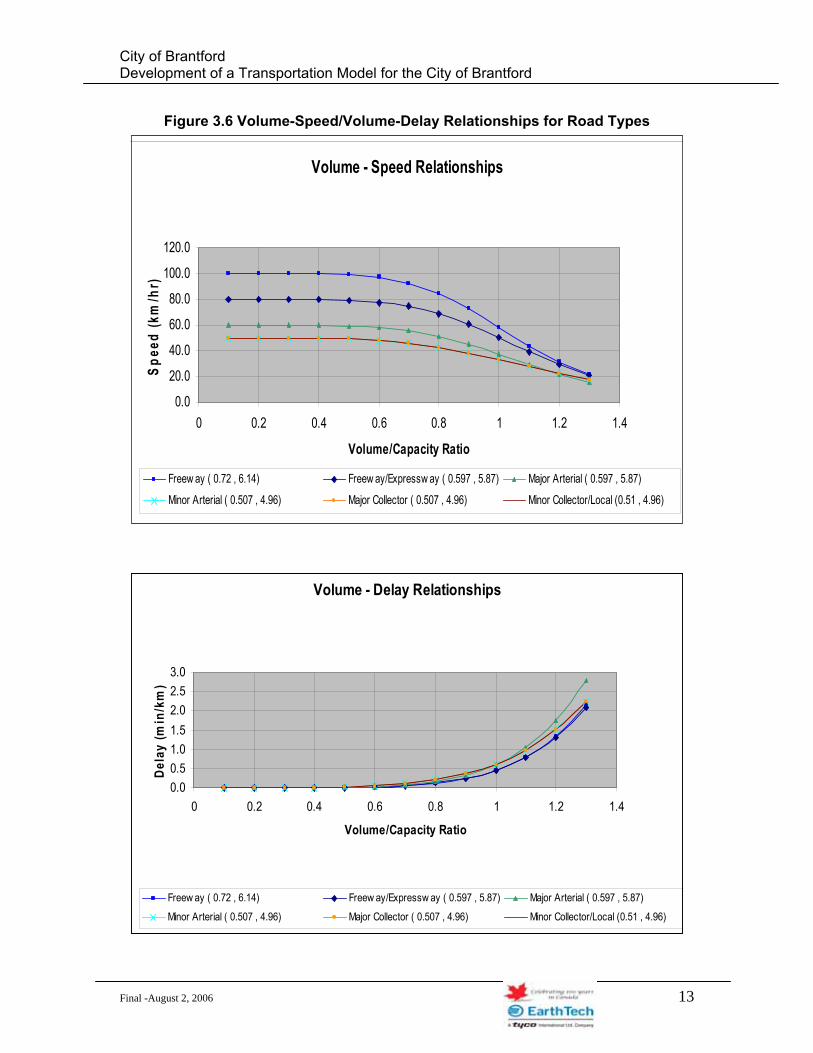
Figure 3.6, below illustrates the how the volume delay function simulates the typical volume-speed relationship and volume-delay relationship for each of the different roadway types. As can be seen on the graphs below, as the ratio of a link’s volume to its capacity (known as the volume-capacity ratio) increases, the speed on the link will drop as vehicles become more closely spaced, lane changing becomes more difficult, and the impacts of vehicle slowing to turn into driveways and entrances becomes more pronounced. This in turn, increases the amount of delay that driver experience on this link and increases the travel time that a motorist will experience. As a link reaches its planning capacity, the link speeds drop significantly and delay increase exponentially. The model uses these relationships to determine the routes and total amount of traffic that will use each link in the network.
Final -August 2, 2006 12
City of Brantford Development of a Transportation Model for the City of Brantford
Figure 3.6 Volume-Speed/Volume-Delay Relationships for Road Types
Volume - Delay Relationships
0.00.51.01.52.02.53.0
0 0.2 0.4 0.6 0.8 1 1.2 1.4
Volume/Capacity Ratio
Dela
y (m
in/k
m)
Freew ay ( 0.72 , 6.14) Freew ay/Expressw ay ( 0.597 , 5.87) Major Arterial ( 0.597 , 5.87)
Minor Arterial ( 0.507 , 4.96) Major Collector ( 0.507 , 4.96) Minor Collector/Local (0.51 , 4.96)
Volume - Speed Relationships
0.0
20.0
40.0
60.0
80.0
100.0
120.0
0 0.2 0.4 0.6 0.8 1 1.2 1.4
Volume/Capacity Ratio
Spee
d (k
m/h
r)
Freew ay ( 0.72 , 6.14) Freew ay/Expressw ay ( 0.597 , 5.87) Major Arterial ( 0.597 , 5.87)
Minor Arterial ( 0.507 , 4.96) Major Collector ( 0.507 , 4.96) Minor Collector/Local (0.51 , 4.96)
Final -August 2, 2006 13
City of Brantford Development of a Transportation Model for the City of Brantford
4 UPDATE THE HOME TO WORK TRAVEL PATTERNS
The original 1995 travel demands, used for the 1997 Brantford Transportation Study, served as a starting point for developing an updated base 2005 trip matrix. Much has changed since the original travel survey was done as part of the 1997 Transportation Master Plan. Within the City, the completion of the north-south portion of Wayne Gretzky Parkway and portions of the BSAR, have affected local travel patterns compared to 1995. Continued growth in the Southwest area of the City has contributed to increased travel on these routes and others. One of the major changes affecting travel demands in the City has been the completion of Highway 403 through the City. This facility now provides a direct connection between the GTA / Hamilton / Niagara Falls and the London / Windsor area and is heavily used by commuter, tourist, and commercial traffic. The influence of this connection is demonstrated with the increased growth in industrial development in the northwest corner of the City, adjacent to the Highway 403 at the Oak Park Road interchange. Where Brantford used to operate largely independent of the GTA and Hamilton, new residents seeking lower housing costs and improved quality of life are increasingly relocating to Brantford. This has resulted in an increase in work related travel demands to and from the GTA & Hamilton, largely influenced by the completion of Highway 403. Finding data to update travel patterns based on origins and destinations of trips is difficult as the only way to collect this data is through travel surveys. The Census, undertaken every 5 years, does provide an excellent data source to update work related travel patterns through the Place of Residence – Place of Work component of the survey, which is administered to approximately 20% of the population. The Census data identifies daily home-to-work trips based on mode of travel. Among the three trip purposes used in the model, the trip making patterns of the Home Based Work trips was felt to be most affected by the change in travel patterns that occurred as a result of the completion of Highway 403. While Home Based Other and Non Home Based trips may change to some degree as well, any significant increase in longer distance trip making for these non work trips is expected to occur outside the peak hour. During the peak hour it is expected that these trip patterns would be similar to those observed in 1995. Since the HBW trips make up 38% of the total travel demand during the PM Peak hour, it was determined that an update to this component of the trip matrix, using the recent 2001 census Place-of-residence (POR)/ Place-of-Work (POW) data for Brantford, would significantly enhance the model for the purpose of this study. The total Auto HBW trips within the model can be classified under four categories:
• Internal to internal trips – trips having their origin and destination within the City, • Internal to external – trips originating in the City with a destination outside the City, • External to Internal – trips originating outside the City with a destination inside the
City, and • External to external – trips that have their origin and destination outside of the City.
Final -August 2, 2006 14
City of Brantford Development of a Transportation Model for the City of Brantford
Since the External to External HBW trips represent through traffic, which does not originate or end in Brantford, these trips were excluded from the Census update and were updated based on observed growth rates at external count stations. From the Census data, the number of residents living within a zone and working in another zone was obtained. Since the model simulates PM Peak hour travel patterns, a methodology to convert the place of residence and place of work to PM Peak Hour Trips was required to be developed. This was done as a three step process:
1. Conversion of place of residence and place of work to daily trips, 2. Conversion of daily trips to peak hour trips, and 3. Determination of peak hour flow directions.
Since the census data provides the location of home and work, the first step in the process involved converting this into daily trips, assuming that each person who travels to work returns home the same day. To capture the proper spatial relationships, a copy of the Census residence-work matrix was transposed and added the original matrix to create daily work trips between zones. The second step involved the conversion of daily work trips into peak hour work trips. It was assumed that the majority of people in Brantford go to work from home or vice-versa in the AM or PM peak periods, which covers the 6am to 10am and 3pm to 7pm time periods. As the model only forecasts the PM peak hour trips, we needed to know how many of the peak period trips are made in the afternoon peak hour only. Analysis of existing traffic count data in the City showed that the PM peak hour volumes are approximately 40% of the PM peak period volumes. Analysis of 2001 Transportation Tomorrow Survey (TTS) data for the municipalities within the GTA suggests a similar percentage of HBW trips are made during the AM peak. Therefore, the daily trip matrix developed above was multiplied by 0.40 to produce the PM peak hour HBW person trip matrix. This reflects the HBW trips made during the P.M. Peak Hour. The final step was to establish the direction of flow patterns between each origin and destination zone for these trips. While the majority of HBW trips that occur in the PM Peak Hour occur between someone’s work and their home, it is recognized that many part time workers and shift workers start their shifts in the afternoon. Therefore the direction of flow between each origin and destination zone is important to understand the overall travel patterns. To complete this last step, it was first necessary to assume that the overall trends in terms of direction of flow for work trips had not changed since 1995. In other words, it was assumed that the proportion of P.M. Peak Hour trips that travel home from work, versus travelling from work to home had not changed significantly between 1995 and 2001. Based on this assumption, the 1995 HBW trip matrix was used to provide an estimate of the proportion of total trips between each origin-destination pair by direction of travel. These same proportions were applied to the 2001 Census data to the update of the HBW trip matrix. Again, for some traffic zone pairs there were no trips in 1995 trip matrix, while they have trips in 2001. For these traffic zones, trip pattern have been taken from the adjacent zones which had trips in 1995 trip matrix.
Final -August 2, 2006 15
City of Brantford Development of a Transportation Model for the City of Brantford
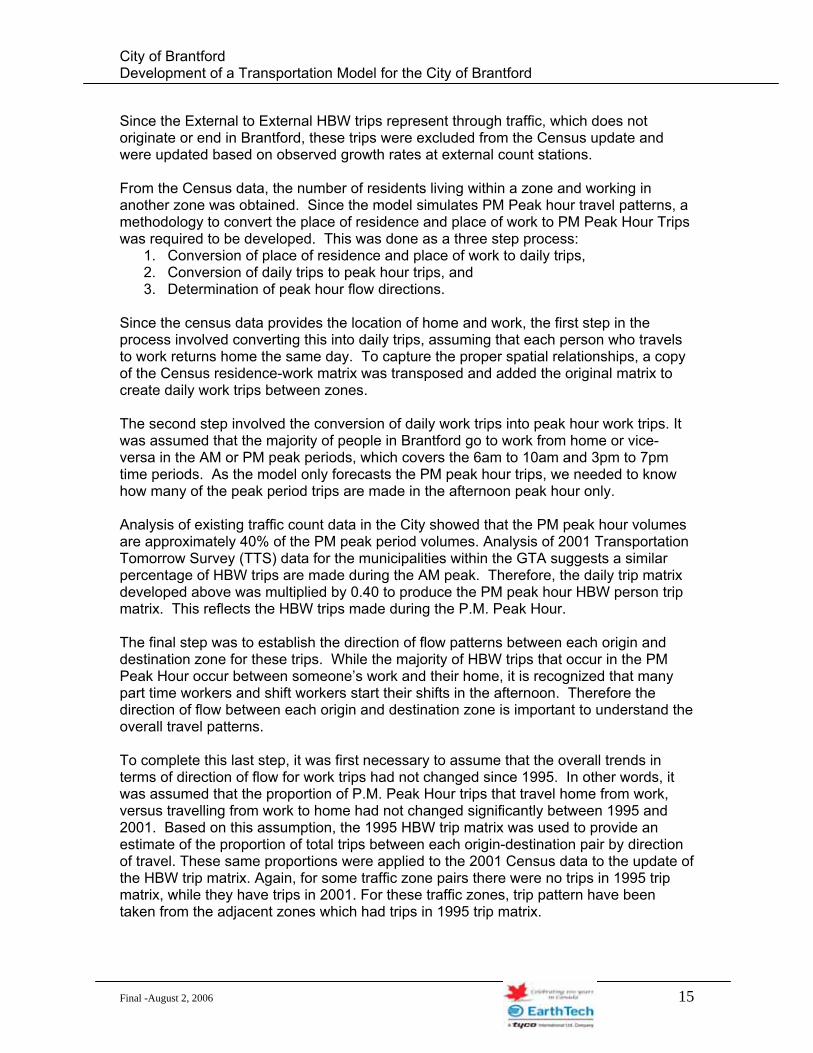
The comparison of original 1995 HBW auto person matrix with the updated 2001 HBW person trip matrix derived from the census data shows the resulting changes in internal and external trips made to/from Brantford as a result of the changing commuter travel patterns over the past 10 years.
Table 4.1 PM Peak Hour Person Trip Distribution Trip Type % of 1995 HBW Auto
Person Trips % of 2001 HBW Auto Person
Trips (updated from 2001 Census)
Internal to Internal 56.4 % 37.8 % Internal to External 20.8 % 26.8 % External to Internal 19.4 % 32.5 % External to External 3.5 % 3.1 % Table 4.1 above clearly shows a significant increase in the share of trips between internal and external zones during the PM Peak Hour. This increase is highest for the return movement, from external (employment) zones to internal (residence) zones, which matches observed traffic count patterns on Highway 403 and other key commuter links in the area. This pattern supports the notion that with the introduction of Highway 403 in Brantford, people are commuting more for work. This happens for trips from Brantford to outside and vice-versa. As a result the proportion of total trips that remain within the City boundaries during peak periods is significantly reduced.
5 UPDATE TRAVEL PATTERNS FOR OTHER TRIP PURPOSES
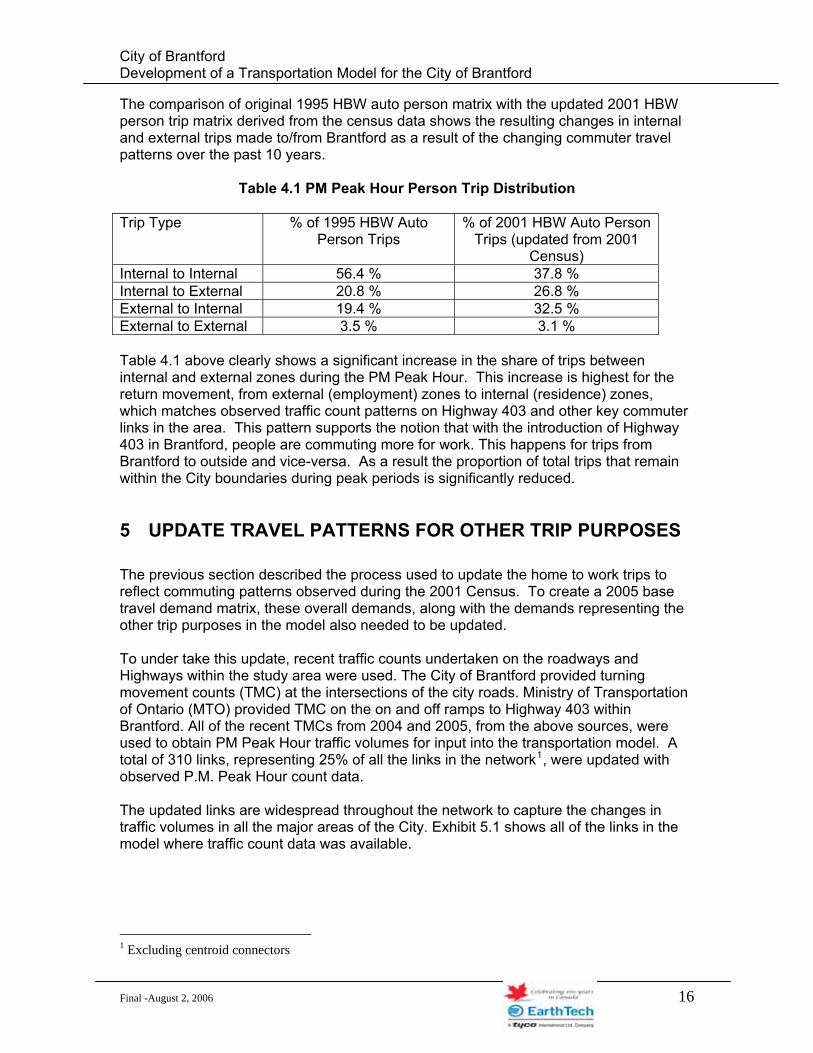
The previous section described the process used to update the home to work trips to reflect commuting patterns observed during the 2001 Census. To create a 2005 base travel demand matrix, these overall demands, along with the demands representing the other trip purposes in the model also needed to be updated. To under take this update, recent traffic counts undertaken on the roadways and Highways within the study area were used. The City of Brantford provided turning movement counts (TMC) at the intersections of the city roads. Ministry of Transportation of Ontario (MTO) provided TMC on the on and off ramps to Highway 403 within Brantford. All of the recent TMCs from 2004 and 2005, from the above sources, were used to obtain PM Peak Hour traffic volumes for input into the transportation model. A total of 310 links, representing 25% of all the links in the network1, were updated with observed P.M. Peak Hour count data. The updated links are widespread throughout the network to capture the changes in traffic volumes in all the major areas of the City. Exhibit 5.1 shows all of the links in the model where traffic count data was available.
1 Excluding centroid connectors
Final -August 2, 2006 16
City of Brantford Development of a Transportation Model for the City of Brantford
Figure 5.1 Roadway Links with Traffic Counts
The TransCAD software includes a procedure which allows for the updating of a base year trip matrix using traffic count data included within fields in the model. This procedure is known as Origin-Destination Matrix Estimation (ODME), and is based on the work of O. A. Nielsen (1998)2. This procedure uses an iterative approach that switches between traffic assignment and matrix estimation stages to update a base matrix to match observed counts. Obviously the more available count data that is available, the more reliable the estimate. To complete this update, the 1995 auto person matrix (for the NHB and HBO trips) was combined with the estimated 2001 HBW matrix to create a base P.M. Peak Hour auto person trip matrix. This was converted to an auto vehicle trip matrix by application of an auto occupancy factor for each trip purpose based on the 1995 travel survey3.
2 Travel Demand Modeling with TransCad 4.7, Users Manual 3 See Page 3, Section 2 for 1995 Auto Occupancies by Trip Purpose – 2001 Auto Occupancies for Work Trips was 1.11 from Census. 3 Include Traffic Zone 37 and 45.
Final -August 2, 2006 17
City of Brantford Development of a Transportation Model for the City of Brantford
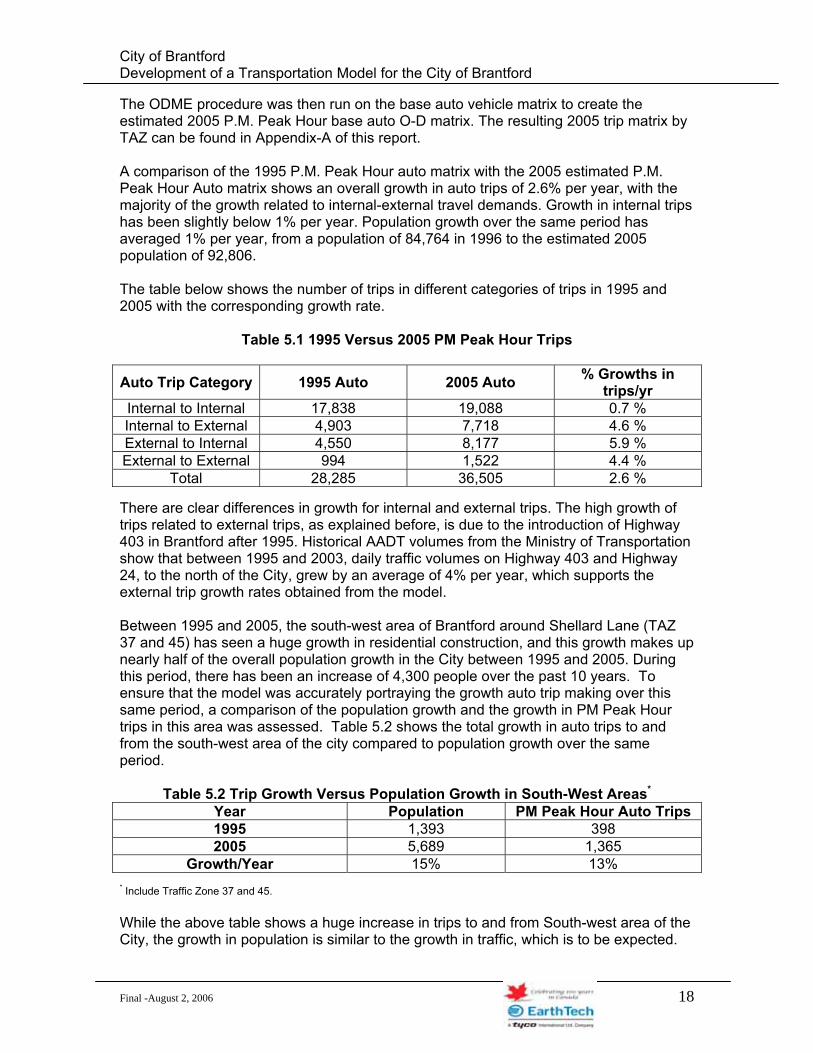
The ODME procedure was then run on the base auto vehicle matrix to create the estimated 2005 P.M. Peak Hour base auto O-D matrix. The resulting 2005 trip matrix by TAZ can be found in Appendix-A of this report. A comparison of the 1995 P.M. Peak Hour auto matrix with the 2005 estimated P.M. Peak Hour Auto matrix shows an overall growth in auto trips of 2.6% per year, with the majority of the growth related to internal-external travel demands. Growth in internal trips has been slightly below 1% per year. Population growth over the same period has averaged 1% per year, from a population of 84,764 in 1996 to the estimated 2005 population of 92,806. The table below shows the number of trips in different categories of trips in 1995 and 2005 with the corresponding growth rate.
Table 5.1 1995 Versus 2005 PM Peak Hour Trips
Auto Trip Category 1995 Auto 2005 Auto % Growths in trips/yr
Internal to Internal 17,838 19,088 0.7 % Internal to External 4,903 7,718 4.6 % External to Internal 4,550 8,177 5.9 % External to External 994 1,522 4.4 %
Total 28,285 36,505 2.6 % There are clear differences in growth for internal and external trips. The high growth of trips related to external trips, as explained before, is due to the introduction of Highway 403 in Brantford after 1995. Historical AADT volumes from the Ministry of Transportation show that between 1995 and 2003, daily traffic volumes on Highway 403 and Highway 24, to the north of the City, grew by an average of 4% per year, which supports the external trip growth rates obtained from the model. Between 1995 and 2005, the south-west area of Brantford around Shellard Lane (TAZ 37 and 45) has seen a huge growth in residential construction, and this growth makes up nearly half of the overall population growth in the City between 1995 and 2005. During this period, there has been an increase of 4,300 people over the past 10 years. To ensure that the model was accurately portraying the growth auto trip making over this same period, a comparison of the population growth and the growth in PM Peak Hour trips in this area was assessed. Table 5.2 shows the total growth in auto trips to and from the south-west area of the city compared to population growth over the same period.
Table 5.2 Trip Growth Versus Population Growth in South-West Areas*
Year Population PM Peak Hour Auto Trips 1995 1,393 398 2005 5,689 1,365
15% 13% Growth/Year * Include Traffic Zone 37 and 45. While the above table shows a huge increase in trips to and from South-west area of the City, the growth in population is similar to the growth in traffic, which is to be expected.
Final -August 2, 2006 18
City of Brantford Development of a Transportation Model for the City of Brantford
6 TRIP GENERATION / TRIP DISTRIBUTION
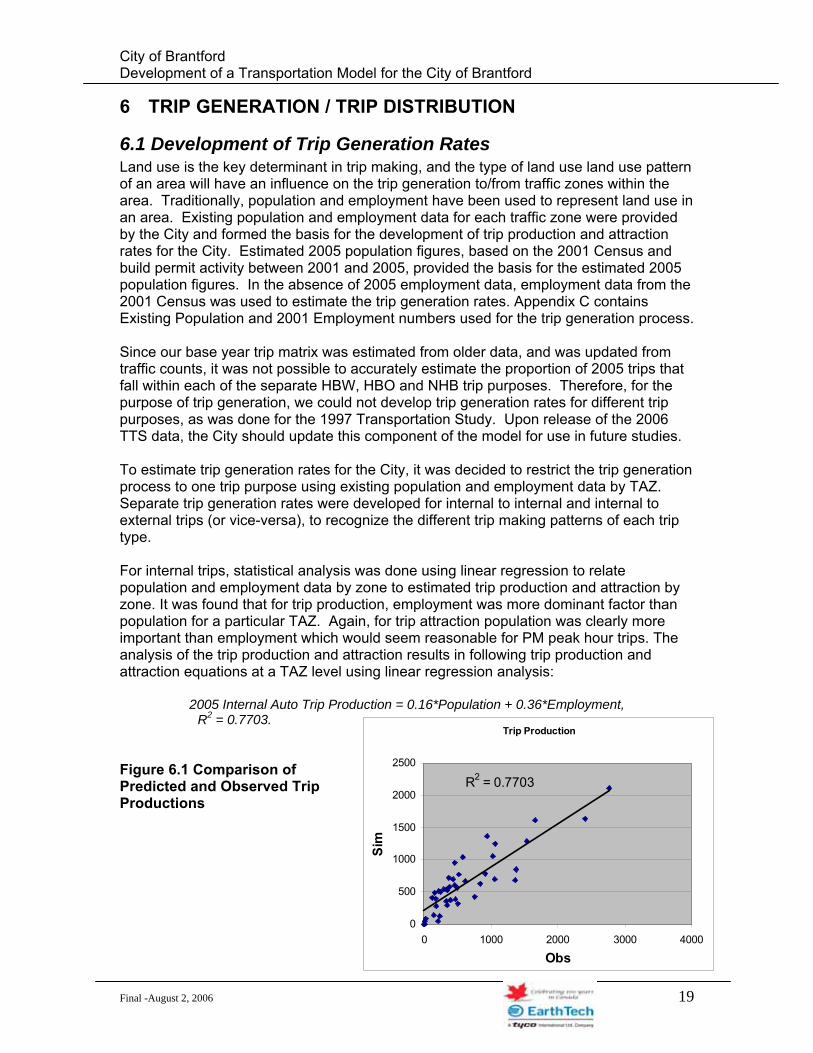
6.1 Development of Trip Generation Rates Land use is the key determinant in trip making, and the type of land use land use pattern of an area will have an influence on the trip generation to/from traffic zones within the area. Traditionally, population and employment have been used to represent land use in an area. Existing population and employment data for each traffic zone were provided by the City and formed the basis for the development of trip production and attraction rates for the City. Estimated 2005 population figures, based on the 2001 Census and build permit activity between 2001 and 2005, provided the basis for the estimated 2005 population figures. In the absence of 2005 employment data, employment data from the 2001 Census was used to estimate the trip generation rates. Appendix C contains Existing Population and 2001 Employment numbers used for the trip generation process. Since our base year trip matrix was estimated from older data, and was updated from traffic counts, it was not possible to accurately estimate the proportion of 2005 trips that fall within each of the separate HBW, HBO and NHB trip purposes. Therefore, for the purpose of trip generation, we could not develop trip generation rates for different trip purposes, as was done for the 1997 Transportation Study. Upon release of the 2006 TTS data, the City should update this component of the model for use in future studies. To estimate trip generation rates for the City, it was decided to restrict the trip generation process to one trip purpose using existing population and employment data by TAZ. Separate trip generation rates were developed for internal to internal and internal to external trips (or vice-versa), to recognize the different trip making patterns of each trip type. For internal trips, statistical analysis was done using linear regression to relate population and employment data by zone to estimated trip production and attraction by zone. It was found that for trip production, employment was more dominant factor than population for a particular TAZ. Again, for trip attraction population was clearly more important than employment which would seem reasonable for PM peak hour trips. The analysis of the trip production and attraction results in following trip production and attraction equations at a TAZ level using linear regression analysis:
2005 Internal Auto Trip Production = 0.16*Population + 0.36*Employment, R2 = 0.7703.
Trip Production
R2 = 0.7703
0
500
1000
1500
2000
2500
0 1000 2000 3000 4000
Obs
Sim
Figure 6.1 Comparison of Predicted and Observed Trip Productions
Final -August 2, 2006 19
City of Brantford Development of a Transportation Model for the City of Brantford
Final -August 2, 2006 20
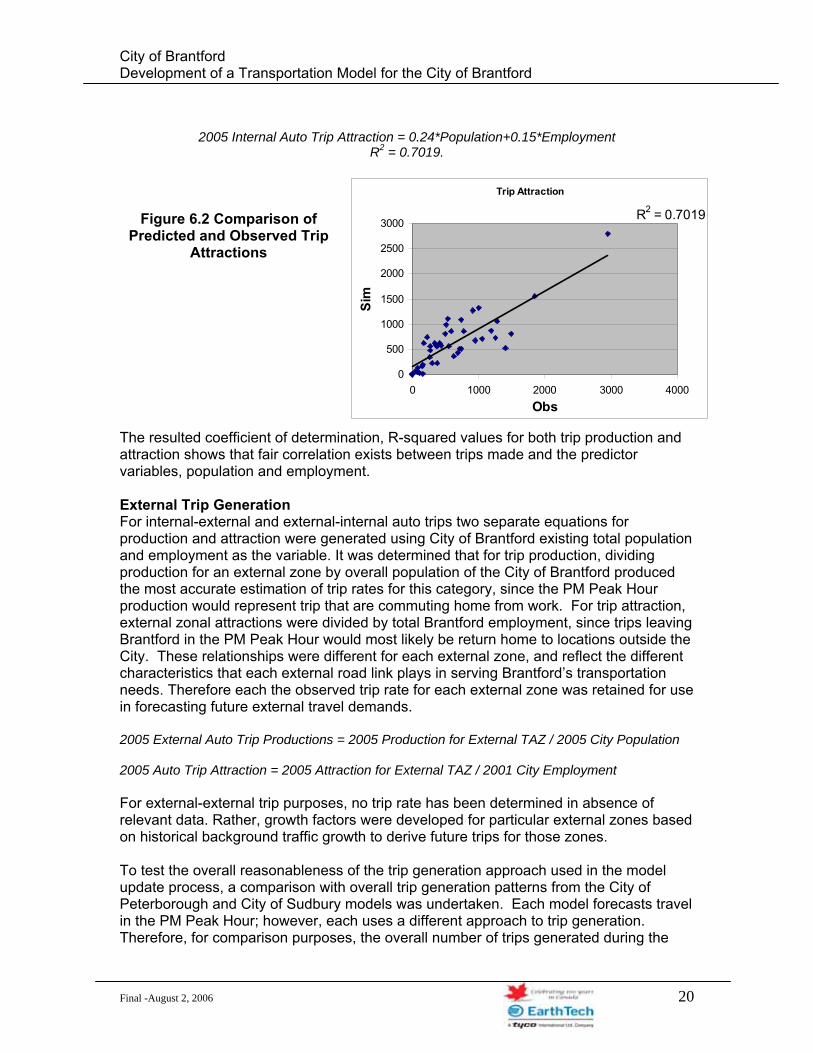
2005 Internal Auto Trip Attraction = 0.24*Population+0.15*Employment R2 = 0.7019.
Trip Attraction
R2 = 0.7019
0
500
1000
1500
2000
2500
3000
0 1000 2000 3000 4000Obs
Sim
Figure 6.2 Comparison of
Predicted and Observed Trip Attractions
The resulted coefficient of determination, R-squared values for both trip production and attraction shows that fair correlation exists between trips made and the predictor variables, population and employment. External Trip Generation For internal-external and external-internal auto trips two separate equations for production and attraction were generated using City of Brantford existing total population and employment as the variable. It was determined that for trip production, dividing production for an external zone by overall population of the City of Brantford produced the most accurate estimation of trip rates for this category, since the PM Peak Hour production would represent trip that are commuting home from work. For trip attraction, external zonal attractions were divided by total Brantford employment, since trips leaving Brantford in the PM Peak Hour would most likely be return home to locations outside the City. These relationships were different for each external zone, and reflect the different characteristics that each external road link plays in serving Brantford’s transportation needs. Therefore each the observed trip rate for each external zone was retained for use in forecasting future external travel demands. 2005 External Auto Trip Productions = 2005 Production for External TAZ / 2005 City Population 2005 Auto Trip Attraction = 2005 Attraction for External TAZ / 2001 City Employment For external-external trip purposes, no trip rate has been determined in absence of relevant data. Rather, growth factors were developed for particular external zones based on historical background traffic growth to derive future trips for those zones. To test the overall reasonableness of the trip generation approach used in the model update process, a comparison with overall trip generation patterns from the City of Peterborough and City of Sudbury models was undertaken. Each model forecasts travel in the PM Peak Hour; however, each uses a different approach to trip generation. Therefore, for comparison purposes, the overall number of trips generated during the
City of Brantford Development of a Transportation Model for the City of Brantford
PM peak hour was compared on a per capita basis. Table 6.1 summarizes this comparison.
Table 6.1 Trip Generation Per Capita Comparisons
Base Population PM Peak Hour Auto Trips
PM Peak Hour Trips per Person
City of Brantford 92,800* 34,983** 0.377 City of Peterborough 76,290*** 28,275** 0.370 City of Sudbury 155,225 60,260 0.388 * Population within City, excluding townships in surrounding Brant County ** Internal plus Internal-External Trips ** Population within City, excluding townships in surrounding Peterborough County Based on the above assessment, it was concluded that the updated base year trip matrix, and the resulting trip generation equations generated by the model, were suitable for use in forecasting auto trip generation patterns in the City of Brantford at a city wide level. To provide refined corridor level forecasts, it is recommended that the City update their model in 2007 / 2008, upon the release of the full TTS survey data.
6.2 Trip Distribution Trip distribution is a process used to determine the destination choices for trips generated by trip makers. There are two basic types of trip distribution models currently in use:
• Growth Factor Methods – which involve factoring an existing matrix based on projected productions and/or attractions generated by each zone in the matrix using an iterative process. This method is often referred to as an unconstrained approach, since the capacity and performance of the transportation network is not considered in forecasting the number of trips that will travel between zones.
• Gravity Model – which predicts the flows between zones based on the impedance of travel between these zones, usually determined by network travel times or other costs to travel between zones and the total number of trips produced and attracted by each zone. This approach explicitly relates the flows between zones to the difficulty of traveling between them.
The Gravity model is based on the Newton’s Laws of gravitational attraction, in that the closer two objects (zones) are together and the larger they are (the larger the number of trips they produce and attract), they will have a larger attraction, and the more likely it is that trips will occur between them. This approach has good technical merits and is widely used in transportation planning models throughout North America, but requires extensive base data to calibrate the equations for each individual trip purpose, since the willingness to travel longer distances is highly influenced by trip purpose. For the purpose of this initial model development process, we utilized a doubly constrained “Growth Factor” method, often referred to as a fratar balancing approach, to predict future trip patterns between zones. The fratar method uses the existing trip matrix as a basis for forecasting the future patterns, and develops growth factors for total
Final -August 2, 2006 21
City of Brantford Development of a Transportation Model for the City of Brantford
trip productions and attractions by traffic zone to scale the values in the matrix. The equation for the growth factor method is shown by : Tij = tij * ai * bj Where Tij = forecast flow between zone i and zone j tij = the base year flow between zone i and zone j ai = balancing factor for row i bj = balancing factor for row j The methodology uses an iterative process that alternates between factoring the productions and then factoring the attractions to match the total forecast productions and attractions for each zone, with a pre set convergence factor. For zones with zero trips in the base year, common for new growth areas, seed values were used in the matrix based on the trip distribution patterns for adjacent zones that have values in the base year.
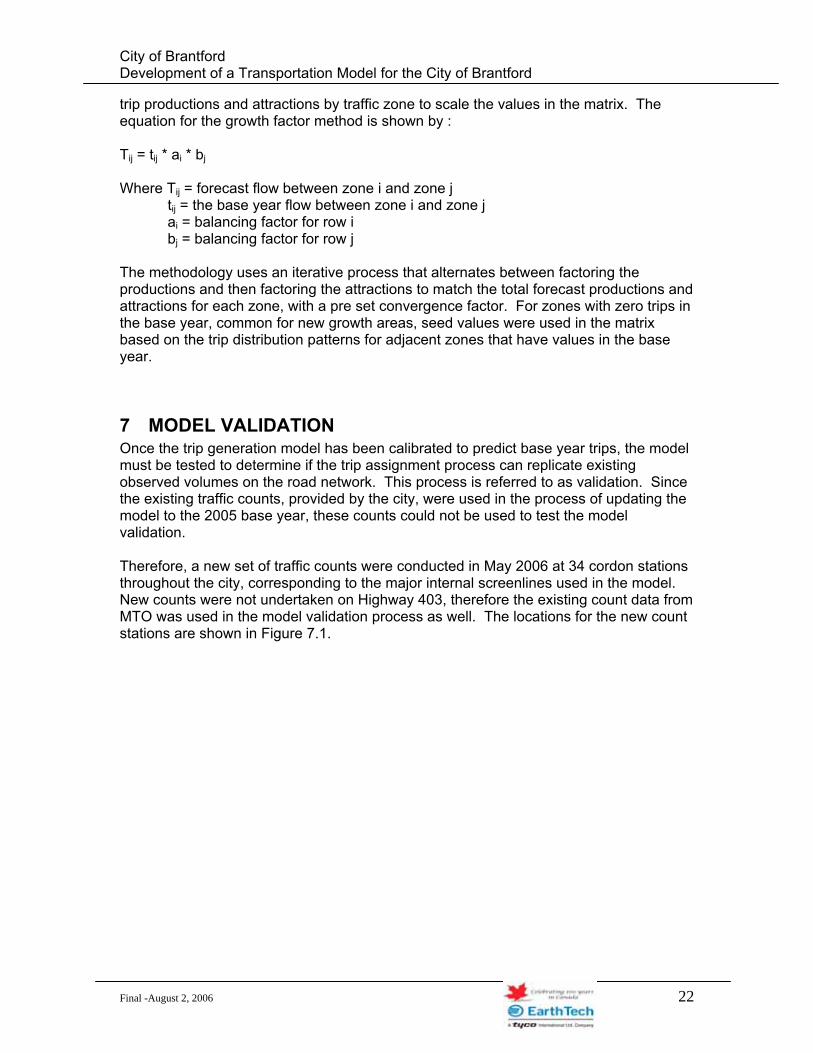
7 MODEL VALIDATION Once the trip generation model has been calibrated to predict base year trips, the model must be tested to determine if the trip assignment process can replicate existing observed volumes on the road network. This process is referred to as validation. Since the existing traffic counts, provided by the city, were used in the process of updating the model to the 2005 base year, these counts could not be used to test the model validation. Therefore, a new set of traffic counts were conducted in May 2006 at 34 cordon stations throughout the city, corresponding to the major internal screenlines used in the model. New counts were not undertaken on Highway 403, therefore the existing count data from MTO was used in the model validation process as well. The locations for the new count stations are shown in Figure 7.1.
Final -August 2, 2006 22
City of Brantford Development of a Transportation Model for the City of Brantford
Figure 7.1 Validation Count Locations
Legend Major Screenlines
Count Locations
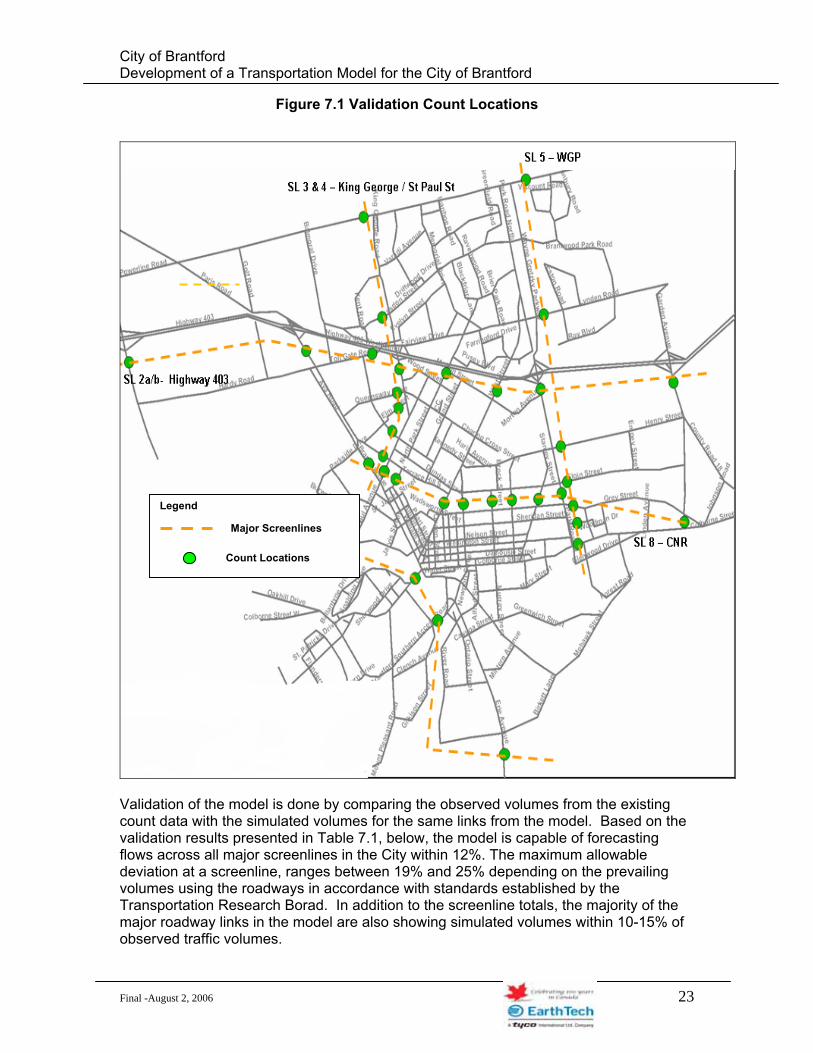
Validation of the model is done by comparing the observed volumes from the existing count data with the simulated volumes for the same links from the model. Based on the validation results presented in Table 7.1, below, the model is capable of forecasting flows across all major screenlines in the City within 12%. The maximum allowable deviation at a screenline, ranges between 19% and 25% depending on the prevailing volumes using the roadways in accordance with standards established by the Transportation Research Borad. In addition to the screenline totals, the majority of the major roadway links in the model are also showing simulated volumes within 10-15% of observed traffic volumes.
Final -August 2, 2006 23
City of Brantford Development of a Transportation Model for the City of Brantford
Table 7.1 Model Validation Screenline Results
Screenline LocationEB/NB WB/SB EB
1,096
665
427
1,1363,324
620
730
/NB WB/SB EB/NB WB/SBCOLBORNE ST W OF BRANT AVE 862 814 1,170 0.94 1.07
BSAR W OF ERIE AVE 505 557 743 1.10 1.12
ERIE AVE S OF BIRKETT LA 292 251 478 0.86 1.12
HWY 403 W OF OAK PARK RD 1,295 1,266 1,214 0.98 1.072,955 2,888 3,604 0.98 1.08
Maximum Allowable Deviation* 25% 24%
OAK PARK RD S OF HIGHWAY 403 588 196 118 0.33 0.19
PARIS RD S OF HIGHWAY 403 754 461 590 0.61 0.81
TO GEORGE ST 695 905 609 439 0.88 0.49
KING GEORGE RD S OF HWY 403 1,023 1,076 1,177 1,247 1.15 1.16
NORTH PARK ST S OF HWY 403 820 721 934 841 1.14 1.17
WEST ST S OF HIGHWAY 403 982 834 1,082 1,002 1.10 1.20
WGP S OF HIGHWAY 403 1,013 909 1,106 1,085 1.09 1.19
GARDEN AVE S OF HWY 403 843 896 758 1,075 0.90 1.206,719 6,692 6,322 6,398 0.94 0.96
Maximum Allowable Deviation 19% 19%
POWERLINE RD W OF KING GEORGE RD 435 475 481 442 1.11 0.93
OXFORD ST W OF KING GEORGE RD 176 230 109 314 0.62 1.37
TOLL GATE RD E OF ST GEORGE ST 695 905 643 599 0.93 0.66
HWY 403 W OF KING GEORGE RD 1,241 1,303 1,051 1,099 0.85 0.84
QUEENSWAY W OF KING GEORGE RD 195 200 77 174 0.40 0.87
ELM ST W OF KING GEORGE RD 35 58 29 73 0.82 1.27
ST GEORGE ST W OF ST PAUL AVE 79 82 85 84 1.08 1.02
T W OF ST PAUL AVE 170 175 329 185 1.94 1.05
BRANT AVE W OF ST PAUL AVE 462 418 450 498 0.97 1.193,488 3,846 3,254 3,468 0.93 0.90
Ma llowable Deviation 24% 24%
POWERLINE RD E OF WGP 458 315 449 289 0.98 0.92
LYNDEN RD E OF WGP 696 1,067 715 1,120 1.03 1.05
HWY 403 E OF WGP 1,546 1,438 1,507 1,643 0.97 1.14
HENRY ST E OF WGP 437 608 234 580 0.53 0.95
ELGIN ST E OF WGP 362 504 154 397 0.42 0.79
GREY ST E OF WGP 198 158 74 142 0.37 0.90
CHATHAM ST E OF WGP 105 51 74 35 0.70 0.69
COLBORNE ST E OF WGP 554 581 625 607 1.13 1.054,358 4,721 3,831 4,813 0.88 1.02
Maximum Allowable Deviation 22% 21%
BRANT AVE W OF ST PAUL AVE 462 418 450 498 0.97 1.19
ST PAUL AVE S OF TERRACE HILL ST 711 686 824 805 1.16 1.17
MCMURRAY ST S OF TERRACE HILL ST 114 99 171 102 1.51 1.03
WEST ST S OF TERRACE HILL S 757 614 717 659 0.95 1.07
CLARENCE ST S OF ELGIN ST 716 596 776 719 1.08 1.21
MURRAY ST S OF ELGIN ST 151 205 194 222 1.28 1.08
RAWDON ST S OF ELGIN ST 122 141 147 140 1.21 1.00
STANLEY ST S OF ELGIN ST 199 260 214 141 1.07 0.54
WGP S OF ELGIN ST 915 1,014 725 1,022 0.79 1.01
GARDEN AVE N OF COLBORNE ST 162 180 166 119 1.03 0.664,310 4,213 4,383 4,428 1.02 1.05
Maximum Allowable Deviation 22% 22%* Source: NCHRP Report 255, Chapter 4, Transportation Research Board, Washington D.C.
Auto VolumeObserved Simulated Sim./Obs.
8
1
2a/2b
3/4
5a/5b
LL GATE RD E OF ST
TERRACE HILL S
ximum A
Final -August 2, 2006 24
City of Brantford Development of a Transportation Model for the City of Brantford
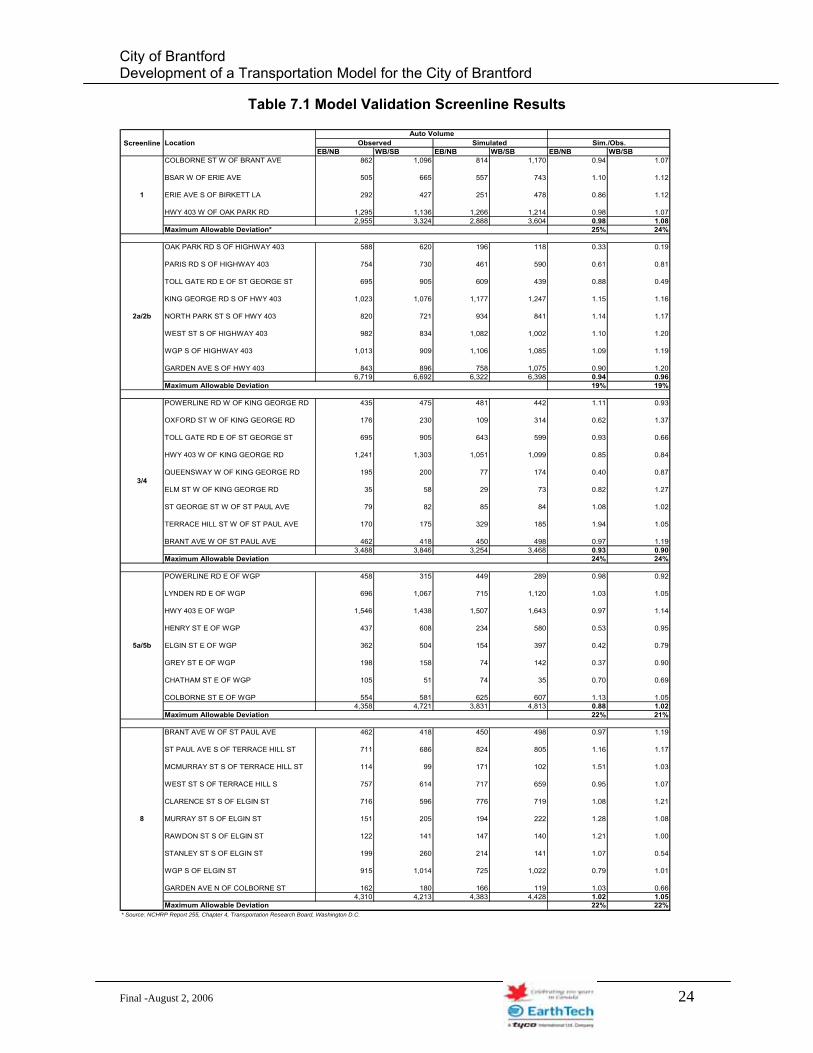
A plot of simulated link volumes compared to the observed volumes was developed to better understand the performance of the model predicting traffic at the link level. The figure below shows that overall the directional link volumes are well represented by the model with R-squared value of 0.88. Generally, the number of links are fairly balanced on both sides of the projected straight line, and the fitted curve equation shows that the model is slightly under simulating existing traffic volumes on an overall basis.
Figure 7.2 Simulated Vs. Observed Directional Link Volumes
y = 0.9624xR2 = 0.878
0
500
1,000
1,500
2,000
0 500 1,000 1,500 2,000
Obs. Traffic Volumes (veh/hr)
Sim
. Tra
ffic
Volu
mes
(veh
/hr)
Analysis of the above results shows the model is generally able to predict traffic well at the link level. At the screenline level, the model can predict traffic more accurately, with enough precision required for an urban model for the City of Brantford.
Final -August 2, 2006 25
City of Brantford Development of a Transportation Model for the City of Brantford
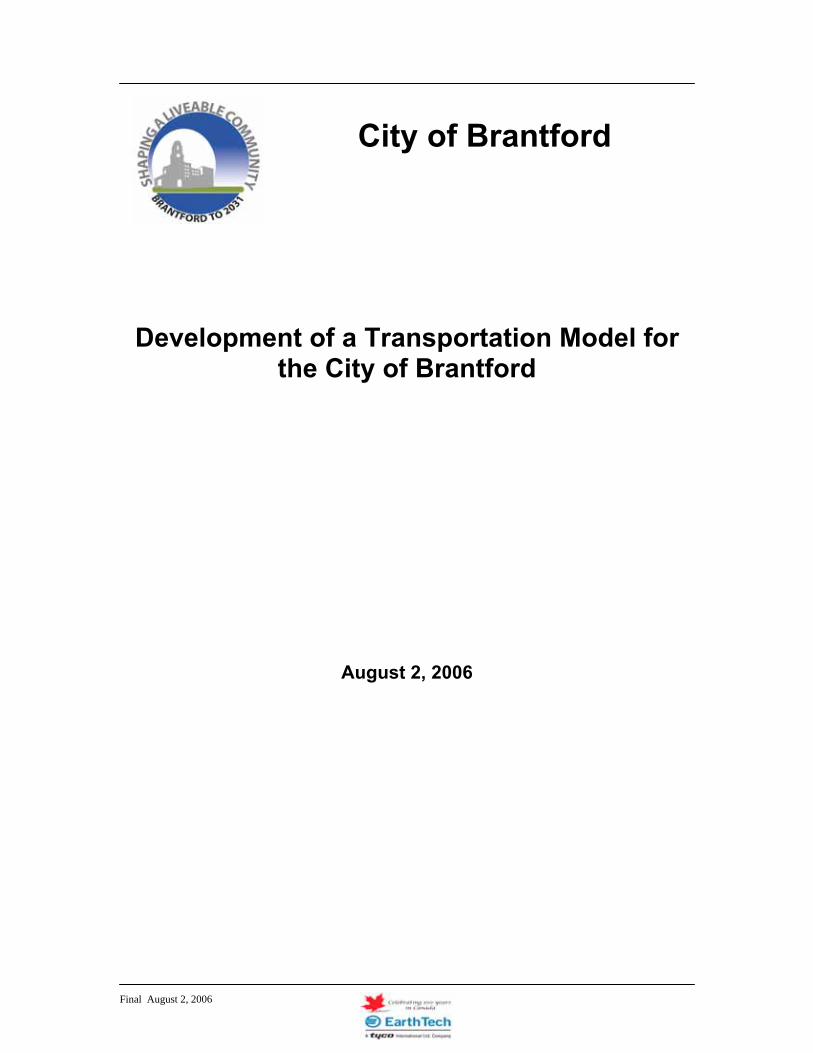
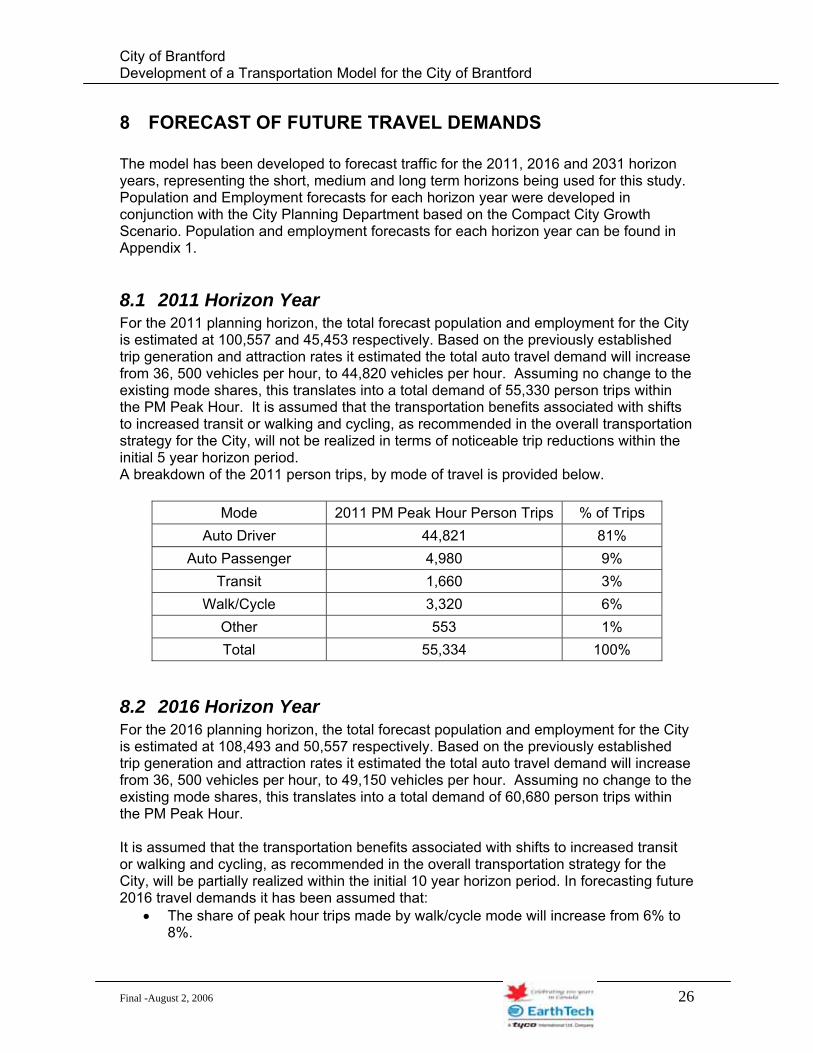
8 FORECAST OF FUTURE TRAVEL DEMANDS The model has been developed to forecast traffic for the 2011, 2016 and 2031 horizon years, representing the short, medium and long term horizons being used for this study. Population and Employment forecasts for each horizon year were developed in conjunction with the City Planning Department based on the Compact City Growth Scenario. Population and employment forecasts for each horizon year can be found in Appendix 1.
8.1 2011 Horizon Year For the 2011 planning horizon, the total forecast population and employment for the City is estimated at 100,557 and 45,453 respectively. Based on the previously established trip generation and attraction rates it estimated the total auto travel demand will increase from 36, 500 vehicles per hour, to 44,820 vehicles per hour. Assuming no change to the existing mode shares, this translates into a total demand of 55,330 person trips within the PM Peak Hour. It is assumed that the transportation benefits associated with shifts to increased transit or walking and cycling, as recommended in the overall transportation strategy for the City, will not be realized in terms of noticeable trip reductions within the initial 5 year horizon period. A breakdown of the 2011 person trips, by mode of travel is provided below.
Mode 2011 PM Peak Hour Person Trips % of Trips Auto Driver 44,821 81%
Auto Passenger 4,980 9% Transit 1,660 3%
Walk/Cycle 3,320 6% Other 553 1% Total 55,334 100%
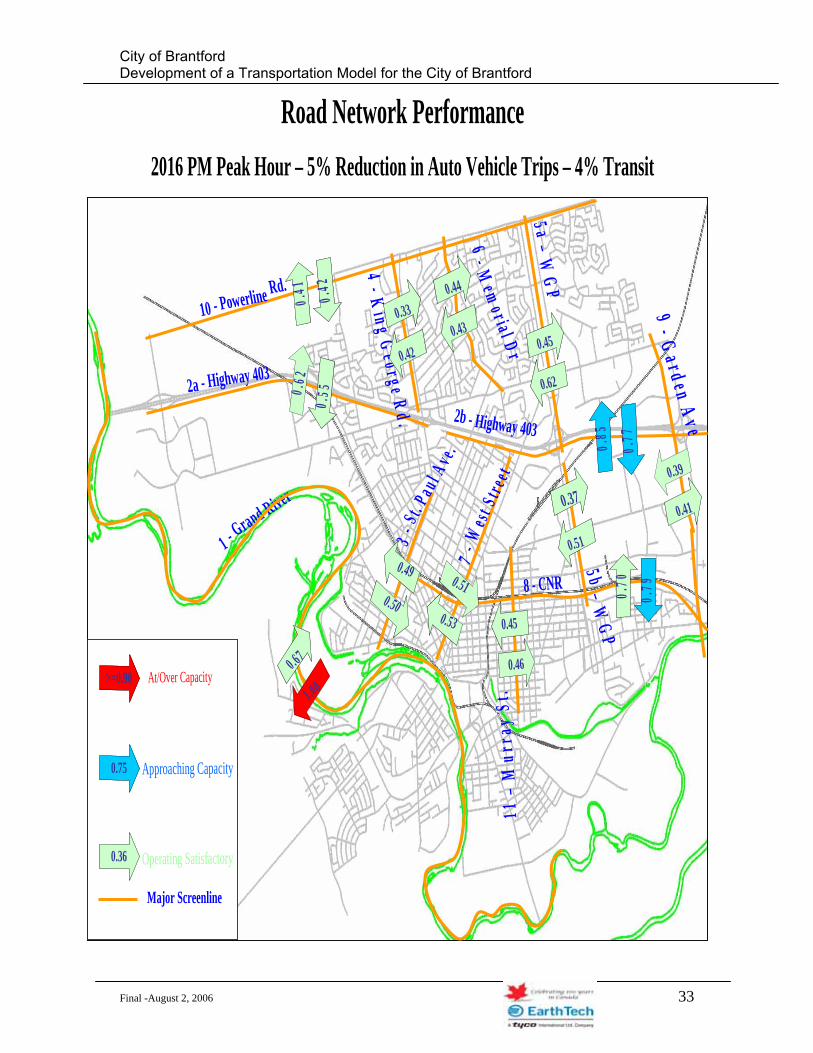
8.2 2016 Horizon Year For the 2016 planning horizon, the total forecast population and employment for the City is estimated at 108,493 and 50,557 respectively. Based on the previously established trip generation and attraction rates it estimated the total auto travel demand will increase from 36, 500 vehicles per hour, to 49,150 vehicles per hour. Assuming no change to the existing mode shares, this translates into a total demand of 60,680 person trips within the PM Peak Hour. It is assumed that the transportation benefits associated with shifts to increased transit or walking and cycling, as recommended in the overall transportation strategy for the City, will be partially realized within the initial 10 year horizon period. In forecasting future 2016 travel demands it has been assumed that:
• The share of peak hour trips made by walk/cycle mode will increase from 6% to 8%.
Final -August 2, 2006 26
City of Brantford Development of a Transportation Model for the City of Brantford
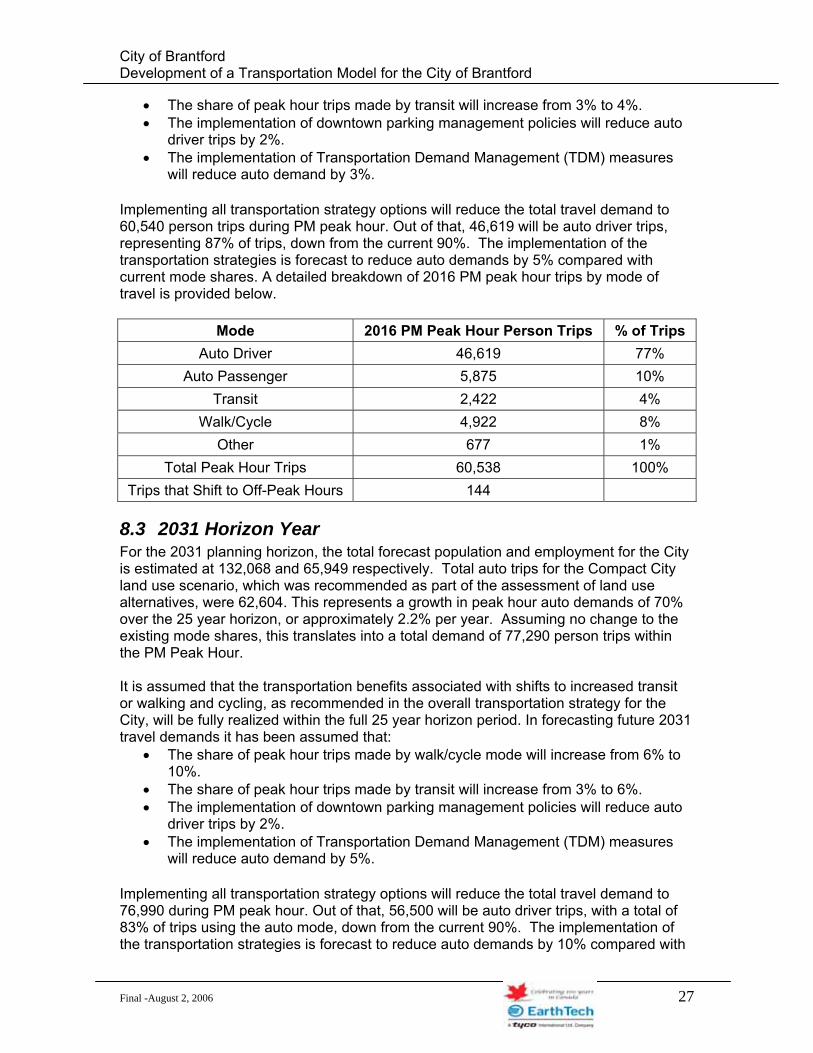
• The share of peak hour trips made by transit will increase from 3% to 4%. • The implementation of downtown parking management policies will reduce auto
driver trips by 2%. • The implementation of Transportation Demand Management (TDM) measures
will reduce auto demand by 3%. Implementing all transportation strategy options will reduce the total travel demand to 60,540 person trips during PM peak hour. Out of that, 46,619 will be auto driver trips, representing 87% of trips, down from the current 90%. The implementation of the transportation strategies is forecast to reduce auto demands by 5% compared with current mode shares. A detailed breakdown of 2016 PM peak hour trips by mode of travel is provided below.
Mode 2016 PM Peak Hour Person Trips % of Trips Auto Driver 46,619 77%
Auto Passenger 5,875 10% Transit 2,422 4%
Walk/Cycle 4,922 8% Other 677 1%
Total Peak Hour Trips 60,538 100% Trips that Shift to Off-Peak Hours 144
8.3 2031 Horizon Year For the 2031 planning horizon, the total forecast population and employment for the City is estimated at 132,068 and 65,949 respectively. Total auto trips for the Compact City land use scenario, which was recommended as part of the assessment of land use alternatives, were 62,604. This represents a growth in peak hour auto demands of 70% over the 25 year horizon, or approximately 2.2% per year. Assuming no change to the existing mode shares, this translates into a total demand of 77,290 person trips within the PM Peak Hour. It is assumed that the transportation benefits associated with shifts to increased transit or walking and cycling, as recommended in the overall transportation strategy for the City, will be fully realized within the full 25 year horizon period. In forecasting future 2031 travel demands it has been assumed that:
• The share of peak hour trips made by walk/cycle mode will increase from 6% to 10%.
• The share of peak hour trips made by transit will increase from 3% to 6%. • The implementation of downtown parking management policies will reduce auto
driver trips by 2%. • The implementation of Transportation Demand Management (TDM) measures
will reduce auto demand by 5%. Implementing all transportation strategy options will reduce the total travel demand to 76,990 during PM peak hour. Out of that, 56,500 will be auto driver trips, with a total of 83% of trips using the auto mode, down from the current 90%. The implementation of the transportation strategies is forecast to reduce auto demands by 10% compared with
Final -August 2, 2006 27
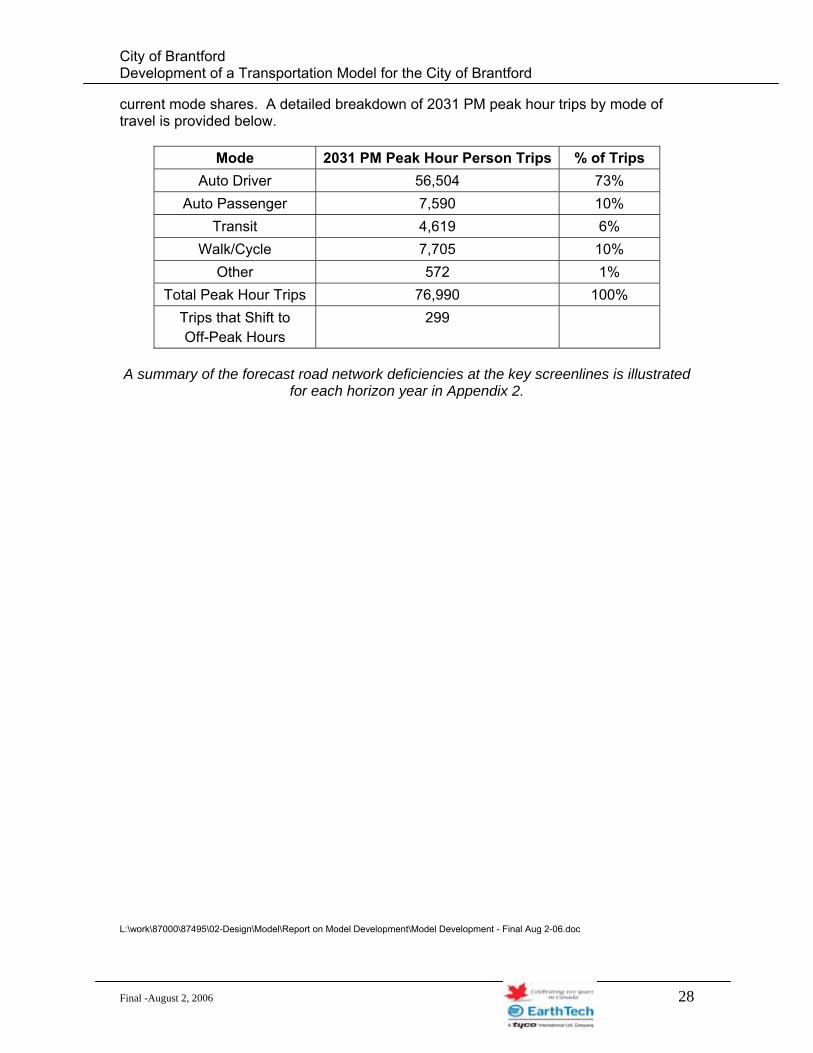
City of Brantford Development of a Transportation Model for the City of Brantford
current mode shares. A detailed breakdown of 2031 PM peak hour trips by mode of travel is provided below.
Mode 2031 PM Peak Hour Person Trips % of Trips Auto Driver 56,504 73%
Auto Passenger 7,590 10% Transit 4,619 6%
Walk/Cycle 7,705 10% Other 572 1%
Total Peak Hour Trips 76,990 100% Trips that Shift to 299 Off-Peak Hours
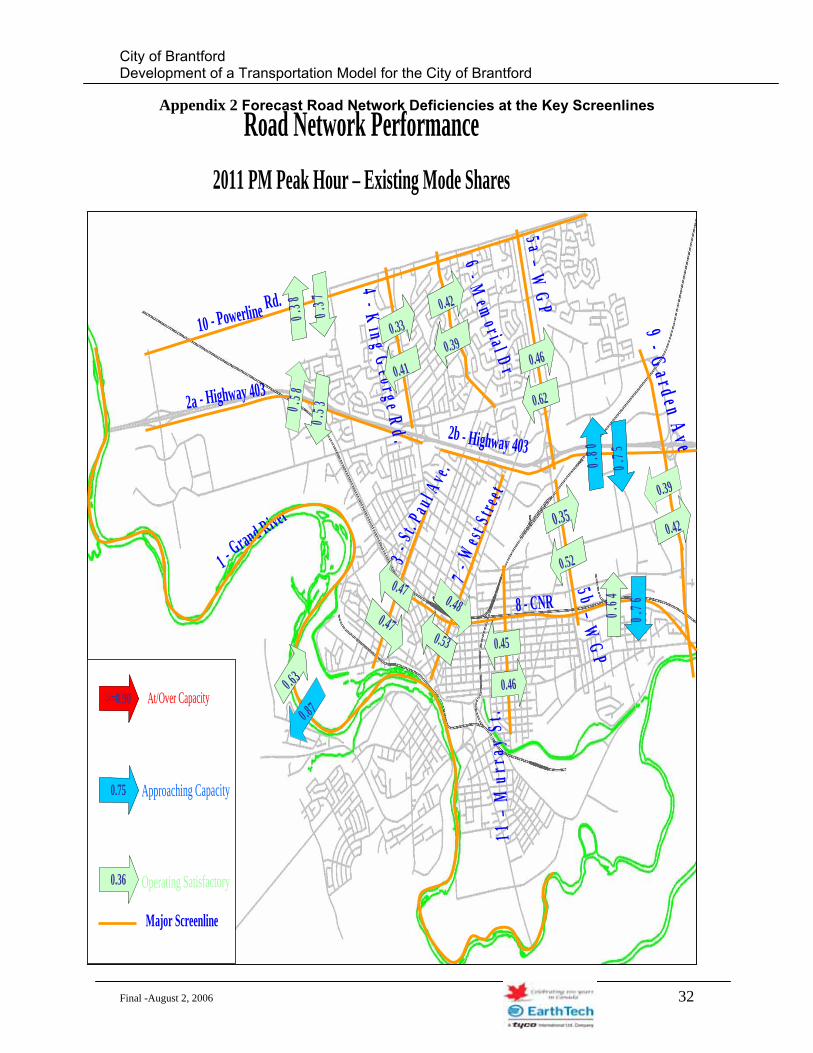
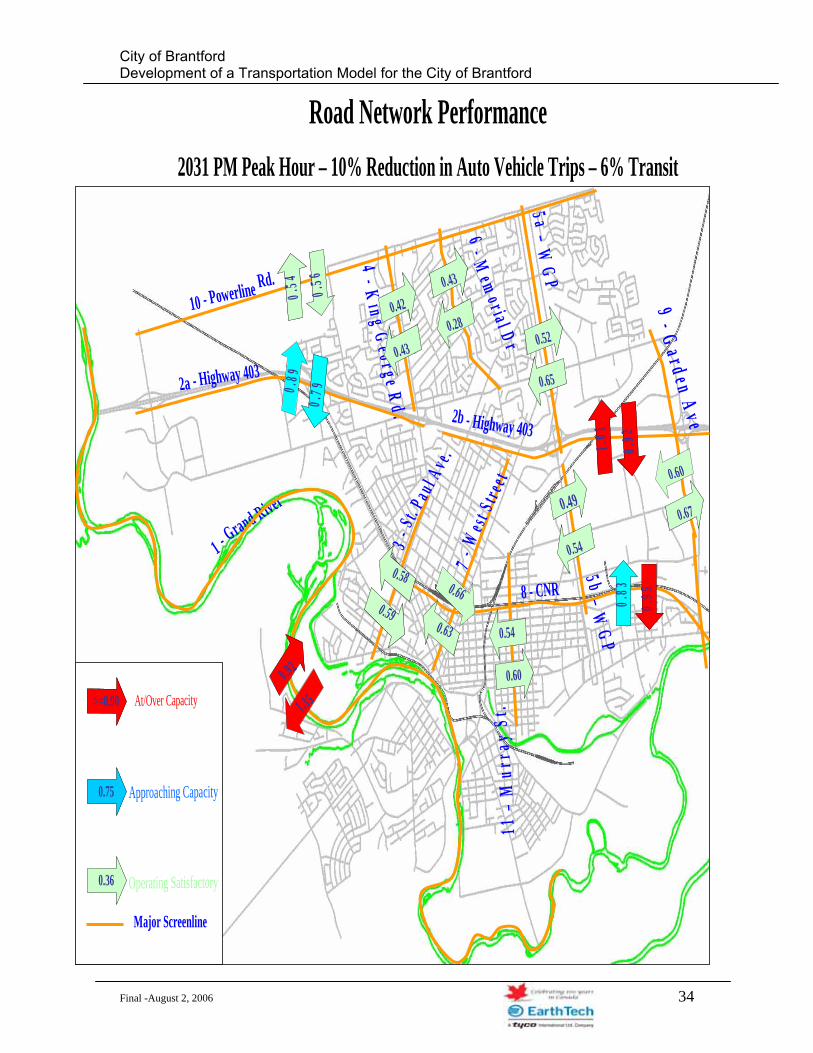
A summary of the forecast road network deficiencies at the key screenlines is illustrated
for each horizon year in Appendix 2. L:\work\87000\87495\02-Design\Model\Report on Model Development\Model Development - Final Aug 2-06.doc
Final -August 2, 2006 28
City of Brantford Development of a Transportation Model for the City of Brantford
TABLE OF CONTENTS
1 INTRODUCTION AND BACKGROUND ............................................................... 2
2 OVERVIEW OF 1995 TRANSPORTATION MODEL ............................................ 3
3 MODEL CHARACTERISTICS AND UPDATES .................................................... 4
3.1 Update Traffic Zone System............................................................................... 4 3.2 Update Model Road Network ............................................................................. 8
4 UPDATE THE HOME TO WORK TRAVEL PATTERNS.................................... 15
5 UPDATE TRAVEL PATTERNS FOR OTHER TRIP PURPOSES ....................... 17
6 TRIP GENERATION / TRIP DISTRIBUTION ...................................................... 20
6.1 Development of Trip Generation Rates .................................................................. 20 6.2 Trip Distribution ..................................................................................................... 22
7 MODEL VALIDATION .......................................................................................... 23
8 FORECAST OF FUTURE TRAVEL DEMANDS.................................................. 27
8.1 2011 Horizon Year............................................................................................ 27 8.2 2016 Horizon Year............................................................................................ 27 8.3 2031 Horizon Year............................................................................................ 28
APPENDICES
Appendix 1 – Population & Employment Forecasts
Appendix 2 - Forecast Road Network Deficiencies at the Key Screenlines
Final -August 2, 2006 29
City of Brantford Development of a Transportation Model for the City of Brantford
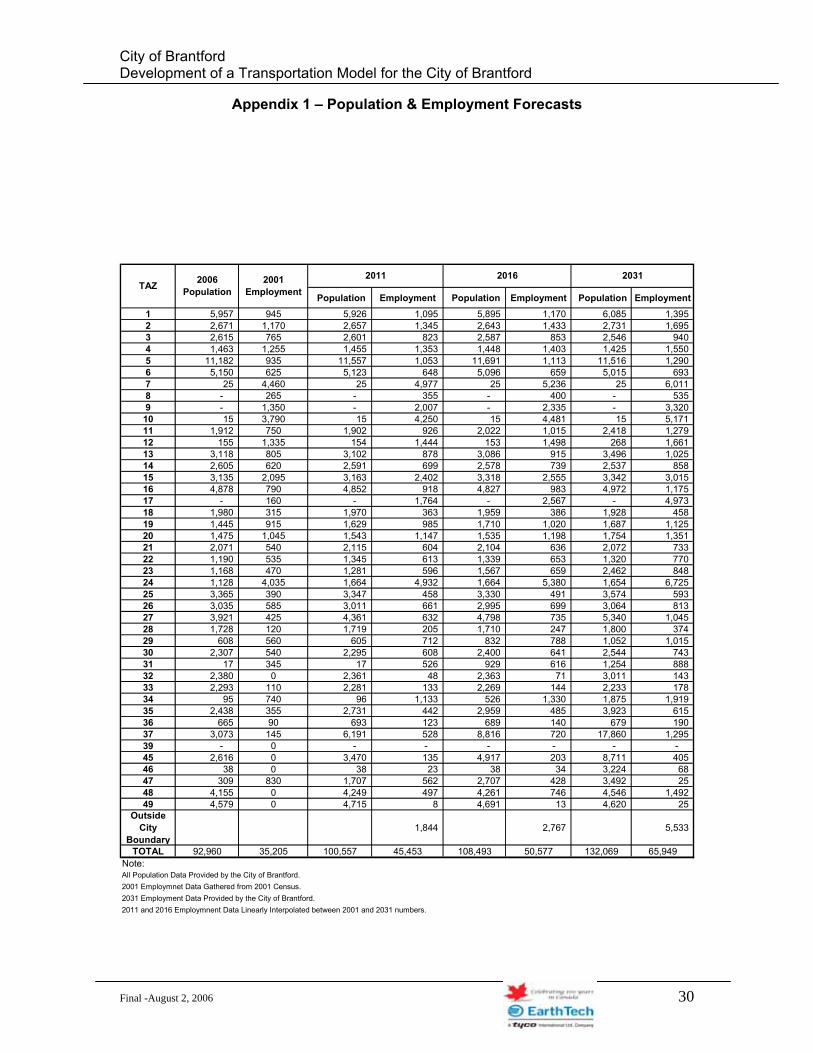
Appendix 1 – Population & Employment Forecasts
Population Employment Population Employment Population Employment1 5,957 945 5,926 1,095 5,895 1,170 6,085 1,395 2 2,671 1,170 2,657 1,345 2,643 1,433 2,731 1,695 3 2,615 765 2,601 823 2,587 853 2,546 940 4 1,463 1,255 1,455 1,353 1,448 1,403 1,425 1,550 5 11,182 935 11,557 1,053 11,691 1,113 11,516 1,290 6 5,150 625 5,123 648 5,096 659 5,015 693 7 25 4,460 25 4,977 25 5,236 25 6,011 8 - 265 - 355 - 400 - 535 9 - 1,350 - 2,007 - 2,335 - 3,320 10 15 3,790 15 4,250 15 4,481 15 5,171 11 1,912 750 1,902 926 2,022 1,015 2,418 1,279 12 155 1,335 154 1,444 153 1,498 268 1,661 13 3,118 805 3,102 878 3,086 915 3,496 1,025 14 2,605 620 2,591 699 2,578 739 2,537 858 15 3,135 2,095 3,163 2,402 3,318 2,555 3,342 3,015 16 4,878 790 4,852 918 4,827 983 4,972 1,175 17 - 160 - 1,764 - 2,567 - 4,973 18 1,980 315 1,970 363 1,959 386 1,928 458 19 1,445 915 1,629 985 1,710 1,020 1,687 1,125 20 1,475 1,045 1,543 1,147 1,535 1,198 1,754 1,351 21 2,071 540 2,115 604 2,104 636 2,072 733 22 1,190 535 1,345 613 1,339 653 1,320 770 23 1,168 470 1,281 596 1,567 659 2,462 848 24 1,128 4,035 1,664 4,932 1,664 5,380 1,654 6,725 25 3,365 390 3,347 458 3,330 491 3,574 593 26 3,035 585 3,011 661 2,995 699 3,064 813 27 3,921 425 4,361 632 4,798 735 5,340 1,045 28 1,728 120 1,719 205 1,710 247 1,800 374 29 608 560 605 712 832 788 1,052 1,015 30 2,307 540 2,295 608 2,400 641 2,544 743 31 17 345 17 526 929 616 1,254 888 32 2,380 0 2,361 48 2,363 71 3,011 143 33 2,293 110 2,281 133 2,269 144 2,233 178 34 95 740 96 1,133 526 1,330 1,875 1,919 35 2,438 355 2,731 442 2,959 485 3,923 615 36 665 90 693 123 689 140 679 190 37 3,073 145 6,191 528 8,816 720 17,860 1,295 39 - 0 - - - - - - 45 2,616 0 3,470 135 4,917 203 8,711 405 46 38 0 38 23 38 34 3,224 68 47 309 830 1,707 562 2,707 428 3,492 25 48 4,155 0 4,249 497 4,261 746 4,546 1,492 49 4,579 0 4,715 8 4,691 13 4,620 25
Outside City
Boundary1,844 2,767 5,533
TOTAL 92,960 35,205 100,557 45,453 108,493 50,577 132,069 65,949Note:All Population Data Provided by the City of Brantford.2001 Employmnet Data Gathered from 2001 Census.2031 Employment Data Provided by the City of Brantford.2011 and 2016 Employmnent Data Linearly Interpolated between 2001 and 2031 numbers.
2016 2031TAZ 2006
Population2001
Employment2011
Final -August 2, 2006 30
City of Brantford Development of a Transportation Model for the City of Brantford
Final -August 2, 2006 31
City of Brantford Development of a Transportation Model for the City of Brantford
Appendix 2 Forecast Road Netw s at the Key Screenlines ork Deficiencie
Road Network Performance 2011 PM Peak Hour – Existing Mode Shares
2a - Highway 403
10 - Powerline Rd.
8 - CNR
–W
GP
4 - Ki n g G
e o r g e Rd .
6 - Me m
o r i a l D r
1 - Grand River
5 a
7 - W
e s t S t
r ee t
3 -S t . P
a ul A
v e.
0.42
2b - Highway 403
9 - Ga r d e n A v e
11 –
Mur
ray
St.
5 b –W
GP
0.39
0.35
0.45
0.480.47
0.330 .
5 3
0.80
0.46
0.38
0 .63
0.76
Major Screenline
At/Over Capacity
0.36
0.75
>=0.90
Approaching Capacity
Operating Satisfactory
0.87
0 .5 8
0.75
0.47
0.41
0.62
0.52
0.39
0.53
0.46
0.64
0.37
0.42
2a - Highway 403
10 - Powerline Rd.
8 - CNR
5a –W
GP
4 - Ki n g G
e o r g e Rd .
6 - Me m
o r i a l D r
1 - Grand River
7 - W
e s t S t
r ee t
3 -S t . P
a ul A
v e.
0.420.42
2b - Highway 403
9 - Ga r d e n A v e
11 –
Mur
ray
St.
5 b –W
GP
0.39
0.350.35
0.450.45
0.480.470.47
0.330.330 .
5 30 .
5 3
0.80
0.80
0.460.46
0.38
0.38 0.37
0.37
0.390.39
0.410.41
0.630.63
0.76
0.76
Major Screenline
At/Over Capacity
0.360.36
0.750.75
>=0.90>=0.90
Approaching Capacity
Operating Satisfactory
0.87
0 .5 8 0.620.62
0.75
0.75
0.420.42
0.520.520.470.47
0.64
0.64
0.530.53
0.460.46
Final -August 2, 2006 32
City of Brantford Development of a Transportation Model for the City of Brantford
2a - Highway 403
10 - Powerline Rd.
8 - CNR
5 a –W
GP
4 - Ki n g G
e o r g e Rd .
6 - Me m
o r i a l D r
1 - Grand River
7 - W
e s t S t
r ee t
3 -S t . P
a ul A
v e.
0.44
2b - Highway 403
9 - Ga r d e n A v e
11 –
Mur
ray
St.
5 b –W
GP
0.39
0.37
0.45
0.510.50
0.330 .
5 5
0.85
0.45
0.41
0 .670.
79
Major Screenline
At/Over Capacity
0.36
0.75
>=0.90
Approaching Capacity
Operating Satisfactory
1.00
0 .6 2
0.77
0.49
0.42
0.62
0.51
0.43
0.53
0.46
0.70
0.42
0.41
2a - Highway 403
10 - Powerline Rd.
8 - CNR
5 a –W
GP
4 - Ki n g G
e o r g e Rd .
6 - Me m
o r i a l D r
1 - Grand River
7 - W
e s t S t
r ee t
3 -S t . P
a ul A
v e.
0.440.44
2b - Highway 403
9 - Ga r d e n A v e
11 –
Mur
ray
St.
5 b –W
GP
0.39
0.370.37
0.450.45
0.510.500.50
0.330.330 .
5 50 .
5 5
0.85
0.85
0.450.45
0.41
0.41 0.42
0.42
0.430.43
0.420.42
0.670.670.
790.
79
Major Screenline
At/Over Capacity
0.360.36
0.750.75
>=0.90>=0.90
Approaching Capacity
Operating Satisfactory
1.00
0 .6 2 0.620.62
0.77
0.77
0.41
0.490.490.51
0.41
Road Network Performance 2016 PM Peak Hour – 5% Reduction in Auto Vehicle Trips – 4% Transit
0.51
0.70
0.70
0.530.53
0.460.46
Final -August 2, 2006 33
City of Brantford Development of a Transportation Model for the City of Brantford
Final -August 2, 2006 34
2a - Highway 403
10 - Powerline Rd.
8 - CNR
5 a –W
GP
4 - Ki n g G
e o r g e Rd .
6 - Me m
o r i a l D r
1 - Grand River
7 - W
e s t S t
r ee t
3 -S t . P
a ul A
v e.
0.430.43
2b - Highway 403
9 - Ga r d e n A v e
11 –
Mur
ray
St.
5 b –W
GP
0.60
0.490.49
0.540.54
0.660.590.59
0.420.420 .
7 90 .
7 9
1.01
1.01
0.520.52
0.54 0.56
0.56
0.54
0.280.28
0.430.43
0.920 .920.
950.
95
1 .35
0 .8 9 0.650.65
0.92
0.92
0.670.67
0.540.540.580.58
0.83
0.83
0.630.63
0.600.60
Major Screenline
At/Over Capacity>=0.90
0.750.75
0.360.36
>=0.90
Approaching Capacity
Operating Satisfactory
Road Network Performance 2031 PM Peak Hour – 10% Reduction in Auto Vehicle Trips – 6% Transit
City of Brantford Development of a Transportation Model for the City of Brantford
Final -August 2, 2006 35