Embed Size (px)
Citation preview

Copenhagen University College of Engineering Center for Information Technology & Electronics (CITE) Lautrupvang 15
2750 Ballerup Denmark Tel.: +45 4480 5130
Fax: +45 4480 5140 www.ihk.dk
Bachelor Project for: Autumn 2012
091357, Kenneth Bengtson
Development of an intelligent vision system for
monitoring on welding process
Abstract:
In this project there have been two focus areas. A) To develop a low-cost vision system for monitoring
of welding process by using a digital camera and an external light source. The light source has been
made by controlling a five row LED array. A Field-Programmable Gate Array (FPGA) is used for
testing different light conditions. B) An investigation has been made on how to integrate intelligence
for adjusting the light conditions in the monitoring process. This to focus areas is combined together
in an attempt to produce images which has sufficient geometry information of a weld pool.
I accept that the report is available at the library of CITE.
Student: Kenneth Bengtson Sign.: …………………………………….
Supervisor: Kim H. Christensen Sign.: …………………………………….
Company: FORCE Technology
Coordinator: Ole Schultz Sign.: …………………………………….
Ext. examiner Svetoslav Nikolov Sign.: …………………………………….

01-01-2013
Development of intelligent vision system for
monitoring in welding
1
Table of Contents
PREFACE ....................................................................................................................................... 3
1. INTRODUCTION ................................................................................................................. 4
1.1 PROJECT START ....................................................................................................................4 1.2 PROBLEM STATEMENT ..........................................................................................................8 1.3 MILESTONE PLAN ................................................................................................................8
2. PROBLEM ANALYSIS ....................................................................................................... 10
2.1 PREREQUISITES FOR THE DEVELOPMENT OF THE VISION SYSTEM ......................................... 10 2.1.1 Pulse laser diodes SPL PL 903 .................................................................................. 10 2.1.2 Spectral characteristic of a MAG welding ............................................................... 11 2.1.3 Spectral characteristic of the Laser diode ................................................................ 13 2.1.4 Camera type GC650 and GC750c ............................................................................. 14 2.1.5 Optical system ........................................................................................................... 18
2.2 LITTERATEUR USED AS BACKGROUND ................................................................................ 20 2.3 SUMMARY OF THE PROBLEM ANALYSIS ............................................................................... 21
3. PROBLEM SOLUTIONS ................................................................................................... 21
3.1 PROBLEM SOLUTIONS EXPECTATION................................................................................... 21 3.1.1 Requirements specification ....................................................................................... 22
3.2 SOLUTION AND IMPLEMENTATION ..................................................................................... 22 3.2.1 Design Overview ....................................................................................................... 23 3.2.2 Laser diode circuit ..................................................................................................... 24 3.2.3 Developed circuit ...................................................................................................... 25
3.3 IMPLEMENTATION OF THE DIGITAL CAMERA ...................................................................... 27 3.3.1 Flowchart diagram of main program....................................................................... 28 3.3.2 Code review ............................................................................................................... 30
3.4 IMPLEMENTATION OF THE FPGA ....................................................................................... 31 3.4.1 Block diagram overview ........................................................................................... 31 3.4.2 Combinatorial and sequential parts ......................................................................... 32
3.5 SIMULATIONS AND TESTS ................................................................................................... 35 3.5.1 Laser diode simulation ............................................................................................. 36 3.5.2 FPGA Simulations ..................................................................................................... 39
4. DISCUSSION ...................................................................................................................... 40
4.1 PROJECT OUTCOME ............................................................................................................ 40 4.1.1 Developed hardware................................................................................................. 40 4.1.2 Developed software .................................................................................................. 40 4.1.3 System improvement ................................................................................................ 41
4.2 RESULTS ............................................................................................................................. 42
5. CONCLUSION .................................................................................................................... 48
BIBLIOGRAPHY ........................................................................................................................ 49
GLOSSARY ................................................................................................................................. 51

01-01-2013
Development of intelligent vision system for
monitoring in welding
2
6. APPENDICES ...................................................................................................................... 52
APPENDIX 1: OSCILLOSCOPE MEASUREMENTS ............................................................. 52
APPENDIX 2: CAMERA FLOWCHART DIAGRAM............................................................. 56
APPENDIX 3: PROSILICA APPLICATION (EXAMPLE OF APPENDIX)........................... 62
APPENDIX 4: MOLDELSIM SIMULATION .......................................................................... 63

01-01-2013
Development of intelligent vision system for
monitoring in welding
3
Preface
This Bachelor Project Report presents the research, findings and
recommendations resulting from the project concerning Development of an
Intelligent Vision System for Monitoring of Welding Process.
The project has benefitted from the advantage being able to perform the
practical exercises at FORCE Technology. The project has also
benefitted from significant inputs and valuable knowledge into welding
processes at FORCE Technology.
I've got this great opportunity to write my Bachelor Project at FORCE
Technology. I am very grateful.
I would like to thank my supervisor Kim Hardam Christensen for the support
and guidance when there was most needed.
I would also thank Lars Evensen for the appreciative support and help I have
received during this project.
And big thanks to the people at FORCE Technology how have made this
project possible.
And I would like to thank my coordinator Ole Schultz, for his guidance and
feedback on the report throughout this project.

01-01-2013
Development of intelligent vision system for
monitoring in welding
4
1. Introduction
In this section a briefly presentation of this project will be reviewed. It will be
discussed, which interest and expectation FORCE Technology have for
writing this project.
1.1 Project start
FORCE Technology is a company which performs Research & Development
(R&D) in many different areas, including the welding industry. In this area
FORCE is constantly developing new methods to carry out and control larger
or smaller demanding welding process in the manufacturing industry.
In the department of Innovation in Welding Technology they among other
things work with automating welding systems. Automated welding systems
are widely used today. Mastering the automated welding process requires a
great deal of control of the many important welding parameters. To ensure a
flawless and uniform weld, adjustment on several parameters must be
performed, where some are more complex than others. By using a visual
system technique in the control process, this provides the ability to adjust
guidelines and parameters at the same time during the welding process.
The light intensity of a welding process is strong throughout the visible
spectrum; therefore it is necessary to filter out as much light as possible.
For instance looking through a welding glass during a welding process a
welder sees the bright welding arc and the hot glowing weld pool. Even
though the emitted light is strong the welder sees impressively enough much
detail. An experience welder possesses the ability to ignore, see through the
intense light and noise during a weld task. Thant is managed by the welders’
ability to see, hear and feel during a weld task.
It is known for an experienced welder, that the human brain has the ability to
store a great deal of information about performing a weld task, which enables
01-01-2013
Development of intelligent vision system for
monitoring in welding
5
the welder to draw out imported information behind the strong light which
the welder is looking at.
This human ability performing a weld task is not easy to copy and mechanize
for a fully automated welding system. Therefore no such state of the art
automated welding systems exists today, for the thick-plate welding, that is.
A functional visions system provides the ability to start collecting data which
can be used for attempting to develop a computer algorithm capable of
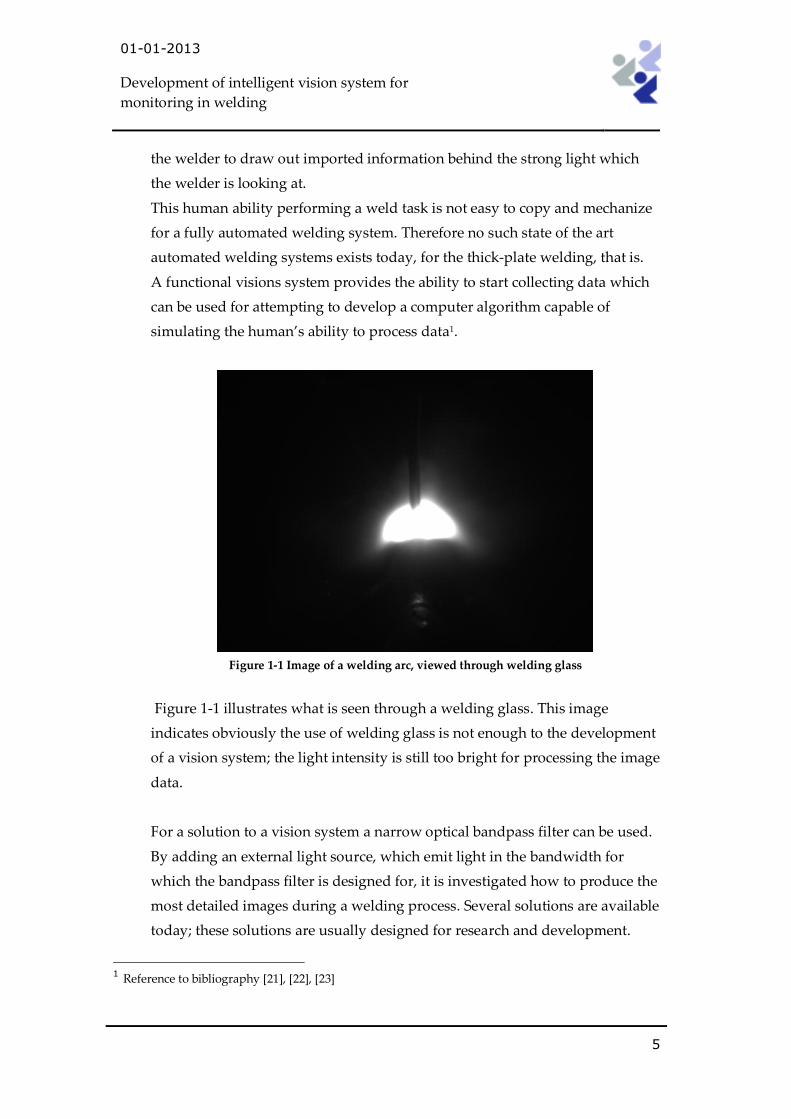
simulating the human’s ability to process data1.
Figure 1-1 Image of a welding arc, viewed through welding glass
Figure 1-1 illustrates what is seen through a welding glass. This image
indicates obviously the use of welding glass is not enough to the development
of a vision system; the light intensity is still too bright for processing the image
data.
For a solution to a vision system a narrow optical bandpass filter can be used.
By adding an external light source, which emit light in the bandwidth for
which the bandpass filter is designed for, it is investigated how to produce the
most detailed images during a welding process. Several solutions are available
today; these solutions are usually designed for research and development.
1 Reference to bibliography [21], [22], [23]

01-01-2013
Development of intelligent vision system for
monitoring in welding
6
Here, for instance, reference is made to CAVITAR. CAVITAR has developed a
CAVILUX HF [9]2 for a high speed application, which operates in a short
period of time. This system captures images in high quality, which is possible
because the system has a light source illuminating the area of interest with a
high power pulsing laser light. To prevent the system from overheating, this
system has to cool down just after a few second in operation.
Furthermore this system is mainly used for research and development by
operating in high speed, which makes it possible to collect data that would
otherwise not be possible with an ordinary camera.
FORCE Technology would like to have a system that is more streamlined for
the production industry, working with thick-plated welding. Furthermore
they would like to have a fully automated welding system which can be used
for the thick-plated welding.
Then why not use the systems available in the cars manufacturing industry,
one may ask. The reason is that the car industries use an automated welding
system which is developed for thin-plate welding. And the manner in which
the welding is performed in thin-plated welding is not the same as the thick-
plated welding. In a thick-plate welding process it is a difficult task to perform
joint weld, often because the welding geometry of the weld joints varies much.
Therefore, this task is performed manually. A fully automated thick-pated
welding system is at the moment not available. A vision system for the thick-
plated welding system is a fundamental part of the fully automated welding
system, and thereby the basis for this project of investigating a solution for a
vision system.
2 Reference to bibliography [9] Brochure http://www.cavitar.com/solutions_and_services/illumination_lasers/products/cavilux_hf
01-01-2013
Development of intelligent vision system for
monitoring in welding
7
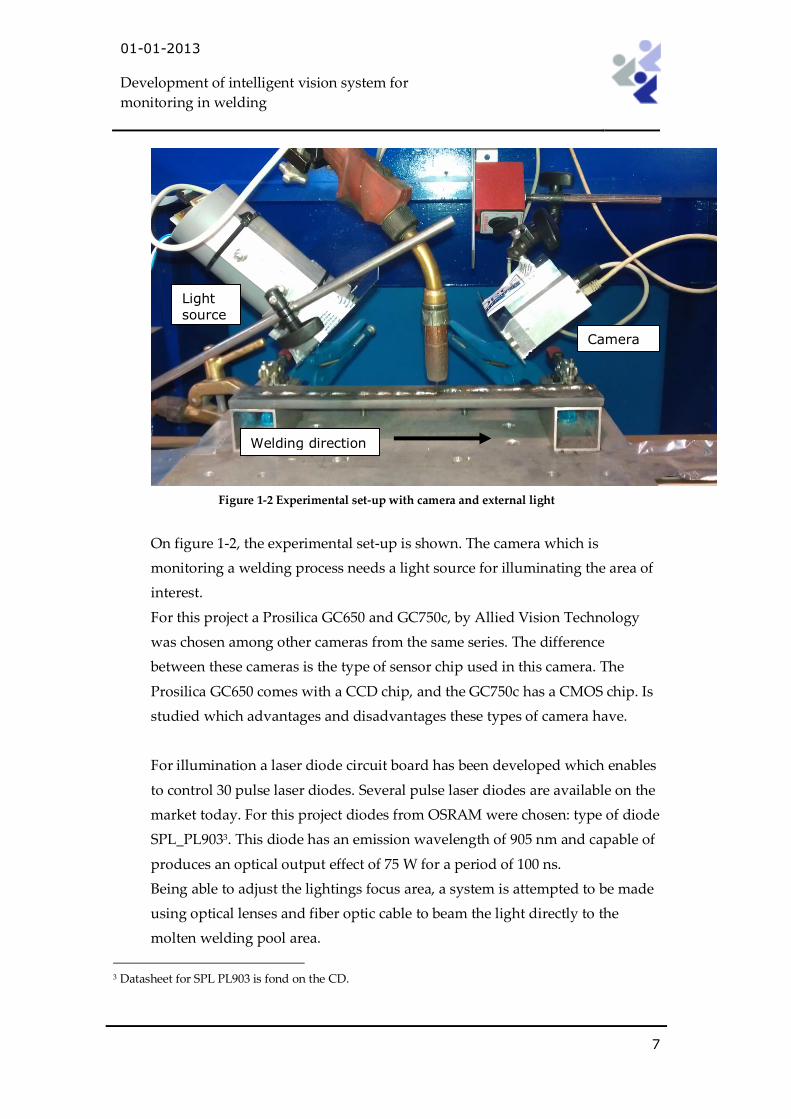
Figure 1-2 Experimental set-up with camera and external light
On figure 1-2, the experimental set-up is shown. The camera which is
monitoring a welding process needs a light source for illuminating the area of
interest.
For this project a Prosilica GC650 and GC750c, by Allied Vision Technology
was chosen among other cameras from the same series. The difference
between these cameras is the type of sensor chip used in this camera. The
Prosilica GC650 comes with a CCD chip, and the GC750c has a CMOS chip. Is
studied which advantages and disadvantages these types of camera have.
For illumination a laser diode circuit board has been developed which enables
to control 30 pulse laser diodes. Several pulse laser diodes are available on the
market today. For this project diodes from OSRAM were chosen: type of diode
SPL_PL9033. This diode has an emission wavelength of 905 nm and capable of
produces an optical output effect of 75 W for a period of 100 ns.
Being able to adjust the lightings focus area, a system is attempted to be made
using optical lenses and fiber optic cable to beam the light directly to the
molten welding pool area.
3 Datasheet for SPL PL903 is fond on the CD.
Camera
Light source
Welding direction

01-01-2013
Development of intelligent vision system for
monitoring in welding
8
1.2 Problem statement
This project will examine the effect by adding external light source in a vision
system for monitoring a real time welding process. Following system solution
is to be developed.
1. Develop a laser diode circuit which can be connected to a digital
camera, and which are used as a light source for high speed
monitoring
2. Develop an optical system which makes it possible to shape the laser
beam, and by the use of fiber-optic cable, bringing the light source to
the desired location.
3. Develop a method that makes it possible to test several different
lightning conditions
4. The digital camera is connected to a PC via Ethernet cable.
The developed software program which controls the camera must be
able to control the laser diode circuit by the use of a FPGA. The
communication between the camera software and FPGA is handled by
a NI DAQ USB 4unit.
5. Design a system capable of storage 5- 30 images per second.
6. The designed system is to be developed with a degree of intelligence
that can control the image processing and the external light source,
which stores only the usable images on to a hard disk
1.3 Milestone Plan
In the following table 1-1 is the milestone plan which describes the workflow
throughout this project.
4 National Instrument USB DAQ 6212 more detail is found on NI website.
http://sine.ni.com/nips/cds/view/p/lang/da/nid/207096
01-01-2013
Development of intelligent vision system for
monitoring in welding
9
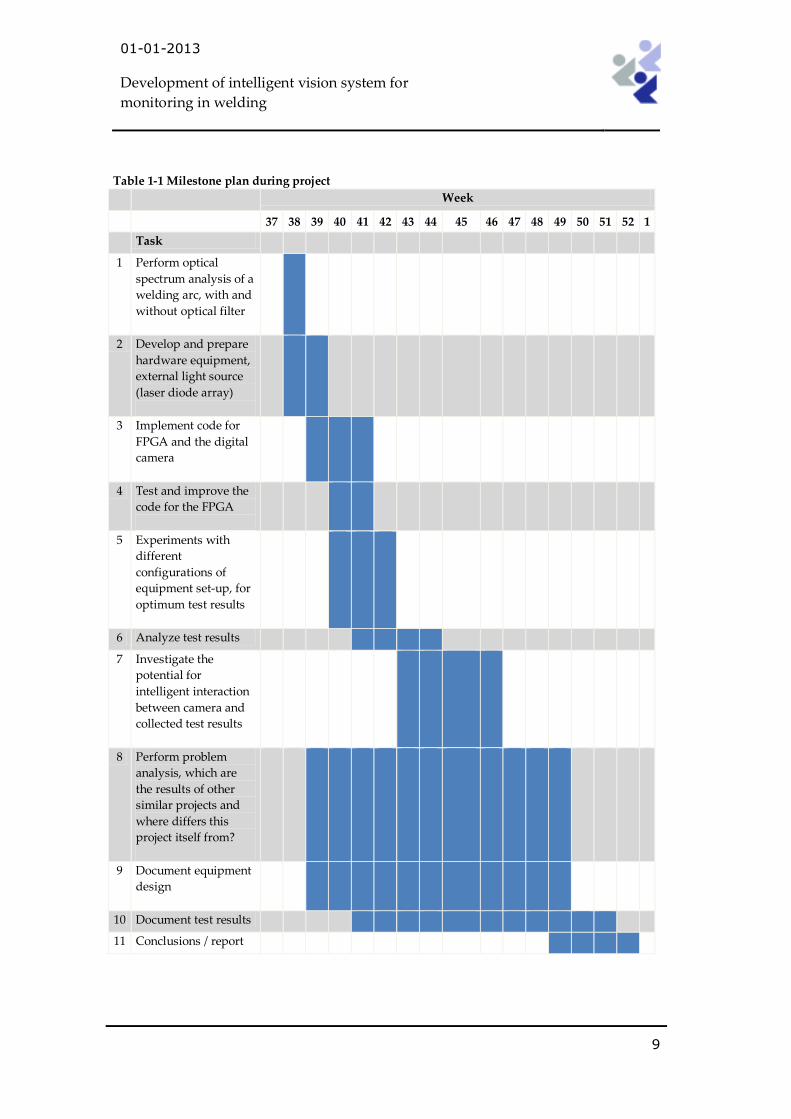
Table 1-1 Milestone plan during project
Week
37 38 39 40 41 42 43 44 45 46 47 48 49 50 51 52 1
Task
1 Perform optical
spectrum analysis of a
welding arc, with and
without optical filter
2 Develop and prepare
hardware equipment,
external light source
(laser diode array)
3 Implement code for
FPGA and the digital
camera
4 Test and improve the
code for the FPGA
5 Experiments with
different
configurations of
equipment set-up, for
optimum test results
6 Analyze test results
7 Investigate the
potential for
intelligent interaction
between camera and
collected test results
8 Perform problem
analysis, which are
the results of other
similar projects and
where differs this
project itself from?
9 Document equipment
design
10 Document test results
11 Conclusions / report

01-01-2013
Development of intelligent vision system for
monitoring in welding
10
2. Problem analysis
In this section a conceptual approach for designing a vision system is
discussed. A problem analysis is carried out to uncover which issues there is
for the used camera and laser diodes. In an attempt to capture high quality
image the vision system is designed by a digital camera, which is
synchronized with an external light source. Through a software program,
intelligence is added to the system.
2.1 Prerequisites for the development of the vision system
It will be uncovered which issues is to be handled in development of the
intelligent visions system. The utilization of laser diodes gives the solutions
some limitations, these limitations will be outlined later. Furthermore it will
be discussed how to integrate the laser driver and the FPGA to the digital
camera in an intelligently manner.
2.1.1 Pulse laser diodes SPL PL 903
For illumination a low-cost laser diode is used. The SPL PL903 laser diode has
an optical output peak effect up to 75 W. The laser diode is a semiconductor
diode which emits light at near infrared, according to the datasheet 905 nm.
Because the diode is a semiconductor it has limited operation properties. At
peak performance it can delivers an optical output power of 75 W for 100 ns,
with a duty cycle of 1 ms.
01-01-2013
Development of intelligent vision system for
monitoring in welding
11
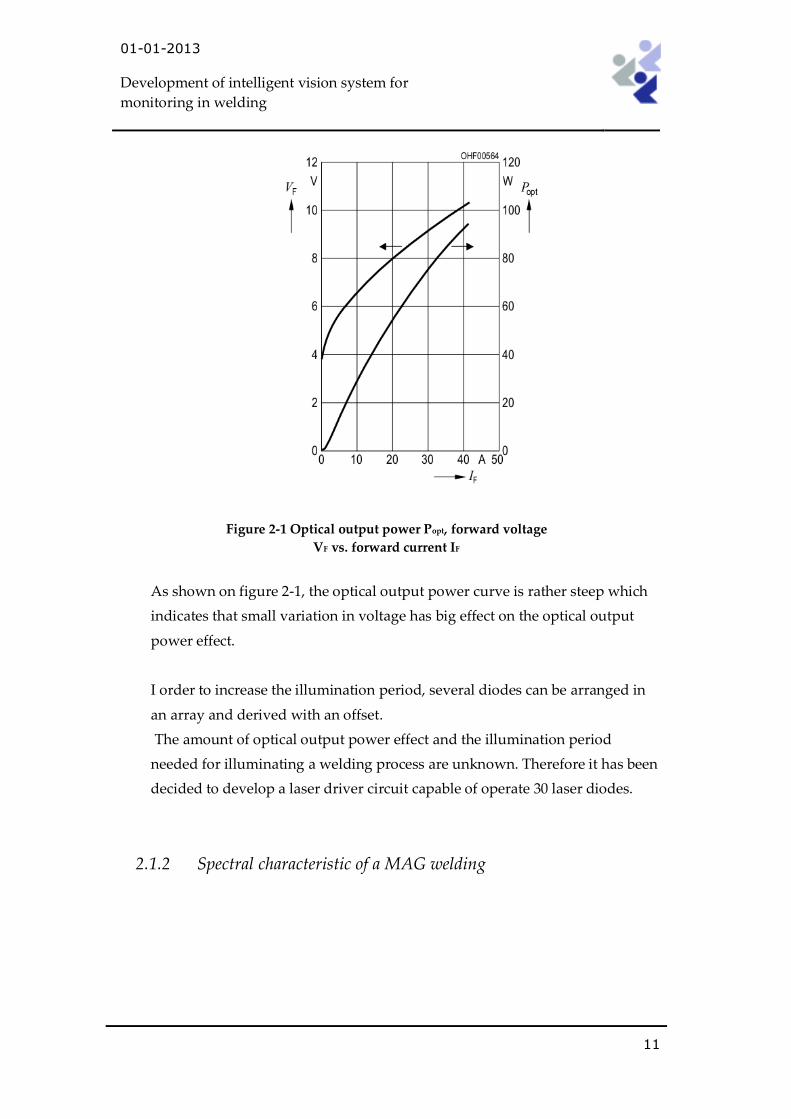
Figure 2-1 Optical output power Popt, forward voltage
VF vs. forward current IF
As shown on figure 2-1, the optical output power curve is rather steep which
indicates that small variation in voltage has big effect on the optical output
power effect.
I order to increase the illumination period, several diodes can be arranged in
an array and derived with an offset.
The amount of optical output power effect and the illumination period
needed for illuminating a welding process are unknown. Therefore it has been
decided to develop a laser driver circuit capable of operate 30 laser diodes.
2.1.2 Spectral characteristic of a MAG welding
01-01-2013
Development of intelligent vision system for
monitoring in welding
12
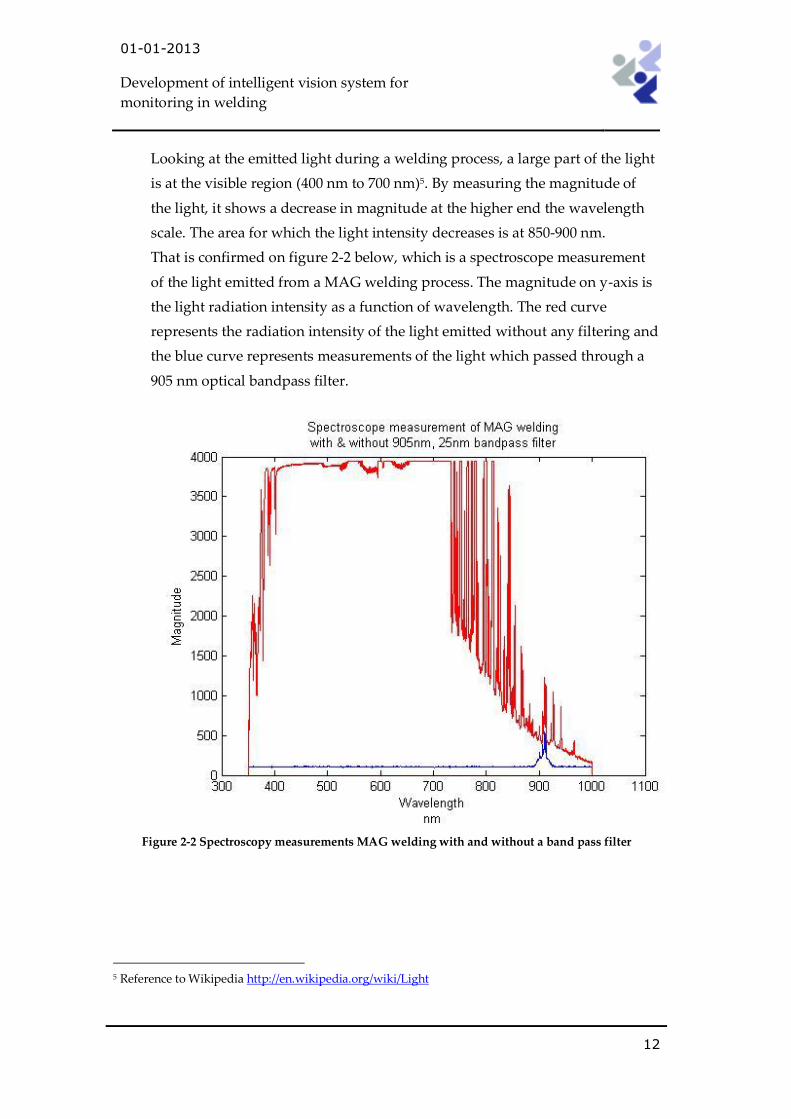
Looking at the emitted light during a welding process, a large part of the light
is at the visible region (400 nm to 700 nm)5. By measuring the magnitude of
the light, it shows a decrease in magnitude at the higher end the wavelength
scale. The area for which the light intensity decreases is at 850-900 nm.
That is confirmed on figure 2-2 below, which is a spectroscope measurement
of the light emitted from a MAG welding process. The magnitude on y-axis is
the light radiation intensity as a function of wavelength. The red curve
represents the radiation intensity of the light emitted without any filtering and
the blue curve represents measurements of the light which passed through a
905 nm optical bandpass filter.
Figure 2-2 Spectroscopy measurements MAG welding with and without a band pass filter
5 Reference to Wikipedia http://en.wikipedia.org/wiki/Light
01-01-2013
Development of intelligent vision system for
monitoring in welding
13
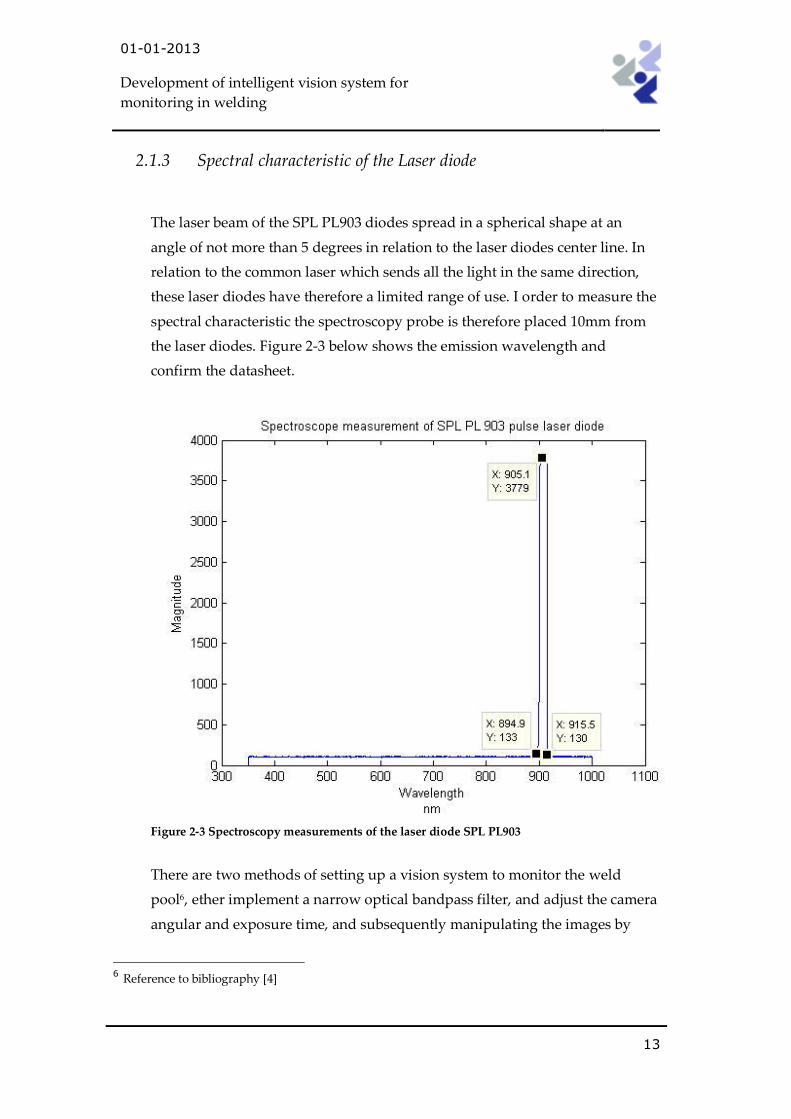
2.1.3 Spectral characteristic of the Laser diode
The laser beam of the SPL PL903 diodes spread in a spherical shape at an
angle of not more than 5 degrees in relation to the laser diodes center line. In
relation to the common laser which sends all the light in the same direction,
these laser diodes have therefore a limited range of use. I order to measure the
spectral characteristic the spectroscopy probe is therefore placed 10mm from
the laser diodes. Figure 2-3 below shows the emission wavelength and
confirm the datasheet.
Figure 2-3 Spectroscopy measurements of the laser diode SPL PL903
There are two methods of setting up a vision system to monitor the weld
pool6, ether implement a narrow optical bandpass filter, and adjust the camera
angular and exposure time, and subsequently manipulating the images by
6 Reference to bibliography [4]
01-01-2013
Development of intelligent vision system for
monitoring in welding
14
software. Or with a system combining the use of optical filter an external
lighting, these outcomes are to be investigated in this project.
2.1.4 Camera type GC650 and GC750c7
This section aims to provide an overview of which issues to take in to account
using this to types of camera.
In high speed photography the exposure time and the lightings are the two
important factors. In order of obtain high quality images it is important to
have good lighting beam, in the right quantity and by applying the lightings
in the right direction. For instance in a set-up using a pulse laser diode with a
illuminating range of 1 to 1000 ns make it possible to obtain these conditions
and for achieving high quality pictures at high speed photography8.
Two types of high speed digital cameras are used, one with a CCD sensor
chip, the Prosilica GC650, and a CMOS sensor chip, the Prosilica GC750c.
The camera in this vision system is setup as the master. Since the laser diodes
has limited operating period, it will be evaluated, for which operating
condition the cameras can be setup for, to handles these issues.
This system is to be driven in real-time, therefore the number of captured
images which is processed, defines the limitations for the number of image
storage.
The timing diagram for the output triggering on the camera is shown on the
figure 2-4 below.
7 Reference to bibliography [6], 8 Reference to bibliography [2]

01-01-2013
Development of intelligent vision system for
monitoring in welding
15
Figure 2-4 Timing diagram for the internal timing waveforms for Prosilica GC9
The logic trigger signal in figure 2-4 is controlled by the camera. When the
camera configuration is set, it is determined by which event to control the
logic trigger signal. The trigger cycle is as follow.
1) When the Logic Trigger event is high the Exposure event is driven
high. The exposure time is defined by the user, but limited by the type of
camera.
2) When the Exposure event is low all sensor values are Readout and
saved in the camera memory.
3) The next Logic Trigger signal which can be handled is delayed by the
Exposure Start Delay; this ends the trigger cycle, which is used for in this
project.
As the price for digital cameras has become more affordable, makes it
therefore suitable for using a digital camera in a low-cost visions system.
Compared to the task the camera will be used for, there is a wide range of
camera type with different properties. Because the camera is to be used in
9 Datasheet found on CD, GC_TechMan_V2.0 page 56
01-01-2013
Development of intelligent vision system for
monitoring in welding
16
monitoring a welding process, it would be an advantage to have a camera
which has a short sensor exposure- and with a high repetition-time. Thus, in
order to limit the amount of light captured on the camera sensor chip.
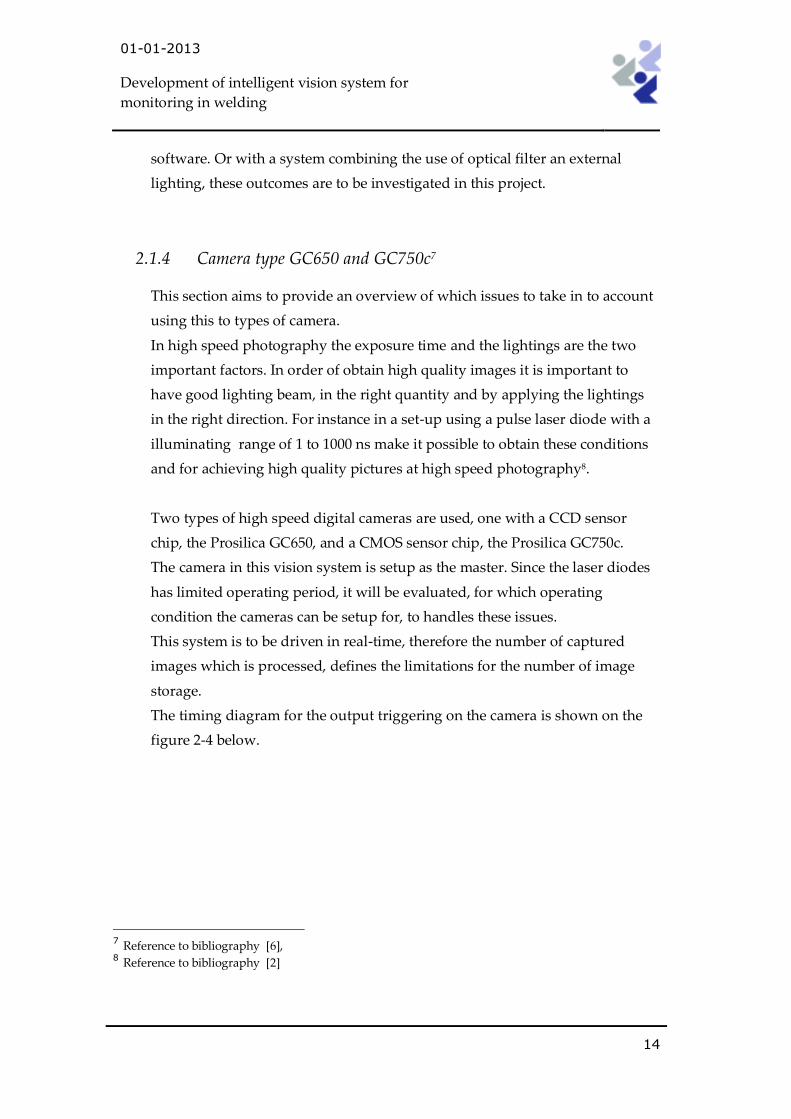
Prosilica GC650 with CCD sensor chip
The GC650 is a high-performance camera; able to capture 90 frames per
second with a resolution of 659 x 493 in monochrome. The CCD chip has high
quantum efficiency, (QE) in the visible region up to more than 50% and less
than 10 % near the infrared region. Photographic film has a QE value of less
than 10 %10. QE is a measurement of how sensitive the camera is of light, in
terms of how many percentage photons are hitting the sensor chip.
The drawback is using a CCD sensor chip is blooming. Blooming occurs when
the pixels on the CCD chip are saturated. Blooming is visible as straight
vertical lines on the image.
In figure 6-11 (Appendix 3) is an example of how blooming appears. In the
area where the welding arc is brightest, vertical stripes appears and arising
from the welding arc.
10 Reference to Wikipedia http://en.wikipedia.org/wiki/Quantum_efficiency
Region of interesse
Figure 2-5 GC650 optical response

01-01-2013
Development of intelligent vision system for
monitoring in welding
17
Prosilica GC750c with CMOS sensor chip
This camera comes with a CMOS chip. Capable of capture 60 frames per
second with a resolution of 752 x 480 in monochrome / color.
The benefits of the cameras with CMOS chip are that they do not suffer for
blooming; it has low power consumption, low cost and has a higher QE
spectral sensitivity.
Although images captured with a CMOS chip camera, as shown on figure 6-12
(Appendix 3) has a better resolution 752 x 480, the quality of still photography
is significantly different than image captured with a CCD chip camera.
For comparisons the camera spectral response, the diagram on figure 2-7
below shows the relative intensity as a function of optical spectrum for the
SPL PL903 pulse laser diodes.
Region of interesse
Figure 2-6 GC750 optical response
01-01-2013
Development of intelligent vision system for
monitoring in welding
18
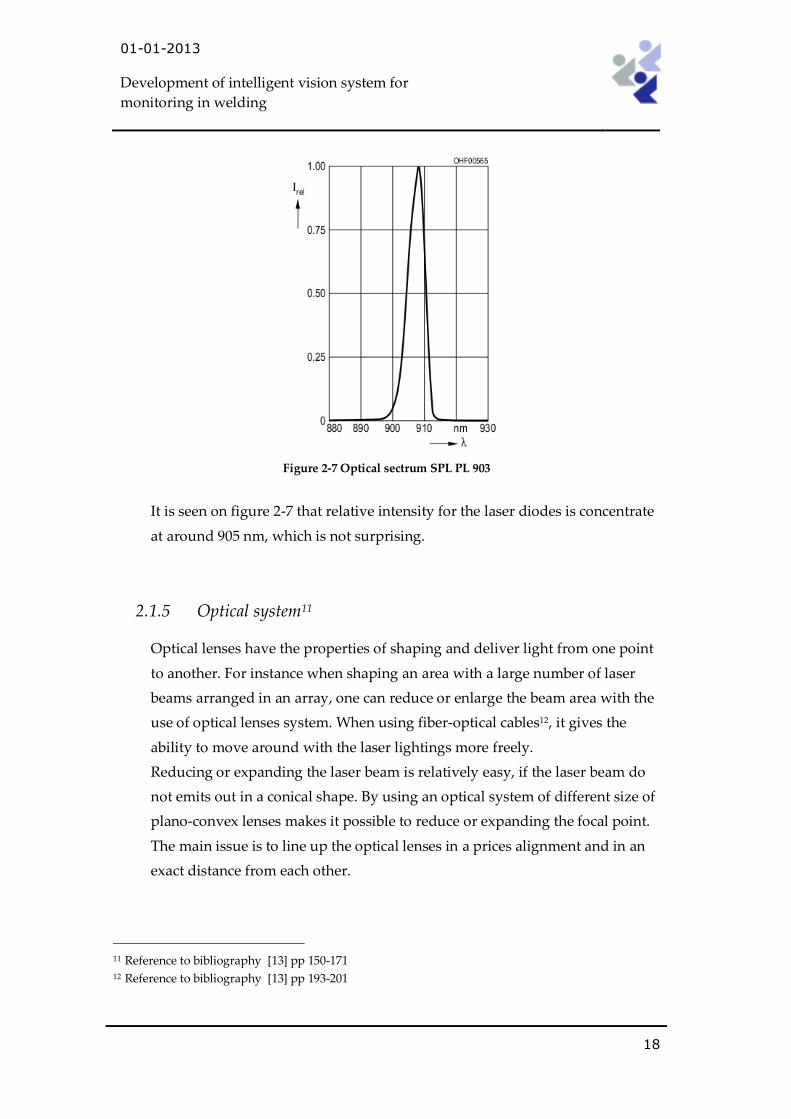
Figure 2-7 Optical sectrum SPL PL 903
It is seen on figure 2-7 that relative intensity for the laser diodes is concentrate
at around 905 nm, which is not surprising.
2.1.5 Optical system11
Optical lenses have the properties of shaping and deliver light from one point
to another. For instance when shaping an area with a large number of laser
beams arranged in an array, one can reduce or enlarge the beam area with the
use of optical lenses system. When using fiber-optical cables12, it gives the
ability to move around with the laser lightings more freely.
Reducing or expanding the laser beam is relatively easy, if the laser beam do
not emits out in a conical shape. By using an optical system of different size of
plano-convex lenses makes it possible to reduce or expanding the focal point.
The main issue is to line up the optical lenses in a prices alignment and in an
exact distance from each other.
11 Reference to bibliography [13] pp 150-171 12 Reference to bibliography [13] pp 193-201
01-01-2013
Development of intelligent vision system for
monitoring in welding
19
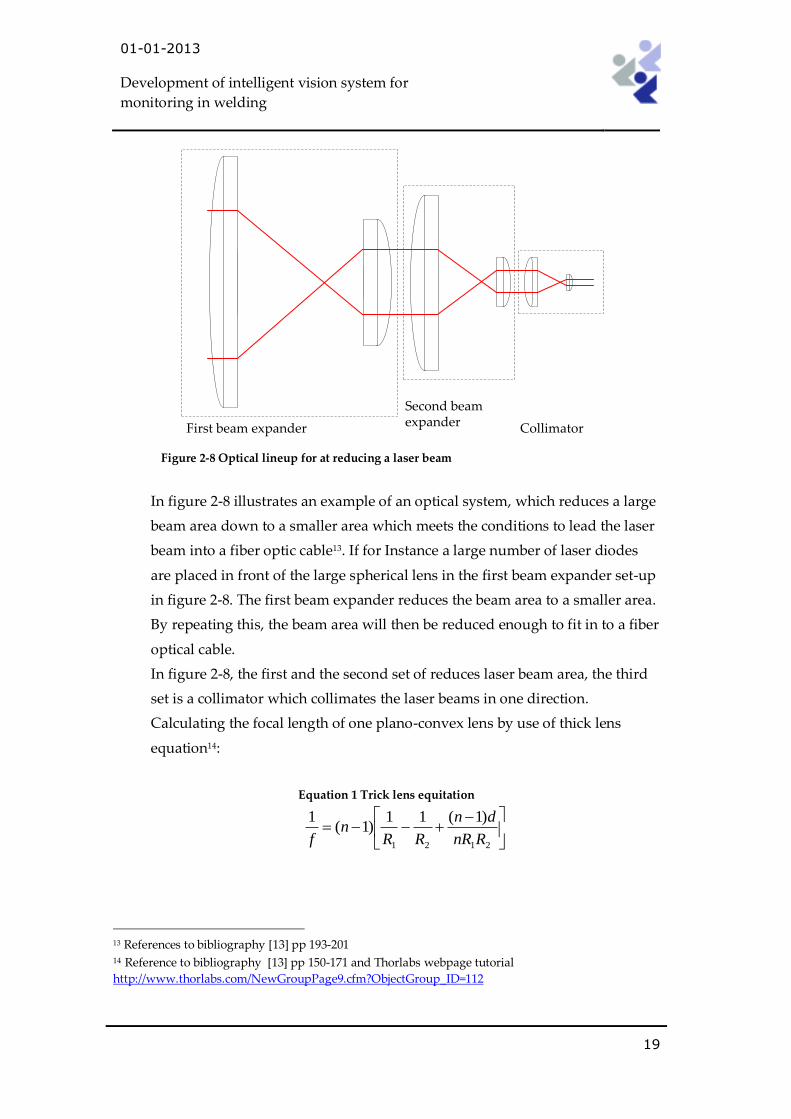
First beam expander
Second beam expander Collimator
Figure 2-8 Optical lineup for at reducing a laser beam
In figure 2-8 illustrates an example of an optical system, which reduces a large
beam area down to a smaller area which meets the conditions to lead the laser
beam into a fiber optic cable13. If for Instance a large number of laser diodes
are placed in front of the large spherical lens in the first beam expander set-up
in figure 2-8. The first beam expander reduces the beam area to a smaller area.
By repeating this, the beam area will then be reduced enough to fit in to a fiber
optical cable.
In figure 2-8, the first and the second set of reduces laser beam area, the third
set is a collimator which collimates the laser beams in one direction.
Calculating the focal length of one plano-convex lens by use of thick lens
equation14:
Equation 1 Trick lens equitation
2121
)1(11)1(
1
RnR
dn
RRn
f
13 References to bibliography [13] pp 193-201 14 Reference to bibliography [13] pp 150-171 and Thorlabs webpage tutorial
http://www.thorlabs.com/NewGroupPage9.cfm?ObjectGroup_ID=112

01-01-2013
Development of intelligent vision system for
monitoring in welding
20
Table 2-1 units for the thick lens equation
Focal length unit description
f Focal length
n Index of refraction
1R Radius for curvature of the lens surface 1
2R Radius for curvature of the lens surface 2
d Lens thickness on the center
For plano-convex lenses index n is de by the type and dimensions of the used
lens. Calculating the focal length of the used plano-convex lens is:
Equation 2 Plano-convex lens equation
Rn
f
1)1(
1
2.2 Litterateur used as background
The focus in this project has been on developing a system which uses an
external lighting in form of a laser beam. It has been a challenge to find
literature dealing with these specific topics as a combination of the different
technologies; camera, high-speed photography, lighting and welding
technology. But there are a number of university projects dealing with these
topics. Some of these projects and theses are used to gather knowledge on the
subject.
The following literature15 used for this project [1] [2] [3] [4] [5] [6] [7] [8]16.
15 This project and these are found on the CD on the back cover on this project 16 References to bibliography [1] [2] [3] [4] [5] [6] [7] [8] is of similar Project

01-01-2013
Development of intelligent vision system for
monitoring in welding
21
2.3 Summary of the problem analysis
The laser diode which is used, has limited range in operation. The
illumination period may be expanded by use of multiple laser diodes.
O n laser diode IV-curve it shows that the optical output power curve is steep,
which means that small voltage variations have a great influence on the
optical output power.
As a spectroscope measurement of a welding process reveals the magnitude of
the light radiation intensity is high in the wavelength range 350 nm – 1000 nm
which has to be reduced in some way.
The exposure time on the camera is an issue because of the large, minimum
exposure time of 8 μs or 30 μs, depending on which camera used, in relative to
the laser diode emission time.
An optical system needs to be considered in order of reduce the laser beam
area, so that the laser beam can be send through a fiber optical cable.
3. Problem solutions
This section uncovers the method of how the requirements for this project are
solved. The goal is to develop vision system which function, and runs in real
time monitoring a welding process. The developed system is proof of concept
which can be used with modifications in a test set-up.
3.1 Problem solutions expectation
The following functional and non-functional specifications are given. These
specifications are the basic building blocks for a vision system which is used
as proof of concept.

01-01-2013
Development of intelligent vision system for
monitoring in welding
22
3.1.1 Requirements specification
Table 3-1 Functional requirements
Functional requirements
R1 The Vision System has to be made by using a digital camera with a
short sensor exposure time.
R2 Use pulse laser diodes, SPL PL903 from OSRAM to develop an
external light source. The LEDs is to be arranged in an array.
R3 The external light source needs to be synchronized with the camera, so
that the illumination is within the sensor exposure time.
R4 The camera has to be connected to a computer using an Ethernet cable,
the images is saved as TIFF file, with a frame rate at between 5-30
frames per second
R5 The system has to be developed so it is possible to adjust the lighting
conditions during a monitoring process. And with a software program
which sorts the images, in order to avoid over-exposed images.
R6 Determine which experimental setup provides the best image with the
most geometrically detail of the weld pool.
Table 3-2 Non-functional requirements
Non-functional requirements
NR1 The Vision System has to be developed using a Prosilica GC 750c or
GC650 camera.
For testing different combination of illumination a Nexys2 FPGA
development kit is used, from Digilent.
NR2 The software program developed for the camera is written in C++.
NR3 The software program developed for the FPGA development kit is
written in VHDL.
3.2 Solution and implementation
In this section the final solution is reviewed. The idea for this project is to
develop a method to illuminate a welding process with laser light in order to

01-01-2013
Development of intelligent vision system for
monitoring in welding
23
examine the possibility to capture quality and detailed images of a real-time
welding process . The solution model consists of a high-speed camera and a
light source which is designed to be controlled by the camera. Furthermore,
the light source can be connected to a FPGA which provide the ability to
regulate the brightness of the laser light.
3.2.1 Design Overview
In figure 3-1 an overview of the systems set-up is shown. By placing the light
source in front of the camera, makes the backlight most effective and therefore
suppresses the welding arc most.
image storage
Weldin Torch
Welding direction
Optical Band pass filter
CameraLight source
Laser driver
FPGA
NI-DAQUSB device
Figure 3-1 Camera and laser synchronization method
The vision system is developed so that the laser driver which controls the light
source can be driven with or without a FPGA. By implementing the FPGA, the
ability of testing a number of different light conditions can be carried out.
The system is developed by setting the camera as the controlling master. The
camera is set to capture 30 fps. For each time a frame is to be captured a

01-01-2013
Development of intelligent vision system for
monitoring in welding
24
trigger signal is transmitted out of the camera through the input/output
connectors.
A laser driver has been developed, with one input port which handles the
trigger signal and five output ports one for each LED row. In a default mode
without connecting the FPGA, the systems is designed to trigger in a series
connected configuration which triggering one LED row after another.
When the FPGA is connected, several triggering combination is made
possible.
In order to control the brightness of the light source, which is done by regulate
the amount of lit diodes, a communications between the PC and the FPGA has
to be developed. A RS232 communications between the PC and the FPGA is
the initial solution model. Due to time constrains it was decided to use a NI
DAQ. The use of DAQ generated a digital signal which is transmitted to the
FPGA and used to regulate the lightings.
3.2.2 Laser diode circuit17
In this section it is clarified how the final circuit which drives the pulse laser
diodes is designed.
Laser diode
One reason of using laser diodes with a wavelength of 905 nm is, because
most of the light emitted from the weld arc and molten weld pool is a very
intense light, shown on a the spectroscopy measurement on (figure 2-2 in
section 2.1.2). Looking at the spectroscopy measurements at near 905 nm,
much of the light intensity is reduced, in relation to the measurement of the
whole area. Using a bandpass filter designed for 905 nm, reduces the data
processing of each image.
Even when using a bandpass filter the light which is passing through the filter
is still blinding. The magnitude of the light passing through the filter can be
measured and can be seen on (figure 2-3 section 2.1.3), by adding a source of
17 References to bibliography [4], Appnote_Operating_SPL_PLxx_03112004

01-01-2013
Development of intelligent vision system for
monitoring in welding
25
light with even larger magnitude, it is possible to exceed much of the light
emitted from a welding process, and in much the same way a photographer
uses flash light for lightings. Therefore it is of interest to use these laser diodes
together with 905 nm bandpass filter.
3.2.3 Developed circuit
The pulse laser diodes circuit is made of one circuit which then is copied to
four parallel circuits. A field effect transistor (MOSFET), TCPA8004 is used as
a switch for operating two laser diodes at a time connected in series.
The MOSFET has a voltages breakdown at above 30 V and has a peak current
operation area at 120 A in a pulsing circuit. With this fact in mind a circuit is
designed.
U8B
SN74123
VCC16
Q5
Q12
REXT/CEXT7
CEXT6
CLR
11
A9
B10
C1922pF
R7
5k
5V
5V
5V
CameraTriggerSignal
C2110uF
5V
U4
EL7104/SO
IN2
OUT-6OUT+7
V+1
V+85V
C124.7uF
C112nF
R110
Q5
TPCA8004-H
S1
S2
S3
G4
D6
D7
D8
D5
D12
GND
D18V
C14
10uf
Ceramic
D11
SPL-PL903
C3010uf
Monostable multivibrator
Mosfet driver
Laser diode array
3-2 Laser driver schematic, one signal transmission line
The above schematic in figure 3-2 shows one trigger pulse circuit. As
mentioned before (in section 2.1.4) when the exposure event on the camera is
high, a trigger signal is transmitted. This trigger signal follows the exposure
event which is changeable in-between 8 μs and 60 s, with 1 μs division.
When the laser diodes is lit and it draws a peak power of 75 W, the pulse
width is limited to 100 ns otherwise the laser diodes will burn out. Therefore it
is necessary to shorten the trigger signal transmitted from the camera. In order
to downgrade the trigger signal a monostable multivibrator, SN74AHC123 is
used. The pulse duration for the monostable multivibrator is given by:

01-01-2013
Development of intelligent vision system for
monitoring in welding
26
Equation 3 Pulse duration equation
TTw CRKt
Table 3-3 Unity explanation
Pulse duration unit description
wt Pulse duration in ns
TR External timing resistor in k
TC External capacitance in pF
K Multiplier factor
Calculating the external timing resistor TR :
Equation 4 calculates the external timing resistance
kpF
ns
CK
tR
T
w
T 136.1224
100
By fixing the external capacitance value TC to 22 pF, it is possible to adjust the
pulse duration wt to 100 ns by using a potentiometer as an external timing
resistor TR . As can be seen of the calculation above the external timing resistor
is calculated to be 1.136 k . To adjust the external timing resistor a
potentiometer at 2 k or larger can be used.
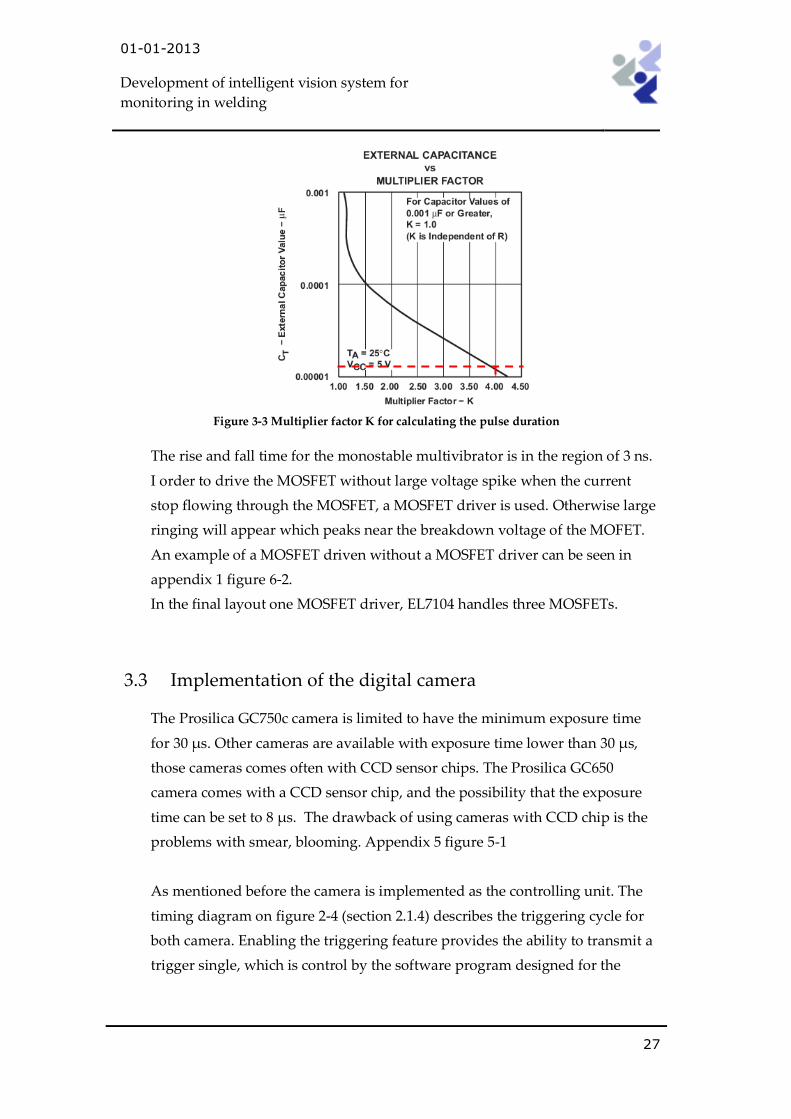
The multiplier factor K is determined by following figure 3-3 found in the
datasheet for SN74AHC123:
01-01-2013
Development of intelligent vision system for
monitoring in welding
27
Figure 3-3 Multiplier factor K for calculating the pulse duration
The rise and fall time for the monostable multivibrator is in the region of 3 ns.
I order to drive the MOSFET without large voltage spike when the current
stop flowing through the MOSFET, a MOSFET driver is used. Otherwise large
ringing will appear which peaks near the breakdown voltage of the MOFET.
An example of a MOSFET driven without a MOSFET driver can be seen in
appendix 1 figure 6-2.
In the final layout one MOSFET driver, EL7104 handles three MOSFETs.
3.3 Implementation of the digital camera
The Prosilica GC750c camera is limited to have the minimum exposure time
for 30 μs. Other cameras are available with exposure time lower than 30 μs,
those cameras comes often with CCD sensor chips. The Prosilica GC650
camera comes with a CCD sensor chip, and the possibility that the exposure
time can be set to 8 μs. The drawback of using cameras with CCD chip is the
problems with smear, blooming. Appendix 5 figure 5-1
As mentioned before the camera is implemented as the controlling unit. The
timing diagram on figure 2-4 (section 2.1.4) describes the triggering cycle for
both camera. Enabling the triggering feature provides the ability to transmit a
trigger single, which is control by the software program designed for the

01-01-2013
Development of intelligent vision system for
monitoring in welding
28
camera. Figure 3-4 shows the port-map for both cameras. This trigger signals
is transmitted through SYNC OUT port.
Figure 3-4 Prosilica camera connection options18
The developed program is written in Microsoft Visual C++. The program is
developed by the use of code examples that came with the Legacy software
AVT PvAPI19. The Legacy software AVT PvAPI is one of several SDK,
software development kit, which can be used to write program code in.
The following flowchart illustrates the code used in this project.
3.3.1 Flowchart diagram of main program
18 Datasheet found on CD, GC_TechMan_V2.0 page 54 19 http://www.alliedvisiontec.com/emea/products/legacy.html
01-01-2013
Development of intelligent vision system for
monitoring in welding
29
Start Program
Initialize the PvAPIif((errCode = PvInitialize()) !=
ePvErrSuccess)
Initialize camera structurememset(&GCamera,0,sizeof(tCamera))
Yes
Wait for a camera to be plugged in WaitForCamera()
Get first camera foundif(CameraGet())
Open cameraif(CameraStart())
Yes
No
No
Start streaming from the cameraif(CameraStart())
Yes
Runs until 30 images is storedwhile(WaitForUserToQuitOrSnap())
Yes
No
True
Stop the camera CameraStop()
Close cameraCameraUnsetup()
False
Uninitialize PvAPIPvUnInitialize()
End program
No
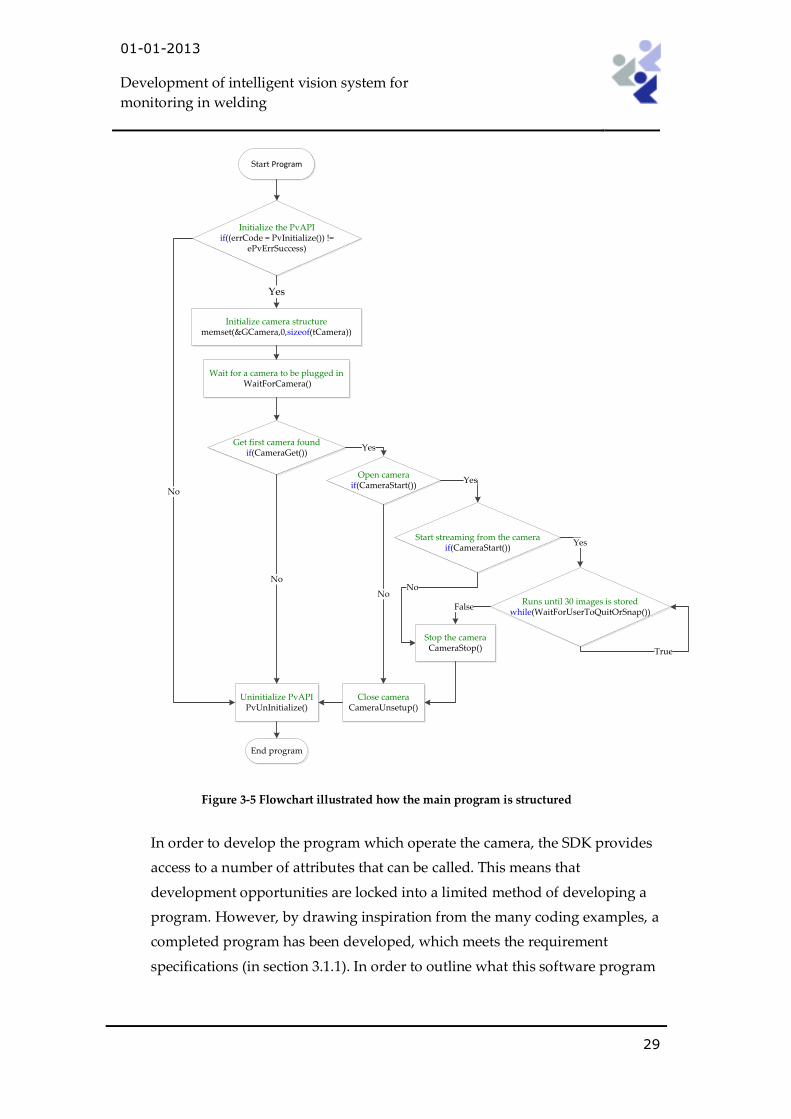
Figure 3-5 Flowchart illustrated how the main program is structured
In order to develop the program which operate the camera, the SDK provides
access to a number of attributes that can be called. This means that
development opportunities are locked into a limited method of developing a
program. However, by drawing inspiration from the many coding examples, a
completed program has been developed, which meets the requirement
specifications (in section 3.1.1). In order to outline what this software program

01-01-2013
Development of intelligent vision system for
monitoring in welding
30
is designed for is here an overview. More details and flowcharts are found in
appendix 2.
3.3.2 Code review
Before compiling the program code, the frame rate, exposure time, gain value
and the number of images to save is determined. By setting frame rate to 30
makes the program able to capture 30 images per second. The exposure time
determines for which period of time the sensor chip is exposed and the gain
value fixed the sensor sensitivity. For best image quality gain values should
remain at zero.
The following description of the function is illustrated on the flowchart
diagram in appendix 4 figure 6-7.
The _STDCALL FrameDoneCB is a program thread which runs continually in
parallel with the main program thread. Every time a frame is captured the
function _STDCALL FrameDoneCB is called. Then function pixelsvalue()
is called which copy all the pixel value in to a 2-dimensional array called
arraytest[j][i]. In the next step, the next function readpixeldata()is
called, this function readout the pixel value and counts up the number of
pixels which has a value above 240, whay is that interessting? The reason is
when a pixel has the value of 250 it is saturated and will appear as a white dot
in an image. The amount of pixels that exceeds this limit is counted and saved
in the integer type overexpo, for validation purpose later in the program.
I order to avoid program locking the count of pixel value is performed only on
9
1 of the image. Which is the center part of the image. The value of overexpo
determines if the captured frame is savde or droped. If the overexpo is belov
100 the frame will be saved.
Before saving the captured image, function regout() is called. This function
compares the value of the integer type sum, in relation to a set of parameter.
This parametser determines how many LED row will be lit aftaer light
expuser regulation. In order making the camera software to communicat with

01-01-2013
Development of intelligent vision system for
monitoring in welding
31
the FPGA and carrie out this lighting ajustment a M-series Multifunction Data
Acqusition Module (DAQ)20 is used to transmit the singals.
The above process is repeated until the required amount of images are stored
on the harddisk.
3.4 Implementation of the FPGA
This section describes the use of the FPGA. The FPGA is used to test a few
different condition of operation the light source in order to examine the
conditions required to achieve the best lightings. The use of the FPGA is
perhaps overrated. A CPDL would be more appropriate for carry out the few
commands to control the light source.
3.4.1 Block diagram overview
Requirement for this system is to handle a few I/O signals. The following
block diagram gives an overview of how the architecture is designed.
All the sub modules are shortly described in the Functionality section in the
TopLevel description in table 3-4.
20 National Instrument USB DAQ 6212 more detail is found on NI website. http://sine.ni.com/nips/cds/view/p/lang/da/nid/207096
01-01-2013
Development of intelligent vision system for
monitoring in welding
32
Top Level
Cout
ClkEnaPulseRst
ClkEnaModeRst
LED
Pulse_rco
Test_Pulse
TriggerPulseGen
Output
ClkModulator
Btn0Btn1MclkRst
Mode
SevenSegCnt_rco
ClkRst ModulatedClk
Output_Test
Pulse PulseWave
LED
PortControl
PortReg
PortOutput
Sw
OutputPortControl
SevenSegDisplay
SevenSegCnt_rco AN0SevenSeq
SevenSegOut
Btn0
Btn1
Clk
Ena
Rst
Sw
5
2
2
4
4
5
5
5
5
5
5
4
7
5
LedControl
TPulseOut
Led
AN0SevenSeq
SevenSegOut
PortRegPortInput
LedArrayControl
PortInput
5
5
5
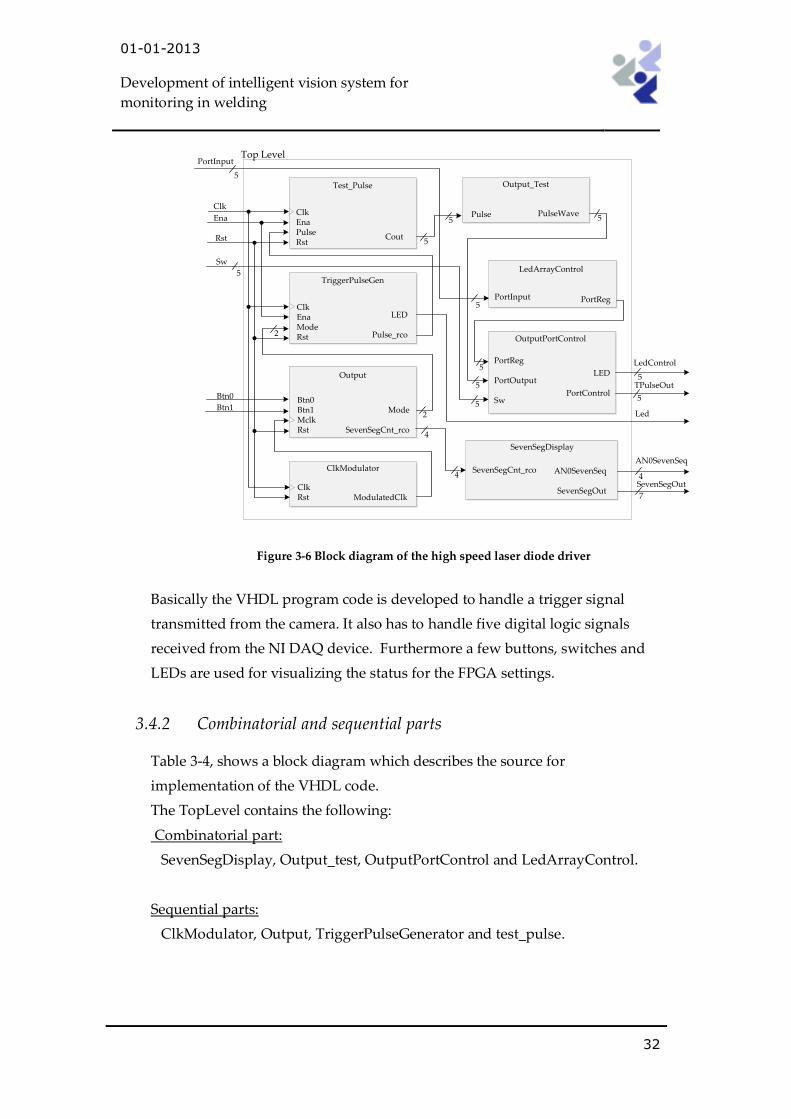
Figure 3-6 Block diagram of the high speed laser diode driver
Basically the VHDL program code is developed to handle a trigger signal
transmitted from the camera. It also has to handle five digital logic signals
received from the NI DAQ device. Furthermore a few buttons, switches and
LEDs are used for visualizing the status for the FPGA settings.
3.4.2 Combinatorial and sequential parts
Table 3-4, shows a block diagram which describes the source for
implementation of the VHDL code.
The TopLevel contains the following:
Combinatorial part:
SevenSegDisplay, Output_test, OutputPortControl and LedArrayControl.
Sequential parts:
ClkModulator, Output, TriggerPulseGenerator and test_pulse.
01-01-2013
Development of intelligent vision system for
monitoring in welding
33
Table 3-4 Description of the VHDL TopLevel
TopLevel
Description
The Toplevel module is a collection of eight sub-modules. The Toplevel receives
a trigger signal. The received signal is used to generate 5 new trigger signals
which are transmitted out through one of the 12 pin I/O PMOD connector port.
The FPGA is programmed to operate in 3 different modes. To change among the
operation modes, two dedicated pushbuttons are used to change among the
operations modes. The seven segment display is used for indicating in which
mode the FPGA is currently in.
One of the 12 pin I/O PMOD connectors is used for receive a digital signal
which regulate the number of output port to the laser driver is open or closed.
Five switches are set to manual open or closing the output port and the LED
above the switch is lit when the dedicated port is open.
Interface
Input Clk
Rst
Ena
PortInput 5 bit vector
Sw 5 bit vector
Btn0
Btn1
Output TPulseOut 5 bit vector
Led
LedControl 5 bit vector
SevenSegOut 7 bit vector
AN0SevenSeq 4 bit vector
Functionality
ClkModulator module
Converts the onboard 50 MHz CLK to 1 Hz clk which is transmitted out
through ModulatedClk to the Output module.
Output module

01-01-2013
Development of intelligent vision system for
monitoring in welding
34
Input: BTN0, BTN1 and Mclk and Rst.
Output: Mode: 3-bit binary signal
SevenSegcnt_rco: 4-bit binary signal
The Mclk is used for debouncing purpose. When the buttons are pushed for
100ms, Mode and SevenSegcnt_rco is counted one, up or down.
TriggerPulseGen module
Input: Clk, Ena, Rst.
Mode: 3-bit binary signal
Output: LED: lit the led when Ena is high.
Pulse_rco: Pulse duration 8 us, 30 us or 15 us.
The trigger signal transmitted from the camera is received on Ena port. Mode
determines the pulse duration transmitted through Pulse_rco, with a pulse
width of 20 ns. The LED is lit when Ena is high, which indicate the camera
frame rate.
Test_Pulse module
Input: Clk, Ena, Rst and Pulse.
Output: Cout: 5-bit binary signal
This module converts the input signal from Pulse to a 5-bit binary output. Ena
determines the output pulse width.
Output_Test module
Input: Pulse: 5-bit binary signal
Output: PulseWave: 5-bit binary signal
This module receives a 5-bit binary input which is converted to 5 pulse waves.
One pulse wave for each output port.
LedArrayControl module
Input: PortInput: 5-bit binary signal
Output: portReg: 5-bit binary signal
This module receives a 5-bit binary input. The 5-bit binary output signal is
identical to the input (this module is unnecessary in this context, this module

01-01-2013
Development of intelligent vision system for
monitoring in welding
35
was met for a communication protocol that was dropped).
OutputPortControl module
Input: PortReg: 5-bit binary signal
PortOutput: 5-bit binary signal
Sw: 5-bit binary signal
Output: Led : 5-bit binary signal
PortControl: 5-bit binary signal
This module regulates which output port transmits the trigger signal received
on the input port PortOutput. When the individual port on PortReg and Sw is
high the signal received on PortOutput is transmitted out on PortControl. When
the individual port on Sw is high the individual port on LED is high.
SevenSegDisplay
Input: SevenSegCnt_rco: 4-bit binary signal
Output: SevenSegOut: 8-bit binary signal
AN0SevenSeq: 5-bit binary signal
This module receives a 5-bit binary single on the input port SevenSegCnt_rco.
Which is coded for displaying an integer digit on the sevens segment display,
through output port SevenSegOut. AN0SevenSeq determines which sevens
segment digit, data is written out on.
3.5 Simulations and tests
Testing is important in the development. In this section a simulation on the
MOSFET and the laser diodes has been performed. This simulation is the basis
for the final circuit. During the VHDL coding all the modules which has been
written, are simulated in ModelSim to insure that the code is working as
intended. Furthermore oscilloscope measurements have also been made for
testing the circuit board.

01-01-2013
Development of intelligent vision system for
monitoring in welding
36
3.5.1 Laser diode simulation
In OrCAD Pspice the following laser diode circuit in figure 3-7 is tested. The
MOSFET TPCA8004-H and the laser diodes are not standard components in
Pspice. Therefore an IRF150 MOSFET is used instead. There are differences
between the breakdown voltage and the rise- and fall-time, apart from that,
this MOSFET can be used to determined the laser diodes characteristic when
the diodes is connected in series.
V3
6VDC
R9
0.1
SPL_PL90 LED
0
0
M1IRF150
L1
3n
R4
1V2TD = 0
TF = 10nPW = 100n
V1 = 0
TR = 10n
V2 = 10
PER = 1m0
I
Figure 3-7 Pspice simulation of the laser diodes with a 40A MOSFET
As mentioned, the laser diode is not a standard Spice part. The following
graph is found in the datasheet for the laser diode.

01-01-2013
Development of intelligent vision system for
monitoring in welding
37
Figure 3-8 Optical output power and forward current characteristic
The forward voltages and the forward current can be read from the graph on
figure 3-8, and by calculating the diode resistance21:
1.0
1040
710
AA
VV
I
Vr
F
Fd
A model can be made and used for simulate the current and voltage
characteristic for the laser diode.
21 References to bibliography [24], from Wikipedia http://en.wikipedia.org/wiki/Diode_modelling
01-01-2013
Development of intelligent vision system for
monitoring in welding
38
Time
0s 40ns 80ns 120ns 160ns 200ns 240ns 280ns 317ns
I(R9)
0A
10A
20A
30A
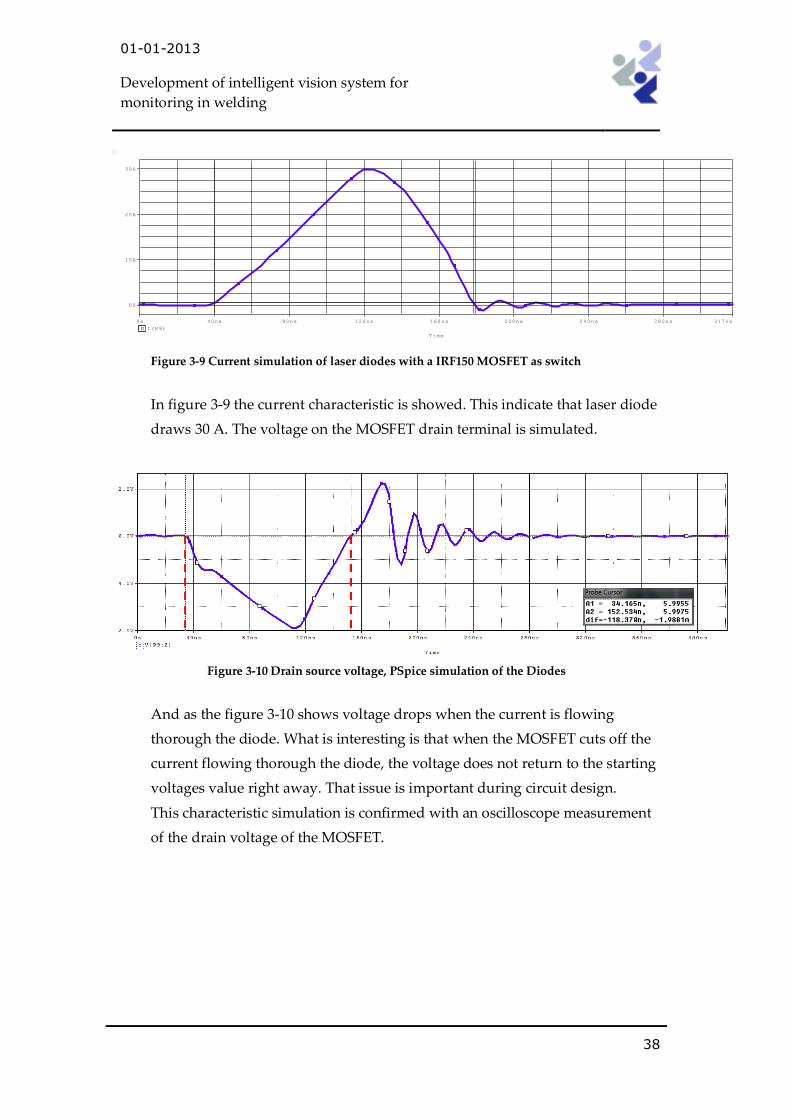
Figure 3-9 Current simulation of laser diodes with a IRF150 MOSFET as switch
In figure 3-9 the current characteristic is showed. This indicate that laser diode
draws 30 A. The voltage on the MOSFET drain terminal is simulated.
Figure 3-10 Drain source voltage, PSpice simulation of the Diodes
And as the figure 3-10 shows voltage drops when the current is flowing
thorough the diode. What is interesting is that when the MOSFET cuts off the
current flowing thorough the diode, the voltage does not return to the starting
voltages value right away. That issue is important during circuit design.
This characteristic simulation is confirmed with an oscilloscope measurement
of the drain voltage of the MOSFET.
01-01-2013
Development of intelligent vision system for
monitoring in welding
39
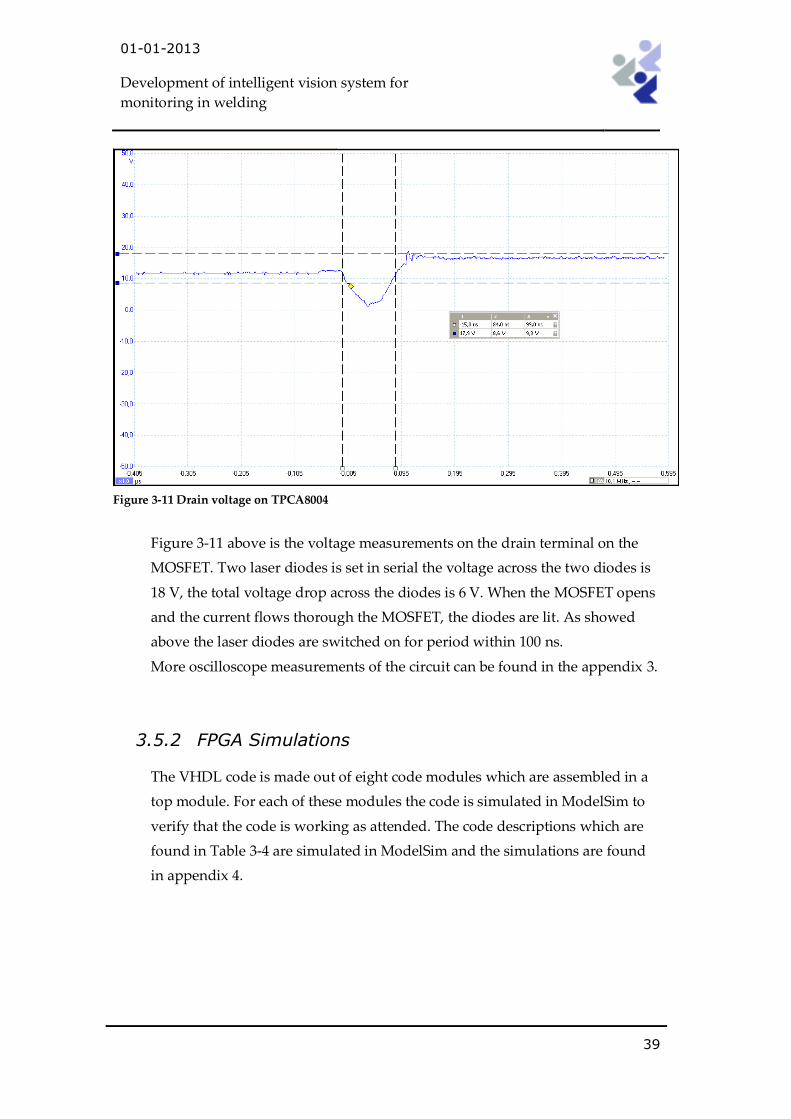
Figure 3-11 Drain voltage on TPCA8004
Figure 3-11 above is the voltage measurements on the drain terminal on the
MOSFET. Two laser diodes is set in serial the voltage across the two diodes is
18 V, the total voltage drop across the diodes is 6 V. When the MOSFET opens
and the current flows thorough the MOSFET, the diodes are lit. As showed
above the laser diodes are switched on for period within 100 ns.
More oscilloscope measurements of the circuit can be found in the appendix 3.
3.5.2 FPGA Simulations
The VHDL code is made out of eight code modules which are assembled in a
top module. For each of these modules the code is simulated in ModelSim to
verify that the code is working as attended. The code descriptions which are
found in Table 3-4 are simulated in ModelSim and the simulations are found
in appendix 4.

01-01-2013
Development of intelligent vision system for
monitoring in welding
40
4. Discussion
This section is a overview of how the developed system is intended to work. A
short presentation of the project outcome is presented and few improvements
are taken into account. Furthermore a review of the images is done with an
explanation of how the image was produced.
4.1 Project outcome
4.1.1 Developed hardware
The developed system meets 5 of 6 the requirements in section 3.1. The goal
for this project was to develop a system which making it possible to monitor a
welding process in real time. The system had to provide clear quality image of
the weld pool.
The system designed to operate two types of cameras with varies exposure
time. As the result shows further down in this section this solution is capable
of carry out the task as desired. The one requirement that was not meet is the
establishment of an optical system. The ability to set the lenses in precise
alignment was a huge issue, and the lack of optical theoretical knowledge did
not contributed to solving the problem. One optical system was tested but did
not delivered the optical output power form the laser beams effective enough
to be used as illumination for this project.
4.1.2 Developed software
For the purpose of testing the designed system solution, the developed
software meets the requirements. Though one error is found in function,
regout()seen in appendix 2 figure 6-10. The integer type sum, was
intended to be used to configurate the light condition, compare with total
backlightings. But, sum only contains one value of one pixle, which is the last

01-01-2013
Development of intelligent vision system for
monitoring in welding
41
pixel read in the function, readpixeldata(). This error has to be fixed in
another manner.
4.1.3 System improvement
There is a lot of improvement to be done. Starting with the hardware:
As explained in section 3.2.3 (circuit description) the circuit board which
driving the 30 laser diodes, is designed from one circuit operation six diodes,
which then is added four times in a parallel connection. This could be
trimmed down to one circuit controlled by a shift register.
The laser diodes are semiconductors, which has various performances
characteristic. If placed in a series connection with another diode with a lower
performance characteristic, the one diode with lowest performance
characteristic will draw the second diode performance characteristic down
and thereby means, not all diodes provide maximum optical power. One laser
diode should have its own MOSFET and MOSFET driver.
As the laser diodes operate in the near infrared range, the exposure cannot be
seen with the naked eye. This made it challenging of line up the hardware in
the right settings.
This issue could be solved by adding a laser diode which emitting visible light
to be used as a pointer. It could be independently turned on and off.
The software could be developed with a GUI application enabling real time
adjustment of the lightings and controlling the camera exposure time and
image brightness evaluating conditions in order to optimize the image quality.
Instead of using the NI DAQ USB device the communication between the
hardware and the PC could be connected using an RS232 serial
communication. Instead of using a FPGA, a CPLD circuit could be as a link
between the developed hardware and the PC.
01-01-2013
Development of intelligent vision system for
monitoring in welding
42
4.2 Results
In this section it will be discussed which systems settings and lightings
conditions is basis of achieving good images.
The camera is placed in front of the welding direction. The light source is
placed on the opposite side of the camera. In this manner the backlighting
from the light source is reflecting directly in to the camera.
Test has also been made by illuminating the welding area from the side at an
angular of 90⁰ to the left of the camera view.
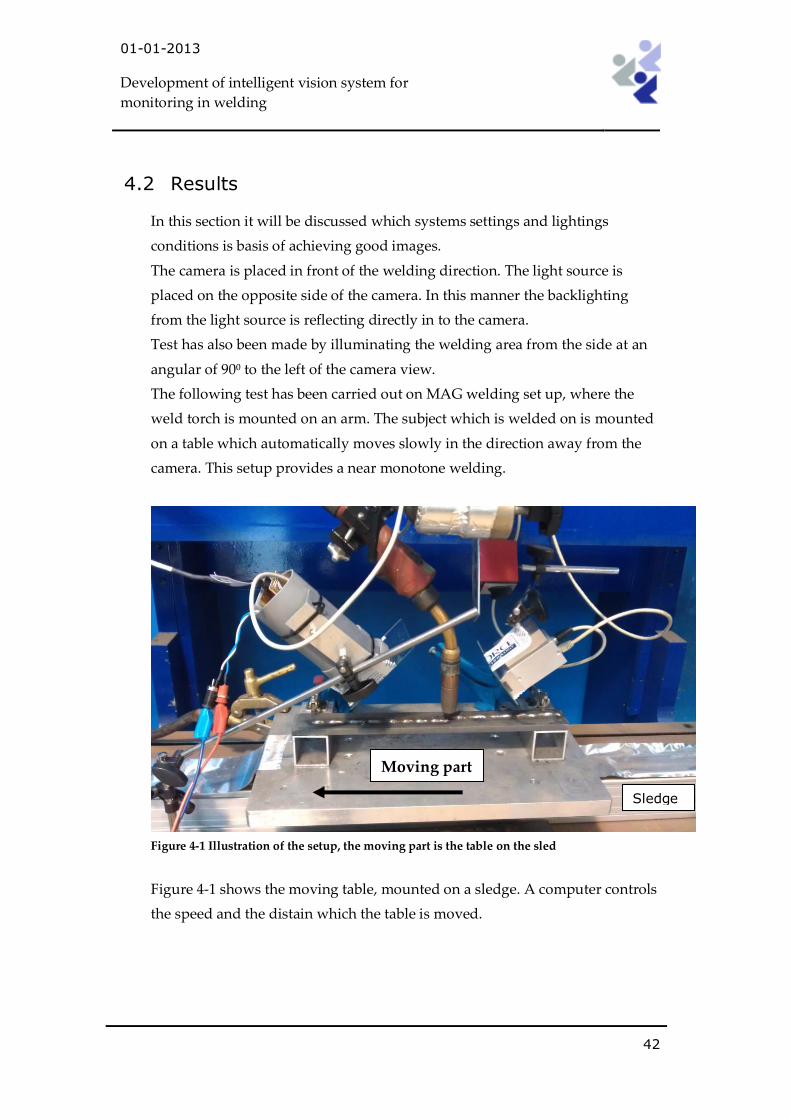
The following test has been carried out on MAG welding set up, where the
weld torch is mounted on an arm. The subject which is welded on is mounted
on a table which automatically moves slowly in the direction away from the
camera. This setup provides a near monotone welding.
Figure 4-1 Illustration of the setup, the moving part is the table on the sled
Figure 4-1 shows the moving table, mounted on a sledge. A computer controls
the speed and the distain which the table is moved.
Moving part
Sledge
01-01-2013
Development of intelligent vision system for
monitoring in welding
43
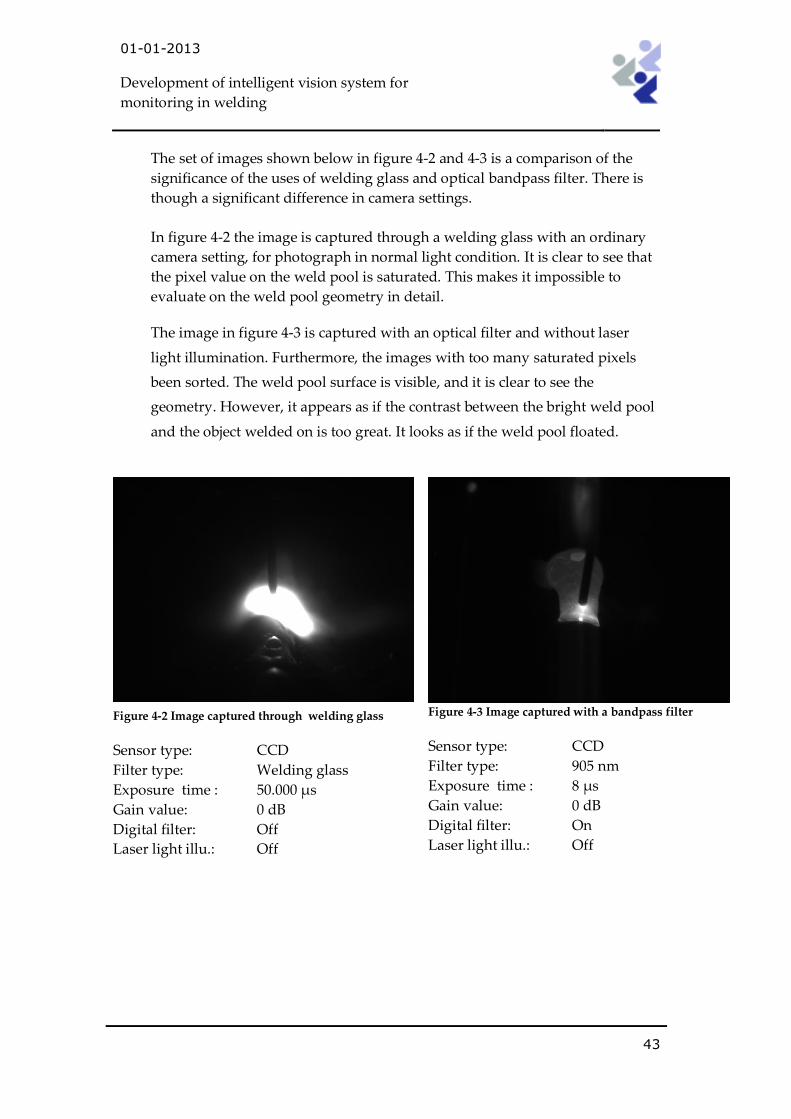
The set of images shown below in figure 4-2 and 4-3 is a comparison of the
significance of the uses of welding glass and optical bandpass filter. There is
though a significant difference in camera settings.
In figure 4-2 the image is captured through a welding glass with an ordinary
camera setting, for photograph in normal light condition. It is clear to see that
the pixel value on the weld pool is saturated. This makes it impossible to
evaluate on the weld pool geometry in detail.
The image in figure 4-3 is captured with an optical filter and without laser
light illumination. Furthermore, the images with too many saturated pixels
been sorted. The weld pool surface is visible, and it is clear to see the
geometry. However, it appears as if the contrast between the bright weld pool
and the object welded on is too great. It looks as if the weld pool floated.
Figure 4-2 Image captured through welding glass
Sensor type: CCD
Filter type: Welding glass
Exposure time : 50.000 μs
Gain value: 0 dB
Digital filter: Off
Laser light illu.: Off
Figure 4-3 Image captured with a bandpass filter
Sensor type: CCD
Filter type: 905 nm
Exposure time : 8 μs
Gain value: 0 dB
Digital filter: On
Laser light illu.: Off
01-01-2013
Development of intelligent vision system for
monitoring in welding
44
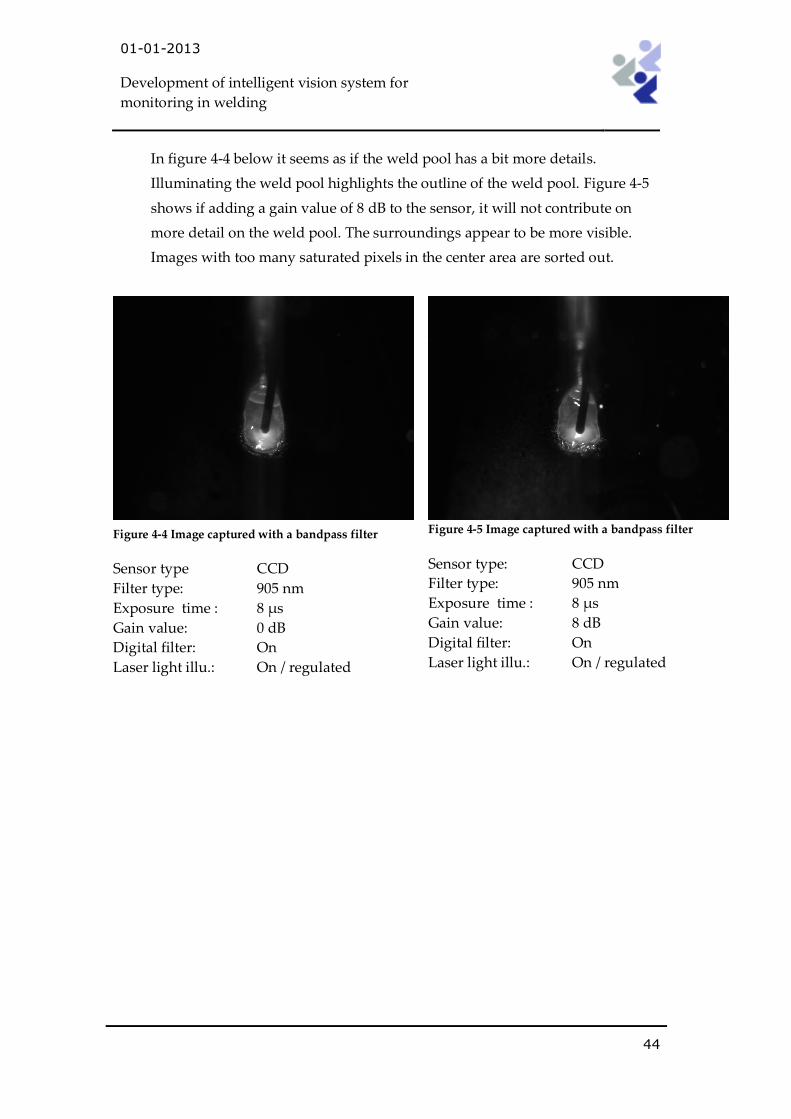
In figure 4-4 below it seems as if the weld pool has a bit more details.
Illuminating the weld pool highlights the outline of the weld pool. Figure 4-5
shows if adding a gain value of 8 dB to the sensor, it will not contribute on
more detail on the weld pool. The surroundings appear to be more visible.
Images with too many saturated pixels in the center area are sorted out.
Figure 4-4 Image captured with a bandpass filter
Sensor type CCD
Filter type: 905 nm
Exposure time : 8 μs
Gain value: 0 dB
Digital filter: On
Laser light illu.: On / regulated
Figure 4-5 Image captured with a bandpass filter
Sensor type: CCD
Filter type: 905 nm
Exposure time : 8 μs
Gain value: 8 dB
Digital filter: On
Laser light illu.: On / regulated
01-01-2013
Development of intelligent vision system for
monitoring in welding
45
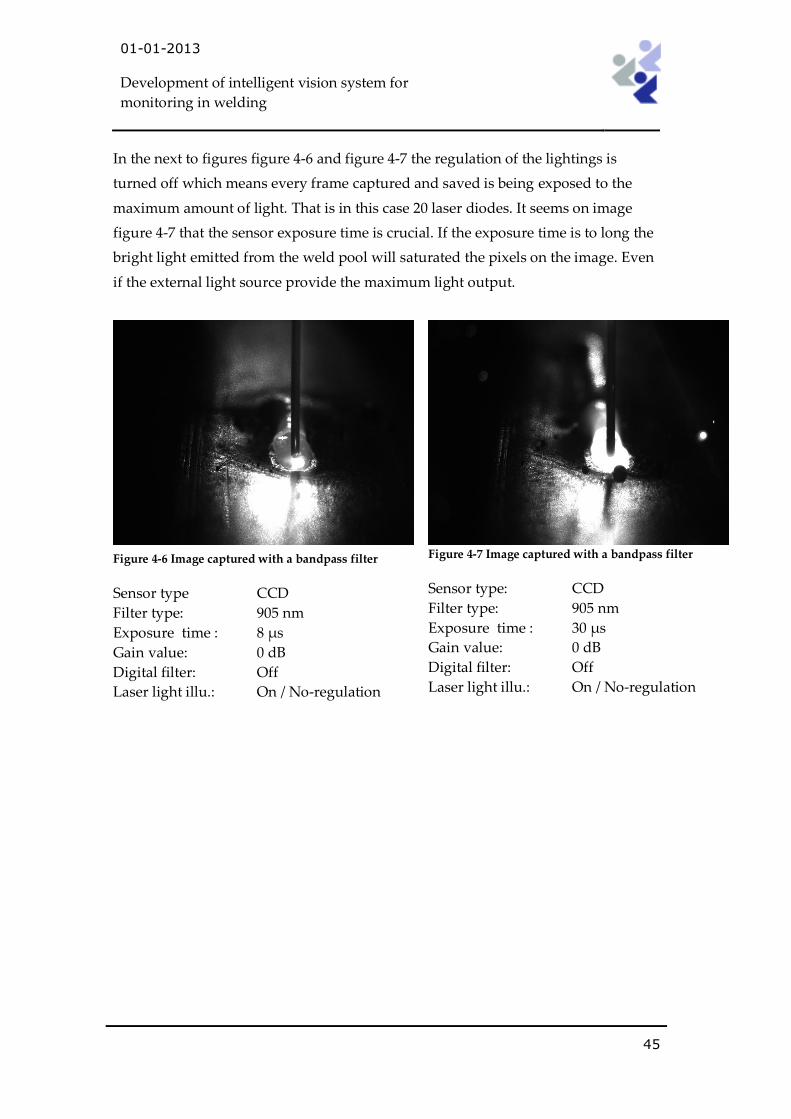
In the next to figures figure 4-6 and figure 4-7 the regulation of the lightings is
turned off which means every frame captured and saved is being exposed to the
maximum amount of light. That is in this case 20 laser diodes. It seems on image
figure 4-7 that the sensor exposure time is crucial. If the exposure time is to long the
bright light emitted from the weld pool will saturated the pixels on the image. Even
if the external light source provide the maximum light output.
Figure 4-6 Image captured with a bandpass filter
Sensor type CCD
Filter type: 905 nm
Exposure time : 8 μs
Gain value: 0 dB
Digital filter: Off
Laser light illu.: On / No-regulation
Figure 4-7 Image captured with a bandpass filter
Sensor type: CCD
Filter type: 905 nm
Exposure time : 30 μs
Gain value: 0 dB
Digital filter: Off
Laser light illu.: On / No-regulation
01-01-2013
Development of intelligent vision system for
monitoring in welding
46
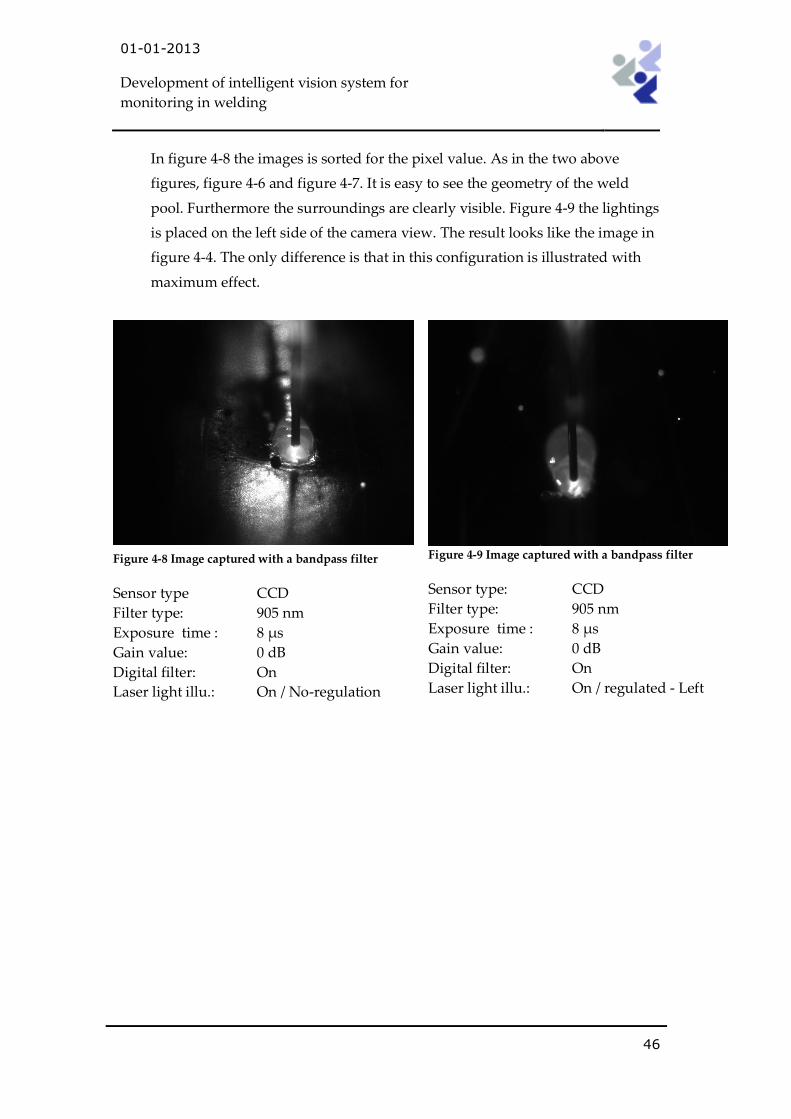
In figure 4-8 the images is sorted for the pixel value. As in the two above
figures, figure 4-6 and figure 4-7. It is easy to see the geometry of the weld
pool. Furthermore the surroundings are clearly visible. Figure 4-9 the lightings
is placed on the left side of the camera view. The result looks like the image in
figure 4-4. The only difference is that in this configuration is illustrated with
maximum effect.
Figure 4-8 Image captured with a bandpass filter
Sensor type CCD
Filter type: 905 nm
Exposure time : 8 μs
Gain value: 0 dB
Digital filter: On
Laser light illu.: On / No-regulation
Figure 4-9 Image captured with a bandpass filter
Sensor type: CCD
Filter type: 905 nm
Exposure time : 8 μs
Gain value: 0 dB
Digital filter: On
Laser light illu.: On / regulated - Left
01-01-2013
Development of intelligent vision system for
monitoring in welding
47
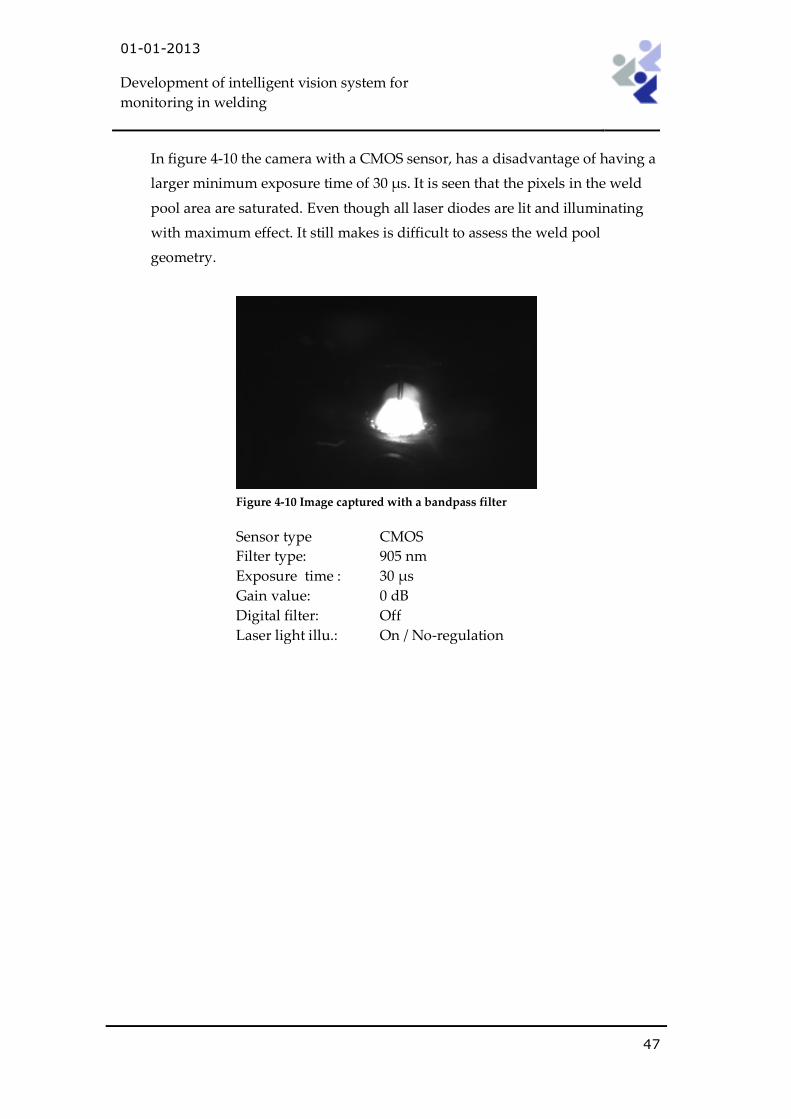
In figure 4-10 the camera with a CMOS sensor, has a disadvantage of having a
larger minimum exposure time of 30 μs. It is seen that the pixels in the weld
pool area are saturated. Even though all laser diodes are lit and illuminating
with maximum effect. It still makes is difficult to assess the weld pool
geometry.
Figure 4-10 Image captured with a bandpass filter
Sensor type CMOS
Filter type: 905 nm
Exposure time : 30 μs
Gain value: 0 dB
Digital filter: Off
Laser light illu.: On / No-regulation
01-01-2013
Development of intelligent vision system for
monitoring in welding
48
5. Conclusion
In this project there had been two areas of interest, the development a low-cost
system and an attempt to implement intelligence in to the system.
By adding intelligence on to the vision system makes it possible for future
work to develop more complex computer algorithmic which simulates the
human vision senses and the ability to gather important information during
the welding process.
The development of the hardware was a part of the project because a custom
design of external light source was needed, since such a system is not
available as an off the shelf hardware. During the system design,
experimental test of a circuit simulation was performed which provide key
knowledge in how the final system was to be developed.
Looking at the test results in section 4 it is shown the importance of using laser
light as illumination which has a great effect on the quality of the captured
images of the weld pool. Furthermore the use of optical filter important on
final image quality of the weld pool.
With this developed system the ability to gather geometrically information of
the weld pool is provided. By adjusting a few parameters in the program
which is controlling camera, the image quality can be fine adjusted as
required.
For the ability to adjust the brightness of the light source a FPGA was used for
the control of the external light source, by certain control parameter sent from
the camera program.
The vision systems are capable of operating to type of camera the GC650 and
GC750c. Depending on the digital filter settings, which sorted by the amount
of saturated pixels in the image this vision system, can deliver between 5-30
image per second.

01-01-2013
Development of intelligent vision system for
monitoring in welding
49
Bibliography
[1] H. Christian Kjeldsen Orye,
Sensor Based Welding Automating Modelling system Including a
Specially Developed Low-cost Temperature Imaging system,
Published 2005 by Aalborg University & Force Technology
[2] Dr Adam Whybrew
High Speed Imaging
http://www.oxfordlasers.com/imaging/high_speed
[3] P. Norman, H. Engström, A. F. H. Kaplan
State of the Art of Monitoring and Imaging of Laser Welding
Defects, Published 2007 by Lappeenranta, University of Technology
[4] Badr M. Abdullah
Monitoring of Welding Using Laser Diodes, Published (2009) by
University of Petroleum and Minerals Dhahran
[5] J. Liu
Passive Visual Sensing in Automatic Arc Welding, Published 2011 by
Technical University of Denmark
[6] B.M Abdullah, A. Al-Shamma’a , B. Lucas, J.D Cullen and M.
Houghton, Vision Systems for Monitoring and Controlling of Arc
and Laser/Arc Hybrid Processes, Published (2004) by University of
Liverpool
[7] G. Saeed
Vision-based sensing of the welding process: a survey, Int. J.
Modelling, Identification and Control, Vol. 1, No. 2, pp. 84–93, 2006
[8] S. Nordbruch, P. Tschirner and A. Gräser
Visual Online Monitoring of PGMAW Without a Light Unit,
Published (2000) by University Bremen Institute of Automation
[9] Cavitar ltd.
CAVILUX HF
http://www.cavitar.com/solutions_and_services/illumination_lasers/
products/cavilux_hf
[10] J. W. Nilsson S. E. Riedel

01-01-2013
Development of intelligent vision system for
monitoring in welding
50
Electric Circuits Ninth Edition, Published 2010 by Pearson
[11] P. J. Ashenden
Digital Design: An embedded Systems Approach Using VHDL,
Published 2008 by Morgan Kaufmann
[12] W. H. Ford, W. R. Topp
Introduction to C++: Computing Using C++ and Object Technology,
Published 1999, by. Prentice Hall
[13] E. Hecht
Optics Fourth Edtion, Addison Wesley, 2002
[14] Information on the C++ language
http://www.cplusplus.com/info/
[15] AVT PvAPI Programmer’s Reference Manual,version 1.26
[16] AVT GigE Camera and Driver Attributions Firmware 1.48
[17] J. R. Hansen
The Practical guide to VHDL Version 2.6, Engineering Collage of
Copenhagen, 2003
[18] Digilent, Inc.
Digilent Nexys2 Board Reference Manual, Pullman, WA, 2011
[19] Basics MatLab cod look-up
http://www.mathworks.se/matlabcentral/
[20] National Instrument USB 6212 manual pp 151-152.
[21] D. Radaj
Heat effects of welding - temperature field, residual stress, distortion,
Published 1992 by Springer in Berlin, New York.
[22] J. Lancaster
Handbook of structural welding - processes, materials and methods
used in the welding of major structures, pipelines and process plant,
Published 1992 by Abington Publishing in Cambridge.
[23] J. Norrish
Advanced welding processes, Published September 15,
2006 by CRC
[24] Calculating Diode Resistance
http://en.wikipedia.org/wiki/Diode_modelling

01-01-2013
Development of intelligent vision system for
monitoring in welding
51
Glossary
Abbreviations used in this project
Abbreviations Description
LED Light Emitting Diode
FPGA Field-Programmable Gate Array
CCD Charge-Coupled Device
CMOS Complementary Metal–Oxide–Semiconductor
NI National Instrument
DAQ Data Acquisition
USB Universal Serial Bus
MAG Metal Active Gas
QE Quantum Efficiency
TIFF Tagged Image File Format
RS232 Recommended Standard 232
MOSFET Metal–Oxide–Semiconductor Field-Effect Transistor
AVT Allied Vision Technologies
PvAPI Extensive application programming interface
SDK Software Development Kit
C++ C Object-Oriented Programming Language
CPLD Complex Programmable Logic Device
I/O Input / Output
VHDL VHSIC Hardware Description Language
(Very-High-Speed-Integrated-Circuit)
PMOD Peripheral Module
GUI Graphical User Interface
01-01-2013
Development of intelligent vision system for
monitoring in welding
52
6. Appendices
In appendices more figures are found of oscilloscope measurements, flowchart
description, examples of images quality on the two types of camera and the
ModelSim simulation of the VHDL code.
Appendix 1: Oscilloscope measurements
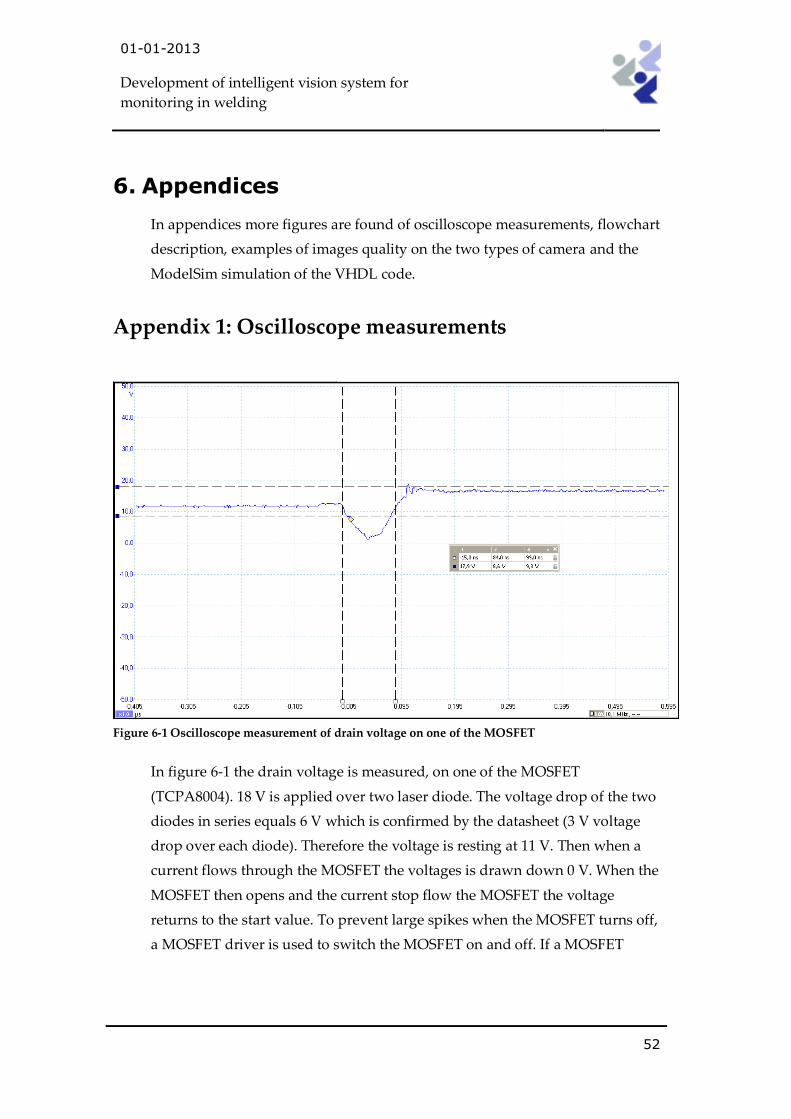
Figure 6-1 Oscilloscope measurement of drain voltage on one of the MOSFET
In figure 6-1 the drain voltage is measured, on one of the MOSFET
(TCPA8004). 18 V is applied over two laser diode. The voltage drop of the two
diodes in series equals 6 V which is confirmed by the datasheet (3 V voltage
drop over each diode). Therefore the voltage is resting at 11 V. Then when a
current flows through the MOSFET the voltages is drawn down 0 V. When the
MOSFET then opens and the current stop flow the MOSFET the voltage
returns to the start value. To prevent large spikes when the MOSFET turns off,
a MOSFET driver is used to switch the MOSFET on and off. If a MOSFET
01-01-2013
Development of intelligent vision system for
monitoring in welding
53
driver is not used the voltage would spike and reach the MOSFET voltage
limit at 30 V.
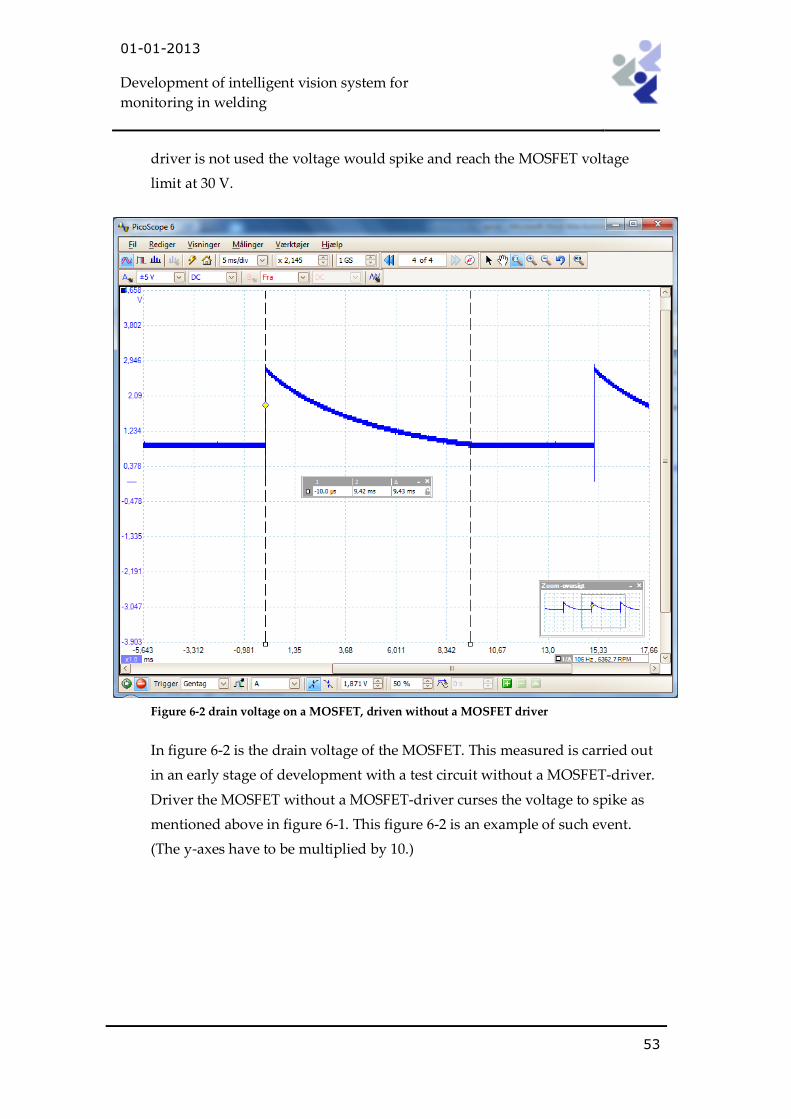
Figure 6-2 drain voltage on a MOSFET, driven without a MOSFET driver
In figure 6-2 is the drain voltage of the MOSFET. This measured is carried out
in an early stage of development with a test circuit without a MOSFET-driver.
Driver the MOSFET without a MOSFET-driver curses the voltage to spike as
mentioned above in figure 6-1. This figure 6-2 is an example of such event.
(The y-axes have to be multiplied by 10.)
01-01-2013
Development of intelligent vision system for
monitoring in welding
54
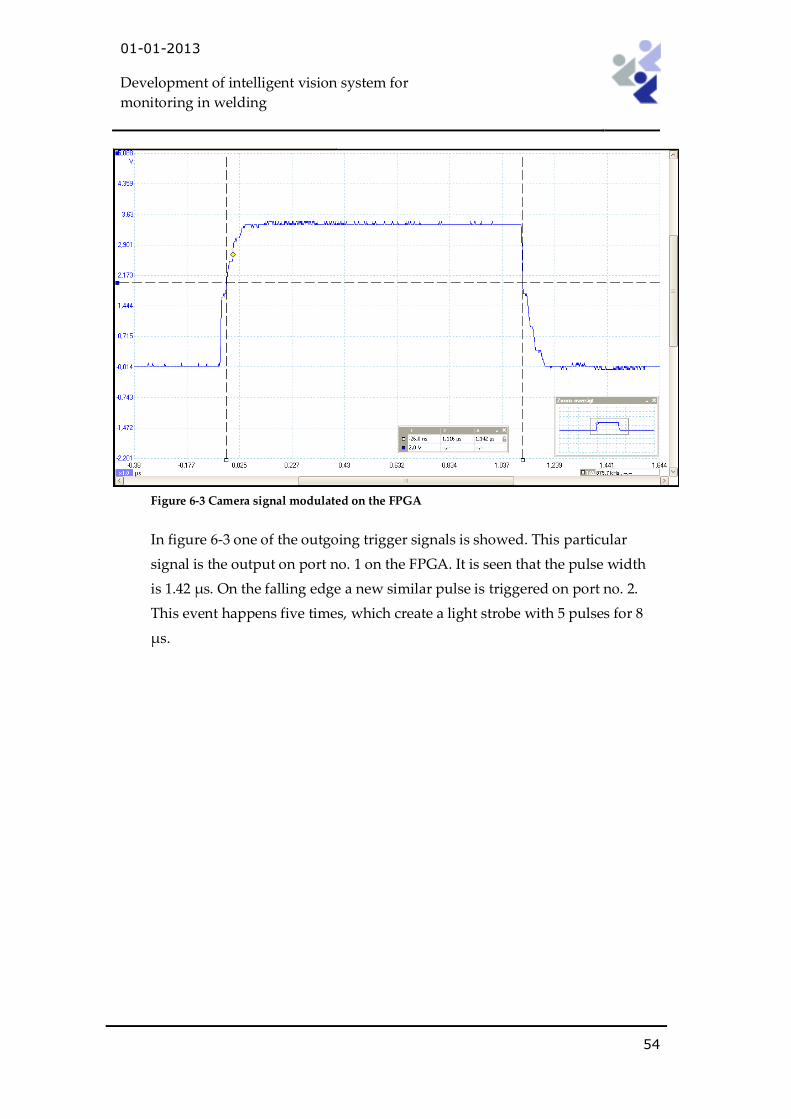
Figure 6-3 Camera signal modulated on the FPGA
In figure 6-3 one of the outgoing trigger signals is showed. This particular
signal is the output on port no. 1 on the FPGA. It is seen that the pulse width
is 1.42 μs. On the falling edge a new similar pulse is triggered on port no. 2.
This event happens five times, which create a light strobe with 5 pulses for 8
μs.
01-01-2013
Development of intelligent vision system for
monitoring in welding
55
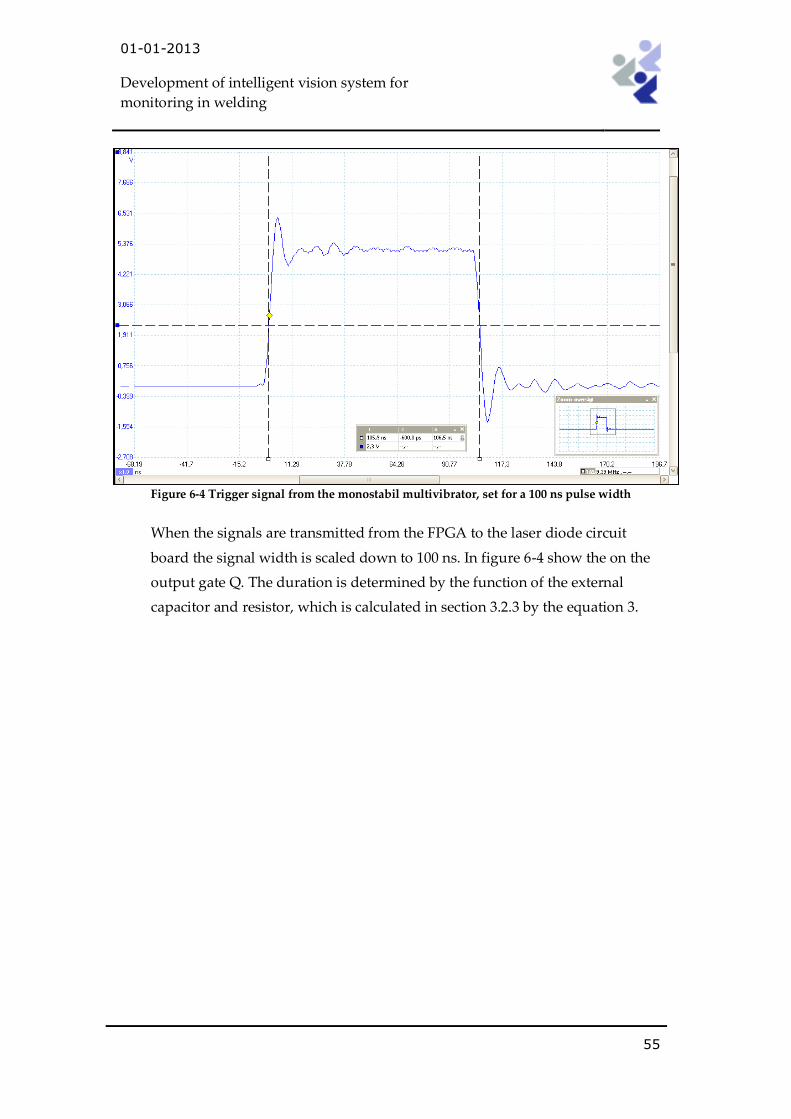
Figure 6-4 Trigger signal from the monostabil multivibrator, set for a 100 ns pulse width
When the signals are transmitted from the FPGA to the laser diode circuit
board the signal width is scaled down to 100 ns. In figure 6-4 show the on the
output gate Q. The duration is determined by the function of the external
capacitor and resistor, which is calculated in section 3.2.3 by the equation 3.
01-01-2013
Development of intelligent vision system for
monitoring in welding
56
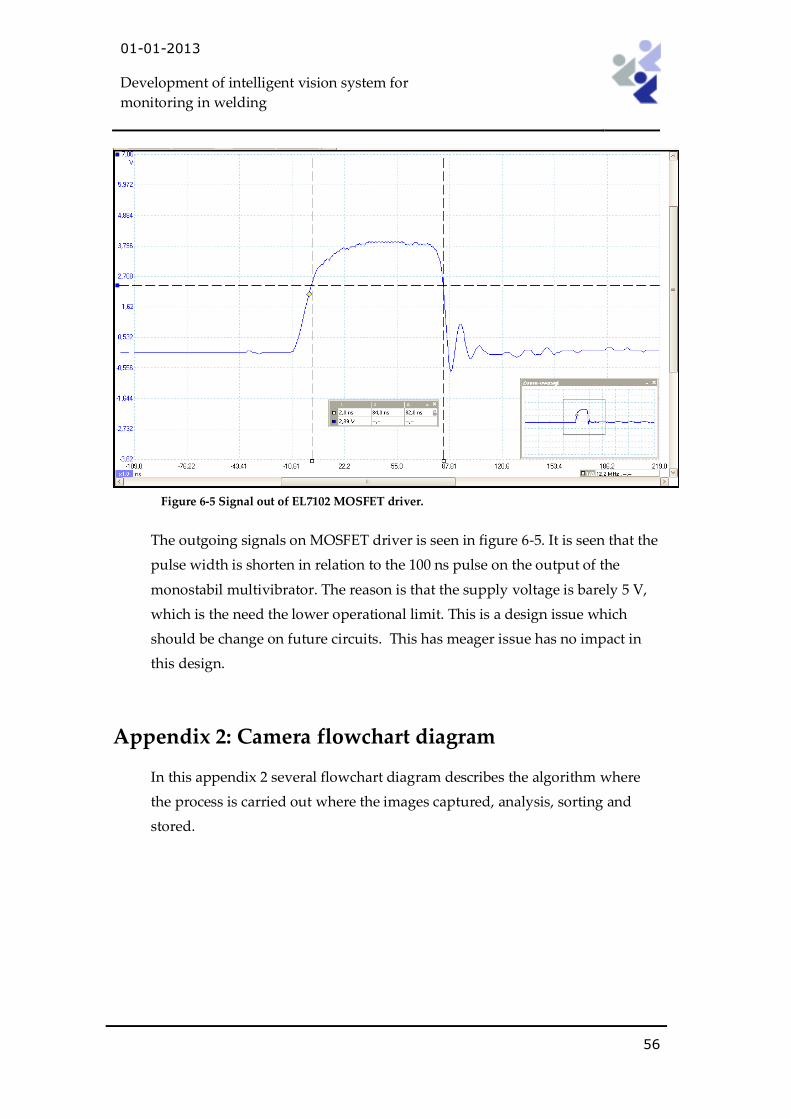
Figure 6-5 Signal out of EL7102 MOSFET driver.
The outgoing signals on MOSFET driver is seen in figure 6-5. It is seen that the
pulse width is shorten in relation to the 100 ns pulse on the output of the
monostabil multivibrator. The reason is that the supply voltage is barely 5 V,
which is the need the lower operational limit. This is a design issue which
should be change on future circuits. This has meager issue has no impact in
this design.
Appendix 2: Camera flowchart diagram
In this appendix 2 several flowchart diagram describes the algorithm where
the process is carried out where the images captured, analysis, sorting and
stored.
01-01-2013
Development of intelligent vision system for
monitoring in welding
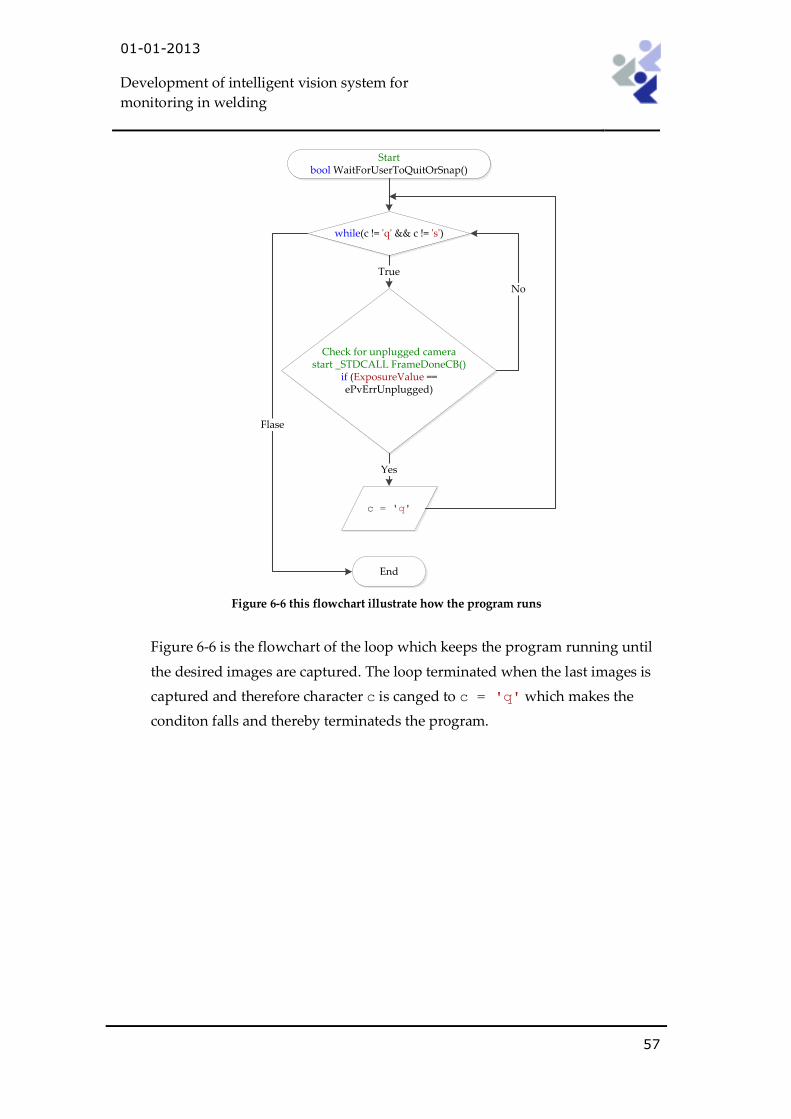
57
while(c != 'q' && c != 's')
Startbool WaitForUserToQuitOrSnap()
End
Check for unplugged camera start _STDCALL FrameDoneCB()
if (ExposureValue == ePvErrUnplugged)
c = 'q'
True
Yes
No
Flase
Figure 6-6 this flowchart illustrate how the program runs
Figure 6-6 is the flowchart of the loop which keeps the program running until
the desired images are captured. The loop terminated when the last images is
captured and therefore character c is canged to c = 'q' which makes the
conditon falls and thereby terminateds the program.
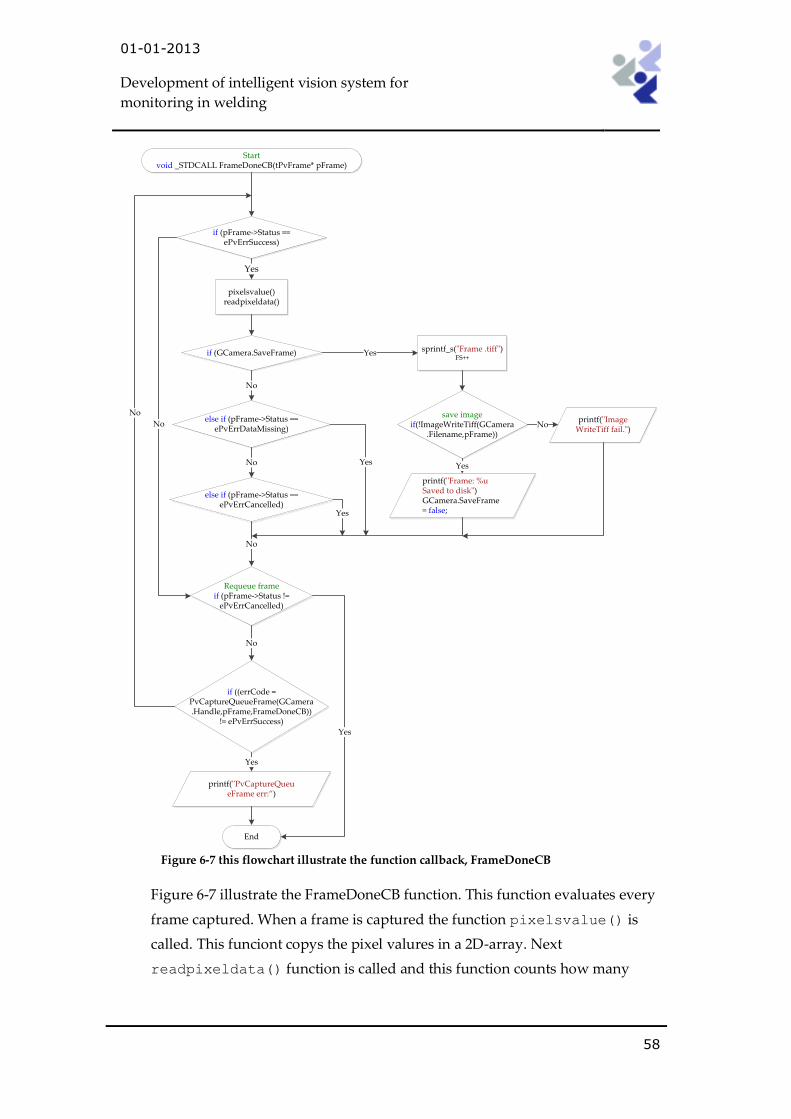
01-01-2013
Development of intelligent vision system for
monitoring in welding
58
Startvoid _STDCALL FrameDoneCB(tPvFrame* pFrame)
if (pFrame->Status == ePvErrSuccess)
pixelsvalue()readpixeldata()
Yes
if (GCamera.SaveFrame) sprintf_s("Frame .tiff")FS++
Yes
save imageif(!ImageWriteTiff(GCamera
.Filename,pFrame))
printf("ImageWriteTiff fail.")
No
printf("Frame: %u Saved to disk")GCamera.SaveFrame = false;
Yes
else if (pFrame->Status == ePvErrDataMissing)
No
else if (pFrame->Status == ePvErrCancelled)
No Yes
Yes
No
Requeue frameif (pFrame->Status !=
ePvErrCancelled)
if ((errCode = PvCaptureQueueFrame(GCamera.Handle,pFrame,FrameDoneCB))
!= ePvErrSuccess)
No
No
printf("PvCaptureQueueFrame err:”)
No
Yes
End
Yes
Figure 6-7 this flowchart illustrate the function callback, FrameDoneCB
Figure 6-7 illustrate the FrameDoneCB function. This function evaluates every
frame captured. When a frame is captured the function pixelsvalue() is
called. This funciont copys the pixel valures in a 2D-array. Next
readpixeldata() function is called and this function counts how many
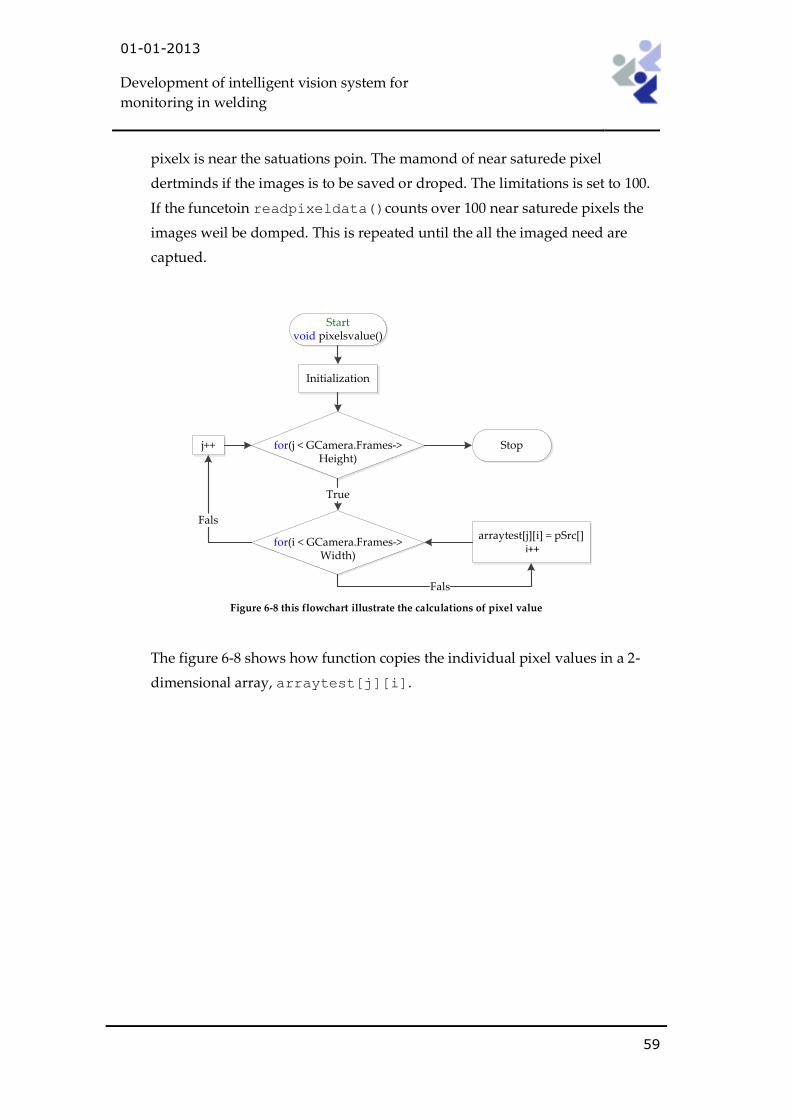
01-01-2013
Development of intelligent vision system for
monitoring in welding
59
pixelx is near the satuations poin. The mamond of near saturede pixel
dertminds if the images is to be saved or droped. The limitations is set to 100.
If the funcetoin readpixeldata()counts over 100 near saturede pixels the
images weil be domped. This is repeated until the all the imaged need are
captued.
Startvoid pixelsvalue()
Initialization
for(j < GCamera.Frames-> Height)
for(i < GCamera.Frames-> Width)
True
Stop
arraytest[j][i] = pSrc[] i++
j++
Fals
Fals
Figure 6-8 this flowchart illustrate the calculations of pixel value
The figure 6-8 shows how function copies the individual pixel values in a 2-
dimensional array, arraytest[j][i].
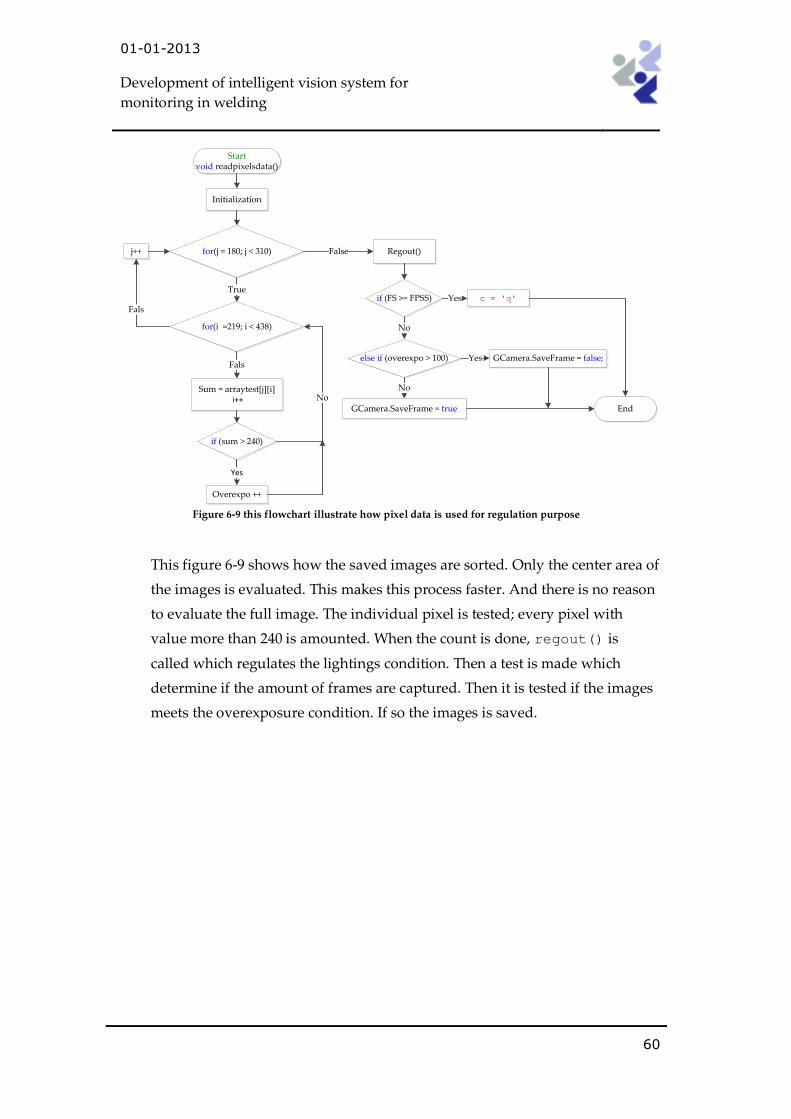
01-01-2013
Development of intelligent vision system for
monitoring in welding
60
Startvoid readpixelsdata()
Initialization
for(j = 180; j < 310)
for(i =219; i < 438)
True
Sum = arraytest[j][i] i++
j++
Fals
Fals
if (sum > 240)
Overexpo ++
Yes
No
Regout()False
if (FS >= FPSS) c = 'q'Yes
else if (overexpo > 100)
No
GCamera.SaveFrame = false;Yes
GCamera.SaveFrame = true
No
End
Figure 6-9 this flowchart illustrate how pixel data is used for regulation purpose
This figure 6-9 shows how the saved images are sorted. Only the center area of
the images is evaluated. This makes this process faster. And there is no reason
to evaluate the full image. The individual pixel is tested; every pixel with
value more than 240 is amounted. When the count is done, regout() is
called which regulates the lightings condition. Then a test is made which
determine if the amount of frames are captured. Then it is tested if the images
meets the overexposure condition. If so the images is saved.
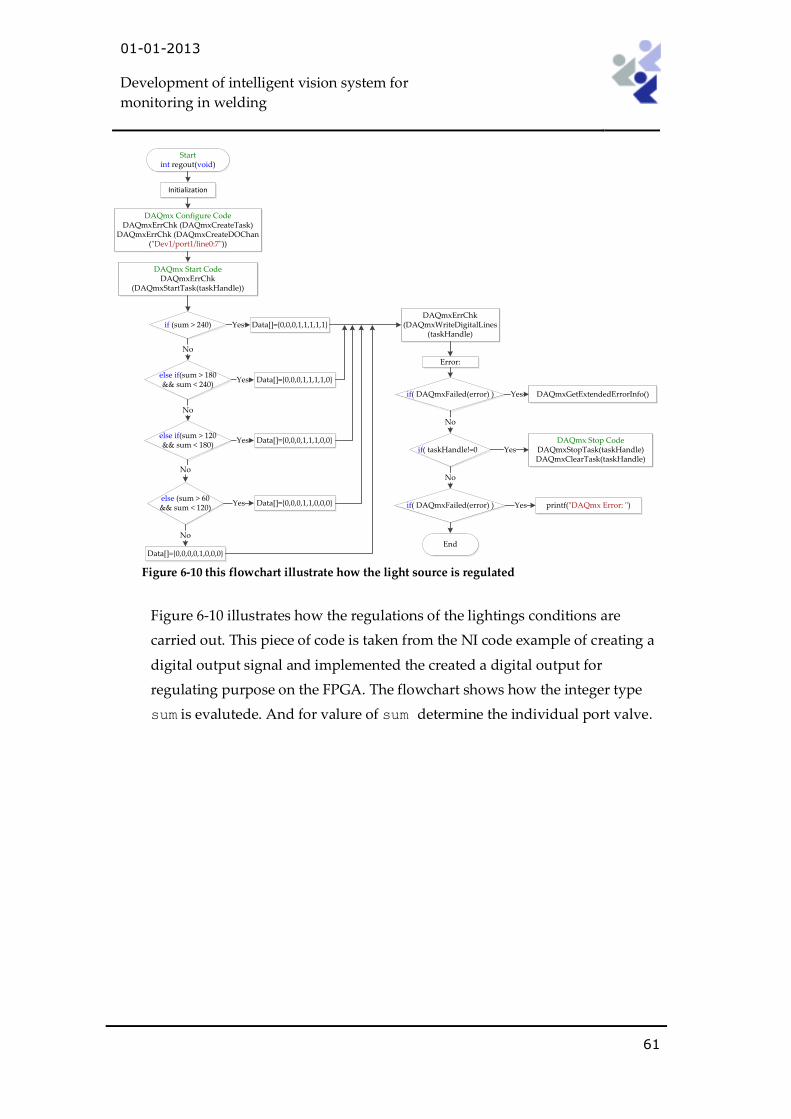
01-01-2013
Development of intelligent vision system for
monitoring in welding
61
Startint regout(void)
Initialization
if (sum > 240) Data[]={0,0,0,1,1,1,1,1}Yes
else if(sum > 180 && sum < 240)
No
Data[]={0,0,0,1,1,1,1,0}Yes
else if(sum > 120 && sum < 180)
Data[]={0,0,0,1,1,1,0,0}
No
Yes
Data[]={0,0,0,0,1,0,0,0}
else (sum > 60 && sum < 120)
No
Data[]={0,0,0,1,1,0,0,0}Yes
DAQmx Configure CodeDAQmxErrChk (DAQmxCreateTask)
DAQmxErrChk (DAQmxCreateDOChan("Dev1/port1/line0:7"))
DAQmx Start CodeDAQmxErrChk
(DAQmxStartTask(taskHandle))
DAQmxErrChk (DAQmxWriteDigitalLines
(taskHandle)
if( DAQmxFailed(error) )
Error:
Yes
if( taskHandle!=0
No
Yes
if( DAQmxFailed(error) )
No
printf("DAQmx Error: ")Yes
End
DAQmxGetExtendedErrorInfo()
DAQmx Stop CodeDAQmxStopTask(taskHandle)DAQmxClearTask(taskHandle)
No
Figure 6-10 this flowchart illustrate how the light source is regulated
Figure 6-10 illustrates how the regulations of the lightings conditions are
carried out. This piece of code is taken from the NI code example of creating a
digital output signal and implemented the created a digital output for
regulating purpose on the FPGA. The flowchart shows how the integer type
sum is evalutede. And for valure of sum determine the individual port valve.
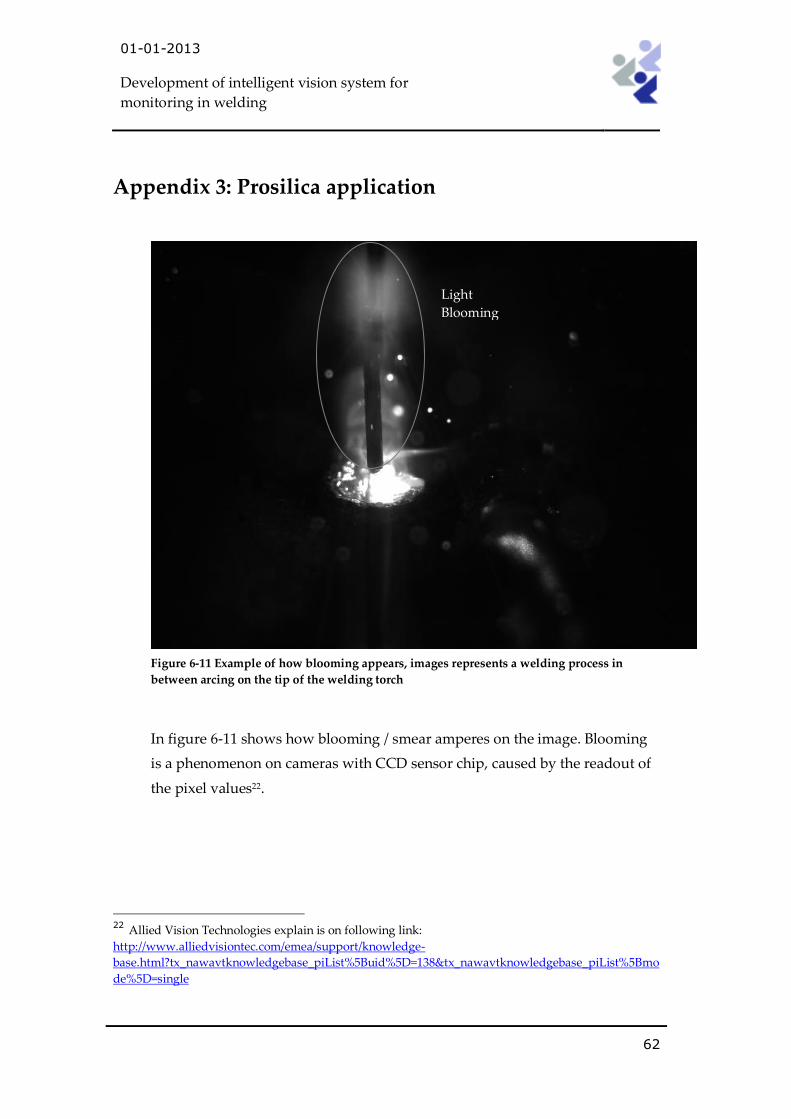
01-01-2013
Development of intelligent vision system for
monitoring in welding
62
Appendix 3: Prosilica application
Figure 6-11 Example of how blooming appears, images represents a welding process in
between arcing on the tip of the welding torch
In figure 6-11 shows how blooming / smear amperes on the image. Blooming
is a phenomenon on cameras with CCD sensor chip, caused by the readout of
the pixel values22.
22 Allied Vision Technologies explain is on following link:
http://www.alliedvisiontec.com/emea/support/knowledge-
base.html?tx_nawavtknowledgebase_piList%5Buid%5D=138&tx_nawavtknowledgebase_piList%5Bmo
de%5D=single
Light
Blooming
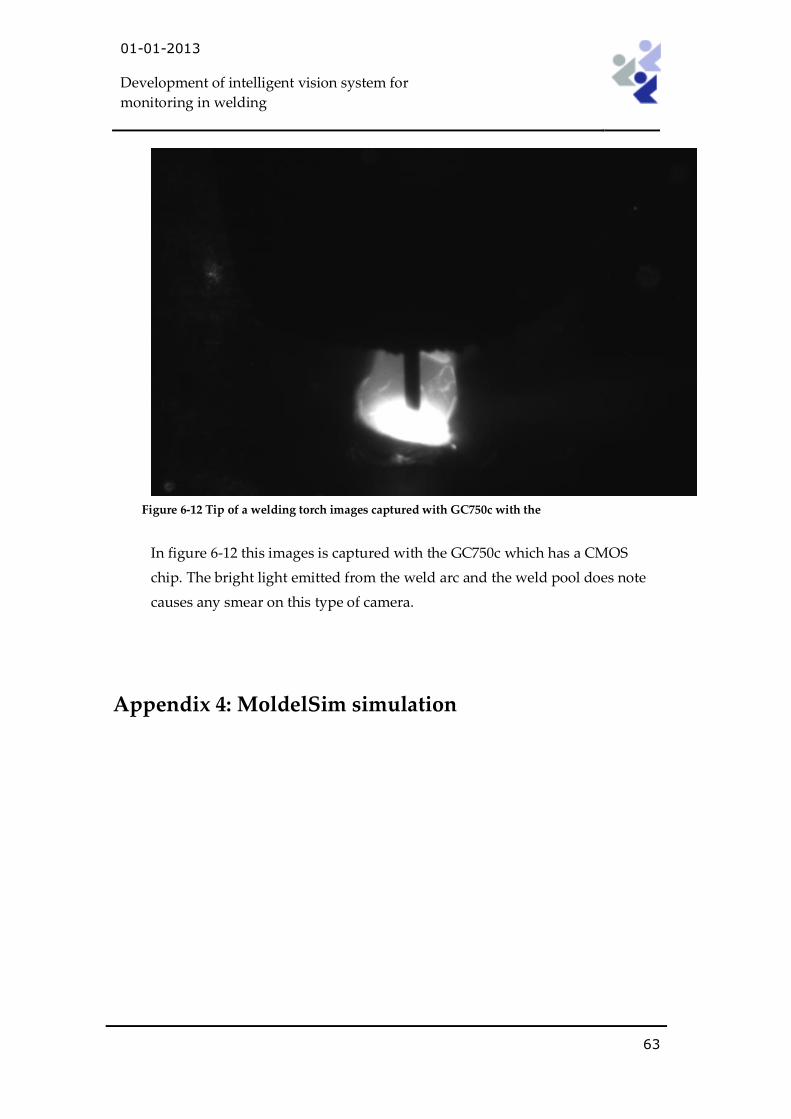
01-01-2013
Development of intelligent vision system for
monitoring in welding
63
Figure 6-12 Tip of a welding torch images captured with GC750c with the
In figure 6-12 this images is captured with the GC750c which has a CMOS
chip. The bright light emitted from the weld arc and the weld pool does note
causes any smear on this type of camera.
Appendix 4: MoldelSim simulation
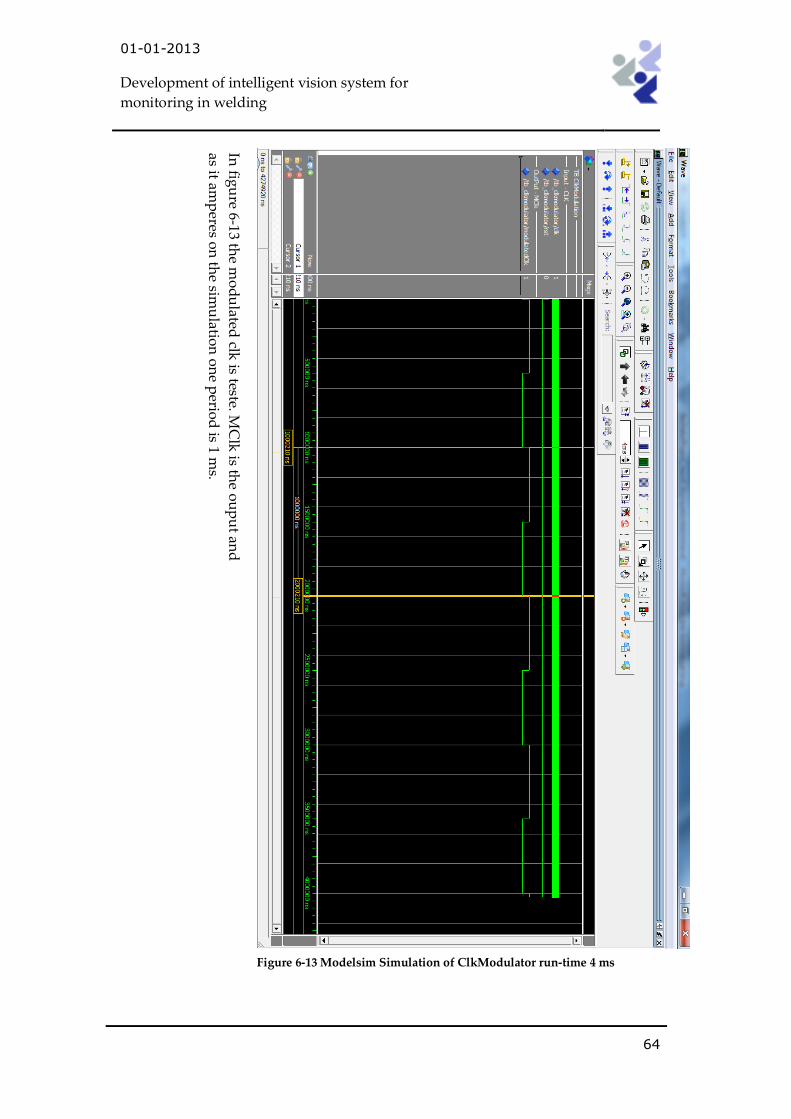
01-01-2013
Development of intelligent vision system for
monitoring in welding
64
Figure 6-13 Modelsim Simulation of ClkModulator run-time 4 ms
In fig
ure 6-13 th
e mo
du
lated clk
is teste. MC
lk is th
e ou
pu
t and
as it amp
eres on
the sim
ulatio
n o
ne p
eriod
is 1 ms.
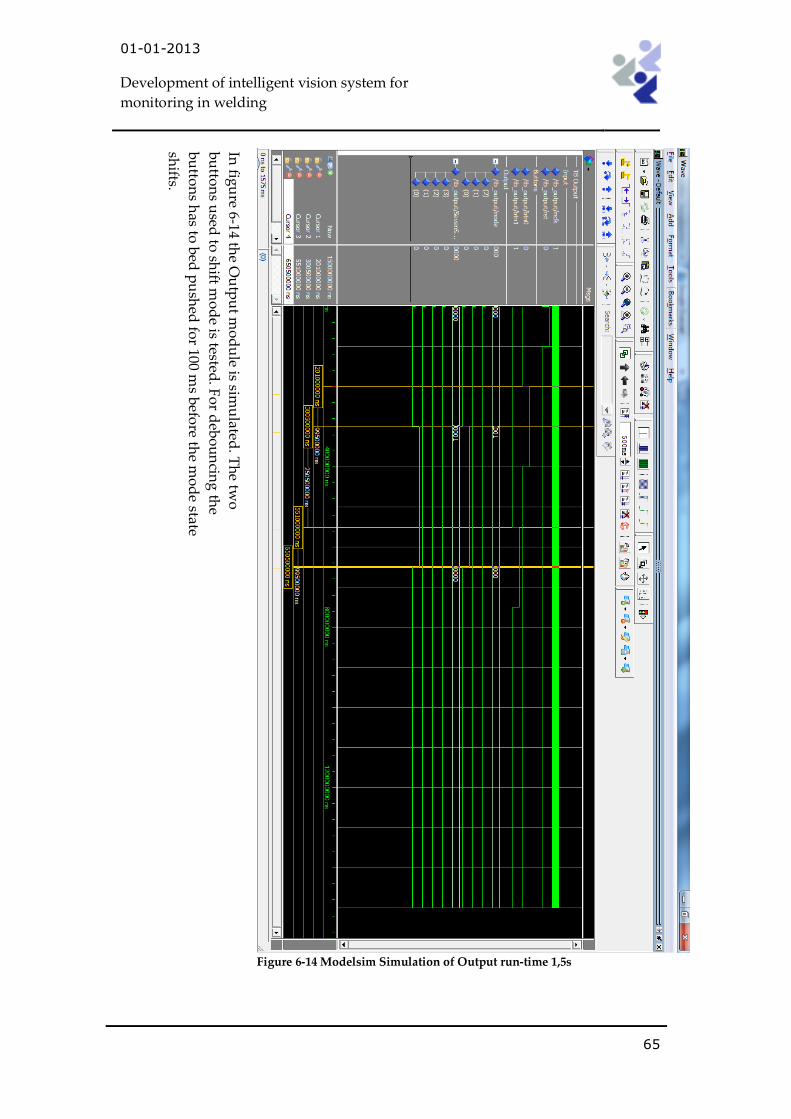
01-01-2013
Development of intelligent vision system for
monitoring in welding
65
Figure 6-14 Modelsim Simulation of Output run-time 1,5s
In fig
ure 6-14 th
e Ou
tpu
t mo
du
le is simu
lated. T
he tw
o
bu
tton
s used
to sh
ift mo
de is tested
. Fo
r deb
ou
ncin
g th
e
bu
tton
s has to
bed
pu
shed
for 100 m
s befo
re the m
od
e state
shifts.
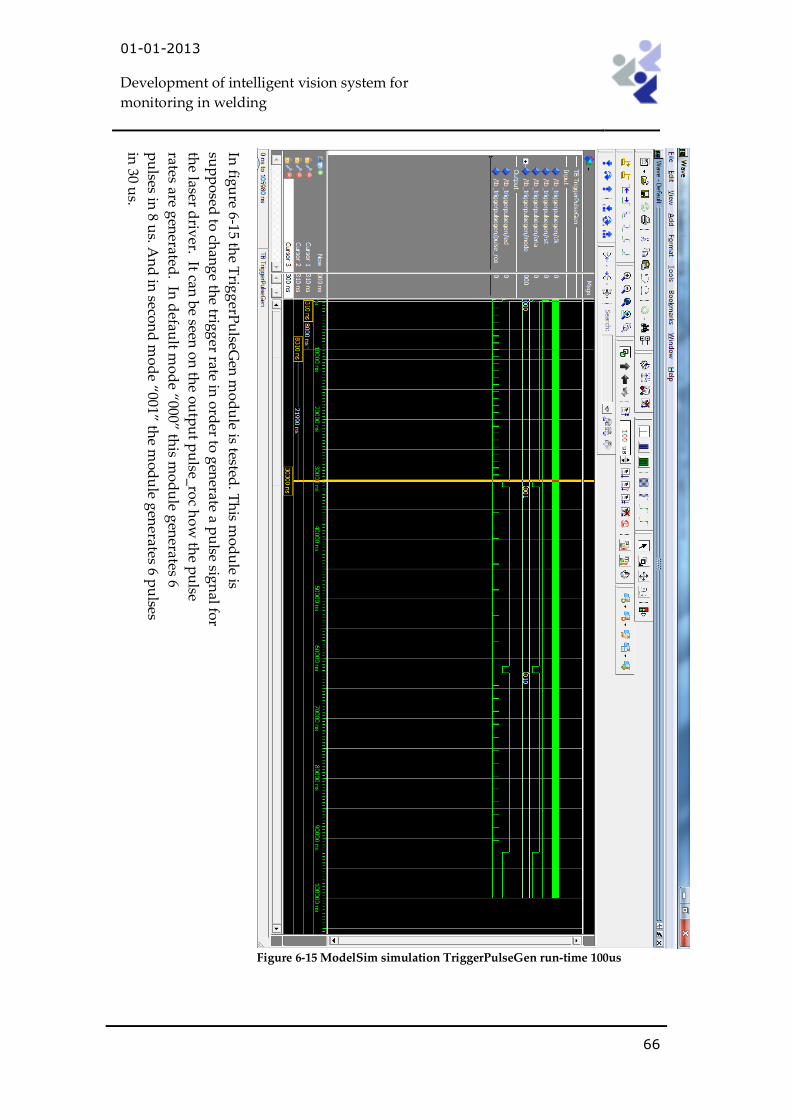
01-01-2013
Development of intelligent vision system for
monitoring in welding
66
Figure 6-15 ModelSim simulation TriggerPulseGen run-time 100us
In fig
ure 6-15 th
e Trig
gerP
ulseG
en m
od
ule is tested
. Th
is mo
du
le is
sup
po
sed to
chan
ge th
e trigg
er rate in o
rder to
gen
erate a pu
lse sign
al for
the laser d
river. It can
be seen
on
the o
utp
ut p
ulse_ro
c ho
w th
e pu
lse
rates are gen
erated. In
defau
lt mo
de “
000” this m
od
ule g
enerates 6
pu
lses in 8 u
s. An
d in
secon
d m
od
e “001” the m
od
ule g
enerates 6 p
ulses
in 30 u
s.
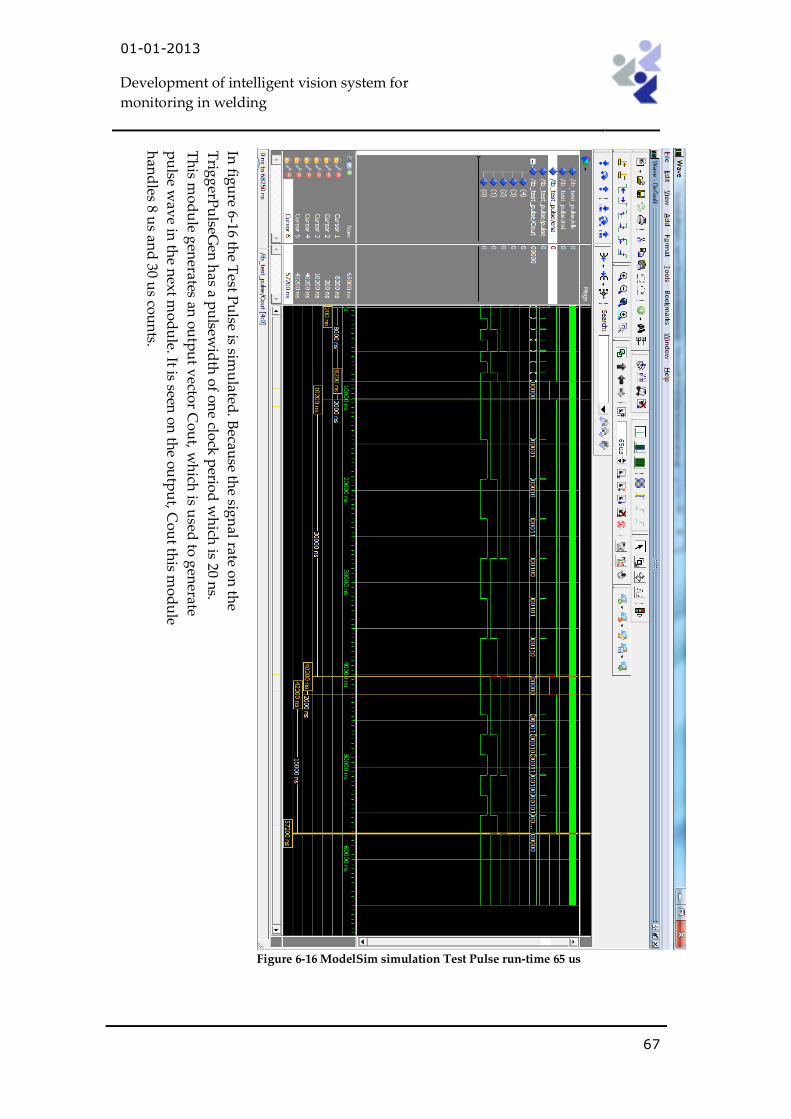
01-01-2013
Development of intelligent vision system for
monitoring in welding
67
Figure 6-16 ModelSim simulation Test Pulse run-time 65 us
In fig
ure 6-16 th
e Test P
ulse is sim
ulated
. Becau
se the sig
nal rate o
n th
e
Trig
gerP
ulseG
en h
as a pu
lsewid
th o
f on
e clock
perio
d w
hich
is 20 ns.
Th
is mo
du
le gen
erates an o
utp
ut v
ector C
ou
t, wh
ich is u
sed to
gen
erate
pu
lse wav
e in th
e next m
od
ule. It is seen
on
the o
utp
ut, C
ou
t this m
od
ule
han
dles 8 u
s and
30 us co
un
ts.
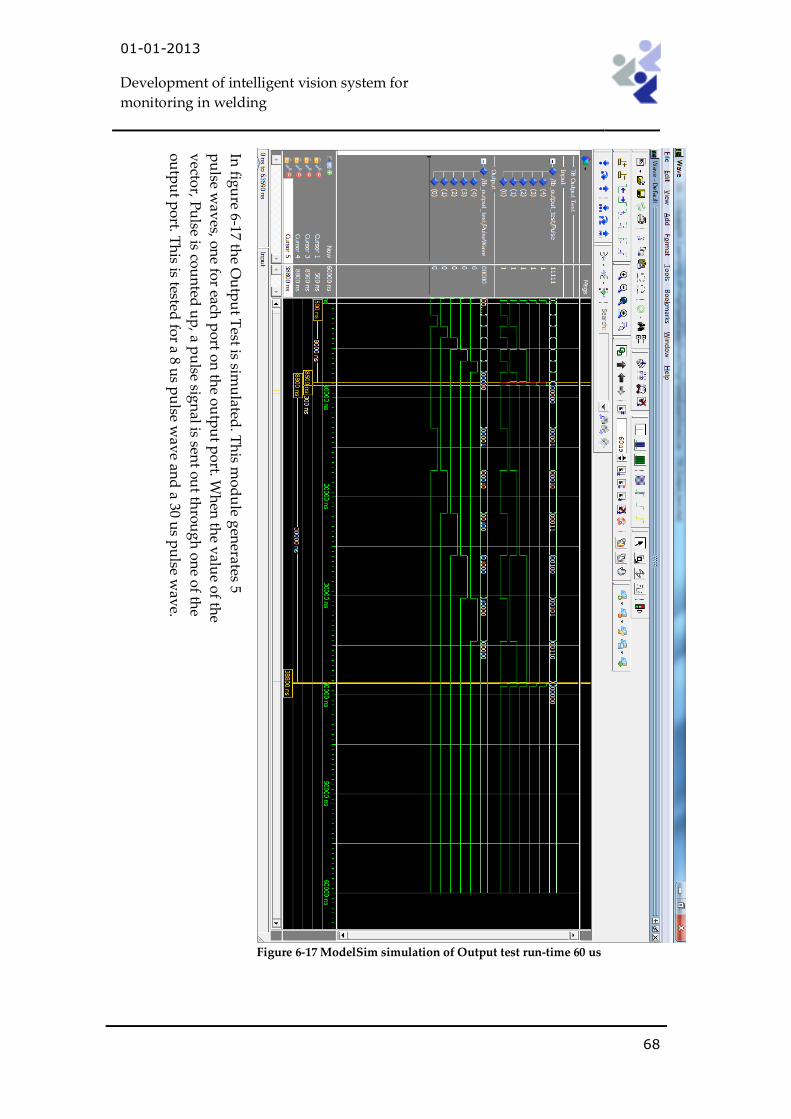
01-01-2013
Development of intelligent vision system for
monitoring in welding
68
Figure 6-17 ModelSim simulation of Output test run-time 60 us
In fig
ure 6-17 th
e Ou
tpu
t Test is sim
ulated
. Th
is mo
du
le gen
erates 5
pu
lse wav
es, on
e for each
po
rt on
the o
utp
ut p
ort. W
hen
the v
alue o
f the
vecto
r, Pu
lse is cou
nted
up
, a pu
lse sign
al is sent o
ut th
rou
gh
on
e of th
e
ou
tpu
t po
rt. Th
is is tested fo
r a 8 us p
ulse w
ave an
d a 30 u
s pu
lse wav
e.
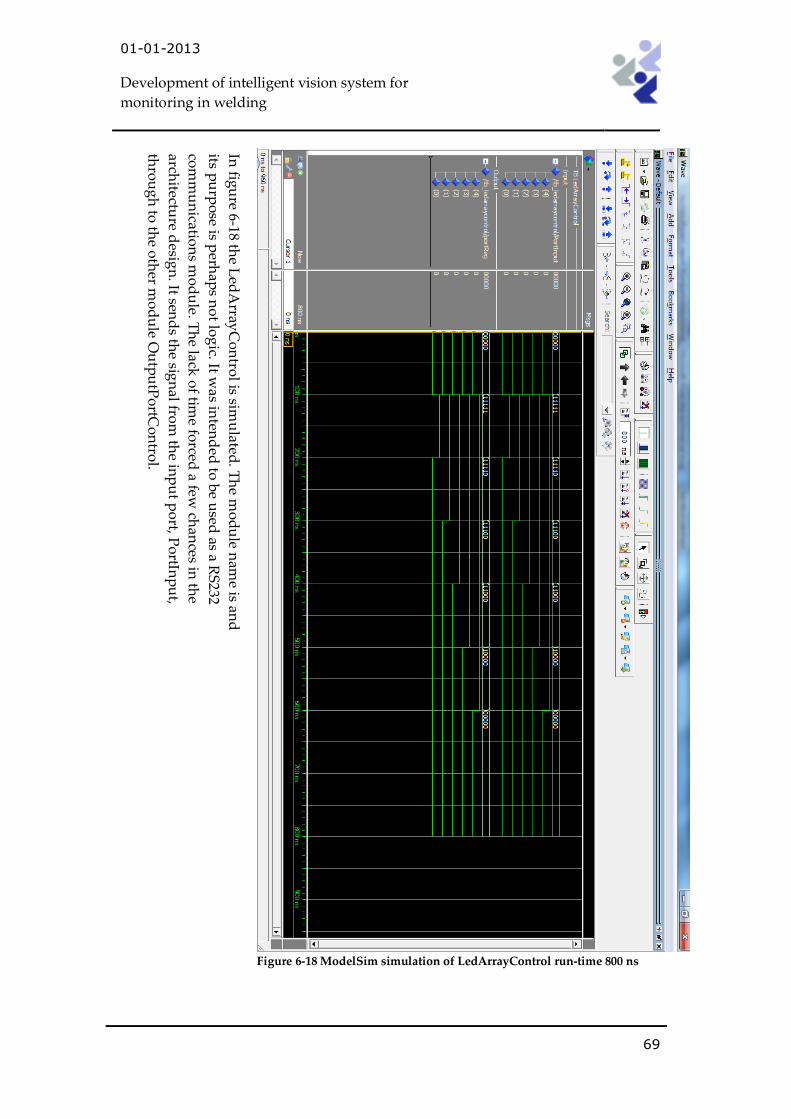
01-01-2013
Development of intelligent vision system for
monitoring in welding
69
Figure 6-18 ModelSim simulation of LedArrayControl run-time 800 ns
In fig
ure 6-18 th
e Led
Array
Co
ntro
l is simu
lated. T
he m
od
ule n
ame is an
d
its pu
rpo
se is perh
aps n
ot lo
gic. It w
as inten
ded
to b
e used
as a RS
232
com
mu
nicatio
ns m
od
ule. T
he lack
of tim
e forced
a few ch
ances in
the
architectu
re desig
n. It sen
ds th
e sign
al from
the in
pu
t po
rt, Po
rtInp
ut,
thro
ug
h to
the o
ther m
od
ule O
utp
utP
ortC
on
trol.
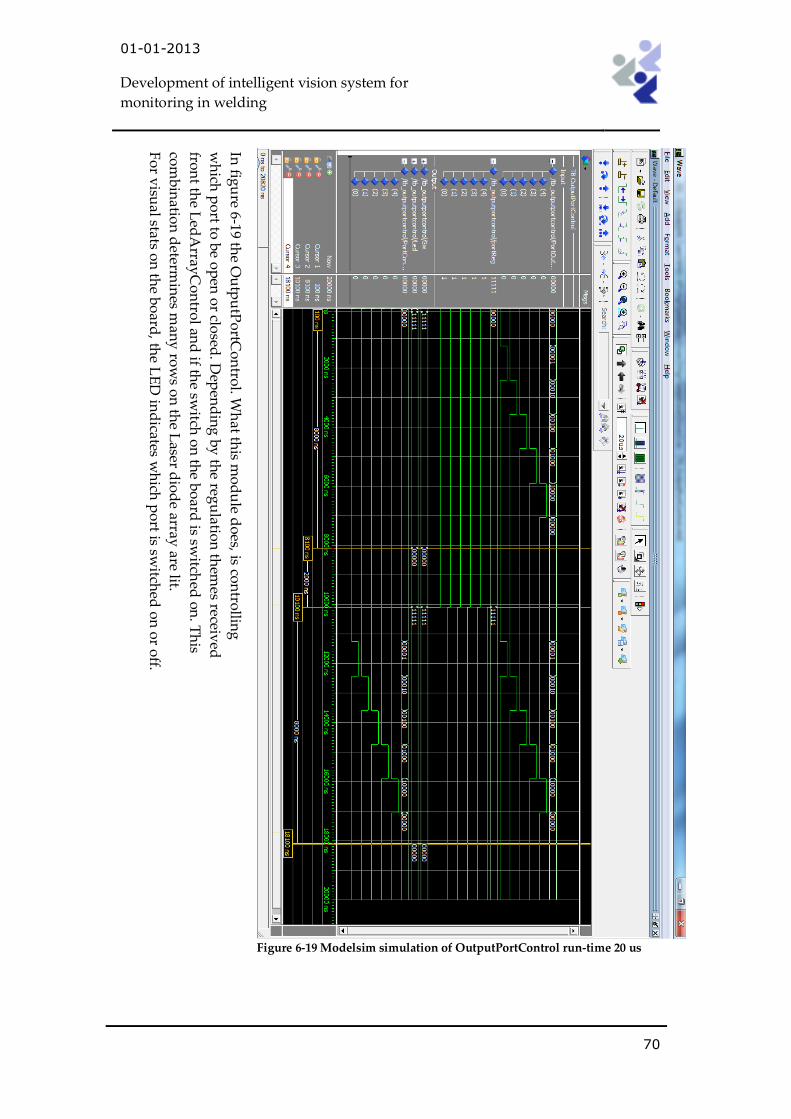
01-01-2013
Development of intelligent vision system for
monitoring in welding
70
Figure 6-19 Modelsim simulation of OutputPortControl run-time 20 us
In fig
ure 6-19 th
e Ou
tpu
tPo
rtCo
ntro
l. Wh
at this m
od
ule d
oes, is co
ntro
lling
wh
ich p
ort to
be o
pen
or clo
sed. D
epen
din
g b
y th
e regu
lation
them
es received
fron
t the L
edA
rrayC
on
trol an
d if th
e switch
on
the b
oard
is switch
ed o
n. T
his
com
bin
ation
determ
ines m
any
row
s on
the L
aser dio
de array
are lit.
Fo
r visu
al stats on
the b
oard
, the L
ED
ind
icates wh
ich p
ort is sw
itched
on
or o
ff.
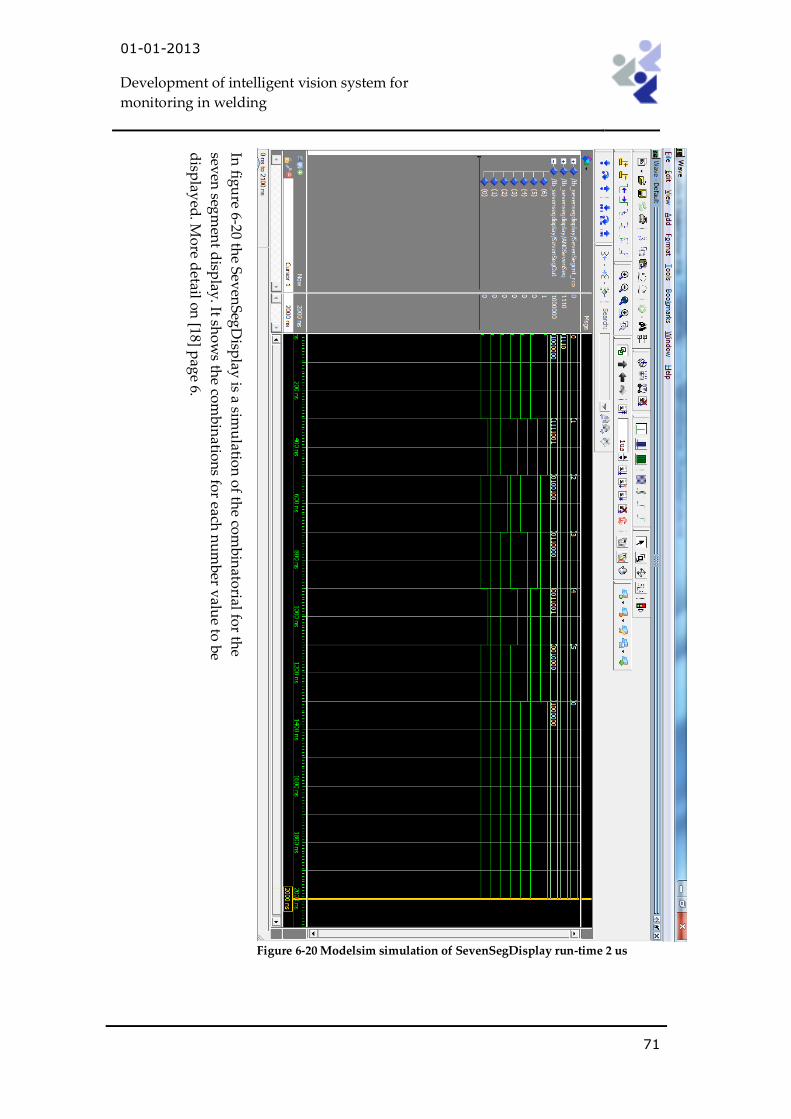
01-01-2013
Development of intelligent vision system for
monitoring in welding
71
Figure 6-20 Modelsim simulation of SevenSegDisplay run-time 2 us
In fig
ure 6-20 th
e Sev
enS
egD
isplay
is a simu
lation
of th
e com
bin
atorial fo
r the
seven
segm
ent d
isplay
. It sho
ws th
e com
bin
ation
s for each
nu
mb
er valu
e to b
e
disp
layed
. Mo
re detail o
n [18] p
age 6.
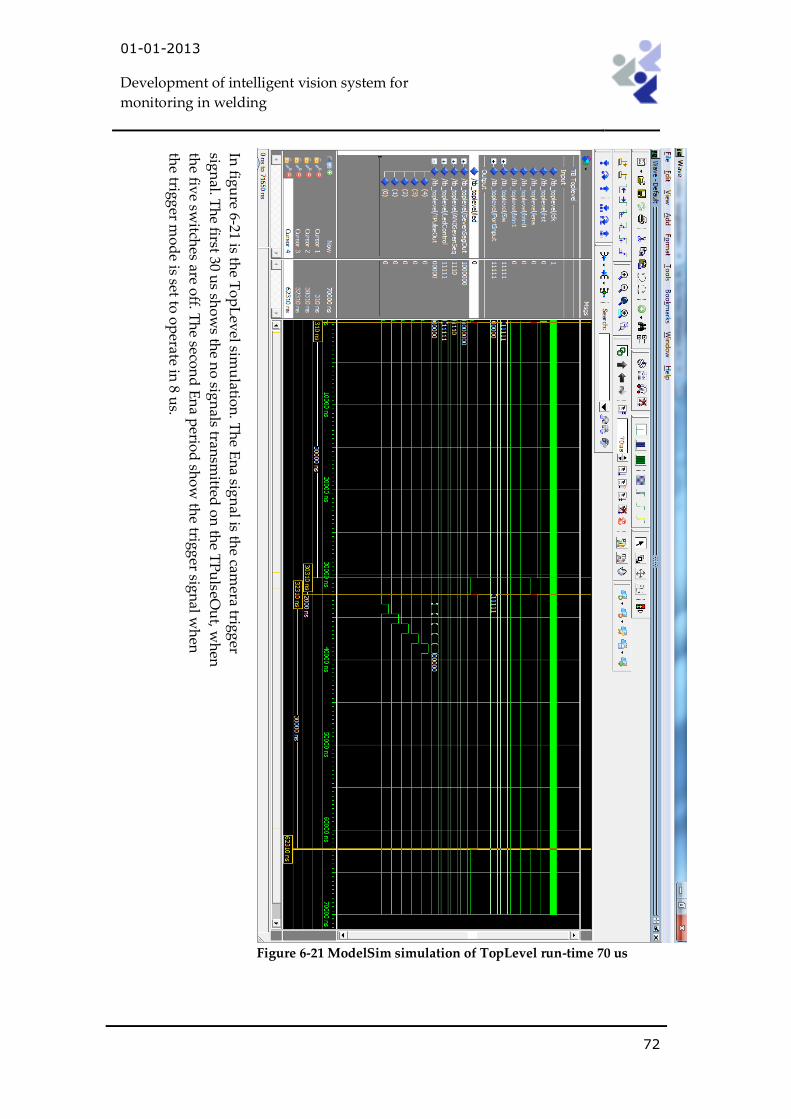
01-01-2013
Development of intelligent vision system for
monitoring in welding
72
Figure 6-21 ModelSim simulation of TopLevel run-time 70 us
In fig
ure 6-21 is th
e To
pL
evel sim
ulatio
n. T
he E
na sig
nal is th
e camera trig
ger
sign
al. Th
e first 30 us sh
ow
s the n
o sig
nals tran
smitted
on
the T
Pu
lseOu
t, wh
en
the fiv
e switch
es are off. T
he seco
nd
En
a perio
d sh
ow
the trig
ger sig
nal w
hen
the trig
ger m
od
e is set to o
perate in
8 us.