Embed Size (px)
Citation preview
Universiti Malaysia Terengganu Journal of Undergraduate ResearchVolume 2 Number 4, Oktober 2020: 41-50
eISSN: 2637-1138© Penerbit UMT
Universiti Malaysia Terengganu Journal of Undergraduate ResearchVolume 2 Number 4, Oktober 2020: 41-50
IntroductionBatteries create electrical power by converting energy from chemical reactions into electrical energy (Bin et al., 2018). During their normal use, an appropriate operating voltage range is required. When the batteries are discharging, the reaction slows down and the same current may be available but the rate of the reaction decreases, causing a voltage drop (Clark & Giles 2016). Conversely, during the charging process, the chemical reaction increases, thus causing a voltage to increase and it also
DEVELOPMENT OF BATTERY MONITORING SYSTEM USING ARDUINO UNO MICROCONTROLLER
NURUL FITRIYAH ROSLAN AND WAN MARIAM WAN MUDA*
Faculty of Ocean Engineering Technology and Informatics, Universiti Malaysia Terengganu, 21030 Kuala Terengganu, Malaysia
*Corresponding author: [email protected]
Abstract: Battery Monitoring System (BMoS) is an electronic system that monitors rechargeable battery cells or packs with various parameters, such as battery voltage, current and State-of-Charge (SoC). This system can be used to avoid overcharging or over-discharging of batteries to increase its shelf life. However, BMoS on the market is very expensive and not suitable for low cost embedded systems. As the Arduino Uno is widely used for low cost microcontroller boards, easy programming environment, and open-source platforms for building electronic projects, therefore, this study focuses on Arduino Uno BMoS based system. This system consists of current and voltage sensors, an Arduino Uno microcontroller and a liquid crystal display (LCD). In order to develop this system, there are three objectives to be achieved. First, the relationship between input and output of the sensors must be derived mathematically. The mathematical expression obtained can be verified by connecting and disconnecting the circuit with load and monitoring the value of output sensors. Then, a complete prototype of the BMoS was developed by connecting the LCD, current and voltage sensors to the Arduino Uno microcontroller. The complete prototype was tested using an 11.1 V of Lithium-ion battery and a DC motor as a load. From the results, the current sensor shows zero value when no load is connected as no current flow. The LCD also displays 11.1V of battery voltage when fully charged. Using the developed system, the user can monitor the current, the voltage and the SoC of the battery to ensure the battery is not overcharged and overused. The development of the BMoS can help to monitor the operation and performance of the batteries in any electronic systems. At the end of this study, the complete BMoS prototype gives benefits to the user and makes work easier.
Keywords: Battery monitoring system, Arduino Uno, State-of-Charge (SoC), lithium-ion battery
depends on the electrical characteristics of the batteries and the chargers (Klinser et al., 2018). If the operation voltage is out of the range, they would be overcharged or over-discharged (Liu et al., 2020).
BMoS is a very important device in the electronic systems to monitor the status of a battery. It is used to measure voltage, current, and temperature of the battery to be processed to estimate the SoC and state of health (SOH) of the battery. It is important to ensure that the battery has a longer lifespan by avoiding overcharging

Nurul Fitriyah Roslan and Wan Mariam Wan Muda 42
Universiti Malaysia Terengganu Journal of Undergraduate ResearchVolume 2 Number 4, Oktober 2020: 41-50
or over-discharging, thus providing a better performance of electronic systems (Friansa et al., 2016). According to Ali et al. (2018) and Darvizeh et al. (2018), the important parameters need to be measured to develop the monitoring system are current and voltage of the battery. It means, for a simple BMoS, the temperature parameter can be ignored.
Generally, it is necessary to monitor SoC instead of simply monitoring the battery voltage as SoC describes how full the battery is (Křivík, 2018). When the battery is fully charged, the SoC of this battery is 100% and 0% when the battery is fully discharged. There is an important relationship between current and voltage of the battery and SoC. The integration of current can be used to determine the value of SoC (Křivík, 2018), and the value of SoC can be used to predict the battery voltage (Lee et al., 2018). For high-cost electronic devices, it comes with a battery management system to avoid overcharging and over discharging that can cause damage to the battery.
However, for low-cost electronic systems, such as the Arduino Uno-based system which is widely used in electronic projects for education, hobbyists, and as a prototype before developing the actual system, there is no point in equipping them with expensive BMoS. The problem arises when the battery used in the developed systems has a very short lifespan due to overcharging / over discharging. Without BMoS, there is no indicator to tell the
electronic project developers when to stop using the battery to run their project. So, there is a possibility that the battery is used 0% of SoC. When the battery is allowed to be at a low level of charge for too long, it can become damaged. By leaving the battery standing for a long time after discharging without recharging it will cause plate sulfation, a condition in which a large grained lead sulfate layer is formed on the surface of the battery. It may cause premature damage such as overheating or inability of the battery to retain a charge.
Hence, this research focuses on the development of Arduino Uno-based BMoS. It can be used for maintaining and monitoring stationary battery systems to maximize the performance of the developed system and reduce battery maintenance and replacement costs by providing the most reliable form of predictive maintenance.
Materials and MethodsThis project uses 50 A current sensor BB-ACS756 that uses Hall effect method to detect current flow from one side to another, and a 25 V DC voltage sensor. The sensors are used to measure the current and voltage of the Lithium-ion battery, respectively, and send values to the Arduino Uno for processing according to the instructions given then the calculated SoC is displayed on the LCD. The discharging process occurs when the battery supplies current to the DC motor, while the charging process occurs when the battery is connected to the charger. Figure 1 shows the block diagram of the BMoS.
Figure 1: The block diagram of BMoS

DEVELOPMENT OF BATTERY MONITORING SYSTEM USING ARDUINO UNO MICROCONTROLLER 43
Universiti Malaysia Terengganu Journal of Undergraduate ResearchVolume 2 Number 4, Oktober 2020: 41-50
The specifications of the battery and DC motor used in this project are shown in Table 1 and Table 2, respectively.
Table 1: Specification of battery
Type of battery Lithium-Polymer (LiPo)Voltage / cell
count11.1 V / 3 cells x 3.7 V
Capacity 5200 mAhDischarge rating 5C
Table 2: Specification of DC motor (load).
Type of DC motor 12V 75RPM 3kgfcm Brushed DC Geared Motor
Rated voltage 12VNo load current < 100 mARated current < 600 mA
The overall steps taken to develop the BMoS are illustrated in Figure 2 and the first step is when the current and voltage sensors are tested by doing some simple experiment to understand the relationship between input and output of the sensors. This step is very important to ensure the input values given to the Arduino Uno microcontroller are correct.
Figure 2: Flowchart of methodology

Nurul Fitriyah Roslan and Wan Mariam Wan Muda 44
Universiti Malaysia Terengganu Journal of Undergraduate ResearchVolume 2 Number 4, Oktober 2020: 41-50
To validate the output of the sensors, the results obtained from Step 1 are compared with the value measured by the multimeter, while for the current sensor, the output of the sensor is measured in two cases which are during the no operation case when the battery is not connected to the DC motor and during the discharging process when the battery is connected to the DC motor. Theoretically, for the first case, there is no current flow from the battery when it is not connected to the DC motor, whilst in the second case, certain amount of current flows from the battery to the DC motor. The output voltage from the current sensor is recorded.
Once the properties of the sensors are understood, all the components are assembled. Figure 3 shows the circuit diagram of the system. I2C LCD is used to reduce the number of wires connecting between LCD and Arduino Uno. The output of current and voltage sensors are connected to A0 (gray color) and A2 (orange color), respectively. Although Li-Po Battery 5200 mAh is used in the project, the 2000 mAh battery is used for illustration purposes only as it exists in the Fritzing library file. The battery connection is the same as the one used in the project.
Figure 3: The circuit diagram of BMoS
Then, the source code of the Arduino Uno is developed. The programme code was written using C language in Arduino IDE software. The general flow of the coding can be seen in the flowchart shown in Figure 4. From the completed codes, the source code
is compiled and uploaded into the Arduino Uno microcontroller. Then, the system is tested by charging and discharging the battery and the value of SoC displayed on LCD is monitored.

DEVELOPMENT OF BATTERY MONITORING SYSTEM USING ARDUINO UNO MICROCONTROLLER 45
Universiti Malaysia Terengganu Journal of Undergraduate ResearchVolume 2 Number 4, Oktober 2020: 41-50
Results and DiscussionThe results are divided into two categories: The results were obtained from the voltage and current sensors before the hardware installation and the final hardware prototype test results.
A. Results obtained from Voltage and Current Sensor
Measuring the battery voltage using the voltage sensor can be done by connecting it in parallel to the battery. However, because the battery has a slow reaction time to
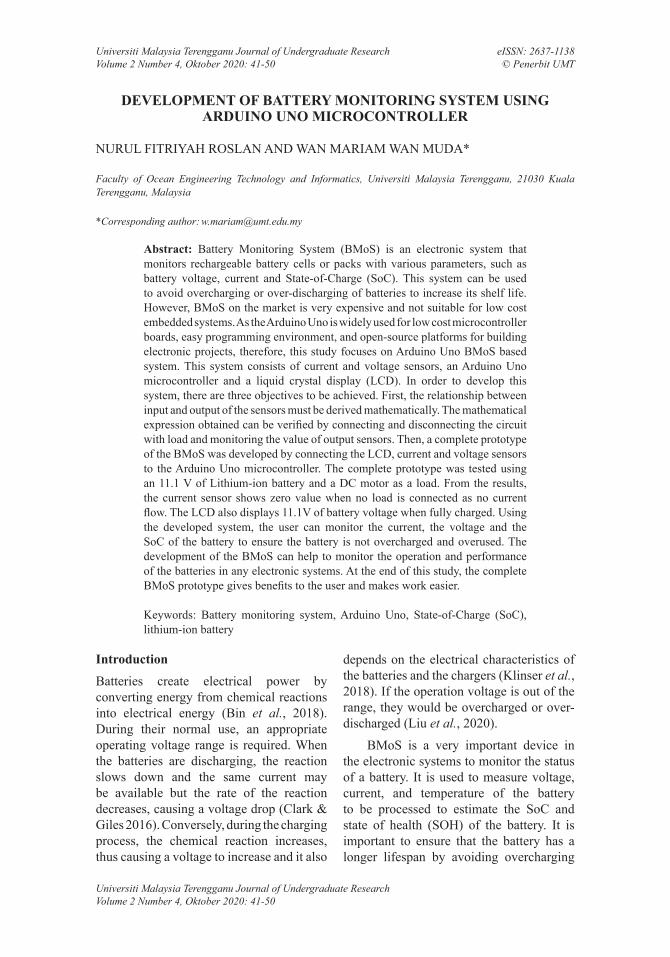
change the voltage, so, a variable power supply is connected to the voltage sensor for experimental purposes. The measured voltage is an analog form which it is then converted to digital form by 10-bit analog to digital converter (ADC) built-in the Arduino Uno when the voltage sensor is connected to analog port of Arduino Uno. The ADC output value can be obtained from the Arduino Uno that can be displayed on the computer screen. The relationship between the measured voltage and ADC output is plotted in Figure 5.
Figure 4: Flowchart of the programming
Nurul Fitriyah Roslan and Wan Mariam Wan Muda 46
Universiti Malaysia Terengganu Journal of Undergraduate ResearchVolume 2 Number 4, Oktober 2020: 41-50
From the figure, it can be observed that when the measured voltage is 0V, ADC output value from the Arduino Uno produced 0 and for the maximum voltage which can be detected by 25V DC voltage sensor, the output of ADC is also at maximum which is at 210 - 1 = 1023, where 10 is the number for bit. So from the graph, for any 10-bit ADC output detected by the Arduino Uno, the measured voltage can be calculated from the following equation: Measured voltage (V) = 0.0244 x 10 bit ADC Output (1)
where 0.0244 is the slope of the linear line.
Theoretically, the relationship between input and output of ADC can be obtained from the following equation (2):
= (2)
where n is the number of bit and Vfullscale
of ADC which is 5V. Vin of ADC is equal to the sensor output voltage as the voltage sensor is connected to the input port of ADC via analog port of Arduino Uno. Although the voltage sensor can measure voltage up to 25V, the maximum output voltage sensor is actually only 5V. This is due to the voltage
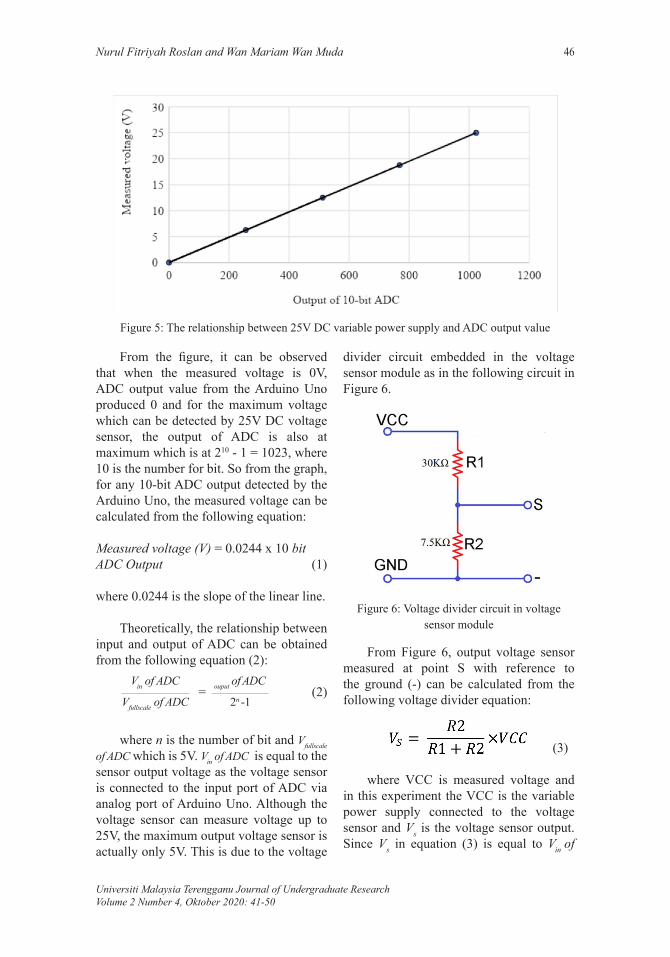
divider circuit embedded in the voltage sensor module as in the following circuit in Figure 6.
Figure 6: Voltage divider circuit in voltage sensor module
From Figure 6, output voltage sensor measured at point S with reference to the ground (-) can be calculated from the following voltage divider equation:
(3)
where VCC is measured voltage and in this experiment the VCC is the variable power supply connected to the voltage sensor and Vs is the voltage sensor output. Since Vs in equation (3) is equal to Vin of
Figure 5: The relationship between 25V DC variable power supply and ADC output value
Vin of ADC
Vfullscale of ADCouput of ADC
2n -1

DEVELOPMENT OF BATTERY MONITORING SYSTEM USING ARDUINO UNO MICROCONTROLLER 47
Universiti Malaysia Terengganu Journal of Undergraduate ResearchVolume 2 Number 4, Oktober 2020: 41-50
ADC in equation (2), thus, equation (2) can be rewritten to:
where VCC is measured voltage and the last equation is equal to equation (1).
To validate the measured battery voltage obtained from voltage sensor output, it is compared with the measured voltage from the multimeter. The results show that there are similarities between the two measurement methods as shown in Figure 7. From the figure, LCD shows 11.1 V which is the same value as measured using multimeter for fully charged battery.
Figure 7: The battery voltage measured by voltage sensor is displayed on LCD.
For the current sensor, it is tested in two conditions. The conditions are that the sensor circuit is connected to the 11.1 V Lithium-ion battery with and without the presence of load. The load used is a DC motor.
For the first case, when there is no current flow from the battery as there is no load connected, the output voltage of the current sensor is 2.5 V which is equivalent to 512 decimal output of 10-bit ADC. The
maximum output of the current sensor is 5V which is equivalent to 1023 decimal output of ADC. The relationship between the output voltage of the current sensor and 10-bit ADC output can be seen as in Figure 8. From the plot, the equation related between 10-bit ADC output and the current sensor voltage (VCS) can be written as: (5)
where is the slope of the line. From the datasheet of the current sensor, the output sensitivity is 40mV/A. If VCS versus current of the current sensor (ICS) is plotted, the intercept of voltage axis happens at ICS = 0, VCS= 2.5V and the slope is 40mV/A., the equation can be written mathematically as,
(6)
Rearrange equation (6),
(7)
Figure 8: The relationship between output of current sensor and ADC output value
So, any ADC value detected by Arduino Uno can be converted to voltage value VCS using equation (5), then from equation (7) the current value measured by current sensor can be calculated.
For the second case, the current sensor is used to measure current of the battery when it is connected to the DC motor (load), the current flow from the battery to the DC motor is measured at different times. The graph voltage and current of the current

Nurul Fitriyah Roslan and Wan Mariam Wan Muda 48
Universiti Malaysia Terengganu Journal of Undergraduate ResearchVolume 2 Number 4, Oktober 2020: 41-50
sensor is plotted as in Figure 9. From the figure, the equation obtained from the graph is the same as in equation (6).
Figure 9: The graph of voltage versus current for current sensor with a load.
B. Results of Final Hardware Prototype Testing
All equations derived above are were used in the programming code of the proposed system to interpret the value received by the Arduino Uno in decimal number from 10-bit ADC to the actual value measured by voltage and current sensor. Then the value of battery current was used to calculate SoC of the battery using the following equation,
(8)
and the rated capacity can be obtained from Table 1, Ibattery and Iloss are the current of the battery before and after a certain period of time.
The BMoS was developed by connecting all the components to the Arduino Uno microcontroller as shown in Figure 10. The developed prototype of BMoS was tested using 11.1 V Lithium-ion Battery and DC motor was used as a load to ensure the discharging process is occurred. By letting the DC motor run for a long time, the battery was discharging. During the process, the values of SoC and battery voltage displayed on LCD were recorded. Figure 10 shows the voltage and SoC of discharged battery. From the figure, it is shown that the voltage terminal battery is 11.1 V when SoC was 100%. As the SoC
decreased, the voltage also decreased until 3.9V at SoC 0%.
Figure 10: The prototype of battery monitoring system.
Comparing the results obtained with similar curve from literature (Lee et al., 2018), the trend of voltage drop during discharging is correct, however, the actual discharging curve of the battery has a constant region and it is not clearly shown in the figure. This is due to the fact that the number of data used to plot the graph is small. If the time sampling used in the experiment increases, thus increasing the amount of data, the constant region can be displayed.
Figure 11: Voltage versus SoC of discharged battery
ConclusionIn this paper, a study on the development and implementation of the BMoS based on Arduino Uno microcontroller has been presented. The circuit has been developed with voltage and current sensors, and LCD for monitoring. It can be used successfully to monitor the battery SoC to ensure it is not overused or overcharged.

DEVELOPMENT OF BATTERY MONITORING SYSTEM USING ARDUINO UNO MICROCONTROLLER 49
Universiti Malaysia Terengganu Journal of Undergraduate ResearchVolume 2 Number 4, Oktober 2020: 41-50
AcknowledgementsThe authors would like to acknowledge Universiti Malaysia Terengganu Malaysia for the support given for this research to be carried out.
ReferencesAli, E., Helal, A., Desouki, H., Shebl,
K., Abdelkader, S., & Malik, O. P. (2018). Power transformer differential protection using current and voltage ratios. Electric Power Systems Research, 154, 140–150.
Bin, D., Wen, Y., Wang, Y., & Xia, Y. (2018). The development in aqueous lithium-ion batteries. Journal of Energy Chemistry .27(6), 1521-1535.
Clark, R. B., & Giles, W. R. (2016). Current–Voltage Relationship for Late Na+ Current in Adult Rat Ventricular Myocytes. Current Topics in Membranes, 451–478.
Darvizeh, A., Alitavoli, M., & Namazi, N. (2018). An investigation into the parameters affecting the breakdown voltage and inter-particle bonding in the electrical discharge compaction of metal powders. Advanced Powder Technology, 29(10), 2346–2355.
Friansa, K., Haq, I. N., Santi, B. M., Kurniadi, D., Leksono, E., Yuliarto, B. (2017). Development of battery monitoring system in smart microgrid based on internet of things (IoT). Procedia Engineering, 170, 482 – 487.
Klinser, G., Stückler, M., Kren, H., Koller, S., Goessler, W., Krenn, H., & Würschum, R. (2018). Charging processes in the cathode LiNi 0.6 Mn 0.2 Co 0.2 O 2 as revealed by operando magnetometry. Journal of Power Sources, 396, 791–795.
Křivík, P. (2018). Methods of SoC determination of lead acid battery. Journal of Energy Storage, 15, 191–195.
Lee, C.-H., Chen, M.-Y., Hsu, S.-H., & Jiang, J.-A. (2018). Implementation of an SoC-based four-stage constant current charger for Li-ion batteries. Journal of Energy Storage, 18, 528–537.
Liu, J., Duan, Q., Feng, L., Ma, M., Sun, J., & Wang, Q. (2020). Capacity fading and thermal stability of LiNixCoyMnzO2 / graphite battery after overcharging. Journal of Energy Storage, 29, 1-9.