Embed Size (px)
Citation preview
\
DEVELOPMENT OF DRAG COEFFICIENTS FOR
OCTAGONAL LUMINARY POLES
by
DAVID C. RITCHIE, B.S.
A THESIS
IN
CIVIL ENGINEERING
Submitted to the Graduate Faculty of Texas Tech University in
Partial Fulfillment of the Requirements for
the Degree of
MASTER OF SCIENCE
IN
CIVIL ENGINEERING
Approved
August, 1990
T3 ACKNOWLEDGMENTS
(f\7^ 2 The author wishes to thank Dr. K.C. Mehta and Dr.
J.W. Gler for their support throughout the conduct of this
project. They encouraged the author to proceed when
things did not work out as planned. The contribution of
Dr. W.K. Wray as a committee member is also greatly
appreciated. In addition, the author is grateful to the
State Department of Highways and Public Transportation
without whose support and patience, this project could not
have succeeded. But most of all, the author is deeply
indebted to his parents and his wonderful wife and family
for making this additional education not only possible,
but more enjoyable than ever could have been imagined.
11
Xir 1- "..J^,
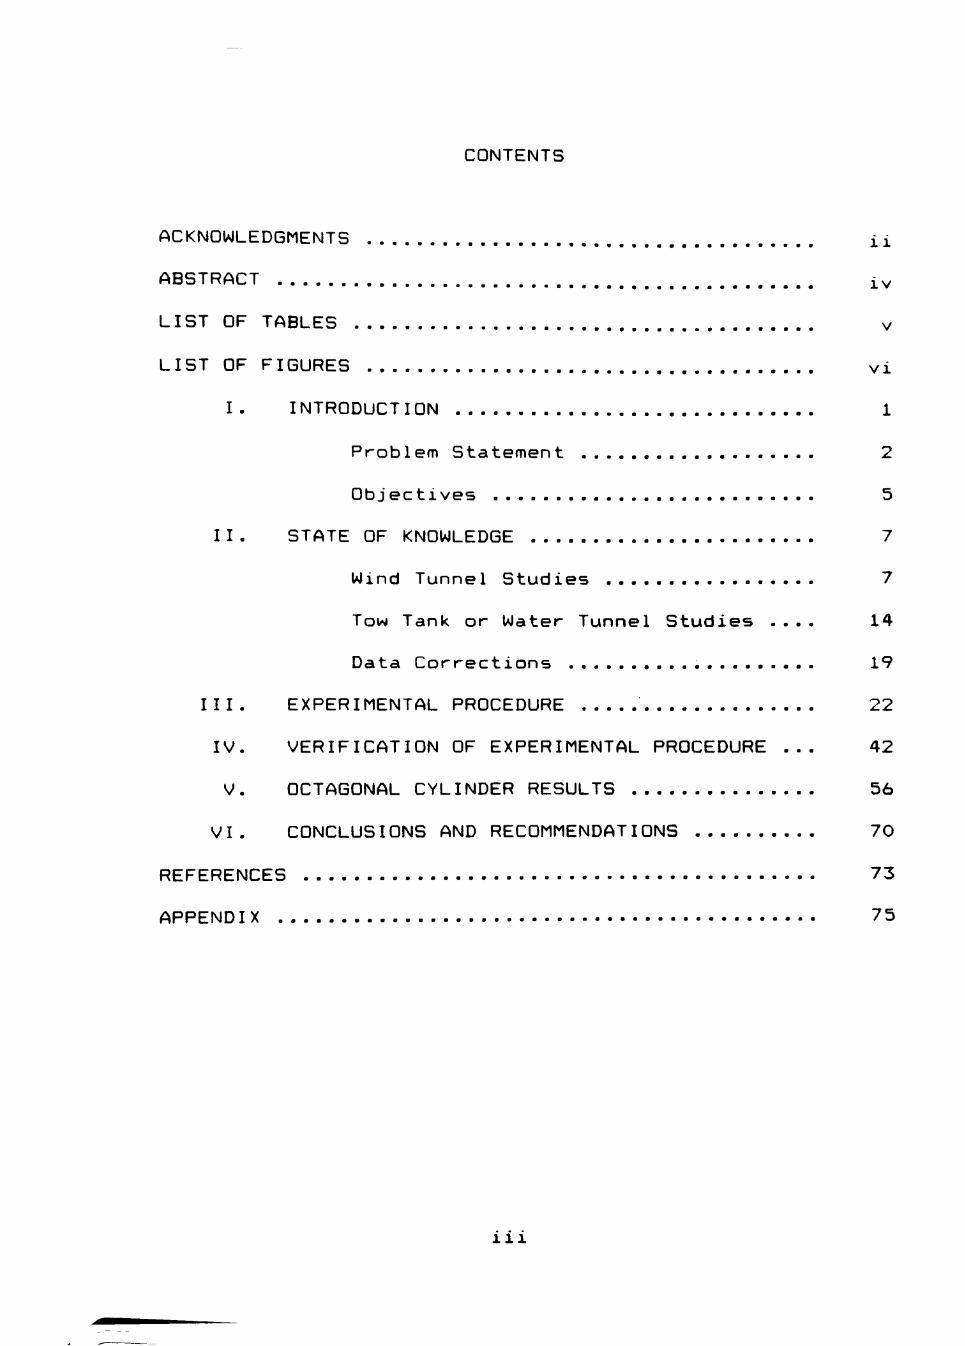
CONTENTS
ACKNOWLEDGMENTS i i
ABSTRACT iv
LIST OF TABLES v
LIST OF FIGURES vi
I. INTRODUCTION 1
Problem Statement 2
Objectives 5
I I . STATE OF KNOWLEDGE 7
Wind Tunnel Studies 7
Tow Tank or Water Tunnel Studies .... 14
Data Corrections 19
III. EXPERIMENTAL PROCEDURE 22
IV. VERIFICATION OF EXPERIMENTAL PROCEDURE ... 42
V. OCTAGONAL CYLINDER RESULTS 56
VI. CONCLUSIONS AND RECOMMENDATIONS 70
REFERENCES 73
APPENDIX 75
1 1 1
ABSTRACT
Highway signs, luminaires, and traffic signal
structures are exposed to wind loads throughout their
lives. The design of the cross-section quite often is
controlled by win^ loads. Improved definition of wind
loads would make luminaires not only more economical but
also more reliable.
The Texas Department of Highways and Public
Transportation sponsored a project at Texas Tech Univer
sity to determine accurate drag coefficients for octagonal
shaped luminaire supports. The research utilized the tow
tank of the Mechanical Engineering Department for the
experimental work. The tow tank experimental procedure
was verified by obtaining drag coefficients for circular
cylinders and comparing them with previously published
data. One innovation employed in this project was to use
actual industry manufactured luminaire pole shapes. These
specimens matched the geometric parameters of the ones
used in the field, thereby eliminating the test specimen's
surface condition as a possible variable.
Results of this project showed an average drag
coefficient for octagonal cylinders to be in a range of
1.3 to 1.4. This value is about 257. higher than the value
now used to design luminaire supports.
i V
1
LIST OF TABLES
Page
1.1. WIND DRAG COEFFICIENTS (Ce,)
(AASHTO 1975) 5
5.1. TEST SPECIMEN PARAMETERS 58
5.2. TEST RESULTS 65
LIST OF FIGURES
Page
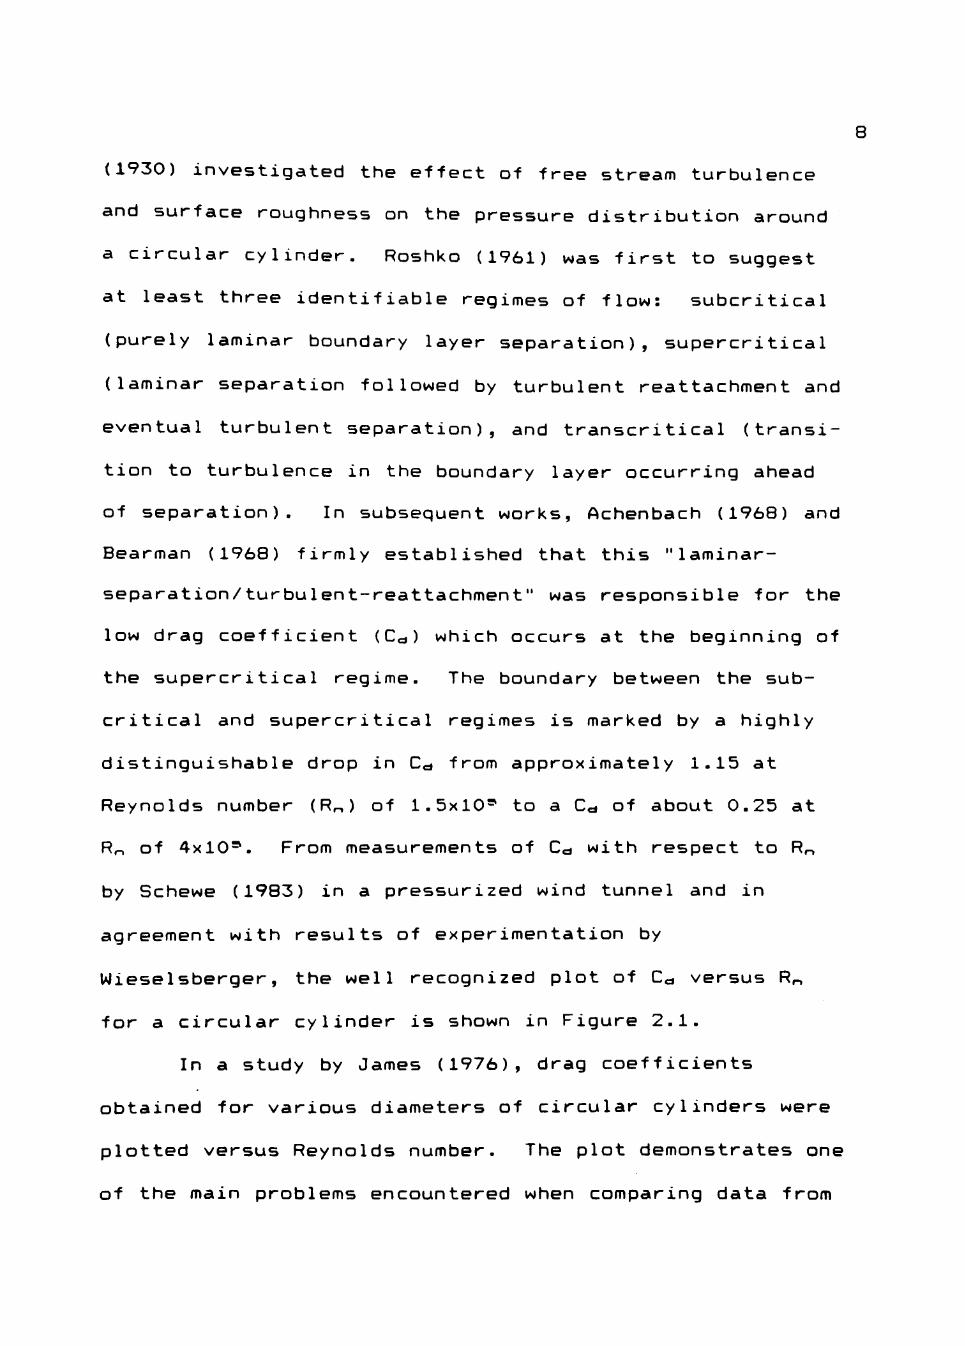
2.1. Drag Coefficient for Circular Cylinder in Wind Tunnel. (Schewe 1983) 9
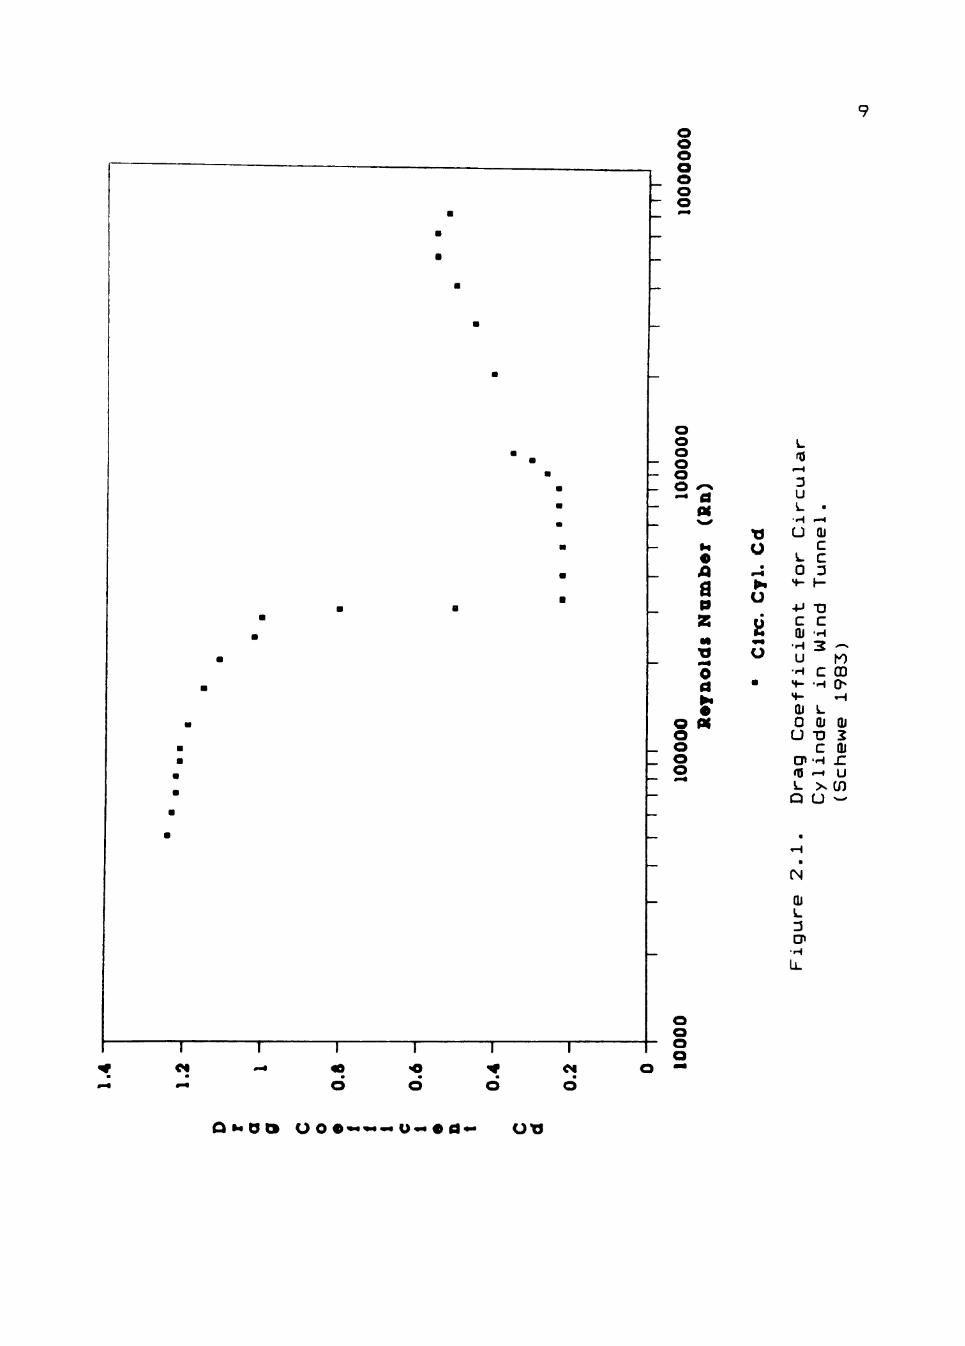
2.2. Circular Cylinder Drag Coefficients with Variable Surface Roughness to Cylinder Diameter Ratio. (James 1976) 11
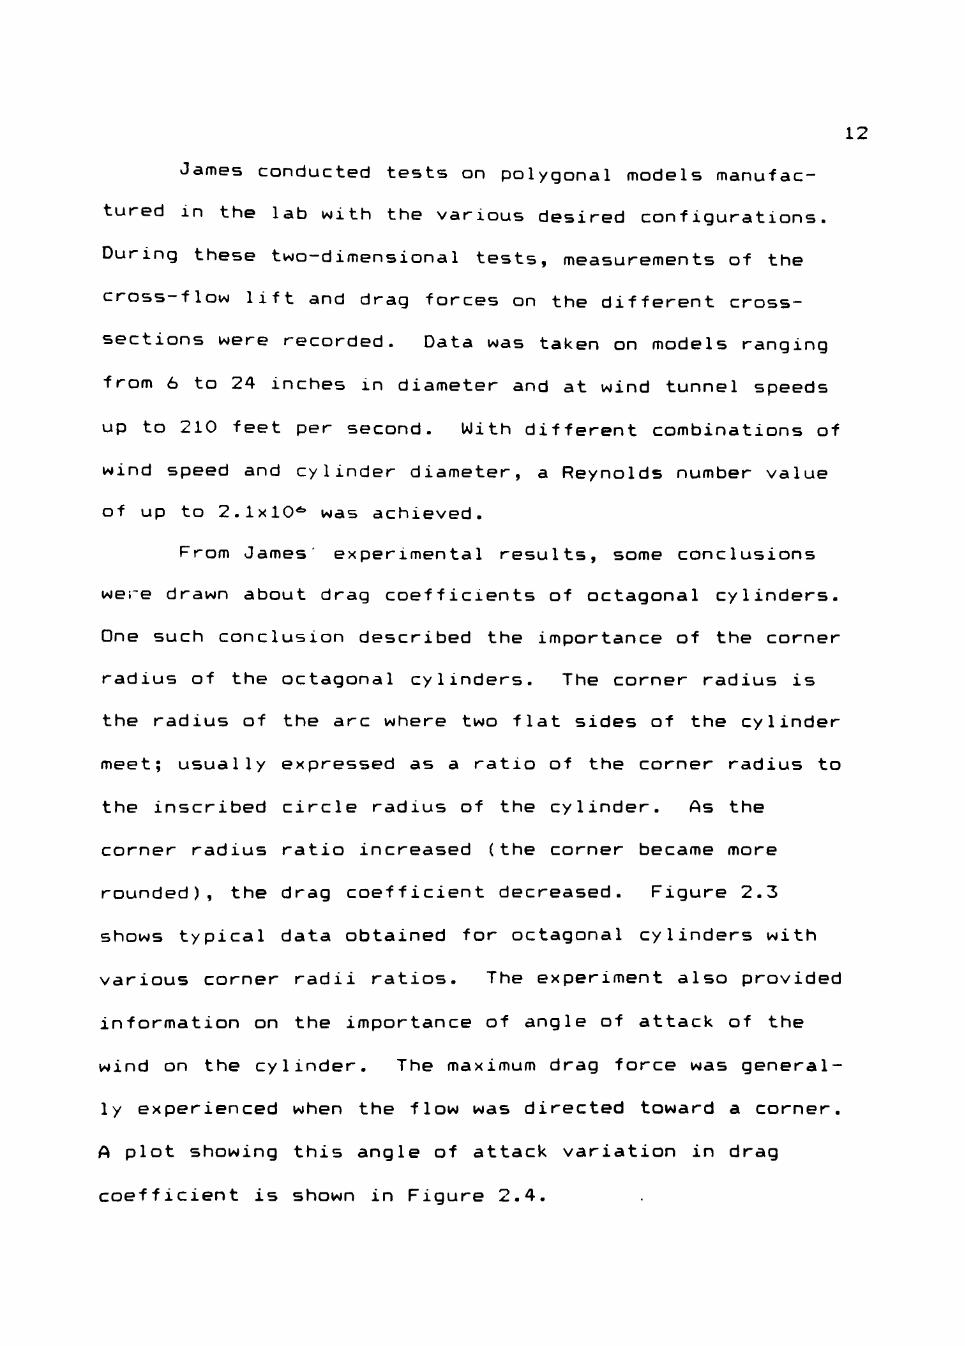
2.3. Octagonal Cylinder Drag Coefficients with Corner Normal to Flow Direction and Variable Corner Radius Ratios. (James 1976) 13
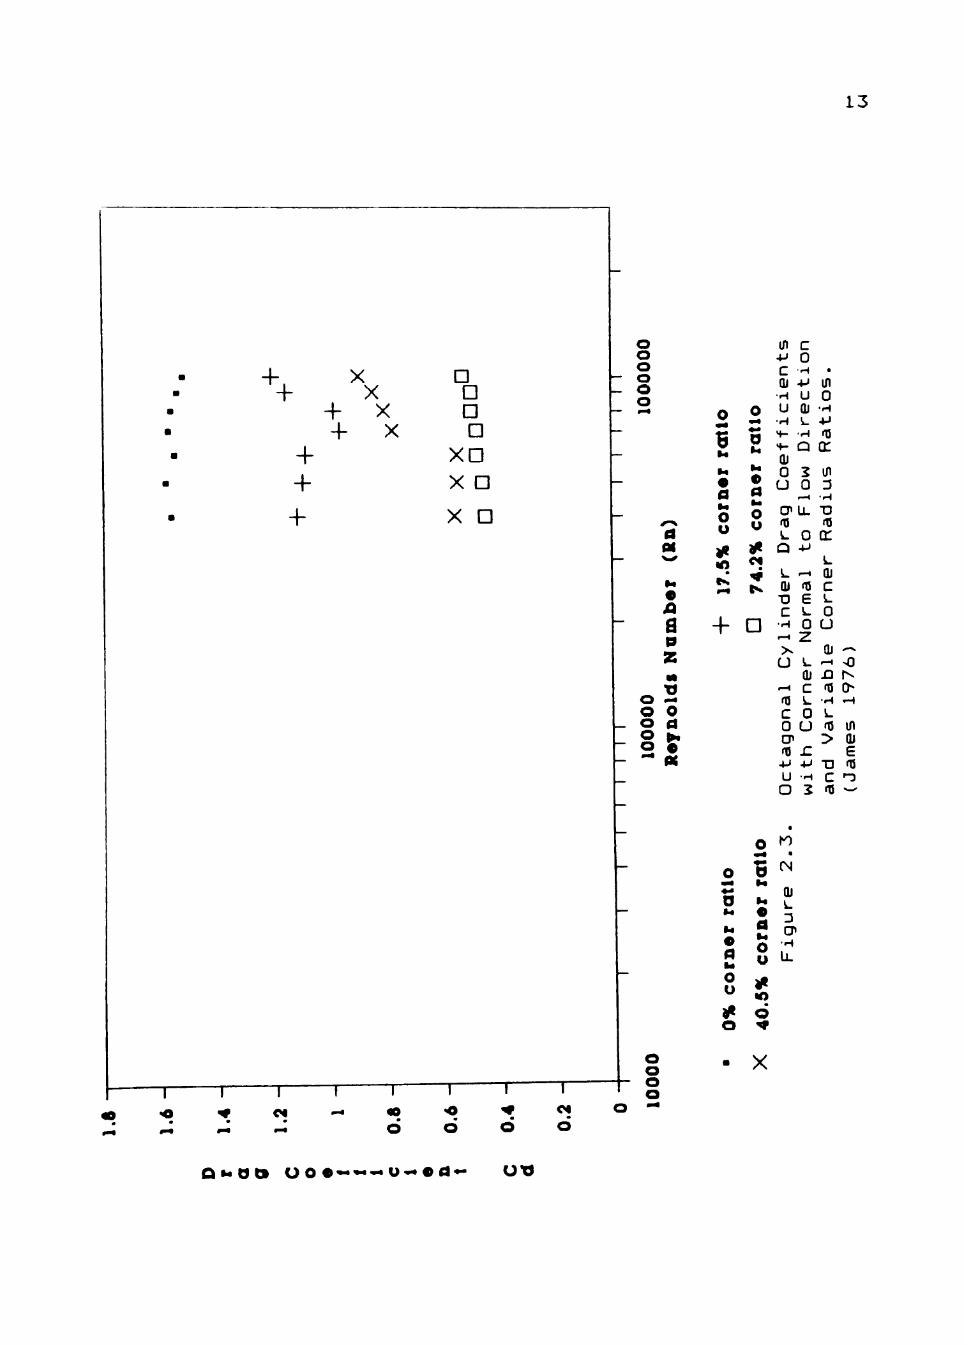
2.4. Octagonal Cylinder Drag Coefficients with Different Angles of Attack. (James 1976) 15
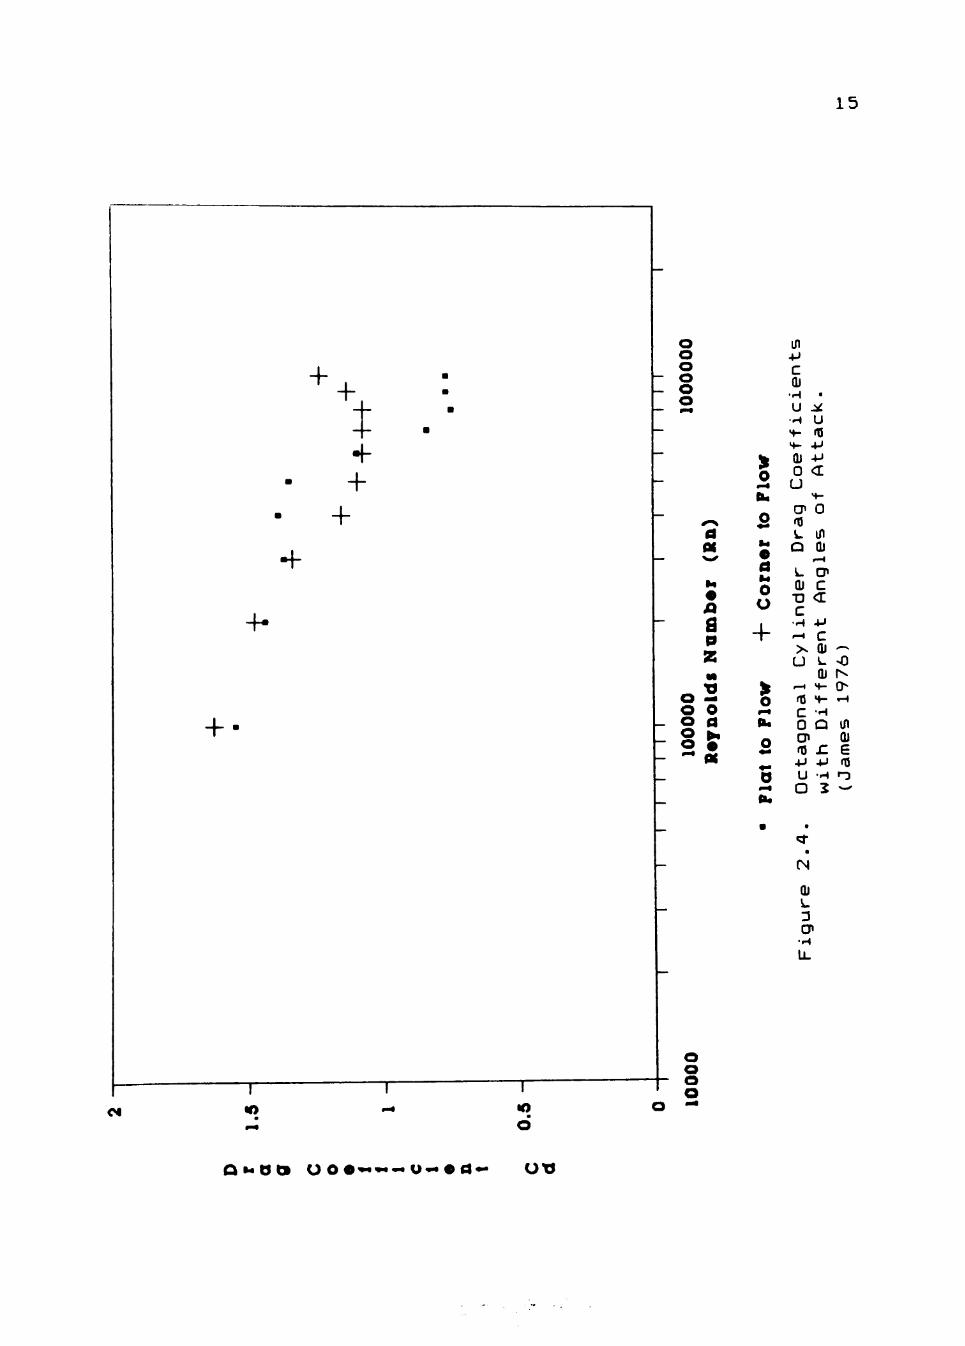
2.5. 8-sided, 12-sided, and 16-sided Polygonal Cylinder Drag Coefficients. (James 1976) 16
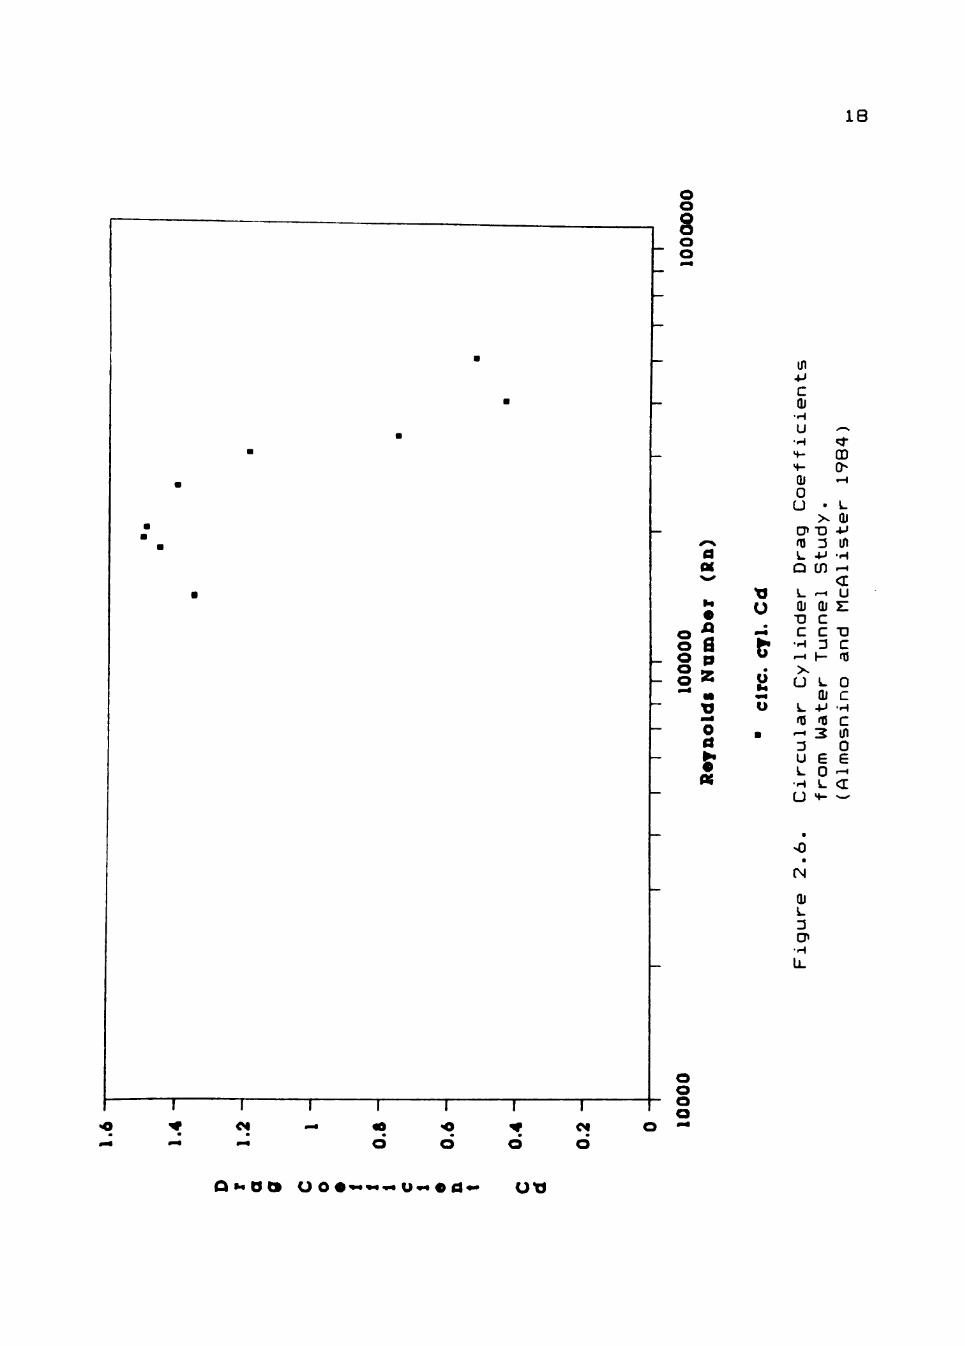
2.6. Circular Cylinder Drag Coefficients from Water Tunnel Study. (Almosnino and McAlister 1984) 18
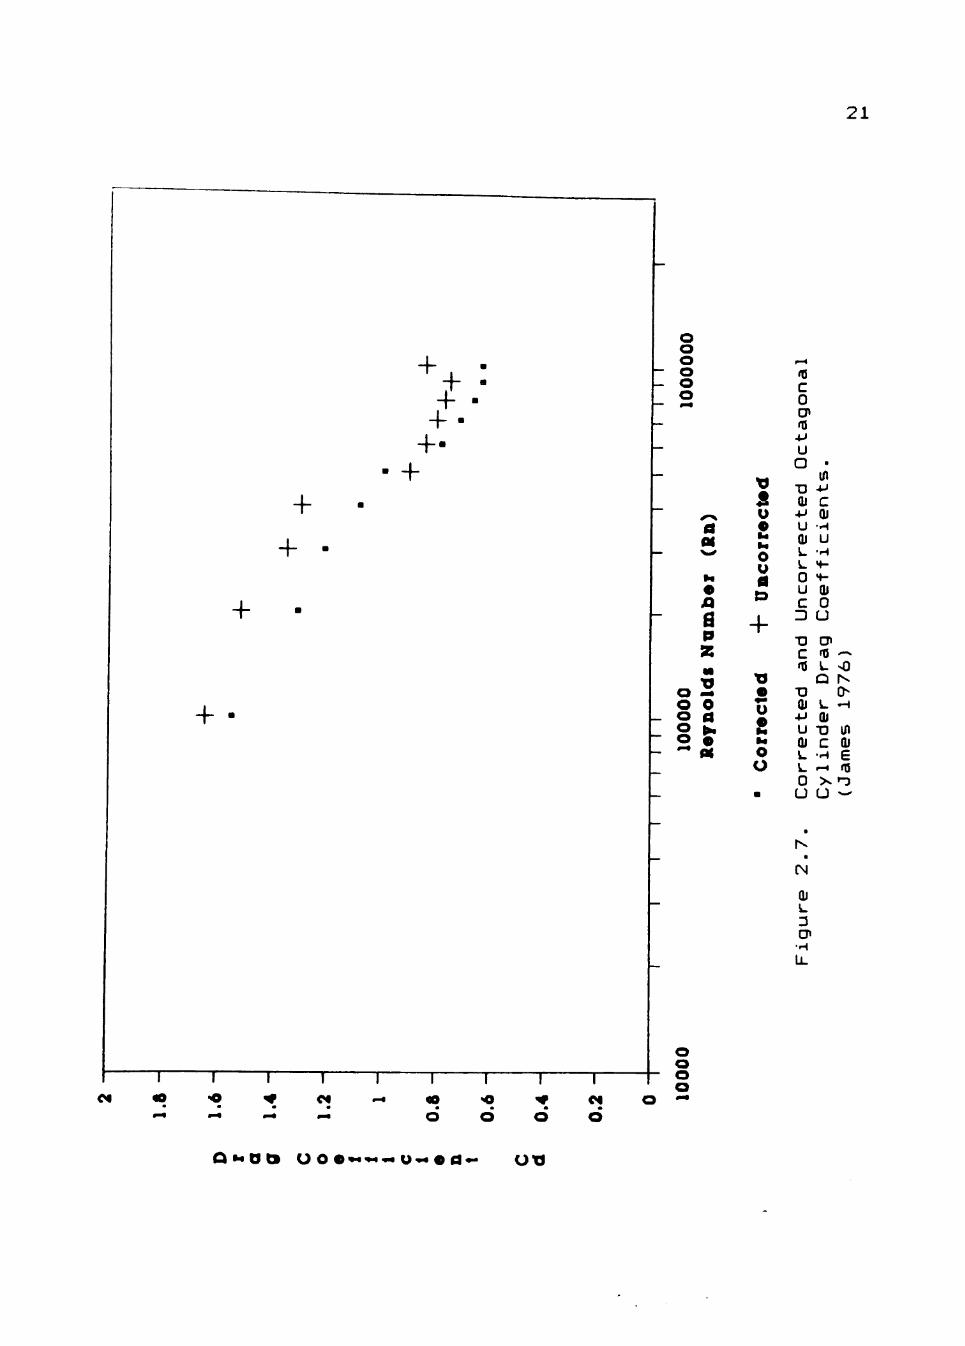
2.7. Corrected and Uncorrected Octagonal Cylinder Drag Coefficients. (James 1976) 21
3.1. Texas Tech University Tow Tank 23
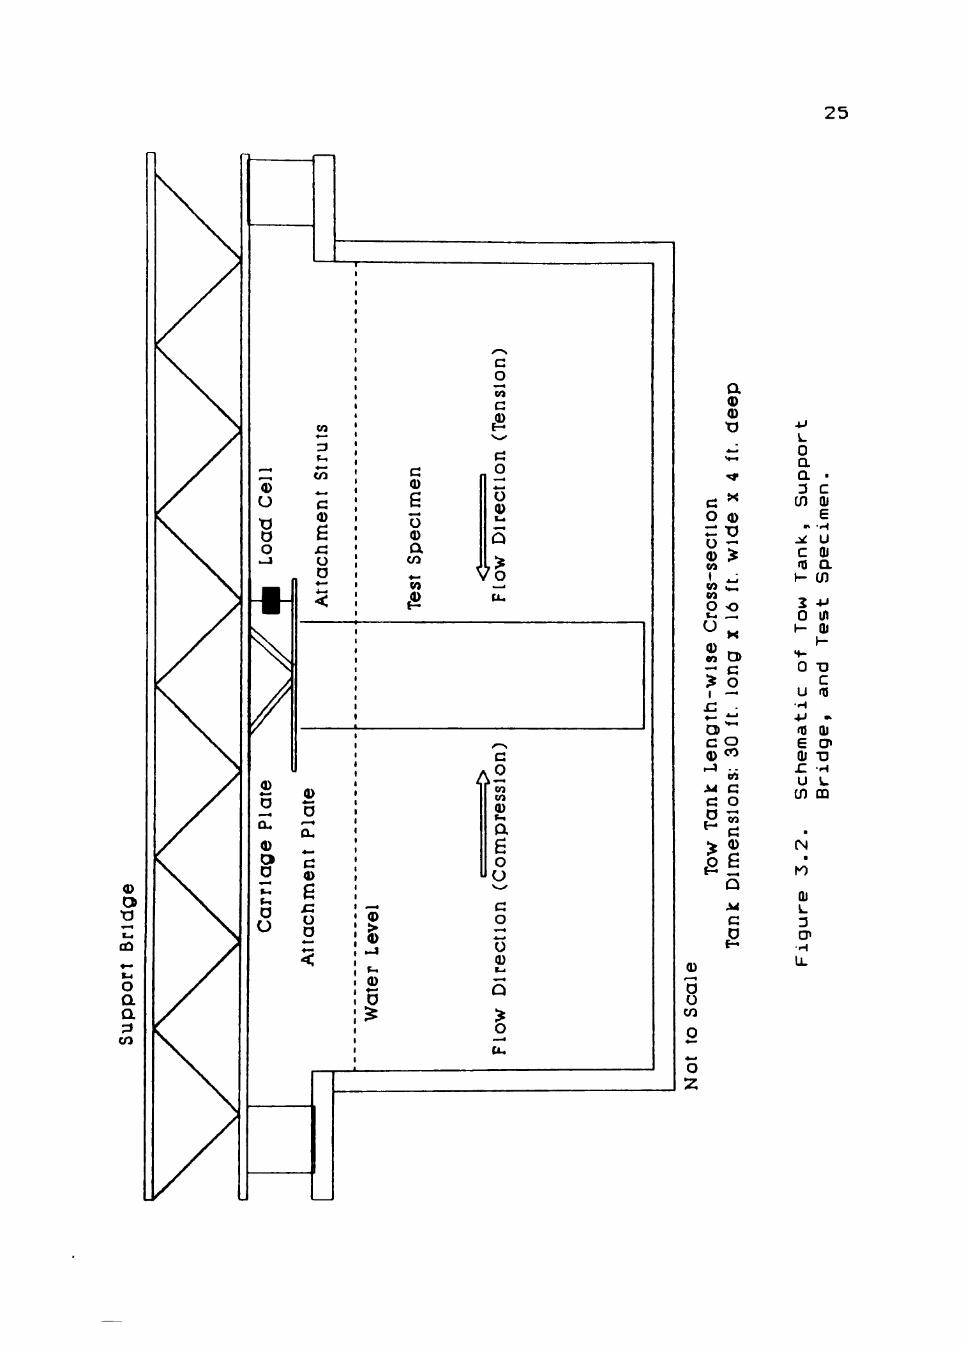
3.2. Schematic of Tow Tank, Support
Bridge, and Test Specimen 25
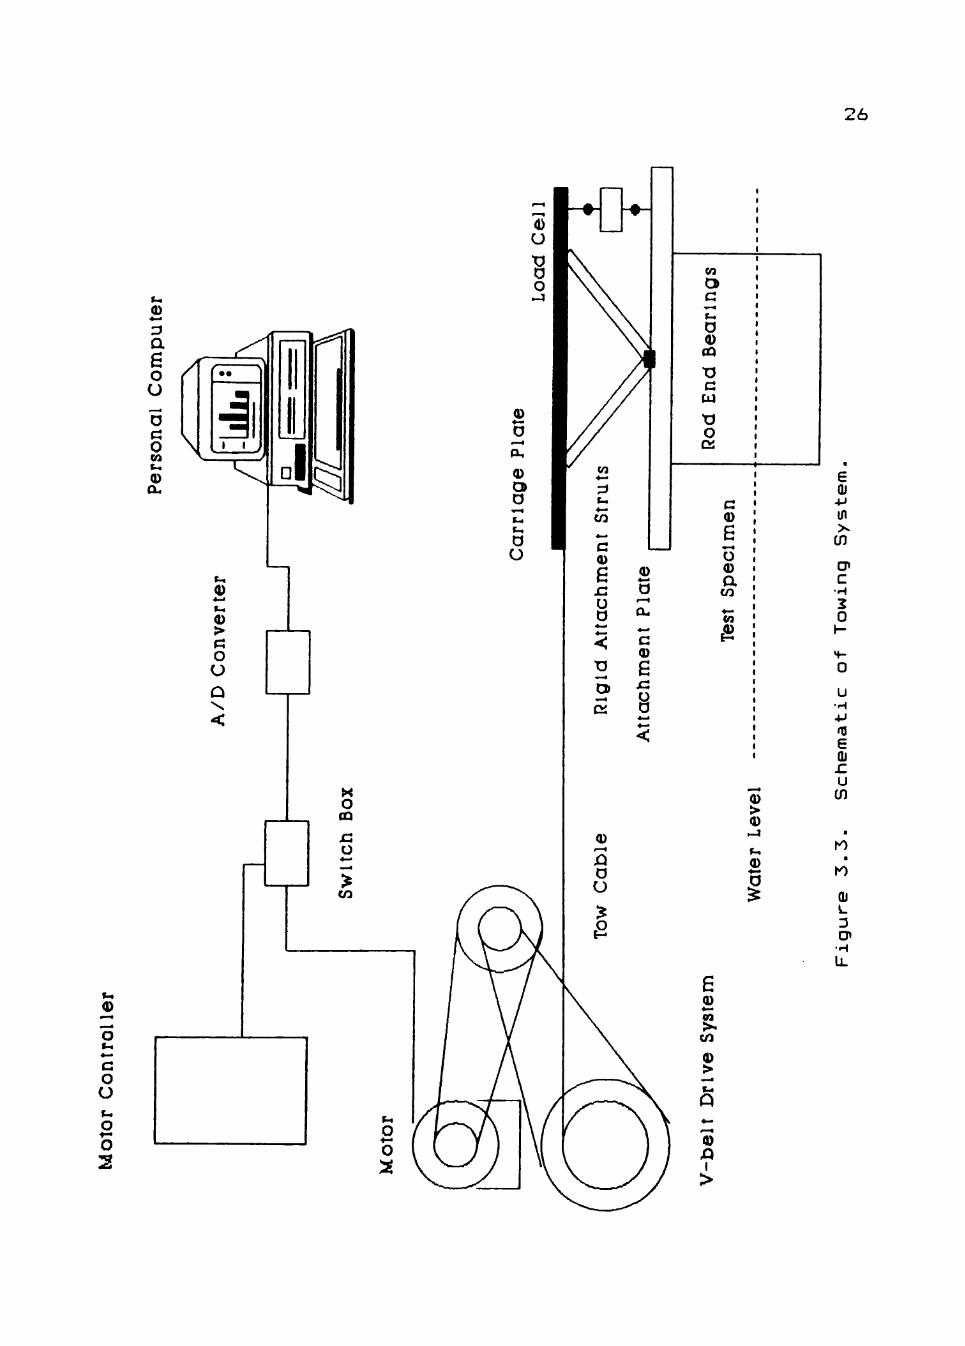
3.3. Schematic of Towing System 26
3.4. Test Specimen Force Diagram 29
3.5. Attachment Plate Diagram 31
VI
Page
3.6. Inscribed Circle Radius and Corner Radius for Octagonal Cylinder Cross-section 37
3.7. Test Specimens with "T" Frame Attachment 39
3.8. Octagonal Cylinder Orientation 41
4.1. Original Attachment Plate Design 44
4.2. 9" and 18" Circular Cylinder Drag Coefficients and Reference Drag Coefficients 46
4.3. 18" Circular Cylinder Drag
Coefficients 48
4.4. New Attachment Frame Design 50
4.5. 9" Circular Cylinder Drag Coefficients 52
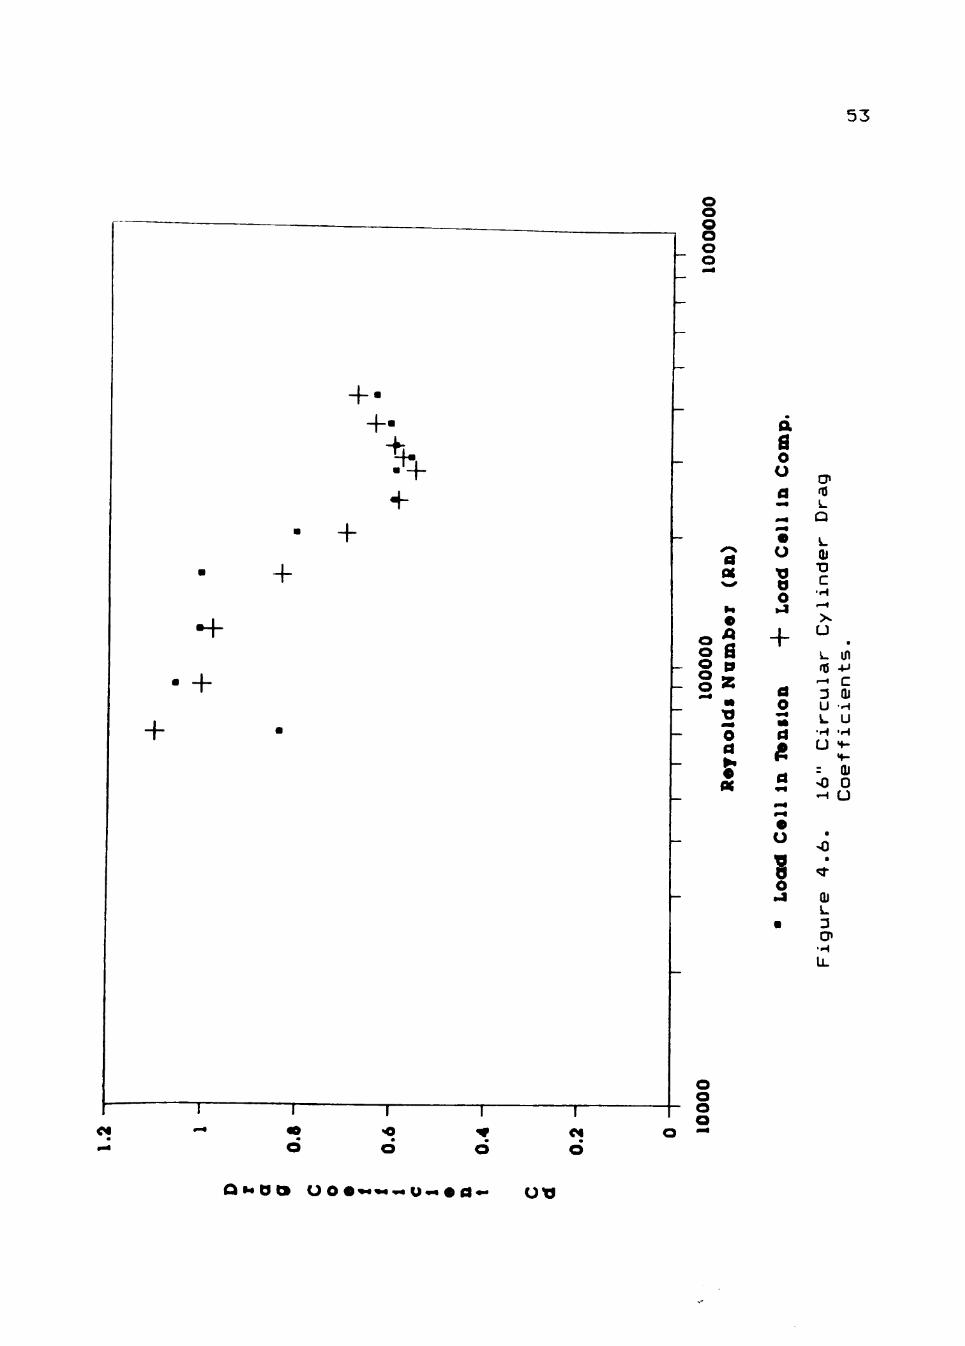
4.6. 16" Circular Cylinder Drag Coefficients 53
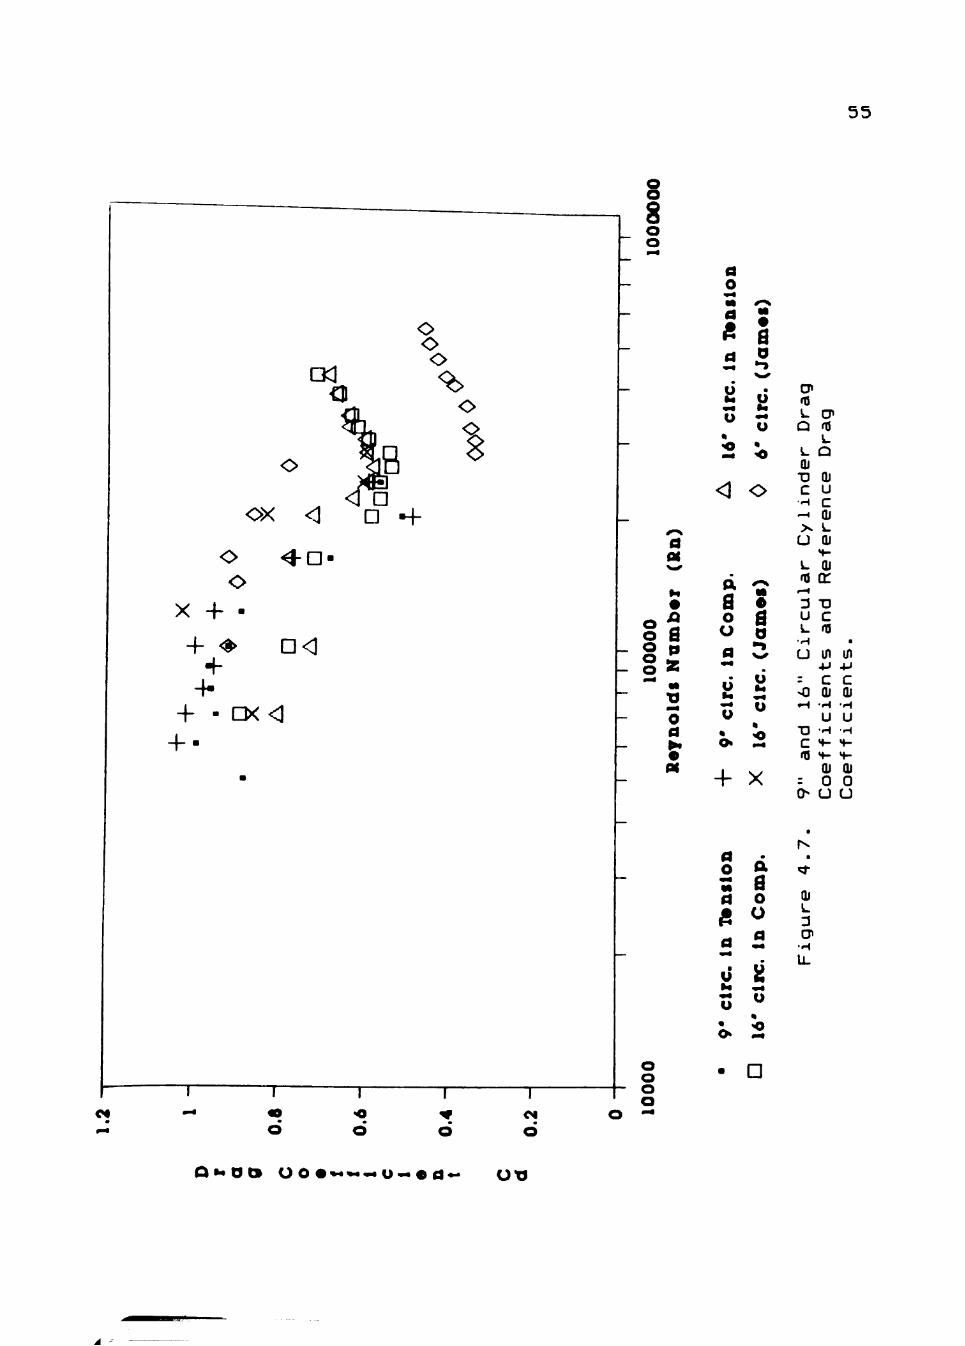
4.7. 9" and 16" Circular Cylinder Drag Coefficients and Reference Drag Coefficients 55
5.1. 9" Octagonal Cylinder Drag Coefficients 59
5.2. 16" Octagonal Cylinder Drag Coefficients 61
5.3. 24" Octagonal Cylinder Drag Coefficients ^2
5.4. 30" Octagonal Cylinder Drag Coefficients 64
Vll
Page
5.5. Octagonal Cylinder Drag Coefficients with Flat Face Normal to Flow Direction 67
5.6. Octagonal Cylinder Drag Coefficients with Corner Normal to Flow Direction 68
V l l l
CHAPTER I
INTRODUCTION
Single pole supports have been widely used as a
means of supporting signs and lights for many years. In
recent years, significant changes in the shape and size of
support poles have occurred. From early heights of 30
feet and less, support pole heights in excess of 150 feet
are now being used. Most early single pole supports were
made with circular cross-sections. However, supports with
polygonal cross-sections are becoming more common. Most
of this new-found interest in polygonal cross-sections
stems from the fact that it is easier to manufacture a
tapered polygonal cylinder than it is to manufacture a
circular cylinder with taper. Another reason for the use
of polygonal cross-sections is the added structural
stiffness of the pole resulting from the introduction of
multiple "flat sides" that run the full length of the
support pole. With these changes in the height and shape
of modern supports and an increasing desire to manufacture
these support poles as economically as possible, it is
important that the forces acting on the surfaces of these
poles be determined accurately. One such force is caused
by wind blowing against the support pole.
Because support poles are exposed to wind, they
experience a drag force caused by the wind flowing around
the poles. If this drag force can be determined, the
stresses on the support caused by that drag can be
calculated. Prediction of forces and resulting stresses
permit optimum design of poles that can withstand winds
that may be encountered.
Problem Statement
The American Association of State Highway and
Transportation Officials (AASHTO) specifies in its
Standard Specification for Structural Supports for Highway
Signs, Luminaires, and Traffic Signals (AASHTO, 1975), an
equation for the wind induced drag force experienced by
single pole supports. This equation is used by most
designers for predicting the pressure due to wind on these
supports. This equation has the form:
P = (0.00256) (1.3xV) = (Cci) (CH) ( Eq . 1 . 1 )
where: P = average force/unit of projected area (psf)
V = mean design wind speed (mph) C ^ = coefficient reflecting height and
terrain effects (dimension less) C«j = drag coefficient (dimension less)
* 0.00256 converts the kinetic energy of the wind speed to potential energy of velocity pressure.
# 1 . 3 modifies the mean design wind speed to wind gusts.
The only factor in Equation 1.1 that takes into account
the interaction between the wind and the support is the
drag coefficient (Cc.) . It is for this reason that the
drag coefficient is an important parameter for optimum
design of single pole supports.
With such an important role played by the drag
coefficient, it is critical to know what factors influence
the drag coefficient for single pole supports". From
previous studies, the drag coefficient has been shown to
be affected by both the shape of the pole and the Reynolds
number (Rr .) . The Reynolds number is a dimension less
quantity which is a measure of the ratio of inertial
forces to viscous forces acting on the member. Rn is used
as an index of the type of flow characteristics or
phenomena that may be expected to occur. The equation for
Reynolds number has the form:
(V)(D)(e) R„ = (Eq.1.2)
(M)
where: Rr, = Reynolds number (dimension less ) V = velocity (ft/sec) D = member diameter (ft) ^ = fluid density (lb/ft-) H = coefficient of fluid viscosity
(Ib/ft-sec).
In research by James (1976), the drag coefficient for
circular cylinders decreased dramatically in the critical
Reynolds number range of 1x10=* to SxlO'^. James' research
also showed that the drag coefficient for octagonal
cylinders decreased in the critical Reynolds number range
of 1x10= to 3x10=^. For pole sizes of 9 to 30 inches in
diameter and wind speeds between 60 and 100 miles per
hour, the Reynolds number varies between 3.8x10* and
6.5x10=. Thus, the practical design size of poles falls
in the critical Reynolds number range. In the same
research by James (1976), two other factors influenced the
drag coefficient. These factors were the surface rough
ness of the pole and the corner radius of the joined "flat
sides" (for polygonal shaped poles.)
Cylindrical, dodecagonal (12-sided), and octagonal
(8-sided) shapes are commonly used for support poles.
Table 1.1 shows the drag coefficient values recommended by
AASHTO as a function of Reynolds number. These values
were established from experimental data obtained with
scaled models of the pole sections in wind tunnels.
However, by using scale models of the pole sections, the
effect of the surface roughness and corner radius on the
drag coefficient may not be the same as the manufacturer's
poles. As can also be seen from Table 1.1, drag coeffi
cient values for octagonal shapes are higher than for the
other shapes over all the ranges of Reynolds numbers
shown. Therefore, an independent experiment using a test
procedure other than the wind tunnel, namely the tow tank,
and using pole sections manufactured by industry could
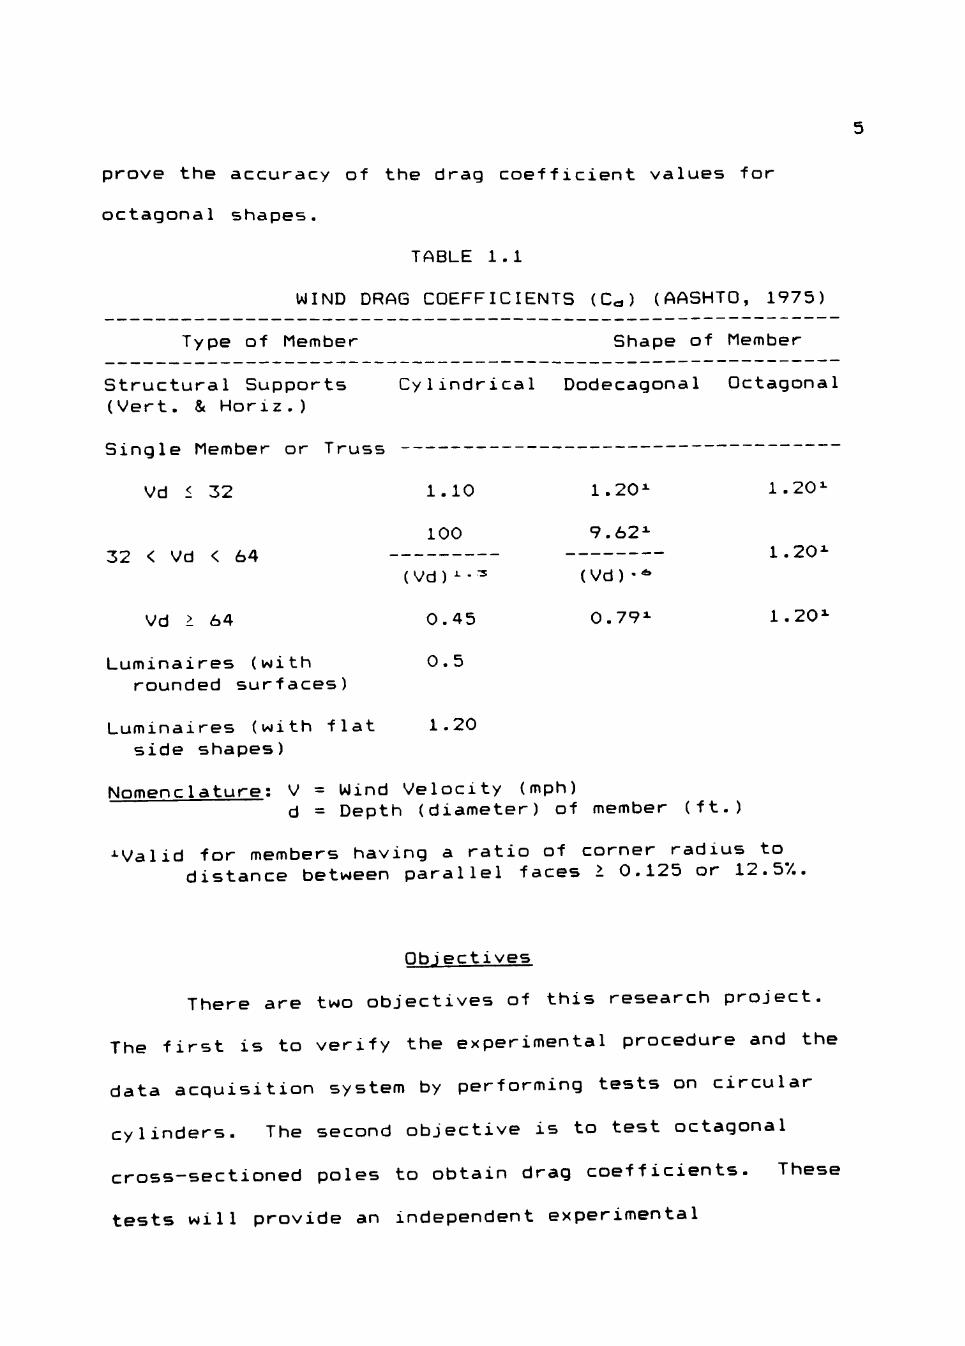
prove the accuracy of the drag coefficient values for
octagonal shapes.
TABLE 1.1
WIND DRAG COEFFICIENTS (Cc) (AASHTO, 1975)
Type of Member Shape of Member
Structural Supports Cylindrical Dodecagonal Octagonal (Vert. & Horiz. )
Single Member or Truss
Vd < 32 1.10 1.20^ 1.20^
100 9.62^
32 < Vd < 64 1.20^ ( Vd ) • ( Vd ) • -
Vd > 64 0.45 0.79^ 1.20^
Luminaires (with 0.5 rounded surfaces)
Luminaires (with flat 1.20 side shapes)
Nomenclature: V = Wind Velocity (mph) d = Depth (diameter) of member (ft.)
•^Valid for members having a ratio of corner radius to^ distance between parallel faces > 0.125 or 12.57..
Qbiectives
There are two objectives of this research project.
The first is to verify the experimental procedure and the
data acquisition system by performing tests on circular
cylinders. The second objective is to test octagonal
cross-sectioned poles to obtain drag coefficients. These
tests will provide an independent experimental
verification of the coefficients used by AASHTO. Both of
these objectives were accomplished by developing a system
to test sections of actual manufacturer supplied support
pole specimens in the Texas Tech University tow tank. The
system allowed the use of water instead of air as the
fluid for flow simulation. Using water permits lower
velocities to be employed while still obtaining the
desired Reynolds number range for drag coefficient
measurement. Use of pole sections supplied by manufac
turers provide a more representative testing environment
that closely duplicates the actual conditions in the
field.
CHAPTER I I
STATE OF KNOWLEDGE
Wind Tunnel Studies
The desire to understand the flow of fluid around a
body and the forces caused by that flow on the body has
prompted scientists to conduct experiments that attempt to
simulate those flows and model those bodies. The majority
of aerodynamic experiments conducted today involve the use
of wind tunnel technology. Wind tunnels allow members of
a variety of cross-sections to be tested to determine the
pressures and forces on the members.
Studies on circular cylinders. The flow of fluid
around a circular cylinder remains one of the most
challenging theoretical problems in the scientific world
today. In addition, the effect of forces generated by
flow around circular cylinders has become extremely
important for a wide range of engineering applications.
Experiments conducted in the early 1900's provided a
base of knowledge to expand upon. Von Karman's (1912)
classical works gave insight into the vortex shedding
phenomenon of flow around circular cylinders. Taylor
(1915) provided valuable information on the change in drag
force of a circular cylinder with respect to the smooth
ness of the cylinder surface. Taylor also showed the
influence of aspect ratio to drag force. Fage and Warsap
8
(1930) investigated the effect of free stream turbulence
and surface roughness on the pressure distribution around
a circular cylinder. Roshko (1961) was first to suggest
at least three identifiable regimes of flow: subcritical
(purely laminar boundary layer separation), supercritical
(laminar separation followed by turbulent reattachment and
eventual turbulent separation), and transcritical (transi
tion to turbulence in the boundary layer occurring ahead
of separation). In subsequent works, Achenbach (1968) and
Bearman (1968) firmly established that this "laminar—
separation/turbulent-reattachment" was responsible for the
low drag coefficient (C^) which occurs at the beginning of
the supercritical regime. The boundary between the sub-
critical and supercritical regimes is marked by a highly
distinguishable drop in Ce* from approximately 1.15 at
Reynolds number (R„) of 1.5x10= to a C^ of about 0.25 at
Rr of 4x10=. From measurements of 0^ with respect to Rr>
by Schewe (1983) in a pressurized wind tunnel and in
agreement with results of experimentation by
Wieselsberger, the well recognized plot of Cd versus Rr,
for a circular cylinder is shown in Figure 2.1.
In a study by James (1976), drag coefficients
obtained for various diameters of circular cylinders were
plotted versus Reynolds number. The plot demonstrates one
of the main problems encountered when comparing data from
o o o a o o o
o o o o o o < — d
M >^
*m 9 A a p z
Ids 0 d N •
O M O o o o
•d
o •
u
rc.
o
•
L T)
i^H a .
D U i_ •
•H r-H U QJ
C i- c 0 3 H- h-
-M t3 C C Qi H •H 3 — U lO •H c CD M- H ( > S- ^ QJ L 0 QJ OJ
U TD 2 C Qi
a» H j z
L >. en Q U >-
QJ L 3 CP
o o o a
o Moo o o•*<*•-• u-«• d*- OtJ
10
several different cylinder diameters. Since C^ is depen
dant upon surface roughness and surface roughness is
usually measured as a ratio to cylinder diameter, a shift
in the C<d versus Rr, curve occurs when data is shown on the
same plot. Shown in Figure 2.2, as the surface roughness
to model diameter ratio increases, the C. curve shifts up
and to the left. Therefore, when comparing data of one
circular cylinder to another, the surface condition should
be considered.
Studies on octagonal cylinders. In more recent
yfears, studies of cylinders with configurations other than
circular have been conducted. As application requirements
have changed, especially in the area of support poles for
highway luminaires, the polygonal cylinder shapes have
emerged as a viable and economical design. The need for
experimental data to guide the engineer in the design of
the polygonal cross-sections is great.
Probably the most extensive experimental work done
to this point on polygonal cylinder shapes is the work
done by James at Iowa State University in 1970 and 1976.
James used wind tunnel technology to conduct tests and
obtain drag coefficient results on octagonal, dodecagonal,
and hexdecagonal cross-sections. James verified his
procedure by comparing his circular cylinder results with
previously published data also shown in Figure 2.2.
11
o o o o o o
u
d M d
M
1 Ul o \n -^
x: d
c x: ® o -c 3
•^ 1
O _ j ' - '
c:-a 0) t9 JC :3 o o < D i
1 ^•m
o 1
CI]
_ . ^^
nsen
./
Dla
.
Q) ^ t j Qj • H I : 3
o o ^ cs
1
0.8
I "
•
o
d
S P
z o2 o o o d O a
U 0
S 5 d ••
s ^
X
U d
a
u <
o o o a
P u
« «
a
in - M 0 C - M QJ H in u tn H Qj
•<- c QJ CJ» 0
u 3 0 •
cr 0 Ul H OS QJ - P L U rQ
QJ 3 •o cn c
• H Ql I—t I—I
>. n U OJ
•H L L rc OS
- i > 3 u r
•H H
U 2
L QI
- M QJ E f5 ^^ •H O Q N
L -H QJ
13 in C QI •H £ 1—t fO X n U —
o ° IN
QJ L 3
d
Q M O Q I O O • •<*«- • U"* • d*- u t )
12
James conducted tests on polygonal models manufac
tured in the lab with the various desired configurations.
During these two-dimensional tests, measurements of the
cross-flow lift and drag forces on the different cross-
sections were recorded. Data was taken on models ranging
from 6 to 24 inches in diameter and at wind tunnel speeds
up to 210 feet per second. With different combinations of
wind speed and cylinder diameter, a Reynolds number value
of up to 2.1x10^ was achieved.
From James experimental results, some conclusions
were drawn about drag coefficients of octagonal cylinders.
One such conclusion described the importance of the corner
radius of the octagonal cylinders. The corner radius is
the radius of the arc where two flat sides of the cylinder
meet; usually expressed as a ratio of the corner radius to
the inscribed circle radius of the cylinder. As the
corner radius ratio increased (the corner became more
rounded), the drag coefficient decreased. Figure 2.3
shows typical data obtained for octagonal cylinders with
various corner radii ratios. The experiment also provided
information on the importance of angle of attack of the
wind on the cylinder. The maximum drag force was general
ly experienced when the flow was directed toward a corner.
A plot showing this angle of attack variation in drag
coefficient is shown in Figure 2.4.
13
• •
•
•
•
•
•
+ . X + X -h X -f X
+ + -h
D D D a
XD X D
X D
T "
d •o d
Q M O O O O •*«<»'-«U-^• d-^
-i r d d
o o o
1000
d 01 >^
M 0 A
fl P
z M TJ
O ^ O 0 o d S fr 2 • PC
o o o o
o
rati
M
• d
cor
^ • ^
-h
o « 4 • ^
o
rner
r
o u ^ o
•
o
rat
M
d
o u 1^ c« ^ Is.
D
o m0
a M M
corn
e
d ^
X
in c 4J 0 C H • Qj -p in H U 0 U Ql -H •H i . ^J 4- H 05 -f- Q CC QJ 0 2 in
U 0 3
C T L L XJ OJ rU
L 0 tr Q -P
L L ^ Ql Ql 13 C TD e L C L 0 •H 0 U
-• z >v QJ U L -H
Qj 13 rH C OJ OJ L H C O L 0 U fO CP > OJ r
.3.
Oct
w
i t
and
(N
QJ L_
Fig
ui
^—. >0 r-o ^
in QJ 6 OJ

14
The data obtained by James that contributed the most
to the need for continuing the study of polygonal cylinder
drag coefficients were the values obtained for the
octagonal cylinder drag coefficients. As can be seen in
Figure 2.5, the drag coefficient for the octagonal
cylinder cross-section is significantly greater than that
for any of the other polygonal test shape.
Tow Tank or Water Tunnel Studies
The use of water as the fluid for simulating flows
around structures (as in tow tanks or water tunnels) is
far less common than the use of air (as in wind tunnels).
Wind tunnel studies and the use of wind tunnel technology
are ahead of tow tank or water tunnel technology because
of the experience gained from wind tunnel usage over a
much longer period. It is for this reason that there are
few published reports and data from tow tank or water
tunnel studies.
Studies on circular cylinders. One such report was
a study of transition flow around circular cylinders in a
water tunnel. The study was performed at the Ames
Research Center and Aeromechanics Laboratory, U.S. Army
Research and Technology Laboratories by Almosnino and
McAlister (1984). The purpose of this study was to
confirm the phenomenon of asymmetric flow separation from
1 5
o o o o o o
d
A B p z
o2 o o o d
o
O
O
u
o
o o e o
in +j
c Qj
•H U
+ -
•H U «f- (B 4- 4J QJ - M
0 <I U CP 0 OJ L in Q QJ
QJ C T3 <I
c
c u
QJ
QJ
•H O
OJ c 0 CP
U H O 2
•
CN
-0
in QJ E OJ
n
Qj L 3 OH
Q M O O I U O•*«*•*« U - ^ e d * - UX3
1 6
o o o o o o
d
A B p z M
o 2 o o
2 •
M I
a
e
I CI
+
mm
m I
o o o
in j j
c QJ •H
TD U Qj H
TD •<-• H «<-
in Qj I 0
>o u CP
TJ U C L (Q Q
» L TD QJ Ql TD Tl C •H H in —i I >. ' -
(N U O 1^
TD QJ
TD •H in I
P6 c 0 in CP QJ X 6
r-i (Q
0 n Q. ^
in
QJ
3 CP
QMdts o o ••*<•««• u — ed<»' UXJ
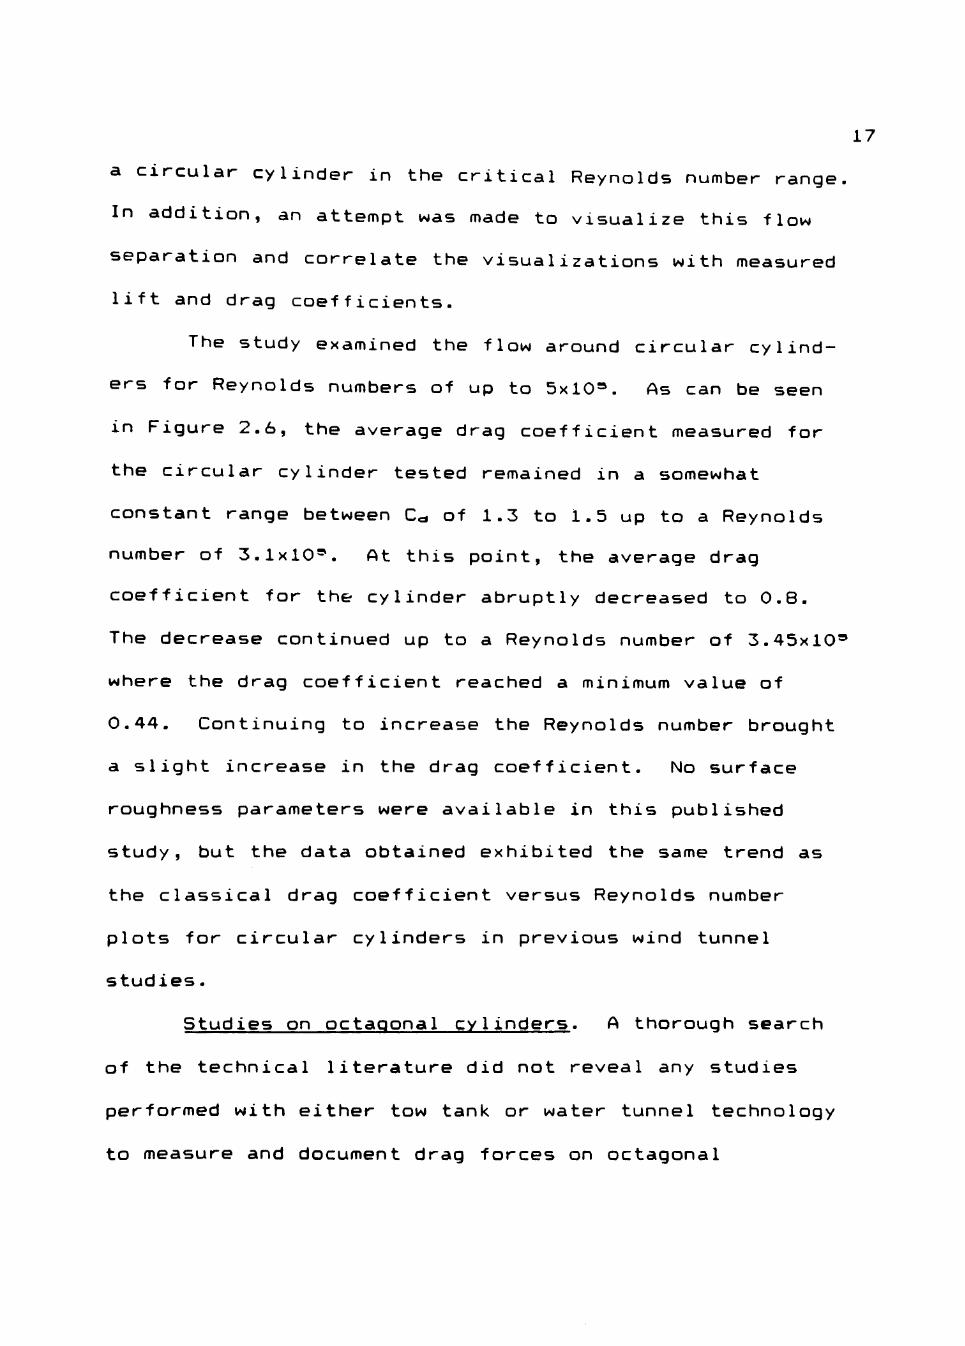
17
a circular cylinder in the critical Reynolds number range.
In addition, an attempt was made to visualize this flow
separation and correlate the visualizations with measured
lift and drag coefficients.
The study examined the flow around circular cylind
ers for Reynolds numbers of up to 5x10=. As can be seen
in Figure 2.6, the average drag coefficient measured for
the circular cylinder tested remained in a somewhat
constant range between C^ of 1.3 to 1.5 up to a Reynolds
number of 3.1x10=. At this point, the average drag
coefficient for the cylinder abruptly decreased to 0.8.
The decrease continued up to a Reynolds number of 3.45x10=
where the drag coefficient reached a minimum value of
0.44. Continuing to increase the Reynolds number brought
a slight increase in the drag coefficient. No surface
roughness parameters were available in this published
study, but the data obtained exhibited the same trend as
the classical drag coefficient versus Reynolds number
plots for circular cylinders in previous wind tunnel
studies.
Studies on octagonal cylinders. A thorough search
of the technical literature did not reveal any studies
performed with either tow tank or water tunnel technology
to measure and document drag forces on octagonal
18
o o s o o
o o o 001
^ ^ d et >.^
tm
e A a p Z w
2 0 d
t • PS
tJ
o •
e
irc.
u •
+j
c QJ
•H u •H 4 -H-QJ 0 u
^-. «t OD C> .H
• L X QJ
CP 13 4J OJ L
Q
L QJ T3 C •H i - H
u L OJ
i - H
3 U L
gu
re
2.6
. C
i
3 in •P -H cn '-•
<r r-. u Ql z c C TD 3 C
H 05
L 0 Ql C +J 'H '0 C 3 m
0 G 6 0 '-•
«4- - w
o o o o
Q M d O U o •*«•-•«« u « « e d * -
19
cylinders. It is hoped that this study will fill that gap
and provide the stimulus for continuing research in this
area.
Data Corrections
Models tested in wind and water tunnels differ from
actual structures on location in one important aspect.
Winds that flow around structures in nature have no
boundaries (except the ground) that restrict their flow
patterns. Test fluids used in wind or water tunnels are
constrained by the walls of the tunnel within which the
tests are conducted. When a model is placed inside the
test section of the tunnel, it takes up space in the test
section. To compensate for this decrease in space in the
test section for the fluid to flow, the fluid velocity
must increase to allow the same volume of fluid to pass.
This results in what is called blockage effect. The net
effect of this blockage is an effective increase in the
dynamic pressure from which drag forces are calculated.
Several methods have been developed to overcome this
blockage effect problem. Equations developed by Glauert
(1933), Allen and Vincenti (1944) and Maskell (1963) have
provided a means to correct for blockage effects in wind
tunnel experiments. James (1976) used Maskell s correc
tion equations for models with diameters up to 12 inches.
For the larger models, Maskell's method failed and the
method of Allen and Vincenti was used. Figure 2.7 shows
the drag coefficient values obtained by James for an
octagonal cylinder. The figure shows a comparison between
uncorrected and corrected drag coefficient values.
By using the tow tank to simulate wind forces on
poles, the blockage effect is minimized. The cross-
sectional area of the tow tank is large enough compared to
the cross-sectional area of the test specimen, to make the
increase in the dynamic pressure caused by the fluid
velocity increase around the test specimen negligible.
2 1
o o o o o o
d
A B p z
o 2 o o o d
2 •
X3 B u e h o u d D
"d
u
o o
05 C 0 CP 05
4J U O
13 Ql 4J U Ql L L 0 u c D
TD C 05
T3 QJ -M U QJ L L 0 U
• in
+ j
c QJ
•H U
•H 4 -*H QJ 0 u CD> 05 L
Q
L QJ TD C
•H > — 1
. K " - ^
>0 N Ch • ^
in Qj £ 05
X fD
u ' - '
CN
QJ L 3 CP •H LL
o o o o
Q M d o u o •<M<M«« u««e d ^ OtJ
CHAPTER I I I
EXPERIMENTAL PROCEDURE
The main objective of this study is to obtain drag
coefficients for octagonal cross-section cylinders. The
experimental apparatus used to obtain these values of drag
coefficients was the Texas Tech University Tow tank.
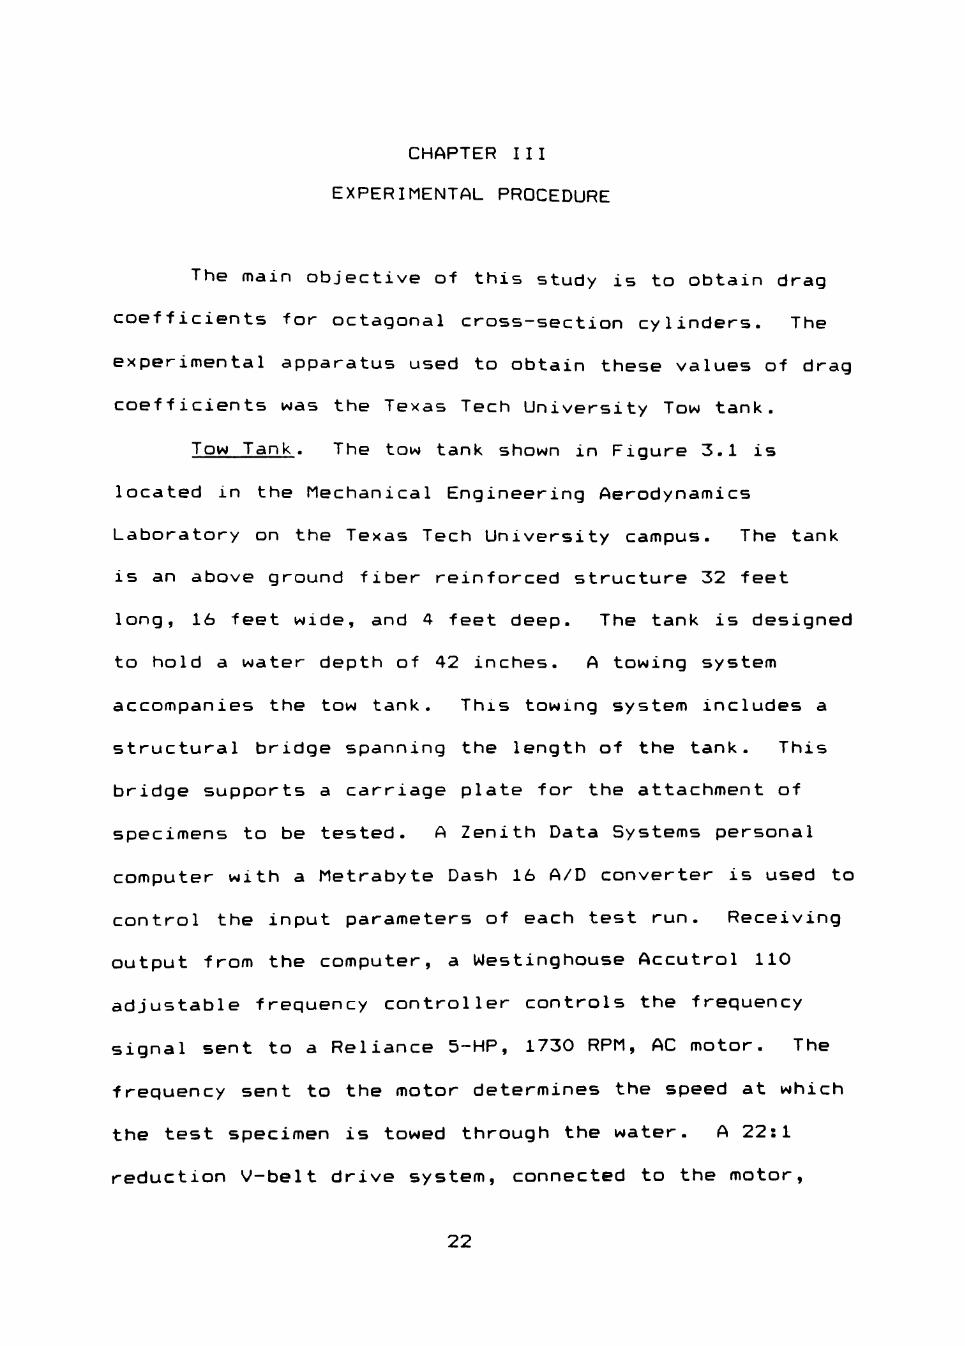
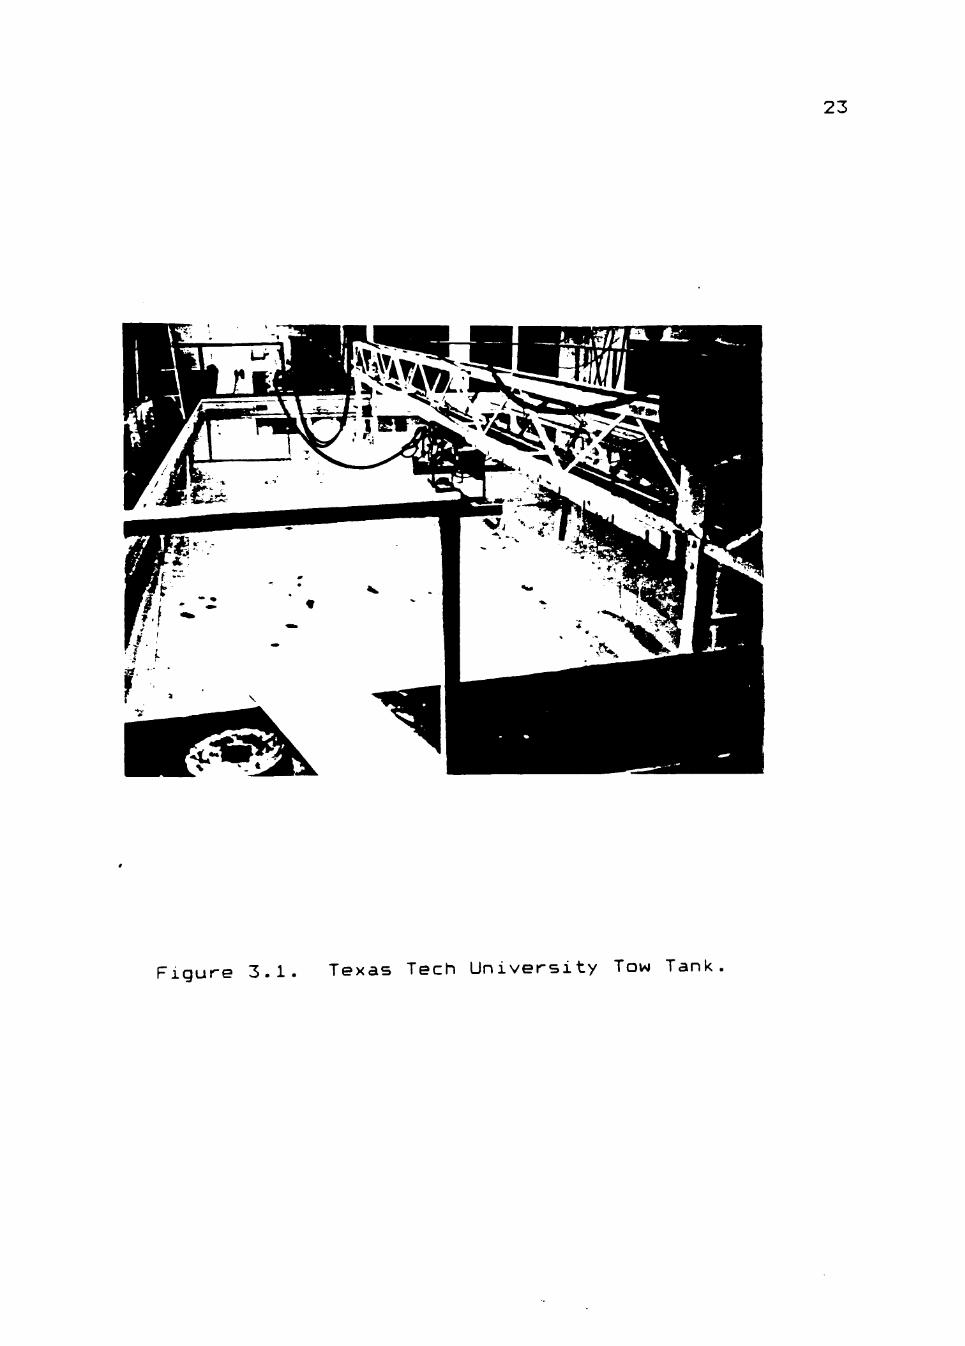
Tow Tank. The tow tank shown in Figure 3.1 is
located in the Mechanical Engineering Aerodynamics
Laboratory on the Texas Tech University campus. The tank
is an above ground fiber reinforced structure 32 feet
long, 16 feet wide, and 4 feet deep. The tank is designed
to hold a water depth of 42 inches. A towing system
accompanies the tow tank. This towing system includes a
structural bridge spanning the length of the tank. This
bridge supports a carriage plate for the attachment of
specimens to be tested. A Zenith Data Systems personal
computer with a Metrabyte Dash 16 A/D converter is used to
control the input parameters of each test run. Receiving
output from the computer, a Westinghouse Accutrol 110
adjustable frequency controller controls the frequency
signal sent to a Reliance 5-HP, 1730 RPM, AC motor. The
frequency sent to the motor determines the speed at which
the test specimen is towed through the water. A 22:1
reduction V-belt drive system, connected to the motor,
22
23
Figure 3.1 Texas Tech University Tow Tank
24
and tow cable attached to the carriage plate permit the
specimen to be tested at a variable speed of up to 4 feet
per second. The computer control also allows the control
of the acceleration, deceleration, or variable velocity
profile of the specimen during the tow test. The control
system has a switch panel that allows the operator to
manually control the towing direction and speed and also
provides a safety "dead man" switch for emergency stop of
the towing system. Figures 3.2 and 3.3 show schematic
representations of the tow tank and towing system.
A few modifications to the towing system were per
formed in order to perform drag coefficient experiments on
octagonal shape poles. One such modification was the
addition of guy wire stabilizers to the structural bridge
spanning the length of the tank. Initially, concern was
expressed as to the ability of the bridge to resist
lateral movement induced by the towing of large specimens.
This concern was confirmed with preliminary test runs with
24-inch and 30-inch diameter cylindrical specimens. The
bridge exhibited lateral movement during these test runs.
Four sets of guy wire lateral stabilizers were used to
stabilize the bridge. Two sets of the guy wires were
placed on each side of the bridge with each set having one
guy wire to the top of the bridge and one guy wire to the
bottom of the bridge. The opposite ends of the guy wires
25
^ 4> U
O O
>-i
^^^
\
/
late
a. 0) O 0
Cam
CO ^— D %-.
CO
C
x: o D • ^ 4—«
<
ate
cu , .
a 0)
tach
m
• r <
eve
I
. . J
Wat
er :
c Q) e
eel
a <n
\ n ^
I
^>. c o *- CO C (D f -v ^
C! O .^m
Dir
ec
> l u.
/-> c
pess
lo
a B o o
ctio
n ('
lo
w
Dir
e
u.
a Q>
t j
0) * — 1
0 o CO
o *~ *^ o 2
c: o •^
o Q) CO
• CO 00 O !;-• u d) m —<
1 x: ^-O) c 0)
r-i
M a o i -
•^t p t-"
f ^
4) V —^ >
••-•
o „_, M
a> c o
. ^ j
*m^
O CO
0 ) C o 00
d <D
H 5
c
4J L 0 a a 3 cn
» ^ c 05
f -
2 0
h-
0
u • H 4 J 05 £ QJ r. u cn
•
c QJ £
• H
u QJ a cn 4 J
in Qj
1 -
TD C 05
• k
QJ O' T3 • H V_ CD
CN •
QJ L 3 CP
• H
26
0)
a g o u D C O CO u. 0)
a.
<0 4—1
0) > a o o
o
CD
O
> CO
<D
a o O Ul
O •—
o 2
o o 2
e QJ
in
cn CP
c •H 2 0
M -0
+J 05 E QJ r u cn
•
QJ L 3 CP
•H
27
are attached to structural joists of the building's roof.
The wires are approximately at a 30" angle with the
horizontal thus providing both vertical and lateral
support to the bridge.
Another modification was the replacement of a 25:1
toothed gear reducer with a V-belt drive system for the
towing motor. During preliminary test runs, high
frequency "noise" was evident in the recorded data. After
several investigations, the toothed gear reducer was
determined to be the source of the high frequency "noise".
By changing to the V-belt drive system, the high frequency
noise, though not completely eliminated, was reduced to a
point where it was no longer significant.
Drag force measurements. Measurements of the drag
force on the specimens are accomplished by the use of a
Lebow 3132-500 load cell rated at 500 pounds capacity in
both tension and compression. The test specimens are
suspended vertically from an attachment plate into the tow
tank. The attachment plate, shown in Figure 3.3, attaches
to the carriage plate by a three point support system.
Two attachment plate designs were developed during the
course of the study. The original attachment plate
design did not perform as expected. The drag coefficient
va lues obtained during the experimental procedure verific-
tion were biased due to the location of the attachment
28
struts on the original design. A more detailed discussion
of the problem encountered with the use of the original
attachment plate is provided in Chapter 4.
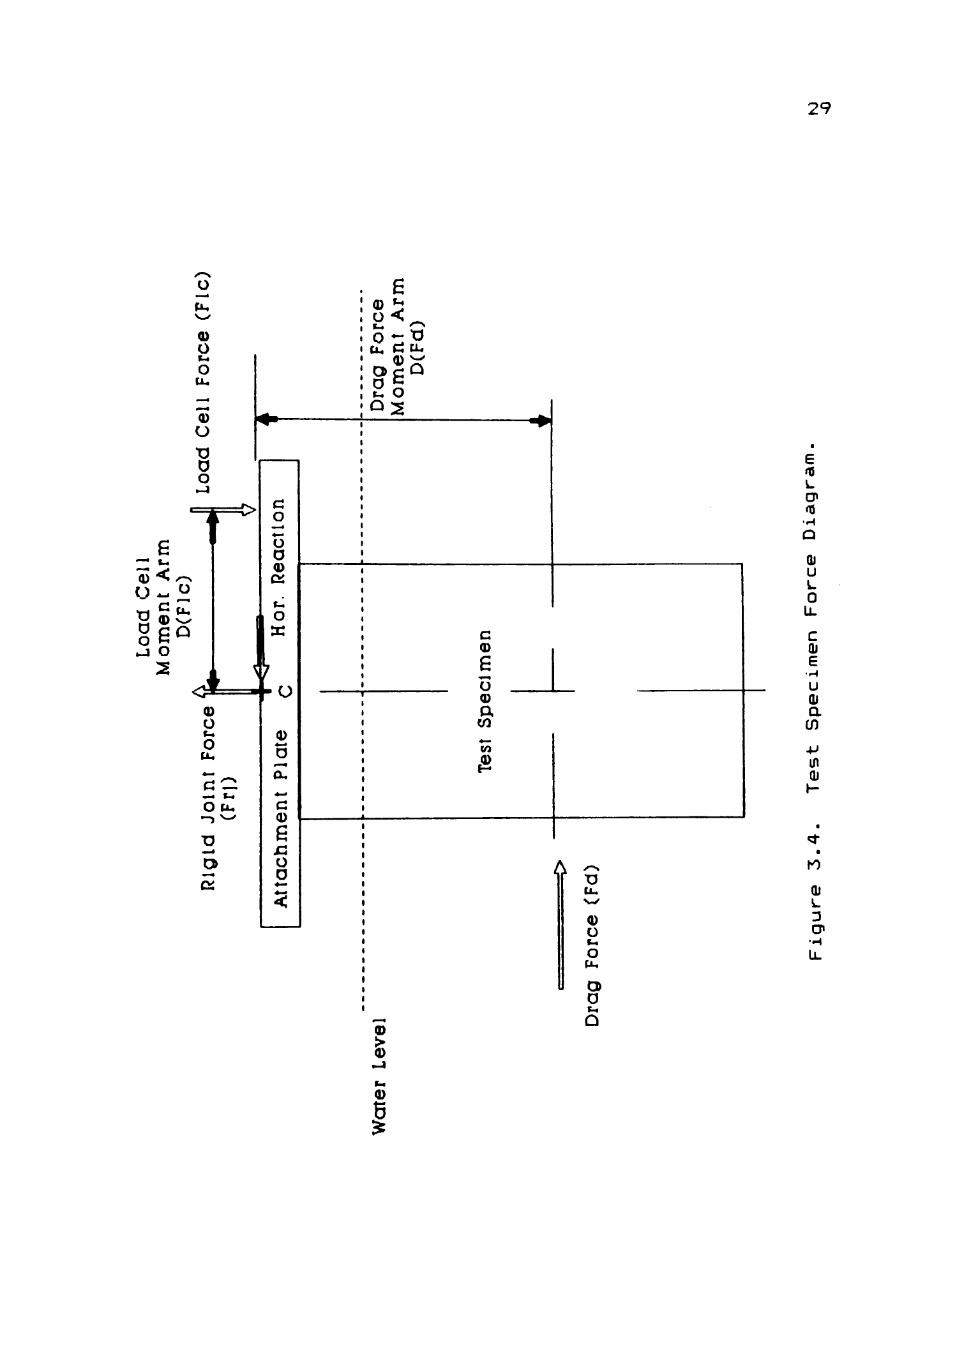
Figure 3.4 shows the couple formed by vertical
reactions that counteracts the moment produced by the
horizontal drag force acting on the specimen. The horizon
tal drag force is the resultant force of an assumed
uniformly distributed force acting on the test specimen.
This resultant force acts at mid-depth of the water height
on the test specimen. The location of the resultant force
application point is known because of the method used to
tow test cylinders. The location was also confirmed with
preliminary tests of circular cylinders in the tow tank.
The test specimens were kept open on bottom allowing the
water level on the inside and outside of the specimen to
be equal. The hydrostatic water pressure acting on the
outside of the test specimen varies because the change in
depth of the water. However, the pressure variation is
cancelled due to an equal and opposite hydrostatic water
pressure acting on the inside of the test specimen. By
cancelling the effect of the depth of the water on the
force acting on the test specimen, the hydrostatic
pressure does not have an effect on the resultant force.
29
o fu
Q> O Ul O
CJU
0) O
•o D o
6 —• (-• 0 ) •**! ^-N
o-i
g g Q J o
2 <i
F = 0
1
^
© o r-i O
O u.
•D
5
£ 05
CP 05
QJ U L 0
U .
c QJ £
u QJ a cn
in QJ
QJ L 3 CP
©
30
In designing the three-point attachment system, care
is exercised to make sure that no horizontal force is
transferred to the single load cell attachment joint. To
accomplish this, rod end bearings are placed on either
side of the load cell to isolate the load cell and make
that attachment incapable of resisting any horizontal
force. Provisions for handling the total horizontal force
on the test specimen are provided by the remaining two
attachment struts. These two struts are horizontally
rigid and are able to resist the total horizontal force
imparted on the test specimen during a test run.
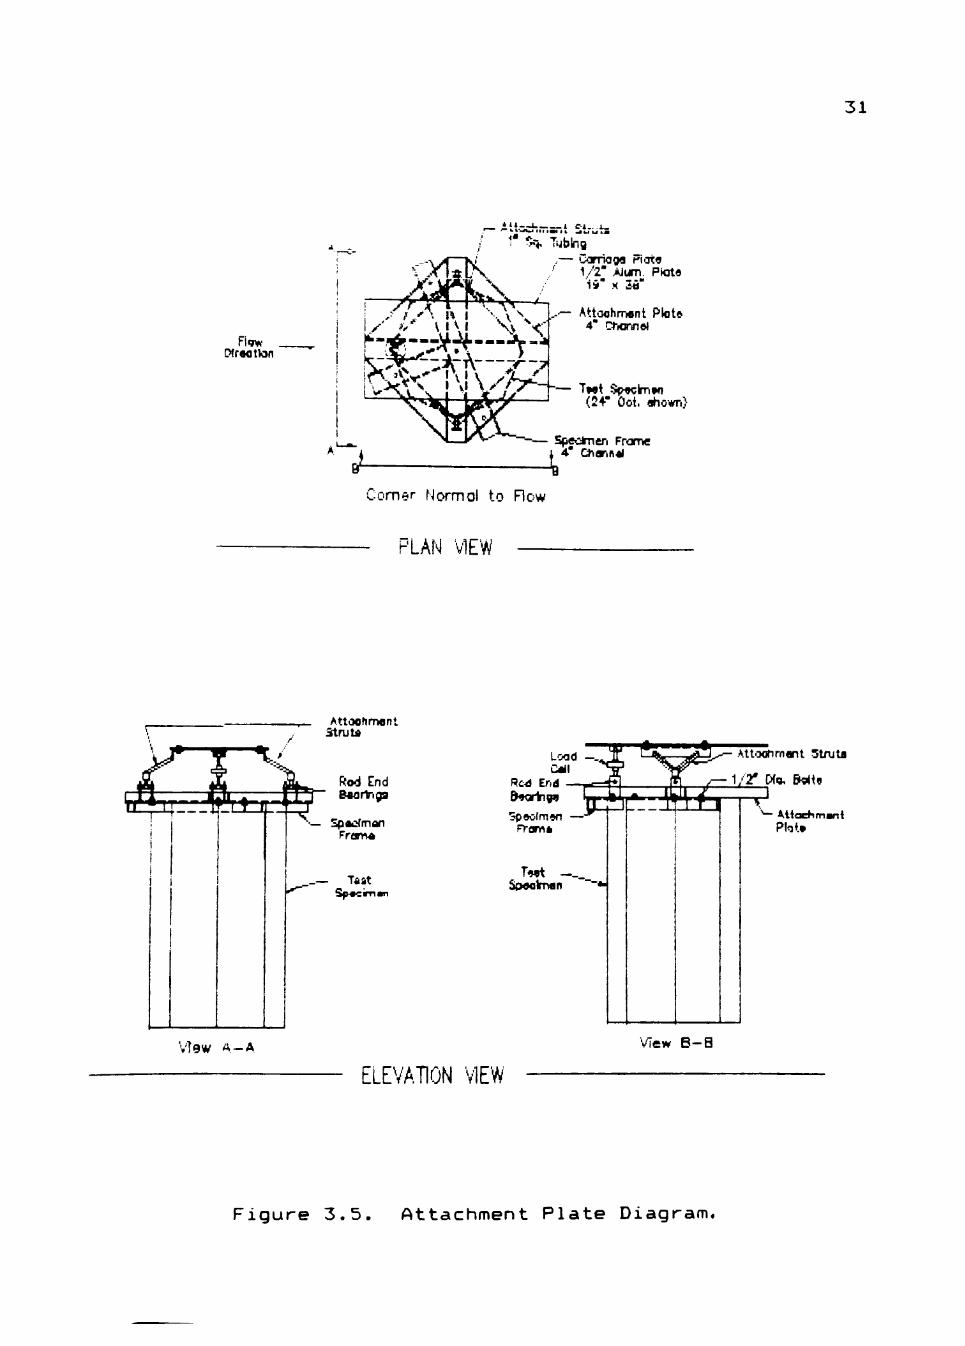
For the load cell to sense the vertical force reac
tion, the two rigid attachment struts must have the
ability to allow the attachment plate, to which the
specimen is attached, to rotate. As shown in Figure 3.5,
the rotation of the attachment plate transfers the
vertical reaction force to the load cell. This vertical
reaction force counteracts the moment caused by the
horizontal drag force. The required rotation of the
attachment plate is accomplished by placing a rod end
bearing at the point where each of the remaining two
attachment struts attach to the attachment plate.
The force that the load cell senses is transmitted
by an electrical cable to a Measurements Group Model 2310
signal conditioner/amplifier/filter. The filtering
[XraotVsn
4 * 1 1 i C i .
/ 1 ' ?q, Ti blnB
A • > V •'
^\.--r i >- ^y' \ I \ I \ v ^ <
' 1/2" Alum. Plots
,-— Attoohment Pkit» 4" CtiOTin*!
"— 1*9\ Sp*clrriM (24- Oot. ahowr.)
- — Spedmeri Frame 1 4 ' Q^arin«l
Comer Normol to Row
31
PLAN VIEW
AttooHment StruU
S ft--_ Rod End
»'T9W A - A
'-— SpAi2(tnan From*
.— T*at Sp«cim
Rc-d Erid
5p«ofm«i Fj'flrw*
SpMlman
—^^r
L-:jM"
Att'Mhrnant Stnjla
• Aliaehmwii
VTew B-B
ELEVATION VIEW
Figure 3.5. Attachment Plate Diagram,
32
ability of the instrument is not used; however, the
amplifier was needed to amplify the load cell signal. The
load cell's output signal has a rated magnitude of 3
millivolts per excitation voltage for a maximum load of
500 pounds. For example, typical loads recorded by the
load cell during this study had an upper range of ap
proximately 100 pounds with an excitation voltage of 15
volts. The load cell under this condition produces an
output signal of 9 millivolts. This signal requires
amplification for use with the ±5.0 volts A/D converter.
The output signal from the load cell is amplified by a
factor of 100 to give a signal that can be accurately
resolved by the A/D converter.
The signal conditioning ability of the 2310 instru
ment is also used. A zero balance circuit makes it
possible to null the zero offset caused by the static
hanging weight of the test specimen. This "new" zero
reading allows calculation of the drag coefficient
directly without having to compensate for the weight of
the test specimen. The amplified and conditioned load
cell output signal is sent to the Metrabyte Dash 16 analog
to digital converter which converts the analog load cell
signal to a signed 12-bit integer that can be processed by
the computer.
33
Data acquisition. The procedure for obtaining the
desired data follows a straight-forward sequence. Each
test specimen is mounted to the attachment plate which in
turn is attached, via the three-point support system, to
the carriage plate (see Figure 3.5). A computer program
called "cyldrag," developed and refined throughout the
study, is used to collect data during the tests.
The program asks for operator input of such variables as:
number of data samples per second, speed of test specimen
in feet per second, the magnitude of amplification used to
enhance the load cell output signal, and the inscribed
cylinder diameter of the specimen in inches.
To test a particular specimen and obtain all the
data desired, several steps are required. After the
specimen to be tested is mounted to the attachment plate,
the signal conditioner is reset to give a zero reading
while the specimen is stationary. Once this has been
accomplished, the computer program is started and the
desired test variables asked for by the program are input
into the computer. With the test specimen at the starting
position in the tow tank (at one end of the tow tank), the
program is engaged and the test begins. Using the input
variables, the program internally calculates the distance
the specimen will travel and sends an output signal to the
motor controller which controls the distance the motor
34
tows the specimen. The test specimen is accelerated up to
the desired speed by the computer and that speed is held
constant. The program collects data samples at the
specified number of samples per second while the test
specimen is being towed at the constant speed. As the
specimen reaches the end of the calculated distance to be
traveled, the computer stops collecting data, decelerates
the specimen and brings the specimen to a stop. The
program takes the data collected during the constant speed
section of the test run and calculates the drag coeffi
cient for each data sample by using the following equa
tion :
(F) Cc =
(0.5)(€)(V=)(A) (Eq.3.1)
where: F = drag force (lbs) Ccd = drag coefficient (dimension less) € = fluid density (slugs/ft^) V = velocity of specimen (ft/sec) A = projected area of specimen (ft=)
The calculation of the drag force (F) is also performed
within the program by taking the load cell output data in
voltages, converting it to load in pounds, and using
statics and the location of the forces to find the
horizontal drag force. The procedure described above is
referred to as a test run. The test run is repeated ten
times with the same test specimen at the same speed. The
program then performs one final calculation by determining
an average drag coefficient.
For this study, Reynolds number values covering a
range from 5x10^ to ^xJ^O^ are desired. By knowing the
Reynolds numbers at which drag coefficients are wanted,
the required velocities, to be input into the computer
program, are calculated using the following equation:
V = (Rr,) (M)
(D) ( ) (Eq.3.2)
where: Ro = Reynolds number (dimension less) M = coefficient of fluid viscosity
(Ib/ft-sec) D = specimen diameter (ft) e = fluid density (Ib/ff).
As mentioned earlier, the tow tank has a maximum velocity
of 4 feet per second. By varying the size and towing
speed of the test specimens, the desired Reynolds number
range from 5x10*^ to 7x10° is obtained.
Each drag coefficient data point is an average of
approximately 150 data samples recorded by the computer.
The large number of samples helps decrease the possibility
of error in the data due to small variations in experi
ments. More than 15 data points with varying Reynolds
number are obtained for each of the test specimens.
Test specimens. One of the significant aspects of
this study is the use of actual manufacturer supplied
sections of support poles. The sections were supplied by
Falcon Steel in Fort Worth, Texas, and by Valmont
Industries in Valley, Nebraska. By using these sections,
drag coefficient values obtained in this study are as
close as possible to the drag coefficient values ex
perienced in the field.
The test specimens received from support pole
manufacturers included both circular and octagonal shaped
sections. The circular cross-sections have diameters of
12 and 16 inches. The octagonal cross-sections are con
structed of 3/16-ipch thick steel plates with diameters
(measured by the inscribed circle of the cylinder) of 9,
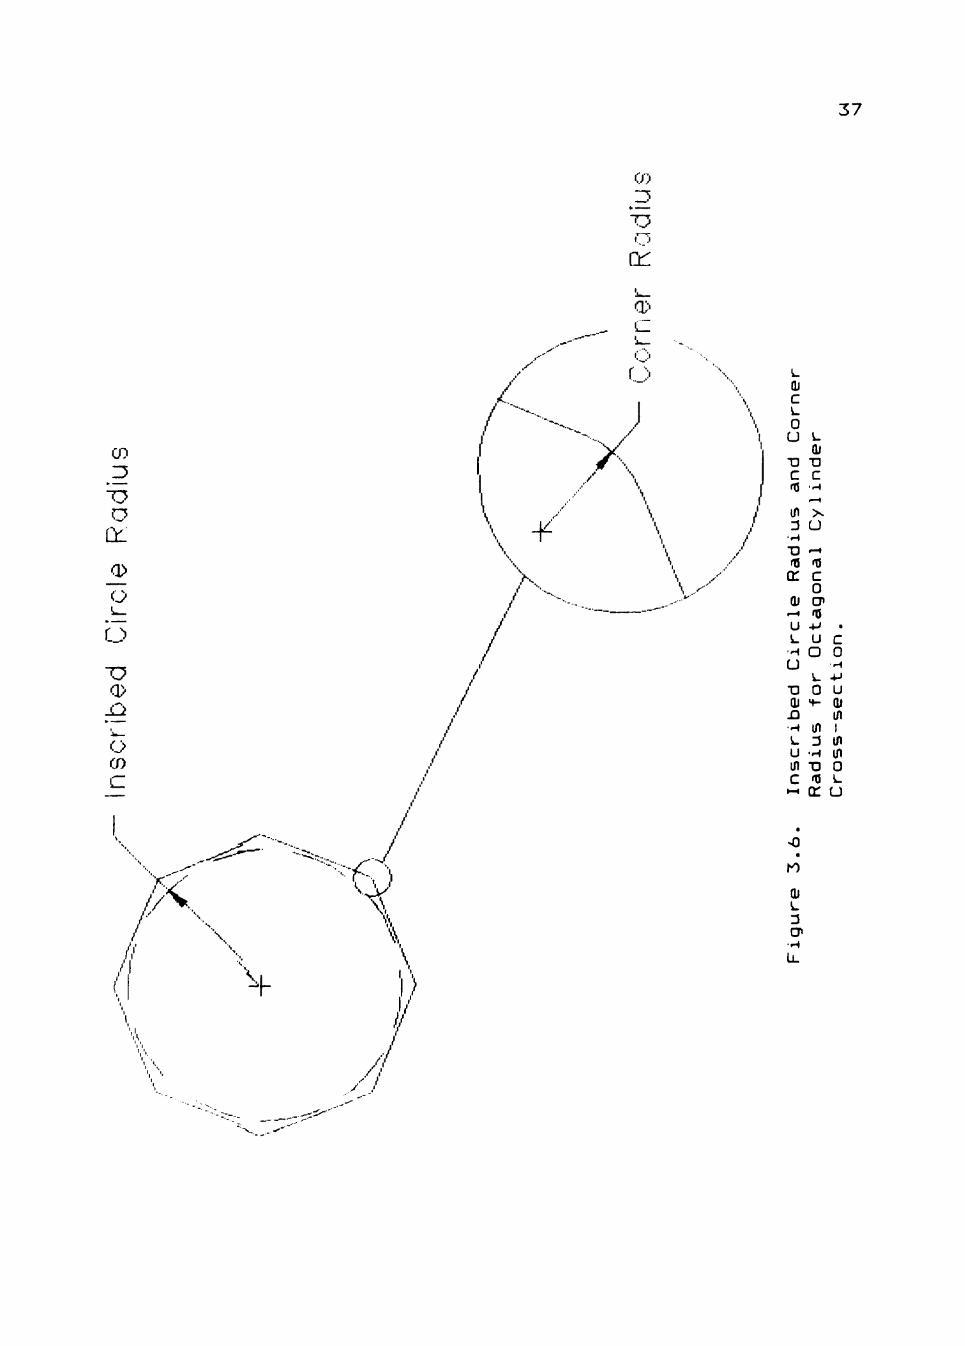
16, 24, and 30 inches. Figure 3.6 shows a cross-sectional
view of the octagonal cylinders and identifies the
inscribed circle of the cylinder along with corner radius
of the cylinder. Although most support poles are manufac
tured with a slight taper along their lengths, the
specimens received for this project are not tapered. The
exterior surfaces of the octagonal cylinders had a gal
vanized coating. The coating on the test specimens
provides the same surface roughness as that of the support
po les used in the field. Additional circular cylinders
were obtained from a pipe supplier. These circular
cylinders have diameters of 9, 18, and 36 inches. The
0)
37
r~\i
(i: a-'
y
CD
T} O
Ql
o
o
£? o CO
^ ^ i. / • '
/ / \ .
\ + \v
1 ' .
1 ».
I, j
\
K
/
/
\
i) i/
/ /
/
y-
\ x"
L QJ c U 0 u TD C 05
in 3
• H
TD 15 cr Ql
1—1
u L
• H
u TD QJ n •H L U in C
HH
a
n
QJ L 3 CP
L QJ TD C
>. u r-t
05 C 0 CJ< 15
-M U o i . 0
••-
in 3
•H TD 05 Q:
> C 0
•H +J u QJ in 1 in in 0 L
U
38
36-inch diameter cylinder was actually constructed of flat
plate rolled to a 36-inch diameter. All circular test
specimens are constructed of 1/8-inch thick steel with a
single coat of paint on the exterior surface.
All the test specimens obtained from the manufac
turers were initially 5 feet long. Each specimen was cut
to 48.625 inches long for placement into the tow tank.
When the test specimens were attached to the attachment
plate, the gap between the bottom of the tank and the
bottom of the test specimen was less than 0.5 inch. The
clearance to the bottom of the tow tank is intentionally
held as small as possible to simulate two-dimensional flow
around the specimen.
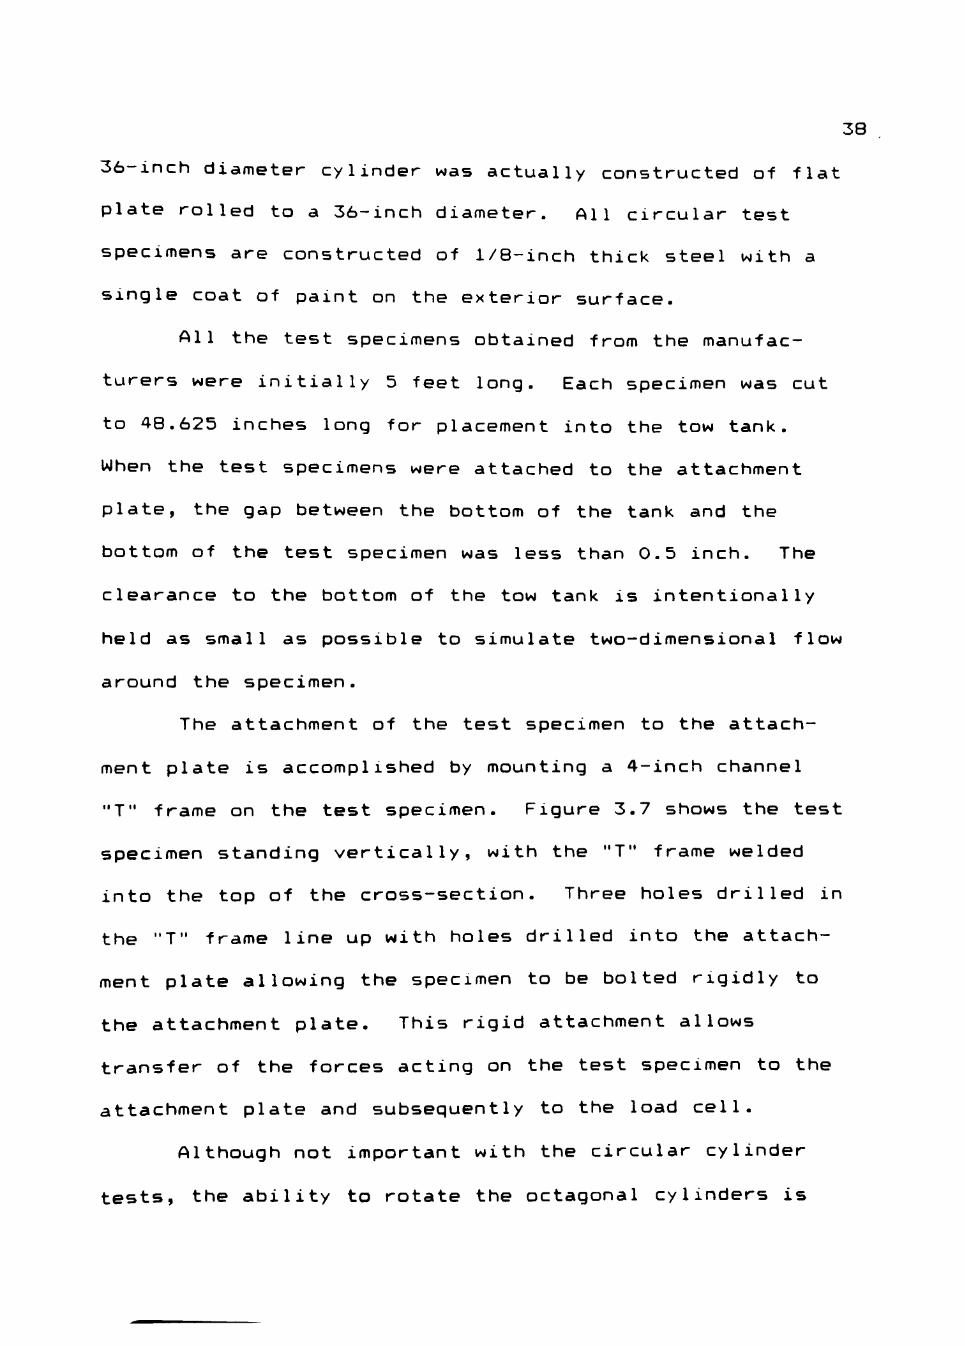
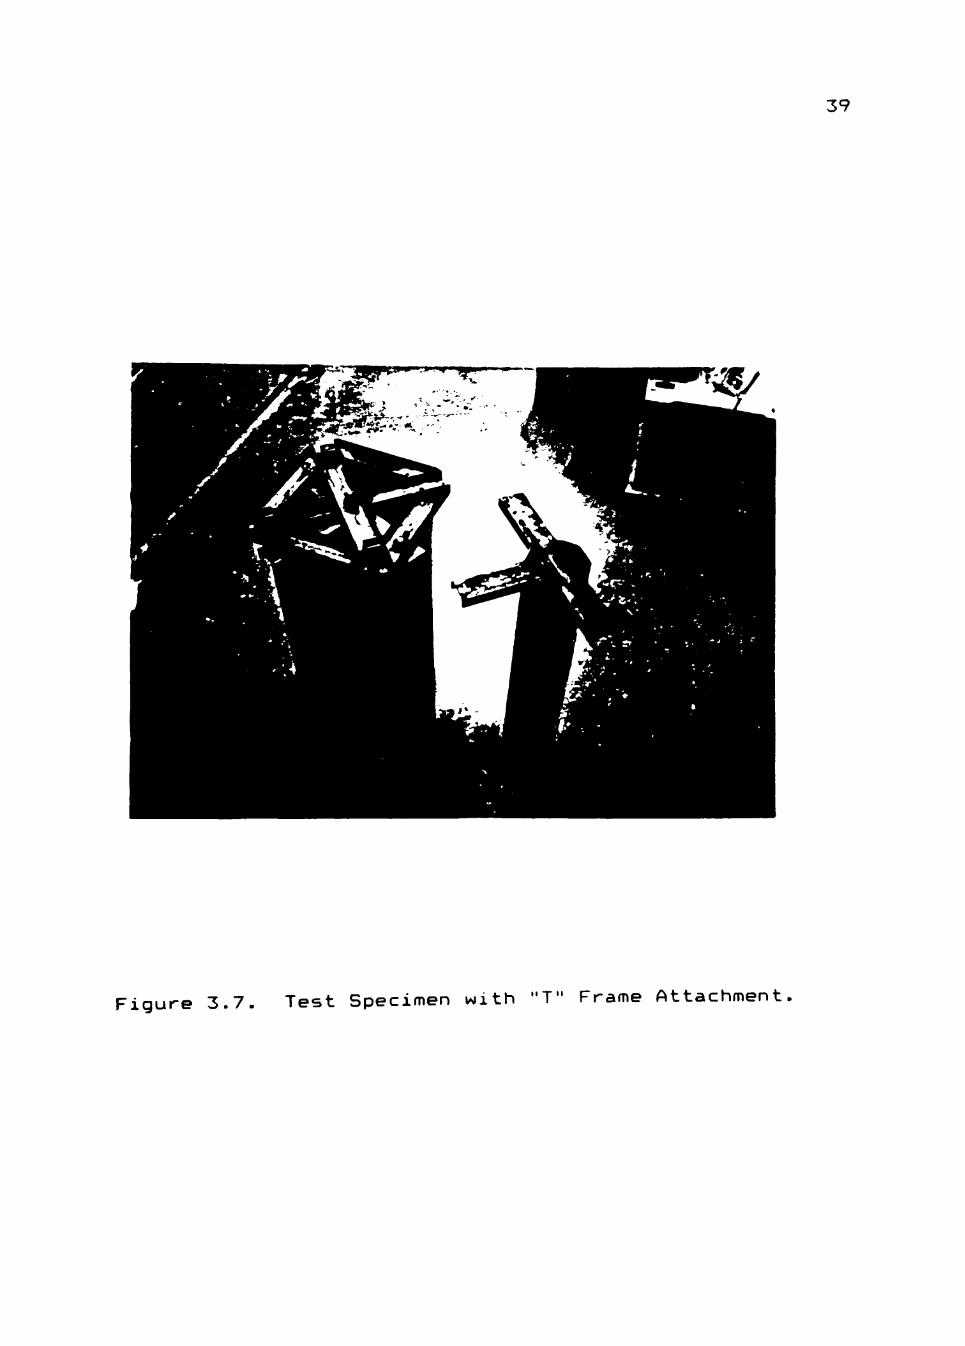
The attachment of the test specimen to the attach
ment plate is accomplished by mounting a 4-inch channel
"T" frame on the test specimen. Figure 3.7 shows the test
specimen standing vertically, with the "T" frame welded
into the top of the cross-section. Three holes drilled in
the "T" frame line up with holes drilled into the attach
ment plate allowing the specimen to be bolted rigidly to
the attachment plate. This rigid attachment allows
transfer of the forces acting on the test specimen to the
attachment plate and subsequently to the load cell.
Although not important with the circular cylinder
tests, the ability to rotate the octagonal cylinders is
39
Figure 3.7. Test Specimen with "T" Frame Attachment
40
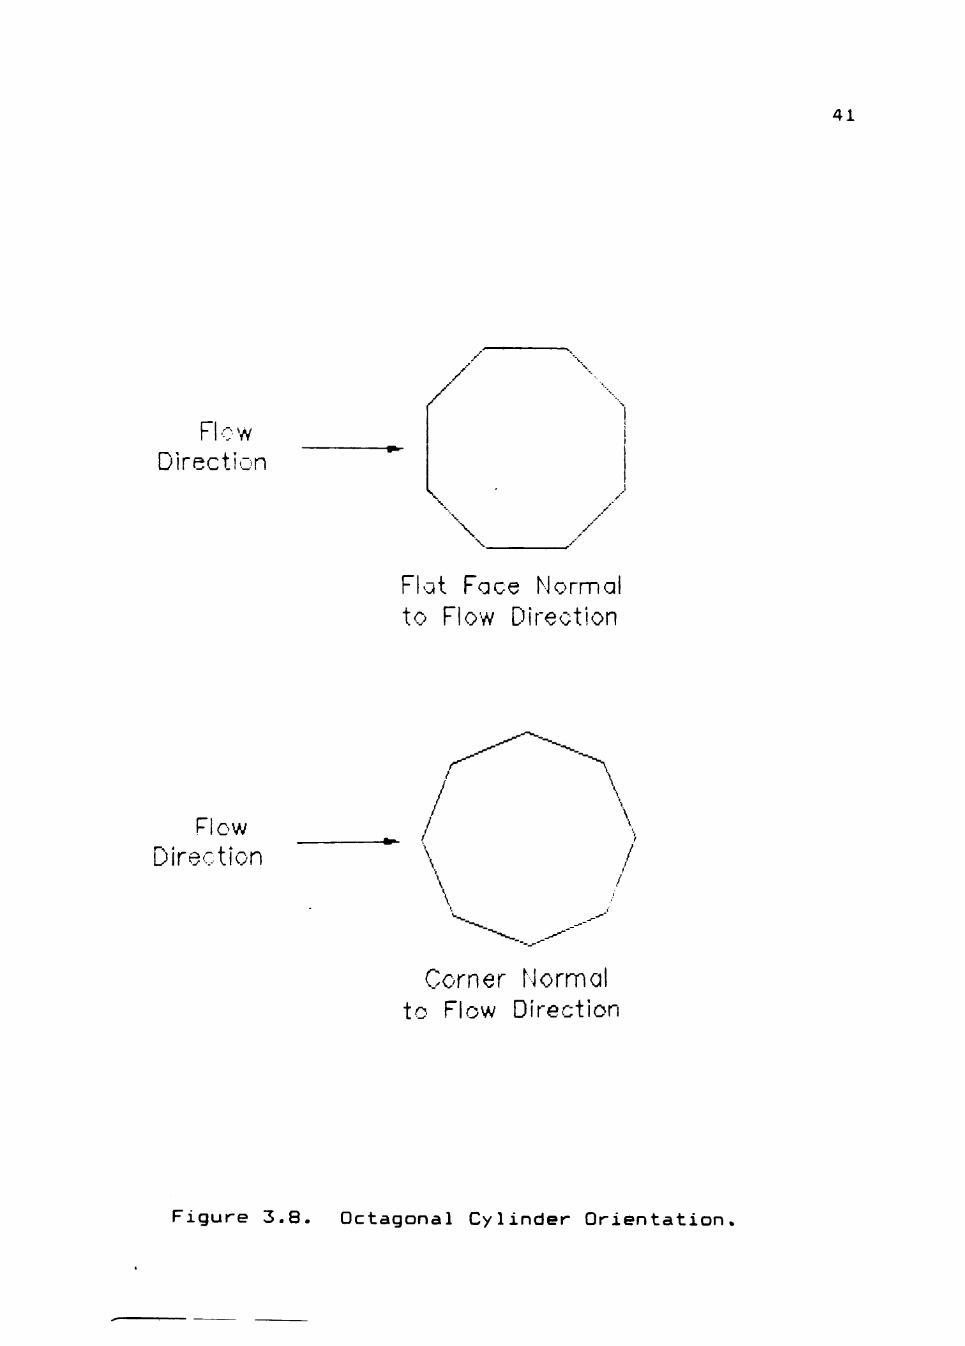
required to determine what effect the orientation of the
cylinder with respect to the fluid flow has on the drag
coefficient values. As would be expected, and verified by
James (1976), the orientation of the cylinder to the fluid
flow has a significant effect on the drag coefficient
values of octagonal cylinders. For this reason, and to
accommodate different size test specimens, the attachment
plate was provided with a series of holes designed to
allow different sizes of octagonal test specimens to be
rotated. Two orientations of the cylinders to the towing
direction, shown in Figure 3.8, were studied in this
project. The first orientation studied was where a flat
face of the octagonal cylinder was normal or perpendicular
to the towing direction of the cylinder. The second
orientation studied was where a corner of the octagonal
cylinder was normal to the towing direction of the cyl
inder. These two orientations were selected because they
represented the extreme cases which produced the highest
drag coefficient values.
Flow Direction
Flow Direction
4 1
/
\ / \ _
Flat Face Normal to Flow Direotion
I
!
\
Corner Normal to Flow Direction
Figure 3.8. Octagonal Cylinder Orientation
CHAPTER IV
VERIFICATION OF EXPERIMENTAL PROCEDURE
As with most research projects, one of the critical
parts of this project was the verification of the experi
mental procedure. At the beginning of the study, verifica
tion of the procedure was not considered to be a difficult
task to accomplish. However, as the research progressed,
verification proved to be a "thorn in the side."
Circular cylinder results. The verification process
followed the same technique that has been used in previous
studies for verifying an experimental procedure for
obtaining drag coefficients of various cross-sectional
shapes. The process uses the drag coefficients obtained
for circular cylinders in previous experimental projects
as a reference for comparison with drag coefficient values
obtained using this study's experimental procedure. The
study of circular cylinder drag coefficients dates back to
the early 1900's and has available the most amount of data
documenting 2-D flow. It is for this reason that circular
cylinder drag coefficients are used as the reference of
comparison to verify new experimental drag measurement
procedures.
Several circular cylinders of different diameters
were tested and the drag coefficients measured. To
42
43
encompass the range of Reynolds numbers desired, cylinder
diameters of 9, 16, 18, and 36 inches were used. Initial
ly, the project plan was to test the circular specimens by
towing them in the direction which would cause a tension
force in the load cell. Tension was preferred due to
concern about the possibility of slack in the joint
attachments. Any slack in the attachments on either side
of the load cell would be taken up by the weight of the
specimen before the test run would begin. If the direc
tion of towing produced a compression force on the load
cell, slack in the joint attachments could have a detri
mental effect on the force registered by the load cell.
As the study progressed, there proved to be a problem
which had not and could not have been foreseen.
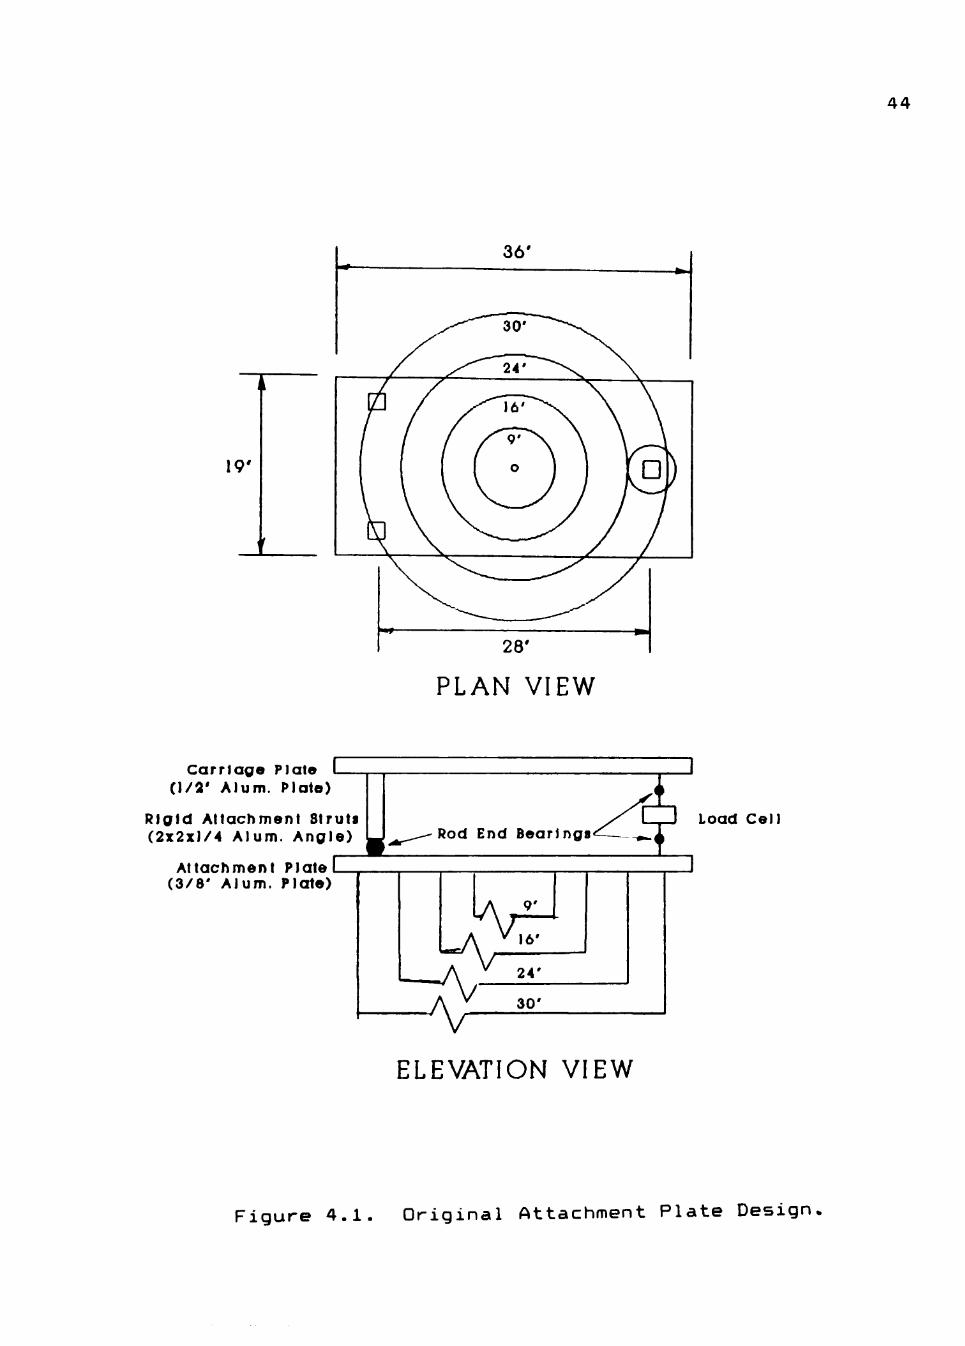
The original attachment plate design, shown in
Figure 4.1, called for the two rigid attachment struts to
be separated from the single load cell attachment by 28
inches with the centerline of the test specimen at mid-
distance between the rigid and load cell joints. The
separation allowed an easy connection of the test specimen
to the attachment plate. Another reason for the 28 inch
separation between the rigid struts and the load cell
joi nt was that the distance from the attachment plate to
the line of action of the drag force was also 28 inches.
This meant that the load cell would be reading the actual
4 4
PLAN VIEW
C a r r i a g e Plate L (1 /2 ' Alum. Plaie)
Rigid Attachment Struts (2x2x1/4 Alum. Angle)
Attachment Plate ( 3 / 8 ' Alum. Plate)
Rod End Bearings^:- _» Load Cel l
9'
16'
24'
30'
ELEVATION VIEW
Figure 4.1. Original Attachment Plate Design.
45
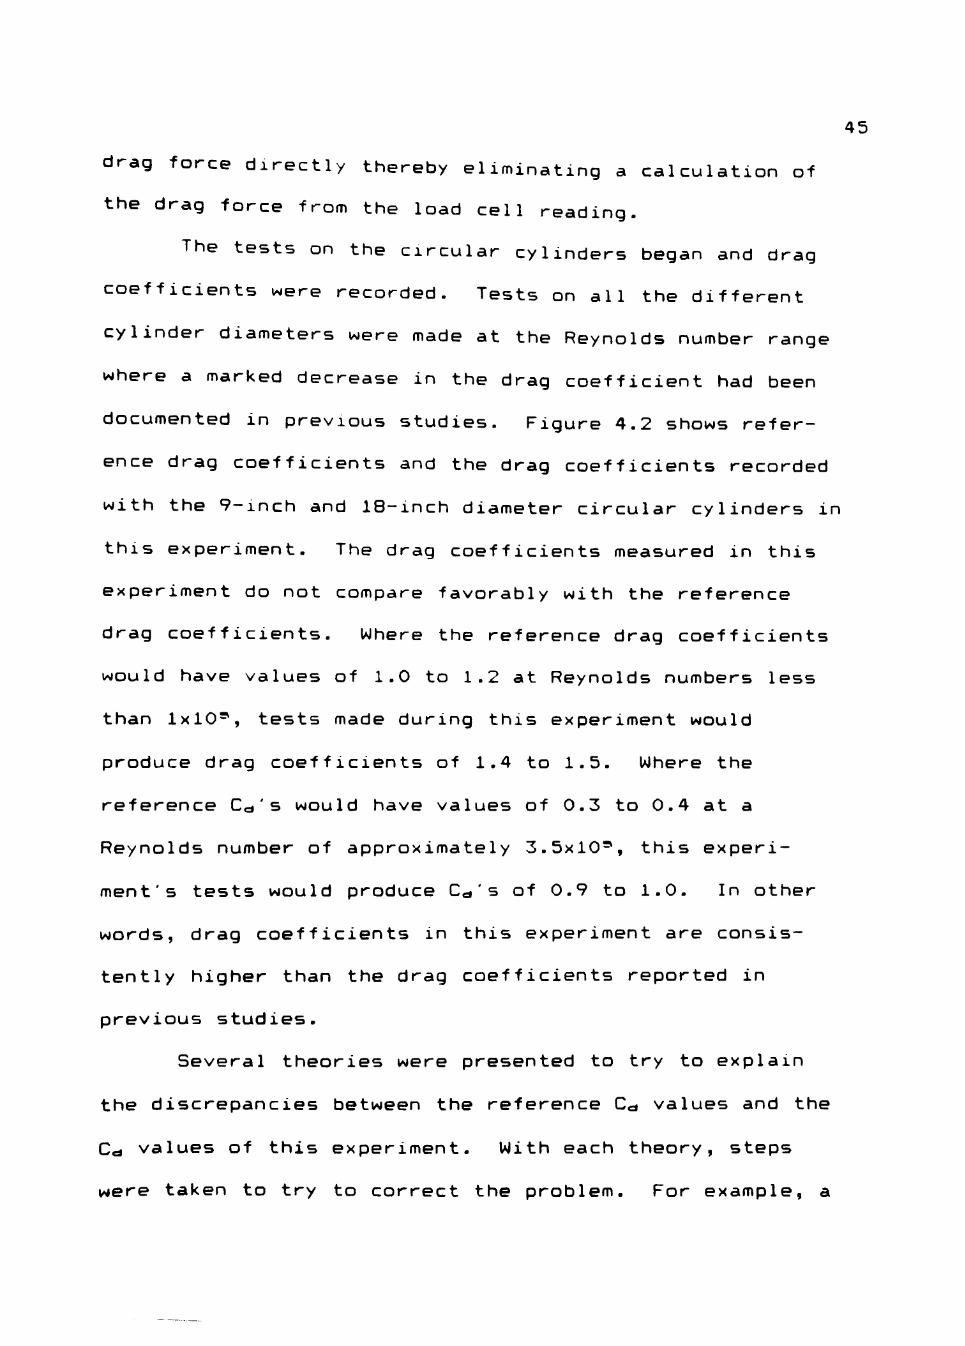
drag force directly thereby eliminating a calculation of
the drag force from the load cell reading.
The tests on the circular cylinders began and drag
coefficients were recorded. Tests on all the different
cylinder diameters were made at the Reynolds number range
where a marked decrease in the drag coefficient had been
documented in previous studies. Figure 4.2 shows refer
ence drag coefficients and the drag coefficients recorded
with the 9-inch and 18-inch diameter circular cylinders in
this experiment. The drag coefficients measured in this
experiment do not compare favorably with the reference
drag coefficients. Where the reference drag coefficients
would have values of 1.0 to 1.2 at Reynolds numbers less
than 1x10*, tests made during this experiment would
produce drag coefficients of 1.4 to 1.5. Where the
reference C^'s would have values of 0.3 to 0.4 at a
Reynolds number of approximately 3.5x10=^, this experi
ment's tests would produce Cc's of 0.9 to 1.0. In other
words, drag coefficients in this experiment are consis
tently higher than the drag coefficients reported in
previous studies.
Several theories were presented to try to explain
the discrepancies between the reference C^ values and the
Cej values of this experiment. With each theory, steps
were taken to try to correct the problem. For example, a
4 6
o o o o o o
o o o o o « 4
d Of
M 0 n B p 2 M
o d • PC
>. T5 3 M
•> •~ ti ^.y
^
& •
u M «« u D w4
x> • ^ 4
+
tud
y)
•> m ••-• n mm
•
& .
Si «« U
a
0 « 4
ts « o>
^^ M • B d
N . ^
M d
P ^ v «
u • r^
X
*^ M • B d
s^ •a
d v ^
rcn
v 4
u « «
cn 05 L CP Q 15
L Q QJ TD Qj c u •H C r-i Qj > L
U QJ H-
L QJ 05 (T
1—«
3 TD
u c L 15 •H
nd
18"
C
ficie
nts
fi
cie
nts
15 f - H-QJ 01
: 0 0 0- u u
•
CN •
QJ L 3 Oi
•H U.
D o a
Q M O O O O • • • • • — U — • d*- OtJ
47
theory of wave action inside the hollow cylinder due to
the cylinder's open bottom was considered. To eliminate
this problem, one of the test specimens had the bottom
opening sealed. To overcome the buoyancy of the specimen
when placed in the water, sand was added to give the
cylinder just enough weight to achieve neutral buoyancy.
However, when new tests were run on the modified cylinder,
there was no appreciable change in the drag coefficient
values of the cylinder.
After several theories were investigated and modifi
cations made to the towing system and test specimens which
produced no change in the data recorded, the decision was
made to test the specimens with the load cell reading a
compressive force. Since the circular cylinder's drag
coefficient is not dependant on the orientation of the
cylinder to the fluid flow, the Cc* values for the tension
and compression tests should be equal. The tests were
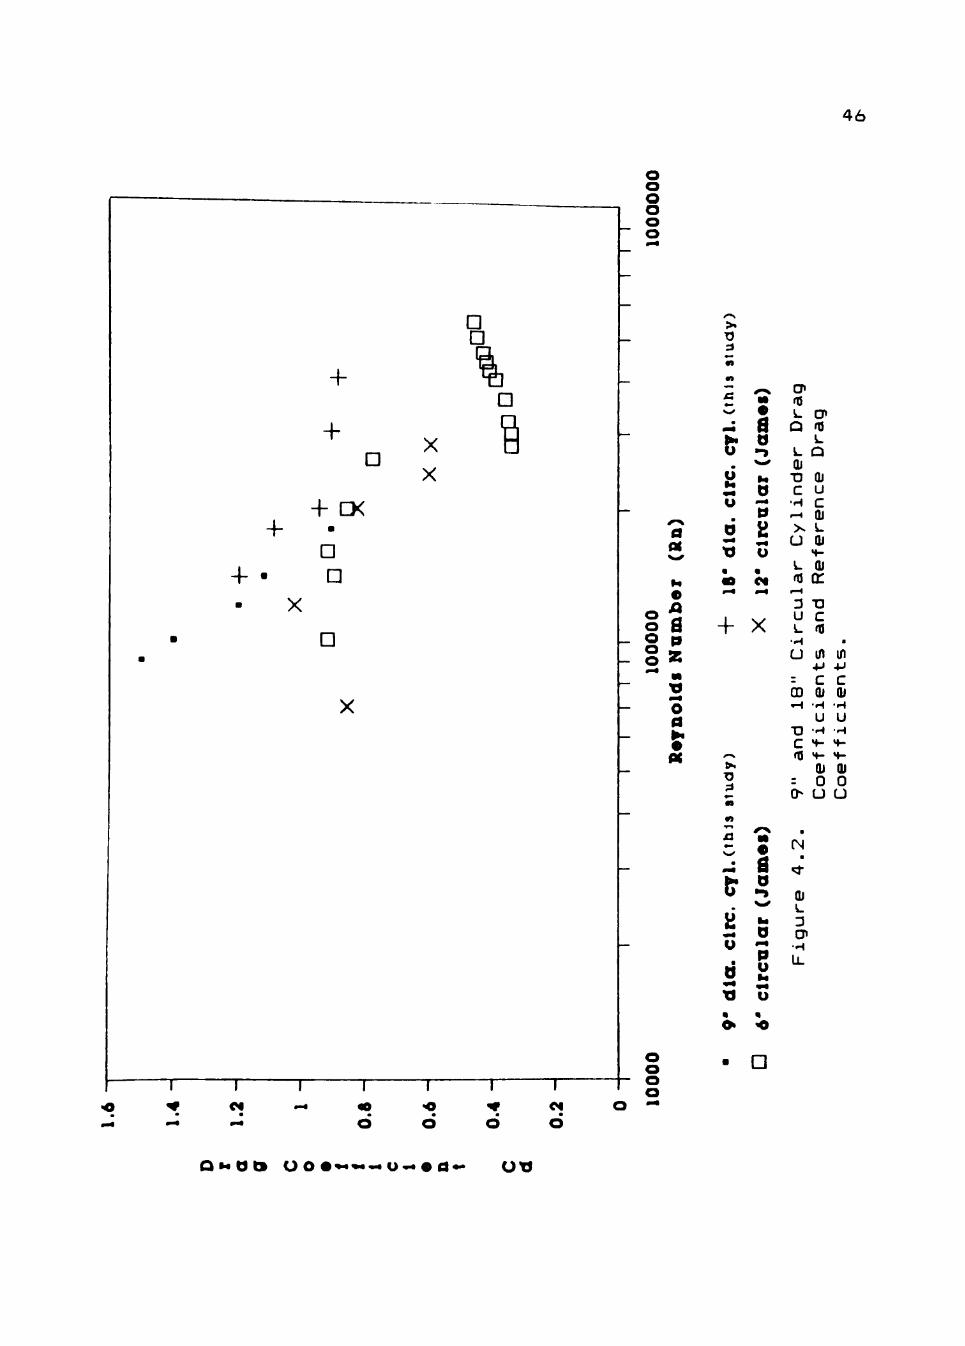
conducted with the 18-inch diameter circular cylinder.
Figure 4.3 shows the drag coefficients for the 18-inch
circular cylinder plotted for the tests with the load cell
in tension and compression. The difference between the
drag coefficients obtained with the load cell reading in
tension and the values with the load cell reading in
compression are easily discernable and not within the
tolerance of experimental error. Drag coefficient values
4 8
o o o a o o
a B o u
2 ^ o
m + o g
§ 2
o d
d o M
d ft
O
d o »4
O o o o
15
Q
QJ T3 C
• H r-i
u a
L in U -M -" c 3 QJ U H L U •H 'H
u •<-= QJ QD 0
V)
QJ L 3 CP
Q M O Q I O O •*•*««« U * « « d*- OX)
49
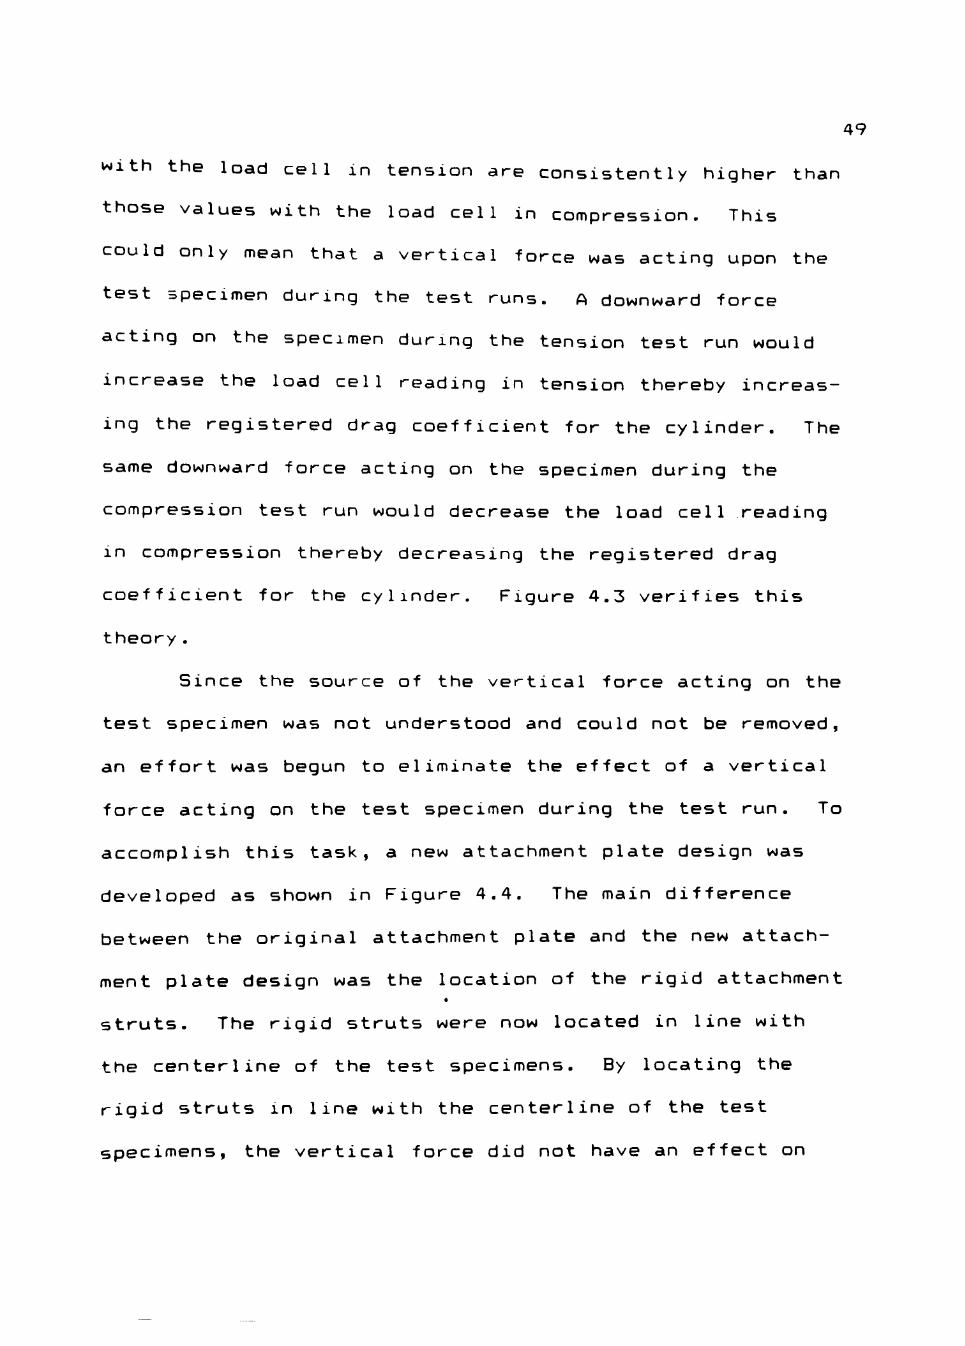
with the load cell in tension are consistently higher than
those values with the load cell in compression. This
could only mean that a vertical force was acting upon the
test specimen during the test runs. A downward force
acting on the specimen during the tension test run would
increase the load cell reading in tension thereby increas
ing the registered drag coefficient for the cylinder. The
same downward force acting on the specimen during the
compression test run would decrease the load cell reading
in compression thereby decreasing the registered drag
coefficient for the cylinder. Figure 4.3 verifies this
theory.
Since the source of the vertical force acting on the
test specimen was not understood and could not be removed,
an effort was begun to eliminate the effect of a vertical
force acting on the test specimen during the test run. To
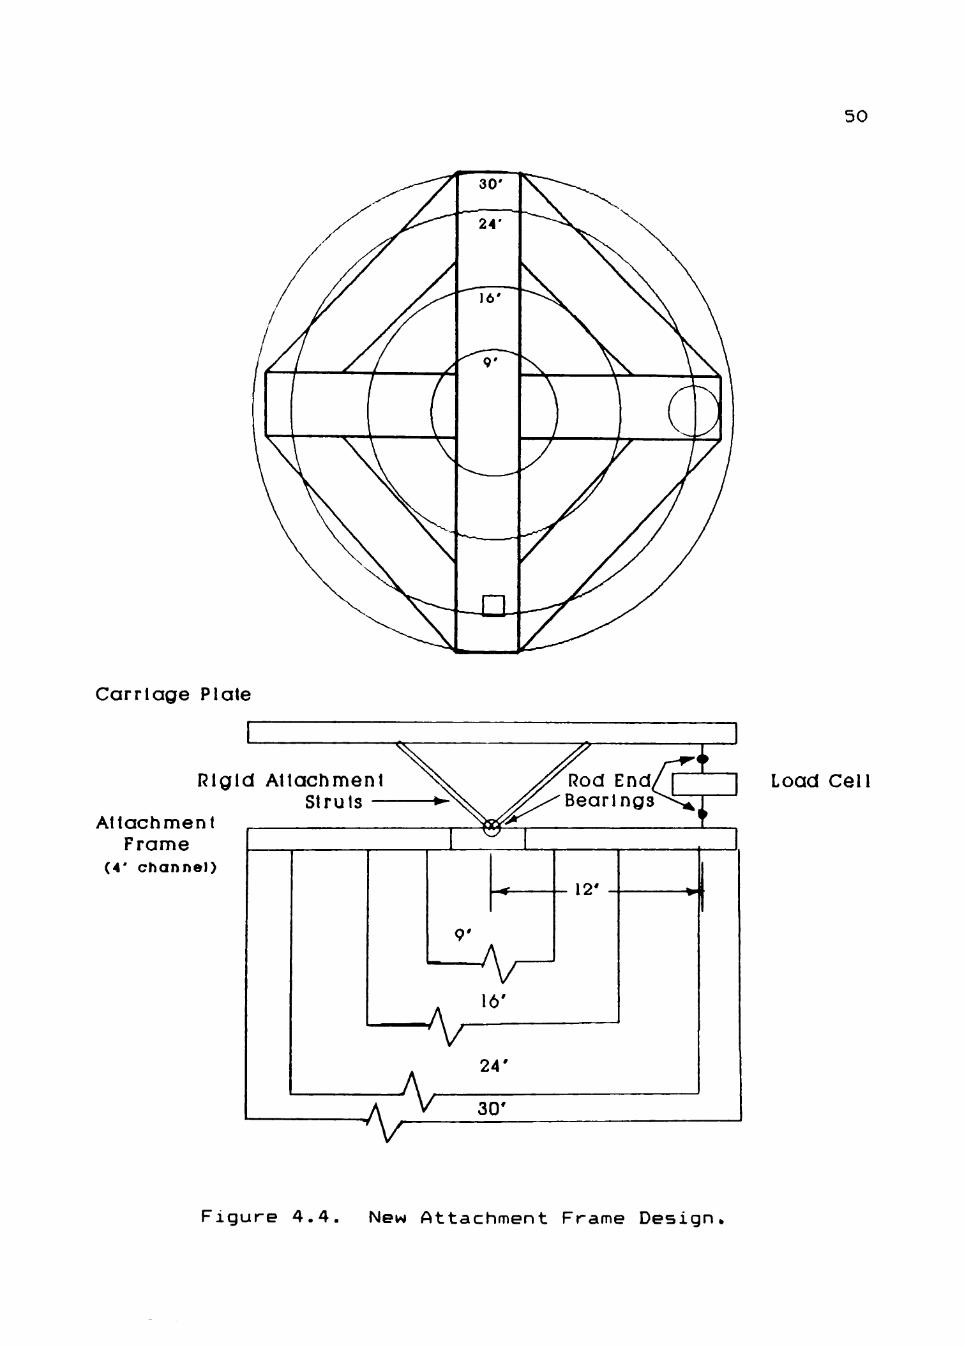
accomplish this task, a new attachment plate design was
developed as shown in Figure 4.4. The main difference
between the original attachment plate and the new attach
ment plate design was the location of the rigid attachment
struts. The rigid struts were now located in line with
the centerline of the test specimens. By locating the
rigid struts in line with the centerline of the test
specimens, the vertical force did not have an effect on
50
Carr iage Plate
Rigid Allachmenl Struts
Attach men t Frame
(4' channel)
9'
Rod E Bean
•nd/F_
V 16'
\
V 24'
30'
12'
Load Cell
Figure 4.4. New Attachment Frame Design,
51
the load cell, if the action of that force was along the
specimen centerline.
Another difference between the two attachment plates
was the material used in their fabrication. The original
attachment plate had been fabricated out of 3/8-inch flat
aluminum plate. As the early tests of the project were
performed, the weakness of the aluminum plate to support
the larger specimens was noticeable. When the need for a
new design of the attachment plate arose, the new "plate"
was fabricated, not out of plate, but out of 4-inch
channel sections. The new attachment "plate" was now a
frame. The new attachment frame was constructed in a
square pattern with crossmembers, one spanning the length
and one the width, from one corner to the opposite corner
(see Figure 4.4).
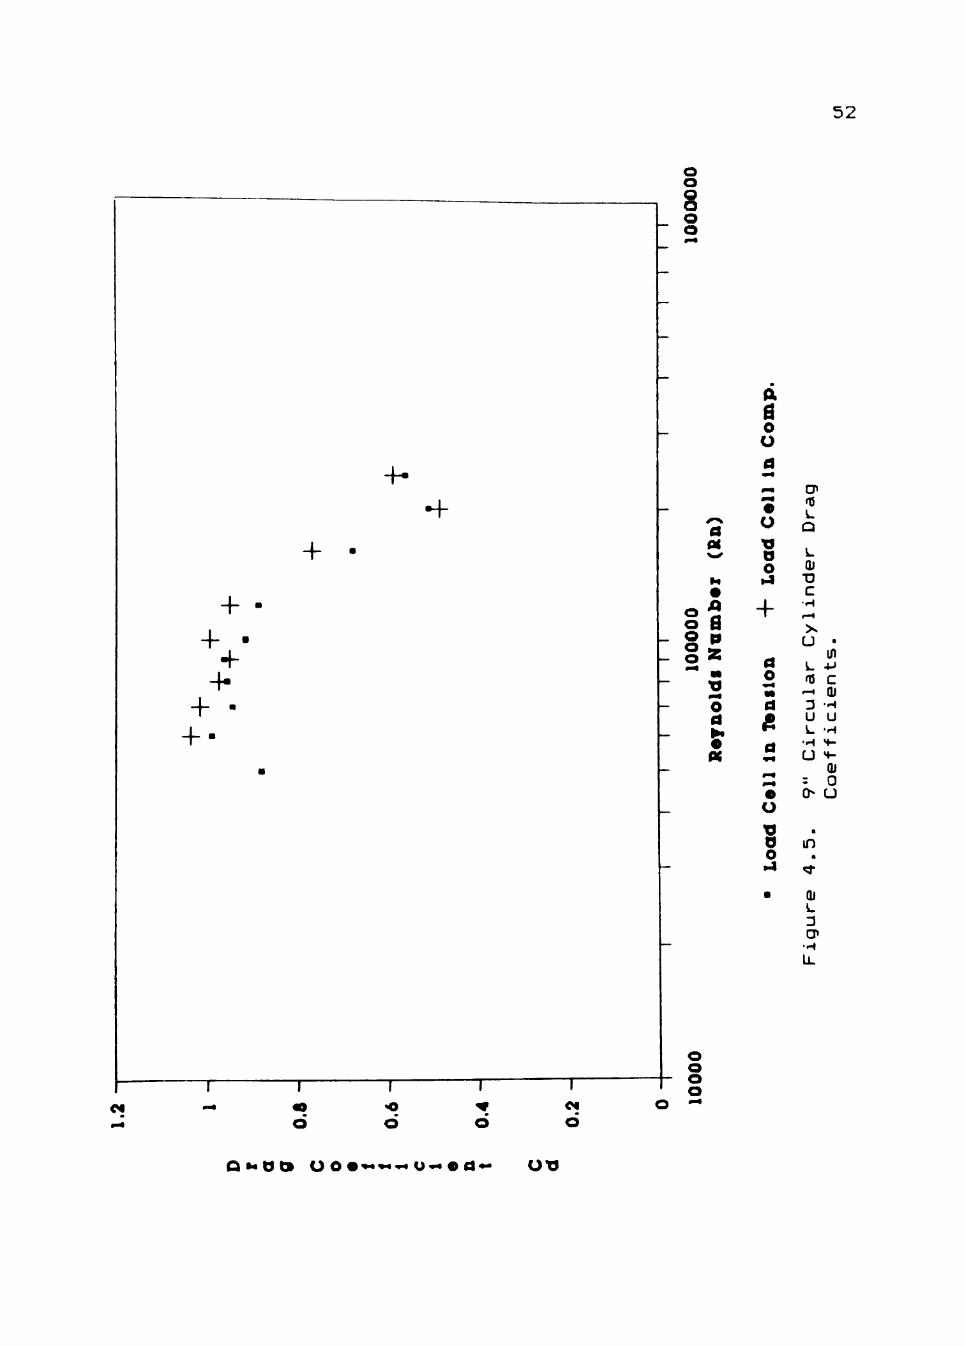
To verify the elimination of the effect of the
vertical force on the drag coefficients by the use of the
new attachment plate design, tests were again performed
subjecting the load cell to both tension and compression
forces using the 9-inch and 16-inch diameter circular
cy linders. Figure 4.5 for the 9-inch and Figure 4.6 for
the 16-inch show the drag coefficients produced during
these tests. The differences between the drag coefficient
V alues produced during the tension test and the
52
0, B o o
o o d o
on 05 L
Q
L QJ
TD C
-I- "
d 2 '0 d
d
o d o >4
u • in
L •*-> C QJ
3 H U U L -H •H f-U ><-
QJ : 0 C> U
in
QJ L 3 CP
•H la.
Q M O O O O ••»«*<*« U « « « d*- OXJ
53
o o o o o o
a B o u
o B § 2
o d
i
o "d d o
+ d o
d ft
o mi
o a o
cn 05 L
Q L QJ
TD C
u •
L in 05 4-1
-< c 3 QJ U H L U
• H " H U f -
= QJ >0 O -H U
QJ L 3
cn •H IL
o»«at> ooo*< on
54
compression test are well within the tolerance of the
experimental procedure and are therefore considered
acceptable.
In comparing the drag coefficient values obtained
for the 9-inch and 16-inch diameters circular cylinders to
the reference drag coefficient values for circular
cylinders from previous studies, a favorable agreement is
seen in Figure 4.7. Allowing for the differences in
surface roughness values between the cylinders and
freestream turbulence in the tests, the C^ values obtained
in this study not only fit the trend of the reference
data, but also matched, within experimental tolerances,
the C«3 values at the various Reynolds numbers tested. The
fit of the experimental data to the reference data,
considered to be good, provides the verification of this
study's experimental procedure.
5 5
o
ox <i
O ^U' o
X -f -
-f < DO 4-
>
+ - DX < -h-
•
1 1
^ ^ m • d
l a da
O O o
o
D - f
1
•o d
1 ^
d
o $
1 C4 C
d
0000
o ~ o ^ 4
• " "
—
—
o o
_ o o
- o
o o
- o o
> - *
^^ d Of
»< •
B p 2 w t) 0 d • «
d o mm M d «
d m^
u m
•
0
00 B o o d ««
•
u •a
•
d o M
d /s d
a u »« mm
u
•
•
* • %
M •
d
.
u • a u
O
M •
B d
•
u mm
u 4
X
•
a a o O d
•
D
05 L CP Q 15
inder
nee Dr
U QJ
L QJ 05 (T
Circu
s and
s.
+ j 4J : C C >0 Qj QJ »H -H -H
u u TD H H C H- H-15 H- 4-
Figure 4.7.
9"
Coe
Coe
O »• d t» O o •«-i«<o« u*« • d * ' OtJ
CHAPTER V
OCTAGONAL CYLINDER RESULTS
The main objective of this study was to obtain drag
coefficients for octagonal cross-section cylinders used
for luminaire supports. To accomplish this objective,
several prerequisites had to be satisfied. As described
in Chapter 3, the first prerequisite completed was the
design of the test system used to tow the specimens. With
that being accomplished, effort could be turned toward the
verification of the experimental procedure as described in
Chapter 4. Finally, with the experimental procedure
verified, the main objective, obtaining drag coefficients
for octagonal cylinders, could be completed. This chapter
presents the results which were obtained along with an
explanation of some problems and their solutions as the
study progressed.
The octagonal cylinder tests were conducted follow
ing the same procedures as used during the circular cylin
der tests. There were, however, different concerns that
influenced the number of tests made with each cylinder.
Unlike the circular cylinder drag coefficient values, the
octagonal cylinder drag coefficient values depend upon the
orientation of the cylinder to the fluid flow. Another
56
57
influence on the drag coefficient values for the octagonal
cylinders is the corner radius ratio, as pointed out in
the study by James (1976). With these two concerns in
mind, the drag coefficient results of the octagonal
cylinders were obtained. They were compared to published
drag coefficient data for octagonal cylinders that most
closely matched the specimens used in this study.
The test specimens used for the octagonal tests were
actual manufacturer supplied sections of octagonal support
poles as used in the field. The four specimens each had
different diameters, as measured by the inscribed circle
of the cross-section, of 9, 16, 24, and 30 inches.
Different diameters were used to allow the tests to span a
Reynolds number range from 5x10^* to 7x10=*. Each cylinder
was tested in both towing directions where the load cell
registered in tension and compression. This procedure
allowed drag coefficients to be obtained during tests when
the load cell was in tension and compression. The tests
were conducted starting with the smallest cylinder and
ending with the largest cylinder.
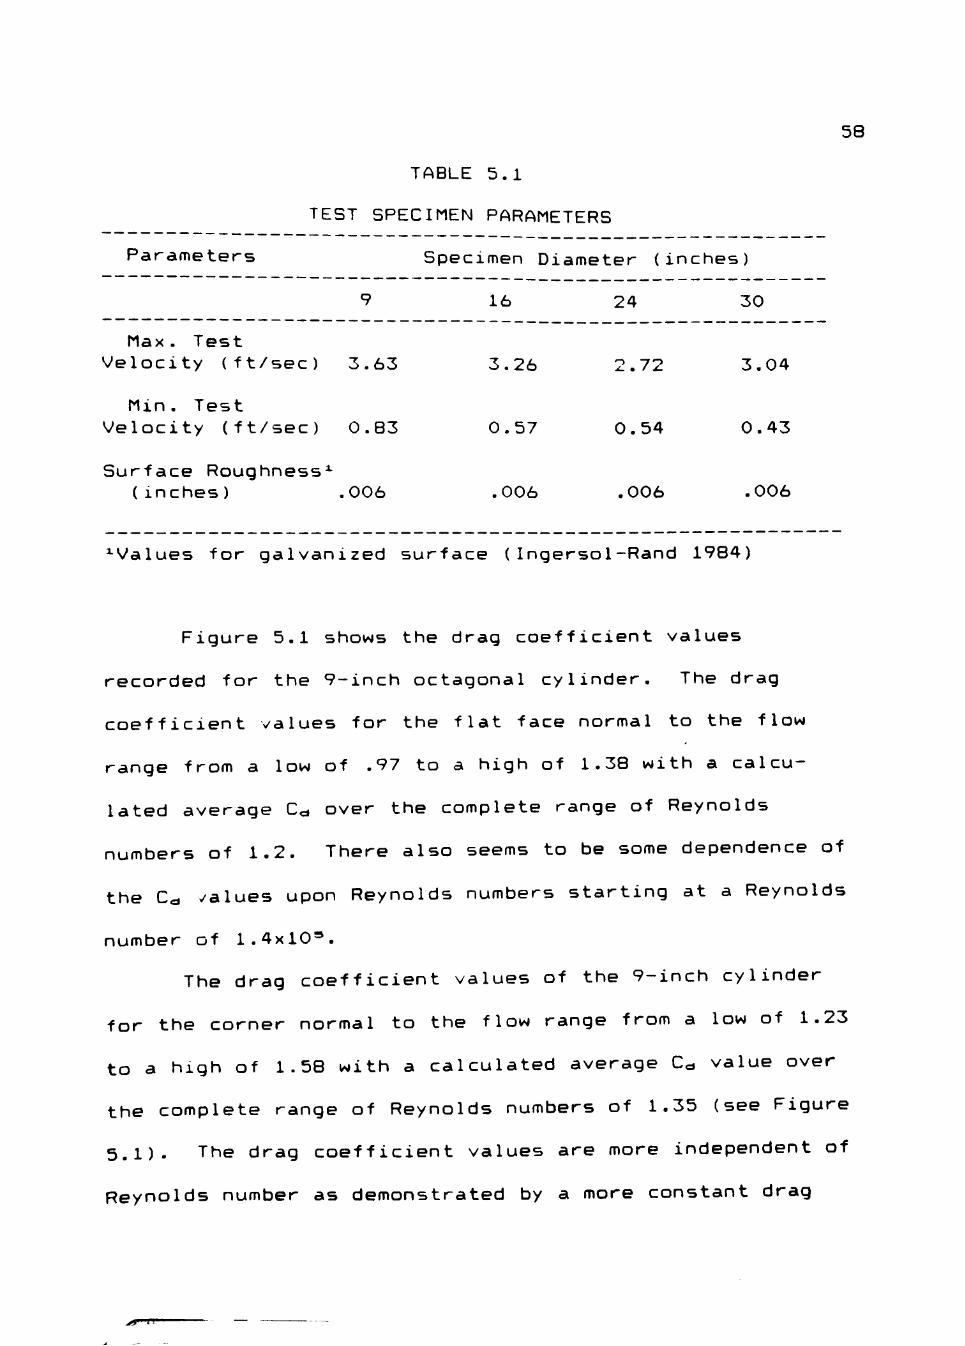
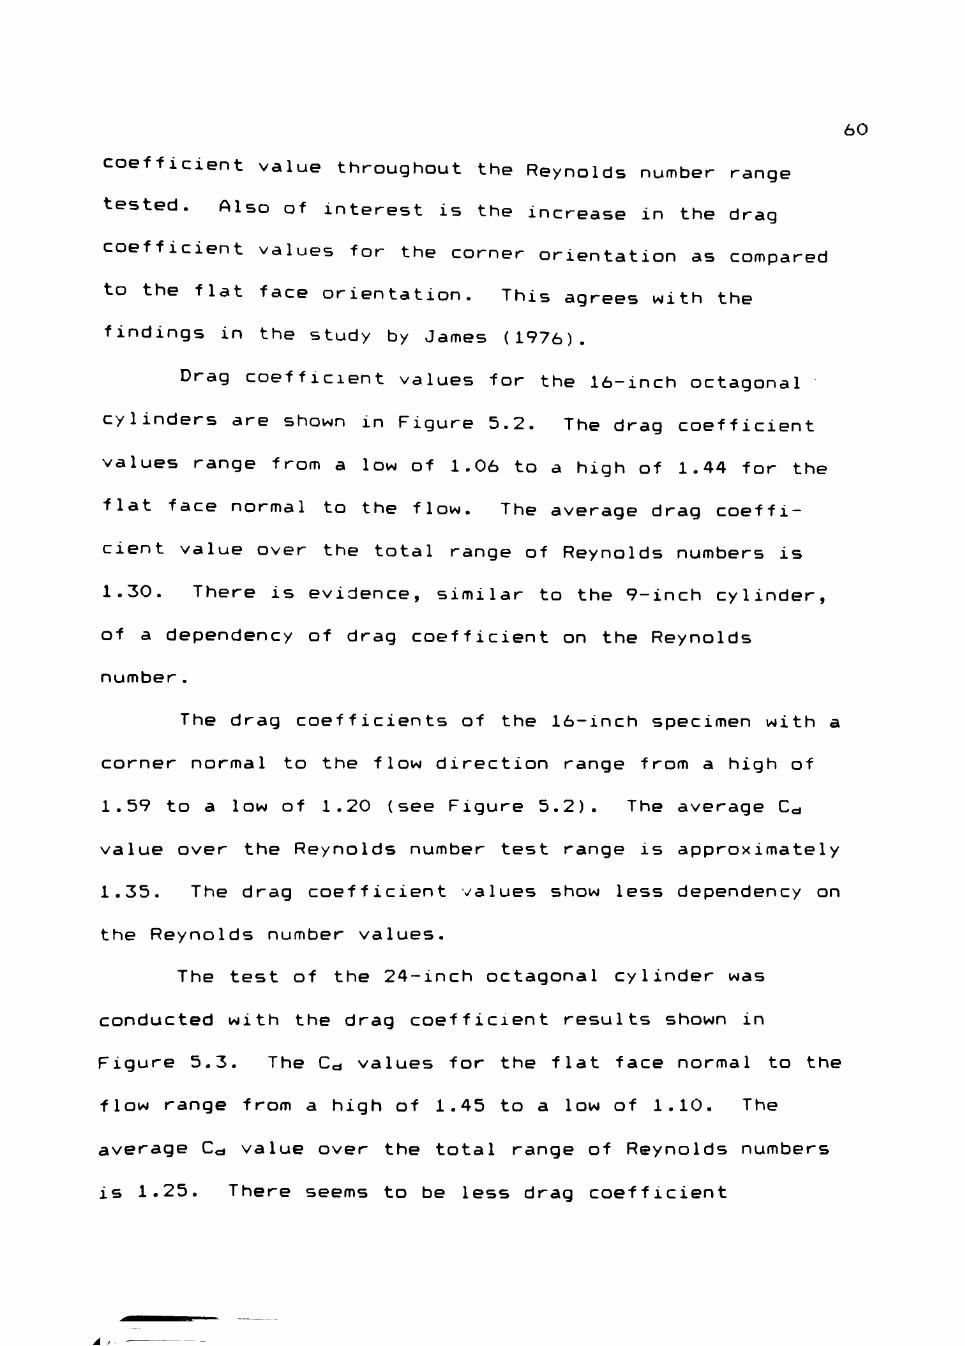
Table 5.1 shows test parameters of the specimens.
The table shows the diameter, the test velocities cor—
re spending to the Reynolds number range, and the surface
roughness of that particular specimen
>*• «i \.>i.-...>.
58
TABLE 5.1
TEST SPECIMEN PARAMETERS
Parameters Specimen Diameter (inches)
16 24 30
Max. Test Velocity (ft/sec) 3.63
Min. Test Velocity (ft/sec) 0.83
Surface Roughness^ (inches) .006
3.26
0.57
.006
.72
0.54
.006
3.04
0.43
.006
^Values for galvanized surface ( Ingersol-Rand 1984)
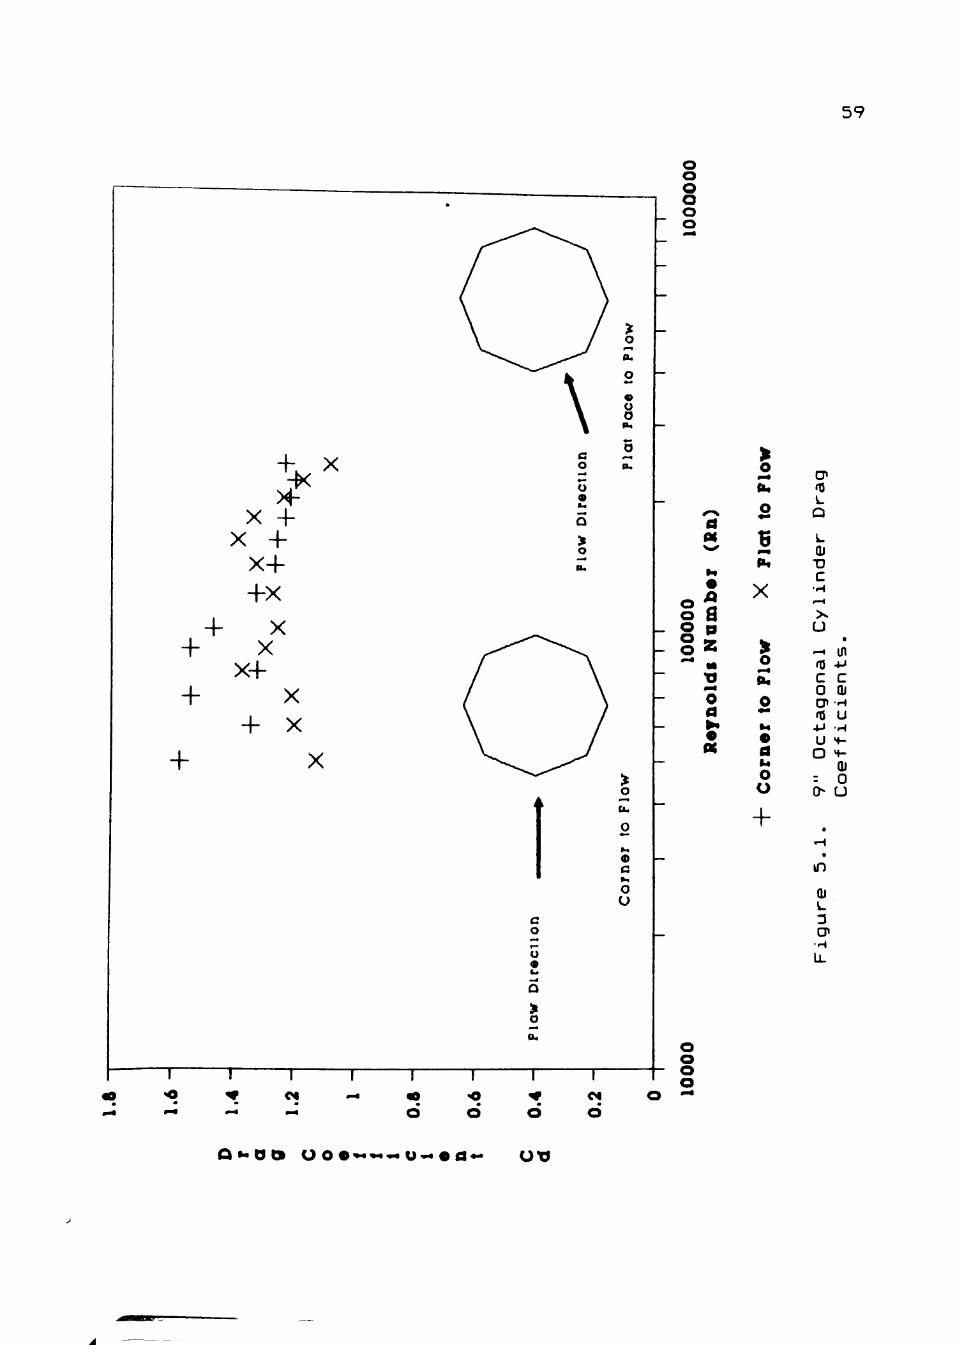
Figure 5.1 shows the drag coefficient values
rec orded for the 9-inch octagonal cylinder. The drag
coefficient values for the flat face normal to the flow
range from a low of .97 to a high of 1.38 with a calcu
lated average Cc over the complete range of Reynolds
numbers of 1.2. There also seems to be some dependence of
the C<d values upon Reynolds numbers starting at a Reynolds
number of 1.4x10®.
The drag coefficient values of the 9-inch cylinder
for the corner normal to the flow range from a low of 1.23
to a high of 1.58 with a calculated average Cc value over
the complete range of Reynolds numbers of 1.35 (see Figure
5.1). The drag coefficient values are more independent of
Reynolds number as demonstrated by a more constant drag
^f^.
5 9
o mm
a. o B
X
o
o mi,
M
d O
o 4-
cn 05 L
Q
L QJ TD C
u ^ in 15 -M
c c 0 QJ O* •'^ 05 U
U H-O 4-
QJ : 0 C> U
in
QJ L 3 cn •H li_
O »« o t> o o e^**-* u<^ • d** U-d
60
coefficient value throughout the Reynolds number range
tested. Also of interest is the increase in the drag
coefficient values for the corner orientation as compared
to the flat face orientation. This agrees with the
findings in the study by James (1976).
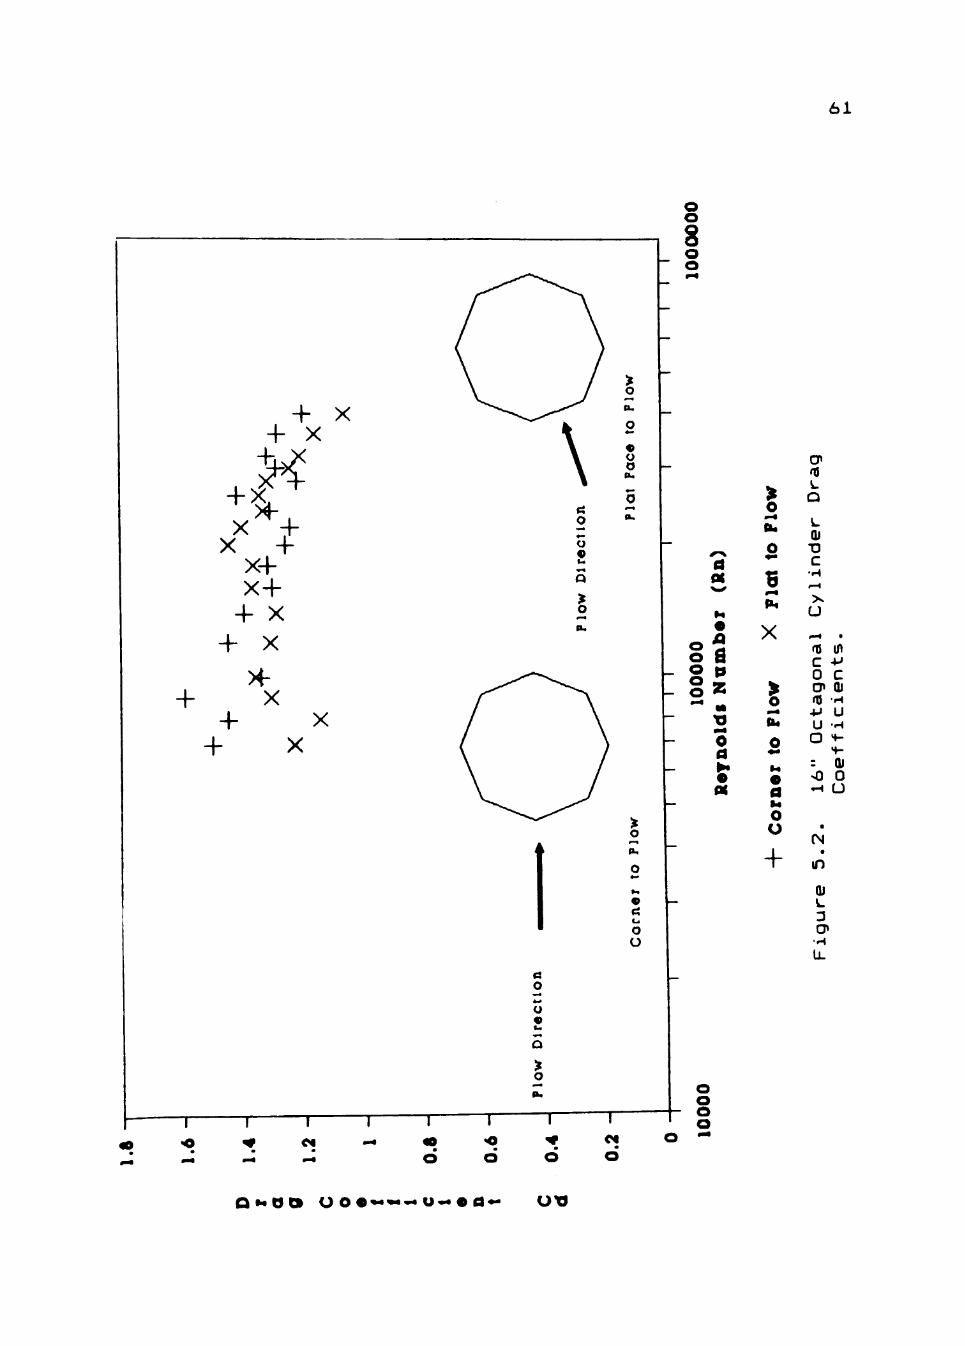
Drag coefficient values for the 16-inch octagonal
cylinders are shown in Figure 5.2. The drag coefficient
values range from a low of 1.06 to a high of 1.44 for the
flat face normal to the flow. The average drag coeffi
cient value over the total range of Reynolds numbers is
1.30. There is evidence, similar to the 9-inch cylinder,
of a dependency of drag coefficient on the Reynolds
number.
The drag coefficients of the 16-inch specimen with a
corner normal to the flow direction range from a high of
1.59 to a low of 1.20 (see Figure 5.2). The average Cd
value over the Reynolds number test range is approximately
1.35. The drag coefficient values show less dependency on
the Reynolds number values.
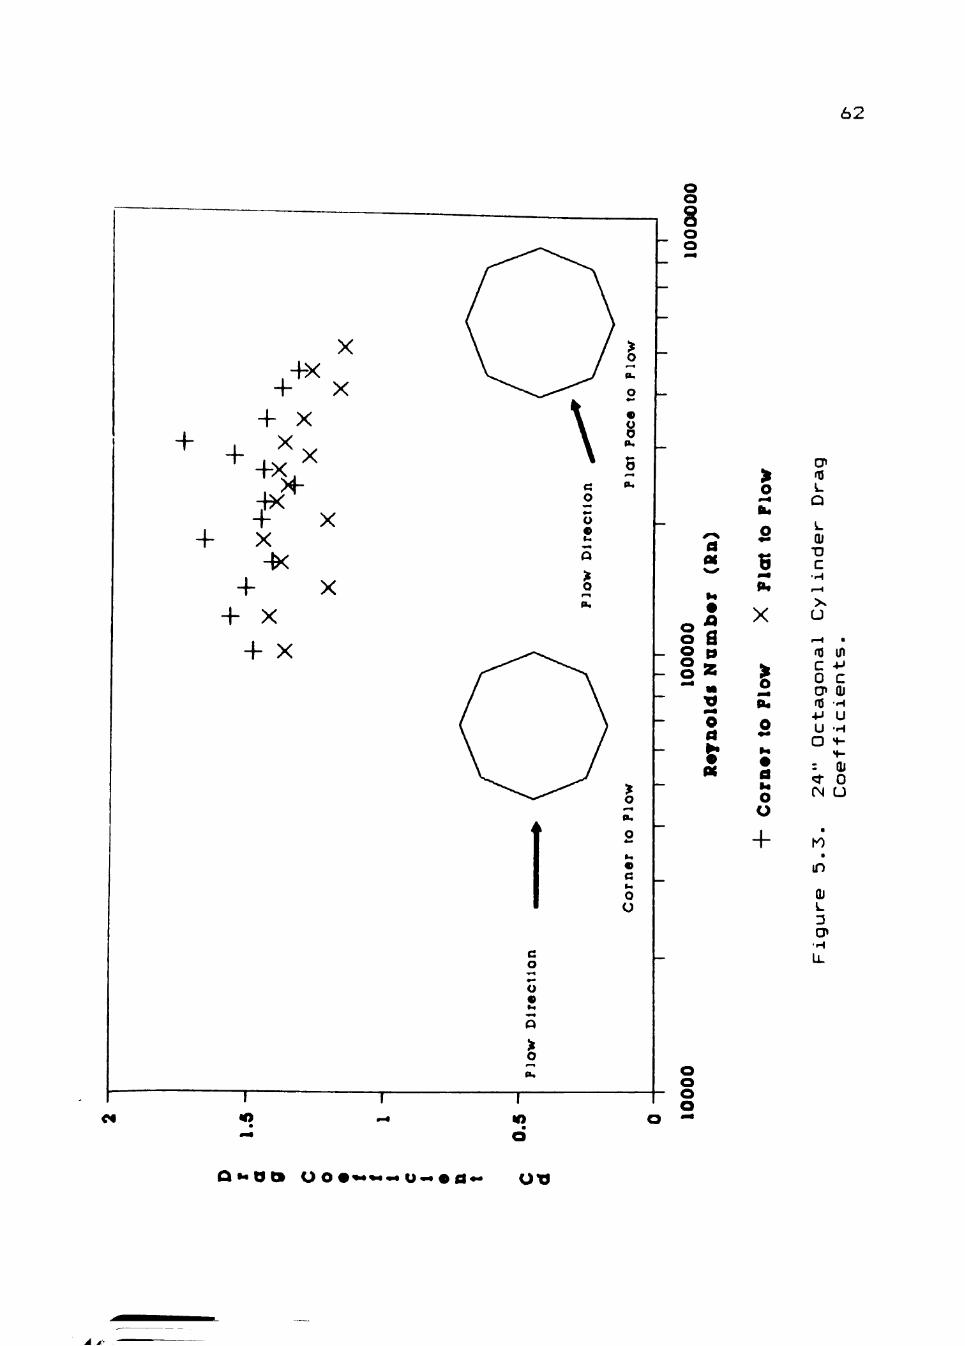
The test of the 24-inch octagonal cylinder was
conducted with the drag coefficient results shown in
Figure 5.3. The Ccj values for the flat face normal to the
flow range from a high of 1.45 to a low of 1.10. The
average C^ value over the total range of Reynolds numbers
is 1.25. There seems to be less drag coefficient
6 1
O
fiu
O
B
X
I o
o o
+
CP 05
Q
V. QJ
13 C
u
15 in c -M 0 c • > Qj 15 H •M U U H
o •<-: QJ sQ O
CN
m
QJ
3
•H U .
Q t a Q Q l U O • « • * • * « U«« • d * - OXJ
6 2
o o 8 O o
d
o B
o d i PC
o
o
B p<
X
I O
d
o o
15 L
o L QJ
TD C
u
05 C 0 CP 15 4J U O
: <t CN
in • ^
c QJ •H
u •H 4 -<•-QJ 0 U
in
QJ i -3 CD» •H
O o o
Q * * d t > O O •«•«<•« u<-« A d * - OtJ
0 ^
63
dependency on Reynolds number than exhibited in the
smaller octagonal cylinders in the flat face orientation.
Drag coefficient results for the 24-inch specimen
with a corner normal to the flow direction range from a
high of 1.74 to a low of 1.28 (see Figure 5.3) with a
calculated average Ca value over the complete range of
Reynolds numbers of 1.50. The data collected has more
scatter with no definite trend or pattern visible. The
drag coefficient values show no dependency of C^ on
Reynolds number.
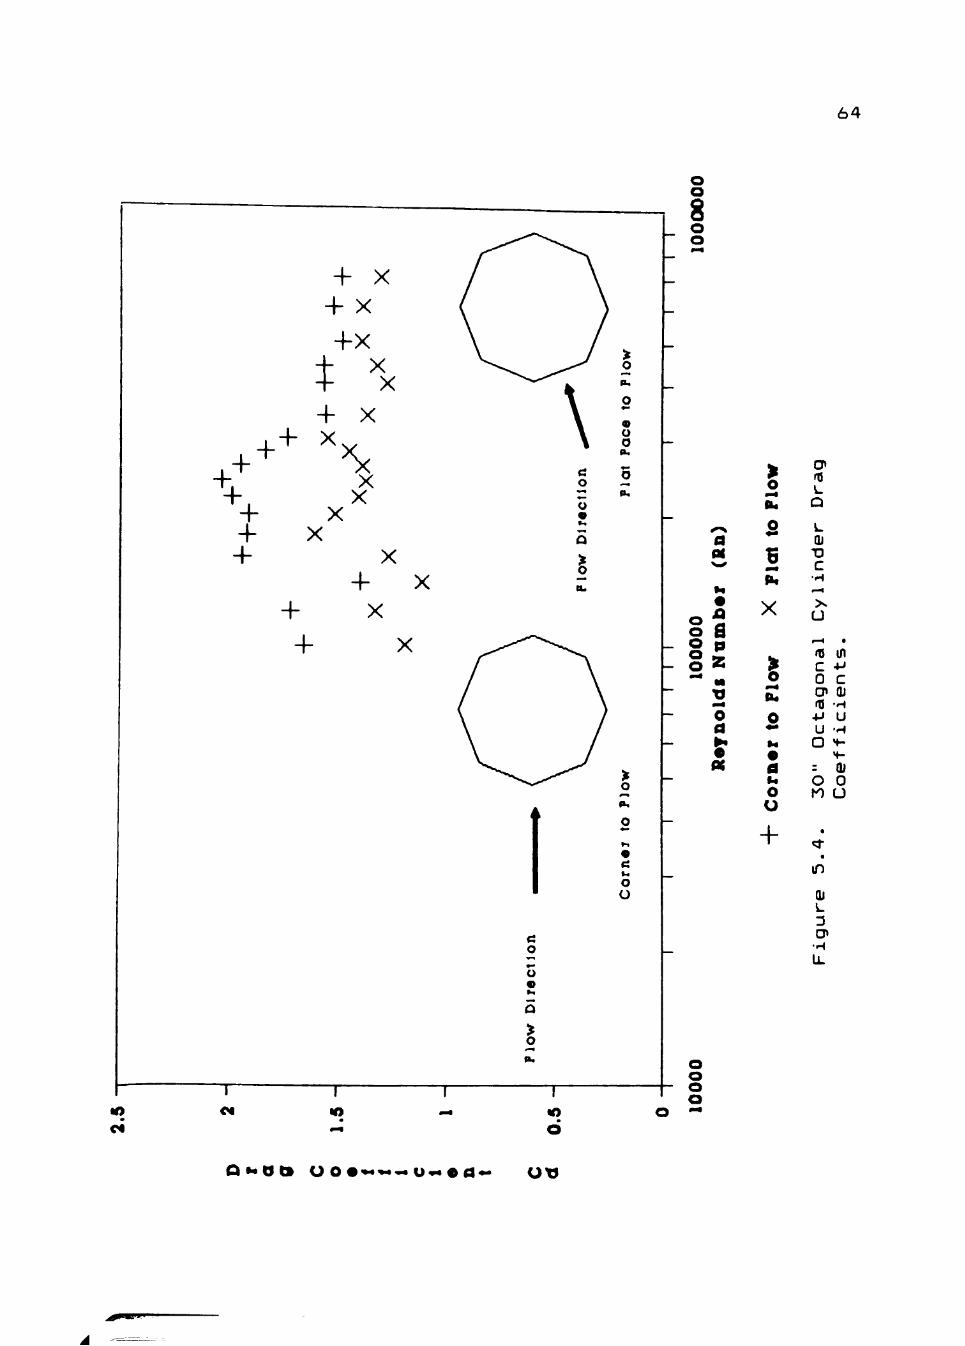
The 30-inch octagonal cylinder drag coefficient
results are shown in Figure 5.4. The Cd values for a flat
face normal to the flow range from a low of 1.02 to a high
of 1.61. The average C^ value over the complete Reynolds
number range is 1.30. The data shows more scatter than
previous tests with no trend or pattern visible. Drag
coefficient dependency on Reynolds number is not apparent
with these tests.
The drag coefficients obtained for the 30-inch
specimen with an orientation of a corner normal to the
flow range from a low of 1.40 to a high of 2.25. The
average Ca value over the total Reynolds number range of
the test is 1.77. The drag coefficient data obtained in
this test also exhibits more dependence upon the Reynolds
number.
6 4
o o 8 o o
d
*m
o d
o a. o
B
X
g BU
o
d u O U
+
cn 15 L
Q L QJ
TD C
•H
05 in c +J 0 c CP QJ 05 - H
•M U U - H
O f -
: QJ O O K) U
in
Qj L 3
o o o o
Q * « d t > O o •<»««-i<« u«« • d * - OTJ
65
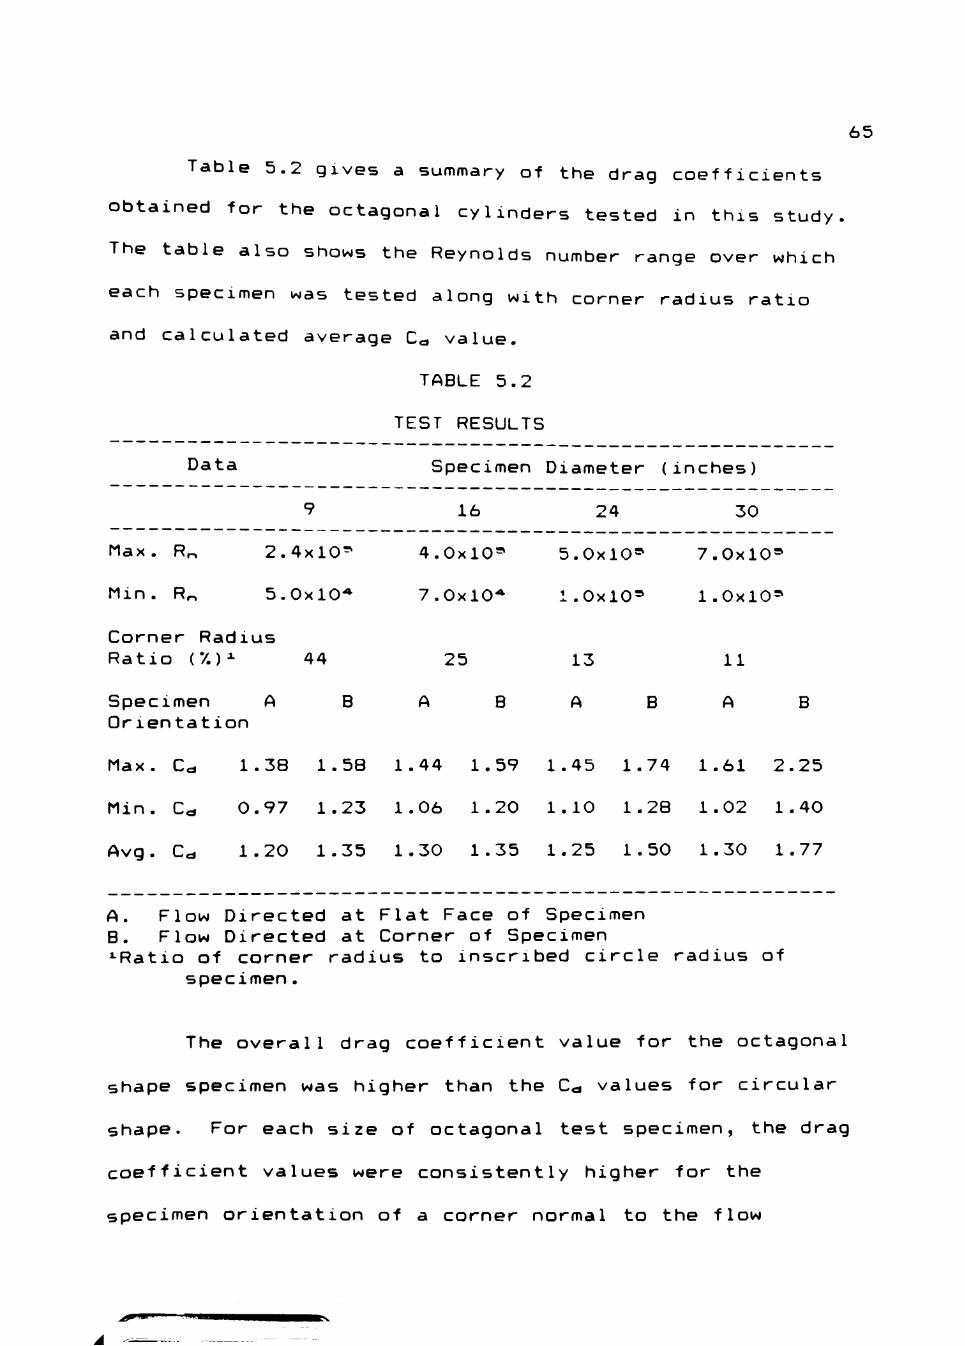
Table 5.2 gives a summary of the drag coefficients
obtained for the octagonal cylinders tested in this study.
The table also shows the Reynolds number range over which
each specimen was tested along with corner radius ratio
and calculated average C^ value.
TABLE 5.2
TEST RESULTS
Data Specimen Diameter (inches)
16 24 30
Max . R,., 2.4x10=^ 4.0x10' 5.0x10' 7.0xl0»
Min. Rr, 5.0x10* 7.0x10* 1.0x10' 1.0x10=
Corner Radius Ratio C/.)^ 44 25 13 11
Specimen A Orientation
B A B B B
Max . C< 1.38 1.58 1.44 1.59 1.45 1.74 1.61 2.25
Min. C< 0.97 1.23 1.06 1.20 1.10 1.28 1.02 1.40
Avg . C< 1.20 1.35 1.30 1.35 1.25 1.50 1.30 1.77
A. Flow Directed at Flat Face of Specimen B. Flow Directed at Corner of Specimen ^Ratio of corner radius to inscribed circle radius of
specimen.
The overall drag coefficient value for the octagonal
shape specimen was higher than the C^ values for circular
shape. For each size of octagonal test specimen, the drag
coefficient values were consistently higher for the
specimen orientation of a corner normal to the flow
66
direction than for the flat face normal to flow direction.
As the size of the test specimen increased, the scatter of
the data also increased. The increased scatter was caused
by not being able to completely achieve a steady state of
fluid flow around the larger diameter cylinders. With the
smaller diameter cylinders, the size of the tow tank
allowed a constant speed test distance between 25 and 30
diameters. These distances allowed the fluid flow around
the cylinder to reach a steady state flow. However, with
the larger cylinders, the test distance translated to
between 10 to 12 diameters. The fluid flow around the
cylinder did not reach a steady state flow during every
test run. The lack of a steady state flow resulted in the
increased scatter of the data collected.
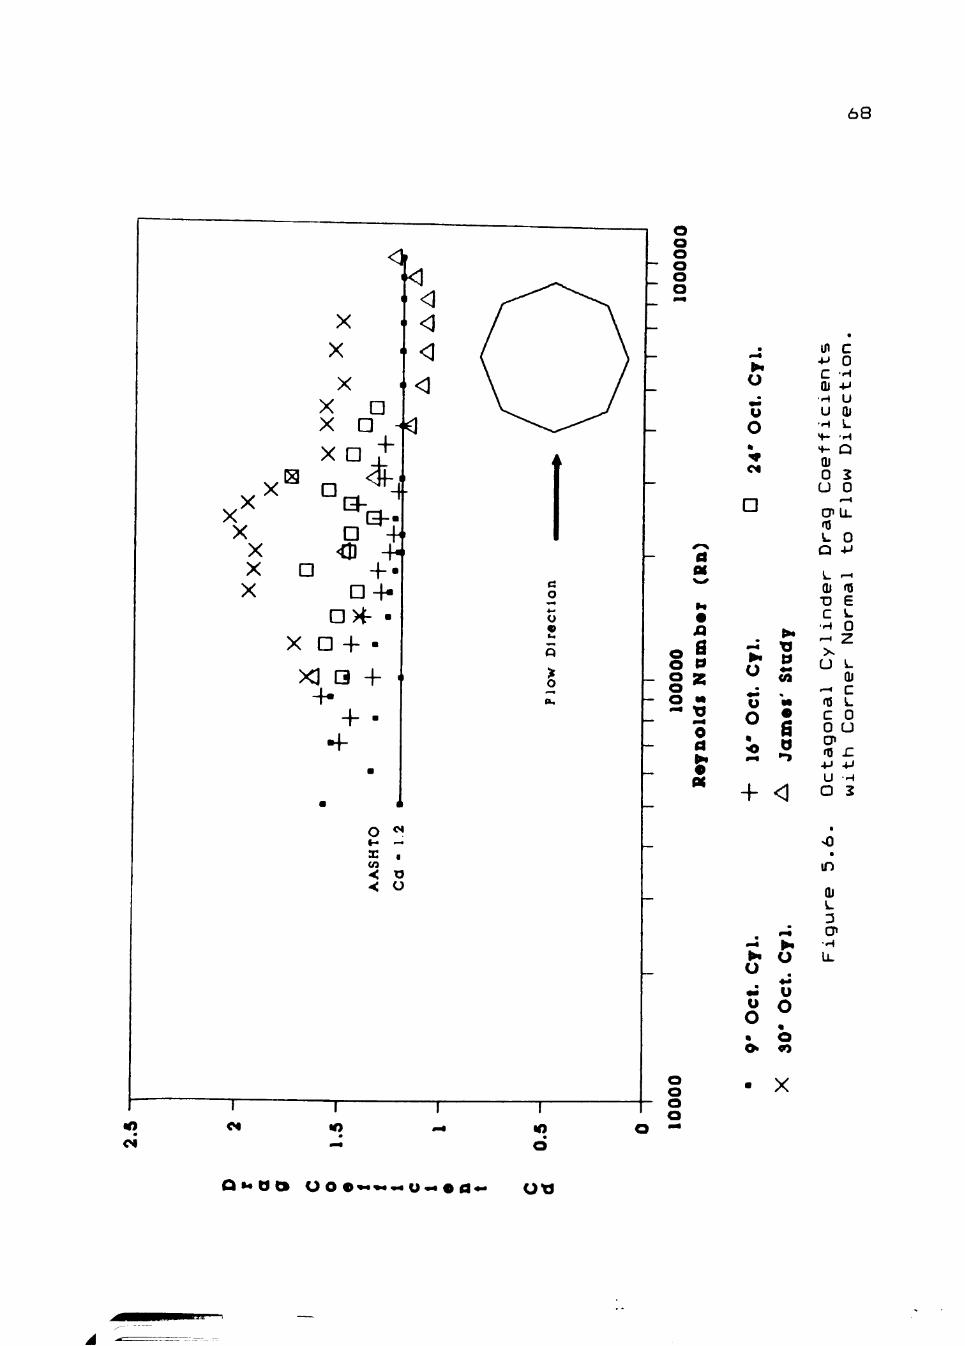
Comparison of Results. To try to better understand
the results obtained in this study. Figures 5.5 and 5.6
show results of this study, results from a previous study
by James (1976), and the values recommended by AASHTO.
Figures 5.5 and 5.6 show the drag coefficient values for
octagonal cylinders with a flat face normal to the flow
and a corner normal to the flow, respectively. As can be
seen in the graphs, the majority of drag coefficient
values obtained in this study lie above the AASHTO
recommended value of 1.20. Average of the experimentally
measured values of C^ is approximately 25*/. higher than the

6 7
O o o o o o
0000
o
^^ d « ^^
*m • A B p
M t ) o d • •
m^ K
N • tJ d
m0 mm
•
u • ^ c«
D
•4
• t l d
0 • «
+
>•
Stn
d
•
a d ^
0
in 4J
c QJ • H
u •H -•- 2 «H 0
0 L. U
0 CP -P 15 i_ ^ 0 15
E
QJ 0 T3 Z c
Cy
li
Fa
ce
r^ 4J 05 15 C ^ 0 Li. CP 05 r
U -H 0 2
•
c 0
4J
u QJ
Dir
- • >•
« o
in •
in
QJ L 3 cn •H LL
O
o
Q »« d t» U O •*«*<'-« u«« • d * - OtJ
6 8
O o o o o o
000
o o
o o o o
d « x.^
•
B p 2 M
tJ 0 d
i «
• 00%
>i o ^
u O k
•^ Ct
D
mm
>•
o
o •
+
•^ >•
o • • u o « <h
m
>* n p
M • a d
<3
r ^
>•
o *m
u o % O «
X
in c -M 0 C H Qt -P H U U QJ •H L
"H Q QJ 0 2 U 0
cnu. 05 u 0 Q -P
L ^ Qj 05 TD E C i .
Cy
li
er
No
— C 05 L C 0 0 U CP 05 IZ -P -P
ure
5
.6.
Oc w
i
O' • H
l i .
Q M Q O O O •<>««•«« U « « 9 0 « . O t J
69
value recommended by AASHTO. The cumulative results in
Figures 5.3 and 5.4 also show that there is little
dependence of Cd values on the Reynolds number.
CHAPTER VI
CONCLUSIONS AND RECOMMENDATIONS
The results of this research project have provided
additional information that can be useful for the design
of octagonal luminaire supports. The research has also
demonstrated the ability of tow tank experimental proce
dures to produce drag coefficient values for circular
cylinders that agree with drag coefficient values produced
using wind tunnel procedures. This agreement between the
Cd values for the tow tank procedure and the Cd values for
the wind tunnel procedure open new doors for the testing
of structural shapes that previously might have been
limited to the wind tunnel.
Information, both of interest and importance,
gathered during this project have been used to develop the
following conclusions:
1. The tow tank experimental procedure can be
a viable and effective procedure for
determining drag coefficients for luminaire
poles.
2. Flow normal to a corner of the octagonal
cylinder produced drag coefficient values
of 107. to 207. higher than that for flow
normal to a flat face.
70
71
3. Drag coefficient values for octagonal
shapes did not exhibit dependency on the
Reynolds number as shown in previous
studies. The drag coefficients remained in
the range of 1.2 to 1.7 over the range of
Reynolds numbers of from 5x10* to 7x10=^.
4. The corner radius ratio in the range of 11
to 44 percent did not have an effect on the
drag coefficient values obtained.
5. For the octagonal cylinders tested with the
corner normal to flow direction orienta
tion, the drag coefficient had an average
value of 1.5. This value is 25"/. higher
than the one recommended in the current
AASHTO standard.
During the course of this project, several recommen
dations were formulated which would have a beneficial
effect on the future research. These recommendations are
based on many hours of work on this project by the author.
The recommendations are as follows:
1. The use of pressure measurements along and
around the cylinder would provide addition
al data to be used to calculate drag
coefficients to compare to existing values.
72
The tow tank enhances the ability for flow
visualization. Flow visualization could be
accomplished with injection of dye into the
flow and would greatly increase the under
standing of flow around various structural
support shapes.
With several of the towing speeds used
during this project, the tow tank length
limited the length of the test run. With a
new, longer tow tank in the final stages at
Texas Tech, the effect of the limited test
run on the data collected could be elimi
nated .
Provisions should be made for a system to
dampen the wave action of the water surface
of the tow tank. Having to wait for the
water surface to calm between test runs
added considerable time to the total
research project.
^^xw-
REFERENCES
!• AASHTO Subcommittee on Bridges and Structures, "Standard Specifications for Structural Supports for Highway Signs, Luminaires, and Traffic Signals," Washington, D.C., 1975.
2. Achenbach, E., "Distribution of Local Pressure and Skin Friction around a Circular Cylinder in Cross-flow up to Re = 5x10-^," J. Fluid Mech. . Vol. 34, pp. 625-640, 1968.
3. Achenbach, E., "Influence of Surface Roughness on the Cross-flow around a Circular Cylinder," J. Fluid Mech.. Vol. 46, part 2, pp. 321-335, 1971.
4. Allen, H.J. and Vincenti, W.G., "Wall Interference in a Two-dimensional-flow Wind Tunnel, with Consideration of the Effect of Compressibility," National Aeronautics and Space Administration, Washington, D.C., Tech. Report, NACA TR 782, 1944.
5. Almosnino, D. and McAlister, K.W., "Water Tunnel Study of Transition Flow around Circular Cylinders," Ames Research Center, National Aeronautics and Space Administration, Moffett Field, California, 1984.
6. Bearman, P.W., "The Flow around a Circular Cylinder in the Critical Reynolds Number Regime," NPL Aero Report 1257, 1968.
7. Page, A. and Warsap, J.H., "The Effects of Turbulence and Surface Roughness on the Drag of a Circular Cylinder," Aeronautic Research Committee, London, England, Report and Memo., ARC R&M 1283, 1930.
8. Fox, R.W. and McDonald, A.T., Introduction to Fluid Mechanics. John Wiley and Sons, pg. 463, 1985.
9. Glauert, H., "Wind Tunnel Interference on Wings, Bodies, and Airscrews," Aeronautic Research Committee, London, England, Report and Memo., ARC R&M 1566, 1933.
/i.*.:
74
10. Ingersol1-Rand Company, Cameron Hydraulic Handbook . Sixteenth Edition, Third Printing, Wood-cliff Lake, N.J., pg. 3-5, 1984.11.
11. James, W.D., "Effects of Reynolds number and Corner Radius on Two-dimensional Flow around Octagonal, Dodecagonal, and Hexdecagonal Cylinders," Engineering Research Institute, Iowa State University, 1976.
12. Jorgensen, L.H., "Prediction of Static Aerodynamic Characteristics for Slender Bodies alone and with Lifting Surfaces to very high Angles of Attack," National Aeronautics and Space Administration, Washington, D.C., Tech. Memo., NASA TMX-73, 123, June 1976.
13. Maskell, E.C., "A Theory of the Blockage Effects on Bluff Bodies and Stalled Wings in a Closed Wind Tunnel," Aeronautical Research Council, Ministry of Aviation, London, England, Report and Memo., ARC R&M 3400, 1963.
14. Roshko, A., "Experiments on the Flow past a Circular Cylinder at a very high Reynolds Number," J . Fluid Mech., Vol. 10, pp. 345-356, 1961.
15. Schewe, G., "On the Force Fluctuations Acting on a Circular Cylinder in Cross-flow from Sub-critical up to Transcritical Reynolds Numbers," J. Fluid Mech.. Vol. 133, pp. 265-285, 1983.
16. Taylor, G.J., "Pressure Distribution around a Cylinder," Tech. Report, Advisor Committee for Aeronamities, 1915.
17. Von Karman, Th. and Rubach, H., "Uber den Mechanismus des Flussigkeits- und Luftwider-standes," Phys. Zeitschrift XIII, 1912.
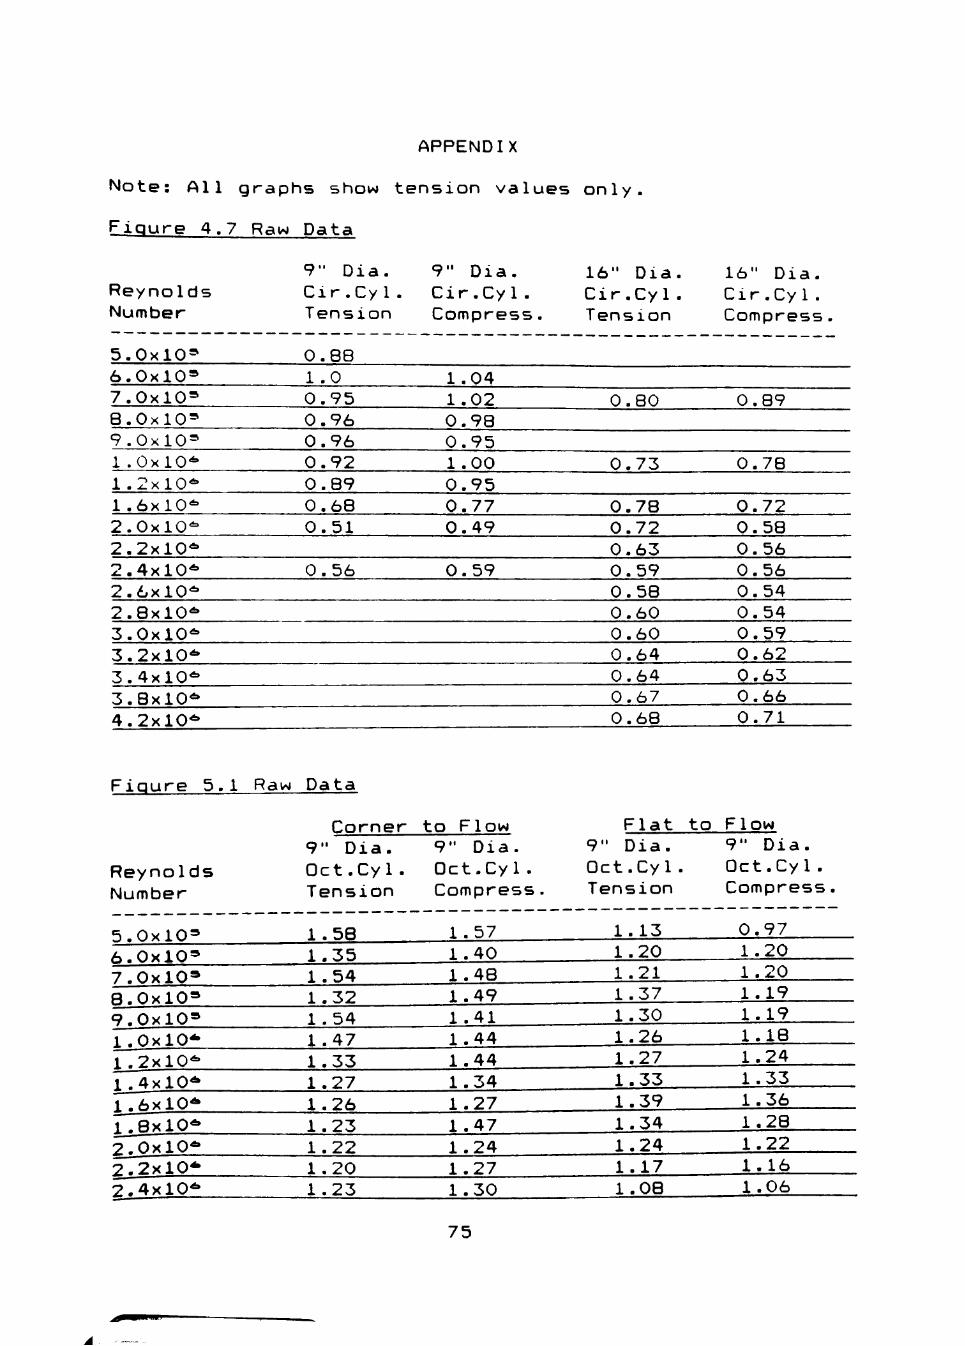
APPENDIX
Note: All graphs show tension values only.
Figure 4.7 Raw Data
9" Dia. 9" Dia. 16" Dia. 16" Dia Reynolds Cir.Cyl. Cir.Cyl. Cir.Cyl. Cir.Cyl Number Tension Compress. Tension Compres<
5.0x10=^ 0.88 6.0x10=^ 1_^ 1 .04 7.0x10=^ 0.95 1.02 0.80 0.89 8.0x10=^ 0.96 0.98 9 . 0 x 1 0 = 1 .0x10 '^ 1 . 2 x 1 0 * 1 . 6 x 1 0 * 2 . 0 x 1 0 * 2 . 2 x 1 0 * 2 . 4 x 1 0 * 2 . 6 x 1 0 * 2 . 8 x 1 0 * 3 . 0 x 1 0 * 3 . 2 x 1 0 * 3 . 4 x 1 0 *
0 . 9 6 0 . 9 2 0 . 8 9 0 . 6 8 0 . 5 1
0 . 5 6
0 . 9 5 1 .00 0 . 9 5 0 . 7 7 0 . 4 9
0 . 5 9
0 . 7 3
0 . 7 8 0 . 7 2 0 . 6 3 0 . 5 9 0 . 5 8 0 . 6 0 0 . 6 0 0 . 6 4 0 . 6 4
0 . 7 8
0 . 7 2 0 . 5 8 0 . 5 6 0 . 5 6 0 . 5 4 0 . 5 4 0 . 5 9 0 . 6 2 0 . 6 3
3.8x10* 0.67 0.66 4.2x10* 0.68 0.71
Figure 5.1 Raw Data
Corner to Flow Flat to Flow 9" Dia. 9" Dia. 9" Dia. 9" Dia.
Reynolds Oct.Cyl. Oct.Cyl. Oct.Cyl. Oct.Cyl. Number Tension Compress. Tension Compress
5.0x10= 1.58 1.57 1.13 Q.s_97 6.0x10= 1.35 1.40 1.20 1-20 7.0x10= 1.54 1.48 1.21 1-20 9.0x10= 1.32 1.49 1.37 LLII 9.0x10= 1.54 1.41 1.30 LJAI l.OxlO*^ 1.47 1.44 1.26 1-16 1.2x10* 1.33 1.44 1.27 1-24 1^.4x10* 1.27 1.34 1-33 1.33 1.6x10* 1.26 1.27 1.39 1-36 1_.8xl0< 1.23 1.47 1.34 1-28 g.OxlO* 1.22 1.24 1.24 1-22 2.2x10* 1.20 1.27 1.17 1.16 2.4x10* 1.23 1.30 1.08 1.06
75
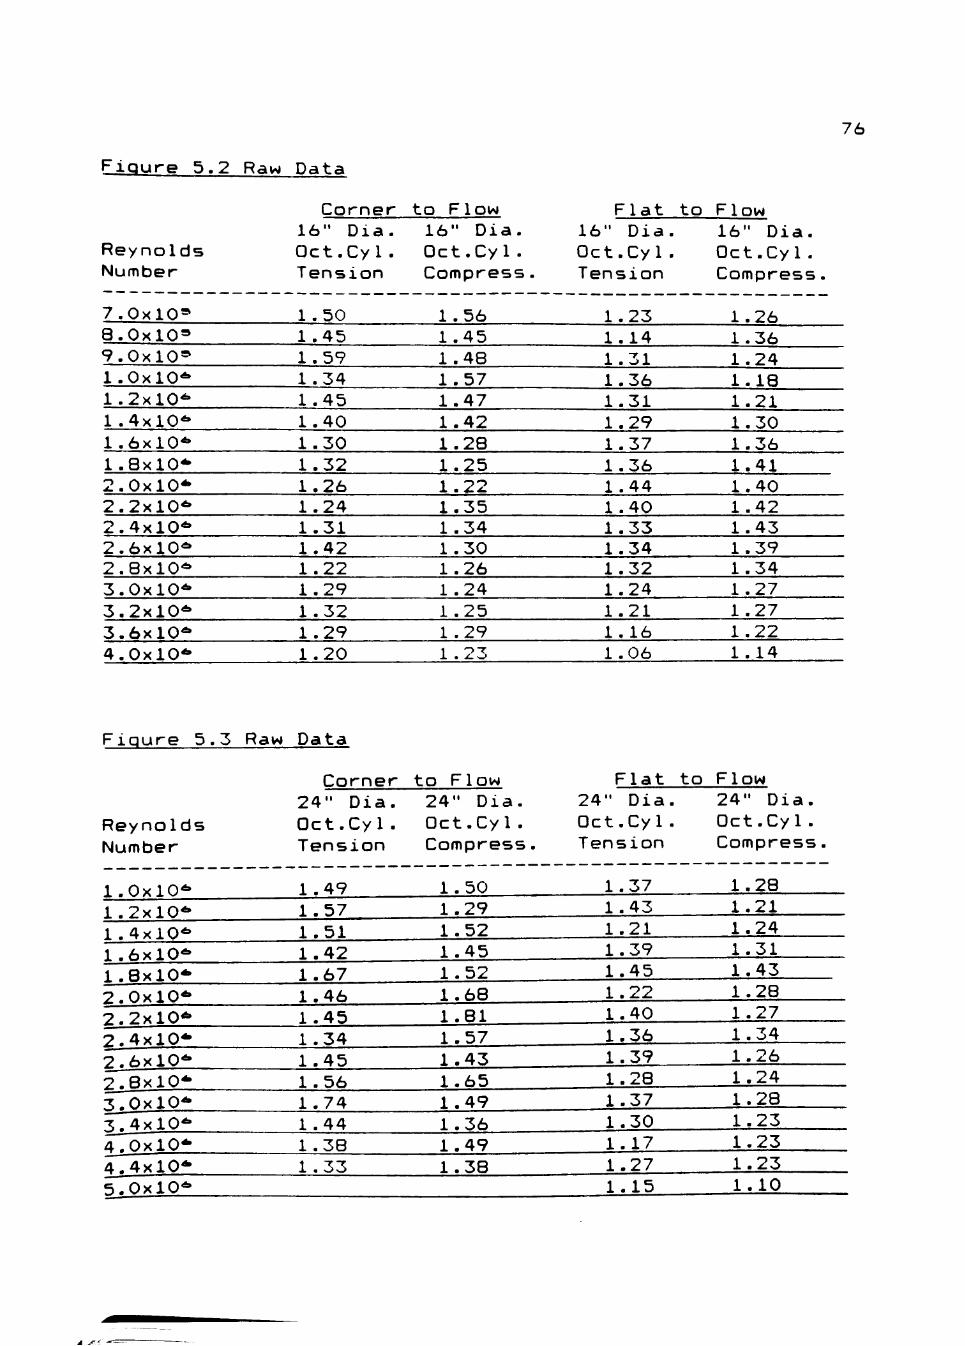
Figure 5.2 Raw Data
76
Reynold' Number
Corner to Flow 16" Dia. 16" Dia. Oct.Cyl. Oct.Cyl. Tension Compress
Flat to Flow 16" Dia. Oct.Cyl. Tension
16" Dia. Oct.Cyl. Compress
7.0x10= 8.0x10= 9.0x10= 1.0x10' 1.2x10*
1.50 1 .45 1.59 1.34 1 .45
Figure 5.3 Raw Data
1 .56 1.45 1.48 1.57 1.47
1.23 1.14 1.31 1.36 1.31
1.26 1.36 1.24 1.18 1.21
1 .4x10* 1 .6x10* 1.8x10* 2.0x10* 2.2x10* 2.4x10* 2.6x10* 2.8x10* 3.0x10* 3.2x10* 3.6x10* 4.0x10*
1.40 1.30 1.32 1.26 1.24 1.31 1.42 1.22 1.29 1.32 1.29 1.20
1.42 1.28 1.25 1.22 1.35 1.34 1.30 1.26 1 .24 1.25 1 .29 1 .23
1.29 1.37 1.36 1.44 1.40 1.33 1.34 1.32 1.24 1.21 1. 16 1.06
1.30 1.36 1.41 1.40 1.42 1.43 1.39 1.34 1.27 1.27 1.22 1.14
Reynolds Number
Corner to Flow 24" Dia. 24" Dia. Oct.Cyl. Oct.Cyl. Tension Compress
Flat to Flow 24" Dia. Oct.Cyl. Tension
24" Dia Oct.Cyl Compres'
1.0x10* 1.2x10* 1.4x10* 1.6x10* 1.8x10* 2.0x10* 2.2x10^ 2.4x10* 2.6x10* 2.8x10* 3.0x10* ^.4x10* 4.0x10* 4.4x10^ f5.0xlO*
1.49 1.57 1.51 1.42 1.67 1.46 1.45 1.34 1.45 1 .56 1.74 1 .44 1 .38 1.33
1.50 1.29 1.52 1.45 1.52 1.68 1.81 1.57 1.43 1.65 1.49 1.36 1.49 1.38
1.37 1.43 1.21 1.39 1.45 1.22 1.40 1.36 1.39 1.28 1.37 1.30 1.17 1.27 1.15
1.28
1.24 1.31 1.43 1.28 1.27 1.34 1.26 1.24 1.28 1.23 1.23 1.23 1.10
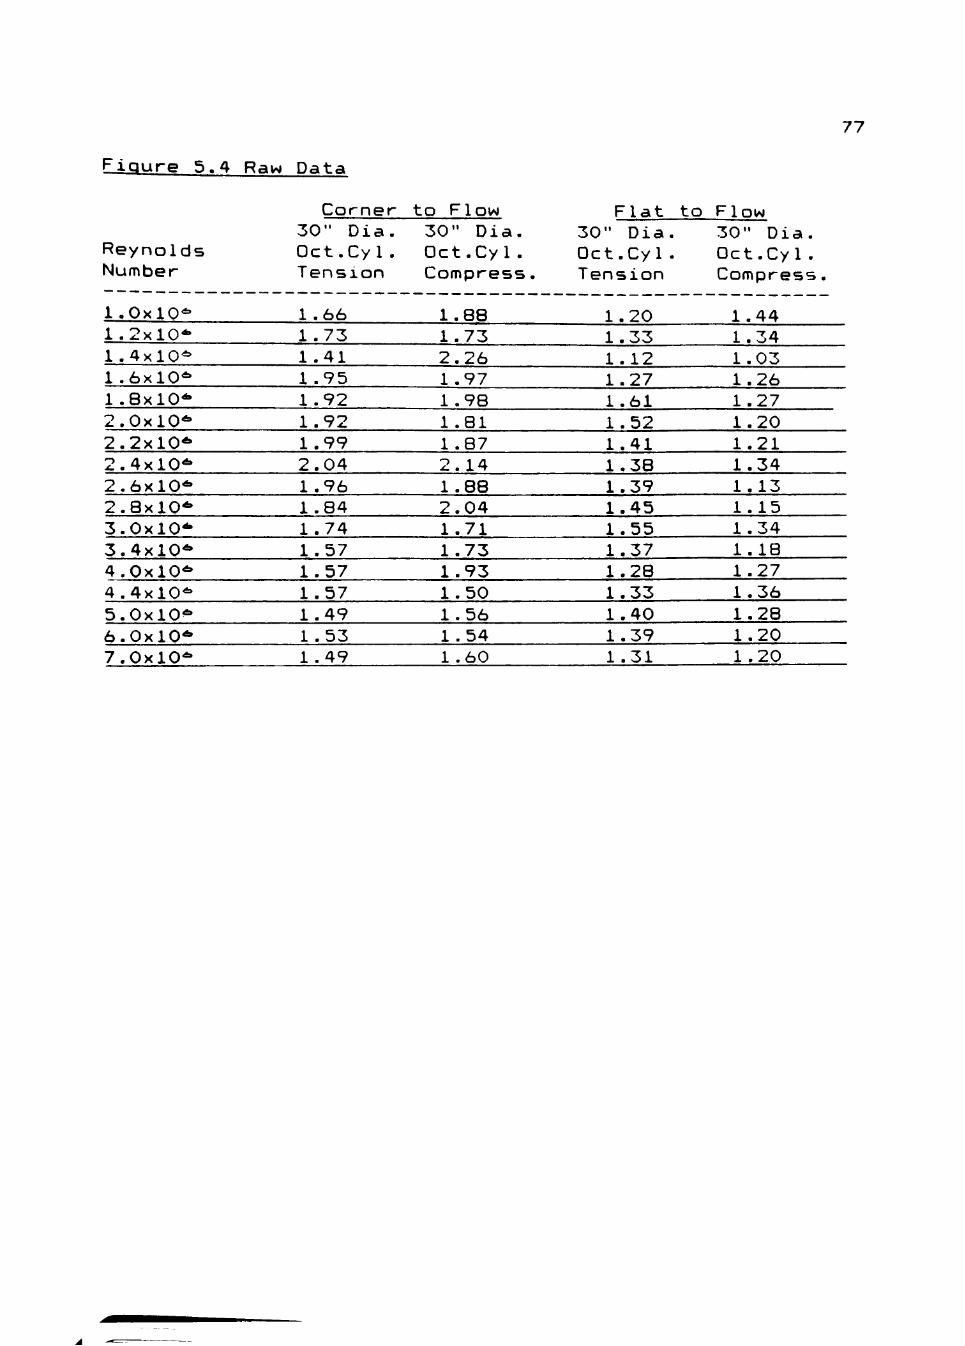
Figure 5.4 Raw Data
77
Reynolds Number
Corner to Flow 30" Dia. 30" Dia. Oct.Cyl. Oct.Cyl. Tension Compress
Flat to Flow 30" Dia. 30" Dia. Oct.Cyl. Oct.Cyl. Tension Compress
1.0x10* 1 .2x10* 1.4x10* 1.6x10* 1.8x10* 2.0x10* 2.2x10* 2.4x10* 2.6x10* 2.8x10* 3.0x10* 3.4x10* 4.0x10* 4.4x10* 5.0x10^' 6.0x10* 7.0x10*
1 .66 1.73 1.41 1 .95 1.92 1.92 1.99 2.04 1.96 1 .84 1.74 1.57 1.57 1.57 1.49 1 .53 1 .49
1.88 1.73 2.26 1 .97 1 .98 1 .81 1.87 2.14 1.88 2.04 1.71 1.73 1.93 1.50 1.56 1 .54 1 .60
1.20 1.33 1.12 1.27 1.61 1.52 1.41 1.38 1.39 1.45 1.55 1.37 1.28 1.33 1.40 1.39 1 .31
1.44 1.34 1.03 1.26 1.27 1.20 1.21 1.34 1.13 1.15 1.34 1.18 1.27 1.36 1.28 1.20 1.20
PERMISSION TO COPY
In presenting this thesis in partial fulfillment of the
requirements for a master's degree at Texas Tech University, I agree
that the Library and my major department shall make it freely avail
able for research purposes. Permission to copy this thesis for
scholarly purposes may be granted by the Director of the Library or
my major professor. It is understood that any copying or publication
of this thesis for financial gain shall not be allowed without my
further written permission and that any user may be liable for copy
right infringement.
Disagree (Permission not granted) Agree (Permission granted)
Student's signature Student's signature
Date S^T^^'"?^
Date