Embed Size (px)
Citation preview
DEVELOPMENT OF FECAL DNA SAMPLING METHODS TO
ASSESS GENETIC POPULATION STRUCTURE
OF GREATER YELLOWSTONE BISON
By
Florence Marie Gardipee
Associate of Science, Medical Laboratory Technology, Austin Community College, Austin, Texas, 1982
Bachelor of Science, Wildlife Biology, The University of Montana, Missoula, Montana, 2003
Thesis
presented in partial fulfillment of the requirements
for the degree of
Master of Science Wildlife Biology
The University of Montana
Missoula, MT
Spring 2007
Approved by:
Dr. David A. Strobel, Dean Graduate School
Fred W. Allendorf, Co-Chair
Division of Biological Sciences
Gordon Luikart, Co-Chair Division of Biological Sciences
Mark Hebblewhite
Department of Ecosystem and Conservation Sciences
Richmond Clow Native American Studies
Gardipee, Florence, M.S., May 2007 Wildlife Biology Development of fecal DNA sampling methods to assess genetic population structure of Greater Yellowstone bison Co-Chairperson: Fred W. Allendorf Co-Chairperson: Gordon Luikart The bison (Bison bison) of Yellowstone National Park (YNP) and Grand Teton National Park (GTNP) represent two of only three remaining populations of plains bison that have no evidence of hybridization with cattle. Therefore, these bison are an important source for ecological and genetic restoration of wild bison. Little is known regarding genetic population structure and gene flow among the Greater Yellowstone Area (GYA) bison herds. I evaluated the feasibility of fecal DNA sampling for genetic analyses of wild bison populations. I used matched blood and fecal samples from eight radio-collared bison from Hayden Valley breeding group (YNP), and multiplex polymerase chain reaction (PCR) of four microsatellite loci to assess amplification success and genotyping error rates. The amplification success rate was 92% and the genotyping error rate was 12% on average across all individuals, and loci. Exclusion of two poor quality samples from data analyses increased amplification success to 97%, and reduced the genotyping error rate to 4%. I PCR amplified a 470 bp mitochondrial DNA (mtDNA) fragment for sequencing, and successfully identified haplotypes for120 individuals. The error rate for mtDNA sequencing was 0.0005 nucleotide mis-incorporations across all samples. Sequencing and RFLP analysis of mtDNA control region from 179 fecal samples collected over two consecutive seasons was conducted to evaluate population structure among YNP breeding groups, and between GTNP and YNP bison populations. I found significant genetic distinction between YNP and GTNP bison populations (FST = 0.191, p < 0.001). The differences in haplotype frequencies between Hayden Valley and Lamar Valley breeding groups were highly significant (FST = 0.367, p < 0.001), and nearly two times greater than between GTNP and YNP thus providing evidence for at least two genetically distinct breeding groups within YNP. Differences between breeding groups remained significant even though haplotype frequencies were different between years within Hayden Valley (FST = 0.054, p < 0.05). The techniques and protocols developed have allowed high amplification success, low genotyping and sequencing error rates. This study demonstrated that non-invasive fecal DNA sampling is feasible for bison, and detected fine-scale population genetic structure in among GYA bison, suggesting female philopatry.
ii
Table of Contents
Abstract……………………………………………………………………………………ii
List of Tables……………………………………………………………………………..iv
List of Figures……………………………………………………………………………..v
Appendices………………………………………………………………………...……...vi
Dedication……………………………………………………………………………..…vii
Acknowledgements……………………………………………………………………..viii
Preface……………………………………………………………………...…………….ix
Chapter 1. Introduction………………………………………………………………1
Chapter 2. Non-invasive fecal DNA sampling and low genotyping
error rates in the Greater Yellowstone Area bison
Abstract…………………………………………………………………..13
Introduction………………………………………………………………14
Methods…………………………………………………………………..15
Results……………………………………………………………………20
Discussion………………………………………………………………..22
Chapter 3. Genetic Population Structure in the Greater Yellowstone Area bison
populations revealed by mitochondrial DNA analyses
Abstract…………………………………………………………………..31
Introduction………………………………………………………………32
Methods…………………………………………………………………..34
Results……………………………………………………………………36
Discussion………………………………………………………………..37
iii
Literature Cited…………………………………………………………………………..46
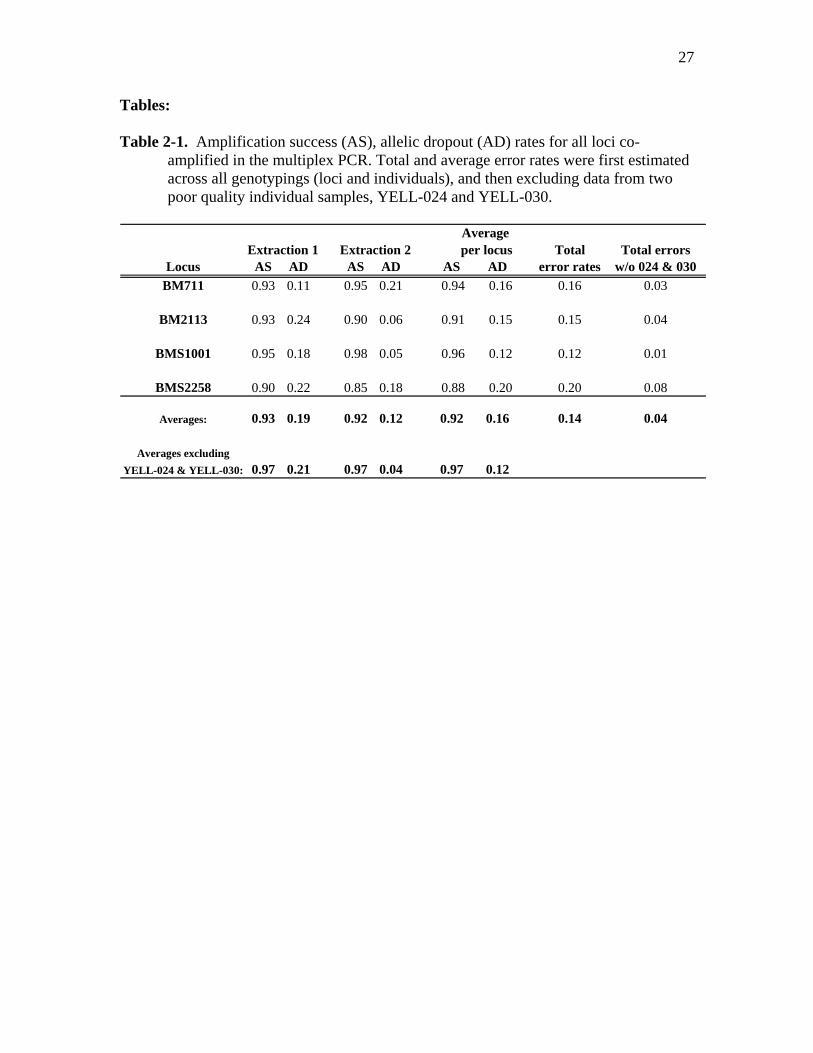
List of Tables 2-1 Amplification success (AS), allelic dropout (AD) and false allele (FA) rates for all
loci co-amplified in the multiplex PCR. Total and average error rates were first
estimated across all genotypings (loci and individuals), and then excluding data
from two individual samples, YELL-024 and YELL-030……………………….27
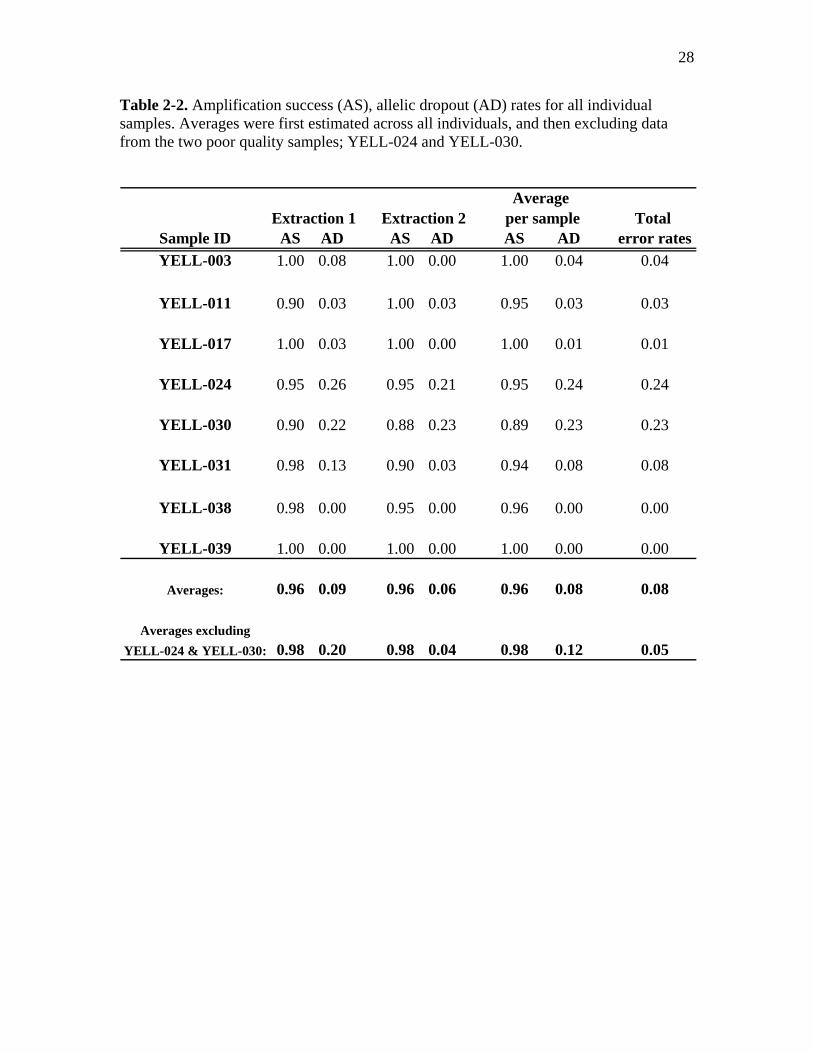
2-2 Amplification success (AS), allelic dropout (AD) rates for all individual samples.
Averages were first estimated across all individuals, and then excluding data from
two individuals, YELL-024 and YELL-030……………………………………..28
3-1 Distribution and frequency of haplotype 6 among the GYA bison populations
sampled over two consecutive breeding seasons, 2005 and 2006, and the total
number of samples analyzed from each population per season………………….45
3-2 FST values based on haplotype frequencies among GYA bison populations…….45
iv
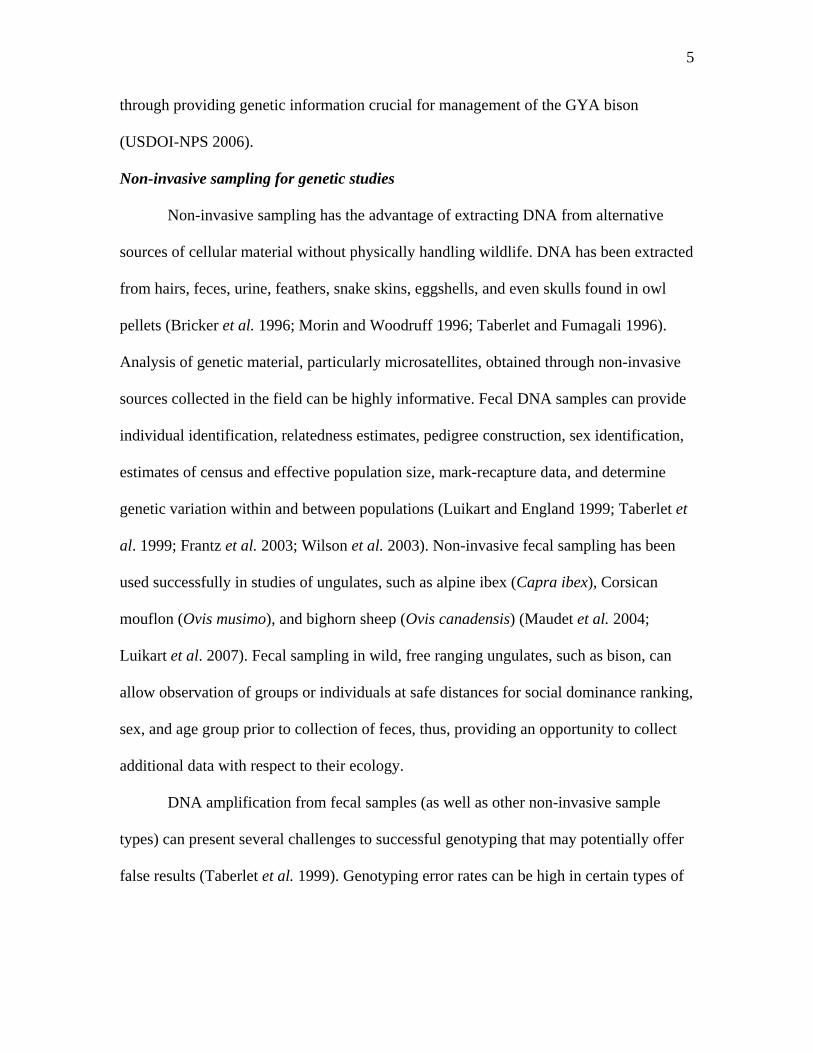
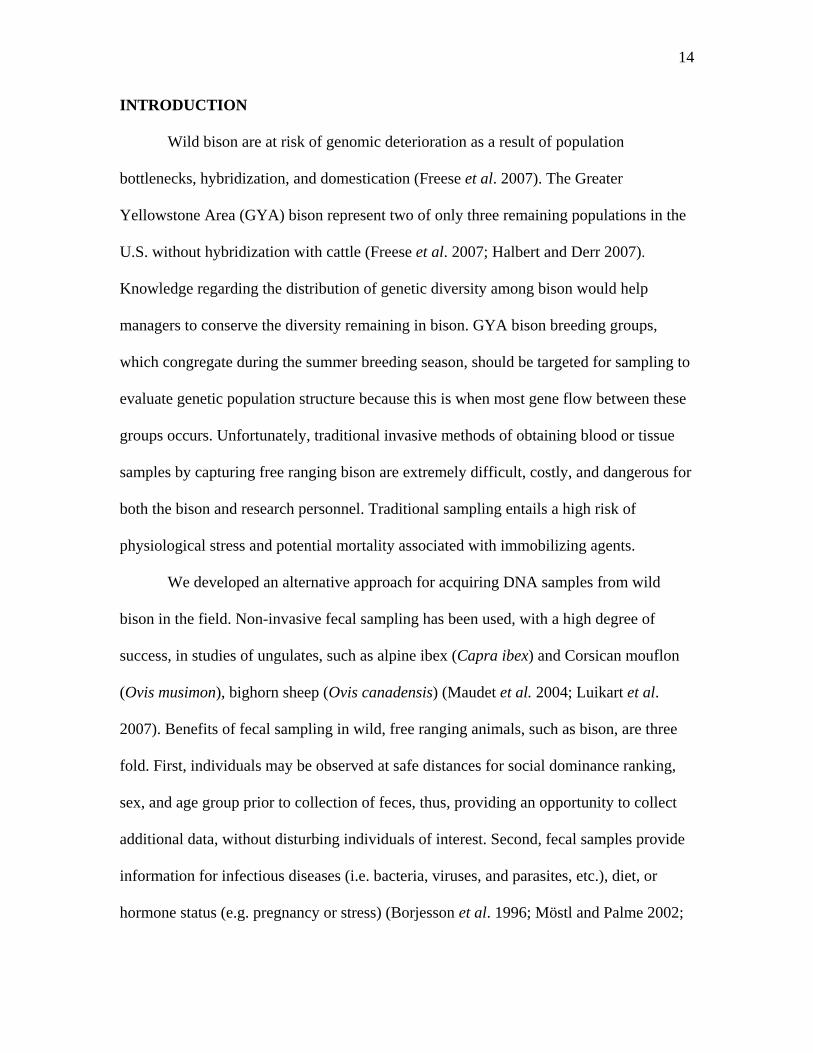
List of Figures 1-1 Map of YNP showing key bison winter ranges and locations of bison breeding
groups as described by Meagher 1973, Taper and Meagher 2000, Meagher et al.
2002………………………………………………………………………………12
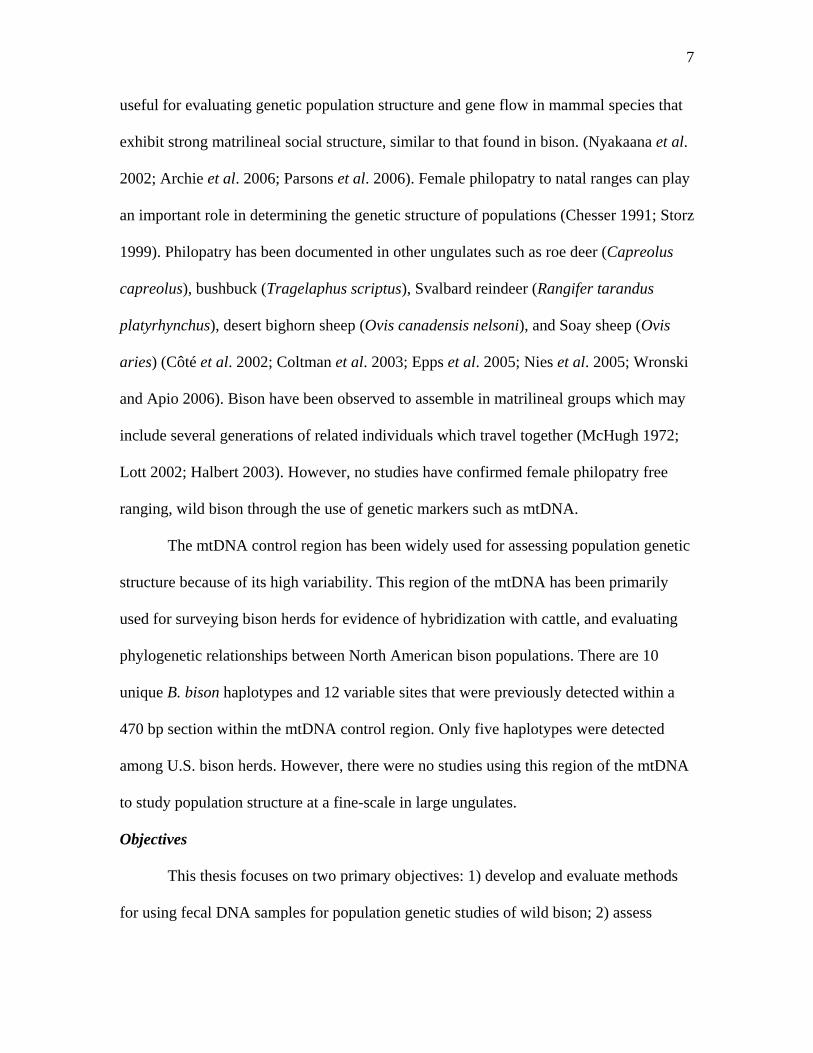
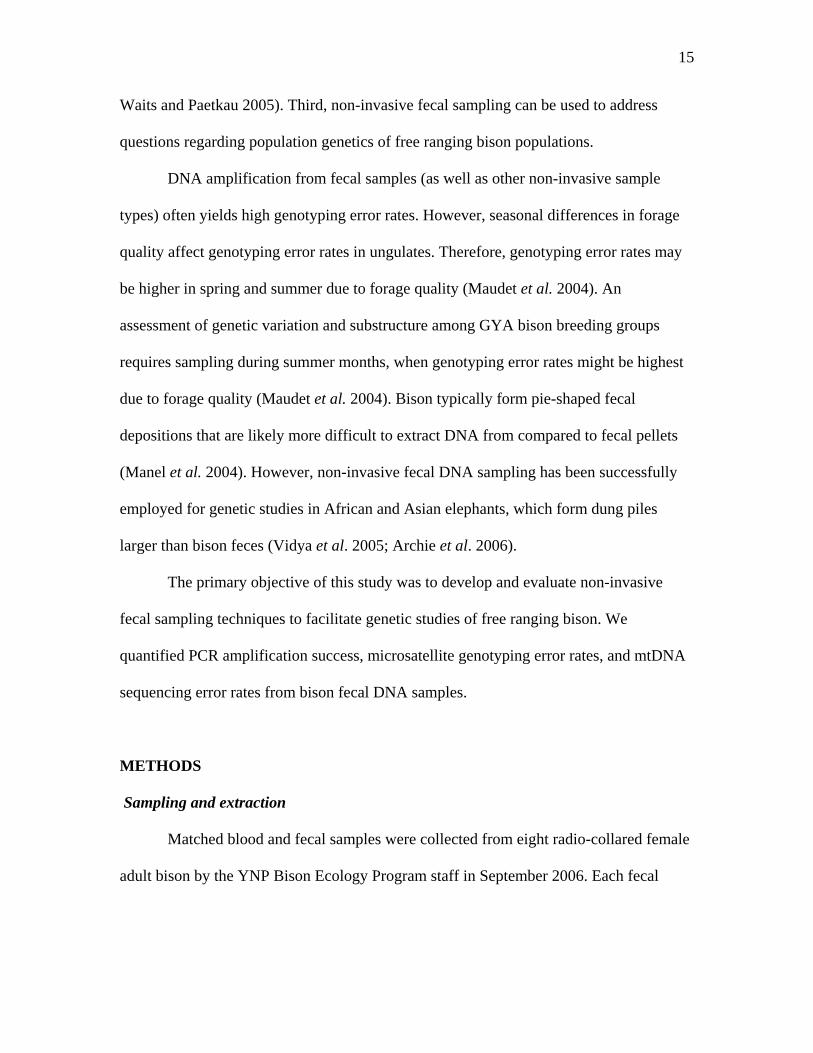
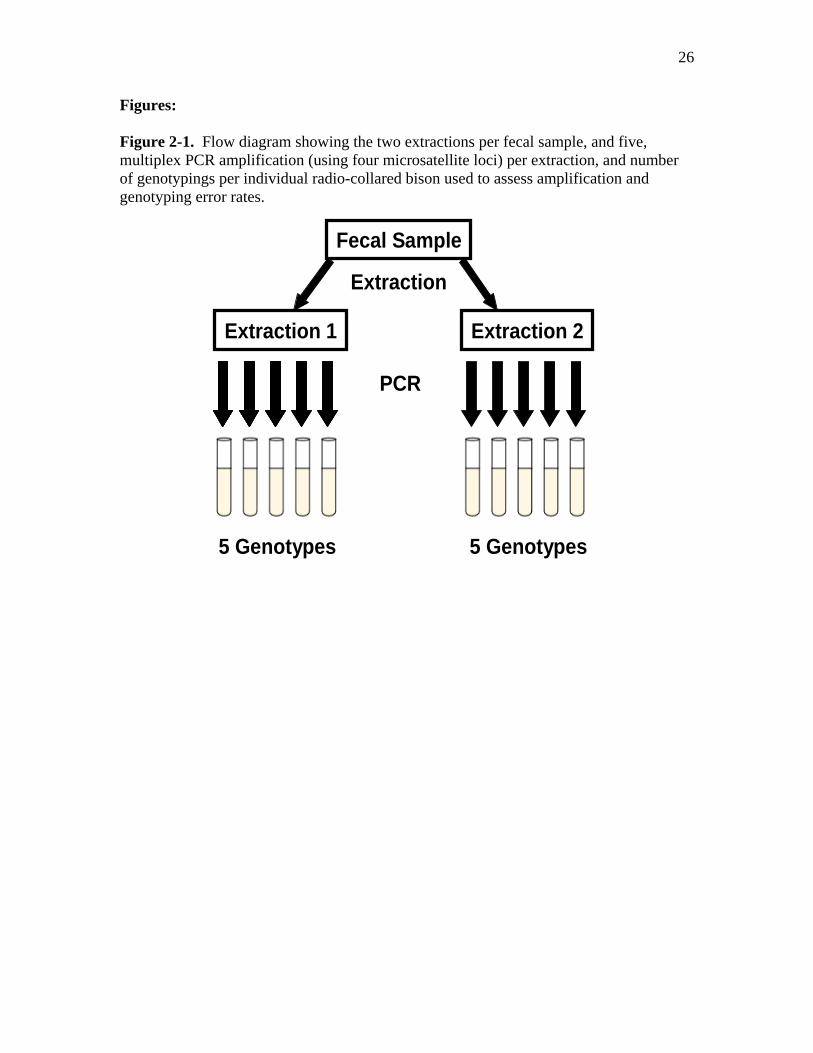
2-1 Flow diagram showing the two extractions per fecal sample, and five, multiplex
PCR amplification (using four microsatellite loci) per extraction, and number of
genotypings per individual radio-collared bison used to assess amplification and
genotyping error rates...………………………………………………………….26
3-1 Approximate locations of GYA bison breeding groups, represented by the
respective haplotype frequencies of bison sampled within each area……………44
v
Appendices
2-1 Characteristics of microsatellite loci amplified in the multiplex PCR; primers, and
chromosome location (Halbert 2003). Allele ranges, and number of alleles (NA)
found in the eight radio-collared bison used to assess amplification success and
error rates for this study………………………………………………………….29
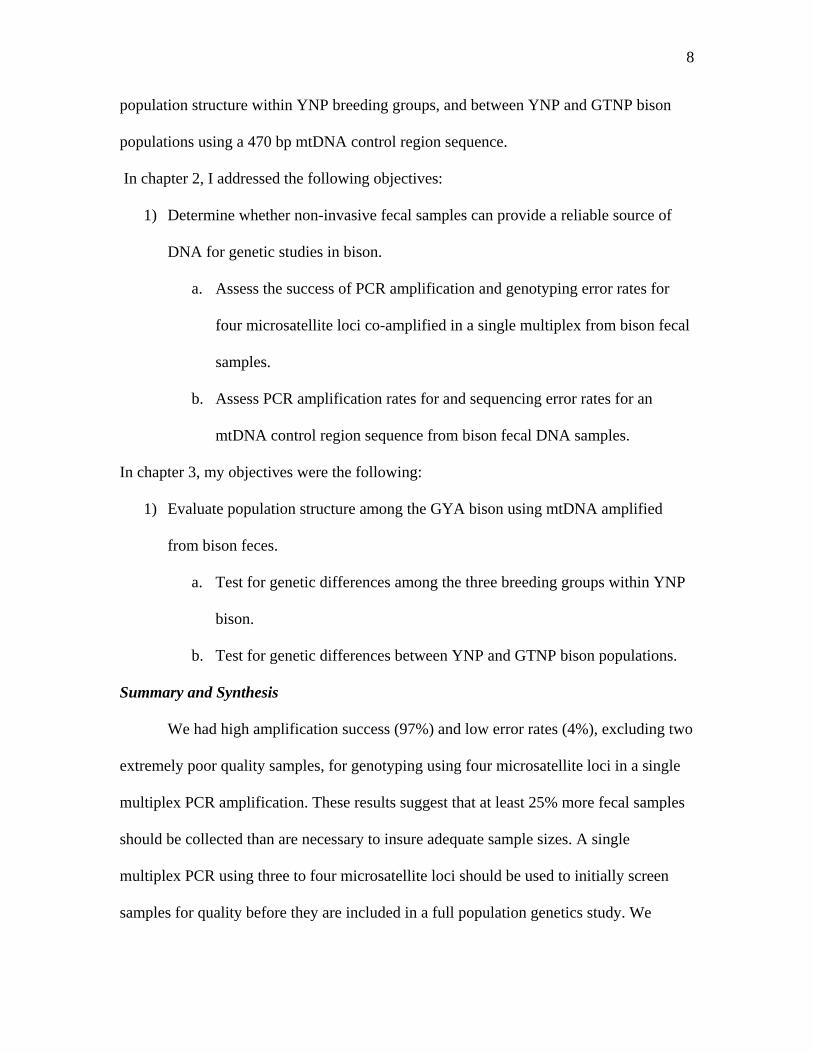
2-2 Amplification rates (AS) reported in our study and for other species with non-
pellet form feces (Reed et al. 1997; Wasser et al. 1997; Kohn et al. 1999; Bradley
et al. 2000; Lathuillière et al. 2001; Morin et al. 2001; Parsons 2001; Lucchini et
al. 2002; Murphy et al. 2002; Eggert et al. 2003; Fernando et al. 2003; Buchan et
al. 2005)………………………………………………………………………….29
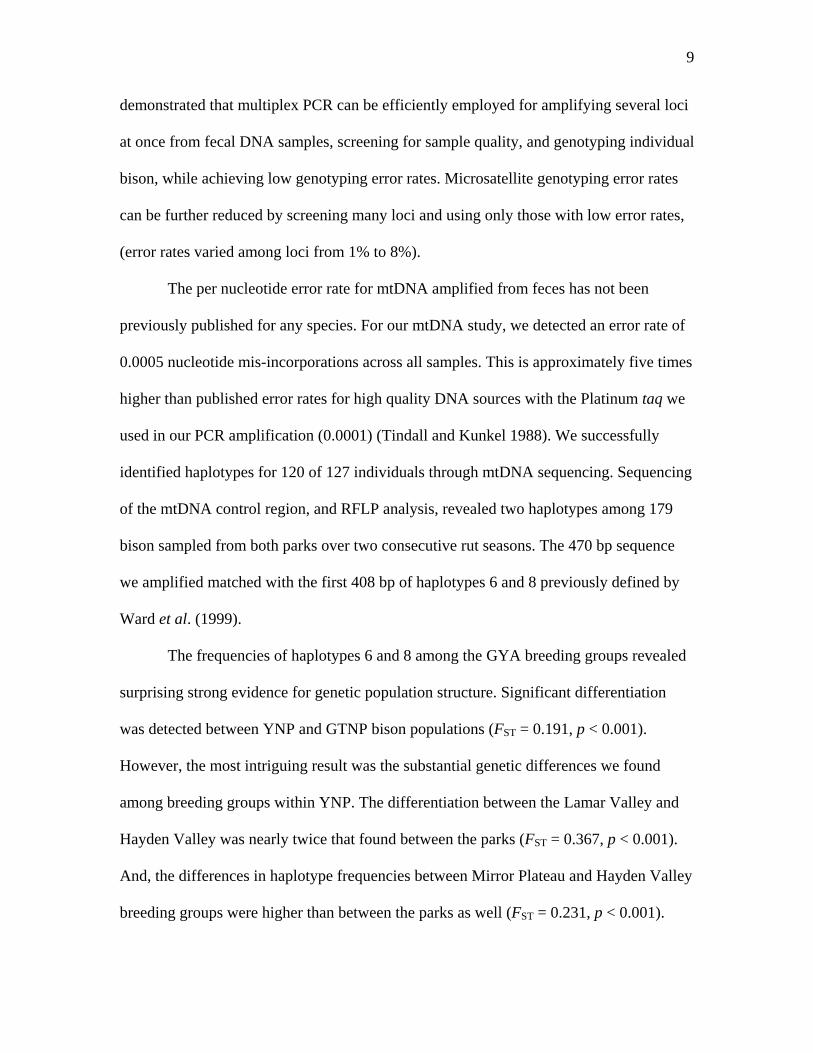
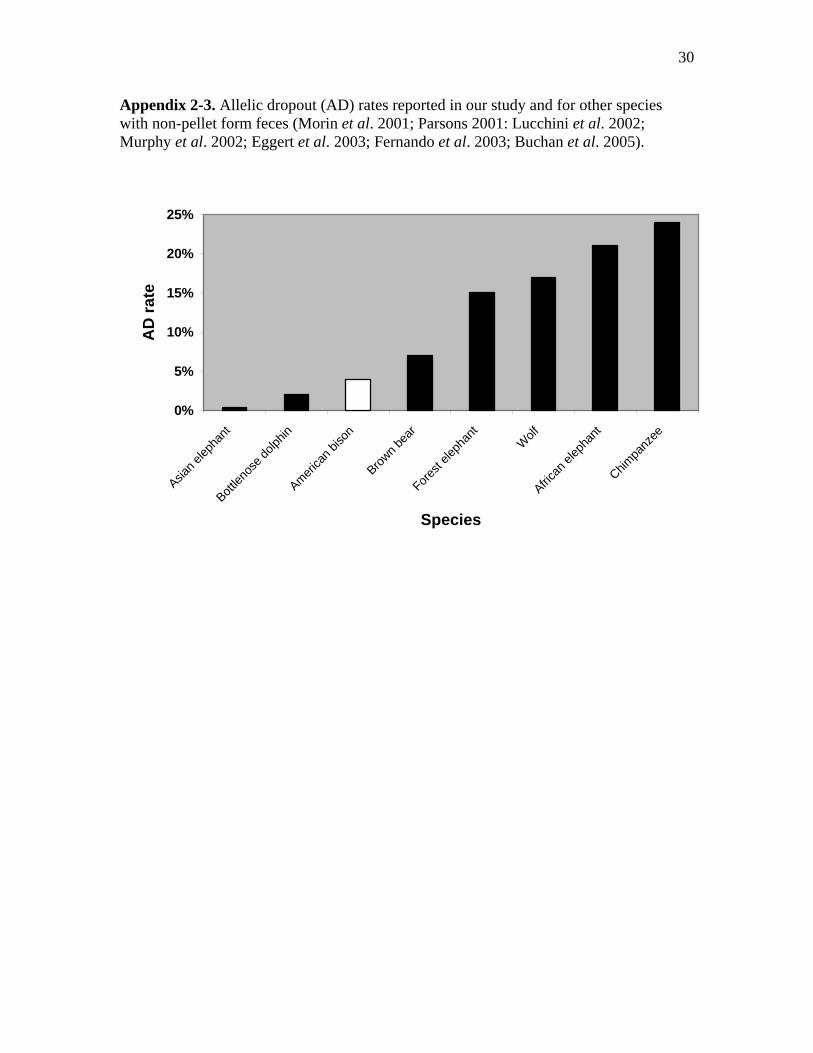
2-3 Allelic dropout (AD) rates reported in our study and for other species with non-
pellet form feces (Morin et al. 2001; Parsons 2001: Lucchini et al. 2002; Murphy
et al. 2002; Eggert et al. 2003; Fernando et al. 2003; Buchan et al. 2005)...…....30
vi
Dedication
The work presented within the body of this thesis is dedicated to all of those who have
subsisted in respectful co-existence with bison in the past, and to those who dream of a
time when bison thundered across the plains, and work toward their restoration. Mostly, I
would like to dedicate this thesis to the tribal elders of the North American First Nations,
who guide our path to the future through teaching us about our past. One such elder who
has played a major role in my life, is my adopted Mom and spiritual mentor, Dr.
Henrietta Mann, who inspires me to be the best scientist and human being I can possibly
be. She has taught me to be generous, respectful, strong, how to feel the earth under my
feet, and stretch my hands to the sky. I would also like to dedicate this thesis to my
beautiful daughters, Jasmine, Juanita, and Jade for their love and patient support. Finally
I offer honor, respect and gratitude to the bison of Greater Yellowstone for their generous
contributions to this study.
vii
Acknowledgements This study would not have been possible without the cooperation and support of
Rick Wallen, Bison Biologist, the Yellowstone National Park Bison Ecology Program
staff, and Steve Cain, Supervisory Wildlife Biologist, Grand Teton National Park. I feel
privileged and honored to have had guidance and support from my advisors, Fred
Allendorf and Gordon Luikart. I owe them both a debt of gratitude for their patience and
kind efforts in assisting me to achieve my academic goals. Committee members Rich
Clow and Mark Hebblewhite deserve thanks and recognition for their support and
valuable suggestions. I would like thank Paul Spruell for inspiring my interest in
conservation genetics and providing expertise. Special thanks go to my research assistant,
Michael O’Brien, for his hard work and dedication to this study both in the lab and the
field. Ericka Gutierrez, Katie Jo Rabbit, and Christine Grossen (AKA “The Buffalo
Girls”) assisted with field studies and lab work. Recognition and gratitude for sharing
laboratory facilities and technical expertise go to Jason Hicks, Steve Amish, and Scott
Mills. Sally Painter, John Powell, and Robb Leary of the Montana Fish, Wildlife, and
Parks Fish Genetics Laboratory provided invaluable technical expertise to this study as
well. I am very grateful to Brian Steele who provided assistance and expertise with
statistical analyses. Funding was provided by; Boyd Evison Graduate Research
Fellowship, Yellowstone National Park, Len Broberg (EVST-UM), Lila Fishman (DBS-
UM), Charlie Janson, Associate Dean, DBS-UM, and Patagonia, Inc. Graduate funding
was provided by Teaching Assistantships, the Sloans Program, and NSF-ECOS Program.
I would also like to thank Penny Kukuk, Carol Brewer, Vanessa Ezenwa, Scott Mills,
Mary Kamensky, Patrick Weasel Head, Kate Shanley, and Dave Dwyer for their support.
viii
Preface
Dale Lott grew up on the National Bison Range, and spent most of his adult life
studying bison behavior and ecology. This work culminated in a book titled, “American
Bison: A Natural History”. Chapter five of this publication, amusingly titled, “Digestion:
Grass to Gas and Chips”, discusses the remarkable digestive system of bison. At the end
of this chapter he touts the usefulness of fecal studies in wildlife, and for bison in
particular; “In their passage chips also pick up bison cells that contain the individual’s
complete genome. It is possible that they could reveal not only the individual’s identity
but perhaps the identity of its parents as well. So science will just keep chipping away at
the secrets in the belly of the beast….but few other ways are as humane and efficient as
chip analysis. No need to subdue the buffalo with a tranquilizing darts–and no worries
that hormone levels in the blood sample reflect short-term peaks or bottoms caused by the
trauma of the sampling. Little wonder then, that when the chips are down, the biologist’s
spirits are up. The investigator that at first seems a figure of fun, a dedicated pooper-
scooper, is really the very model of a modern-day mammalogist.”
Dale was right! The non-invasive fecal DNA sampling protocols I have developed
for population genetic studies of free-ranging bison, has just begun to reveal “the secrets
in the belly of the beast”. I have become the dedicated “pooper-scooper”, and hope to
continue the use of non-invasive fecal sampling to learn as much as I can about the wild
bison of Greater Yellowstone. And, who knows how much we will continue to learn
about these amazing animals through just sampling of their feces? Hopefully, we will
gain the information and insights we need in order to conserve them for future
generations.
ix
1
Chapter 1.
Introduction
Conservation of wild bison (Bison bison) is crucial to conservation of North
American Tribal cultures and the biodiversity of the plains ecosystem. Bison are an
ecological and cultural keystone species (McHugh 1972; Erdoes and Ortiz 1984; Knapp
et al. 1999). Concern for the persistence of wild bison has increased since conservation
status reviews revealed that they are ecologically extinct from over 90% of their former
habitats. Of the estimated >450,000 bison in the United States (U.S.), 95% of them reside
on private ranches where they have been subjected to hybridization with cattle and
domestication (Boyd 2003). In addition, at least seven of ten federal bison herds show
evidence of hybridization (Halbert and Derr 2007).
Prior to Euro-American settlement, the bison populations that roamed North
America were reduced from an estimated 30 million (Seton 1937; Barsness 1985;
Hornaday 2002) to less than 1000 by the late 1800’s (Coder 1975; Hornaday 2002; Smits
1994). Shortly after this near extermination, the few hundred remaining bison were either
captured and sent to zoos or adopted by private ranchers (Coder 1975; Hornaday 2003).
The conservation efforts of the past have insured that the American bison is no longer at
risk of demographic extinction. However, the loss of genetic diversity due to multiple
bottlenecks, founder effects, hybridization, and domestication pose the risk of genomic
extinction, and reduced evolutionary potential (Freese et al. 2007).
Following Boyd’s (2003) recommendations, the Wildlife Conservation Society
has initiated a comprehensive review of the status of bison in collaboration with the
IUCN Bison Specialist Group. In 2005, the WCS began the revitalization of the
2
principles of the historic American Bison Society in an effort to bring about the
ecological recovery of bison populations across their historic range (Freese et al. 2007).
Individual and collaborative efforts directed at ecological restoration of bison to
their former ranges have been initiated by government agencies, private citizens, non-
governmental organizations, and Native American tribes (Freese et al. 2007). They face
two major issues in pursuing these efforts; locating large tracts of suitable habitat for
bison, and identifying source populations with sufficient genetic diversity and no
evidence of hybridization that can contribute to the conservation of the bison genome
(Freese et al. 2007).
The Greater Yellowstone Area (GYA) bison herds represent an evolutionary
legacy for conservation of bison because they are the only surviving naturally occurring
wild bison population in the United States (Freese et al. 2007). Two large herds currently
reside within Yellowstone and Grand Teton National Parks (YNP and GTNP). Previous
genetic studies revealed that the GYA bison have a relatively high degree of genetic
variation and no evidence of hybridization (Ward et al. 1999; Halbert and Derr 2007).
The GYA bison may also represent an ecological microcosm of historic bison
populations, thus requiring careful conservation efforts to ensure their persistence.
Population genetic studies would provide crucial information for agencies charged with
the management and conservation of these bison populations:
• National Park Service (NPS)
• U.S. Fish and Wildlife Service (USFWS)
• U.S. Forest Service (USFS)
3
• United States Department of Agriculture, Animal and Plant Health Inspection
Service (USDA-APHIS)
• Montana Fish, Wildlife, and Parks (MFWP)
• Wyoming Game and Fish (WGF)
• Montana Department of Livestock (MDOL)
Previous genetic studies of the GYA bison relied upon opportunistic sampling
animals captured on winter ranges outside of park boundaries. Over forty microsatellite
loci were used to assess genetic diversity and evaluate whether more than one
subpopulation exists within YNP bison (Halbert 2003). Population substructure analyses
conducted in STRUCTURE (Pritchard et al. 2000) suggested the presence of three
subpopulations (or breeding groups) for 166 bison exiting the park though the northern
boundary, and one primary subpopulation for 63 bison exiting through West Yellowstone
(Halbert 2003). Although, Halbert (2003) tested for genetic differentiation between YNP
and GTNP bison herds (FST = 0.102), the rate and direction of gene flow between these
parks was not thoroughly assessed. Because bison were not sampled at the geographic
locations of breeding groups within the parks, population structure could not be
confirmed, and the partitioning of genetic diversity among breeding groups remained
unknown.
An expanded assessment of population structure and gene flow between GYA
bison populations through non-invasive fecal sampling, microsatellite studies, and the
addition of mtDNA sequencing could confirm whether population structure among
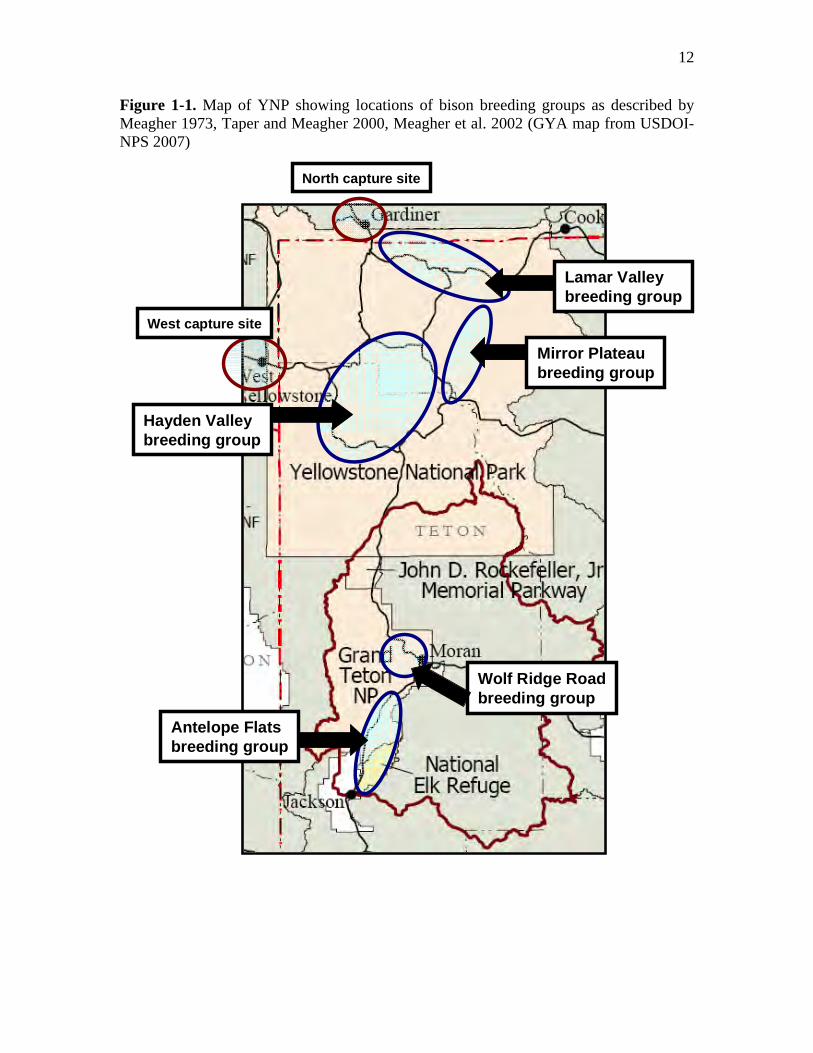
breeding groups truly exists. YNP bison breeding groups are known to congregate in two
primary geographic locations (Lamar Valley/ Mirror Plateau and Hayden Valley), and
4
within a possible third location (Mirror Plateau/Pelican Valley) during the summer rut
season (Fig. 1-1) (Meagher et al. 2002; Geremia et al. 2005; Jones et al. 2006). Genetic
variation and population substructure, for these breeding groups is unknown. This is, in
large part, due to the difficulty obtaining blood or tissue samples from wild, free ranging
bison during the summer. Also, the high risk of undue physiological stress from live
capture, and potential mortality associated with immobilizing agents further hinder
invasive approaches to sample collection. Sampling bison with traditional methods while
they are congregated in large groups during the breeding season can be complicated,
dangerous and stressful for the bison. Therefore, an alternative sampling approach was
considered for acquiring genetic data from bison within the parks. Non-invasive fecal
DNA sampling offers an efficient means of acquiring genetic data from GYA bison
populations across their geographic range, with minimum risk to wild bison, and
personnel collecting samples. This approach will also allow us to associate the genetic
data with specific locations of breeding groups.
Most importantly, the non-invasive sampling approach is highly compatible with
NPS wildlife management philosophy which mandates the following: “The Wildlife
Management Program will achieve the NPS’s primary mission by…minimizing human
impacts on native animals, populations, communities, and ecosystems, and the processes
that sustain them” (USDOI-NPS 2006). This study will also assist the NPS with meeting
the Genetic Resource Management Principles “to protect the full range of genetic types
(genotypes) of native plants and animal populations in the parks by perpetuating natural
evolutionary processes and minimizing human interference with evolving genetic
diversity…the Service will maintain the appropriate levels of natural genetic diversity”,
5
through providing genetic information crucial for management of the GYA bison
(USDOI-NPS 2006).
Non-invasive sampling for genetic studies
Non-invasive sampling has the advantage of extracting DNA from alternative
sources of cellular material without physically handling wildlife. DNA has been extracted
from hairs, feces, urine, feathers, snake skins, eggshells, and even skulls found in owl
pellets (Bricker et al. 1996; Morin and Woodruff 1996; Taberlet and Fumagali 1996).
Analysis of genetic material, particularly microsatellites, obtained through non-invasive
sources collected in the field can be highly informative. Fecal DNA samples can provide
individual identification, relatedness estimates, pedigree construction, sex identification,
estimates of census and effective population size, mark-recapture data, and determine
genetic variation within and between populations (Luikart and England 1999; Taberlet et
al. 1999; Frantz et al. 2003; Wilson et al. 2003). Non-invasive fecal sampling has been
used successfully in studies of ungulates, such as alpine ibex (Capra ibex), Corsican
mouflon (Ovis musimo), and bighorn sheep (Ovis canadensis) (Maudet et al. 2004;
Luikart et al. 2007). Fecal sampling in wild, free ranging ungulates, such as bison, can
allow observation of groups or individuals at safe distances for social dominance ranking,
sex, and age group prior to collection of feces, thus, providing an opportunity to collect
additional data with respect to their ecology.
DNA amplification from fecal samples (as well as other non-invasive sample
types) can present several challenges to successful genotyping that may potentially offer
false results (Taberlet et al. 1999). Genotyping error rates can be high in certain types of

6
samples. However, repeated genotyping of heterozygous individuals can be used to
accurately determine genotyping error rates (Taberlet et al. 1999; Maudet et al. 2004).
Seasonal differences in forage quality can potentially affect genotyping error rates
from ungulate feces (Maudet et al. 2004). Maudet et al. (2004) found significant
differences for DNA recovery in fecal samples collected in winter versus summer
samples. DNA recovery rates were much lower, and genotyping error rates were much
higher in seasons when forage quality is quite high, such as spring or summer. Recovery
of DNA from bison fecal samples collected during the summer rut season could be
challenging and error rates high. Bison typically form pie-shaped fecal depositions that
may be more difficult to extract DNA from compared to pellet-form fecal depositions.
However, non-invasive fecal DNA sampling has been successfully employed for genetic
studies in African and Asian elephants, which form dung piles that are similar to, but
larger than bison feces (Vidya et al. 2005; Archie et al. 2006).
Feasibility studies should be conducted on all novel non-invasive sample types,
before approaching a large scale genetic analysis to insure that DNA analysis is reliable
(Taberlet et al. 1999; Maudet et al. 2004). Non-invasive fecal DNA samples can produce
high error rates due to allelic dropout and false alleles, therefore it is necessary to
estimate the number of replicate genotypings needed for confidently assigning correct
genotypes (Taberlet et al. 1999; Maudet et al. 2004). We therefore assessed amplification
success and error rates for fecal DNA extracted from bison feces.
mtDNA and population structure
Our primary objective was to assess population structure among the GYA bison
breeding groups. We chose to use the mtDNA control region for this study because it is
7
useful for evaluating genetic population structure and gene flow in mammal species that
exhibit strong matrilineal social structure, similar to that found in bison. (Nyakaana et al.
2002; Archie et al. 2006; Parsons et al. 2006). Female philopatry to natal ranges can play
an important role in determining the genetic structure of populations (Chesser 1991; Storz
1999). Philopatry has been documented in other ungulates such as roe deer (Capreolus
capreolus), bushbuck (Tragelaphus scriptus), Svalbard reindeer (Rangifer tarandus
platyrhynchus), desert bighorn sheep (Ovis canadensis nelsoni), and Soay sheep (Ovis
aries) (Côté et al. 2002; Coltman et al. 2003; Epps et al. 2005; Nies et al. 2005; Wronski
and Apio 2006). Bison have been observed to assemble in matrilineal groups which may
include several generations of related individuals which travel together (McHugh 1972;
Lott 2002; Halbert 2003). However, no studies have confirmed female philopatry free
ranging, wild bison through the use of genetic markers such as mtDNA.
The mtDNA control region has been widely used for assessing population genetic
structure because of its high variability. This region of the mtDNA has been primarily
used for surveying bison herds for evidence of hybridization with cattle, and evaluating
phylogenetic relationships between North American bison populations. There are 10
unique B. bison haplotypes and 12 variable sites that were previously detected within a
470 bp section within the mtDNA control region. Only five haplotypes were detected
among U.S. bison herds. However, there were no studies using this region of the mtDNA
to study population structure at a fine-scale in large ungulates.
Objectives
This thesis focuses on two primary objectives: 1) develop and evaluate methods
for using fecal DNA samples for population genetic studies of wild bison; 2) assess
8
population structure within YNP breeding groups, and between YNP and GTNP bison
populations using a 470 bp mtDNA control region sequence.
In chapter 2, I addressed the following objectives:
1) Determine whether non-invasive fecal samples can provide a reliable source of
DNA for genetic studies in bison.
a. Assess the success of PCR amplification and genotyping error rates for
four microsatellite loci co-amplified in a single multiplex from bison fecal
samples.
b. Assess PCR amplification rates for and sequencing error rates for an
mtDNA control region sequence from bison fecal DNA samples.
In chapter 3, my objectives were the following:
1) Evaluate population structure among the GYA bison using mtDNA amplified
from bison feces.
a. Test for genetic differences among the three breeding groups within YNP
bison.
b. Test for genetic differences between YNP and GTNP bison populations.
Summary and Synthesis
We had high amplification success (97%) and low error rates (4%), excluding two
extremely poor quality samples, for genotyping using four microsatellite loci in a single
multiplex PCR amplification. These results suggest that at least 25% more fecal samples
should be collected than are necessary to insure adequate sample sizes. A single
multiplex PCR using three to four microsatellite loci should be used to initially screen
samples for quality before they are included in a full population genetics study. We
9
demonstrated that multiplex PCR can be efficiently employed for amplifying several loci
at once from fecal DNA samples, screening for sample quality, and genotyping individual
bison, while achieving low genotyping error rates. Microsatellite genotyping error rates
can be further reduced by screening many loci and using only those with low error rates,
(error rates varied among loci from 1% to 8%).
The per nucleotide error rate for mtDNA amplified from feces has not been
previously published for any species. For our mtDNA study, we detected an error rate of
0.0005 nucleotide mis-incorporations across all samples. This is approximately five times
higher than published error rates for high quality DNA sources with the Platinum taq we
used in our PCR amplification (0.0001) (Tindall and Kunkel 1988). We successfully
identified haplotypes for 120 of 127 individuals through mtDNA sequencing. Sequencing
of the mtDNA control region, and RFLP analysis, revealed two haplotypes among 179
bison sampled from both parks over two consecutive rut seasons. The 470 bp sequence
we amplified matched with the first 408 bp of haplotypes 6 and 8 previously defined by
Ward et al. (1999).
The frequencies of haplotypes 6 and 8 among the GYA breeding groups revealed
surprising strong evidence for genetic population structure. Significant differentiation
was detected between YNP and GTNP bison populations (FST = 0.191, p < 0.001).
However, the most intriguing result was the substantial genetic differences we found
among breeding groups within YNP. The differentiation between the Lamar Valley and
Hayden Valley was nearly twice that found between the parks (FST = 0.367, p < 0.001).
And, the differences in haplotype frequencies between Mirror Plateau and Hayden Valley
breeding groups were higher than between the parks as well (FST = 0.231, p < 0.001).
10
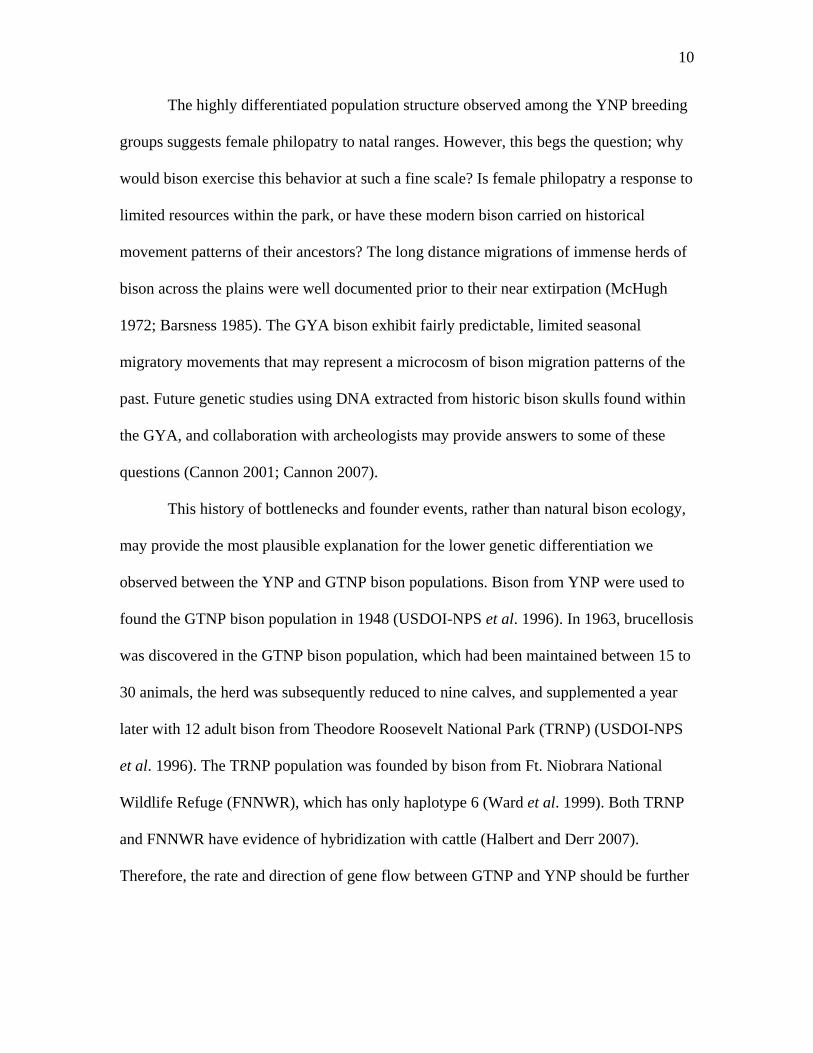
The highly differentiated population structure observed among the YNP breeding
groups suggests female philopatry to natal ranges. However, this begs the question; why
would bison exercise this behavior at such a fine scale? Is female philopatry a response to
limited resources within the park, or have these modern bison carried on historical
movement patterns of their ancestors? The long distance migrations of immense herds of
bison across the plains were well documented prior to their near extirpation (McHugh
1972; Barsness 1985). The GYA bison exhibit fairly predictable, limited seasonal
migratory movements that may represent a microcosm of bison migration patterns of the
past. Future genetic studies using DNA extracted from historic bison skulls found within
the GYA, and collaboration with archeologists may provide answers to some of these
questions (Cannon 2001; Cannon 2007).
This history of bottlenecks and founder events, rather than natural bison ecology,
may provide the most plausible explanation for the lower genetic differentiation we
observed between the YNP and GTNP bison populations. Bison from YNP were used to
found the GTNP bison population in 1948 (USDOI-NPS et al. 1996). In 1963, brucellosis
was discovered in the GTNP bison population, which had been maintained between 15 to
30 animals, the herd was subsequently reduced to nine calves, and supplemented a year
later with 12 adult bison from Theodore Roosevelt National Park (TRNP) (USDOI-NPS
et al. 1996). The TRNP population was founded by bison from Ft. Niobrara National
Wildlife Refuge (FNNWR), which has only haplotype 6 (Ward et al. 1999). Both TRNP
and FNNWR have evidence of hybridization with cattle (Halbert and Derr 2007).
Therefore, the rate and direction of gene flow between GTNP and YNP should be further
11
investigated using microsatellite loci, along with additional surveillance for
hybridization.
The field collection, laboratory, and molecular genetic techniques and protocols
developed through this study provide an approach that will allow an expanded assessment
of genetic diversity and population structure for the GYA bison. The high amplification
success and low error rates we achieved demonstrate that non-invasive fecal DNA
sampling is a viable approach for conducting population genetic studies of free ranging
bison. This study has provided evidence for population structure among the GYA
breeding groups, advanced the field of non-invasive studies in wildlife, and opened the
door to future studies that will provide crucial information for the genetic conservation
and ecological restoration of wild bison.
12
Figure 1-1. Map of YNP showing locations of bison breeding groups as described by Meagher 1973, Taper and Meagher 2000, Meagher et al. 2002 (GYA map from USDOI-NPS 2007)
Lamar Valleybreeding group
Mirror Plateaubreeding group
Hayden Valleybreeding group
Antelope Flatsbreeding group
Wolf Ridge Roadbreeding group
West capture site
North capture site
13
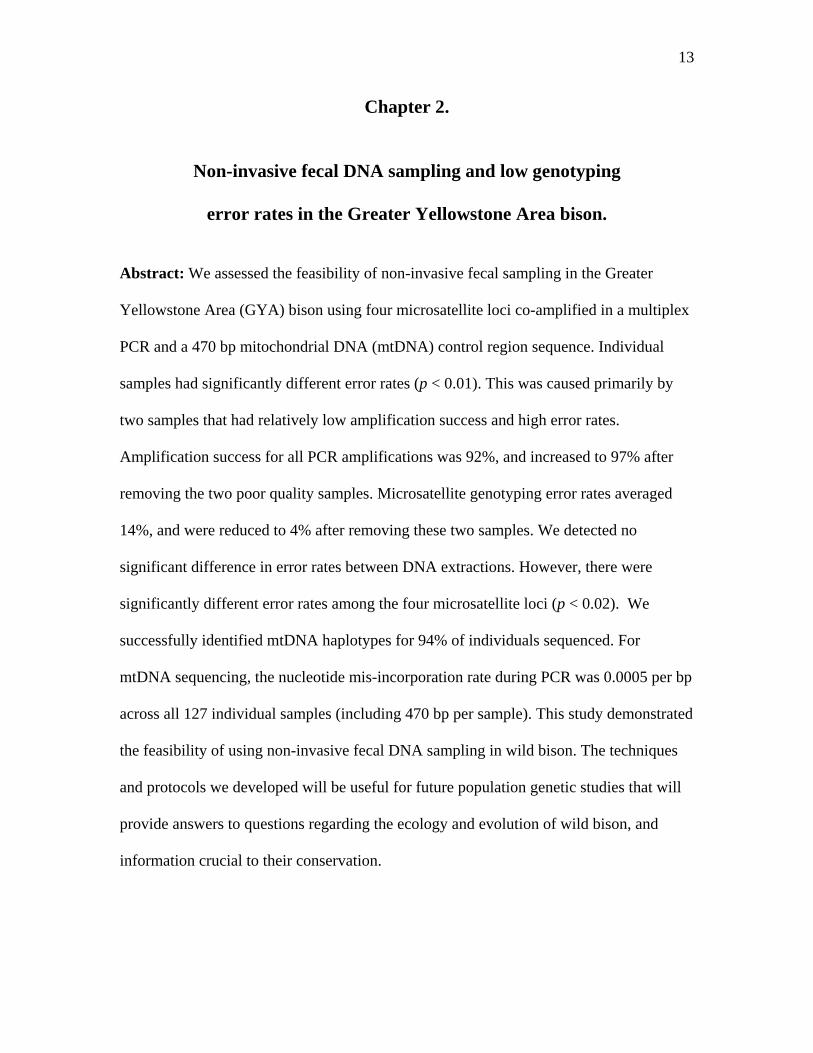
Chapter 2.
Non-invasive fecal DNA sampling and low genotyping
error rates in the Greater Yellowstone Area bison.
Abstract: We assessed the feasibility of non-invasive fecal sampling in the Greater
Yellowstone Area (GYA) bison using four microsatellite loci co-amplified in a multiplex
PCR and a 470 bp mitochondrial DNA (mtDNA) control region sequence. Individual
samples had significantly different error rates (p < 0.01). This was caused primarily by
two samples that had relatively low amplification success and high error rates.
Amplification success for all PCR amplifications was 92%, and increased to 97% after
removing the two poor quality samples. Microsatellite genotyping error rates averaged
14%, and were reduced to 4% after removing these two samples. We detected no
significant difference in error rates between DNA extractions. However, there were
significantly different error rates among the four microsatellite loci (p < 0.02). We
successfully identified mtDNA haplotypes for 94% of individuals sequenced. For
mtDNA sequencing, the nucleotide mis-incorporation rate during PCR was 0.0005 per bp
across all 127 individual samples (including 470 bp per sample). This study demonstrated
the feasibility of using non-invasive fecal DNA sampling in wild bison. The techniques
and protocols we developed will be useful for future population genetic studies that will
provide answers to questions regarding the ecology and evolution of wild bison, and
information crucial to their conservation.
14
INTRODUCTION
Wild bison are at risk of genomic deterioration as a result of population
bottlenecks, hybridization, and domestication (Freese et al. 2007). The Greater
Yellowstone Area (GYA) bison represent two of only three remaining populations in the
U.S. without hybridization with cattle (Freese et al. 2007; Halbert and Derr 2007).
Knowledge regarding the distribution of genetic diversity among bison would help
managers to conserve the diversity remaining in bison. GYA bison breeding groups,
which congregate during the summer breeding season, should be targeted for sampling to
evaluate genetic population structure because this is when most gene flow between these
groups occurs. Unfortunately, traditional invasive methods of obtaining blood or tissue
samples by capturing free ranging bison are extremely difficult, costly, and dangerous for
both the bison and research personnel. Traditional sampling entails a high risk of
physiological stress and potential mortality associated with immobilizing agents.
We developed an alternative approach for acquiring DNA samples from wild
bison in the field. Non-invasive fecal sampling has been used, with a high degree of
success, in studies of ungulates, such as alpine ibex (Capra ibex) and Corsican mouflon
(Ovis musimon), bighorn sheep (Ovis canadensis) (Maudet et al. 2004; Luikart et al.
2007). Benefits of fecal sampling in wild, free ranging animals, such as bison, are three
fold. First, individuals may be observed at safe distances for social dominance ranking,
sex, and age group prior to collection of feces, thus, providing an opportunity to collect
additional data, without disturbing individuals of interest. Second, fecal samples provide
information for infectious diseases (i.e. bacteria, viruses, and parasites, etc.), diet, or
hormone status (e.g. pregnancy or stress) (Borjesson et al. 1996; Möstl and Palme 2002;
15
Waits and Paetkau 2005). Third, non-invasive fecal sampling can be used to address
questions regarding population genetics of free ranging bison populations.
DNA amplification from fecal samples (as well as other non-invasive sample
types) often yields high genotyping error rates. However, seasonal differences in forage
quality affect genotyping error rates in ungulates. Therefore, genotyping error rates may
be higher in spring and summer due to forage quality (Maudet et al. 2004). An
assessment of genetic variation and substructure among GYA bison breeding groups
requires sampling during summer months, when genotyping error rates might be highest
due to forage quality (Maudet et al. 2004). Bison typically form pie-shaped fecal
depositions that are likely more difficult to extract DNA from compared to fecal pellets
(Manel et al. 2004). However, non-invasive fecal DNA sampling has been successfully
employed for genetic studies in African and Asian elephants, which form dung piles
larger than bison feces (Vidya et al. 2005; Archie et al. 2006).
The primary objective of this study was to develop and evaluate non-invasive
fecal sampling techniques to facilitate genetic studies of free ranging bison. We
quantified PCR amplification success, microsatellite genotyping error rates, and mtDNA
sequencing error rates from bison fecal DNA samples.
METHODS
Sampling and extraction
Matched blood and fecal samples were collected from eight radio-collared female
adult bison by the YNP Bison Ecology Program staff in September 2006. Each fecal
16
sample was extracted twice using the extraction process described below (Fig. 1). Each
extraction was genotyped five times with four microsatellite loci.
Blood samples were applied to Whatman© FTA cards according to manufacturer’s
instructions. For DNA recovery for PCR, we used two separate punches from each FTA
card that were purified according to manufacturers’ instructions. Two independent
extractions (purifications) per individual were genotyped with the four microsatellite loci.
Fecal samples for mtDNA studies were collected from 127 bison within YNP and
GTNP, during the rut (July 2006). Most samples (~ 5 grams) were collected within 10-
15 minutes of defecation and placed into vials containing ~20 mls of 95% ethanol
(ETOH), and immediately placed into portable coolers until frozen at -20º C for up to 1
year prior to extraction in a laboratory designated for non-invasive samples.
All fecal extractions were carried out in a designated non-invasive laboratory.
Each of the eight fecal samples was extracted twice for microsatellite analyses, and 127
fecal samples only extracted once mtDNA studies. Sterile filter tips, transfer pipettes,
collection tubes, and microtubes were used. The QIAamp© Stool Mini Kit (QIAGEN)
was used to extract genomic DNA from all fecal samples according to manufacturer’s
protocol with modifications as described below. Fecal samples were mixed well to insure
relatively homogeneous distribution of cellular material prior to sub-sampling for
extraction.
We transferred approximately 1.5 to 2 ml of fecal suspension into Eppendorf
microtubes which were centrifuged at 16,100 rcf (relative centrifugal force) for 5
minutes. As much ethanol as possible was drawn off, leaving behind approximately 200
μl of feces required for the QIAamp© extraction protocol. The QIAamp protocol was then
17
carried out with one last modification. The final elution of DNA was repeated by passing
the eluate through the column once more. This last step was modified in an attempt to
recover as much DNA as possible. The tubes were centrifuged for one minute at 16,100
rcf. Negative extraction controls, containing sterile distilled water, were used along with
each set of fecal extractions to monitor for possible cross contamination.
Microsatellite PCR and genotyping error rates
We screened a set of 36 microsatellite loci for use with fecal DNA samples,
which were previously used in other genetic studies of bison (Halbert (2003). Only loci
that were previously found to have a minimum heterozygosity of 0.50 in GYA bison
were used to provide high power for future population genetic studies. We identified four
dinucleotide loci with allele ranges less than 200 bp, BM 711(157-163 bp; NED),
BM2113 (123-143 bp; NED), BMS1001 (101-109 bp; 6- FAM), and BMS2258 (123-144
bp; VIC) for use in a single multiplex PCR to estimate genotyping error rate (Appendix
1).
Multiplex PCR was carried out in 10 μl volumes containing 2 μl sterile HPLC
H2O, 5 μl QIAGEN Multiplex PCR Mix, 1 μl QIAGEN Q-Solution, 1 μl 10x primers
(Table 1), and 1 μl template DNA. PCR was performed in an MJ Research PTC-200
Peltier Thermal Cycler using the following touchdown profile: 95º C for 5 min, followed
by one cycle of 94º C for 30 s, 58º C for 1 min 30 s, and 72º C for 20 s. For the
subsequent 19 cycles, all conditions remained the same except that the annealing
temperature decreased by 0.5 degrees per cycle. This was followed by 26 cycles of 94º C
for 30 s, 48º C for 1 min 30 s, and 72º C for 20 s. The profile concluded with a single
extension of 72º C for 10 min.
18
Fragment analysis was carried out on an ABI 3130xl using the GS-600 LIZ size
standard and GeneMapper v3.7 software was used to size fragments and call alleles for
each locus. Peaks less than 50 relative fluorescent units were not scored. Two people
independently scored all electropherograms for each locus. True genotypes were assumed
to be those obtained from DNA amplified from high quality blood samples.
Amplification success (AS) was calculated by the proportion of PCR amplifications that
resulted in a scoreable genotype. Allelic dropout (AD) rate was inferred when a
homozygous genotype was scored for a heterozygous individual known from analysis of
the corresponding blood sample. Allelic dropout rate was computed as the proportion of
all genotypes among loci and individuals with a dropout. False alleles (FA) were inferred
when a different allele was observed in a replicate PCR compared to true genotype
known from blood.
A generalized linear mixed model (GLMM) was used to test for differences in
error rates among individual samples, loci, and between extractions per Steele (1996),
and implemented using Gauss 7.0 Aptech Systems (http://www.aptech.com/). GLMM
allows us to broaden the scope and inference of the individual samples used for
evaluating genotyping error rate to the “population” of samples randomly collected in the
field (Steele and Hogg 2003).
mtDNA PCR and error rate
We surveyed NCBI-GenBank and relevant literature to identify a short (< 500 bp)
mtDNA sequence that could potentially be amplified from bison feces. Alignment of
bison mtDNA D-loop sequences; AF083357 through AF083364 (Ward et al. 1999),
CIC1 and CIC2 (Vogel et al. 2006) in MEGA 3.1 (Kumar et al. 2004), reveals 10 unique
19
B. bison haplotypes and twelve variable sites within a 408bp section of this region.
Primers BISCR-16348F and BISCR-16990R were used to amplify the first 470 bp of the
mtDNA control region (Vogel et al. 2006). These same primers were used by Shapiro et
al. (2004) to amplify this same region of the D-loop from fossil Bison bison bones
ranging in age from modern to >60 ka BP.
Primers BISCR-16348F 5'-CTACAGTCTCACCGTCAACCC-3' and BISCR-
16990R 5'-GATGAGATGGCCCTGAAGAA-3' were used to amplify a 470 bp segment
of the bison mtDNA control region (Shapiro et al. 2004; Vogel et al. 2006). PCR was
carried out in 25 μl volumes containing; 8.95 μl sterile HPLC H2O, 2.5 μl
Invitrogen©10X PCR buffer, 1 μl dNTP’s, 0.5 μl of each primer, 2.5 μl BSA (2ng/μl),
1.25 μl MgCl (50 mM), 0.3 μl Invitrogen© Platinum Taq Polymerase (5 units/μl), and 7.5
μl of template DNA. PCR was performed in an MJ Research PTC-200 Peltier Thermal
Cycler using the following touchdown protocol: 94º C for 5 min, followed by one cycle
of 94º C for 30 s, 60º C for 30 s, and 72º C for 30 s. For the subsequent 10 cycles, all
conditions remained the same except that the annealing temperature decreased by 0.5
degrees per cycle. This was followed by 25 cycles of 94º C for 30 s, 55º C for 30 s, and
72º C for 30 s. The profile concluded with a single extension of 72º C for 5 min.
PCR products were purified using QIAquick© purification columns according to
manufacturers’ instructions with one exception; the final elution was carried out with 20
μl of Buffer EB instead of the recommended 30-50 μl to compensate for potential low
quantity template DNA . The amount of purified post-PCR product was quantified by
fluorometry prior to sequencing to insure that 5-10 ng/μl of amplified DNA was present
in the sample. Sequencing was performed on the ABI 3100xl sequencer. Sequences were
20
visualized, assessed for quality, and edited with Chromas 2.31
(http://www.technelysium.com.au/chromas.html). MEGA 3.1 (Kumar et al. 2004) was
used to align edited mtDNA sequences with known bison haplotypes. Comparison of
sequence nucleotide variation at known variable sites determined the haplotype of each
sample. PCR was repeated for sequences that matched a known haplotype at all known
variable sites, but had nucleotide mis-incorporations at other sites, to rule out the
existence of novel haplotypes. Repeated PCR amplification and sequencing was
performed to resolve these ambiguities and determine the correct haplotype for those
samples.
Ambiguous sequences that could not be scored primarily due to numerous
overlapping nucleotide peaks were re-extracted, PCR amplified, and sequenced again to
determine the correct haplotype. Samples that repeatedly yielded ambiguous sequences
post re-extraction were not assigned haplotypes. The per nucleotide error rate for mtDNA
amplified from feces has not been previously published. We estimated the nucleotide
mis-incorporation error rate is the number of erroneous nucleotide mis-incorporations
(that occurred during PCR) divided by the total number of nucleotides sequenced.
RESULTS
Microsatellite loci
Individual sample quality had a significant overall effect on microsatellite
genotyping error rates (p < 0.01) (Table 1). Two samples contributed to the majority of
genotyping errors. The combined errors from these two samples accounted for 34 of 72
(47%) allelic dropout errors and produced the one false allele. Removal of these two
21
individuals from the data set decreased the total overall genotyping error rate from 15%
to 5% across all loci and samples, and increased amplification success from 92% to 97%
(Table 1). There were no significant differences in error rates between extractions. This
provided evidence that our extraction techniques are relatively consistent across all
samples.
There were significant differences in error rates among loci (p < 0.01) (Table 1).
Error rates varied among loci from 12% to 20%, and were reduced to 1% to 8% when
YELL-024 and YELL-030 are excluded from the analysis. Even with the exclusion of the
two poor quality samples from the GLMM, we still detected significant differences in
error rates among loci (p < 0.02). We observed no tendency for larger alleles to have
higher error rates. BM 711, which has the largest allele range (157-163), produced fewer
errors than loci in the median range (BM2113; 123-143 and BMS2258; 123-144). Within
loci, we found no association between larger allele size and error rates.
mtDNA and error rate
We obtained sequences from 120 samples (94%) that matched with the first 408
bp of two sequences previously identified as haplotypes 6 and 8 (GenBank accessions
AF083362 and AF083364) by Ward et al. (1999). There are four base-pair differences
between these two haplotypes, and three variable sites; two of which are single nucleotide
polymorphisms (SNP’s), and one insertion-deletion.
The remaining seven samples produced ambiguous sequences that were not
scoreable due to multiple overlapping nucleotide peaks. The initial PCR for two of these
samples yielded poor quality ambiguous sequences. Therefore PCR and sequencing was
repeated. Two of these samples produced abbreviated or fragmented sequences that
22
aligned with less than two out of three diagnostic sites, after a second PCR amplification.
The remaining five samples consistently produced sequences with multiple overlapping
nucleotide peaks, which precluded alignment with any haplotype. Multiple attempts
involving repeated extraction, PCR amplification, and sequencing failed to resolve this
issue for those samples.
Ambiguous sequences that matched a haplotype at all three diagnostic sites, but
had random nucleotide mis-incorporations at other sites, occurred in 4% of all samples.
Haplotypes were not identified for these samples until repeated PCR and sequencing
yielded a sequence that unambiguously aligned with a known haplotype without mis-
incorporations at other sites within the sequence. The nucleotide errors were resolved for
all of these samples on the second PCR. The per-nucleotide error rate was low for all of
these samples, with the overall per-nucleotide error rate across all samples being 0.05%
DISCUSSION
We successfully extracted and amplified DNA from all eight matched fecal
samples. However, because two samples had exceptionally high error rates, we
recommend that future studies screen samples and exclude those that yield low
amplification and high error rates. Thus, it is important to collect many extra fecal
samples in the field to insure that there are sufficient high quality samples available for
genetic study of interest. For bison, it may be necessary to collect at least 25% more fecal
samples than what is needed to insure an adequate number are available for genetic
analyses.
23
We successfully optimized a multiplex (4-locus) PCR. This is important because
multiplexing is especially challenging for poor quality DNA samples, and not widely
used in non-invasive studies, but can greatly reduced time and cost of analyses while
consuming less DNA (which is limited in low quality non-invasive samples). A single
multiplex PCR allows for rapid screening to identify fecal samples with sufficiently high
quality or quantity of template DNA. We recommend that future non-invasive studies
use multiplexes, which was facilitated here by the use of QIAGEN Multiplex PCR kit.
Only two other studies that employed noninvasive fecal DNA sampling for
species that have non-pellet form feces reported higher amplification and lower error
rates than we found in our study (Appendices 2-2 and 2-3). Fernando et al. (2003)
reported amplification success of 97.5 to 100%, for six microsatellite loci, which were
slightly higher than our overall AS rate (excluding poor quality samples). Our AD rate
(4%) was nearly twice that reported by Fernando et al. (2%). Parsons (2001) reported a
slightly higher AS rate (98.1%) than our study and a lower error rate (2%) for bottlenose
dolphins (Tursiops truncatus). However, a noninvasive study of harbor seals (Phoca
vitulina) reported very a low AS rate (60%) relative to our results (Reed et al.1997).
The AS rate (97%) we achieved was also much higher than that found in
noninvasive studies of African and forest elephants which ranged from 60% to 72%
(Appendix 2-1) (Eggert et al. 2003; Fernando et al. 2003; Buchan et al. 2005). The rate
of AD for African elephants ranged from 15% to 25% across 12 loci, and an average of
15% AD rate was reported for 7 loci amplified from forest elephant feces (Appendix 2-
2). Our AS rates were much higher, and AD error rates were lower those reported for
terrestrial carnivore species such as wolves (Canis lupus), coyotes (Canis latrans,), black
24
bears (Ursus americanus), and brown bears (Ursus arctos) as well (Appendices 2-1 and
2-2) (Wasser et al. 1997; Kohn et al. 1999; Lucchini et al. 2002; Murphy et al. 2002).
Noninvasive fecal DNA studies in primates reported the lowest AS and highest AD rates
relative to our study results (Appendices 2-1 and 2-2) (Bradley et al.2000; Lathuillière et
al. 2001; Morin et al. 2001).
We found no large effect of extractions to error rates. Therefore, only one
extraction per fecal sample is necessary prior to screening for quality. It would be much
more cost effective and efficient to perform one extraction, and screening for sample
quality with a single multiplex PCR, before using a sample for complete genetic studies.
For mtDNA, we successfully amplified high quality sequences from 93% of fecal
DNA extracts on the first attempt. Sequences that produced nucleotide mis-
incorporations that did not match any previously described haplotypes were PCR
amplified and sequenced at least once more. This resolved all nucleotide mis-
incorporation errors. Seven apparently low quality samples yielded ambiguous sequences
with multiple overlapping nucleotide peaks. Repeated PCR amplification and sequencing
did not resolve this issue. However, our success rate for amplifying scoreable haplotypes
was much higher than for scoreable microsatellite genotypes. The higher success is most
likely due to the fact that mtDNA occurs in multiple copies within each cell. Therefore,
mtDNA studies from fecal samples may require collection of only about 10% more
samples in the field than necessary, as opposed to 25% more for microsatellite studies.
The per nucleotide error rate (0.0005) for fecal DNA generated by our study
demonstrates that caution must exercised in identifying new haplotypes through
sequencing. Our fecal DNA extracts produced higher than average nucleotide mis-
25
incorporation error rate (0.0005) for the platinum taq polymerase (0.0001) used in our
PCR amplifications (Tindall and Kunkel 1988). Samples that do not match previously
identified haplotypes should be sequenced in both directions at least twice before the
haplotype can be confirmed. An initial subset of fecal DNA extractions should be
sequenced in both directions to screen for potential haplotype diversity before proceeding
with full mtDNA studies. In addition, initial sequencing in both directions will determine
whether individual haplotype assignment can be confidently determined from sequencing
in only one direction for cost effectiveness.
This study clearly demonstrates that non-invasive fecal DNA sampling is a
feasible approach for conducting population genetic studies of wild bison. We achieved
reasonably high amplification success and minimal error rates through strict adherence to
systematically developed field and laboratory protocols. This will allow us to use non-
invasive fecal DNA sampling in an efficient and cost effective manner. The results of this
study further advance the field of non-invasive genetic sampling in wildlife while
providing another example of the feasibility and usefulness of this approach.
26
Figures: Figure 2-1. Flow diagram showing the two extractions per fecal sample, and five, multiplex PCR amplification (using four microsatellite loci) per extraction, and number of genotypings per individual radio-collared bison used to assess amplification and genotyping error rates.
Fecal Sample
Extraction 1 Extraction 2
Extraction
PCR
5 Genotypes 5 Genotypes
27
Tables: Table 2-1. Amplification success (AS), allelic dropout (AD) rates for all loci co-
amplified in the multiplex PCR. Total and average error rates were first estimated across all genotypings (loci and individuals), and then excluding data from two poor quality individual samples, YELL-024 and YELL-030.
Average
Extraction 1 Extraction 2 per locus Total Total errorsLocus AS AD AS AD AS AD error rates w/o 024 & 030
BM711 0.93 0.11 0.95 0.21 0.94 0.16 0.16 0.03
BM2113 0.93 0.24 0.90 0.06 0.91 0.15 0.15 0.04
BMS1001 0.95 0.18 0.98 0.05 0.96 0.12 0.12 0.01
BMS2258 0.90 0.22 0.85 0.18 0.88 0.20 0.20 0.08
Averages: 0.93 0.19 0.92 0.12 0.92 0.16 0.14 0.04
Averages excludingYELL-024 & YELL-030: 0.97 0.21 0.97 0.04 0.97 0.12
28
Table 2-2. Amplification success (AS), allelic dropout (AD) rates for all individual samples. Averages were first estimated across all individuals, and then excluding data from the two poor quality samples; YELL-024 and YELL-030.
Average
Extraction 1 Extraction 2 per sample Total Sample ID AS AD AS AD AS AD error ratesYELL-003 1.00 0.08 1.00 0.00 1.00 0.04 0.04
YELL-011 0.90 0.03 1.00 0.03 0.95 0.03 0.03
YELL-017 1.00 0.03 1.00 0.00 1.00 0.01 0.01
YELL-024 0.95 0.26 0.95 0.21 0.95 0.24 0.24
YELL-030 0.90 0.22 0.88 0.23 0.89 0.23 0.23
YELL-031 0.98 0.13 0.90 0.03 0.94 0.08 0.08
YELL-038 0.98 0.00 0.95 0.00 0.96 0.00 0.00
YELL-039 1.00 0.00 1.00 0.00 1.00 0.00 0.00
Averages: 0.96 0.09 0.96 0.06 0.96 0.08 0.08
Averages excludingYELL-024 & YELL-030: 0.98 0.20 0.98 0.04 0.98 0.12 0.05

29
Appendices Appendix 2-1. Characteristics of microsatellite loci amplified in the multiplex PCR; primers, and chromosome location (Halbert 2003). Allele ranges, and number of alleles (NA) found in the eight radio-collared bison used to assess amplification success and error rates for this study.
l
AlleleLocus Primers Size Range N A Chromosome
BM711 F 5’- CAGCATCAGCAACTAACATAGG -3' 157-163 3 8R 5’- TGGACCATGAGGGAAGTCTC -3'
BM2113 F 5’- GCTGCCTTCTACCAAATACCC -3’ 123-143 4 2R 5’- CTTCCTGAGAGAAGCAACACC -3’
BMS1001 F 5’- GAGCCAATTCCTACAATTCTCTT -3' 101-109 4 27R 5’- AGACATGGCTGAAATGACTGA -3'
BMS2258 F 5’- CCAGCAGAAGAGAAAGATACTGA -3' 123-144 5 7R 5’- AGTGGTAGAACTTCCATCTCACA -3'
Appendix 2-2. Amplification rates (AS) reported in our study and for other species with non-pellet form feces (Reed et al. 1997; Wasser et al. 1997; Kohn et al. 1999; Bradley et al. 2000; Lathuillière et al. 2001; Morin et al. 2001; Parsons 2001; Lucchini et al. 2002; Murphy et al. 2002; Eggert et al. 2003; Fernando et al. 2003; Buchan et al. 2005).
0%
20%
40%
60%
80%
100%
Asian e
lepha
nt
Bottlen
ose d
olphin
America
n biso
nW
olf
Coyote
Brown b
ear
Harbor
seal
Chimpa
nzee
Macaq
ue
Black b
ear
Forest
eleph
ant
African
elep
hant
Gorilla
Species
AS
rate
30
Appendix 2-3. Allelic dropout (AD) rates reported in our study and for other species with non-pellet form feces (Morin et al. 2001; Parsons 2001: Lucchini et al. 2002; Murphy et al. 2002; Eggert et al. 2003; Fernando et al. 2003; Buchan et al. 2005).
0%
5%
10%
15%
20%
25%
Asian e
lepha
nt
Bottlen
ose d
olphin
America
n biso
n
Brown b
ear
Forest
eleph
ant
Wolf
African
elep
hant
Chimpa
nzee
Species
AD
rate
31
Chapter 3.
Genetic Population Structure in the Greater Yellowstone
Bison Revealed by Mitochondrial DNA Analyses
Abstract: The Greater Yellowstone Area (GYA) populations are crucial for conservation
of wild bison (Bison bison). The GYA provides the only place in the United States where
the ecology and population genetic structure of free ranging plains bison populations may
be observed. There are three locations where breeding groups congregate within YNP
during the rut season; Hayden Valley, Lamar Valley, and Mirror Plateau. Bison in Grand
Teton National Park (GTNP) primarily congregate in Antelope Flats during the rut. Non-
invasive sampling and mitochondrial DNA studies were conducted to assess population
subdivision. We hypothesized that fidelity to breeding areas would result in genetic
differences among GYA breeding groups. Non-invasive fecal samples were collected
from bison within the geographic locations of breeding groups during two consecutive rut
seasons. We used sequencing and restriction fragment length polymorphism (RFLP)
analysis of a 470 bp segment of the bison mtDNA control region to assess population
structure. We found substantial differentiation between YNP and GTNP populations (FST
= 0.1912, p < 0.001). We also found substantial differences in haplotype frequencies
between the Lamar Valley and Hayden Valley breeding groups (FST = 0.3667, p < 0.001).
Within Hayden Valley haplotype frequencies were different between two consecutive
years (FST = 0. 0536, p < 0.05). However, the genetic differences between the Lamar
Valley and Hayden Valley were highly significant for both 2005 and 2006. The relatively
32
strong fine scale genetic differentiation among breeding groups within YNP suggests
female philopatry to natal ranges.
INTRODUCTION
The most immediate genetic threats to bison conservation are population
bottlenecks, hybridization with cattle, domestication, and anthropogenic selection (Freese
et al. 2007). The Yellowstone bison is one of only two or three remaining non-hybridized
source U.S. populations for bison reintroduction and restoration (Freese et al. 2007).
Previous genetic studies, using microsatellite loci, revealed that the GYA bison have a
relatively high degree of genetic variation and no evidence of hybridization (Ward et al.
1999; Halbert 2003; Halbert and Derr 2007). This previous study, which relied upon
opportunistic sampling of bison on winter ranges outside park boundaries, suggested the
presence of three subpopulations (or breeding groups) within YNP (Halbert 2003).
An expanded assessment of population structure and gene flow between GYA
bison populations, using mtDNA and direct sampling of breeding groups, would further
knowledge of the distribution of genetic variation in the parks. There are three locations
where breeding groups congregate within YNP during the rut season; Hayden Valley,
Lamar Valley, and Mirror Plateau (Meagher 1973; Taper and Meagher 2000; Meagher et
al. 2002; Geremia et al. 2005; Jones et al. 2006). Bison in Grand Teton National Park
(GTNP) primarily congregate in Antelope Flats during the rut (USDOI-NPS and USFWS
2007). However, a smaller group of bison are known to range around Wolf Ridge Road
near Moran, Wyoming (S. Cain pers. comm., Supervisory Biologist, GTNP, 2006).
33
Female philopatry to natal ranges can play an important role in determining the
genetic structure of populations (Chesser 1991; Storz 1999). Philopatry has been
documented in other ungulates such as roe deer (Capreolus capreolus), bushbuck
(Tragelaphus scriptus), Svalbard reindeer (Rangifer tarandus platyrhynchus), and Soay
sheep (Ovis aries) (Côté et al. 2002; Coltman et al. 2003; Nies et al. 2005; Wronski and
Apio 2006). Bison have been observed to assemble in matrilineal groups which may
include several generations of related individuals which travel together (McHugh 1972;
Lott 2002; Halbert 2003). Social structure, polygyny, and dominance hierarchies have
been documented in bison as well (Lott 2002; Gates et al. 2005). However, no studies
have confirmed female philopatry in free ranging, wild bison through the use of genetic
markers such as mtDNA.
Mitochondrial DNA (mtDNA) is especially useful for genetic studies involving
non-invasive fecal samples where a limited number of cells may be present in fecal
samples. We used non-invasive fecal DNA sampling to minimize disturbance to bison
activities, and improve our ability to collect a sample of DNA from a significantly large
proportion of the respective breeding groups. Previous studies revealed 10 B. bison
haplotypes and 12 variable sites within a 470 bp section of the bison mtDNA control
region (Polziehn et al. 1995; Polziehn et al. 1996; Ward et al. 1999; Shapiro et al.2004;
Vogel et al. 2006). The variability of the 470 bp sequence could prove useful for mtDNA
studies in the GYA bison populations to assess population structure.
The primary objective of this study was to assess population structure among the
GYA bison using mtDNA amplified from bison feces. We hypothesize that because
34
fidelity to breeding areas may be high, there should be genetic differences among bison
breeding groups of the Yellowstone population, and between YNP and GTNP.
METHODS
Sample collection and storage
We collected fecal samples from bison within the geographic range of each
breeding group during the 2005 and 2006 breeding seasons. We determined the relative
age class of individuals sampled through field observations of horn length and width,
body size, and condition (especially for older animals). Social dominance ranking was
recorded for individuals who displayed obvious behavioral clues such as displacement of
other bison from foraging patches or wallowing pits, false charges, challenges for mates,
and leading groups of other bison. Most samples (~ 5 grams) were collected within 10-15
minutes of defecation and placed into vials containing approximately 20 ml of 95%
ethanol, and placed into coolers for up to 8 hours before they were frozen. Fecal samples
were stored frozen at -20º C for up to 1 year prior to extraction.
Extraction
All fecal extractions were carried out in a designated non-invasive laboratory.
Sterile filter tips, transfer pipettes, and microtubes were used. The QIAamp© Stool Mini
Kit (QIAGEN) was used to extract genomic DNA from all fecal samples according to
manufacturer’s protocol with modifications. Negative extraction and PCR controls were
used to monitor for possible contamination.
35
PCR amplification
Primers BISCR-16348F 5'-CTACAGTCTCACCGTCAACCC-3' and BISCR-
16990R 5'-GATGAGATGGCCCTGAAGAA-3' (Shapiro et al. 2004; Vogel et al. 2006)
were used to amplify a 470 bp segment of the bison mtDNA control region. PCR was
carried out in 25 μl volumes containing; 8.95 μl sterile HPLC H2O, 2.5 μl
Invitrogen©10X PCR buffer, 1 μl dNTP’s, 0.5 μl of each primer, 2.5 μl BSA (2ng/μl),
1.25 μl MgCl (50 mM), 0.3 μl Invitrogen© Platinum Taq Polymerase (5 units/μl), and 7.5
μl of template DNA. Amplification was performed in an MJ Research PTC-200 Peltier
Thermal Cycler using the following touchdown protocol: 94º C for 5 min, followed by
one cycle of 94º C for 30 s, 60º C for 30 s, and 72º C for 30 s. For the subsequent 10
cycles, all conditions remained the same except that the annealing temperature decreased
by 0.5 degrees per cycle. This was followed by 25 cycles of 94º C for 30 s, 55º C for 30 s,
and 72º C for 30 s. The profile concluded with a single extension of 72º C for 5 min.
Sequencing
PCR products were purified using QIAquick© purification columns according to
manufacturers’ instructions with one exception; the final elution was carried out with 20
μl of Buffer EB instead of the recommended 30-50 μl to compensate for potential low
quantity template DNA . The amount of purified post-PCR product was quantified by
fluorometry to insure that 5-10 ng/μl of amplified DNA was present for sequencing on
the ABI 3100xl sequencer. Sequences were visualized, assessed for quality, and edited
using Chromas 2.31 (http://www.technelysium.com.au/chromas.html). MEGA 3.1
(Kumar et al. 2004) was used to align edited mtDNA sequences with known bison
haplotypes.
36
RFLP
PCR amplification was carried out as described above and digested with Ssp1,
which cuts haplotype 8, resulting in two fragments (372 bp and 98 bp in length).
Restriction digests were conducted in 20 μl volumes consisting of 11.3 μl sterile HPLC
water, 2 μl RE 10X buffer, 0.2 μl acetylated BSA (10μg/ μl), and 5 μl PCR product and
incubated at 37ºC for four hours. Digested products were run out on 2% agarose gels for
two hours. Gels were stained with ethidium bromide solution, and visualized using a
Hitachi FMBIOII scanner. We used 16 samples from YNP 2006 previously identified as
either haplotype 6 or 8 through sequencing as controls to test the accuracy of our RFLP
analysis. A set of 12 YNP 2005 samples identified as haplotype 6 were re-screened to
evaluate whether failure to digest could result in erroneous haplotype identification. No
haplotype identification errors were detected, thus validating the accuracy of the RFLP
analysis.
Data analysis
The combined results of sequencing and RFLP analysis were used to determine
the frequency and distribution of these haplotypes among the GYA bison populations,
and determine FST values. Significance of FST values were tested by contingency chi-
square analyses for comparisons among YNP breeding groups, and between parks.
RESULTS
Sequencing revealed two mtDNA control region haplotypes, amplified from
120 GYA bison fecal samples from the 2006 breeding season. These haplotypes matched
the first 408 bp of haplotypes 6 and 8 previously defined by Ward et al. (1999). RFLP
37
analysis was used to resolve between haplotypes for 59 bison fecal samples collected in
2005.
Significant differentiation was found between YNP and GTNP populations (FST
= 0.191, p < 0.001). Haplotype 6 was the most common in both parks, while haplotype 8
was found only in 34 YNP bison samples tested, occurring most frequently in Lamar
Valley (0.54) and Mirror Plateau (0.38), and least common in Hayden Valley 2005 and
2006 (0.10 and 0.00, respectively) (Table 3-1).
Among YNP breeding groups, we found substantial differentiation between the
Lamar Valley and Hayden Valley (FST = 0.367, p < 0.001). The bison sampled in Mirror
Plateau were more similar to the Lamar Valley breeding group (FST = 0.026) than they
were to bison sampled in Hayden Valley 2005 and 2006 (FST = 0.103, and FST = 0.231,
respectively, Table 3-2).
Within Hayden Valley, haplotype frequencies were different between two
consecutive years (FST= 0.054, p < 0.05). Haplotype 6 was found in 87% of bison
samples tested from Hayden Valley in 2005, and in 100% of samples tested from Hayden
during 2006 (Table 3-1). However, the genetic differences between Hayden Valley
(2005) and Lamar Valley were significant for both years (2005: FST= 0.218, p < 0.001,
2006: FST = 0.367, p < 0.001, Table 3-2).
DISCUSSION
The frequency of mtDNA control region haplotypes among the GYA bison
provided strong evidence for genetic differentiation among breeding groups (Fig. 3-1).
One of the most striking results of this study was the substantial differentiation we found
38
between the Lamar Valley and Hayden breeding groups. This was perhaps surprising for
several reasons. First, in 1936, 71 bison were translocated from Lamar Valley to Hayden
Valley and the Firehole, where bison had been absent for over 30 years (McHugh 1972;
USDOI, NPS 2000; Gates et al. 2005). Assuming that this translocation captured a fair
representation of haplotype frequencies present within Lamar during this time, we might
expect little differentiation between these two groups. Second, bison are highly mobile
and have been known to travel long distances in a short period of time (Carbyn 1997),
and Hayden and Lamar Valleys are separated by less than 50 kilometers.
However, the difference in haplotype frequencies between Hayden and Lamar
breeding groups may not be all that surprising when we consider the role of female
philopatry in determining genetic differentiation. Female philopatry has been observed in
other highly mobile ungulate species such as roe deer (Capreolus capreolus), bushbuck
(Tragelaphus scriptus), Svalbard reindeer (Rangifer tarandus platyrhynchus), desert
bighorn sheep (Ovis canadensis nelsoni), and Soay sheep (Ovis aries) (Côté et al. 2002;
Coltman et al. 2003; Epps et al. 2005; Nies et al. 2005; Wronski and Apio 2006). Female
philopatry to natal ranges can play an important role in determining the genetic structure
of populations (Chesser 1991; Storz 1999).
Marked animal re-location data recorded for adult female bison from the central
range reveals occasional movements west and north out of YNP park boundaries during
winter months (Gates et al. 2005). However, these marked bison always return to the
central range during the summer rut season (Gates et al. 2005). For example, YELL-011
(a radio-collared adult female identified as haplotype 6) has been documented to travel to
the northern range during winter month, and primarily range within Hayden Valley
39
during summer rut season (Gates et al. 2005). Interestingly, Christianson et al. (2005)
found significant differences in incisor wear, between female bison from the northern and
central ranges of YNP suggesting limited exchange of individuals between the ranges.
Differences in incisor wear were attributed to increased levels of fluoride content in
vegetation and water within central Yellowstone’s geothermal areas (Shupe et al. 1984;
Christianson et al. 2005)
. Finally, the diverse historic origins of the Lamar Valley bison, relative to the
Hayden Valley herd, may explain, in part, the differences in haplotype frequencies we
observed here. By 1902, YNP’s wild bison herd had been reduced from 200-300, through
illegal poaching, to about 25 animals that remained in Pelican Valley. This led to a
decision to introduce 21 bison from other sources into Lamar Valley that same year
(McHugh 1972; USDOI, NPS 2000; Gates et al. 2005). However, the Hayden Valley
bison descended from a single translocation of 71 individuals from Lamar Valley in 1936
that may not have captured the range of haplotype frequencies that were present in these
bison during that time.
We also observed differences in haplotype frequencies within Hayden Valley
between two consecutive breeding seasons. However, we found strong differences
between Hayden and Lamar breeding groups for both years (Table 3-2). A few radio-
collared adult females have been observed to move between Hayden Valley and Pelican
Creek during late summer and early fall (R. Wallen, Bison Ecologist, YNP, pers. comm.
2007). Re-location data from YELL-024 (an adult female identified as haplotype 8),
reveal movements between Hayden Valley and Pelican Creek during late summer and
early fall (R. Wallen, pers. comm. 2007). The lower FST values between Mirror Plateau
40
and Lamar Valley, in comparison to the higher values between these groups and Hayden
Valley (2005 and 2006) suggest that genetic exchange between Mirror Plateau and Lamar
Valley bison may occur more frequently than with central range animals (Table 3-2).
These data suggest a possible stepping-stone pattern of gene flow within YNP,
whereby genetic exchange is more likely to occur between adjacent subpopulations (or
breeding groups) than geographically distant ones. Therefore, because adjacent
subpopulations are more similar, genetic drift will have more of an effect and result in
greater differentiation among breeding groups in this model of gene flow. This observed
pattern of genetic differentiation is in contrast to the conclusions of Meagher et al. (2002)
who suggested that bison that previously ranged between Mirror Plateau and Pelican
Valley may have assimilated into the Hayden Valley bison after the mid to late 80’s.
Their conclusions were based on observations of large congregations of bison within
Hayden Valley during the rut, from air surveys conducted during 1983 to 2001. However,
the possible pattern of gene flow among YNP breeding groups, as suggested by the
observed haplotype frequencies, does appear to match closely with historic bison travel
routes described by Meagher (Taper et al. 2000; Gates et al. 2005). Therefore, the current
YNP bison population may be carrying on historical movement patterns of their
ancestors, which in turn has contributed to the pattern of genetic differentiation we
observed with mtDNA haplotypes.
Significant genetic differentiation between GTNP and YNP was found
previously by Halbert (2003) using 49 microsatellite loci (FST = 0.102). The FST (0.191)
we found for mtDNA was only twice that estimated from Halbert’s microsatellite data.
This difference is lower than would be expected, however, since mtDNA generally
41
represents only about 25% the effective population size of nuclear DNA (Birky et al.
1983; Allendorf and Luikart 2007). Furthermore, the FST values within YNP among
breeding groups, at a fine scale, were much higher (with the exception of Mirror Plateau
and Lamar Valley, FST = 0.026) than between GTNP and YNP, which are approximately
five times further apart (Table 3-2).
The FST value (0.191, p < 0.001) between GTNP and YNP may be attributed to
both the history of these populations and limited gene flow. There are isolated accounts
of a few individual bison from YNP traveling to GTNP. During the winter of 1996/97,
one adult female accompanied by two juvenile females from YNP were discovered on a
groomed road heading toward GTNP (S. Cain pers. comm. 2006). These females were
radio-collared to track their movements. They became permanent residents of the GTNP
herd, and subsequently bred within this population. A single bull from YNP migrated
between the parks outside of the breeding season (S. Cain pers. comm. 2006; R. Wallen
pers. comm. 2006). No migration of bison from GTNP to YNP has been documented.
The FST (0.191) value observed between YNP and GTNP, and the absence of haplotype 8
within GTNP may be explained by the history of bottlenecks and supplementation
experienced by these bison.
The GTNP bison herd originated in 1948 from 20 animals brought in from
Lamar Valley, YNP, which may have resulted in similar haplotype frequencies between
GTNP and YNP. Furthermore, in 1963 when brucellosis was discovered, all 13 adults
were destroyed, leaving only nine calves. The following year, GTNP received 12 adult
bison from the TRNP bison herd, which originated from Ft. Niobrara National Wildlife
Refuge (FNNWR) which contains only haplotype 6 (Ward et al. 1999).

42
The differences in haplotype frequencies among YNP breeding groups may be
attributed to both the natural biology of free ranging bison populations and the historical
origins of these bison. However, the history of the GTNP herd may be playing a greater
role than the natural ecology of wild bison in determining the genetic differences we
observed between the YNP and GTNP populations. Additional sampling should be
collected within the same locations for at least one more consecutive breeding season to
further evaluate temporal stability of mtDNA haplotype and microsatellite allele
frequencies among GYA breeding groups.
Estimating the rate and direction of gene flow between YNP and GTNP may be
especially important with respect to issues such as disease transmission, and the transfer
cattle genes to a non-hybridized bison population. No evidence of hybridization with
cattle has been found in either YNP or GTNP bison in other studies (Halbert and Derr
2007). Also, we did not detect any cattle haplotype among the samples tested for this
study. However, the GTNP bison originate, in part from herds where hybridization is
known to exist. There is no way to know whether the bison translocated from TRNP in
1964 were hybrids. Populations that show evidence of introgression can be considered
hybrid swarms, the result of generations of backcrossings with parental types and matings
among hybrids (Allendorf et al. 2001). The small sample size from GTNP (N = 39) may
have limited the power to detect hybridization within this population (Halbert and Derr
2007). The concern for possible introgression of cattle DNA into YNP warrants further
investigation with the addition of microsatellite loci, for estimating the rate and direction
of gene flow between GTNP and YNP.
43
The preferred alternative proposed for managing the GTNP bison population to
reduce disease risks and prevent habitat degradation from the rapidly growing herd, is to
cull bison through hunting over several years to maintain a population of about 500
individuals (USDOI-USFWS and NPS). The effects of this type of herd reduction to
heterozygosity have not been evaluated. Gross and Wang (2005) demonstrated, through
modeling of various management scenarios, that a population of 1000 animals would
have a 90% probability of maintaining 90% allelic diversity for 200 years. However,
these models were based on genetic data from YNP provided by Halbert (2003) without
accounting for any existing population subdivision within this herd, and did not include
data from GTNP.
Genetic data collected from bison during the breeding season, and on winter
ranges within YNP and outside park boundaries should be used to construct models under
various management scenarios to evaluate effects of culling to existing genetic diversity.
Modeling of various herd reduction scenarios for the GTNP bison population should be
conducted as well. The output generated by these models would provide crucial
information for agencies to evaluate the effects of current and proposed management
regimes to the genetic diversity of the GYA bison populations.
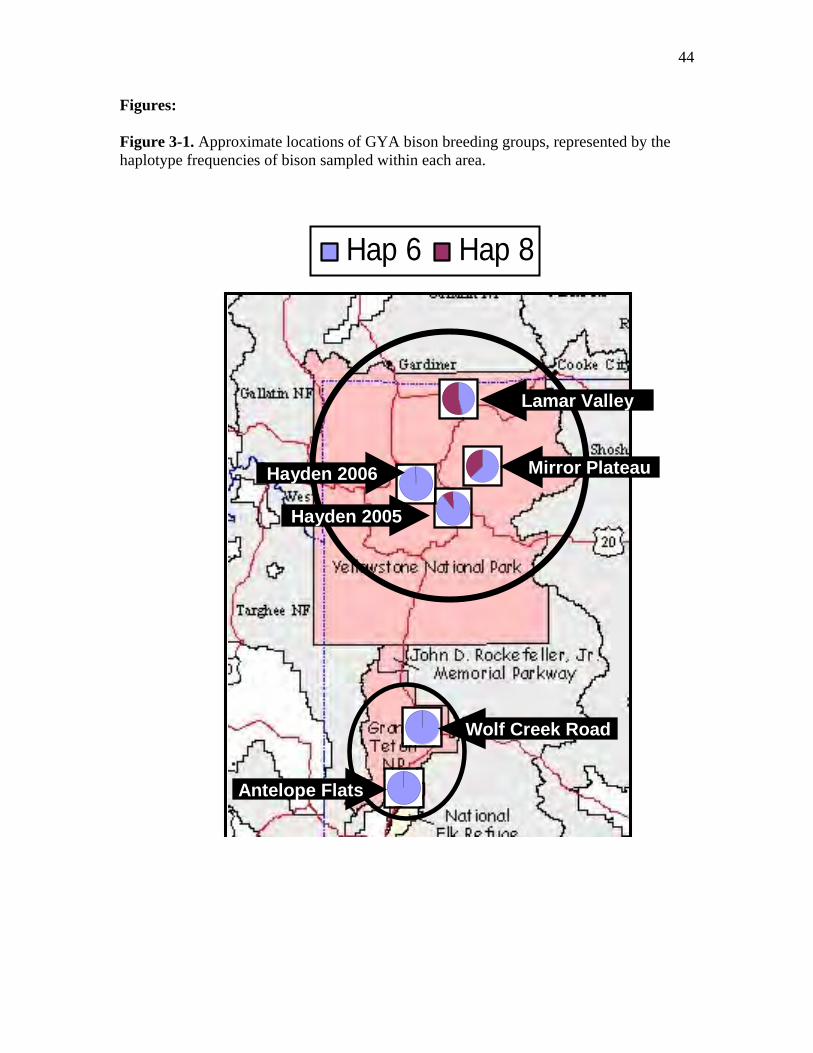
44
Figures: Figure 3-1. Approximate locations of GYA bison breeding groups, represented by the haplotype frequencies of bison sampled within each area.
Hayden 2006
Hayden 2005
Antelope Flats
Lamar Valley
Mirror Plateau
Wolf Creek Road
Hap 6 Hap 8
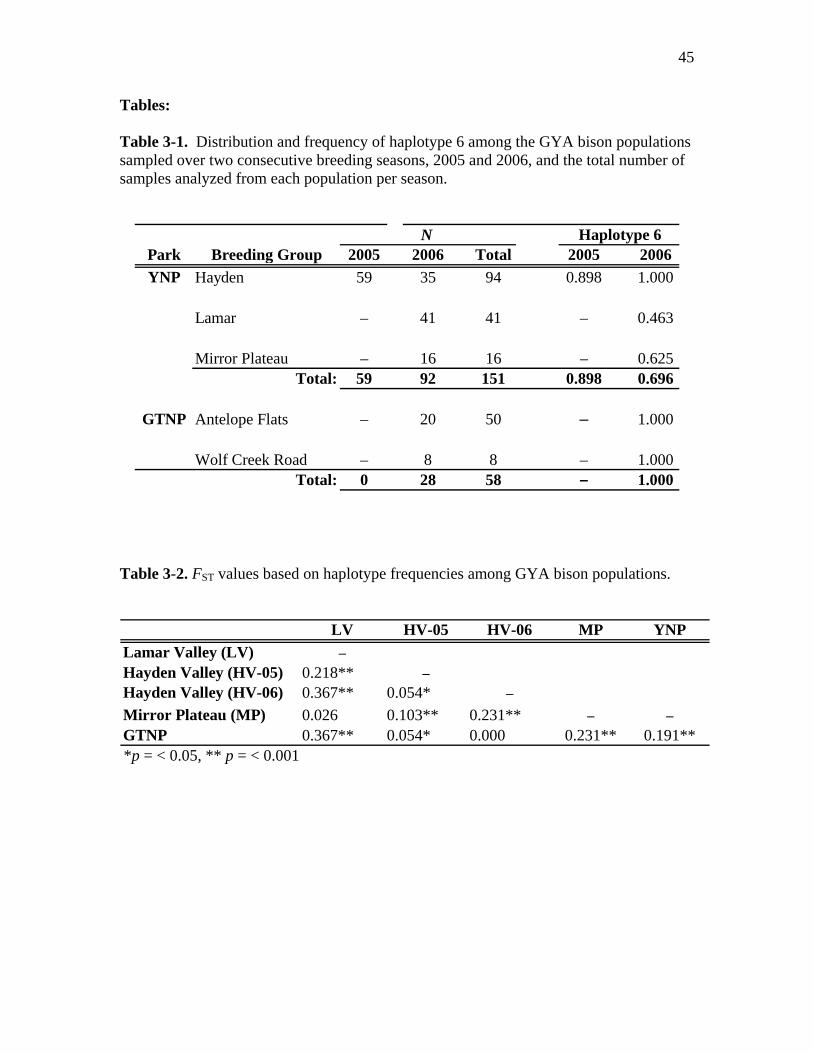
45
Tables: Table 3-1. Distribution and frequency of haplotype 6 among the GYA bison populations sampled over two consecutive breeding seasons, 2005 and 2006, and the total number of samples analyzed from each population per season.
N Haplotype 6Park Breeding Group 2005 2006 Total 2005 2006YNP Hayden 59 35 94 0.898 1.000
Lamar – 41 41 – 0.463
Mirror Plateau – 16 16 – 0.625Total: 59 92 151 0.898 0.696
GTNP Antelope Flats – 20 50 – 1.000
Wolf Creek Road – 8 8 – 1.000Total: 0 28 58 – 1.000
Table 3-2. FST values based on haplotype frequencies among GYA bison populations.
LV HV-05 HV-06 MP YNPLamar Valley (LV) –Hayden Valley (HV-05) 0.218** –Hayden Valley (HV-06) 0.367** 0.054* –
Mirror Plateau (MP) 0.026 0.103** 0.231** – –GTNP 0.367** 0.054* 0.000 0.231** 0.191** *p = < 0.05, ** p = < 0.001
46
Literature Cited
Allendorf, F.W., R.F. Leary, P. Spruell, and J.K. Wenburg. 2001. The problems with
hybrids: Setting conservation guidelines. Trends in Ecology and Evolution 16:
613-622.
Allendorf, F.W. and G. Luikart. 2007. Population subdivision. In Conservation and the
Genetics of Populations. Blackwell Publishing, Inc. pp. 211-212.
Archie E.A., Moss, C.J., and Alberts, S.C. 2006. The ties that bind: genetic relatedness
predicts the fission and fusion of social groups in wild African elephants.
Proceedings of the Royal Society B 273: 513-522.
Barsness, L. 1985. Heads, Hides, and Horns; The Compleat Buffalo Book. Texas
Christian University Press, Fort Worth, Texas.
Bellemain, E. and P. Taberlet. 2004. Improved noninvasive genotyping method:
application to brown bear (Ursus arctos) faeces. Molecular Ecology Notes 4: 519-
522.
Berger, J. and C. Cunningham. 1994. Bison: Mating and Conservation in Small
Populations. Columbia University Press, New York.
Birky, C.W., Maruyama, T. and P. Fuerst. 1983. An approach to population and
evolutionary genetic theory for genes in mitochondria and chloroplasts, and some
results. Genetics 103: 513-527.
Bricker, J. 1996. Purification of high quality DNA from shed skins. Herpetological
Review 27:133.
Boyd, D.P. 2003. Conservation of North American bison: status and recommendations.
Masters Thesis, University of Calgary, Calgary, Alberta, Canada.
47
Broquet, T., N. Ménard, and E. Petit. 2007. Noninvasive population genetics: A review of
sample source, diet, fragment length and microsatellite motif effects on
amplification success and genotyping error rates. Conservation Genetics 8: 249-
260.
Buchan, J.C., E.A. Archie, R.C. Van Horn, C.J. Moss, and S.C. Albert. 2005. Locus
specific effects and sources of error in noninvasive genotyping. Molecular
Ecology. 5: 680-683.
Cannon, K.P. 2001. What the past can provide: Contribution of prehistoric bison studies
to modern bison management. Great Plains Research 11: 145-174.
Cannon, K.P. 2007. “They went as high as they choose:” What an isolated skull can tell
us about the biogeography of high-altitude bison. Arctic, Antarctic, and Alpine
Research 39: 44-56.
Carbyn, L.N. 1997. Unusual movement by Bison bison bison, in response to wolf, Canis
lupus predation. Canadian Field-Naturalist 111: 461-462.
Chesser, R.K. 1991. Gene diversity and female philopatry. Genetics 127: 437-447.
Christianson, A., Gogan, P.J., Podruzny, KM.., Olexa, E.M. 2005. Incisor wear and age
in Yellowstone bison. Wildlife Society Bulletin 33: 669-676.
Coder, G. D. 1975. The national movement to preserve the American buffalo in the
United States and Canada between 1880 and 1920. Ph.D. dissertation, Ohio State
University.
Coltman, D.W., J.G. Pilkington, and J.M. Pemberton. 2003. Fine-scale genetic structure
in a free living ungulate population. Molecular Ecology 12: 733-742.
48
Côté, S.D., F. Dallas, F. Marshall, R.J. Irvine, R. Langvatn, and S.D. Albon. 2002.
Microsatellite DNA evidence for genetic drift and philopatry in Svalbard reindeer.
Molecular Ecology 11: 1923-1930.
Eggert, L.S., J.A. Eggert, and D.S. Woodruff. 2003. Estimating population sizes for
elusive animals: the forest elephants of Kakum National Park, Ghana. Molecular
Ecology 12: 1389-1402.
Epps, C.W., P.J. Palsboll, J.D. Wehausen, G.K. Roderick, R.R. Ramey II, D.R.
McCullough. 2005. Highways block gene flow and cause rapid decline in genetic
diversity of desert bighorn sheep. Ecology Letters 8: 1029-1038.
Erdoes, R. and A. Ortiz. 1984. American Indian Myths and Legends. Pantheon books,
New York, New York.
Frantz, A.C., L.C. Pope, P.J. Carpenter, T.J. Roper, G.J. Wilson, J. Delahays, and T.
Burke. 2003. Reliable microsatellite genotyping of the Eurasian badger (Meles
meles) using faecal DNA. Molecular Ecology Notes 12:1649-1661.
Freese C.H., Aune, K.E., Boyd, D.P., Derr, J.N., Forrest, S.C., Gates, C.C., Gogan, P.J.,
Grassel, S.M., Halbert, N.D., Kunkel, K., and Redford, K.H. 2007. Second chance
for plains bison. Biological Conservation, in Press.
Gates, C.C., B. Stelfox, T. Muhly, T. Chowns, and R.J. Hudson. 2005. The Ecology of
Bison Movements and Distribution In and Beyond Yellowstone National Park.
Faculty of Environmental Design, The University of Calgary, Calgary, Alberta.
Geremia, C., T. Jones, R. Wallen, and J. Treanor. 2005. Yellowstone bison population
estimate summer 2005. Unpublished report, Bison Ecology and Management
Office, Yellowstone National Park, U.S. National Park Service.
49
Gross, J.E. and G. Wang. 2005. Effects of population control strategies on retention of
genetic diversity in National Park Service bison (Bison bison) herds. National
Park Service, unpublished report.
Halbert, N.D. 2003. The utilization of genetic markers to resolve modern management
issues in historic bison populations: implications for species conservation. Ph.D.
dissertation, Texas A&M University, College Station, Texas
Halbert, N.D. and J.N. Derr. 2007. A comprehensive evaluation of cattle introgression
into US federal bison herds. Journal of Heredity 98: 1-12.
Hornaday, W.T. 2002. The Extermination of the American Bison. Smithsonian Institute
Press, Washington and London.
Jones, J., R. Wallen, C. Geremia, and D. Blanton. 2006. Yellowstone bison population
estimate summer 2006. Unpublished report, Bison Ecology and Management
Office, U.S. Yellowstone National Park, National Park Service.
Knapp, A.K., J.M. Blair, J.M. Briggs, S.L. Collins, D.C. Hartnett, L.C. Johnson, and E.G.
Towne. 1999. The keystone role of bison in North American tallgrass prairie.
BioScience 49: 39-50.
Kumar, S., K Tamura, and M. Nei. 2004. MEGA3: Integrated software for Molecular
Evolutionary Genetics Analysis and sequence alignment. Briefings in
Bioinformatics 5:150-163.
Lott, D.F. 2002. American Bison: A Natural History. University of California Press,
Berkeley, and Los Angeles, California.
Luikart, G. and P.R. England. 1999. Statistical analysis of microsatellite DNA data.
Trends in Ecology and Evolution 14:253-256.
50
Luikart, G., S. Zundel, D. Rioux, C. Miguel, K.A. Keating, J.T. Hogg, B. Steele, K.
Foresman, and P. Taberlet. 2007. Low genotyping error rates for microsatellite
multiplexes and noninvasive fecal DNA samples from bighorn sheep. Journal of
Wildlife Management, in Press.
Maudet, C., G. Luikart, D. Dubray, A. Von Hardenberg, and P. Taberlet. 2004. Low
genotyping error rates in wild ungulate faeces sampled in winter. Molecular
Ecology Notes 4: 772-775.
McHugh, T. 1972. The Time of the Buffalo. University of Nebraska Press, Lincoln,
Nebraska.
Meagher, M.M. 1973. The bison of Yellowstone National Park. National Park Service
Science Monologue 1: 1-161.
Meagher, M.M., M.L. Taper, and C.L. Jerde. 2002. Recent changes in population
distribution: The Pelican bison and the domino effect. Proceedings of the 6th
Biennial Scientific Conference, Yellowstone National Park: pp. 135-147.
Morin, P.A., K.E. Chambers, C. Boesch, and L. Viligant. 2001. Quantitative polymerase
chain reaction of DNA from non-invasive samples for accurate microsatellite
genotyping of wild chimpanzees (Pan troglodytes verus). Molecular Ecology 10:
1835-1844.
Morin, P.A. and D.S. Woodruff. 1996. Non-invasive genotyping for vertebrate
conservation. In Molecular Genetic Approaches in Conservation. Edited by T.B.
Smith and R.K. Wayne. Oxford University Press, New York, pp. 298-313.
Nies, G. F.E. Zachos, and G.B. Hartl. 2005. The impact of female philopatry on
population differentiation in the European roe deer (Capreolus capreolus) as

51
revealed by mitochondrial DNA and allozymes. Mammalian Biology 70: 130-
134.
Nyakaana, S. P. Arctander, and H.R. Siegismund. 2002. Population structure of the
African savannah elephant inferred from mitochondrial control region sequences
and nuclear microsatellite loci. Heredity 89: 90-98.
Parsons, K.M. 2001. Reliable microsatellite genotyping of dolphin DNA from faeces.
Molecular Ecology 1: 341-344.
Parsons, K.M., J.W. Durban, D.E. Claridge, D.I. Herzing, K.C. Balcomb, and L.R.
Noble. 2006. Population genetic structure of coastal bottlenose dolphins (Tursiops
truncates) in the Northern Bahamas. Marine Mammal Science 22: 276-298.
Polziehn, R.O., C. Strobeck, J. Sheraton, R. Beech, J. 1995. Bovine mtDNA discovered
in North American bison populations. Conservation Biology 9: 1638-1643.
Polziehn, R.O., R. Beech, J. Sheraton, and C. Strobeck. 1996. Genetic relationships
among North American bison populations. Canadian Journal of Zoology 74: 738-
749.
Pritchard, J.K., M. Stephens, and P. Donnelly. 2000. Inference of population structure
using multilocus genotype data. Genetics 155: 945-959.
Seton, E.T. 1937. Lives of Game Animals. Literary Guild of America, New York.
Shapiro, B. A.J. Drummond, A. Rambaut, M.C. Wilson, P.E. Matheus, A.V. Sher, O.G.
Pybus, MT.P. Gilbert, I. Barnes, J. Binladen, E. Willerslev, A.J. Hansen, G.F.
Baryshnikov, J.A. Burns, S. Davydov, J.C. Driver, D.G. Froese, C.R. Harington,
G. Keddie, P. Kosintev, M.L. Kunz, L.D. Martin, R.O. Stephenson, J. Storer, R.
52
Tedford, S. Zimov, and A. Cooper. 2004. Rise and fall of the Beringian Steppe
bison. Science 306: 1561-1565.
Shupe, J.L., A.E. Olson, H.B. Peterson, and J.B. Low. 1984. Fluoride toxicosis in wild
ungulates. Journal of the American Veterinary Medical Association 185: 1295-
1300.
Smits, D.D. 1994. The frontier army and the destruction of the buffalo: 1865-1883. The
Western Historical Quarterly 25: 312-338.
Steele, B.M. 1996. A modified EM algorithm for estimation in generalized mixed
models. Biometrics 52: 1295-1310.
Steele, B.M. and J.T Hogg. 2003. Measuring individual quality in conservation and
behavior. In Animal Behavior and Wildlife Conservation. Edited by M. Festa-
Bianchet and M. Appolonio. Island Press, Washington, D.C. pp. 243-269.
Storz, J.F. 1999. Genetic consequences of mammalian social structure. Journal of
Mammalogy 80: 553-569.
Taberlet, P., and L. Fumagali. 1996. Owl pellets as a source of DNA for genetic studies
of small mammals. Molecular Ecology Notes 5: 301-305.
Taberlet, P., L.P. Waits, and G. Luikart. 1999. Non-invasive sampling: look before you
leap. Trends in Ecology and Evolution 14: 323-327.
Taper, M.L., M. Meagher, and C.L. Jerde. 2000. The phenology of space: Spatial aspects
of bison density dependence in Yellowstone National Park. Montana State
University, Bozeman, MT. Unpublished manuscript.
Tindall, K.R. and T. A. Kunkel. 1988. Fidelity of DNA synthesis by the Thermus
aquaticus DNA polymerase. Biochemistry 27: 6008-6013.
53
United States Department of the Interior, National Park Service. 2000. Bison
Management for the State of Montana and Yellowstone National Park; Final
Environmental Impact Statement. U.S. Government Printing Office, Region 10.
United States Department of the Interior, National Park Service. 2006. Management
Policies. U.S. Government Printing Office.
United States Department of the Interior, NPS-Grand Teton National Park, USFWS-
National Elk Refuge, Wyoming Fish and Game, and Bridger-Teton National
Forest. 1996. The Jackson Bison Herd; Long Term Management Plan and
Environmental Assessment. Jackson, Wyoming. U.S. Government Printing
Office.
United States Department of the Interior, NPS-Grand Teton National Park, USFWS-
National Elk Refuge. 2007. Summary of the Final Bison and Elk Management
Plan and Environmental Impact Statement: National Elk Refuge, Grand Teton
National Park. U.S. Government Printing Office.
Vidya, T.N.C., P. Fernando D.J. Melnick, and R. Sukuman. 2005. Population
differentiation within and among Asian elephant (Elephas maximus) populations
in southern India. Heredity 94: 71-80.
Vogel, A.B., S. Edmands, and D. Hedgecock. 2006. Introgression of cattle mtDNA into
Santa Catalina Island American bison. Unpublished. GenBank accession
numbers; DQ452027 to DQ452030.
Ward, T.J., J.P. Bielawski, S.K. Davis, J.W. Templeton, and J.N. Derr. 1999.
Identification of domestic cattle hybrids in wild cattle and bison species: a
54
general approach using mtDNA markers and the parametric bootstrap. Animal
Conservation 2: 51-57.
Wronski, T. and A. Apio. 2006. Home-range overlap, social vicinity and agonistic
interactions denoting matrilineal organization in bushbuck, Tragelaphus
scriptus. Behavioral Ecology and Sociobiology 59: 819-828.