Embed Size (px)
Citation preview
2015 TECHNICAL REPORT
Electric Power Research Institute 3420 Hillview Avenue, Palo Alto, California 94304-1338 • PO Box 10412, Palo Alto, California 94303-0813 USA
800.313.3774 • 650.855.2121 • [email protected] • www.epri.com
Development of Generic Scaling Factors for Technetium-99 and Iodine 129 in Low and Intermediate Level Waste
9923195

9923195
EPRI Project Manager K. Kim
3420 Hillview Avenue Palo Alto, CA 94304-1338 USA PO Box 10412 Palo Alto, CA 94303-0813 USA 800.313.3774 650.855.2121
[email protected] 3002005564
www.epri.com Final Report, November 2015
Development of Generic Scaling Factors for Technetium-99 and
Iodine-129 in Low and Intermediate Level Waste
All or a portion of the requirements of the EPRI Nuclear Quality Assurance Program apply to this product.
9923195
DISCLAIMER OF WARRANTIES AND LIMITATION OF LIABILITIES
THIS DOCUMENT WAS PREPARED BY THE ORGANIZATION(S) NAMED BELOW AS AN ACCOUNT OF WORK SPONSORED OR COSPONSORED BY THE ELECTRIC POWER RESEARCH INSTITUTE, INC. (EPRI). NEITHER EPRI, ANY MEMBER OF EPRI, ANY COSPONSOR, THE ORGANIZATION(S) BELOW, NOR ANY PERSON ACTING ON BEHALF OF ANY OF THEM:
(A) MAKES ANY WARRANTY OR REPRESENTATION WHATSOEVER, EXPRESS OR IMPLIED, (I) WITH RESPECT TO THE USE OF ANY INFORMATION, APPARATUS, METHOD, PROCESS, OR SIMILAR ITEM DISCLOSED IN THIS DOCUMENT, INCLUDING MERCHANTABILITY AND FITNESS FOR A PARTICULAR PURPOSE, OR (II) THAT SUCH USE DOES NOT INFRINGE ON OR INTERFERE WITH PRIVATELY OWNED RIGHTS, INCLUDING ANY PARTY'S INTELLECTUAL PROPERTY, OR (III) THAT THIS DOCUMENT IS SUITABLE TO ANY PARTICULAR USER'S CIRCUMSTANCE; OR
(B) ASSUMES RESPONSIBILITY FOR ANY DAMAGES OR OTHER LIABILITY WHATSOEVER (INCLUDING ANY CONSEQUENTIAL DAMAGES, EVEN IF EPRI OR ANY EPRI REPRESENTATIVE HAS BEEN ADVISED OF THE POSSIBILITY OF SUCH DAMAGES) RESULTING FROM YOUR SELECTION OR USE OF THIS DOCUMENT OR ANY INFORMATION, APPARATUS, METHOD, PROCESS, OR SIMILAR ITEM DISCLOSED IN THIS DOCUMENT.
REFERENCE HEREIN TO ANY SPECIFIC COMMERCIAL PRODUCT, PROCESS, OR SERVICE BY ITS TRADE NAME, TRADEMARK, MANUFACTURER, OR OTHERWISE, DOES NOT NECESSARILY CONSTITUTE OR IMPLY ITS ENDORSEMENT, RECOMMENDATION, OR FAVORING BY EPRI.
THE FOLLOWING ORGANIZATIONS, UNDER CONTRACT TO EPRI, PREPARED THIS REPORT:
Cox Nuclear Consulting, LLC
Suncoast Solutions
THE TECHNICAL CONTENTS OF THIS PRODUCT WERE NOT PREPARED IN ACCORDANCE WITH THE EPRI QUALITY PROGRAM MANUAL THAT FULFILLS THE REQUIREMENTS OF 10 CFR 50, APPENDIX B. THIS PRODUCT IS NOT SUBJECT TO THE REQUIREMENTS OF 10 CFR PART 21.
NOTE
For further information about EPRI, call the EPRI Customer Assistance Center at 800.313.3774 or e-mail [email protected].
Electric Power Research Institute, EPRI, and TOGETHERSHAPING THE FUTURE OF ELECTRICITY are registered service marks of the Electric Power Research Institute, Inc.
Copyright © 2015 Electric Power Research Institute, Inc. All rights reserved.
9923195
This publication is a corporate document that should be cited in the
literature in the following manner:
Development of Generic Scaling Factors for Technetium-99 and
Iodine-129 in Low and Intermediate Level Waste.
EPRI, Palo Alto, CA: 2015. 3002005564.
iii
Acknowledgments The following organization, under contract to the Electric Power Research Institute (EPRI), prepared this report:
Cox Nuclear Consulting Services LLC 45 Railroad Ave. Seabrook ,NH 03874
Principal Investigator B. Cox
Suncoast Solutions 431 Toccoa Farm Road Morganton, GA 30560
Principal Investigator P. Saunders
This report describes research sponsored by EPRI.
The investigators acknowledge the following individuals for their assistance with data requests and thoughts in support of this research:
Heather Baxter of Duke Energy Shearon Harris Plant
Rebecca Charles of Teledyne Brown Engineering Laboratory
Fred Haniffy of NextERA Energy Seabrook plant
Keith Jeter of Teledyne Brown Engineering Laboratory
Clint Miller of Pacific Gas and Electric Diablo Canyon Power Plant
9923195

9923195
v
Product Description The radionuclides technetium-99 (99Tc) and iodine-129 (129I) are
known to be present in very small quantities in low and intermediate level waste (LILW). Coincidentally, while these same two radionuclides are classified as hard-to-measure (HTM), they are very important in assessing the long-term performance of LILW disposal sites because of their mobility in groundwater. This work provides an in-depth evaluation of existing highly accurate mass spectrometry measurements on LILW samples performed at Pacific Northwest National Laboratories (PNNL) for 99Tc and 129I. The mass spectrometry measurement data are then used to develop generic scaling factors for estimating 99Tc and 129I in LILW.
Background It is well documented that 99Tc and 129I quantities are often overestimated in LILW. The primary reason for this overestimation is the common practice of using lower limits of detection values to characterize LILW or to develop scaling factors for use in characterizing LILW. Lower limits of detection values are often reported in lieu of measurement results when the radiochemical analysis does not lead to positive measurements of 129I and 99Tc. These lower limit of detection values are then misinterpreted as real measurement values and lead to the overestimation of these radionuclides in LILW. The only accurate way to quantify 99Tc and 129I in LILW is through mass spectrometry analyses. Over a number of years, PNNL has performed these mass spectrometry measurements on nuclear power plant LILW waste. As a result, there is now a reasonable dataset that may be used for developing generic scaling factors for characterizing LILW.
Objectives To determine if the PNNL datasets for 99Tc and 129I in LILW
samples can be qualified for use in developing generic scaling factors.
To develop generic scaling factors for 99Tc and 129I and provide the technical basis for the scaling factors.
To validate the generic scaling factors using calculations and/or other independent data.
9923195
vi
Approach The existing PNNL mass spectrometry measurement data for 99Tc and 129I from NUREG/CR-6567, Low-Level Radioactive Waste Classification, Characterization, and Assessment: Waste Streams and Neutron-Activated Metals, were reproduced in a spreadsheet and evaluated for validity. Once validated, these data were used to develop generic scaling factors for estimating 99Tc and 129I in nuclear power plant LILW for varying fuel conditions. The results of the evaluation were compared to both calculations and reactor coolant concentrations for validity. 129I and 99Tc scaling factors used in various countries were also reviewed to compare with the generic scaling factors developed in this work.
Results The PNNL mass spectrometry data were of sufficient quality that they could be used to develop reasonable generic scaling factors for 99Tc and 129I in LILW. The technical basis for these scaling factors is provided along with qualifying bounds for use. A generic scaling factor to cesium-137 (137Cs) that is applicable to all ranges of fuel conditions is provided for 129I. Another scaling factor is provided for use in a case where 137Cs is not detected in the waste streams. In such a situation, it is recommended that 129I be scaled to cobalt-60 (60Co). Two scaling factors are provided for use with 99Tc, depending on the measure of fuel integrity defined in the results—60Co or 137Cs.
Independent calculations and comparison to reactor coolant chemistry data agreed well with these generic scaling factors. While these scaling factors were developed based on U.S. LILW measurement data, they may also be applicable to enhancing the accuracy of international nuclear power plant LILW. This report reviews international scaling factors as a benchmark for the generic scaling factors.
Applications, Value, and Use Application of the generic scaling factors can result in far greater accuracy in the calculation of 99Tc and 129I inventory of LILW disposal sites. This will lead to lowering postulated dose to the public due to the LILW in a disposal site and increasing the capacity of disposal sites where 99Tc and 129I are the limiting radionuclides. The derivation of the generic scaling factors from this work will inform the technical discussion related to reporting of 99Tc and 129I and may lead to reconsideration of some scaling factors in use globally for these radionuclides.
Keywords Low level waste (LLW) Scaling Factors Low and intermediate level waste (LILW) Radioactive Waste Hard-to-Measure Radionuclides (HTM)—129I, 99Tc Difficult-to-Measure Radionuclides (DTM)
9923195
vii
Table of Contents
Section 1: Summary and Results ......................... 1-1 Research Summary ..................................................... 1-1 Research Results ......................................................... 1-2
Iodine-129 Results ................................................. 1-2 Technetium-99 Results ............................................ 1-3
Results Summary ........................................................ 1-4
Section 2: Background ....................................... 2-1 A Review of Existing and Reliable Measurement Data for Technetium-99 and Iodine-129 .................................... 2-6 Discussion on Direct and Indirect Methods in the U.S. Regulatory Context ................................................... 2-10 U.S. Regulatory Position Review ................................. 2-11 Summary ................................................................ 2-12
Section 3: Technetium-99 and Iodine-129 Production and Transport ................... 3-1
Fission Product Production: .......................................... 3-1 Fission Product Transport ............................................. 3-2
Recoil .................................................................. 3-3 Diffusion .............................................................. 3-3 Knockout ............................................................. 3-4 Fuel Clad Leaks and Fission Product Escape Coefficients .......................................................... 3-4
Activation of Corrosion Products (Production) ................ 3-7 Iodine-129 Production ................................................ 3-7 Technetium–99 Production .......................................... 3-8
Section 4: Iodine-129 Data Analysis ................... 4-1 Sample Data Review and Validity ................................ 4-1 Sample Data Evaluation .............................................. 4-6 Recommended Scaling Factor Test against the PNNL Mass Spectroscopy Dataset ....................................... 4-12 Comparison of the Derived Iodine-129 Scaling Factor to Fuel Clad Gap Release Calculations........................... 4-14 Comparison to Global Iodine-129 Scaling Factors ....... 4-16
9923195
viii
Section 5: Technetium-99 Data Analysis .............. 5-1 Understanding the Technetium-99 Relationship to Cobalt-60 and Cesium-137 in the Sample Dataset ................... 5-1 Sample Data Validity .................................................. 5-5 Sample Data Evaluation ............................................ 5-10 Recommended Scaling Factor Test Against the PNNL Mass Spectroscopy Dataset ....................................... 5-17 Comparison of the Derived Scaling Factors for 99Tc to Fuel Clad Gap Release Calculations and Reactor Coolant Concentrations of 98Mo ................................ 5-19
Verification to Core Inventories Corrected for Fission Product Escape Coefficients ................................. 5-20 Verification to Reactor Coolant Concentrations ....... 5-22
Comparison to Global Technetium-99 Scaling Factors .. 5-23
Section 6: Determining Iodine-129 When Cesium-137 Is Not Detected in LILW Samples... 6-1
Section 7: Software Codes .................................. 7-1 EPRI RADSOURCE ...................................................... 7-1 3R-STAT .................................................................. 7-2 PROFIP .................................................................. 7-2 PACTOLE .................................................................. 7-2 LLWAA .................................................................. 7-3
Section 8: Additional Considerations ................... 8-1 Elemental and Chemistry Considerations....................... 8-1 Iodine-129/Cesium-137 Behavior ................................ 8-1 Technetium-99/Cobalt-60 and Technetium-99/Cesium-137 Behavior ............................................................ 8-2 Importance of Decay Correction .................................. 8-3
Section 9: Summary of and Compatibility with Other EPRI Guidance .......................... 9-1
Historical EPRI Research Associated with LILW Scaling Factors .................................................................. 9-1
NP-1494, Activity Levels of Transuranic Nuclides in Low-level Solid Waste for U.S Power Reactors (1980) (61).......................................................... 9-1 NP-2734, Solid Radwaste Radionuclide Measurements (1982) (62) .................................... 9-1 NP-4037, Radionuclides in Low-Level RadWaste 1985 (14) ........................................................... 9-2
9923195
ix
NP-5077, Updated Scaling Factors in Low-level Radwaste 1987 (4) ............................................... 9-2 NP-5677, Below Regulatory Concern Owners Group: Radionuclide Characterization of Potential BRC Waste Types from Nuclear Power Stations 1989 (63) ........................................................... 9-3 TR-100740, Generic Scaling Factors for Dry Active Waste, 1992 (60) ................................................ 9-3 TR-101960, RADSOURCE, A Scaling Factor Prediction Computer Program Technical Manual and Code Validation, 1992 (26) .................................. 9-4 TR-107201, Low Level Waste Characterization Guidelines, 1996 (17) .......................................... 9-5 TR-109448, Utility use of Constant Scaling Factors, 1999 (18) ........................................................... 9-5
Section 10: References ................................ 10-1
Appendix A: PNNL Dataset .............................. A-1
Appendix B: United States Application Screening ........................................... B-1
9923195

9923195
xi
List of Figures
Figure 2-1 Ten Years of Independent Lab 99TC LILW Sample Results ........................................................... 2-3
Figure 2-2 Ten Years of 99TC LLD Results Reduced to Net Count Rate ................................................................ 2-5
Figure 2-3 129I/137Cs PNNL Sample Data ..................... 2-8
Figure 2-4 129I/60Co PNNL Sample Data ........................ 2-8
Figure 2-5 PNNL 99Tc/60Co PNNL Sample Data .............. 2-9
Figure 2-6 PNNL 99Tc/137Cs PNNL Sample Data ............. 2-9
Figure 3-1 Typical 235U LWR Core Fissions by Fuel Source . 3-2
Figure 3-2 Simplified Fission Product Transport Mechanisms . 3-4
Figure 3-3 129I Decay Chain (69) .................................... 3-7
Figure 3-4 99Mo/99Tc Decay Chain (69) ......................... 3-9
Figure 3-5 PWR RCS 60Co and 99Mo Concentrations ...... 3-13
Figure 4-1 Raw Data Ln 129I/Ln 137Cs ............................ 4-3
Figure 4-2 Frequency Distribution Ln 129I/137Cs ............... 4-4
Figure 4-3 Ln 129I/137Cs Q-Q Plot .................................. 4-5
Figure 4-4 Ln 129I/Ln 137Cs Residual Plot ........................ 4-5
Figure 4-5 Ln 129I/Ln 137Cs Dispersion Plot All Fuel Conditions ................................................................. 4-7
Figure 4-6 Ln 129I/Ln 137Cs Dispersion Plot 137Cs/60Co <10 ... 4-7
Figure 4-7 Ln 129I/Ln 137Cs Dispersion Plot 137Cs/60Co >10 ... 4-8
Figure 4-8 Two Tailed Distribution Confidence Intervals ..... 4-10
Figure 4-9 129I Log-Mean Dispersion Plots ......................... 4-11
Figure 4-10 Calculated Gap Scaling Factor Change with Burnup Normalized to 70 MWD/MT ......................... 4-15
Figure 5-1 99Tc Scaling Factors to 60Co as a Function of Fuel Clad Integrity ............................................................. 5-2
Figure 5-2 99Tc Scaling Factors to 137Cs as a Function of Fuel Clad Integrity ............................................................. 5-2
9923195
xii
Figure 5-3 Weighted Impact of Fuel Clad Integrity on 99Tc/60Co Scaling Factor ............................................. 5-3
Figure 5-4 Ratio of 99Tc/129I in LILW Samples versus Fuel Clad Integrity ............................................................. 5-4
Figure 5-5 Ln 99Tc/Ln129I ................................................... 5-5
Figure 5-6 Raw Ln 99Tc/Ln 60Co Data Plot ........................... 5-7
Figure 5-7 Frequency Distribution Ln 99Tc/60Co ................... 5-8
Figure 5-8 Ln 99Tc/60Co Q-Q Plot ...................................... 5-9
Figure 5-9 Ln 99Tc/Ln 60Co Residual Plot ............................. 5-9
Figure 5-10 Ln 99Tc/Ln 60Co Dispersion Plot BWRs and PWRs All Fuel Conditions .......................................... 5-11
Figure 5-11 Ln 99Tc/Ln 60Co Dispersion Plot BWRs All Fuel Conditions ............................................................... 5-11
Figure 5-12 Ln 99Tc/Ln 60Co Dispersion Plot PWRs All Fuel Conditions ............................................................... 5-12
Figure 5-13 Ln 99Tc/Ln 60Co Dispersion Plot 137Cs/60Co <10 ................................................. 5-12
Figure 5-14 Ln 99Tc/Ln 60Co Dispersion Plot 137Cs/60Co >10 ................................................. 5-13
Figure 5-15 Ln 99Tc/Ln 137Cs Dispersion Plot 137Cs/60Co <10 ................................................. 5-13
Figure 5-16 Ln 99Tc/Ln 137Cs Dispersion Plot 137Cs/60Co >10 ................................................. 5-14
Figure 5-17 99Tc Log Mean Dispersion Plots ...................... 5-16
Figure 5-18 Calculated Gap 99Tc/137Cs Scaling Factor Change with Burnup Normalized to 70 MWD/MT ...... 5-21
Figure 5-19 99Tc/137Cs Scaling Factors Where 137Cs/60Co Ratio is Greater than 10 ........................................... 5-25
Figure 5-20 99Tc/137Cs Scaling Factors Where 137Cs/60Co Ratio is Less than 10 ................................................. 5-26
Figure 6-1 129I/99Tc Core Inventory, Fission Yield and Sample Ratios ............................................................ 6-3
Figure A-1 Table 7.8 of NUREG/CR-6567 ........................ A-1
Figure B-1 U.S. Application Scaling Factor Use Screening Checklist ................................................................... B-2
9923195
xiii
List of Tables
Table 1-1 Recommended PWR and BWR 129I Generic Scaling Factors .......................................................... 1-3
Table 1-2 Recommended PWR and BWR 99Tc Generic Scaling Factors .......................................................... 1-4
Table 2-1 Waste Stream Activity and Sample Distribution Comparison .............................................................. 2-7
Table 3-1 Various Fission Product Escape Coefficients and RCS Design Activity Concentrations .............................. 3-6
Table 3-2 Select Iodine and Cesium Fission Yields ............... 3-8
Table 3-3 Technetium-99 and Related Radionuclide Fission Yields ....................................................................... 3-9
Table 3-4 Cobalt and Molybdenum Percent Impurities in RCS Materials .......................................................... 3-11
Table 3-5 Approximate Production Potential Relevant to 60Co.................................................................... 3-12
Table 4-1 129I Sample Data ............................................... 4-1
Table 4-2 Ln 129I/137Cs Shapiro Wilk Test Output ................ 4-4
Table 4-3 129I/137Cs Geometric Mean Scaling Factors and Log-Mean Distributions ................................................ 4-8
Table 4-4 129I/137Cs Scaling Factor Applied to PNNL Data . 4-12
Table 4-5 Calculated 129I/137Cs Gap Activity Scaling Factors (SF) [Corrected for PNNL-18212 Rev. 1 (31) Release Fractions] ................................................................ 4-14
Table 4-6 Comparison of PNNL Sample Data 129I/137Cs Scaling Factors to Gap Activity Calculated Values ....... 4-15
Table 4-7 129I Scaling Factors or SF Calculations from Other Sources ................................................................... 4-16
Table 5-1 99Tc Sample Data .............................................. 5-6
Table 5-2 Ln 99Tc/60Co Shapiro Wilk Test Output ................ 5-8
9923195
xiv
Table 5-3 99Tc/60Co and 99Tc/137Cs Geometric Mean Scaling Factors and Log-Mean Distributions ................. 5-14
Table 5-4 99Tc/60Co and 99Tc/137Cs Scaling Factors Applied to PNNL Data .......................................................... 5-18
Table 5-5 Calculated 99Tc/137Cs Gap Activity Scaling Factors (SF) [Corrected for RG 1.183 (28) Release Fractions] ................................................................ 5-20
Table 5-6 Comparison of PNNL Sample Data 99Tc/137Cs Scaling Factors to Gap Activity Calculated Values ....... 5-21
Table 5-7 Various Reactor Coolant Concentration Comparisons to Recommended Scaling Factors ........... 5-22
Table 5-8 99Tc Scaling Factors or SF Calculations from Other Sources ................................................................... 5-24
Table 6-1 129I/99Tc Core Inventory and Sample Ratios .......... 6-2
Table 6-2 129/99 Cumulative Fission Yield Ratios .............. 6-3
Table 6-3 129I/99Tc Tramp Production Ratio Evaluation Comparisons ............................................................. 6-5
Table 6-4 129I/60Co Scaling Factor Comparison to PNNL Sample Data ............................................................. 6-5
Table 8-1 129I/137Cs All Data versus Filters, Mixed Resins and Anion Capacity Depleted Resin ............................. 8-2
Table 8-2 99Tc/60Co All Data versus Filters, Mixed Resins and Anion Capacity Depleted Resin ............................. 8-3
Table 9-1 TR-100740 DAW Generic Scaling Factors........... 9-4
9923195
1-1
Section 1: Summary and Results Research Summary
The radionuclides technetium-99 (99Tc) and iodine-129 (129I) are known to be present in very small quantities in low and intermediate level waste (LILW). Coincidentally these same two radionuclides cannot be easily measured yet they are very important in accessing the long term performance of LILW disposal sites because of their mobility in groundwater. It is well documented that often 99Tc and 129I quantities are overestimated in LILW. This is primarily because radiochemistry measurements are not sensitive enough to detect the amount of 99Tc and 129I in typical LILW. Often, when there are no positive detections of these radionuclides using radiochemical measurement and analysis, the detection limits are reported. These detection limit values are then misinterpreted, considered “real,” and included in LILW disposal site inventories.
Although costly, an accurate way to quantify 99Tc and 129I in LILW is through mass spectrometry analyses. Over a number of years, Pacific Northwest National Laboratories (PNNL) has performed mass spectrometry measurements in LILW samples for various clients in the United States (U.S.) and there is a reasonable dataset reproduced in NUREG/CR-6567 “Low-Level Radioactive Waste Classification, Characterization, and Assessment: Waste Streams and Neutron-Activated Metals” (1) that may be used to derive scaling factors in characterizing LILW.
This research provides an in-depth evaluation of existing highly accurate mass spectrometry measurements on LILW samples performed at PNNL for 99Tc and 129I. The existing PNNL mass spectrometry measurement data for 99Tc and 129I was reproduced in a spreadsheet and evaluated for validity. Non-linear behaviors with respect to ratios between the key radionuclide (that will be used to calculate the 99Tc and 129I) and the 99Tc and 129I were observed. It was necessary to determine what parameter in the data influenced the non-linear behaviors so that it could be understood and compensated for in the results. Once the non-linear behavior was resolved, the data spanning several orders of magnitude was transformed to log space and evaluated. The results of the evaluation were compared to both calculations and reactor coolant concentrations for validity.
The purpose of this work is to research, evaluate, and develop, if possible, generic scaling factors for quantifying 99Tc and 129I in power reactor LILW based on the most accurate empirical data currently available, related references and sound scientific calculation.
9923195
1-2
Application of the generic scaling factors from this work can result in far greater accuracy in the 99Tc and 129I inventory of LILW disposal sites thus lowering postulated dose to the public and increasing capacity where 99Tc and 129I are limiting. The empirical data used in this research represents one of the best collections of highly accurate mass spectroscopy measurements of LILW samples available in the United States and this work may be used to inform the derivation of constant scaling factors currently in use elsewhere.
Research Results
The PNNL mass spectrometry data was found of sufficient quality such that it could be used to develop reasonable generic scaling factors for 99Tc and 129I in LILW. A technical basis for these scaling factors is provided along with qualifying bounds for use of these scaling factors.
Independent calculations and comparison to reactor coolant chemistry data agreed well with these generic scaling factors. The results of this work show that: 1) Scaling factors for 99Tc and 129I in other global LILW applications may also be higher and less accurate than they could be and, 2) 99Tc production from activation of molybdenum-98 (98Mo) is a much greater contributor than fission in operational LILW.
Little difference was found between pressurized water reactors (PWR) and boiling water reactors (BWR) and between different waste streams such that generally bounding and conservative scaling factors could be established that apply to both types of reactors.
Iodine-129 Results
The fission products 129I and cesium-137 (137Cs) were found to scale well to each other. The non-linearity of a decreasing 129I/137Cs scaling factor with increasing 137Cs activity has been explained by the difference in the release mechanisms. The ratio of 129I to 137Cs released from tramp fuel is different than the combined ratio from tramp fuel and fuel clad gap releases. 137Cs is released from the fuel clad gap in greater proportion to 129I than it is from tramp fuel. A scaling factor to cobalt-60 (60Co) is provided for instances where 137Cs is not detected in the waste stream.
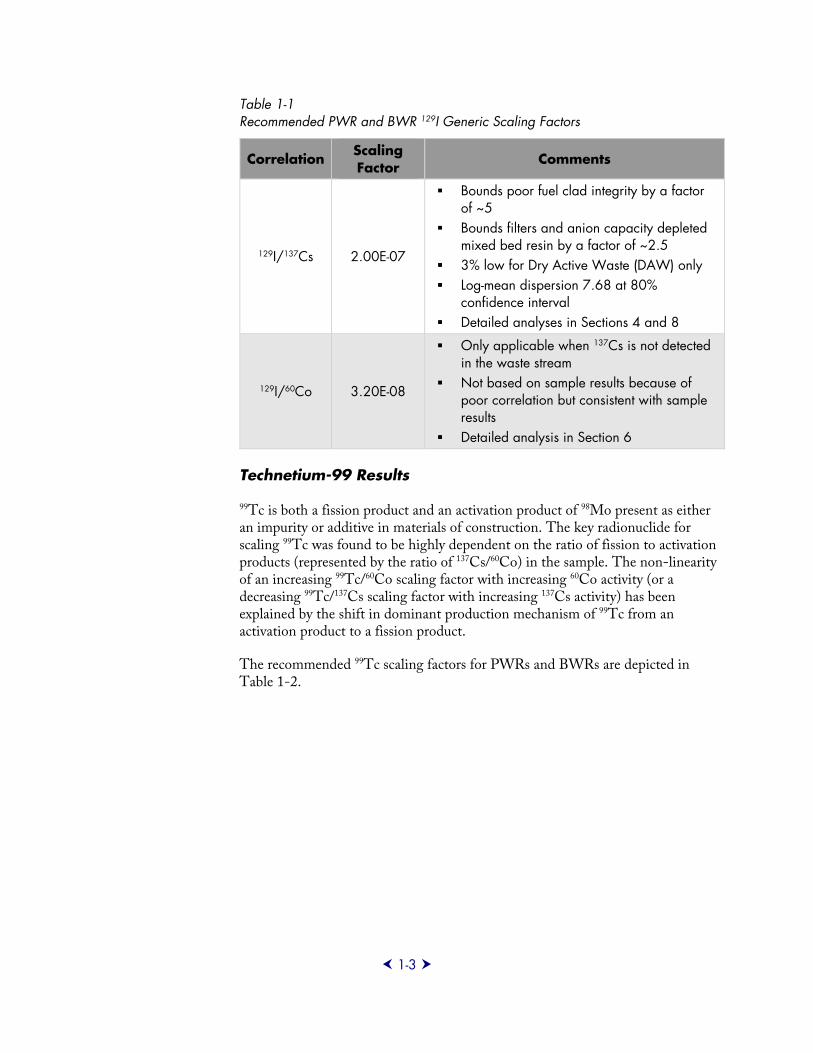
The recommended 129I scaling factors for PWRs and BWRs are depicted in Table 1-1.
9923195
1-3
Table 1-1 Recommended PWR and BWR 129I Generic Scaling Factors
Correlation Scaling Factor
Comments
129I/137Cs 2.00E-07
Bounds poor fuel clad integrity by a factor of ~5
Bounds filters and anion capacity depleted mixed bed resin by a factor of ~2.5
3% low for Dry Active Waste (DAW) only Log-mean dispersion 7.68 at 80%
confidence interval Detailed analyses in Sections 4 and 8
129I/60Co 3.20E-08
Only applicable when 137Cs is not detected in the waste stream
Not based on sample results because of poor correlation but consistent with sample results
Detailed analysis in Section 6
Technetium-99 Results
99Tc is both a fission product and an activation product of 98Mo present as either an impurity or additive in materials of construction. The key radionuclide for scaling 99Tc was found to be highly dependent on the ratio of fission to activation products (represented by the ratio of 137Cs/60Co) in the sample. The non-linearity of an increasing 99Tc/60Co scaling factor with increasing 60Co activity (or a decreasing 99Tc/137Cs scaling factor with increasing 137Cs activity) has been explained by the shift in dominant production mechanism of 99Tc from an activation product to a fission product.
The recommended 99Tc scaling factors for PWRs and BWRs are depicted in Table 1-2.
9923195
1-4
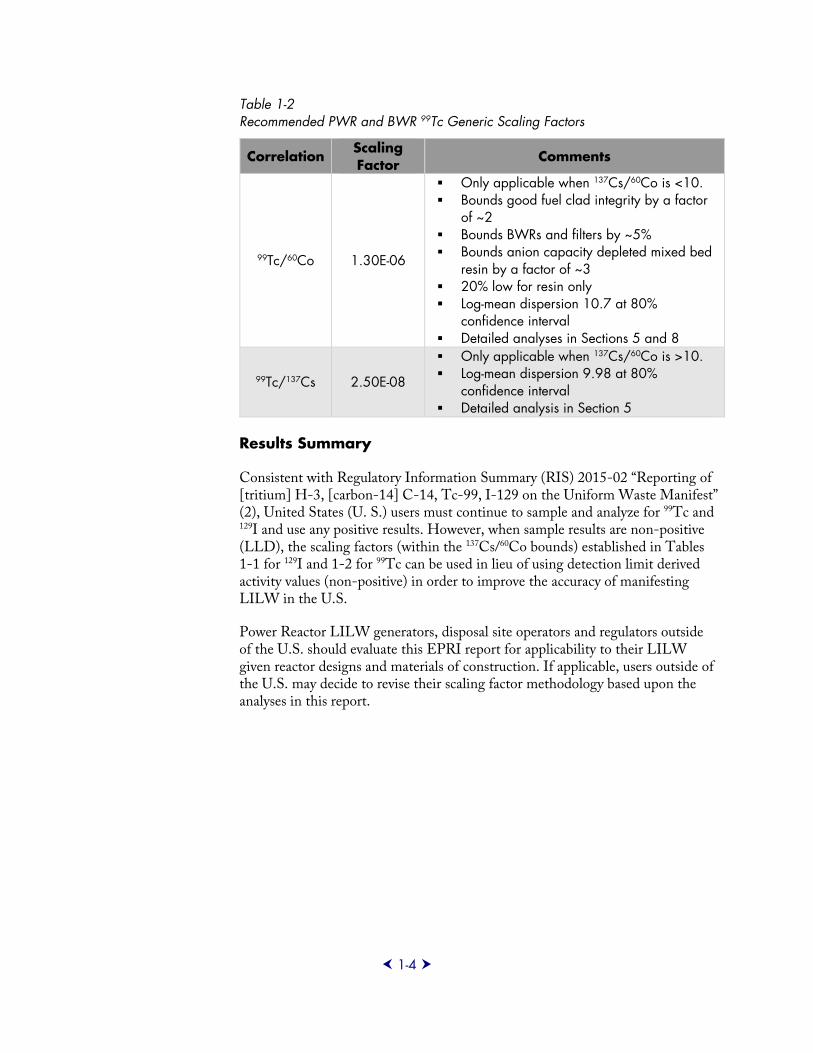
Table 1-2 Recommended PWR and BWR 99Tc Generic Scaling Factors
Correlation Scaling Factor
Comments
99Tc/60Co 1.30E-06
Only applicable when 137Cs/60Co is <10. Bounds good fuel clad integrity by a factor
of ~2 Bounds BWRs and filters by ~5% Bounds anion capacity depleted mixed bed
resin by a factor of ~3 20% low for resin only Log-mean dispersion 10.7 at 80%
confidence interval Detailed analyses in Sections 5 and 8
99Tc/137Cs 2.50E-08
Only applicable when 137Cs/60Co is >10. Log-mean dispersion 9.98 at 80%
confidence interval Detailed analysis in Section 5
Results Summary
Consistent with Regulatory Information Summary (RIS) 2015-02 “Reporting of [tritium] H-3, [carbon-14] C-14, Tc-99, I-129 on the Uniform Waste Manifest” (2), United States (U. S.) users must continue to sample and analyze for 99Tc and 129I and use any positive results. However, when sample results are non-positive (LLD), the scaling factors (within the 137Cs/60Co bounds) established in Tables 1-1 for 129I and 1-2 for 99Tc can be used in lieu of using detection limit derived activity values (non-positive) in order to improve the accuracy of manifesting LILW in the U.S.
Power Reactor LILW generators, disposal site operators and regulators outside of the U.S. should evaluate this EPRI report for applicability to their LILW given reactor designs and materials of construction. If applicable, users outside of the U.S. may decide to revise their scaling factor methodology based upon the analyses in this report.
9923195
2-1
Section 2: Background Many of the radionuclides of concern related to long-term performance of LILW disposal sites are considered hard-to-measure (HTM). These HTM radionuclides present unique challenges in the accurate quantification of activity as it relates to low and intermediate level waste (LILW) characterization. These HTM radionuclides, in many cases, may be observed in the waste forms at very low concentrations and below the vendor (or utility) laboratory’s lower limit of detection (LLD) capabilities.
Radiochemical analyses for some radionuclides require complex chemical separation processes to isolate the element in question followed by counting. This can result in large uncertainties in the results. In some cases, where the radionuclide is not detected above the LLD, the LLD is reported. Over reporting of activity results when such LLD values are treated as real or true activity values.
This research evaluates the application of scaling factors related to 99Tc and 129I to provide more accurate reporting of activity.
Early EPRI research activities identified a methodology that allows for the application of scaling factors. The 1984 EPRI report, Radionuclide Correlations in Low-Level Radwaste, NP-4037 (3) and the follow-up EPRI report in 1989, Updated Scaling Factors in Low-Level Radwaste, NP-5077 (4) provided the technical basis, documentation, and methodology related to the determination and application of scaling factors that used an industry dataset that continued to be developed over several years. Section 9 provides a more detailed chronological summary of EPRI scaling factor research.
The International Atomic Energy Agency (IAEA) Nuclear Energy Series, NW-T-1.18, Determination and Use of Scaling Factors for Waste Characterization in Nuclear Power Plants (5) captures an overall global strategy and defines some of the key attributes related to the determination of scaling factors and application in various countries. Scaling factors (SF) have been accepted to varying degrees for the characterization of low and intermediate low level radioactive waste (LILW) because of challenges related to accurate quantification of the HTM radionuclides and their long term impact in the disposal environment. (5)
U.S. scaling factor guidance was recently consolidated in a regulatory information summary (RIS) (2) and is largely based in the 1983 Branch Technical Position on
9923195
2-2
Waste Classification and Waste Form (6) and a United States Nuclear Regulatory Commission (USNRC) Information Notice from 1986. (7)
A scaling factor (or correlation factor) is a multiplier applied to a “readily detected radionuclide” also referred to as a key, scaling, or easy-to-measure (ETM) radionuclide and is used to calculate or scale to the hard-to-detect (HTD), or hard-to-measure (HTM) radionuclide. For consistency in this work, the terms “key” and “HTM” are used. The scaling factors used to calculate HTM radionuclide activity in LILW is typically based on a correlation developed from historical sampling, calculation or both. The HTM radionuclide inference may also be based on periodic, such as annual or batch, sampling. When a HTM radionuclide activity is calculated based on fractional abundance in a dose rate to activity model, a scaling factor is in effect being used.
Scaling factors are developed through a process that has been vetted by both early EPRI research and through application by the radwaste industry. This process utilizes an understanding of the production methods and transport processes of radionuclides throughout the primary coolant system (referred to as the reactor coolant system or RCS in this work) and draws on sample programs and industry datasets. The production and transport processes are well understood and provide the basis for the regulatory application of scaling factors. (5) In some cases scaling factors that are based on erroneous assumptions derived from radiochemical measurements with high levels of uncertainty or are based on elevated detection limit (background) values continue to be used when calculated values would provide far better accuracy. (8)
Based on observations made in this research and noted in other literature (9), a common error made in the development of scaling factors and in the fractional HTM radionuclide inputs into the dose rate to activity model is the use of the detection limit derived activity values as “true” (or real) activity measurements. Other errors, such as the use of less than ideal key radionuclides that do not follow changes in dose rates because of differences in the production or waste retention mechanisms, are also observed.
The term “detection limit derived activity value” is used in this work, for consistency, to represent the minimum detectable activity (MDA), minimum detectable concentration (MDC), or the lower limit of detection (LLD). In terms of some guidance related to nuclear power plant effluents and LILW, the LLD [as defined in NUREG/CR-4007 (10)], refers to what is more commonly called MDA or MDC. LLD or the detection limit (DL) is commonly used to describe the minimum signal above background that, when using a counting error multiple of 2σ (1.96), is representative of a 95% probability of detection (Type 1 errors) and less than a 5% probability of false signal (Type 2 errors). (11) The MDA or MDC is subsequently derived from the DL by applying the counting efficiency, quantity, units of measure, and other factors as applicable (e.g., recovery, collection efficiency, decay, etc.). An important point here is that the DL and thus the activity values derived thereof have no relationship to the true (if any) activity present and are primarily a function of the background (or noise) of a counting system.
Detection limit derived activity values have no relationship to true activity, rather they are a function of the counting system background (or noise.)
9923195
2-3
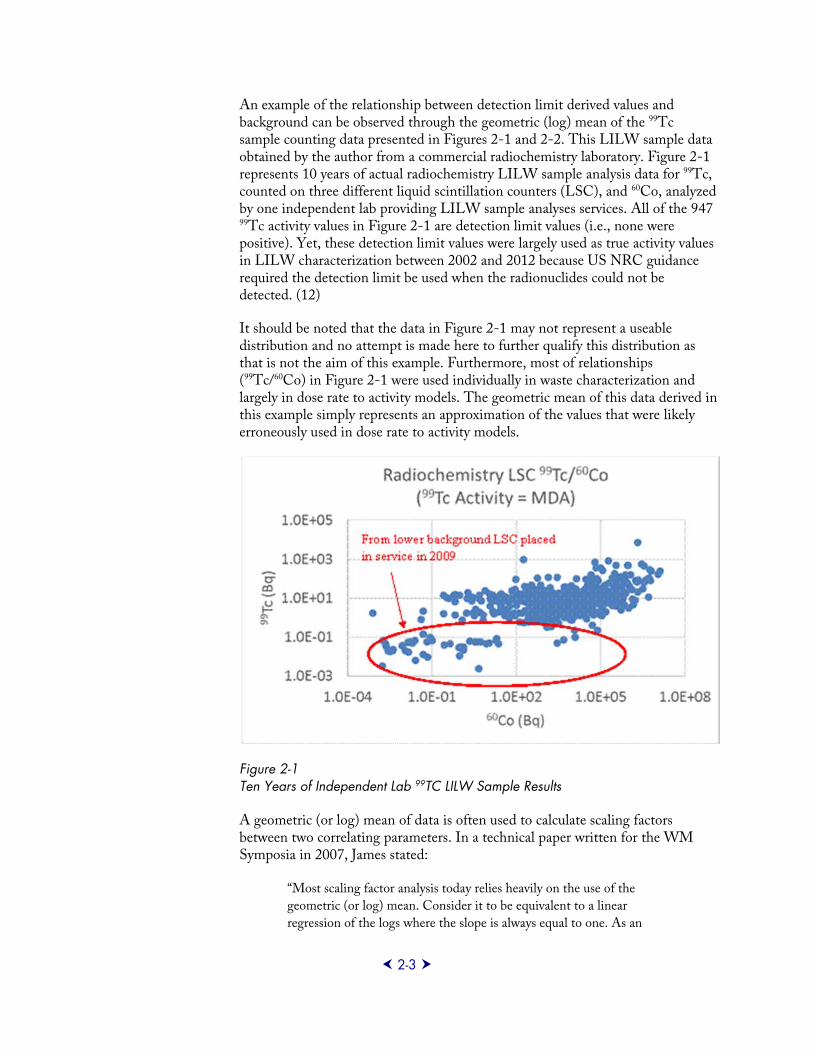
An example of the relationship between detection limit derived values and background can be observed through the geometric (log) mean of the 99Tc sample counting data presented in Figures 2-1 and 2-2. This LILW sample data obtained by the author from a commercial radiochemistry laboratory. Figure 2-1 represents 10 years of actual radiochemistry LILW sample analysis data for 99Tc, counted on three different liquid scintillation counters (LSC), and 60Co, analyzed by one independent lab providing LILW sample analyses services. All of the 947 99Tc activity values in Figure 2-1 are detection limit values (i.e., none were positive). Yet, these detection limit values were largely used as true activity values in LILW characterization between 2002 and 2012 because US NRC guidance required the detection limit be used when the radionuclides could not be detected. (12)
It should be noted that the data in Figure 2-1 may not represent a useable distribution and no attempt is made here to further qualify this distribution as that is not the aim of this example. Furthermore, most of relationships (99Tc/60Co) in Figure 2-1 were used individually in waste characterization and largely in dose rate to activity models. The geometric mean of this data derived in this example simply represents an approximation of the values that were likely erroneously used in dose rate to activity models.
Figure 2-1 Ten Years of Independent Lab 99TC LILW Sample Results
A geometric (or log) mean of data is often used to calculate scaling factors between two correlating parameters. In a technical paper written for the WM Symposia in 2007, James stated:
“Most scaling factor analysis today relies heavily on the use of the
geometric (or log) mean. Consider it to be equivalent to a linear
regression of the logs where the slope is always equal to one. As an
9923195
2-4
approximation of the median, the geometric mean has the quality of
reducing the effect of the inherent variability of the data. A justification
for the use of the geometric mean was presented in EPRI - 4037. It is
easy to calculate and relatively easy to understand. Use of the geometric
mean with reasonable dispersion values produces consistent scaling
factor results and minimizes year to year variations caused by sampling
variability.” (13) (14)
The geometric mean scaling factor for 99Tc/60Co derived from Figure 2-1 data is 3.11E-03. Table 7.8 of NUREG/CR-6567 (8) calculated the relationship between measured 99Tc values and 60Co for LILW to be approximately 1.30E-06 or about 2,500 times lower than the Figure 2-1 data indicates. Therefore, using the 99Tc fraction from the Figure 2-1 sample data in dose rate to activity models for characterizing waste erroneously overstated the 99Tc activity in the waste by greater than three orders of magnitude.
This practice for using LLD values for estimating radionuclide inventory in waste is in effect contrary to the typical guidance where scaling factors used in LILW characterization are generally required to be within a factor of ten (6) (5) because the 99Tc activity fraction (hence scaling factor) used in the dose rate to activity model is in error between a factor of 100 and 10,000 even though derived from an actual measurement. The compounding factor is that the actual measurement used in this practice amounts to nothing more than a measure of background.
The fact that a calculated detection limit is largely a function of background (or electronic noise) can clearly be seen in Figure 2-1. The highlighted data with lower reported 99Tc activity values are associated with a newer liquid scintillation counter (LSC) that has an inherent lower background (about half of the individual background count rates of other two LSCs represented in the Figure 2-1 data). The background properties of the three LSC counters represented in the data in Figures 2-1 and 2-2 is known because each sample count in the dataset (15) identifies the instrument that it was counted on.
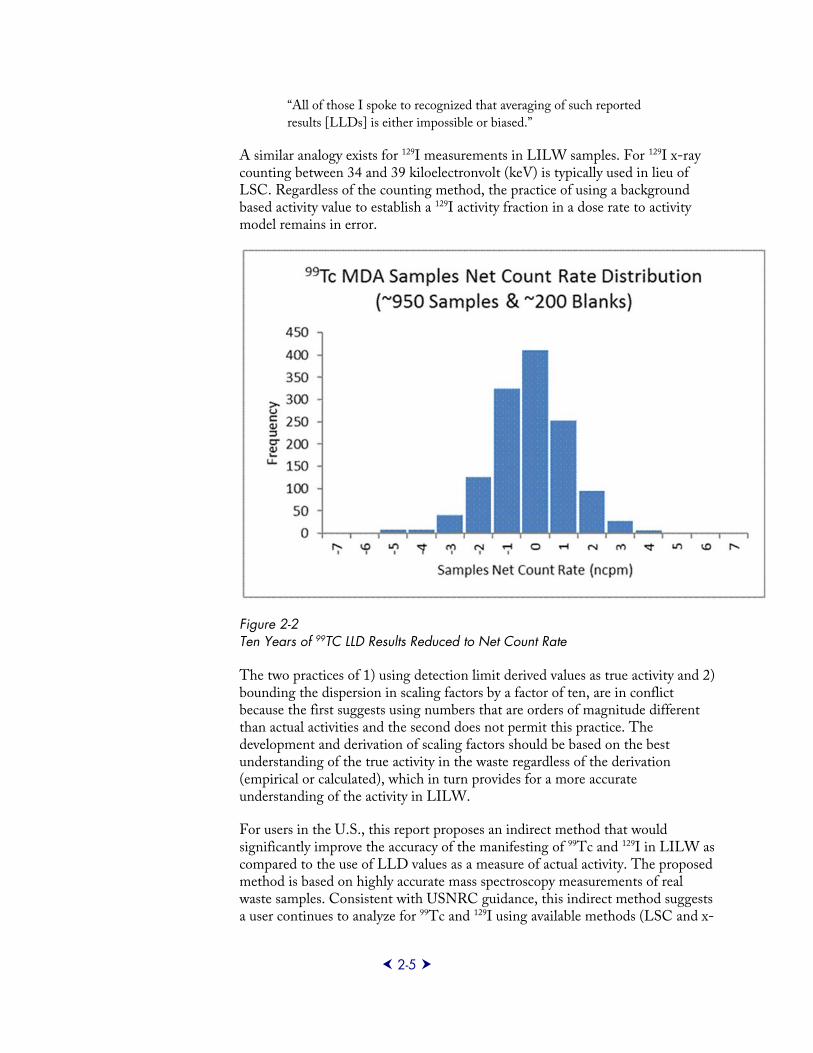
The data presented in Figure 2-1 and an additional ~200 blanks from the sample counting process are reduced to a count rate expressed as net of background (net counts per minute or ncpm) and then plotted as a histogram in Figure 2-2 for a frequency (or occurrence) distribution. This distribution of individual sample net count rates, be it positive or negative, depicts a near perfect distribution around zero as would be expected in the absence of sufficient signal statistically above background. Two key points become clear from this discussion:
Detection limit derived activity values do not represent true signal, rather they are zero relative to the sensitivity of the measurement method and,
Liquid scintillation counting does not have sufficient sensitivity to quantify 99Tc at the typical quantities that it are present in LILW.
Currie noted in NUREG/CR-4007 (10) that detection limit derived activity values were not appropriate for data based decisions, stating:
Using LLD activity values for 99Tc and 129I as fractions in dose rate to activity models in effect is using scaling factors that deviate by much greater than a factor of ten
9923195
2-5
“All of those I spoke to recognized that averaging of such reported
results [LLDs] is either impossible or biased.”
A similar analogy exists for 129I measurements in LILW samples. For 129I x-ray counting between 34 and 39 kiloelectronvolt (keV) is typically used in lieu of LSC. Regardless of the counting method, the practice of using a background based activity value to establish a 129I activity fraction in a dose rate to activity model remains in error.
Figure 2-2 Ten Years of 99TC LLD Results Reduced to Net Count Rate
The two practices of 1) using detection limit derived values as true activity and 2) bounding the dispersion in scaling factors by a factor of ten, are in conflict because the first suggests using numbers that are orders of magnitude different than actual activities and the second does not permit this practice. The development and derivation of scaling factors should be based on the best understanding of the true activity in the waste regardless of the derivation (empirical or calculated), which in turn provides for a more accurate understanding of the activity in LILW.
For users in the U.S., this report proposes an indirect method that would significantly improve the accuracy of the manifesting of 99Tc and 129I in LILW as compared to the use of LLD values as a measure of actual activity. The proposed method is based on highly accurate mass spectroscopy measurements of real waste samples. Consistent with USNRC guidance, this indirect method suggests a user continues to analyze for 99Tc and 129I using available methods (LSC and x-
9923195
2-6
ray counting, respectively) and apply the scaling factors only when 99Tc and/or 129I are not detected. (2)
Power Reactor LILW generators outside of the U.S. should evaluate this report for applicability to their power plant designs and materials of construction. If applicable, users outside of the U.S. may decide to revise their scaling factor methodology based upon the analyses in this report.
A Review of Existing and Reliable Measurement Data for Technetium-99 and Iodine-129
Between 1986 and 20001, Pacific Northwest National Laboratory (PNNL) conducted mass spectrometric measurements on waste samples for 99Tc and 129I for EPRI, USNRC, a number of utilities, and, a private client (Vance and associates). The results of these measurements are provided in NUREG/CR-6567 (1) stating:
“These measurements have provided the most accurate data base to
date of these activity scaling factors [99Tc and 129I]. Because of the large
difference between the two data bases [NUREG/CR-4101 and EPRI
NP-5077 versus the subject data], the dissemination of the accurate
mass spectrometric data would benefit the nuclear utilities, state and
federal regulators, performance assessment modelers, radioactive waste
managers, and LLW disposal facility operators”.
The mass spectrometric results of 99Tc and 129I measurements compiled from both previously published and unpublished measurements made at PNNL are summarized in Table 7.8 of NUREG/CR-6567 (1). These measurement results from NUREG/CR-6567 (1) are reproduced in Appendix A of this document. It should be noted that slight differences in the geometric means of the scaling factors between this work and NUREG/CR-6567 will be observed because this work does not have access to the same number of significant digits in the sample results as the original compilation.
General observations about the data in Section 7.2 and Table 7.8 of NUREG/CR-6567 (1) will be discussed first and then further details specific to 99Tc and 129I will be expanded upon separately.
The subject datasets contains 31 99Tc and 45 129I measurements from radwaste media from plants with a wide range of degrees of fuel failure (based on the ratio of fission to activation products in the samples from individual 137Cs/60Co ratios). The data set breaks down further as follows:
1 NUREG/CR-6567 was completed in the year 2000 however a date error was discovered in Table 7.8 in the document where it lists ten sample dates as 12-Jun-2009 and this is obviously a typographic error. This typographic error in the sample date doses not detract from the use of the sample results because the sample results are used in pairs without any need for decay.
9923195
2-7
45 Total Samples
- 32 Ion Exchange Resin
- 5 Dry Active Waste (DAW)
- 4 Filters
- 4 Others (Soil, Coolant, Charcoal)
30 samples are from 14 Pressurized Water Reactor (PWR) sites
15 samples are from 11 Boiling Water Reactor (BWR) sites
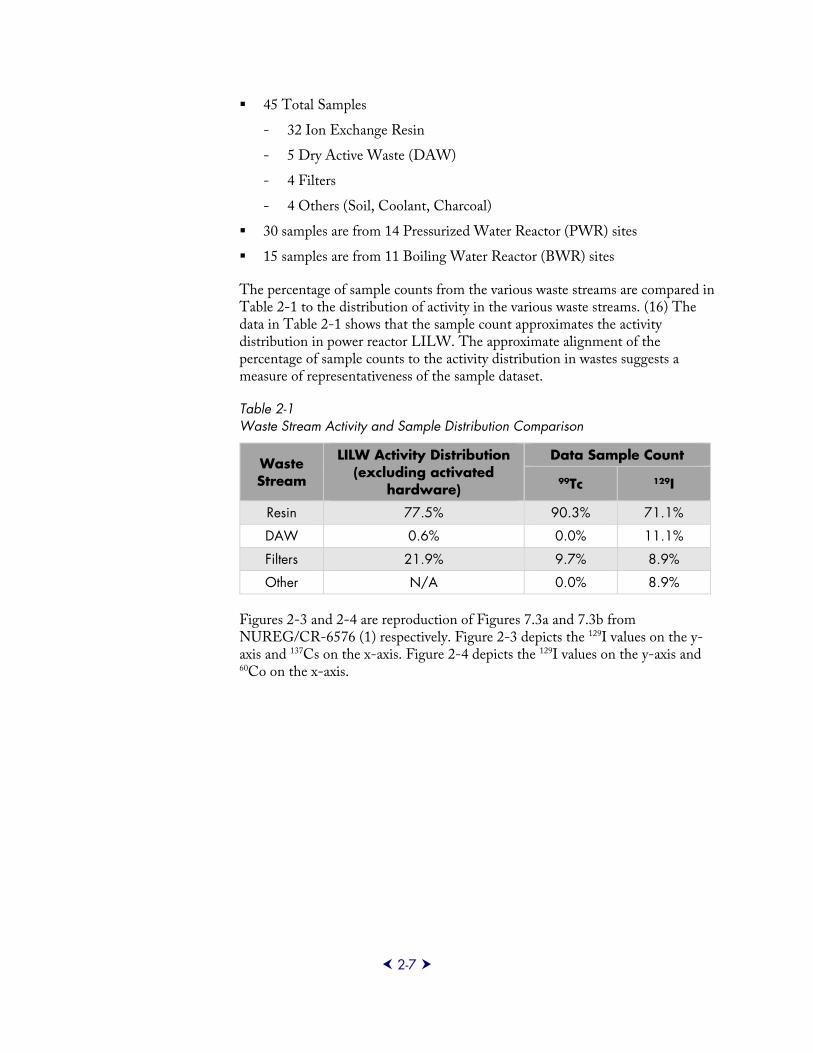
The percentage of sample counts from the various waste streams are compared in Table 2-1 to the distribution of activity in the various waste streams. (16) The data in Table 2-1 shows that the sample count approximates the activity distribution in power reactor LILW. The approximate alignment of the percentage of sample counts to the activity distribution in wastes suggests a measure of representativeness of the sample dataset.
Table 2-1 Waste Stream Activity and Sample Distribution Comparison
Waste Stream
LILW Activity Distribution (excluding activated
hardware)
Data Sample Count
99Tc 129I
Resin 77.5% 90.3% 71.1%
DAW 0.6% 0.0% 11.1%
Filters 21.9% 9.7% 8.9%
Other N/A 0.0% 8.9%
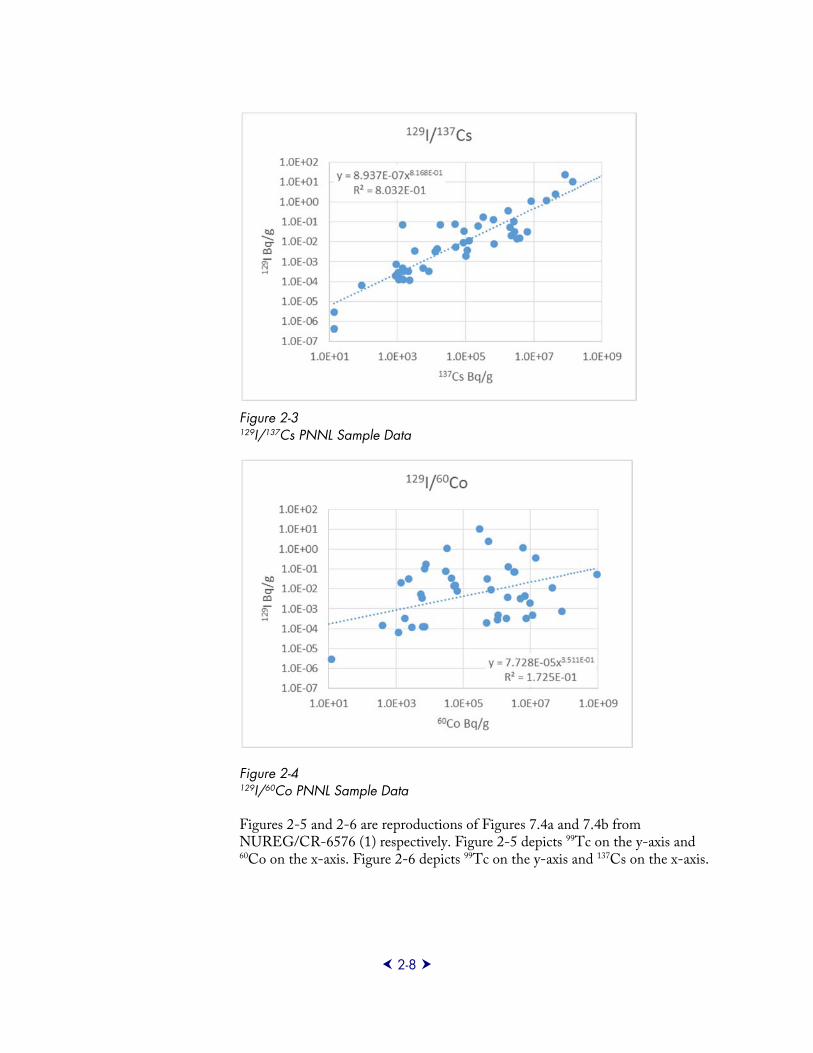
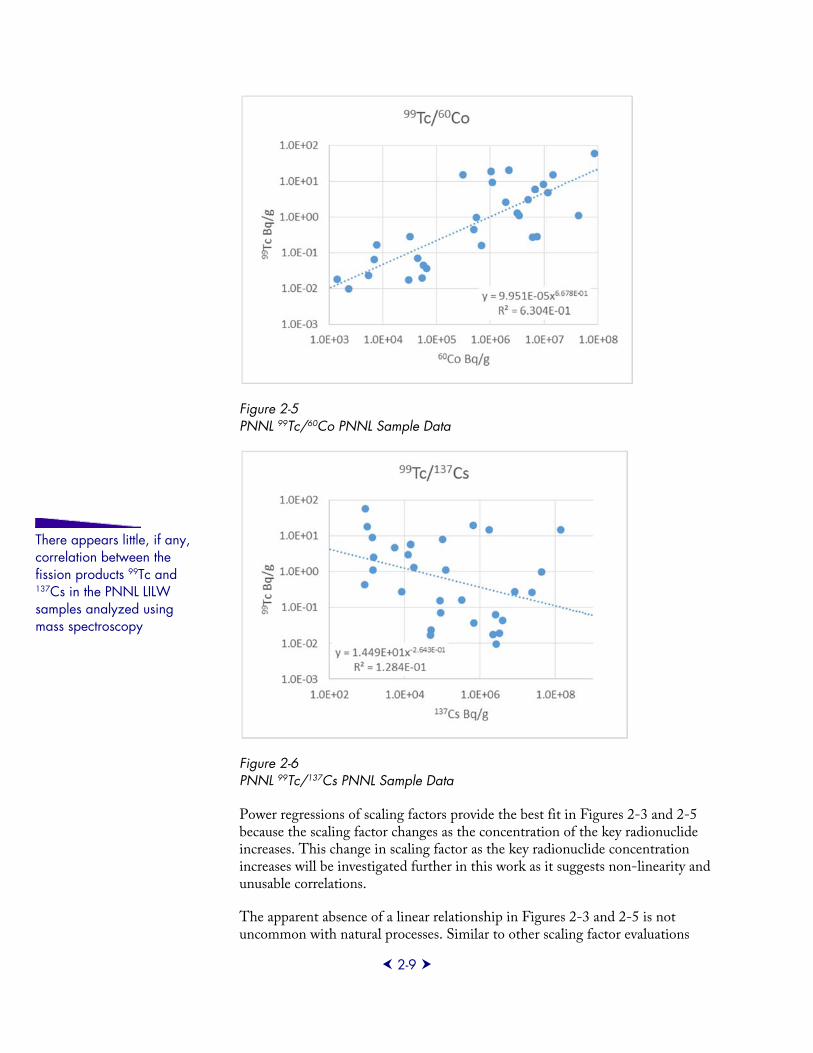
Figures 2-3 and 2-4 are reproduction of Figures 7.3a and 7.3b from NUREG/CR-6576 (1) respectively. Figure 2-3 depicts the 129I values on the y-axis and 137Cs on the x-axis. Figure 2-4 depicts the 129I values on the y-axis and 60Co on the x-axis.
9923195
2-8
Figure 2-3 129I/137Cs PNNL Sample Data
Figure 2-4 129I/60Co PNNL Sample Data
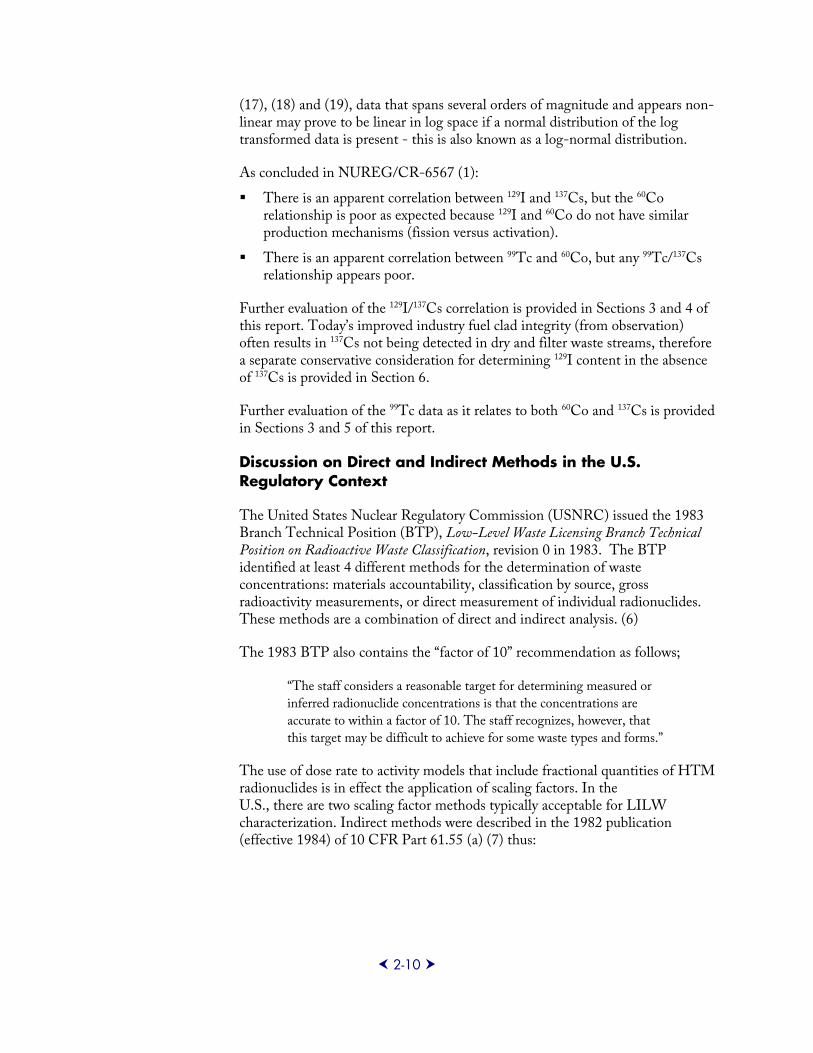
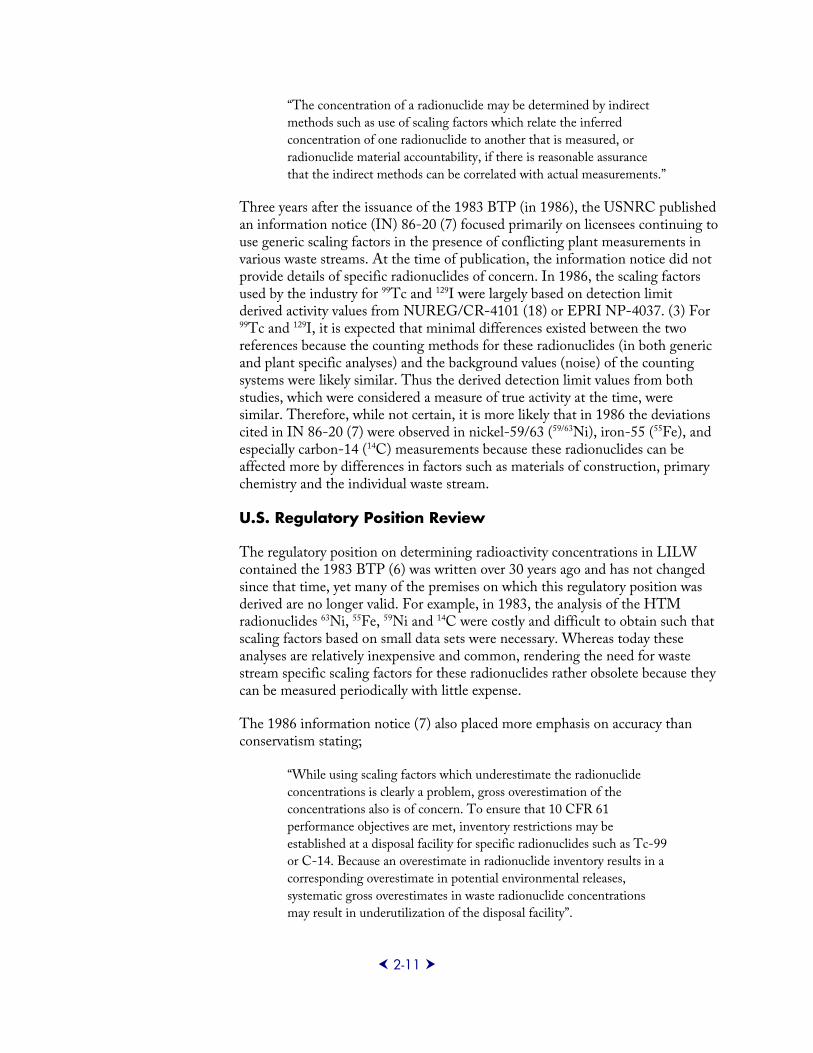
Figures 2-5 and 2-6 are reproductions of Figures 7.4a and 7.4b from NUREG/CR-6576 (1) respectively. Figure 2-5 depicts 99Tc on the y-axis and 60Co on the x-axis. Figure 2-6 depicts 99Tc on the y-axis and 137Cs on the x-axis.
9923195
2-9
Figure 2-5 PNNL 99Tc/60Co PNNL Sample Data
Figure 2-6 PNNL 99Tc/137Cs PNNL Sample Data
Power regressions of scaling factors provide the best fit in Figures 2-3 and 2-5 because the scaling factor changes as the concentration of the key radionuclide increases. This change in scaling factor as the key radionuclide concentration increases will be investigated further in this work as it suggests non-linearity and unusable correlations.
The apparent absence of a linear relationship in Figures 2-3 and 2-5 is not uncommon with natural processes. Similar to other scaling factor evaluations
There appears little, if any, correlation between the fission products 99Tc and 137Cs in the PNNL LILW samples analyzed using mass spectroscopy
9923195
2-10
(17), (18) and (19), data that spans several orders of magnitude and appears non-linear may prove to be linear in log space if a normal distribution of the log transformed data is present - this is also known as a log-normal distribution.
As concluded in NUREG/CR-6567 (1):
There is an apparent correlation between 129I and 137Cs, but the 60Co relationship is poor as expected because 129I and 60Co do not have similar production mechanisms (fission versus activation).
There is an apparent correlation between 99Tc and 60Co, but any 99Tc/137Cs relationship appears poor.
Further evaluation of the 129I/137Cs correlation is provided in Sections 3 and 4 of this report. Today’s improved industry fuel clad integrity (from observation) often results in 137Cs not being detected in dry and filter waste streams, therefore a separate conservative consideration for determining 129I content in the absence of 137Cs is provided in Section 6.
Further evaluation of the 99Tc data as it relates to both 60Co and 137Cs is provided in Sections 3 and 5 of this report.
Discussion on Direct and Indirect Methods in the U.S. Regulatory Context
The United States Nuclear Regulatory Commission (USNRC) issued the 1983 Branch Technical Position (BTP), Low-Level Waste Licensing Branch Technical Position on Radioactive Waste Classification, revision 0 in 1983. The BTP identified at least 4 different methods for the determination of waste concentrations: materials accountability, classification by source, gross radioactivity measurements, or direct measurement of individual radionuclides. These methods are a combination of direct and indirect analysis. (6)
The 1983 BTP also contains the “factor of 10” recommendation as follows;
“The staff considers a reasonable target for determining measured or
inferred radionuclide concentrations is that the concentrations are
accurate to within a factor of 10. The staff recognizes, however, that
this target may be difficult to achieve for some waste types and forms.”
The use of dose rate to activity models that include fractional quantities of HTM radionuclides is in effect the application of scaling factors. In the U.S., there are two scaling factor methods typically acceptable for LILW characterization. Indirect methods were described in the 1982 publication (effective 1984) of 10 CFR Part 61.55 (a) (7) thus:
9923195
2-11
“The concentration of a radionuclide may be determined by indirect
methods such as use of scaling factors which relate the inferred
concentration of one radionuclide to another that is measured, or
radionuclide material accountability, if there is reasonable assurance
that the indirect methods can be correlated with actual measurements.”
Three years after the issuance of the 1983 BTP (in 1986), the USNRC published an information notice (IN) 86-20 (7) focused primarily on licensees continuing to use generic scaling factors in the presence of conflicting plant measurements in various waste streams. At the time of publication, the information notice did not provide details of specific radionuclides of concern. In 1986, the scaling factors used by the industry for 99Tc and 129I were largely based on detection limit derived activity values from NUREG/CR-4101 (18) or EPRI NP-4037. (3) For 99Tc and 129I, it is expected that minimal differences existed between the two references because the counting methods for these radionuclides (in both generic and plant specific analyses) and the background values (noise) of the counting systems were likely similar. Thus the derived detection limit values from both studies, which were considered a measure of true activity at the time, were similar. Therefore, while not certain, it is more likely that in 1986 the deviations cited in IN 86-20 (7) were observed in nickel-59/63 (59/63Ni), iron-55 (55Fe), and especially carbon-14 (14C) measurements because these radionuclides can be affected more by differences in factors such as materials of construction, primary chemistry and the individual waste stream.
U.S. Regulatory Position Review
The regulatory position on determining radioactivity concentrations in LILW contained the 1983 BTP (6) was written over 30 years ago and has not changed since that time, yet many of the premises on which this regulatory position was derived are no longer valid. For example, in 1983, the analysis of the HTM radionuclides 63Ni, 55Fe, 59Ni and 14C were costly and difficult to obtain such that scaling factors based on small data sets were necessary. Whereas today these analyses are relatively inexpensive and common, rendering the need for waste stream specific scaling factors for these radionuclides rather obsolete because they can be measured periodically with little expense.
The 1986 information notice (7) also placed more emphasis on accuracy than conservatism stating;
“While using scaling factors which underestimate the radionuclide
concentrations is clearly a problem, gross overestimation of the
concentrations also is of concern. To ensure that 10 CFR 61
performance objectives are met, inventory restrictions may be
established at a disposal facility for specific radionuclides such as Tc-99
or C-14. Because an overestimate in radionuclide inventory results in a
corresponding overestimate in potential environmental releases,
systematic gross overestimates in waste radionuclide concentrations
may result in underutilization of the disposal facility”.
9923195
2-12
Yet today 99Tc and 129I continue to be over-reported by two to three orders of magnitude through either the use of detection limit derived activity values (or scaling factors derived from detection limit derived activity values) that have no relationship to the true activity of these radionuclides present in LILW.
In general, the recommendation for routine confirmatory sampling is satisfied through the minimum collection of annual samples for class B and C wastes and bi-annual samples for class A waste.(6) Indirect methods such as the use of scaling factors or computer codes may be used to predict with the same regulatory requirement for scaling factor use, that is:
“…there is reasonable assurance that the indirect methods can be
correlated with actual measurements.” (7)
The 1986 Information Notice (7) provides additional guidance:
“Scaling factors based on a single set of detailed sample analysis results
are acceptable, provided that there is reasonable assurance as to the
representativeness of the samples.”
It is this basis of using “a single set of detailed sample analyses” qualified through evaluation of fit and verified by calculation, thus providing “reasonable assurance” of representativeness, that this research is based upon.
From a review of more than 20 years of data, it has been demonstrated that 129I and 99Tc are over estimated in waste inventory, often much greater than the target “factor of 10” (8) by “in effect” using scaling factors based on detection limit values reported in radiochemistry analysis results.
Summary
The purpose of this work is to research, evaluate, and develop, if possible, an acceptable indirect method of quantifying 99Tc and 129I in power reactor LILW based on the most accurate empirical data currently available, related references and sound scientific calculation. These results may prove useful for decommissioning light water reactors (LWR) as well provided that sufficient consideration for radioactive decay of the key radionuclides is given. For example, if ten years has elapsed prior to decommissioning, then a key radionuclide such as 60Co would need to be decayed back to the generation date (approximately two half-lives) prior to applying the scaling factor. Otherwise the scaled HTM radionuclide activity would be understated by a factor of four in this example.
In support of this objective, this project evaluates the data from Table 7.8 of NUREG/CR-6567 (1) for 99Tc and 129I relative to the key gamma-emitting radionuclides (60Co and 137Cs) in pairs from the same Table 7.8. This evaluation is conducted to determine if reasonable correlations can be found for use as generic scaling factors in LILW.
9923195
2-13
The use of scaling factors derived from direct measurements in waste is recommended in lieu of using activity values derived from detection limits when the analysis method meets the required sensitivity for the measurement, but lacks the sensitivity to measure the true activity in the sample (typically 2-3 orders of magnitude lower for 99Tc and 129I using radiochemical methods).
U.S. users of this indirect method should continue to periodically analyze waste samples for 99Tc and 129I to the respective required (or lower, if desired) detection limits. In the event that no signal is detected per the detection limits (i.e., LLD, DL, MDA, MDC), a generic scaling factor from this research could be applied to scale the activity. This estimated 99Tc and/or 129I activity would then be reported as true consistent with USNRC Regulatory Issue Summary 2015-02. (2)
9923195

9923195
3-1
Section 3: Technetium-99 and Iodine-129 Production and Transport
In operating reactors, there are essentially three sources of radionuclides that could potentially impact the waste stream classification: coolant activation, fission, and activated corrosion products.
Coolant activation products, such as 3H and 14C, result from the activation of the coolant and its constituents (water, boron, lithium, etc.).
Fission products are produced from the fission process. The vast majority of fission products are maintained within the fuel cladding. However, other factors including tramp impurities and fuel defects can result in the release of the fission products into the coolant and waste streams.
Activated corrosion products arise from the activation of materials that have corroded from plant materials of construction. Activated corrosion produced are sorted into three sub-groups: corrosion products deposited on fuel surfaces from ex-core surface corrosion, highly activated corrosion products from fuel and reactor materials, and corrosion products, to a smaller degree, in support systems that are deposited on fuel surfaces and activated.
This report is focused on 99Tc and 129I from fission and also 99Tc from corrosion product activation. Coolant activation is not a source of 129I and 99Tc and is not discussed further in this report.
Fission Product Production:
Power reactors are initially loaded with uranium oxide fuel consisting of ~4% enriched uranium-235 (235U) and the balance uranium-238 (238U) to support the power demands placed on specific cycle requirements. As the cycle progress, 235U is expended and power is shifted to fission of plutonium-239 (239Pu) and some other minor transuranic nuclides. As the fuel exposure or the number of days in the cycle increases, the increase in 239Pu, and to some degree plutonium-241 (241Pu), provide a large fraction of the fission required to support power production (Figure 3-1). This change in fissile material has an impact on the fission fields and the equilibrium concentrations of fission products.
9923195
3-2
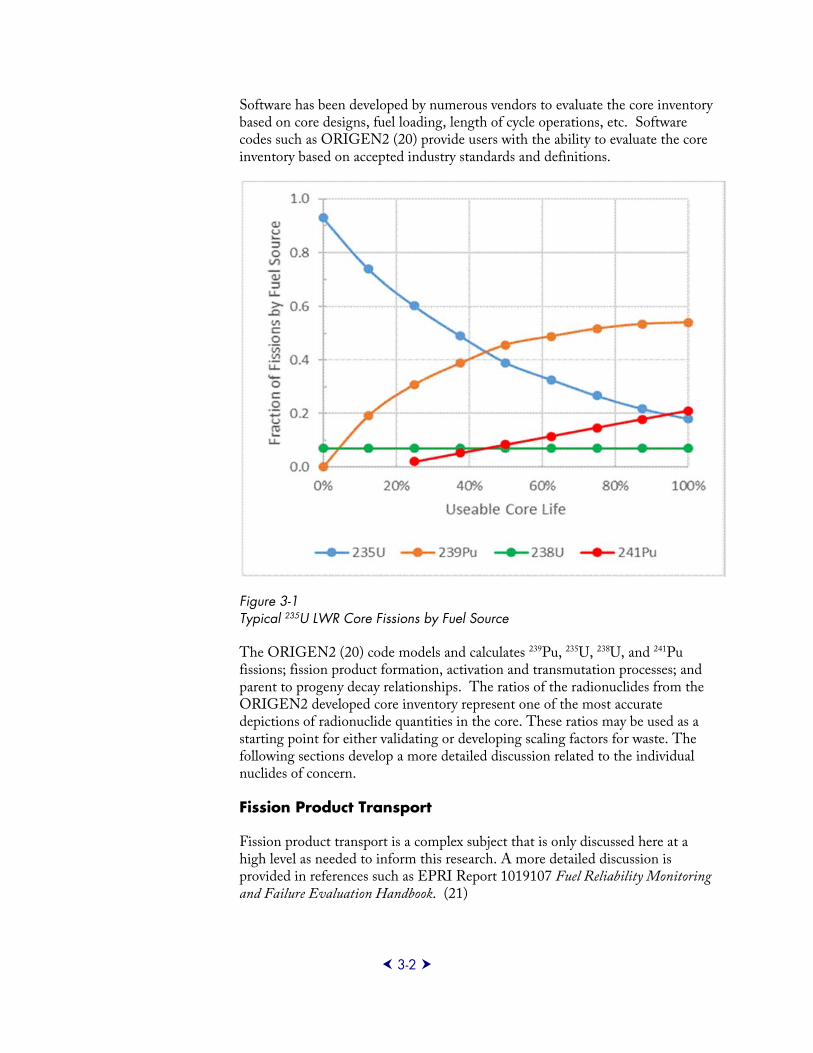
Software has been developed by numerous vendors to evaluate the core inventory based on core designs, fuel loading, length of cycle operations, etc. Software codes such as ORIGEN2 (20) provide users with the ability to evaluate the core inventory based on accepted industry standards and definitions.
Figure 3-1 Typical 235U LWR Core Fissions by Fuel Source
The ORIGEN2 (20) code models and calculates 239Pu, 235U, 238U, and 241Pu fissions; fission product formation, activation and transmutation processes; and parent to progeny decay relationships. The ratios of the radionuclides from the ORIGEN2 developed core inventory represent one of the most accurate depictions of radionuclide quantities in the core. These ratios may be used as a starting point for either validating or developing scaling factors for waste. The following sections develop a more detailed discussion related to the individual nuclides of concern.
Fission Product Transport
Fission product transport is a complex subject that is only discussed here at a high level as needed to inform this research. A more detailed discussion is provided in references such as EPRI Report 1019107 Fuel Reliability Monitoring and Failure Evaluation Handbook. (21)
9923195
3-3
In general, for a radionuclide to end up in waste, it must first be transported to the reactor coolant system (RCS). From the RCS, radionuclides migrate to waste through filtration and purification processes (ion exchange media, filter media and cartridges) or through leaks and the subsequent liquid processing and/or decontamination activities.
Fission products in the RCS have two sources. They are either formed in the fuel pellet itself or in much smaller quantities from fuel present in or on clad that originated from the fuel fabrication process. This latter source is known as “tramp” fuel. During or after formation, some fraction of fission products are transported out of the fuel where they originated (pellets or tramp) by primarily three processes.
Recoil – the process whereby fission fragments recoil from the fission event.
Diffusion – the process whereby fission products migrate through cracks and grain boundaries of the fuel.
Knockout – the process whereby a fission fragment strikes another and ejects the target from the fuel.
All three of these release methods are the subject of significant study and varying mathematical models. (22) (21) (23) (24) (25) (26) Fission products in the fuel to cladding gap may then be further transported to the RCS in the presence of degraded fuel clad integrity.
Recoil
In recoil from fuel pellets, it is estimated that approximately 25% of the fission fragments forming near the surface [within one recoil length or approximately 10 microns (22)] of a fuel pellet are released to the gap. The vast majority of these recoil fission products that enter and traverse the gap are stopped (deposited) in the inner wall of the fuel cladding. (25) Because of the process of stopping in the inner clad wall, recoil fission products do not contribute significantly to gap activity.
When considering recoil in tramp fuel, depending upon the location of the tramp (within or upon a material), recoil releases fission fragments directly to the RCS when there is less than a recoil length of material between the fission event and the RCS. Thus recoil is the largest source of fission products originating from tramp fuel in the RCS.
Diffusion
In diffusion, volatile radionuclides migrate from the fuel pellet to the gap typically through grain boundaries or cracks in the fuel pellet itself. (22) This is the primary source of noble gas activity in the gap. Iodine and cesium are less prone to diffusion than noble gasses under normal operating conditions, but can be more subject to diffusion at higher fuel pellet temperatures such as those experienced during a power increase (ramp). (25) Diffusion of certain radionuclides is also affected (delayed or accelerated) by the chemical form of the
9923195
3-4
precursor element. Therefore, when considering diffusion, the precursor state of matter must also be considered. For example, the dominant source of 137Cs from fission comes from decay of the precursor xenon-137 (137Xe) (3.83 minutes); 137Xe can diffuse from the fuel pellet to the gap and then decay to 137Cs in the gap.
Diffusion from tramp fuel seems to be generally discounted in the literature as a significant source of fission products in the RCS because recoil is so much more dominant and tramp fuel temperatures are much lower than the temperature of fuel pellets. (27)
Knockout
In knockout, fission fragments from recoil interact with other fission products in the fuel matrix transferring sufficient kinetic energy to eject the fission product from the fuel matrix. Knockout is limited by fission fragment recoil length in the fuel pellet, so it only occurs at the surface of the fuel pellets. Knockout is also the likely source of the majority of non-volatile fission products in the gap (27) because the targets will be released with lower energies than the incident fission fragment. These energies may be sufficiently low such that the targets are stopped in the gap and not driven into the clad wall like recoil fission fragments typically would be.
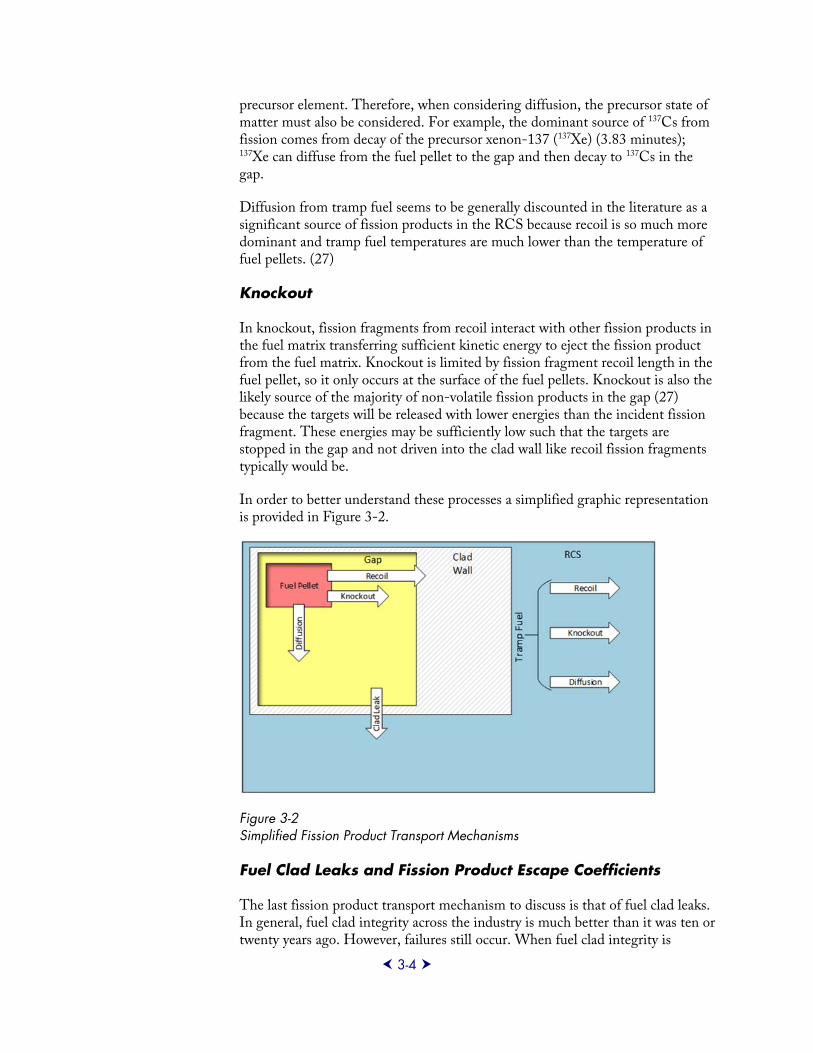
In order to better understand these processes a simplified graphic representation is provided in Figure 3-2.
Figure 3-2 Simplified Fission Product Transport Mechanisms
Fuel Clad Leaks and Fission Product Escape Coefficients
The last fission product transport mechanism to discuss is that of fuel clad leaks. In general, fuel clad integrity across the industry is much better than it was ten or twenty years ago. However, failures still occur. When fuel clad integrity is
9923195
3-5
compromised, fission products that were retained in the gap may be released to the RCS. This release from the gap to the RCS is a topic of significant study under both normal operating and varying accident (and temperature) conditions. (23) (24) (28) (29) The focus of this research only applies to operational waste, so the accident releases will not be considered.
Fission product transport through fuel clad leaks depends upon many factors that have been generalized into groups of elements possessing similar chemical properties (solubility, volatility, etc.) and the operating environment (RCS chemistry, temperature, pressure, etc.). The relative amounts of the radionuclides in these generalized group that are released from the fuel clad are commonly referred to as release fractions. Release fractions are provided in tables such as Table 3 of Regulatory Guide 1.183 (28) and updated in PNNL 18212 Rev. 1, 2011. (29)
Other generalizations of fission product transport may be more encompassing to include fuel clad leaks and the fission product contribution from tramp fuel combined. When combined they are referred to as fission product escape rate coefficients. Fission product escape rate coefficients are provided in references such as the Gaseous and Liquid Effluents (GALE) codes (30) (31). These are commonly used for developing operating design basis source terms for shielding and effluent dose controls.
Regardless of the units of measure used in release fractions or fission product escape rate coefficients, when the values are compared to other elements in the same dataset, they provide a relative behavior (or ratio) of certain elements as compared to others. These release fractions or fission product escape rate coefficients are used in the design and licensing of nuclear power plants and include some nuclear safety applications. These same values will be generally referred to as fission product escape coefficients in this work. They will be used here to evaluate the behavior of iodine, technetium and cesium relative to each other for evaluation and validation of the mass spectrometry measurement data from the PNNL LILW samples.
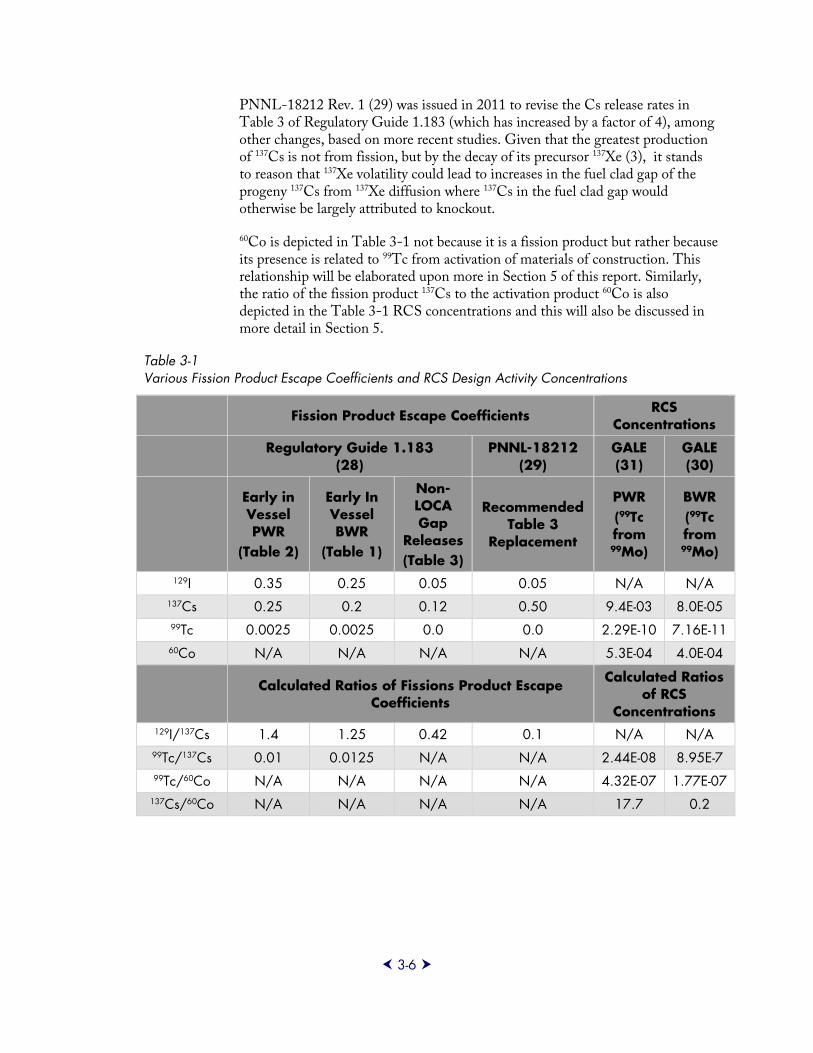
Table 3-1 depicts various fission product escape coefficients for the radionuclides of interest. As discussed, the units of the coefficients do not matter because the only values of interest are the unitless ratios of 129I/137Cs and 99Tc/137Cs within each column. Regulatory Guide 1.183 (28) provided updated source terms in 2000 to be used for analysis of accidents with or without loss of coolant accidents (LOCA). The “Early in Vessel” values in Table 3-1 involve heating above normal and are only depicted because they had values for Tc but they would not be applicable to operational waste with fuel clad defects. The values from Table 3 of Regulatory Guide 1.183 are depicted in Table 3.1 of this report and are for non-LOCA gap releases. These non-LOCA gap release fractions from Table 3 of Regulatory Guide 1.183 would be applicable to operational waste. However, these non-LOCA gap fractions do not have values for Tc because it is not as mobile as Cs or I from the pellet to the fuel clad gap to be considered significant in non-LOCA gap fractions.
9923195
3-6
PNNL-18212 Rev. 1 (29) was issued in 2011 to revise the Cs release rates in Table 3 of Regulatory Guide 1.183 (which has increased by a factor of 4), among other changes, based on more recent studies. Given that the greatest production of 137Cs is not from fission, but by the decay of its precursor 137Xe (3), it stands to reason that 137Xe volatility could lead to increases in the fuel clad gap of the progeny 137Cs from 137Xe diffusion where 137Cs in the fuel clad gap would otherwise be largely attributed to knockout.
60Co is depicted in Table 3-1 not because it is a fission product but rather because its presence is related to 99Tc from activation of materials of construction. This relationship will be elaborated upon more in Section 5 of this report. Similarly, the ratio of the fission product 137Cs to the activation product 60Co is also depicted in the Table 3-1 RCS concentrations and this will also be discussed in more detail in Section 5.
Table 3-1 Various Fission Product Escape Coefficients and RCS Design Activity Concentrations
Fission Product Escape Coefficients RCS Concentrations
Regulatory Guide 1.183
(28) PNNL-18212
(29) GALE (31)
GALE (30)
Early in Vessel PWR
(Table 2)
Early In Vessel BWR
(Table 1)
Non-LOCA Gap
Releases (Table 3)
Recommended Table 3
Replacement
PWR (99Tc from 99Mo)
BWR (99Tc from 99Mo)
129I 0.35 0.25 0.05 0.05 N/A N/A 137Cs 0.25 0.2 0.12 0.50 9.4E-03 8.0E-05 99Tc 0.0025 0.0025 0.0 0.0 2.29E-10 7.16E-11 60Co N/A N/A N/A N/A 5.3E-04 4.0E-04
Calculated Ratios of Fissions Product Escape Coefficients
Calculated Ratios of RCS
Concentrations 129I/137Cs 1.4 1.25 0.42 0.1 N/A N/A 99Tc/137Cs 0.01 0.0125 N/A N/A 2.44E-08 8.95E-7 99Tc/60Co N/A N/A N/A N/A 4.32E-07 1.77E-07
137Cs/60Co N/A N/A N/A N/A 17.7 0.2
9923195
3-7
The ratios of the fission product escape coefficients in Table 3-1 describe relative behavior between the radionuclides and can be applied to core inventory values to evaluate the approximate relationships that would be present in reactor coolant. The ratios of the reactor coolant concentrations in Table 3-1 also provide direct approximate relationships in reactor coolant. Either approximation of what would be present in reactor coolant is also, in general, an approximation of what would be present in waste. For waste, there are other factors to consider such as differing decontamination factors, solubility, etc. Nevertheless, these approximations provide a reasonable data point for comparing to the PNNL mass spectrometry sample data evaluations in this work.
Note that the 99Tc RCS concentrations in Table 3-1 are calculated from the RCS molybdenum-99 (99Mo) concentrations provided in the same references (the GALE codes) by using the ratio of 99Tc/99Mo specific activity values, the specific activity of 99Mo is 4.75E+11 μCi/g (1.76E+16 Bq/g) and the specific activity of 99Tc is 1.70E+04 μCi/g (6.29E+04 Bq/g). (32). This process essentially converts 99Mo to mass then that mass to 99Tc activity resulting in the unitless ratio of 3.58E-08.
Activation of Corrosion Products (Production)
Through a series of corrosion processes, corrosion products are released into the coolant and transported around the RCS. Passage through the operating core or deposition of the corrosion products on the fuel surfaces can lead to activation through neutron capture. It is not the purpose of this report to go extensively into various activation products but only to briefly focus on those that are of importance to this scaling factor investigation, specifically 60Co and 99Tc. These will be expanded upon further in this section, where 99Tc production is discussed, and in Section 5.
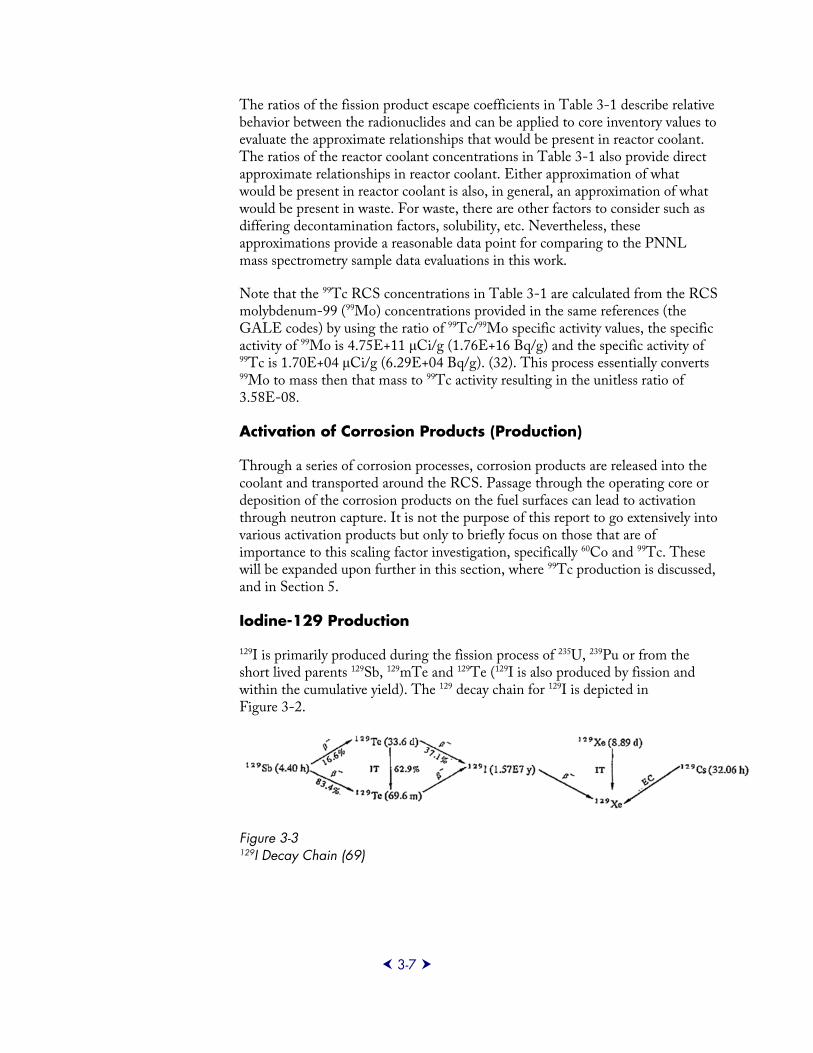
Iodine-129 Production
129I is primarily produced during the fission process of 235U, 239Pu or from the short lived parents 129Sb, 129mTe and 129Te (129I is also produced by fission and within the cumulative yield). The 129 decay chain for 129I is depicted in Figure 3-2.
Figure 3-3 129I Decay Chain (69)
9923195
3-8
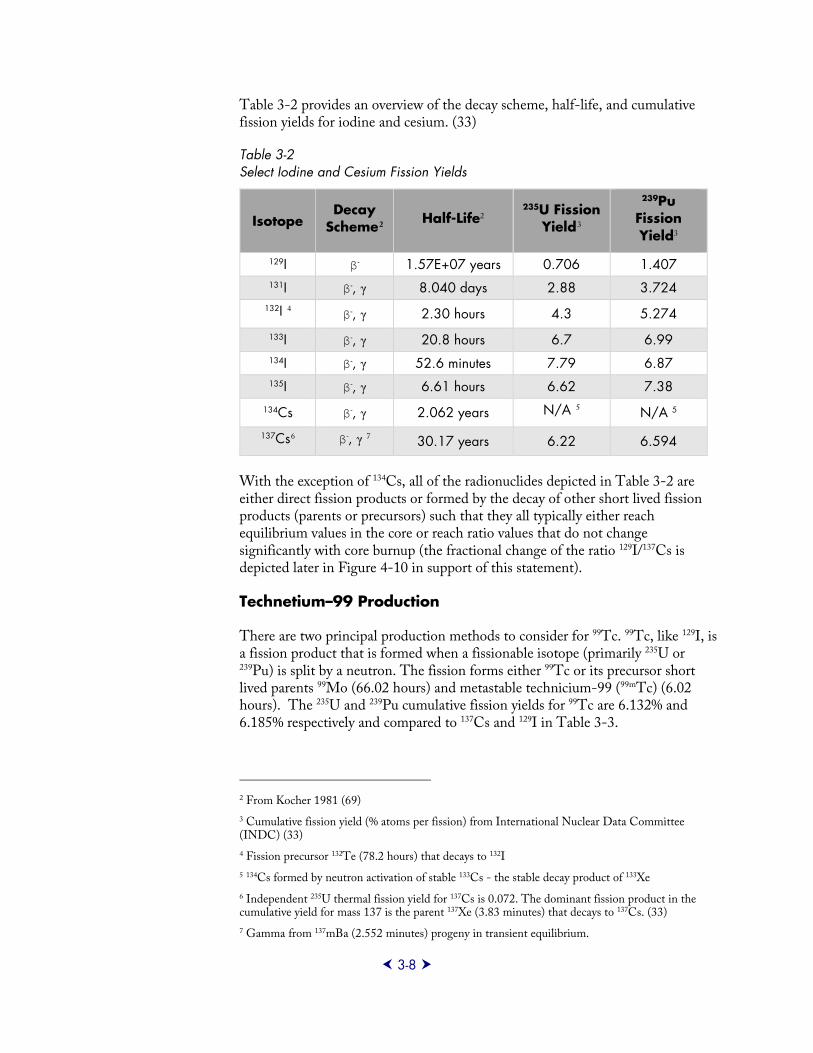
Table 3-2 provides an overview of the decay scheme, half-life, and cumulative fission yields for iodine and cesium. (33)
Table 3-2 Select Iodine and Cesium Fission Yields
Isotope Decay
Scheme2 Half-Life2 235U Fission
Yield3
239Pu Fission Yield3
129I β- 1.57E+07 years 0.706 1.407 131I β-, γ 8.040 days 2.88 3.724
132I 4 β-, γ 2.30 hours 4.3 5.274 133I β-, γ 20.8 hours 6.7 6.99 134I β-, γ 52.6 minutes 7.79 6.87 135I β-, γ 6.61 hours 6.62 7.38
134Cs β-, γ 2.062 years N/A 5 N/A 5 137Cs6 β-, γ 7 30.17 years 6.22 6.594
With the exception of 134Cs, all of the radionuclides depicted in Table 3-2 are either direct fission products or formed by the decay of other short lived fission products (parents or precursors) such that they all typically either reach equilibrium values in the core or reach ratio values that do not change significantly with core burnup (the fractional change of the ratio 129I/137Cs is depicted later in Figure 4-10 in support of this statement).
Technetium–99 Production
There are two principal production methods to consider for 99Tc. 99Tc, like 129I, is a fission product that is formed when a fissionable isotope (primarily 235U or 239Pu) is split by a neutron. The fission forms either 99Tc or its precursor short lived parents 99Mo (66.02 hours) and metastable technicium-99 (99mTc) (6.02 hours). The 235U and 239Pu cumulative fission yields for 99Tc are 6.132% and 6.185% respectively and compared to 137Cs and 129I in Table 3-3.
2 From Kocher 1981 (69) 3 Cumulative fission yield (% atoms per fission) from International Nuclear Data Committee (INDC) (33) 4 Fission precursor 132Te (78.2 hours) that decays to 132I 5 134Cs formed by neutron activation of stable 133Cs - the stable decay product of 133Xe 6 Independent 235U thermal fission yield for 137Cs is 0.072. The dominant fission product in the cumulative yield for mass 137 is the parent 137Xe (3.83 minutes) that decays to 137Cs. (33) 7 Gamma from 137mBa (2.552 minutes) progeny in transient equilibrium.
9923195
3-9
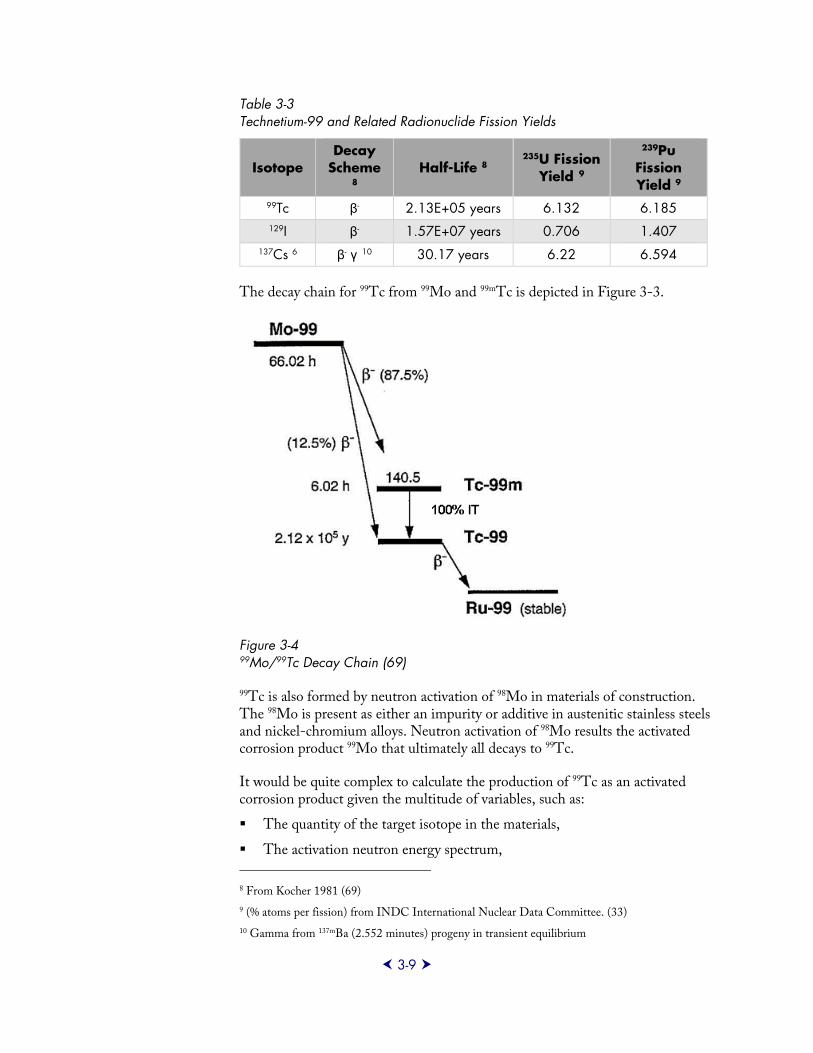
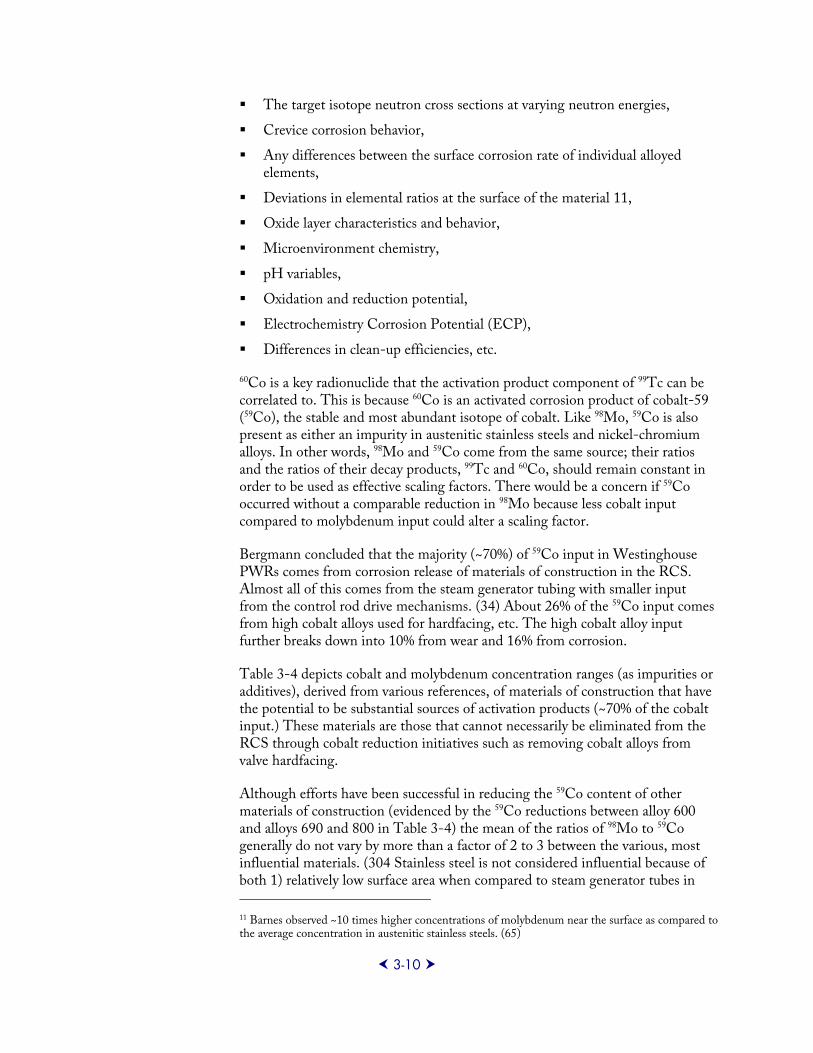
Table 3-3 Technetium-99 and Related Radionuclide Fission Yields
Isotope Decay
Scheme 8
Half-Life 8 235U Fission
Yield 9
239Pu Fission Yield 9
99Tc β- 2.13E+05 years 6.132 6.185 129I β- 1.57E+07 years 0.706 1.407
137Cs 6 β- γ 10 30.17 years 6.22 6.594
The decay chain for 99Tc from 99Mo and 99mTc is depicted in Figure 3-3.
Figure 3-4 99Mo/99Tc Decay Chain (69)
99Tc is also formed by neutron activation of 98Mo in materials of construction. The 98Mo is present as either an impurity or additive in austenitic stainless steels and nickel-chromium alloys. Neutron activation of 98Mo results the activated corrosion product 99Mo that ultimately all decays to 99Tc.
It would be quite complex to calculate the production of 99Tc as an activated corrosion product given the multitude of variables, such as: The quantity of the target isotope in the materials,
The activation neutron energy spectrum, 8 From Kocher 1981 (69) 9 (% atoms per fission) from INDC International Nuclear Data Committee. (33) 10 Gamma from 137mBa (2.552 minutes) progeny in transient equilibrium
9923195
3-10
The target isotope neutron cross sections at varying neutron energies,
Crevice corrosion behavior,
Any differences between the surface corrosion rate of individual alloyed elements,
Deviations in elemental ratios at the surface of the material 11,
Oxide layer characteristics and behavior,
Microenvironment chemistry,
pH variables,
Oxidation and reduction potential,
Electrochemistry Corrosion Potential (ECP),
Differences in clean-up efficiencies, etc.
60Co is a key radionuclide that the activation product component of 99Tc can be correlated to. This is because 60Co is an activated corrosion product of cobalt-59 (59Co), the stable and most abundant isotope of cobalt. Like 98Mo, 59Co is also present as either an impurity in austenitic stainless steels and nickel-chromium alloys. In other words, 98Mo and 59Co come from the same source; their ratios and the ratios of their decay products, 99Tc and 60Co, should remain constant in order to be used as effective scaling factors. There would be a concern if 59Co occurred without a comparable reduction in 98Mo because less cobalt input compared to molybdenum input could alter a scaling factor.
Bergmann concluded that the majority (~70%) of 59Co input in Westinghouse PWRs comes from corrosion release of materials of construction in the RCS. Almost all of this comes from the steam generator tubing with smaller input from the control rod drive mechanisms. (34) About 26% of the 59Co input comes from high cobalt alloys used for hardfacing, etc. The high cobalt alloy input further breaks down into 10% from wear and 16% from corrosion.
Table 3-4 depicts cobalt and molybdenum concentration ranges (as impurities or additives), derived from various references, of materials of construction that have the potential to be substantial sources of activation products (~70% of the cobalt input.) These materials are those that cannot necessarily be eliminated from the RCS through cobalt reduction initiatives such as removing cobalt alloys from valve hardfacing.
Although efforts have been successful in reducing the 59Co content of other materials of construction (evidenced by the 59Co reductions between alloy 600 and alloys 690 and 800 in Table 3-4) the mean of the ratios of 98Mo to 59Co generally do not vary by more than a factor of 2 to 3 between the various, most influential materials. (304 Stainless steel is not considered influential because of both 1) relatively low surface area when compared to steam generator tubes in
11 Barnes observed ~10 times higher concentrations of molybdenum near the surface as compared to the average concentration in austenitic stainless steels. (65)
9923195
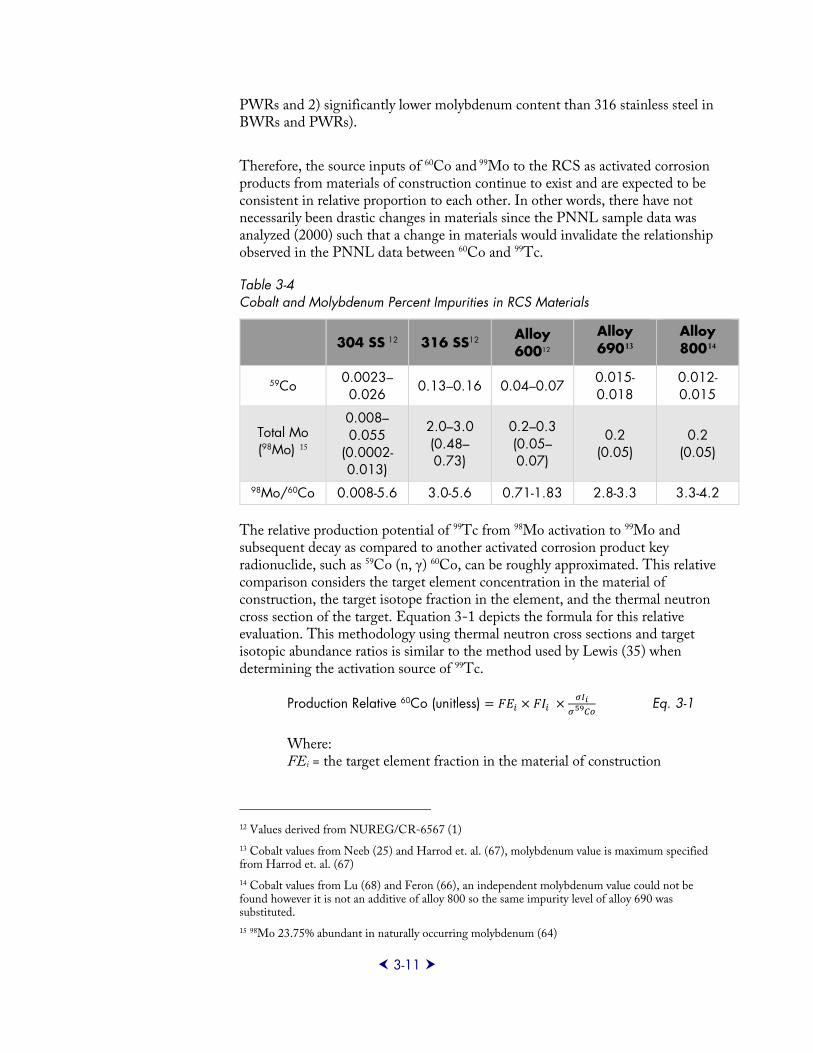
3-11
PWRs and 2) significantly lower molybdenum content than 316 stainless steel in BWRs and PWRs).
Therefore, the source inputs of 60Co and 99Mo to the RCS as activated corrosion products from materials of construction continue to exist and are expected to be consistent in relative proportion to each other. In other words, there have not necessarily been drastic changes in materials since the PNNL sample data was analyzed (2000) such that a change in materials would invalidate the relationship observed in the PNNL data between 60Co and 99Tc.
Table 3-4 Cobalt and Molybdenum Percent Impurities in RCS Materials
304 SS 12 316 SS12 Alloy 60012
Alloy 69013
Alloy 80014
59Co 0.0023–0.026
0.13–0.16 0.04–0.07 0.015-0.018
0.012-0.015
Total Mo (98Mo) 15
0.008–0.055
(0.0002-0.013)
2.0–3.0 (0.48–0.73)
0.2–0.3 (0.05–0.07)
0.2 (0.05)
0.2 (0.05)
98Mo/60Co 0.008-5.6 3.0-5.6 0.71-1.83 2.8-3.3 3.3-4.2
The relative production potential of 99Tc from 98Mo activation to 99Mo and subsequent decay as compared to another activated corrosion product key radionuclide, such as 59Co (n, γ) 60Co, can be roughly approximated. This relative comparison considers the target element concentration in the material of construction, the target isotope fraction in the element, and the thermal neutron cross section of the target. Equation 3-1 depicts the formula for this relative evaluation. This methodology using thermal neutron cross sections and target isotopic abundance ratios is similar to the method used by Lewis (35) when determining the activation source of 99Tc.
Production Relative 60Co (unitless) = 𝐹𝐹𝐹𝐹𝑖𝑖 × 𝐹𝐹𝐹𝐹𝑖𝑖 × 𝜎𝜎𝜎𝜎𝑖𝑖𝜎𝜎 𝐶𝐶𝐶𝐶59 Eq. 3-1
Where: FEi = the target element fraction in the material of construction
12 Values derived from NUREG/CR-6567 (1) 13 Cobalt values from Neeb (25) and Harrod et. al. (67), molybdenum value is maximum specified from Harrod et. al. (67) 14 Cobalt values from Lu (68) and Feron (66), an independent molybdenum value could not be found however it is not an additive of alloy 800 so the same impurity level of alloy 690 was substituted. 15 98Mo 23.75% abundant in naturally occurring molybdenum (64)
9923195
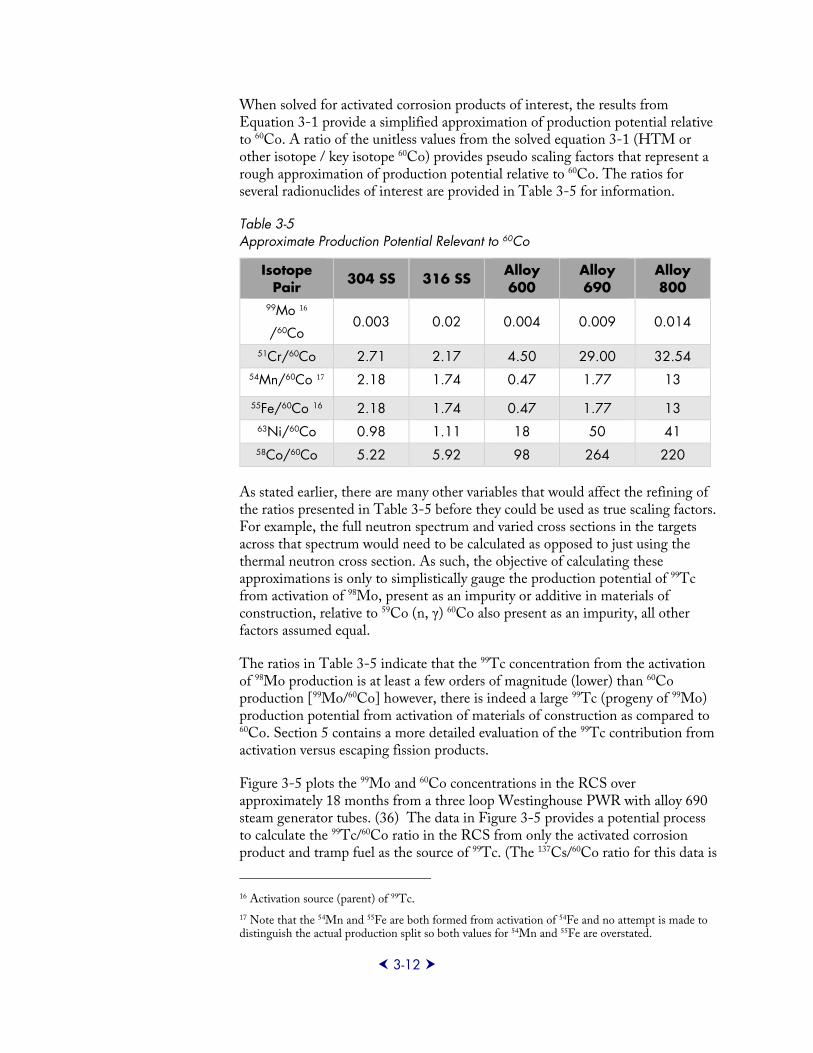
3-12
When solved for activated corrosion products of interest, the results from Equation 3-1 provide a simplified approximation of production potential relative to 60Co. A ratio of the unitless values from the solved equation 3-1 (HTM or other isotope / key isotope 60Co) provides pseudo scaling factors that represent a rough approximation of production potential relative to 60Co. The ratios for several radionuclides of interest are provided in Table 3-5 for information.
Table 3-5 Approximate Production Potential Relevant to 60Co
Isotope Pair
304 SS 316 SS Alloy 600
Alloy 690
Alloy 800
99Mo 16
/60Co 0.003 0.02 0.004 0.009 0.014
51Cr/60Co 2.71 2.17 4.50 29.00 32.54 54Mn/60Co 17 2.18 1.74 0.47 1.77 13
55Fe/60Co 16 2.18 1.74 0.47 1.77 13 63Ni/60Co 0.98 1.11 18 50 41 58Co/60Co 5.22 5.92 98 264 220
As stated earlier, there are many other variables that would affect the refining of the ratios presented in Table 3-5 before they could be used as true scaling factors. For example, the full neutron spectrum and varied cross sections in the targets across that spectrum would need to be calculated as opposed to just using the thermal neutron cross section. As such, the objective of calculating these approximations is only to simplistically gauge the production potential of 99Tc from activation of 98Mo, present as an impurity or additive in materials of construction, relative to 59Co (n, γ) 60Co also present as an impurity, all other factors assumed equal.
The ratios in Table 3-5 indicate that the 99Tc concentration from the activation of 98Mo production is at least a few orders of magnitude (lower) than 60Co production [99Mo/60Co] however, there is indeed a large 99Tc (progeny of 99Mo) production potential from activation of materials of construction as compared to 60Co. Section 5 contains a more detailed evaluation of the 99Tc contribution from activation versus escaping fission products.
Figure 3-5 plots the 99Mo and 60Co concentrations in the RCS over approximately 18 months from a three loop Westinghouse PWR with alloy 690 steam generator tubes. (36) The data in Figure 3-5 provides a potential process to calculate the 99Tc/60Co ratio in the RCS from only the activated corrosion product and tramp fuel as the source of 99Tc. (The 137Cs/60Co ratio for this data is
16 Activation source (parent) of 99Tc.
17 Note that the 54Mn and 55Fe are both formed from activation of 54Fe and no attempt is made to distinguish the actual production split so both values for 54Mn and 55Fe are overstated.
9923195
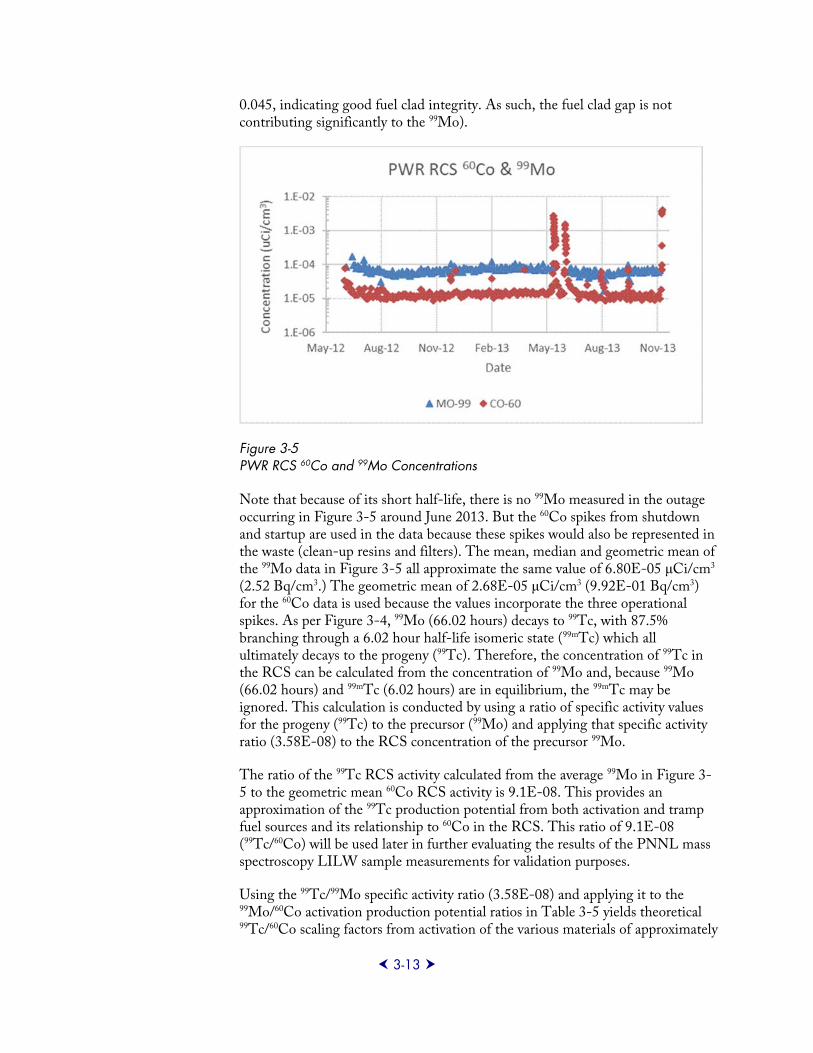
3-13
0.045, indicating good fuel clad integrity. As such, the fuel clad gap is not contributing significantly to the 99Mo).
Figure 3-5 PWR RCS 60Co and 99Mo Concentrations
Note that because of its short half-life, there is no 99Mo measured in the outage occurring in Figure 3-5 around June 2013. But the 60Co spikes from shutdown and startup are used in the data because these spikes would also be represented in the waste (clean-up resins and filters). The mean, median and geometric mean of the 99Mo data in Figure 3-5 all approximate the same value of 6.80E-05 μCi/cm3 (2.52 Bq/cm3.) The geometric mean of 2.68E-05 μCi/cm3 (9.92E-01 Bq/cm3) for the 60Co data is used because the values incorporate the three operational spikes. As per Figure 3-4, 99Mo (66.02 hours) decays to 99Tc, with 87.5% branching through a 6.02 hour half-life isomeric state (99mTc) which all ultimately decays to the progeny (99Tc). Therefore, the concentration of 99Tc in the RCS can be calculated from the concentration of 99Mo and, because 99Mo (66.02 hours) and 99mTc (6.02 hours) are in equilibrium, the 99mTc may be ignored. This calculation is conducted by using a ratio of specific activity values for the progeny (99Tc) to the precursor (99Mo) and applying that specific activity ratio (3.58E-08) to the RCS concentration of the precursor 99Mo.
The ratio of the 99Tc RCS activity calculated from the average 99Mo in Figure 3-5 to the geometric mean 60Co RCS activity is 9.1E-08. This provides an approximation of the 99Tc production potential from both activation and tramp fuel sources and its relationship to 60Co in the RCS. This ratio of 9.1E-08 (99Tc/60Co) will be used later in further evaluating the results of the PNNL mass spectroscopy LILW sample measurements for validation purposes.
Using the 99Tc/99Mo specific activity ratio (3.58E-08) and applying it to the 99Mo/60Co activation production potential ratios in Table 3-5 yields theoretical 99Tc/60Co scaling factors from activation of the various materials of approximately
9923195
3-14
1.0E-10 to 7.0E-10. These theoretical values are lower by a few orders of magnitude than the value calculated from Figure 3-5 and from the values exhibited by the actual LILW sample data in Section 5. It is important to note that:
This comparison does not account for 99Mo (thus 99Tc) from tramp fuel because it assumes all 99Mo in Figure 3-5 is from activation,
The 99Mo activation product potential is only based on thermal neutrons and not highly refined to include the full fission neutron spectrum and individual neutron cross sections based on the fission neutron spectrum, and
There are no fuel clad integrity challenges in the data presented in Figure 3-5; as such only activation of 98Mo and tramp fuel fission are the sources of 99Mo in the data.
The derivation of the ratios in Table 3-5 are oversimplified yet validating when the approximate production potential for 99Tc from activation of 98Mo in materials of construction alone is more than sufficient to explain a large proportion of the 99Tc in LILW and the apparent 99Tc correlation to 60Co.
9923195
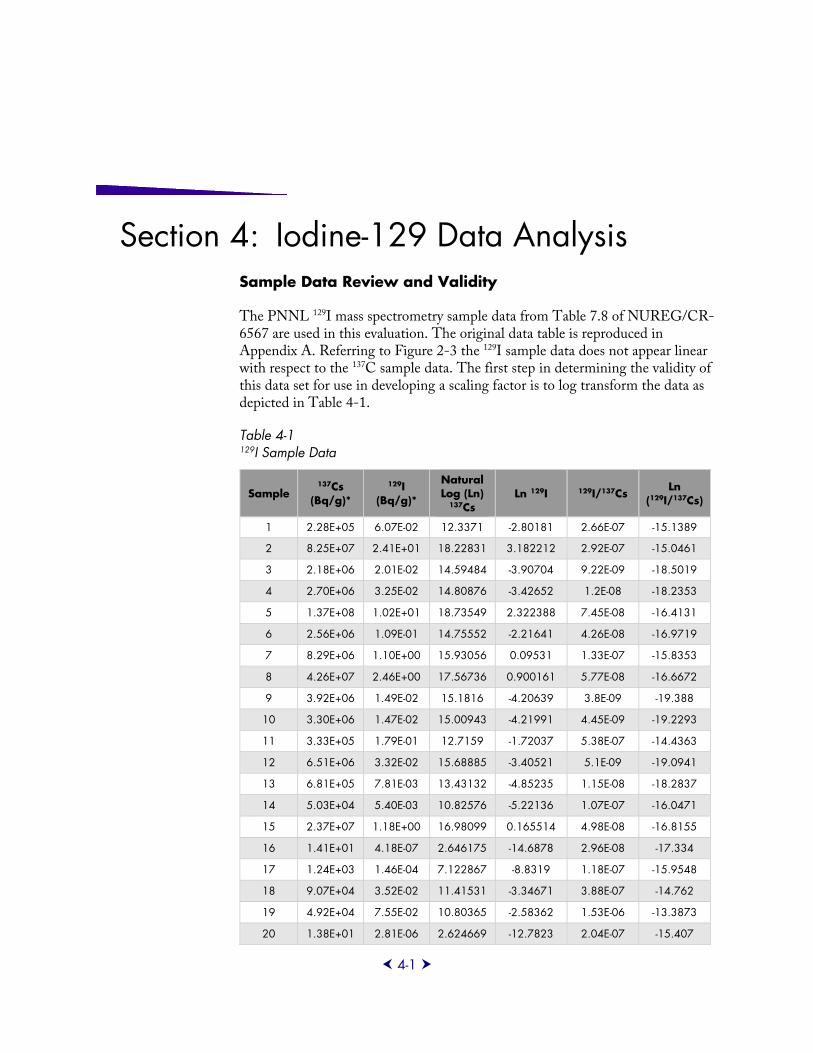
4-1
Section 4: Iodine-129 Data Analysis Sample Data Review and Validity
The PNNL 129I mass spectrometry sample data from Table 7.8 of NUREG/CR-6567 are used in this evaluation. The original data table is reproduced in Appendix A. Referring to Figure 2-3 the 129I sample data does not appear linear with respect to the 137C sample data. The first step in determining the validity of this data set for use in developing a scaling factor is to log transform the data as depicted in Table 4-1.
Table 4-1 129I Sample Data
Sample 137Cs
(Bq/g)*
129I (Bq/g)*
Natural Log (Ln)
137Cs Ln 129I 129I/137Cs
Ln (129I/137Cs)
1 2.28E+05 6.07E-02 12.3371 -2.80181 2.66E-07 -15.1389
2 8.25E+07 2.41E+01 18.22831 3.182212 2.92E-07 -15.0461
3 2.18E+06 2.01E-02 14.59484 -3.90704 9.22E-09 -18.5019
4 2.70E+06 3.25E-02 14.80876 -3.42652 1.2E-08 -18.2353
5 1.37E+08 1.02E+01 18.73549 2.322388 7.45E-08 -16.4131
6 2.56E+06 1.09E-01 14.75552 -2.21641 4.26E-08 -16.9719
7 8.29E+06 1.10E+00 15.93056 0.09531 1.33E-07 -15.8353
8 4.26E+07 2.46E+00 17.56736 0.900161 5.77E-08 -16.6672
9 3.92E+06 1.49E-02 15.1816 -4.20639 3.8E-09 -19.388
10 3.30E+06 1.47E-02 15.00943 -4.21991 4.45E-09 -19.2293
11 3.33E+05 1.79E-01 12.7159 -1.72037 5.38E-07 -14.4363
12 6.51E+06 3.32E-02 15.68885 -3.40521 5.1E-09 -19.0941
13 6.81E+05 7.81E-03 13.43132 -4.85235 1.15E-08 -18.2837
14 5.03E+04 5.40E-03 10.82576 -5.22136 1.07E-07 -16.0471
15 2.37E+07 1.18E+00 16.98099 0.165514 4.98E-08 -16.8155
16 1.41E+01 4.18E-07 2.646175 -14.6878 2.96E-08 -17.334
17 1.24E+03 1.46E-04 7.122867 -8.8319 1.18E-07 -15.9548
18 9.07E+04 3.52E-02 11.41531 -3.34671 3.88E-07 -14.762
19 4.92E+04 7.55E-02 10.80365 -2.58362 1.53E-06 -13.3873
20 1.38E+01 2.81E-06 2.624669 -12.7823 2.04E-07 -15.407
9923195
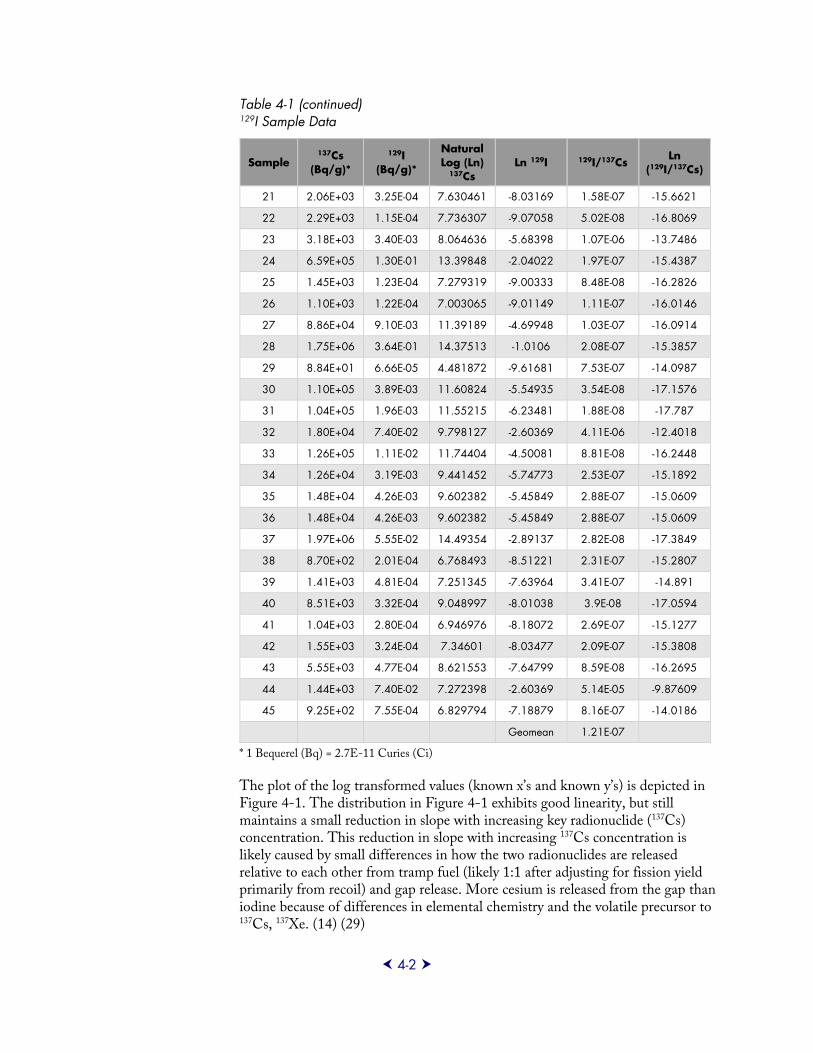
4-2
Table 4-1 (continued) 129I Sample Data
Sample 137Cs
(Bq/g)*
129I (Bq/g)*
Natural Log (Ln)
137Cs Ln 129I 129I/137Cs
Ln (129I/137Cs)
21 2.06E+03 3.25E-04 7.630461 -8.03169 1.58E-07 -15.6621
22 2.29E+03 1.15E-04 7.736307 -9.07058 5.02E-08 -16.8069
23 3.18E+03 3.40E-03 8.064636 -5.68398 1.07E-06 -13.7486
24 6.59E+05 1.30E-01 13.39848 -2.04022 1.97E-07 -15.4387
25 1.45E+03 1.23E-04 7.279319 -9.00333 8.48E-08 -16.2826
26 1.10E+03 1.22E-04 7.003065 -9.01149 1.11E-07 -16.0146
27 8.86E+04 9.10E-03 11.39189 -4.69948 1.03E-07 -16.0914
28 1.75E+06 3.64E-01 14.37513 -1.0106 2.08E-07 -15.3857
29 8.84E+01 6.66E-05 4.481872 -9.61681 7.53E-07 -14.0987
30 1.10E+05 3.89E-03 11.60824 -5.54935 3.54E-08 -17.1576
31 1.04E+05 1.96E-03 11.55215 -6.23481 1.88E-08 -17.787
32 1.80E+04 7.40E-02 9.798127 -2.60369 4.11E-06 -12.4018
33 1.26E+05 1.11E-02 11.74404 -4.50081 8.81E-08 -16.2448
34 1.26E+04 3.19E-03 9.441452 -5.74773 2.53E-07 -15.1892
35 1.48E+04 4.26E-03 9.602382 -5.45849 2.88E-07 -15.0609
36 1.48E+04 4.26E-03 9.602382 -5.45849 2.88E-07 -15.0609
37 1.97E+06 5.55E-02 14.49354 -2.89137 2.82E-08 -17.3849
38 8.70E+02 2.01E-04 6.768493 -8.51221 2.31E-07 -15.2807
39 1.41E+03 4.81E-04 7.251345 -7.63964 3.41E-07 -14.891
40 8.51E+03 3.32E-04 9.048997 -8.01038 3.9E-08 -17.0594
41 1.04E+03 2.80E-04 6.946976 -8.18072 2.69E-07 -15.1277
42 1.55E+03 3.24E-04 7.34601 -8.03477 2.09E-07 -15.3808
43 5.55E+03 4.77E-04 8.621553 -7.64799 8.59E-08 -16.2695
44 1.44E+03 7.40E-02 7.272398 -2.60369 5.14E-05 -9.87609
45 9.25E+02 7.55E-04 6.829794 -7.18879 8.16E-07 -14.0186
Geomean 1.21E-07
* 1 Bequerel (Bq) = 2.7E-11 Curies (Ci)
The plot of the log transformed values (known x’s and known y’s) is depicted in Figure 4-1. The distribution in Figure 4-1 exhibits good linearity, but still maintains a small reduction in slope with increasing key radionuclide (137Cs) concentration. This reduction in slope with increasing 137Cs concentration is likely caused by small differences in how the two radionuclides are released relative to each other from tramp fuel (likely 1:1 after adjusting for fission yield primarily from recoil) and gap release. More cesium is released from the gap than iodine because of differences in elemental chemistry and the volatile precursor to 137Cs, 137Xe. (14) (29)
9923195
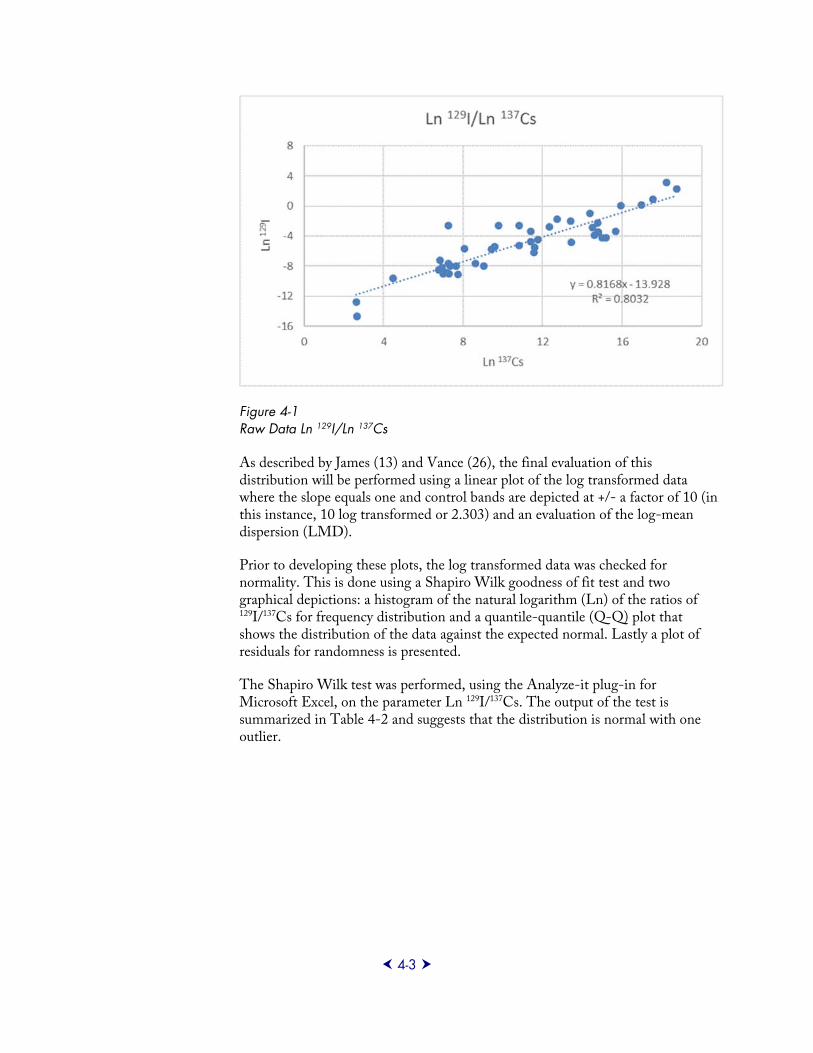
4-3
Figure 4-1 Raw Data Ln 129I/Ln 137Cs
As described by James (13) and Vance (26), the final evaluation of this distribution will be performed using a linear plot of the log transformed data where the slope equals one and control bands are depicted at +/- a factor of 10 (in this instance, 10 log transformed or 2.303) and an evaluation of the log-mean dispersion (LMD).
Prior to developing these plots, the log transformed data was checked for normality. This is done using a Shapiro Wilk goodness of fit test and two graphical depictions: a histogram of the natural logarithm (Ln) of the ratios of 129I/137Cs for frequency distribution and a quantile-quantile (Q-Q) plot that shows the distribution of the data against the expected normal. Lastly a plot of residuals for randomness is presented.
The Shapiro Wilk test was performed, using the Analyze-it plug-in for Microsoft Excel, on the parameter Ln 129I/137Cs. The output of the test is summarized in Table 4-2 and suggests that the distribution is normal with one outlier.
9923195
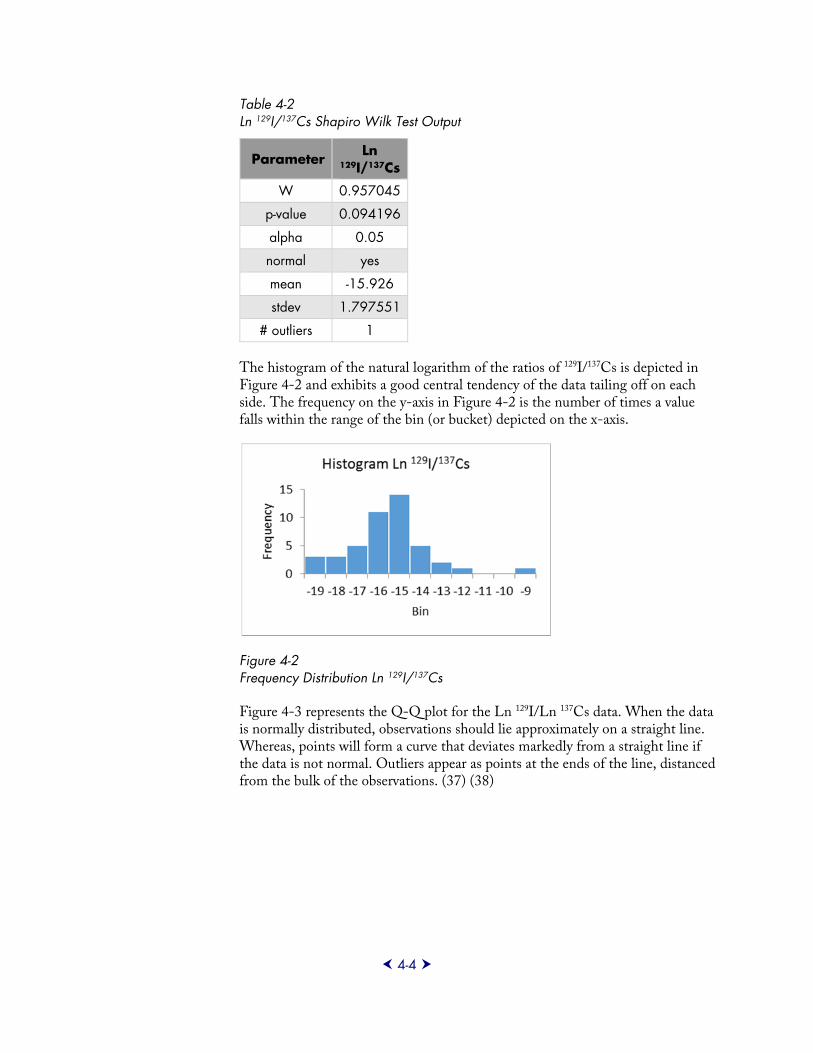
4-4
Table 4-2 Ln 129I/137Cs Shapiro Wilk Test Output
Parameter Ln
129I/137Cs
W 0.957045
p-value 0.094196
alpha 0.05
normal yes
mean -15.926
stdev 1.797551
# outliers 1
The histogram of the natural logarithm of the ratios of 129I/137Cs is depicted in Figure 4-2 and exhibits a good central tendency of the data tailing off on each side. The frequency on the y-axis in Figure 4-2 is the number of times a value falls within the range of the bin (or bucket) depicted on the x-axis.
Figure 4-2 Frequency Distribution Ln 129I/137Cs
Figure 4-3 represents the Q-Q plot for the Ln 129I/Ln 137Cs data. When the data is normally distributed, observations should lie approximately on a straight line. Whereas, points will form a curve that deviates markedly from a straight line if the data is not normal. Outliers appear as points at the ends of the line, distanced from the bulk of the observations. (37) (38)
9923195
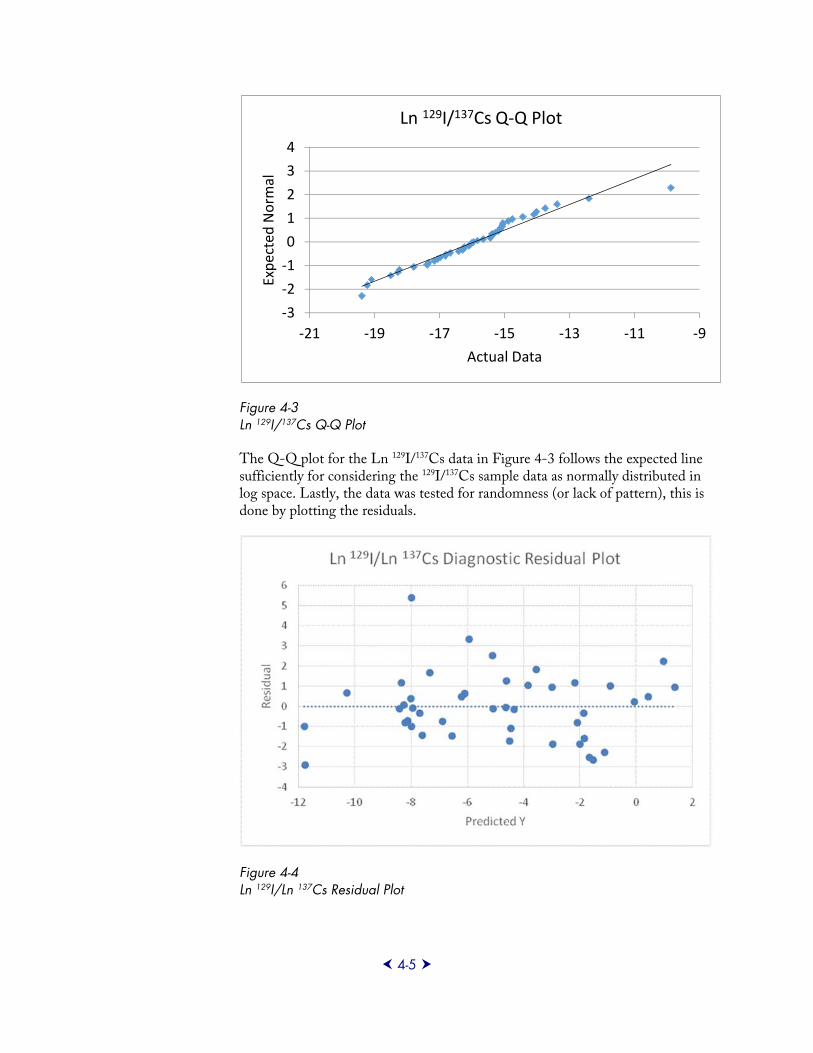
4-5
Figure 4-3 Ln 129I/137Cs Q-Q Plot
The Q-Q plot for the Ln 129I/137Cs data in Figure 4-3 follows the expected line sufficiently for considering the 129I/137Cs sample data as normally distributed in log space. Lastly, the data was tested for randomness (or lack of pattern), this is done by plotting the residuals.
Figure 4-4 Ln 129I/Ln 137Cs Residual Plot
‐3
‐2
‐1
0
1
2
3
4
‐21 ‐19 ‐17 ‐15 ‐13 ‐11 ‐9
Expected Norm
al
Actual Data
Ln 129I/137Cs Q‐Q Plot
9923195
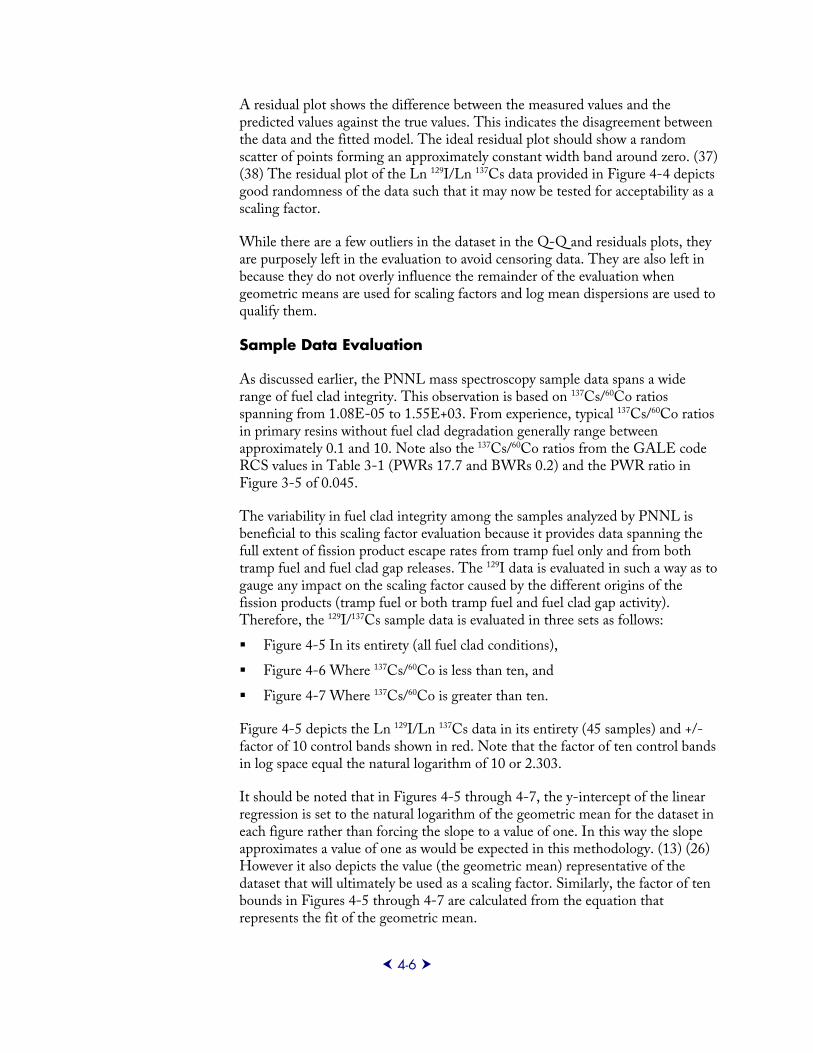
4-6
A residual plot shows the difference between the measured values and the predicted values against the true values. This indicates the disagreement between the data and the fitted model. The ideal residual plot should show a random scatter of points forming an approximately constant width band around zero. (37) (38) The residual plot of the Ln 129I/Ln 137Cs data provided in Figure 4-4 depicts good randomness of the data such that it may now be tested for acceptability as a scaling factor.
While there are a few outliers in the dataset in the Q-Q and residuals plots, they are purposely left in the evaluation to avoid censoring data. They are also left in because they do not overly influence the remainder of the evaluation when geometric means are used for scaling factors and log mean dispersions are used to qualify them.
Sample Data Evaluation
As discussed earlier, the PNNL mass spectroscopy sample data spans a wide range of fuel clad integrity. This observation is based on 137Cs/60Co ratios spanning from 1.08E-05 to 1.55E+03. From experience, typical 137Cs/60Co ratios in primary resins without fuel clad degradation generally range between approximately 0.1 and 10. Note also the 137Cs/60Co ratios from the GALE code RCS values in Table 3-1 (PWRs 17.7 and BWRs 0.2) and the PWR ratio in Figure 3-5 of 0.045.
The variability in fuel clad integrity among the samples analyzed by PNNL is beneficial to this scaling factor evaluation because it provides data spanning the full extent of fission product escape rates from tramp fuel only and from both tramp fuel and fuel clad gap releases. The 129I data is evaluated in such a way as to gauge any impact on the scaling factor caused by the different origins of the fission products (tramp fuel or both tramp fuel and fuel clad gap activity). Therefore, the 129I/137Cs sample data is evaluated in three sets as follows:
Figure 4-5 In its entirety (all fuel clad conditions),
Figure 4-6 Where 137Cs/60Co is less than ten, and
Figure 4-7 Where 137Cs/60Co is greater than ten.
Figure 4-5 depicts the Ln 129I/Ln 137Cs data in its entirety (45 samples) and +/- factor of 10 control bands shown in red. Note that the factor of ten control bands in log space equal the natural logarithm of 10 or 2.303.
It should be noted that in Figures 4-5 through 4-7, the y-intercept of the linear regression is set to the natural logarithm of the geometric mean for the dataset in each figure rather than forcing the slope to a value of one. In this way the slope approximates a value of one as would be expected in this methodology. (13) (26) However it also depicts the value (the geometric mean) representative of the dataset that will ultimately be used as a scaling factor. Similarly, the factor of ten bounds in Figures 4-5 through 4-7 are calculated from the equation that represents the fit of the geometric mean.
9923195
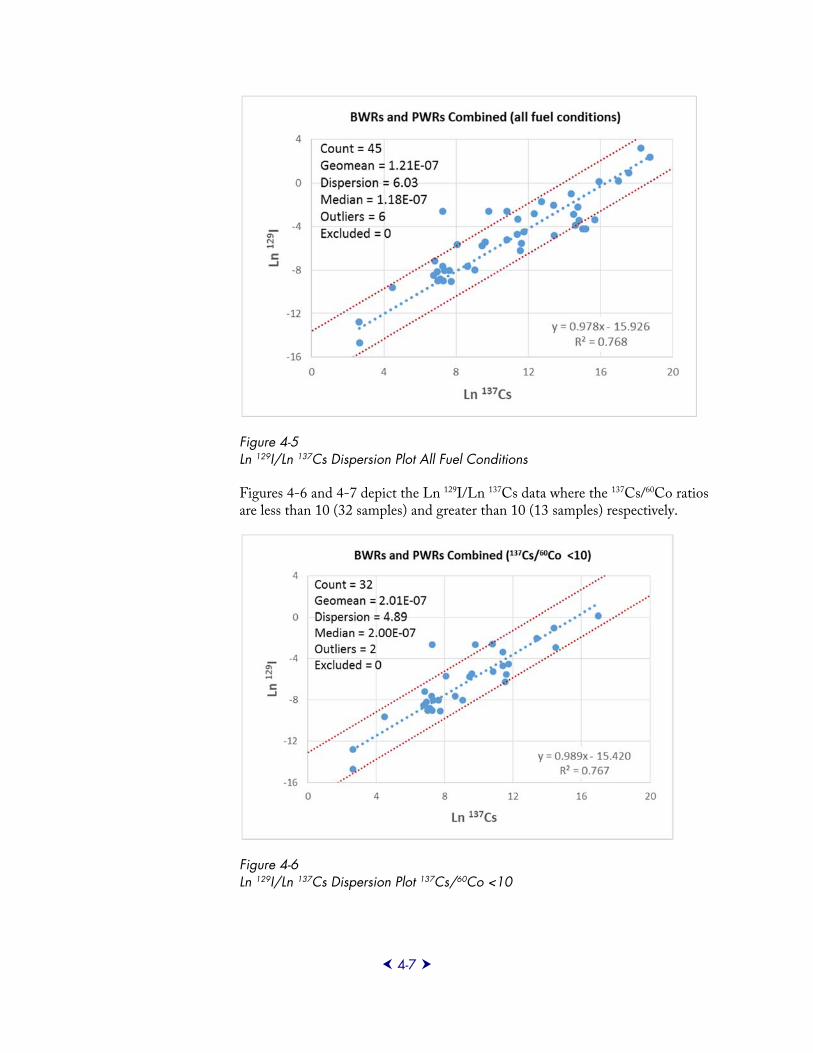
4-7
Figure 4-5 Ln 129I/Ln 137Cs Dispersion Plot All Fuel Conditions
Figures 4-6 and 4-7 depict the Ln 129I/Ln 137Cs data where the 137Cs/60Co ratios are less than 10 (32 samples) and greater than 10 (13 samples) respectively.
Figure 4-6 Ln 129I/Ln 137Cs Dispersion Plot 137Cs/60Co <10
9923195
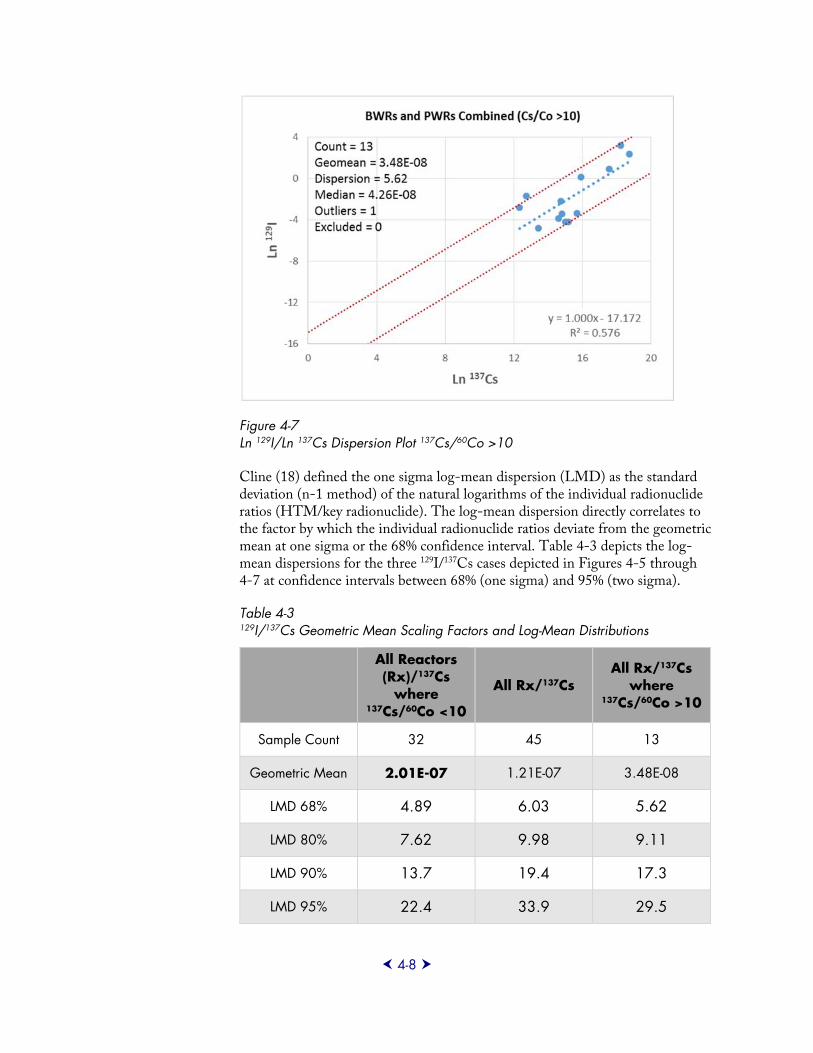
4-8
Figure 4-7 Ln 129I/Ln 137Cs Dispersion Plot 137Cs/60Co >10
Cline (18) defined the one sigma log-mean dispersion (LMD) as the standard deviation (n-1 method) of the natural logarithms of the individual radionuclide ratios (HTM/key radionuclide). The log-mean dispersion directly correlates to the factor by which the individual radionuclide ratios deviate from the geometric mean at one sigma or the 68% confidence interval. Table 4-3 depicts the log-mean dispersions for the three 129I/137Cs cases depicted in Figures 4-5 through 4-7 at confidence intervals between 68% (one sigma) and 95% (two sigma).
Table 4-3 129I/137Cs Geometric Mean Scaling Factors and Log-Mean Distributions
All Reactors (Rx)/137Cs
where 137Cs/60Co <10
All Rx/137Cs All Rx/137Cs
where 137Cs/60Co >10
Sample Count 32 45 13
Geometric Mean 2.01E-07 1.21E-07 3.48E-08
LMD 68% 4.89 6.03 5.62
LMD 80% 7.62 9.98 9.11
LMD 90% 13.7 19.4 17.3
LMD 95% 22.4 33.9 29.5
9923195
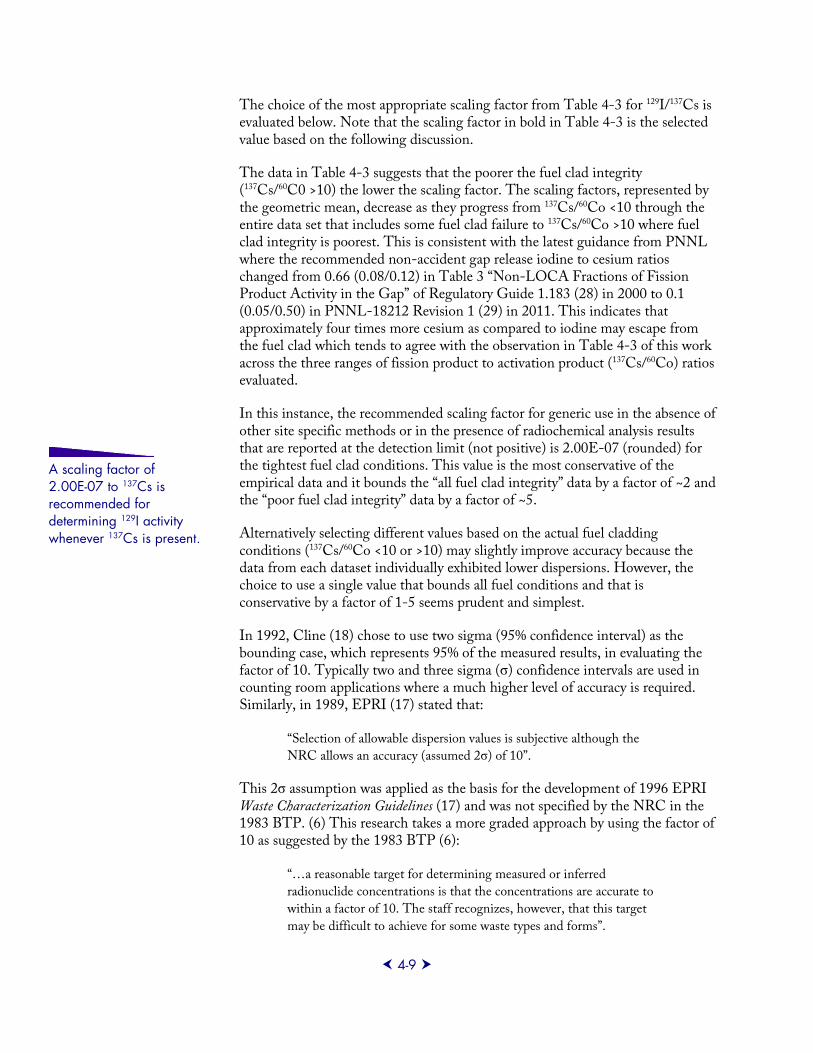
4-9
The choice of the most appropriate scaling factor from Table 4-3 for 129I/137Cs is evaluated below. Note that the scaling factor in bold in Table 4-3 is the selected value based on the following discussion.
The data in Table 4-3 suggests that the poorer the fuel clad integrity (137Cs/60C0 >10) the lower the scaling factor. The scaling factors, represented by the geometric mean, decrease as they progress from 137Cs/60Co <10 through the entire data set that includes some fuel clad failure to 137Cs/60Co >10 where fuel clad integrity is poorest. This is consistent with the latest guidance from PNNL where the recommended non-accident gap release iodine to cesium ratios changed from 0.66 (0.08/0.12) in Table 3 “Non-LOCA Fractions of Fission Product Activity in the Gap” of Regulatory Guide 1.183 (28) in 2000 to 0.1 (0.05/0.50) in PNNL-18212 Revision 1 (29) in 2011. This indicates that approximately four times more cesium as compared to iodine may escape from the fuel clad which tends to agree with the observation in Table 4-3 of this work across the three ranges of fission product to activation product (137Cs/60Co) ratios evaluated.
In this instance, the recommended scaling factor for generic use in the absence of other site specific methods or in the presence of radiochemical analysis results that are reported at the detection limit (not positive) is 2.00E-07 (rounded) for the tightest fuel clad conditions. This value is the most conservative of the empirical data and it bounds the “all fuel clad integrity” data by a factor of ~2 and the “poor fuel clad integrity” data by a factor of ~5.
Alternatively selecting different values based on the actual fuel cladding conditions (137Cs/60Co <10 or >10) may slightly improve accuracy because the data from each dataset individually exhibited lower dispersions. However, the choice to use a single value that bounds all fuel conditions and that is conservative by a factor of 1-5 seems prudent and simplest.
In 1992, Cline (18) chose to use two sigma (95% confidence interval) as the bounding case, which represents 95% of the measured results, in evaluating the factor of 10. Typically two and three sigma (σ) confidence intervals are used in counting room applications where a much higher level of accuracy is required. Similarly, in 1989, EPRI (17) stated that:
“Selection of allowable dispersion values is subjective although the NRC allows an accuracy (assumed 2σ) of 10”.
This 2σ assumption was applied as the basis for the development of 1996 EPRI Waste Characterization Guidelines (17) and was not specified by the NRC in the 1983 BTP. (6) This research takes a more graded approach by using the factor of 10 as suggested by the 1983 BTP (6):
“…a reasonable target for determining measured or inferred radionuclide concentrations is that the concentrations are accurate to within a factor of 10. The staff recognizes, however, that this target may be difficult to achieve for some waste types and forms”.
A scaling factor of 2.00E-07 to 137Cs is recommended for determining 129I activity whenever 137Cs is present.
9923195
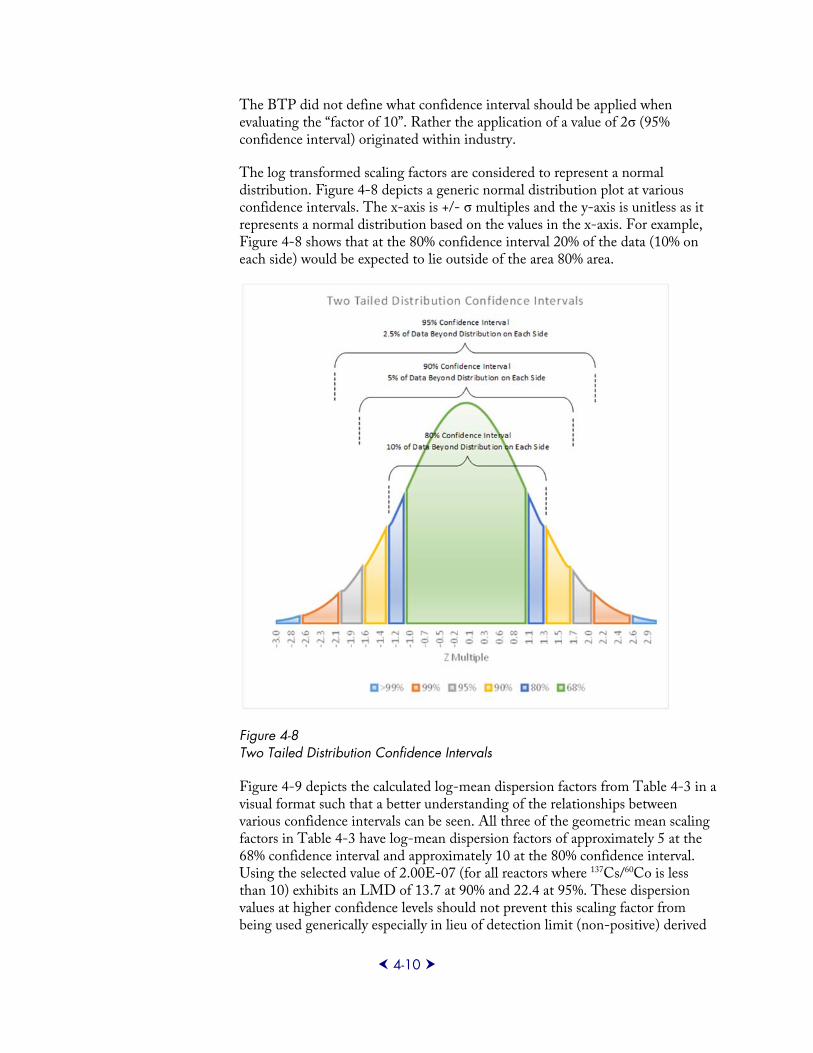
4-10
The BTP did not define what confidence interval should be applied when evaluating the “factor of 10”. Rather the application of a value of 2σ (95% confidence interval) originated within industry.
The log transformed scaling factors are considered to represent a normal distribution. Figure 4-8 depicts a generic normal distribution plot at various confidence intervals. The x-axis is +/- σ multiples and the y-axis is unitless as it represents a normal distribution based on the values in the x-axis. For example, Figure 4-8 shows that at the 80% confidence interval 20% of the data (10% on each side) would be expected to lie outside of the area 80% area.
Figure 4-8 Two Tailed Distribution Confidence Intervals
Figure 4-9 depicts the calculated log-mean dispersion factors from Table 4-3 in a visual format such that a better understanding of the relationships between various confidence intervals can be seen. All three of the geometric mean scaling factors in Table 4-3 have log-mean dispersion factors of approximately 5 at the 68% confidence interval and approximately 10 at the 80% confidence interval. Using the selected value of 2.00E-07 (for all reactors where 137Cs/60Co is less than 10) exhibits an LMD of 13.7 at 90% and 22.4 at 95%. These dispersion values at higher confidence levels should not prevent this scaling factor from being used generically especially in lieu of detection limit (non-positive) derived
9923195
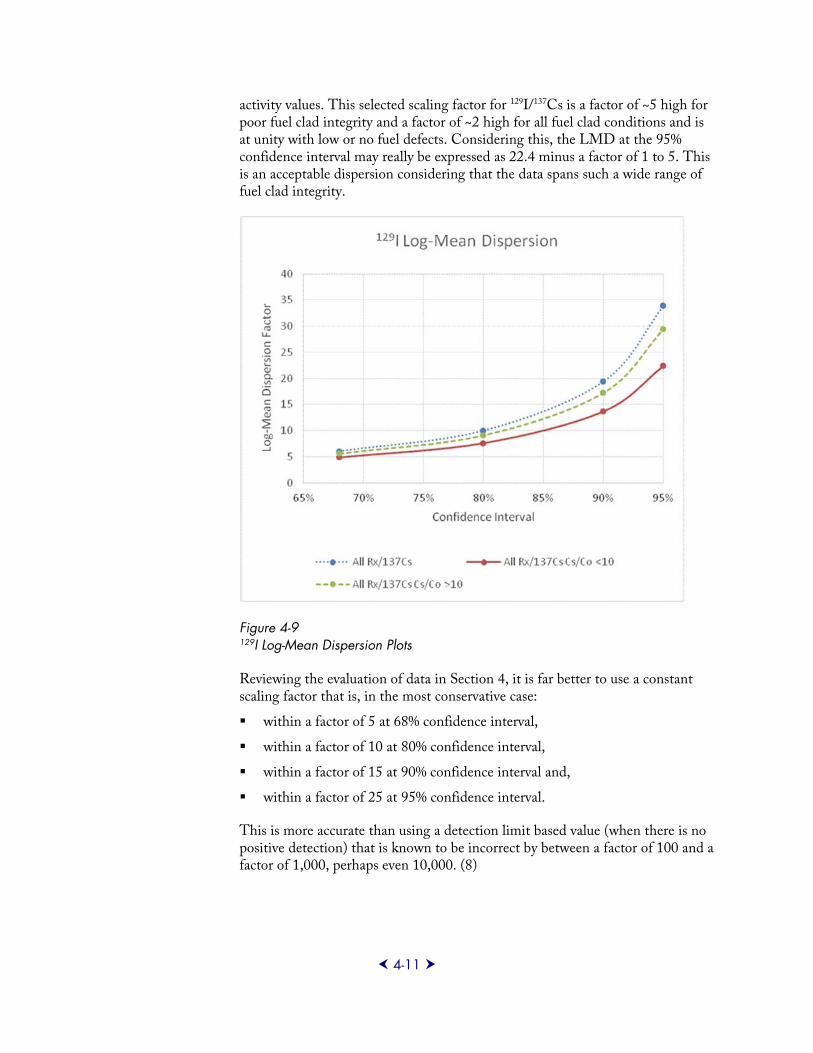
4-11
activity values. This selected scaling factor for 129I/137Cs is a factor of ~5 high for poor fuel clad integrity and a factor of ~2 high for all fuel clad conditions and is at unity with low or no fuel defects. Considering this, the LMD at the 95% confidence interval may really be expressed as 22.4 minus a factor of 1 to 5. This is an acceptable dispersion considering that the data spans such a wide range of fuel clad integrity.
Figure 4-9 129I Log-Mean Dispersion Plots
Reviewing the evaluation of data in Section 4, it is far better to use a constant scaling factor that is, in the most conservative case:
within a factor of 5 at 68% confidence interval,
within a factor of 10 at 80% confidence interval,
within a factor of 15 at 90% confidence interval and,
within a factor of 25 at 95% confidence interval.
This is more accurate than using a detection limit based value (when there is no positive detection) that is known to be incorrect by between a factor of 100 and a factor of 1,000, perhaps even 10,000. (8)
9923195
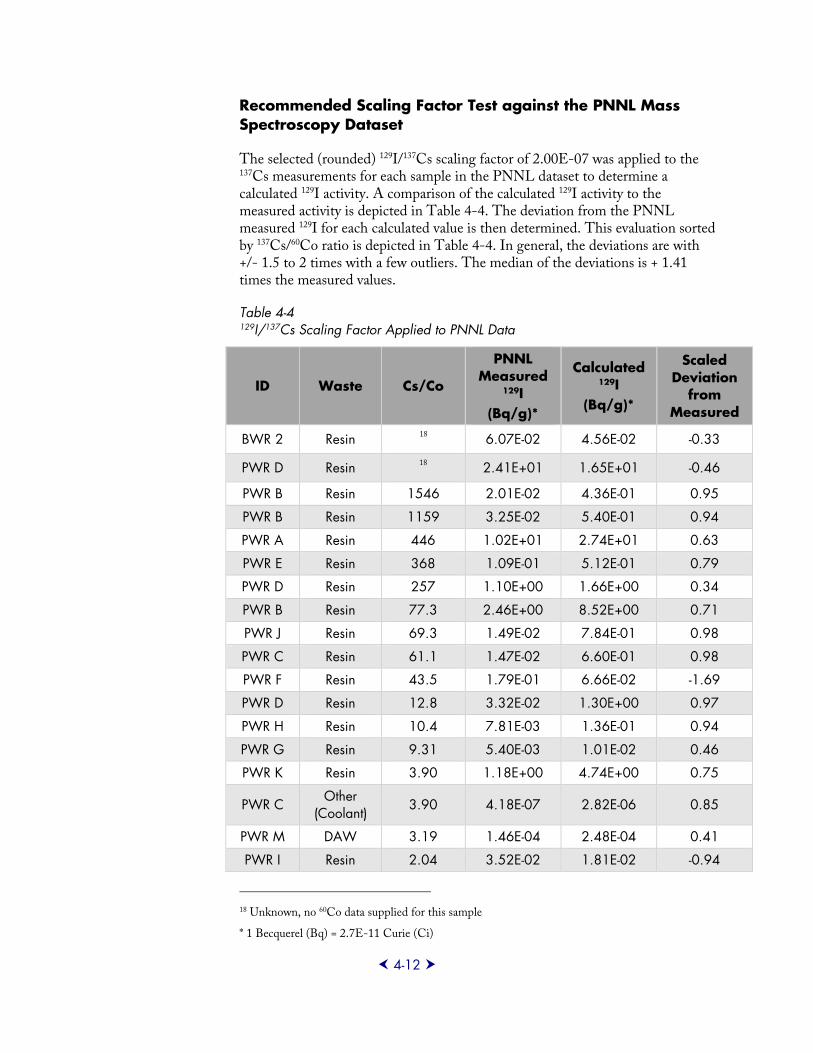
4-12
Recommended Scaling Factor Test against the PNNL Mass Spectroscopy Dataset
The selected (rounded) 129I/137Cs scaling factor of 2.00E-07 was applied to the 137Cs measurements for each sample in the PNNL dataset to determine a calculated 129I activity. A comparison of the calculated 129I activity to the measured activity is depicted in Table 4-4. The deviation from the PNNL measured 129I for each calculated value is then determined. This evaluation sorted by 137Cs/60Co ratio is depicted in Table 4-4. In general, the deviations are with +/- 1.5 to 2 times with a few outliers. The median of the deviations is + 1.41 times the measured values.
Table 4-4 129I/137Cs Scaling Factor Applied to PNNL Data
ID Waste Cs/Co
PNNL Measured
129I (Bq/g)*
Calculated 129I
(Bq/g)*
Scaled Deviation
from Measured
BWR 2 Resin 18 6.07E-02 4.56E-02 -0.33
PWR D Resin 18 2.41E+01 1.65E+01 -0.46
PWR B Resin 1546 2.01E-02 4.36E-01 0.95
PWR B Resin 1159 3.25E-02 5.40E-01 0.94
PWR A Resin 446 1.02E+01 2.74E+01 0.63
PWR E Resin 368 1.09E-01 5.12E-01 0.79
PWR D Resin 257 1.10E+00 1.66E+00 0.34
PWR B Resin 77.3 2.46E+00 8.52E+00 0.71
PWR J Resin 69.3 1.49E-02 7.84E-01 0.98
PWR C Resin 61.1 1.47E-02 6.60E-01 0.98
PWR F Resin 43.5 1.79E-01 6.66E-02 -1.69
PWR D Resin 12.8 3.32E-02 1.30E+00 0.97
PWR H Resin 10.4 7.81E-03 1.36E-01 0.94
PWR G Resin 9.31 5.40E-03 1.01E-02 0.46
PWR K Resin 3.90 1.18E+00 4.74E+00 0.75
PWR C Other
(Coolant) 3.90 4.18E-07 2.82E-06 0.85
PWR M DAW 3.19 1.46E-04 2.48E-04 0.41
PWR I Resin 2.04 3.52E-02 1.81E-02 -0.94
18 Unknown, no 60Co data supplied for this sample
* 1 Becquerel (Bq) = 2.7E-11 Curie (Ci)
9923195
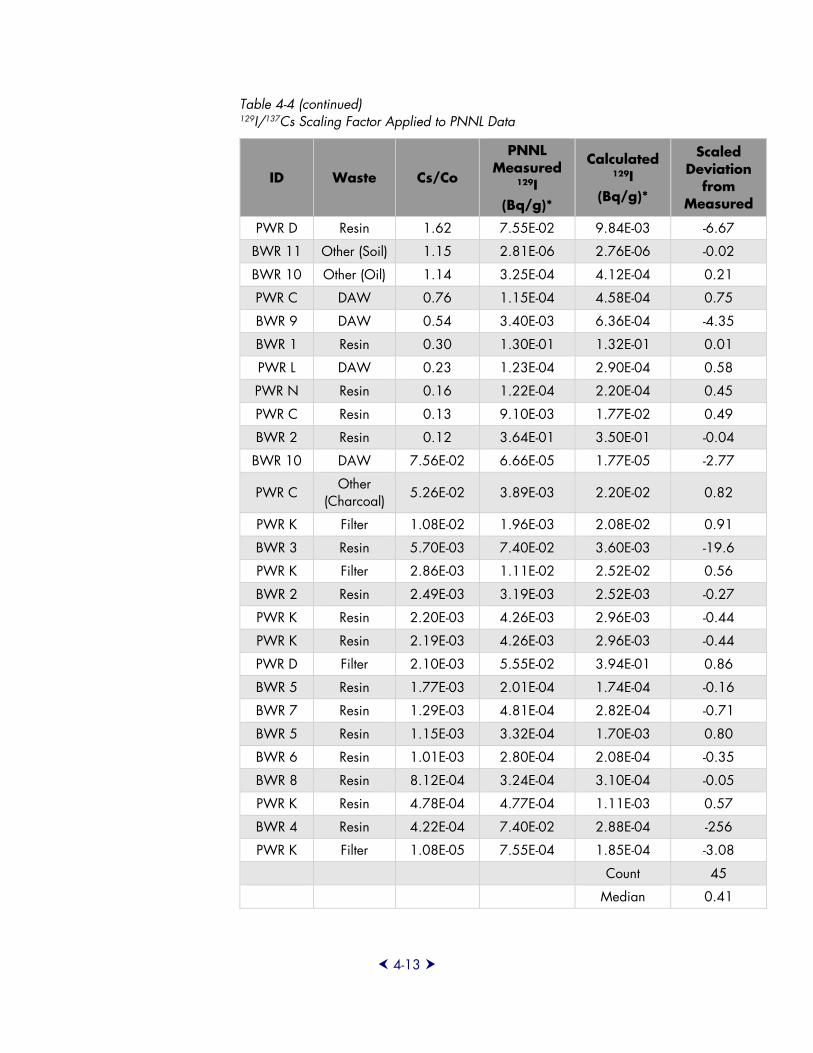
4-13
Table 4-4 (continued) 129I/137Cs Scaling Factor Applied to PNNL Data
ID Waste Cs/Co
PNNL Measured
129I (Bq/g)*
Calculated 129I
(Bq/g)*
Scaled Deviation
from Measured
PWR D Resin 1.62 7.55E-02 9.84E-03 -6.67
BWR 11 Other (Soil) 1.15 2.81E-06 2.76E-06 -0.02
BWR 10 Other (Oil) 1.14 3.25E-04 4.12E-04 0.21
PWR C DAW 0.76 1.15E-04 4.58E-04 0.75
BWR 9 DAW 0.54 3.40E-03 6.36E-04 -4.35
BWR 1 Resin 0.30 1.30E-01 1.32E-01 0.01
PWR L DAW 0.23 1.23E-04 2.90E-04 0.58
PWR N Resin 0.16 1.22E-04 2.20E-04 0.45
PWR C Resin 0.13 9.10E-03 1.77E-02 0.49
BWR 2 Resin 0.12 3.64E-01 3.50E-01 -0.04
BWR 10 DAW 7.56E-02 6.66E-05 1.77E-05 -2.77
PWR C Other
(Charcoal) 5.26E-02 3.89E-03 2.20E-02 0.82
PWR K Filter 1.08E-02 1.96E-03 2.08E-02 0.91
BWR 3 Resin 5.70E-03 7.40E-02 3.60E-03 -19.6
PWR K Filter 2.86E-03 1.11E-02 2.52E-02 0.56
BWR 2 Resin 2.49E-03 3.19E-03 2.52E-03 -0.27
PWR K Resin 2.20E-03 4.26E-03 2.96E-03 -0.44
PWR K Resin 2.19E-03 4.26E-03 2.96E-03 -0.44
PWR D Filter 2.10E-03 5.55E-02 3.94E-01 0.86
BWR 5 Resin 1.77E-03 2.01E-04 1.74E-04 -0.16
BWR 7 Resin 1.29E-03 4.81E-04 2.82E-04 -0.71
BWR 5 Resin 1.15E-03 3.32E-04 1.70E-03 0.80
BWR 6 Resin 1.01E-03 2.80E-04 2.08E-04 -0.35
BWR 8 Resin 8.12E-04 3.24E-04 3.10E-04 -0.05
PWR K Resin 4.78E-04 4.77E-04 1.11E-03 0.57
BWR 4 Resin 4.22E-04 7.40E-02 2.88E-04 -256
PWR K Filter 1.08E-05 7.55E-04 1.85E-04 -3.08
Count 45
Median 0.41
9923195
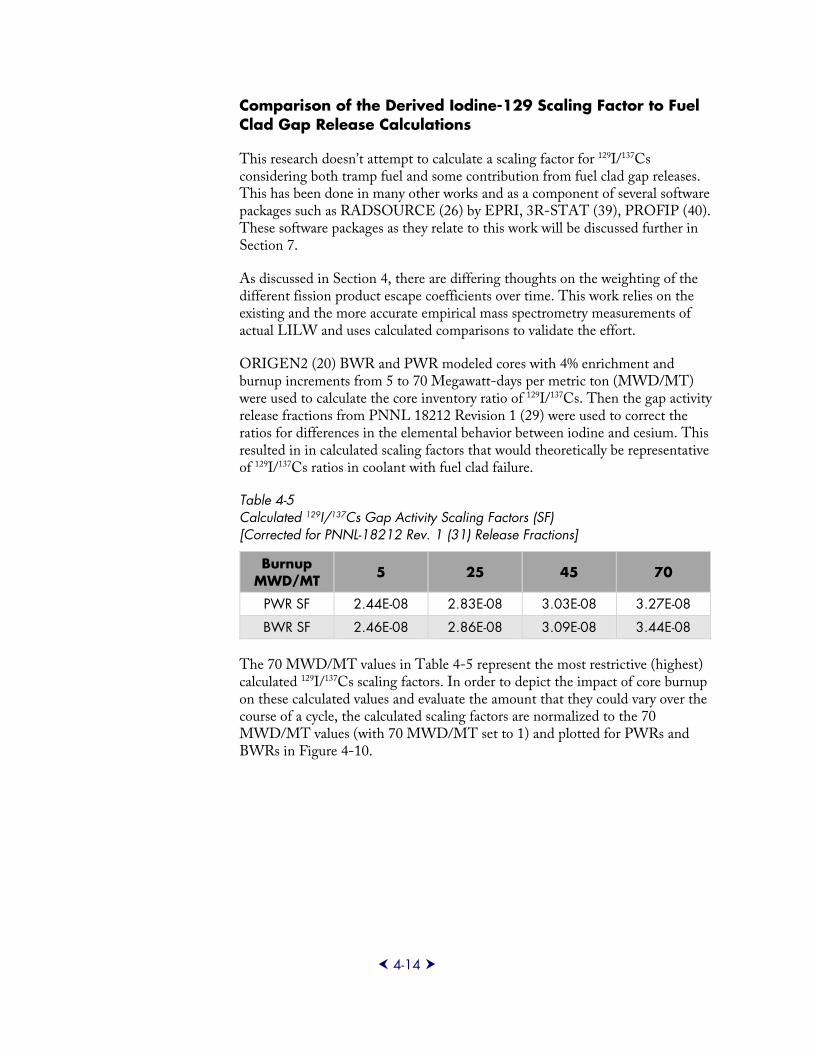
4-14
Comparison of the Derived Iodine-129 Scaling Factor to Fuel Clad Gap Release Calculations
This research doesn’t attempt to calculate a scaling factor for 129I/137Cs considering both tramp fuel and some contribution from fuel clad gap releases. This has been done in many other works and as a component of several software packages such as RADSOURCE (26) by EPRI, 3R-STAT (39), PROFIP (40). These software packages as they relate to this work will be discussed further in Section 7.
As discussed in Section 4, there are differing thoughts on the weighting of the different fission product escape coefficients over time. This work relies on the existing and the more accurate empirical mass spectrometry measurements of actual LILW and uses calculated comparisons to validate the effort.
ORIGEN2 (20) BWR and PWR modeled cores with 4% enrichment and burnup increments from 5 to 70 Megawatt-days per metric ton (MWD/MT) were used to calculate the core inventory ratio of 129I/137Cs. Then the gap activity release fractions from PNNL 18212 Revision 1 (29) were used to correct the ratios for differences in the elemental behavior between iodine and cesium. This resulted in in calculated scaling factors that would theoretically be representative of 129I/137Cs ratios in coolant with fuel clad failure.
Table 4-5 Calculated 129I/137Cs Gap Activity Scaling Factors (SF) [Corrected for PNNL-18212 Rev. 1 (31) Release Fractions]
Burnup MWD/MT
5 25 45 70
PWR SF 2.44E-08 2.83E-08 3.03E-08 3.27E-08
BWR SF 2.46E-08 2.86E-08 3.09E-08 3.44E-08
The 70 MWD/MT values in Table 4-5 represent the most restrictive (highest) calculated 129I/137Cs scaling factors. In order to depict the impact of core burnup on these calculated values and evaluate the amount that they could vary over the course of a cycle, the calculated scaling factors are normalized to the 70 MWD/MT values (with 70 MWD/MT set to 1) and plotted for PWRs and BWRs in Figure 4-10.
9923195
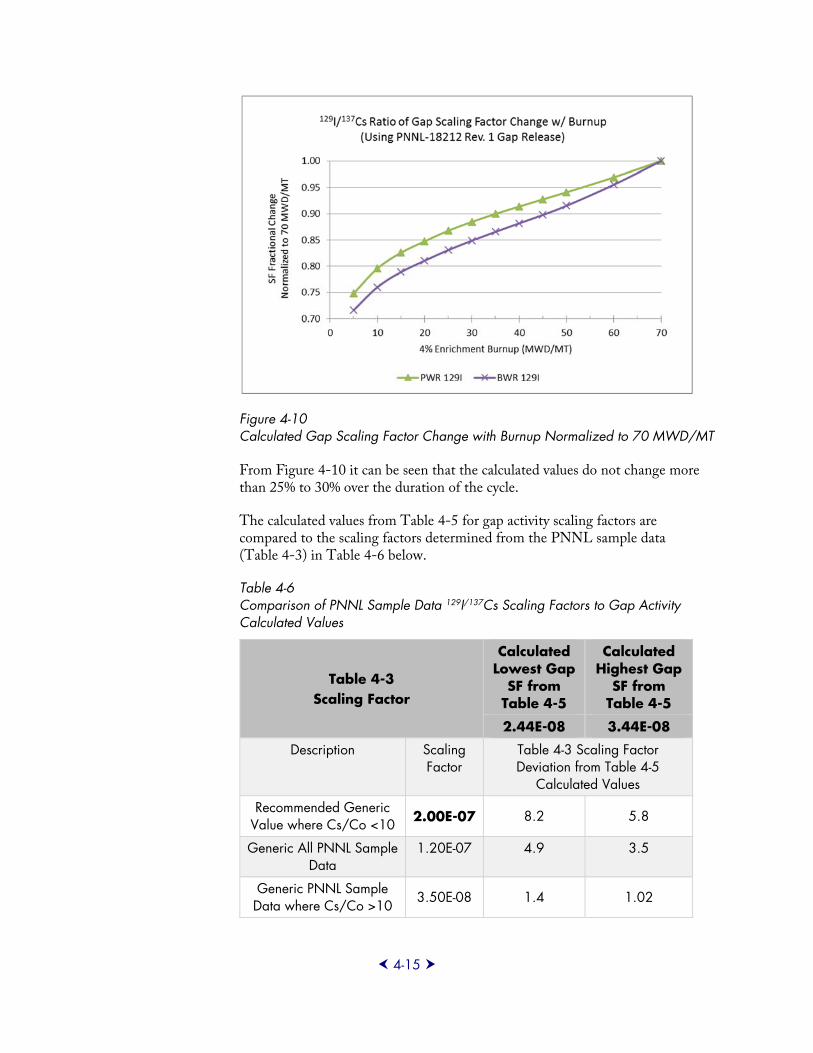
4-15
Figure 4-10 Calculated Gap Scaling Factor Change with Burnup Normalized to 70 MWD/MT
From Figure 4-10 it can be seen that the calculated values do not change more than 25% to 30% over the duration of the cycle.
The calculated values from Table 4-5 for gap activity scaling factors are compared to the scaling factors determined from the PNNL sample data (Table 4-3) in Table 4-6 below.
Table 4-6 Comparison of PNNL Sample Data 129I/137Cs Scaling Factors to Gap Activity Calculated Values
Table 4-3 Scaling Factor
Calculated Lowest Gap
SF from Table 4-5
Calculated Highest Gap
SF from Table 4-5
2.44E-08 3.44E-08
Description Scaling Factor
Table 4-3 Scaling Factor Deviation from Table 4-5
Calculated Values
Recommended Generic Value where Cs/Co <10 2.00E-07 8.2 5.8
Generic All PNNL Sample Data
1.20E-07 4.9 3.5
Generic PNNL Sample Data where Cs/Co >10 3.50E-08 1.4 1.02
9923195
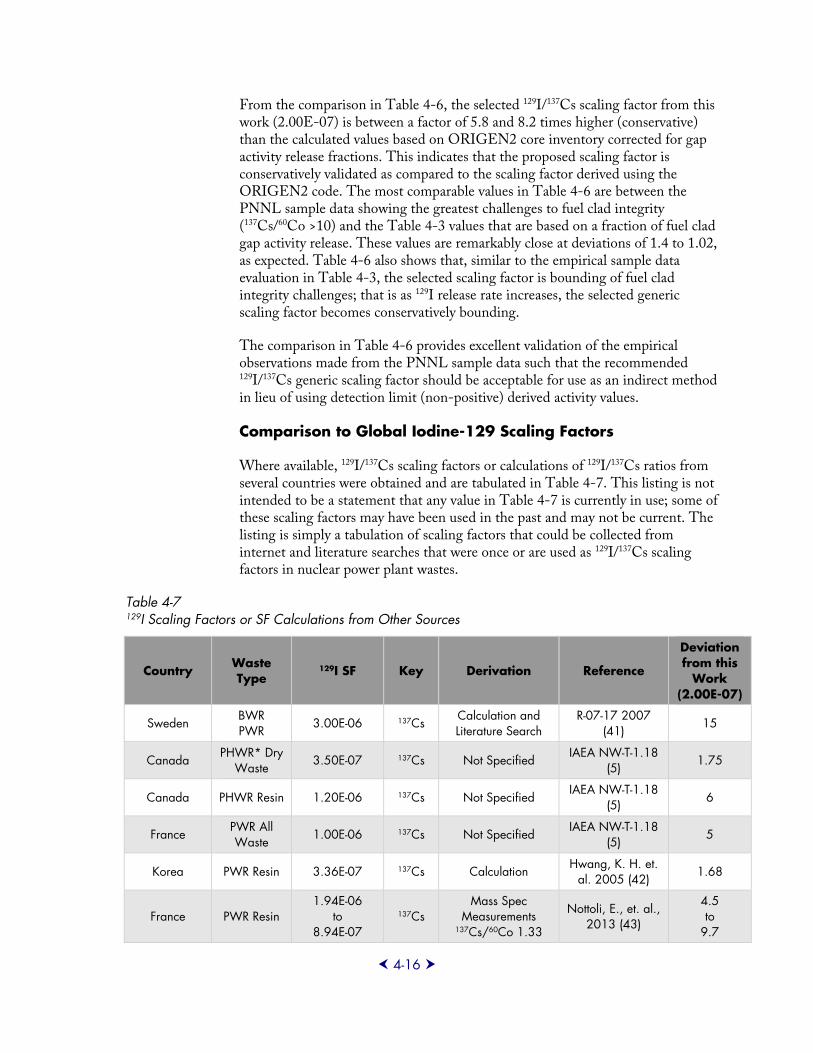
4-16
From the comparison in Table 4-6, the selected 129I/137Cs scaling factor from this work (2.00E-07) is between a factor of 5.8 and 8.2 times higher (conservative) than the calculated values based on ORIGEN2 core inventory corrected for gap activity release fractions. This indicates that the proposed scaling factor is conservatively validated as compared to the scaling factor derived using the ORIGEN2 code. The most comparable values in Table 4-6 are between the PNNL sample data showing the greatest challenges to fuel clad integrity (137Cs/60Co >10) and the Table 4-3 values that are based on a fraction of fuel clad gap activity release. These values are remarkably close at deviations of 1.4 to 1.02, as expected. Table 4-6 also shows that, similar to the empirical sample data evaluation in Table 4-3, the selected scaling factor is bounding of fuel clad integrity challenges; that is as 129I release rate increases, the selected generic scaling factor becomes conservatively bounding.
The comparison in Table 4-6 provides excellent validation of the empirical observations made from the PNNL sample data such that the recommended 129I/137Cs generic scaling factor should be acceptable for use as an indirect method in lieu of using detection limit (non-positive) derived activity values.
Comparison to Global Iodine-129 Scaling Factors
Where available, 129I/137Cs scaling factors or calculations of 129I/137Cs ratios from several countries were obtained and are tabulated in Table 4-7. This listing is not intended to be a statement that any value in Table 4-7 is currently in use; some of these scaling factors may have been used in the past and may not be current. The listing is simply a tabulation of scaling factors that could be collected from internet and literature searches that were once or are used as 129I/137Cs scaling factors in nuclear power plant wastes.
Table 4-7 129I Scaling Factors or SF Calculations from Other Sources
Country Waste Type
129I SF Key Derivation Reference
Deviation from this
Work (2.00E-07)
Sweden BWR PWR
3.00E-06 137Cs Calculation and Literature Search
R-07-17 2007 (41)
15
Canada PHWR* Dry Waste
3.50E-07 137Cs Not Specified IAEA NW-T-1.18 (5)
1.75
Canada PHWR Resin 1.20E-06 137Cs Not Specified IAEA NW-T-1.18
(5) 6
France PWR All Waste
1.00E-06 137Cs Not Specified IAEA NW-T-1.18 (5)
5
Korea PWR Resin 3.36E-07 137Cs Calculation Hwang, K. H. et. al. 2005 (42)
1.68
France PWR Resin 1.94E-06
to 8.94E-07
137Cs Mass Spec
Measurements 137Cs/60Co 1.33
Nottoli, E., et. al., 2013 (43)
4.5 to
9.7
9923195
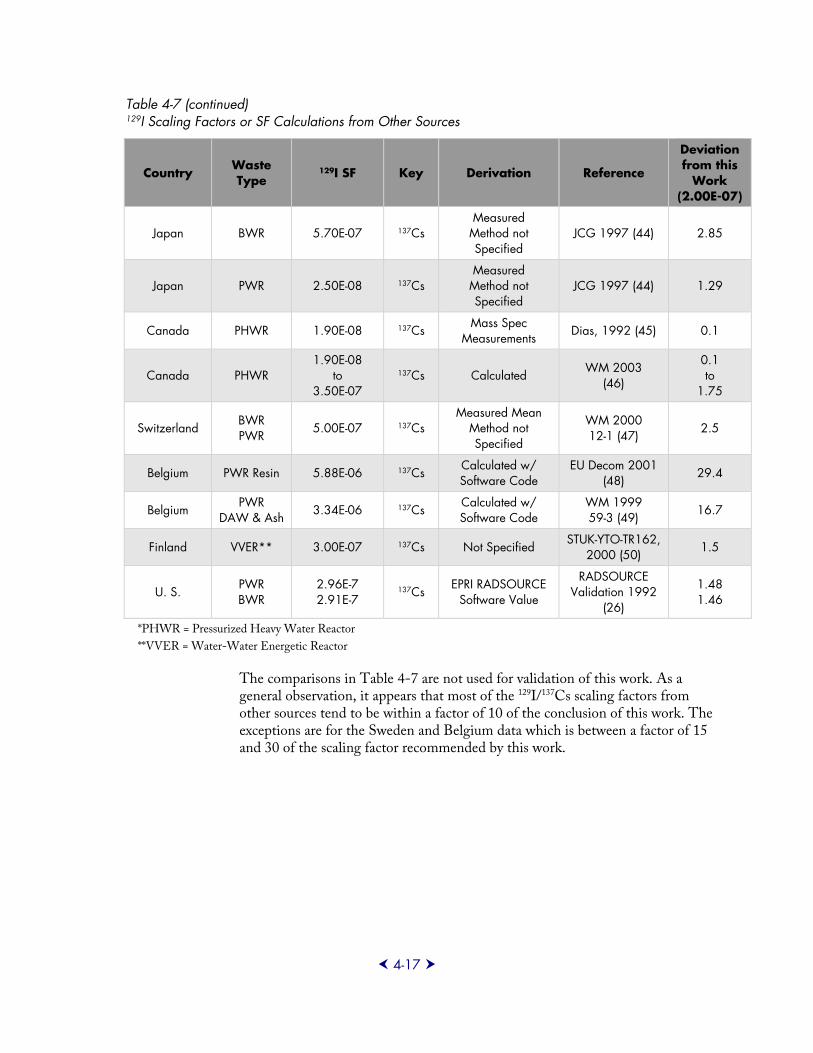
4-17
Table 4-7 (continued) 129I Scaling Factors or SF Calculations from Other Sources
Country Waste Type
129I SF Key Derivation Reference
Deviation from this
Work (2.00E-07)
Japan BWR 5.70E-07 137Cs Measured Method not Specified
JCG 1997 (44) 2.85
Japan PWR 2.50E-08 137Cs Measured Method not Specified
JCG 1997 (44) 1.29
Canada PHWR 1.90E-08 137Cs Mass Spec Measurements
Dias, 1992 (45) 0.1
Canada PHWR 1.90E-08
to 3.50E-07
137Cs Calculated WM 2003 (46)
0.1 to
1.75
Switzerland BWR PWR
5.00E-07 137Cs Measured Mean
Method not Specified
WM 2000 12-1 (47)
2.5
Belgium PWR Resin 5.88E-06 137Cs Calculated w/ Software Code
EU Decom 2001 (48)
29.4
Belgium PWR
DAW & Ash 3.34E-06 137Cs Calculated w/ Software Code
WM 1999 59-3 (49) 16.7
Finland VVER** 3.00E-07 137Cs Not Specified STUK-YTO-TR162, 2000 (50)
1.5
U. S. PWR BWR
2.96E-7 2.91E-7
137Cs EPRI RADSOURCE Software Value
RADSOURCE Validation 1992
(26)
1.48 1.46
*PHWR = Pressurized Heavy Water Reactor
**VVER = Water-Water Energetic Reactor
The comparisons in Table 4-7 are not used for validation of this work. As a general observation, it appears that most of the 129I/137Cs scaling factors from other sources tend to be within a factor of 10 of the conclusion of this work. The exceptions are for the Sweden and Belgium data which is between a factor of 15 and 30 of the scaling factor recommended by this work.
9923195

9923195
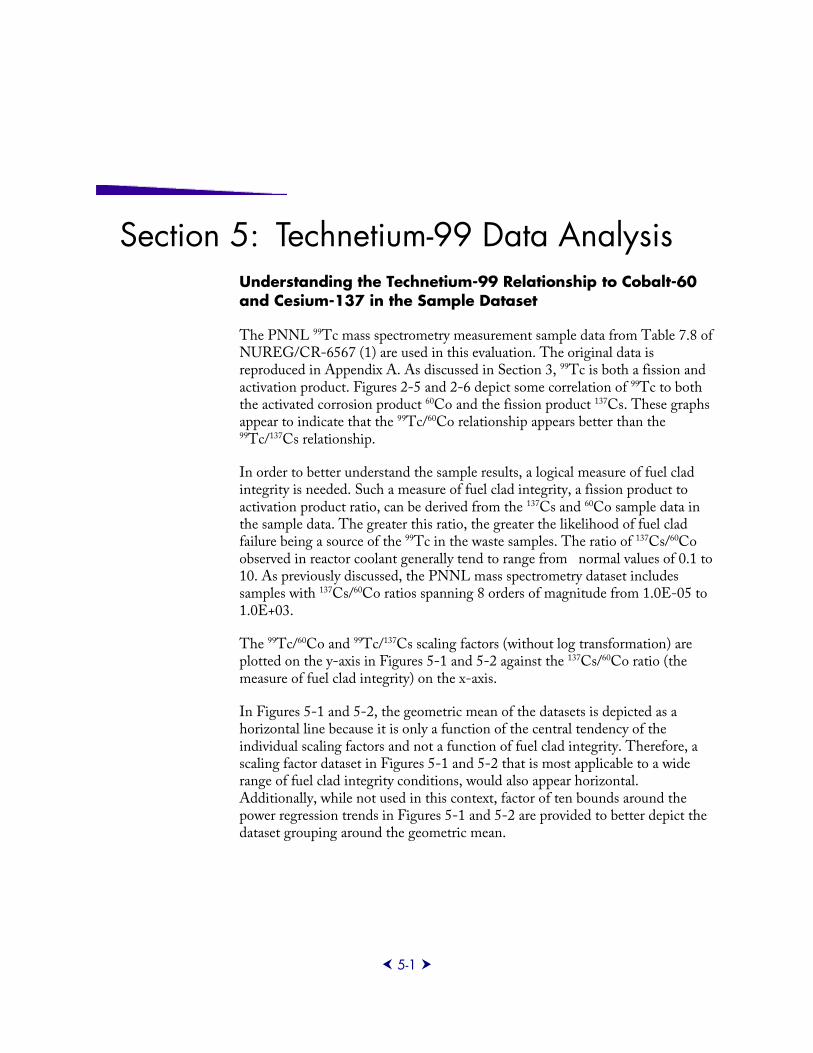
5-1
Section 5: Technetium-99 Data Analysis Understanding the Technetium-99 Relationship to Cobalt-60 and Cesium-137 in the Sample Dataset
The PNNL 99Tc mass spectrometry measurement sample data from Table 7.8 of NUREG/CR-6567 (1) are used in this evaluation. The original data is reproduced in Appendix A. As discussed in Section 3, 99Tc is both a fission and activation product. Figures 2-5 and 2-6 depict some correlation of 99Tc to both the activated corrosion product 60Co and the fission product 137Cs. These graphs appear to indicate that the 99Tc/60Co relationship appears better than the 99Tc/137Cs relationship.
In order to better understand the sample results, a logical measure of fuel clad integrity is needed. Such a measure of fuel clad integrity, a fission product to activation product ratio, can be derived from the 137Cs and 60Co sample data in the sample data. The greater this ratio, the greater the likelihood of fuel clad failure being a source of the 99Tc in the waste samples. The ratio of 137Cs/60Co observed in reactor coolant generally tend to range from normal values of 0.1 to 10. As previously discussed, the PNNL mass spectrometry dataset includes samples with 137Cs/60Co ratios spanning 8 orders of magnitude from 1.0E-05 to 1.0E+03.
The 99Tc/60Co and 99Tc/137Cs scaling factors (without log transformation) are plotted on the y-axis in Figures 5-1 and 5-2 against the 137Cs/60Co ratio (the measure of fuel clad integrity) on the x-axis.
In Figures 5-1 and 5-2, the geometric mean of the datasets is depicted as a horizontal line because it is only a function of the central tendency of the individual scaling factors and not a function of fuel clad integrity. Therefore, a scaling factor dataset in Figures 5-1 and 5-2 that is most applicable to a wide range of fuel clad integrity conditions, would also appear horizontal. Additionally, while not used in this context, factor of ten bounds around the power regression trends in Figures 5-1 and 5-2 are provided to better depict the dataset grouping around the geometric mean.
9923195
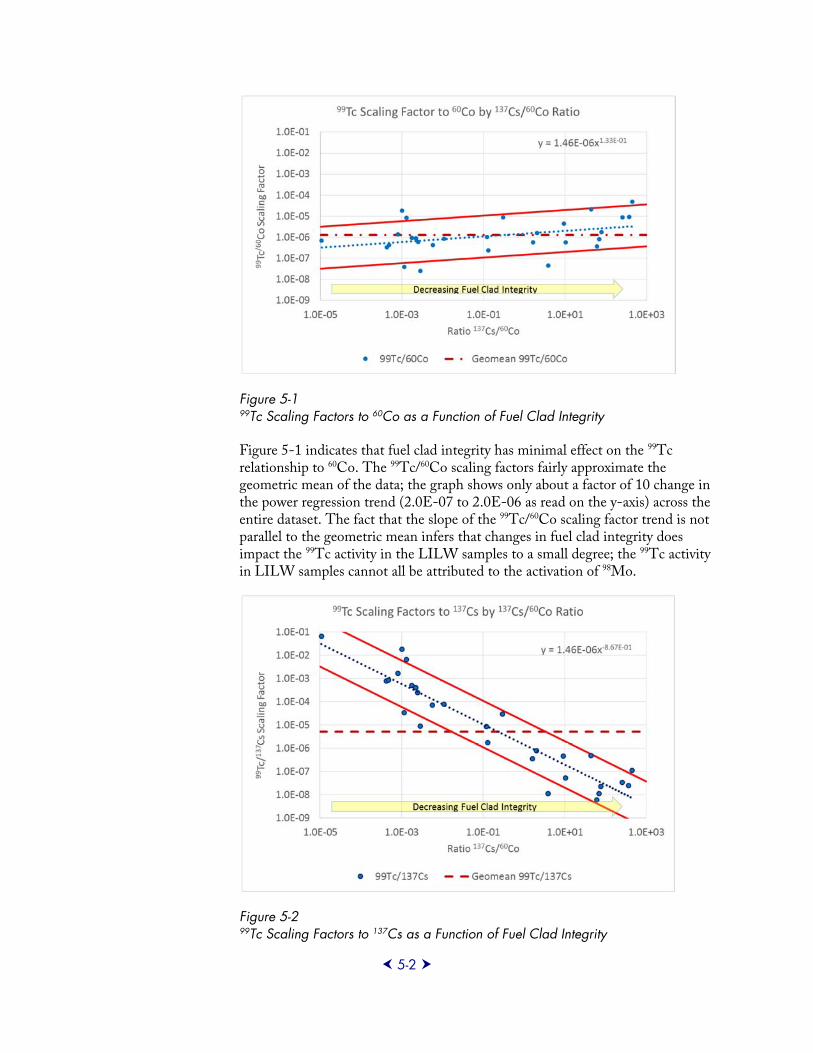
5-2
Figure 5-1 99Tc Scaling Factors to 60Co as a Function of Fuel Clad Integrity
Figure 5-1 indicates that fuel clad integrity has minimal effect on the 99Tc relationship to 60Co. The 99Tc/60Co scaling factors fairly approximate the geometric mean of the data; the graph shows only about a factor of 10 change in the power regression trend (2.0E-07 to 2.0E-06 as read on the y-axis) across the entire dataset. The fact that the slope of the 99Tc/60Co scaling factor trend is not parallel to the geometric mean infers that changes in fuel clad integrity does impact the 99Tc activity in the LILW samples to a small degree; the 99Tc activity in LILW samples cannot all be attributed to the activation of 98Mo.
Figure 5-2 99Tc Scaling Factors to 137Cs as a Function of Fuel Clad Integrity
9923195
5-3
Figure 5-2 indicates that changes in fuel clad integrity has a large effect on the 99Tc relationship to 137Cs. The 99Tc/137Cs scaling factors do not approximate the geometric mean of the data. Rather, there is about seven orders of magnitude change in the power regression trend as indicated on the y-axis. This data also implies that changes in fuel clad integrity impact to the 99Tc and it cannot all be attributed to the activation of 98Mo. However, it is also clear from Figure 5-2 that the geometric mean of the scaling factors is not representative of the behavior of the data. Using the geometric mean as a scaling factor would overestimate the 99Tc concentration in most wastes where the 137Cs/60Co ratio is less than 10 and underestimate the 99Tc concentration when fuel clad integrity challenges are greatest. Both of these situations would be undesirable.
In order to evaluate the significance of the fuel contribution to the 99Tc in the sample data, the power regression trendline equations in Figure 5-1 and 5-2 are used to calculate 99Tc/60Co and 99Tc/137Cs ratios for each 137Cs/60Co data point. Then the relationships between the 99Tc/60Co and 99Tc/137Cs ratios are weighted to the sum of the 99Tc/137Cs ratios to produce Figure 5-3. Figure 5-3 depicts the weighted significance of 99Tc/137Cs relationship compared to the 99Tc/60Co relationship where the summed significance on the y-axis would be equal to one and the 137Cs/60Co ratio is shown on the x-axis.
Figure 5-3 Weighted Impact of Fuel Clad Integrity on 99Tc/60Co Scaling Factor
Figure 5-3 indicates that fuel clad integrity and any 99Tc originating from tramp fuel has little impact on the 99Tc/60Co scaling factor until the 137Cs/60Co ratio in the sample data exceeds 10. To further support this data evaluation, if the dominant source of 99Tc was fission, it should logically follow the fission product 129I in the sample data over varying fuel clad integrity conditions. Similar to Figures 5-1 and 5-2, the ratio of 99Tc/129I is plotted in Figure 5-4 over the ratio of 137Cs/60Co; the ratio of 137Cs/60Co is again being used as an indicator of fuel clad integrity.
99Tc from fission does not begin to factor significantly (>1% of the total) into 99Tc in waste until 137Cs/60Co ratios in the waste approach 100
9923195
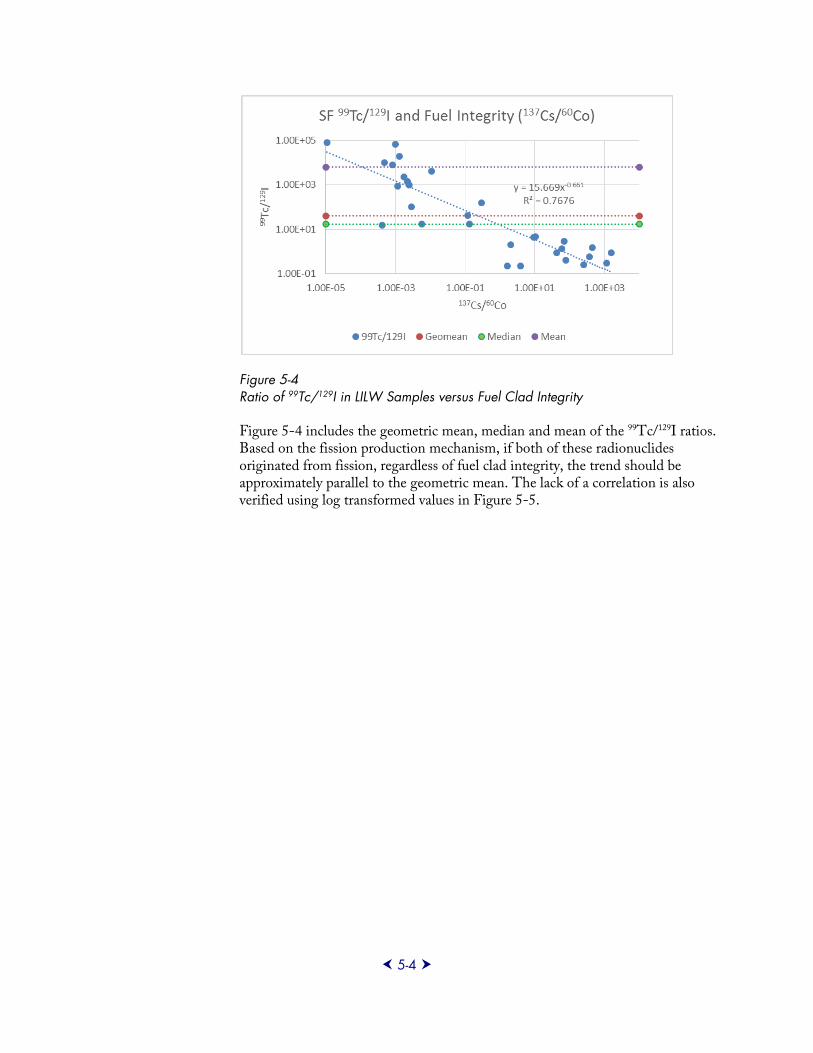
5-4
Figure 5-4 Ratio of 99Tc/129I in LILW Samples versus Fuel Clad Integrity
Figure 5-4 includes the geometric mean, median and mean of the 99Tc/129I ratios. Based on the fission production mechanism, if both of these radionuclides originated from fission, regardless of fuel clad integrity, the trend should be approximately parallel to the geometric mean. The lack of a correlation is also verified using log transformed values in Figure 5-5.
9923195
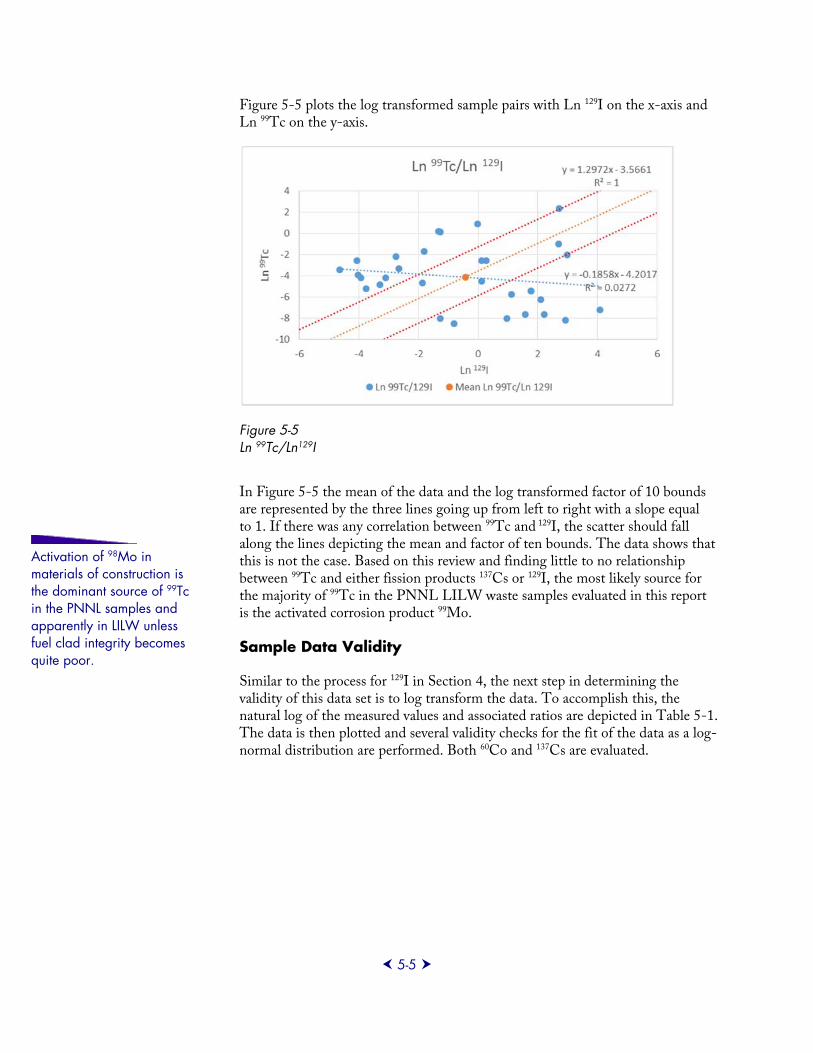
5-5
Figure 5-5 plots the log transformed sample pairs with Ln 129I on the x-axis and Ln 99Tc on the y-axis.
Figure 5-5 Ln 99Tc/Ln129I
In Figure 5-5 the mean of the data and the log transformed factor of 10 bounds are represented by the three lines going up from left to right with a slope equal to 1. If there was any correlation between 99Tc and 129I, the scatter should fall along the lines depicting the mean and factor of ten bounds. The data shows that this is not the case. Based on this review and finding little to no relationship between 99Tc and either fission products 137Cs or 129I, the most likely source for the majority of 99Tc in the PNNL LILW waste samples evaluated in this report is the activated corrosion product 99Mo.
Sample Data Validity
Similar to the process for 129I in Section 4, the next step in determining the validity of this data set is to log transform the data. To accomplish this, the natural log of the measured values and associated ratios are depicted in Table 5-1. The data is then plotted and several validity checks for the fit of the data as a log-normal distribution are performed. Both 60Co and 137Cs are evaluated.
Activation of 98Mo in materials of construction is the dominant source of 99Tc in the PNNL samples and apparently in LILW unless fuel clad integrity becomes quite poor.
9923195
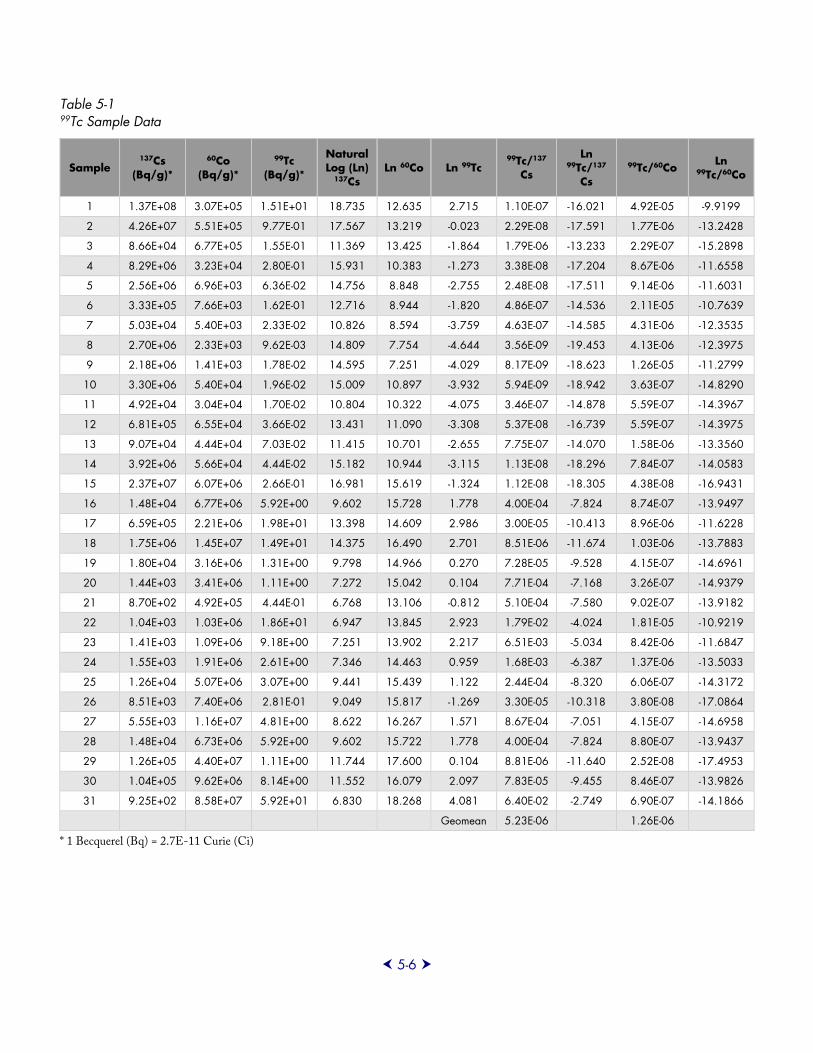
5-6
Table 5-1 99Tc Sample Data
Sample 137Cs
(Bq/g)*
60Co (Bq/g)*
99Tc (Bq/g)*
Natural Log (Ln)
137Cs Ln 60Co Ln 99Tc
99Tc/137
Cs
Ln 99Tc/137
Cs
99Tc/60Co Ln
99Tc/60Co
1 1.37E+08 3.07E+05 1.51E+01 18.735 12.635 2.715 1.10E-07 -16.021 4.92E-05 -9.9199
2 4.26E+07 5.51E+05 9.77E-01 17.567 13.219 -0.023 2.29E-08 -17.591 1.77E-06 -13.2428
3 8.66E+04 6.77E+05 1.55E-01 11.369 13.425 -1.864 1.79E-06 -13.233 2.29E-07 -15.2898
4 8.29E+06 3.23E+04 2.80E-01 15.931 10.383 -1.273 3.38E-08 -17.204 8.67E-06 -11.6558
5 2.56E+06 6.96E+03 6.36E-02 14.756 8.848 -2.755 2.48E-08 -17.511 9.14E-06 -11.6031
6 3.33E+05 7.66E+03 1.62E-01 12.716 8.944 -1.820 4.86E-07 -14.536 2.11E-05 -10.7639
7 5.03E+04 5.40E+03 2.33E-02 10.826 8.594 -3.759 4.63E-07 -14.585 4.31E-06 -12.3535
8 2.70E+06 2.33E+03 9.62E-03 14.809 7.754 -4.644 3.56E-09 -19.453 4.13E-06 -12.3975
9 2.18E+06 1.41E+03 1.78E-02 14.595 7.251 -4.029 8.17E-09 -18.623 1.26E-05 -11.2799
10 3.30E+06 5.40E+04 1.96E-02 15.009 10.897 -3.932 5.94E-09 -18.942 3.63E-07 -14.8290
11 4.92E+04 3.04E+04 1.70E-02 10.804 10.322 -4.075 3.46E-07 -14.878 5.59E-07 -14.3967
12 6.81E+05 6.55E+04 3.66E-02 13.431 11.090 -3.308 5.37E-08 -16.739 5.59E-07 -14.3975
13 9.07E+04 4.44E+04 7.03E-02 11.415 10.701 -2.655 7.75E-07 -14.070 1.58E-06 -13.3560
14 3.92E+06 5.66E+04 4.44E-02 15.182 10.944 -3.115 1.13E-08 -18.296 7.84E-07 -14.0583
15 2.37E+07 6.07E+06 2.66E-01 16.981 15.619 -1.324 1.12E-08 -18.305 4.38E-08 -16.9431
16 1.48E+04 6.77E+06 5.92E+00 9.602 15.728 1.778 4.00E-04 -7.824 8.74E-07 -13.9497
17 6.59E+05 2.21E+06 1.98E+01 13.398 14.609 2.986 3.00E-05 -10.413 8.96E-06 -11.6228
18 1.75E+06 1.45E+07 1.49E+01 14.375 16.490 2.701 8.51E-06 -11.674 1.03E-06 -13.7883
19 1.80E+04 3.16E+06 1.31E+00 9.798 14.966 0.270 7.28E-05 -9.528 4.15E-07 -14.6961
20 1.44E+03 3.41E+06 1.11E+00 7.272 15.042 0.104 7.71E-04 -7.168 3.26E-07 -14.9379
21 8.70E+02 4.92E+05 4.44E-01 6.768 13.106 -0.812 5.10E-04 -7.580 9.02E-07 -13.9182
22 1.04E+03 1.03E+06 1.86E+01 6.947 13.845 2.923 1.79E-02 -4.024 1.81E-05 -10.9219
23 1.41E+03 1.09E+06 9.18E+00 7.251 13.902 2.217 6.51E-03 -5.034 8.42E-06 -11.6847
24 1.55E+03 1.91E+06 2.61E+00 7.346 14.463 0.959 1.68E-03 -6.387 1.37E-06 -13.5033
25 1.26E+04 5.07E+06 3.07E+00 9.441 15.439 1.122 2.44E-04 -8.320 6.06E-07 -14.3172
26 8.51E+03 7.40E+06 2.81E-01 9.049 15.817 -1.269 3.30E-05 -10.318 3.80E-08 -17.0864
27 5.55E+03 1.16E+07 4.81E+00 8.622 16.267 1.571 8.67E-04 -7.051 4.15E-07 -14.6958
28 1.48E+04 6.73E+06 5.92E+00 9.602 15.722 1.778 4.00E-04 -7.824 8.80E-07 -13.9437
29 1.26E+05 4.40E+07 1.11E+00 11.744 17.600 0.104 8.81E-06 -11.640 2.52E-08 -17.4953
30 1.04E+05 9.62E+06 8.14E+00 11.552 16.079 2.097 7.83E-05 -9.455 8.46E-07 -13.9826
31 9.25E+02 8.58E+07 5.92E+01 6.830 18.268 4.081 6.40E-02 -2.749 6.90E-07 -14.1866
Geomean 5.23E-06 1.26E-06
* 1 Becquerel (Bq) = 2.7E-11 Curie (Ci)
9923195
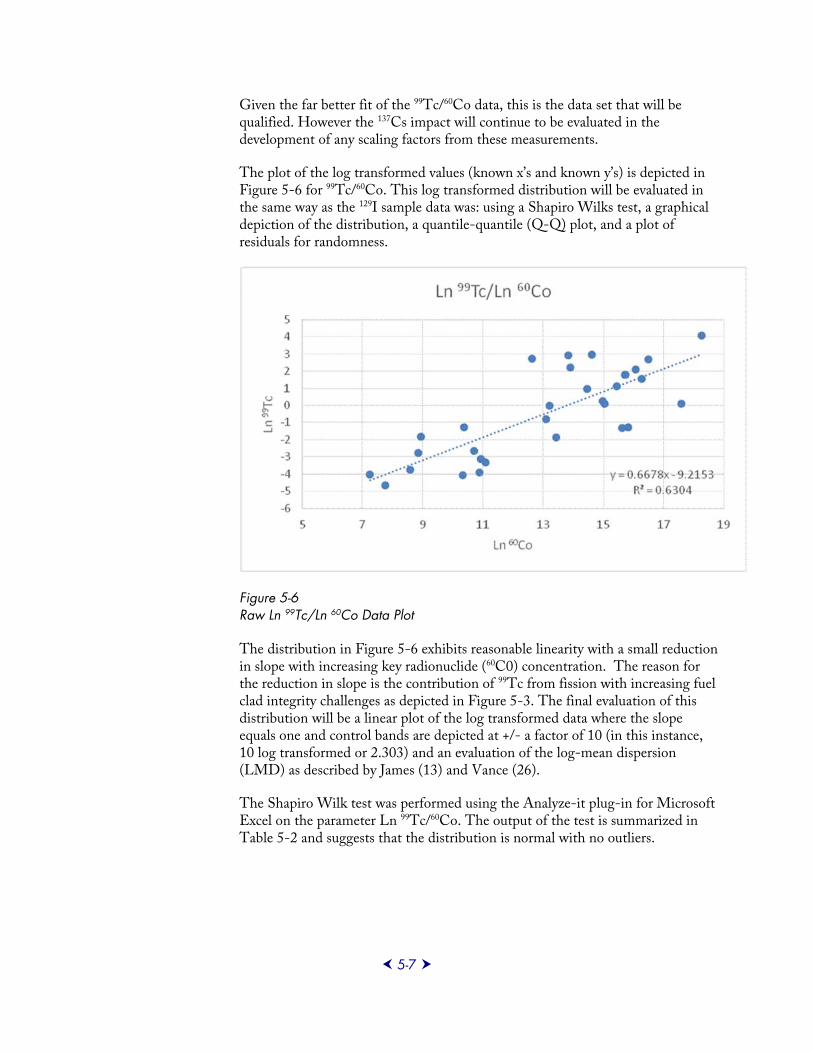
5-7
Given the far better fit of the 99Tc/60Co data, this is the data set that will be qualified. However the 137Cs impact will continue to be evaluated in the development of any scaling factors from these measurements.
The plot of the log transformed values (known x’s and known y’s) is depicted in Figure 5-6 for 99Tc/60Co. This log transformed distribution will be evaluated in the same way as the 129I sample data was: using a Shapiro Wilks test, a graphical depiction of the distribution, a quantile-quantile (Q-Q) plot, and a plot of residuals for randomness.
Figure 5-6 Raw Ln 99Tc/Ln 60Co Data Plot
The distribution in Figure 5-6 exhibits reasonable linearity with a small reduction in slope with increasing key radionuclide (60C0) concentration. The reason for the reduction in slope is the contribution of 99Tc from fission with increasing fuel clad integrity challenges as depicted in Figure 5-3. The final evaluation of this distribution will be a linear plot of the log transformed data where the slope equals one and control bands are depicted at +/- a factor of 10 (in this instance, 10 log transformed or 2.303) and an evaluation of the log-mean dispersion (LMD) as described by James (13) and Vance (26).
The Shapiro Wilk test was performed using the Analyze-it plug-in for Microsoft Excel on the parameter Ln 99Tc/60Co. The output of the test is summarized in Table 5-2 and suggests that the distribution is normal with no outliers.
9923195
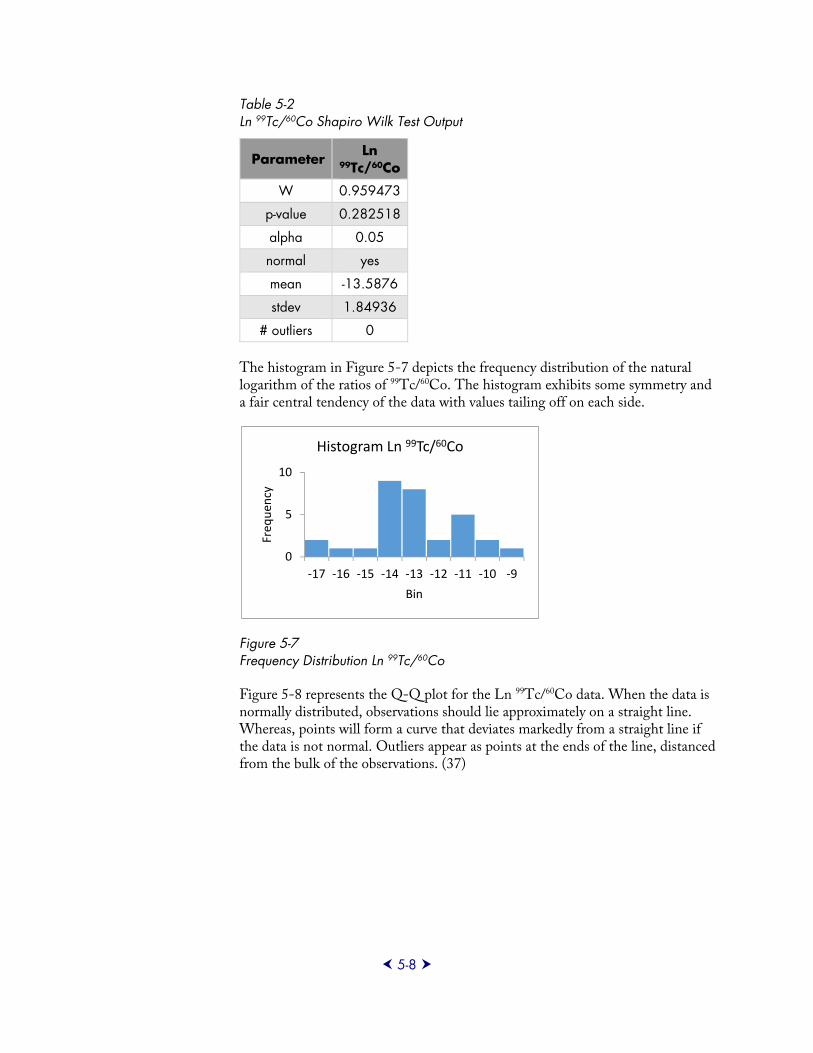
5-8
Table 5-2 Ln 99Tc/60Co Shapiro Wilk Test Output
Parameter Ln
99Tc/60Co
W 0.959473
p-value 0.282518
alpha 0.05
normal yes
mean -13.5876
stdev 1.84936
# outliers 0
The histogram in Figure 5-7 depicts the frequency distribution of the natural logarithm of the ratios of 99Tc/60Co. The histogram exhibits some symmetry and a fair central tendency of the data with values tailing off on each side.
Figure 5-7 Frequency Distribution Ln 99Tc/60Co
Figure 5-8 represents the Q-Q plot for the Ln 99Tc/60Co data. When the data is normally distributed, observations should lie approximately on a straight line. Whereas, points will form a curve that deviates markedly from a straight line if the data is not normal. Outliers appear as points at the ends of the line, distanced from the bulk of the observations. (37)
0
5
10
‐17 ‐16 ‐15 ‐14 ‐13 ‐12 ‐11 ‐10 ‐9
Freq
uen
cy
Bin
Histogram Ln 99Tc/60Co
9923195
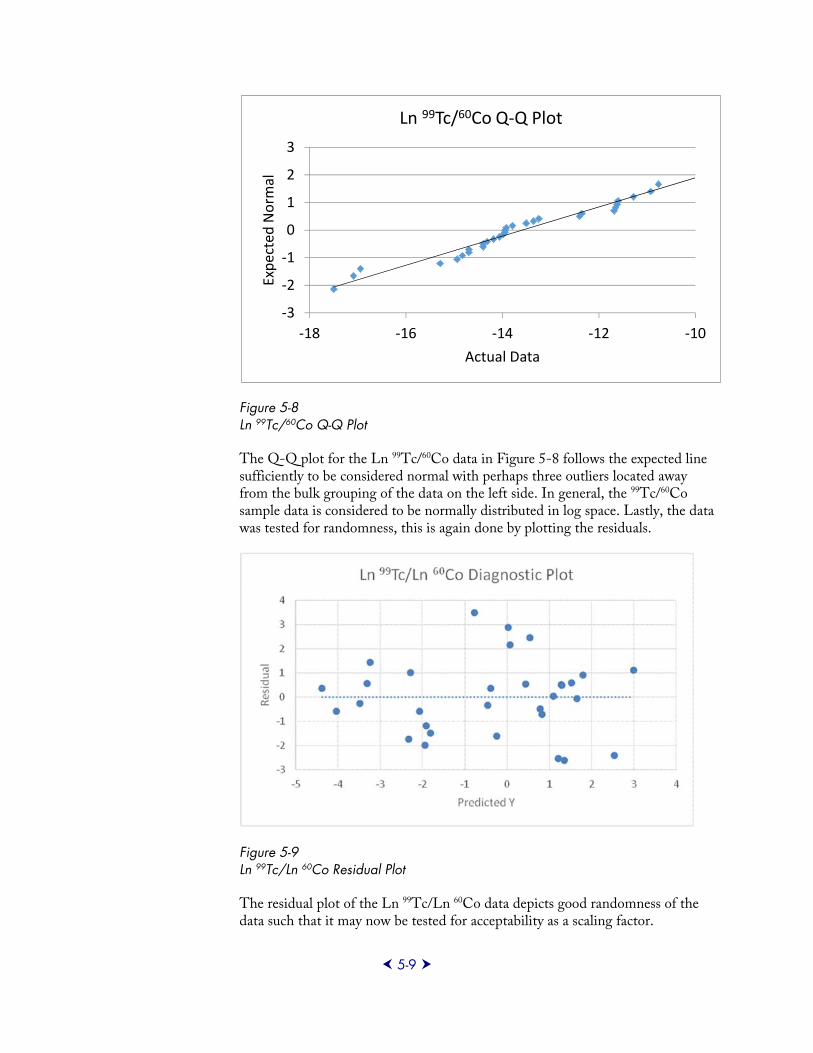
5-9
Figure 5-8 Ln 99Tc/60Co Q-Q Plot
The Q-Q plot for the Ln 99Tc/60Co data in Figure 5-8 follows the expected line sufficiently to be considered normal with perhaps three outliers located away from the bulk grouping of the data on the left side. In general, the 99Tc/60Co sample data is considered to be normally distributed in log space. Lastly, the data was tested for randomness, this is again done by plotting the residuals.
Figure 5-9 Ln 99Tc/Ln 60Co Residual Plot
The residual plot of the Ln 99Tc/Ln 60Co data depicts good randomness of the data such that it may now be tested for acceptability as a scaling factor.
‐3
‐2
‐1
0
1
2
3
‐18 ‐16 ‐14 ‐12 ‐10
Expected Norm
al
Actual Data
Ln 99Tc/60Co Q‐Q Plot
9923195
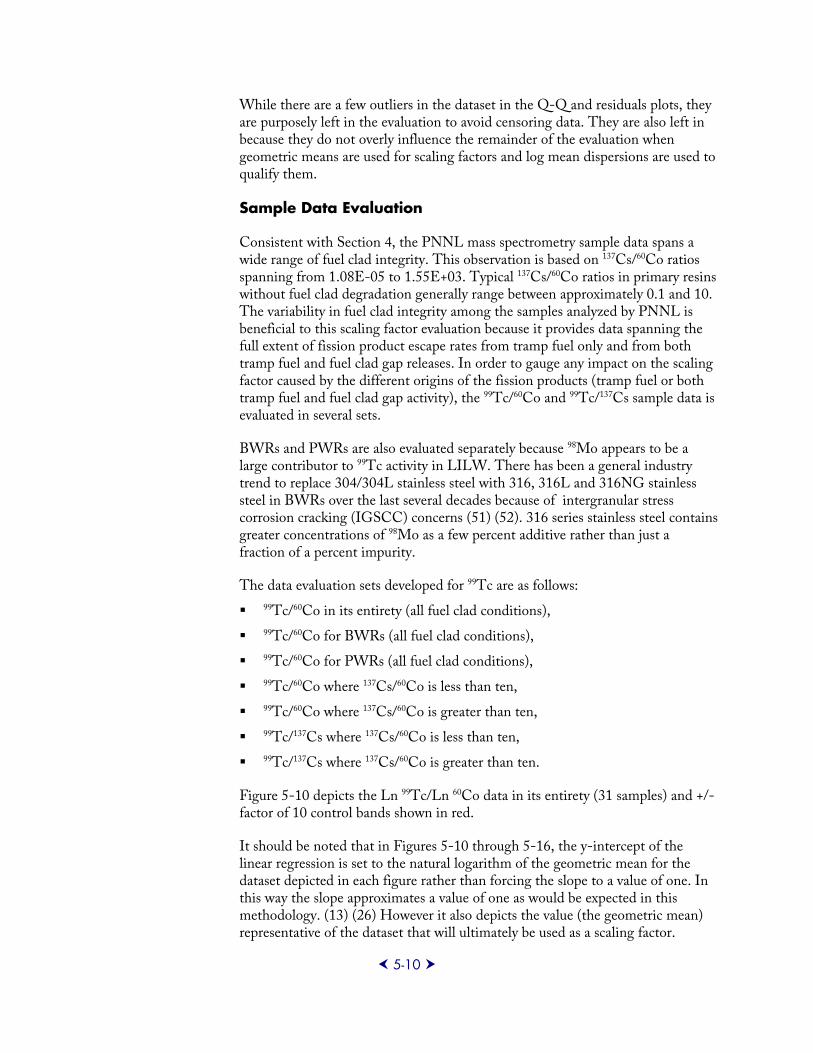
5-10
While there are a few outliers in the dataset in the Q-Q and residuals plots, they are purposely left in the evaluation to avoid censoring data. They are also left in because they do not overly influence the remainder of the evaluation when geometric means are used for scaling factors and log mean dispersions are used to qualify them.
Sample Data Evaluation
Consistent with Section 4, the PNNL mass spectrometry sample data spans a wide range of fuel clad integrity. This observation is based on 137Cs/60Co ratios spanning from 1.08E-05 to 1.55E+03. Typical 137Cs/60Co ratios in primary resins without fuel clad degradation generally range between approximately 0.1 and 10. The variability in fuel clad integrity among the samples analyzed by PNNL is beneficial to this scaling factor evaluation because it provides data spanning the full extent of fission product escape rates from tramp fuel only and from both tramp fuel and fuel clad gap releases. In order to gauge any impact on the scaling factor caused by the different origins of the fission products (tramp fuel or both tramp fuel and fuel clad gap activity), the 99Tc/60Co and 99Tc/137Cs sample data is evaluated in several sets.
BWRs and PWRs are also evaluated separately because 98Mo appears to be a large contributor to 99Tc activity in LILW. There has been a general industry trend to replace 304/304L stainless steel with 316, 316L and 316NG stainless steel in BWRs over the last several decades because of intergranular stress corrosion cracking (IGSCC) concerns (51) (52). 316 series stainless steel contains greater concentrations of 98Mo as a few percent additive rather than just a fraction of a percent impurity.
The data evaluation sets developed for 99Tc are as follows:
99Tc/60Co in its entirety (all fuel clad conditions),
99Tc/60Co for BWRs (all fuel clad conditions),
99Tc/60Co for PWRs (all fuel clad conditions),
99Tc/60Co where 137Cs/60Co is less than ten,
99Tc/60Co where 137Cs/60Co is greater than ten,
99Tc/137Cs where 137Cs/60Co is less than ten,
99Tc/137Cs where 137Cs/60Co is greater than ten.
Figure 5-10 depicts the Ln 99Tc/Ln 60Co data in its entirety (31 samples) and +/- factor of 10 control bands shown in red.
It should be noted that in Figures 5-10 through 5-16, the y-intercept of the linear regression is set to the natural logarithm of the geometric mean for the dataset depicted in each figure rather than forcing the slope to a value of one. In this way the slope approximates a value of one as would be expected in this methodology. (13) (26) However it also depicts the value (the geometric mean) representative of the dataset that will ultimately be used as a scaling factor.
9923195
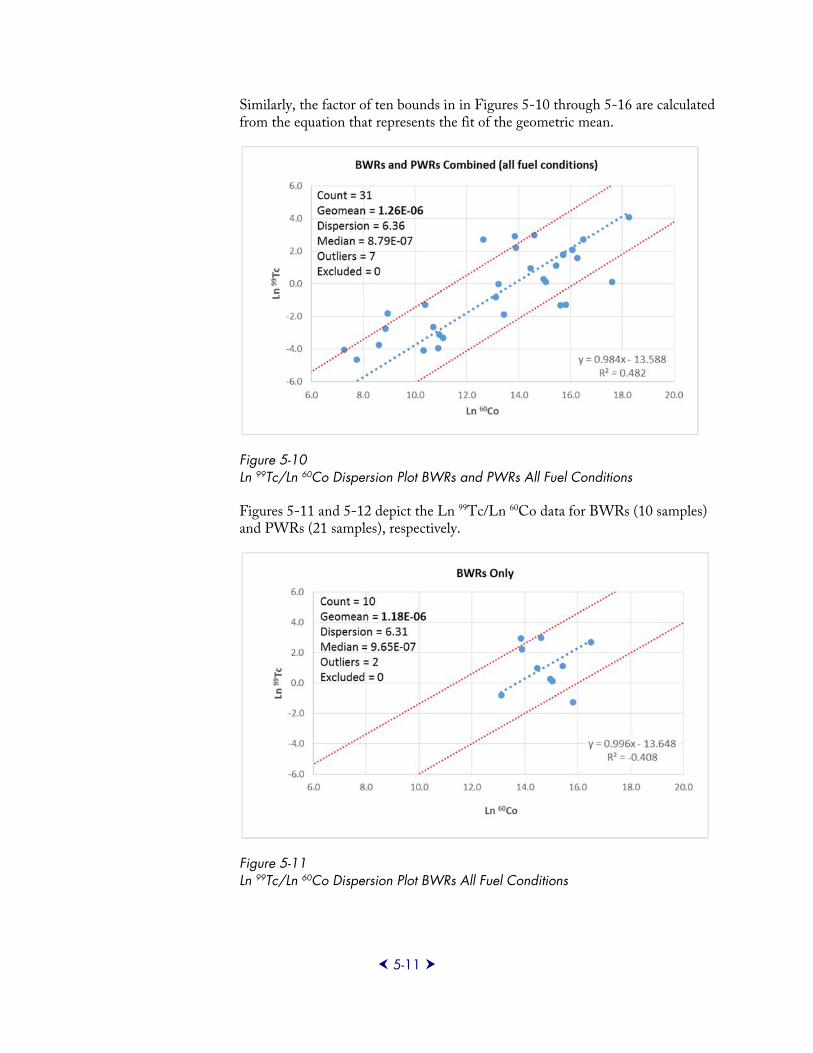
5-11
Similarly, the factor of ten bounds in in Figures 5-10 through 5-16 are calculated from the equation that represents the fit of the geometric mean.
Figure 5-10 Ln 99Tc/Ln 60Co Dispersion Plot BWRs and PWRs All Fuel Conditions
Figures 5-11 and 5-12 depict the Ln 99Tc/Ln 60Co data for BWRs (10 samples) and PWRs (21 samples), respectively.
Figure 5-11 Ln 99Tc/Ln 60Co Dispersion Plot BWRs All Fuel Conditions
9923195
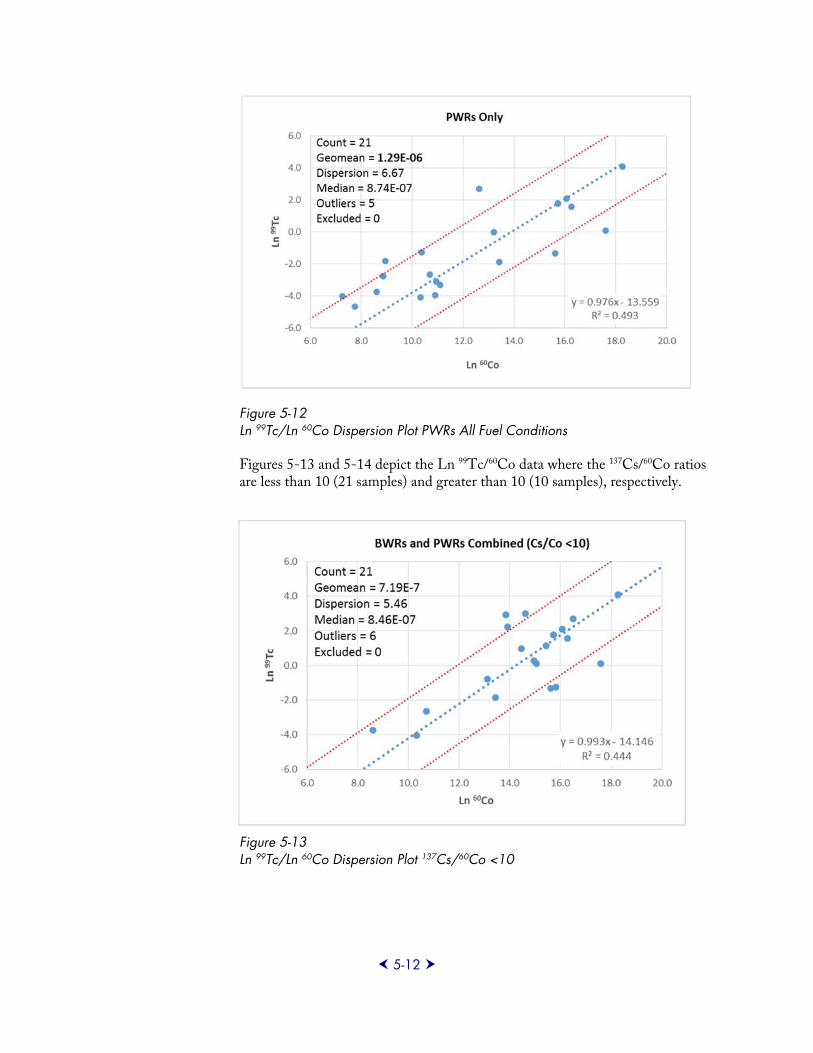
5-12
Figure 5-12 Ln 99Tc/Ln 60Co Dispersion Plot PWRs All Fuel Conditions
Figures 5-13 and 5-14 depict the Ln 99Tc/60Co data where the 137Cs/60Co ratios are less than 10 (21 samples) and greater than 10 (10 samples), respectively.
Figure 5-13 Ln 99Tc/Ln 60Co Dispersion Plot 137Cs/60Co <10
9923195
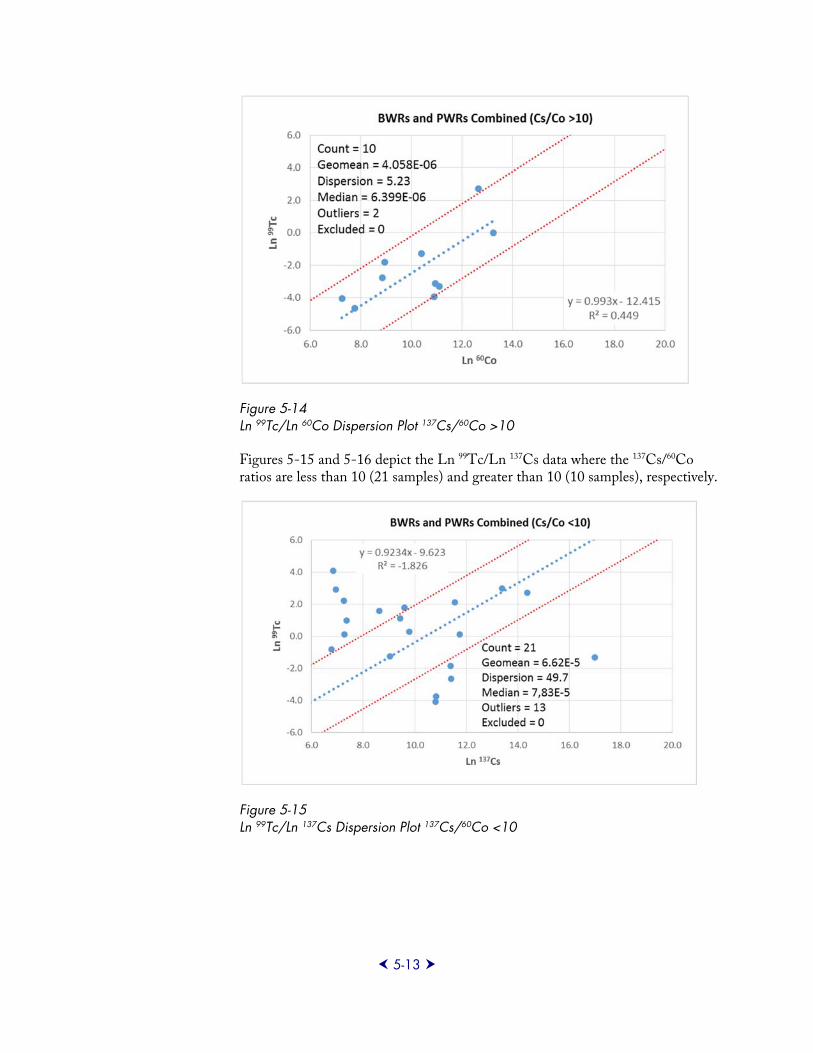
5-13
Figure 5-14 Ln 99Tc/Ln 60Co Dispersion Plot 137Cs/60Co >10
Figures 5-15 and 5-16 depict the Ln 99Tc/Ln 137Cs data where the 137Cs/60Co ratios are less than 10 (21 samples) and greater than 10 (10 samples), respectively.
Figure 5-15 Ln 99Tc/Ln 137Cs Dispersion Plot 137Cs/60Co <10
9923195
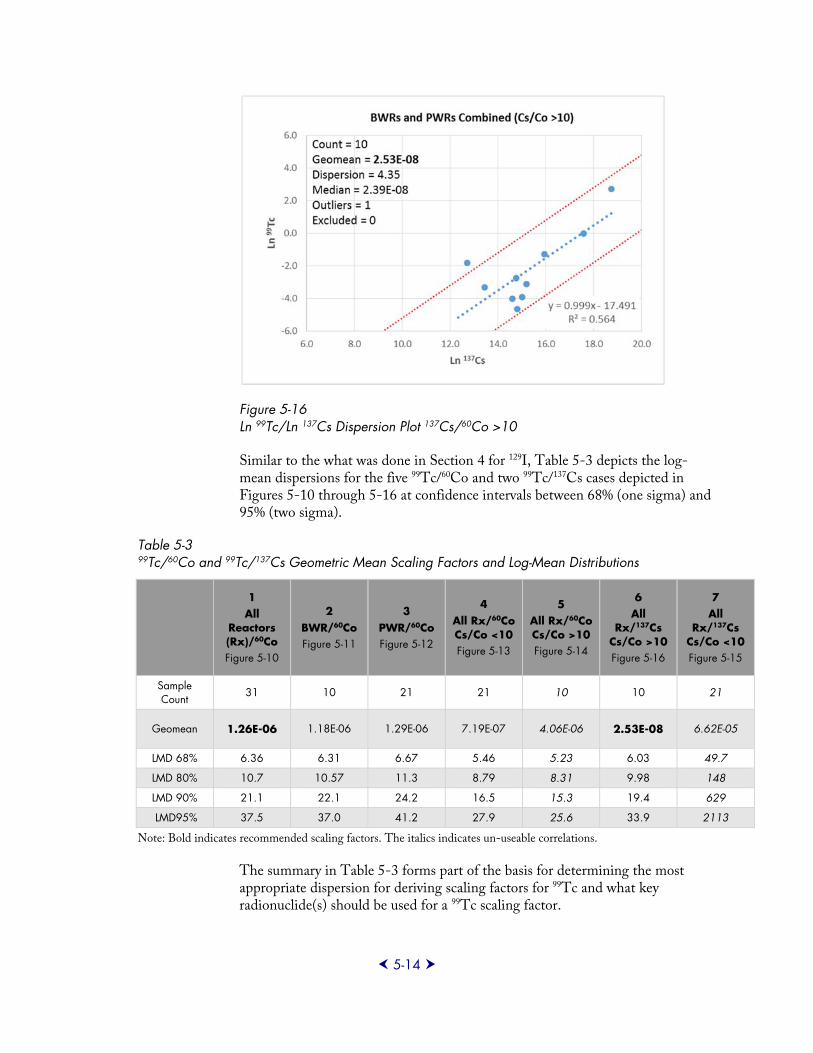
5-14
Figure 5-16 Ln 99Tc/Ln 137Cs Dispersion Plot 137Cs/60Co >10
Similar to the what was done in Section 4 for 129I, Table 5-3 depicts the log-mean dispersions for the five 99Tc/60Co and two 99Tc/137Cs cases depicted in Figures 5-10 through 5-16 at confidence intervals between 68% (one sigma) and 95% (two sigma).
Table 5-3 99Tc/60Co and 99Tc/137Cs Geometric Mean Scaling Factors and Log-Mean Distributions
1 All
Reactors (Rx)/60Co Figure 5-10
2 BWR/60Co Figure 5-11
3 PWR/60Co Figure 5-12
4 All Rx/60Co Cs/Co <10 Figure 5-13
5 All Rx/60Co Cs/Co >10 Figure 5-14
6 All
Rx/137Cs Cs/Co >10 Figure 5-16
7 All
Rx/137Cs Cs/Co <10 Figure 5-15
Sample Count
31 10 21 21 10 10 21
Geomean 1.26E-06 1.18E-06 1.29E-06 7.19E-07 4.06E-06 2.53E-08 6.62E-05
LMD 68% 6.36 6.31 6.67 5.46 5.23 6.03 49.7
LMD 80% 10.7 10.57 11.3 8.79 8.31 9.98 148
LMD 90% 21.1 22.1 24.2 16.5 15.3 19.4 629
LMD95% 37.5 37.0 41.2 27.9 25.6 33.9 2113
Note: Bold indicates recommended scaling factors. The italics indicates un-useable correlations.
The summary in Table 5-3 forms part of the basis for determining the most appropriate dispersion for deriving scaling factors for 99Tc and what key radionuclide(s) should be used for a 99Tc scaling factor.
9923195
5-15
Consideration must also be given to the major contributor of 99Tc in the waste depending upon the condition of fuel clad integrity (as discussed earlier in this section and depicted in Figures 5-1 through 5-3.)
The dataset in Table 5-3, Column 7 and the accompanying Figure 5-15, where 99Tc/137Cs is evaluated against 137Cs/60Co ratios <10, can be eliminated on just the basis of no correlation. Column 7 in Table 5-3 is depicted in italics to distinguish it as non-usable.
Next the dataset in Table 5-3, Column 5 and the accompanying Figure 5-14 where 99Tc/60Co is evaluated against 137Cs/60Co ratios >10 is reviewed. If only considering the dispersion values in Table 5-3 one might consider this the most appropriate scaling factor for 137Cs/60Co ratios >10. However, recalling the dominance of 99Tc/137Cs relationship in Figure 5-3 that builds in with increased fuel clad integrity challenges, scaling the 99Tc originating from the fuel clad gap to the activation product 60Co is not appropriate. As discussed earlier in this section, 99Tc is produced, for the most part, by activation of 98Mo in materials of construction and, to a lesser extent, from tramp fuel when fuel clad integrity is good. Therefore, 60Co should not be used for scaling 99Tc when there is a high ratio of fission products to activation products in the waste (137Cs/60Co >10, an indication of challenged fuel clad integrity.) Column 5 in Table 5-3 is thus depicted in italics to distinguish it as non-usable.
When reviewing the datasets in Table 5-3, Columns 1-4, where 60Co is the key radionuclide for 99Tc, and their respective dispersion plots in Figures 5-10 through 5-13, the following observations are made. There is little difference between PWRs and BWRs. It is also evident that when fuel clad integrity is good (137Cs/60Co <10), the scaling factor in Column 4 is about 50% of the 99Tc/60Co scaling factor for all fuel conditions in Column 1. While the value in Column 4 would be slightly more accurate for fuel clad conditions where 137Cs/60Co is <10, it is also less conservative. In this instance, it would be better to use the bounding of the four values, from Column 1, because there is not a significant difference.
Therefore, when the 137Cs/60Co ratio is <10, 99Tc should be scaled to 60Co using the rounded value of 1.30E-06 from Column 1 of Table 5-3.
Having determined that 99Tc is not best scaled to 60Co when 137Cs/60Co ratios are >10, the 99Tc/137Cs data in Column 6 of Table 5-3 and the corresponding Figure 5-16 are considered. When fuel clad integrity is not optimal (137Cs/60Co >10), the 99Tc/137Cs scaling factor depicted in Column 6 of Table 5-3 and in Figure 5-16 is valid and more appropriate than using the scaling factor for 99Tc to 60C0. Based on the observed relationship of 99Tc and 137Cs in the PNNL LILW samples, it appears that when the fission product 137Cs is dominant the 99Tc from fission also increases as both are originating from the fuel clad gap.
Therefore, when the 137Cs/60Co ratio is >10, 99Tc should be scaled to 137Cs using the rounded value of 2.50E-08 from Column 6 of Table 5-3.
9923195
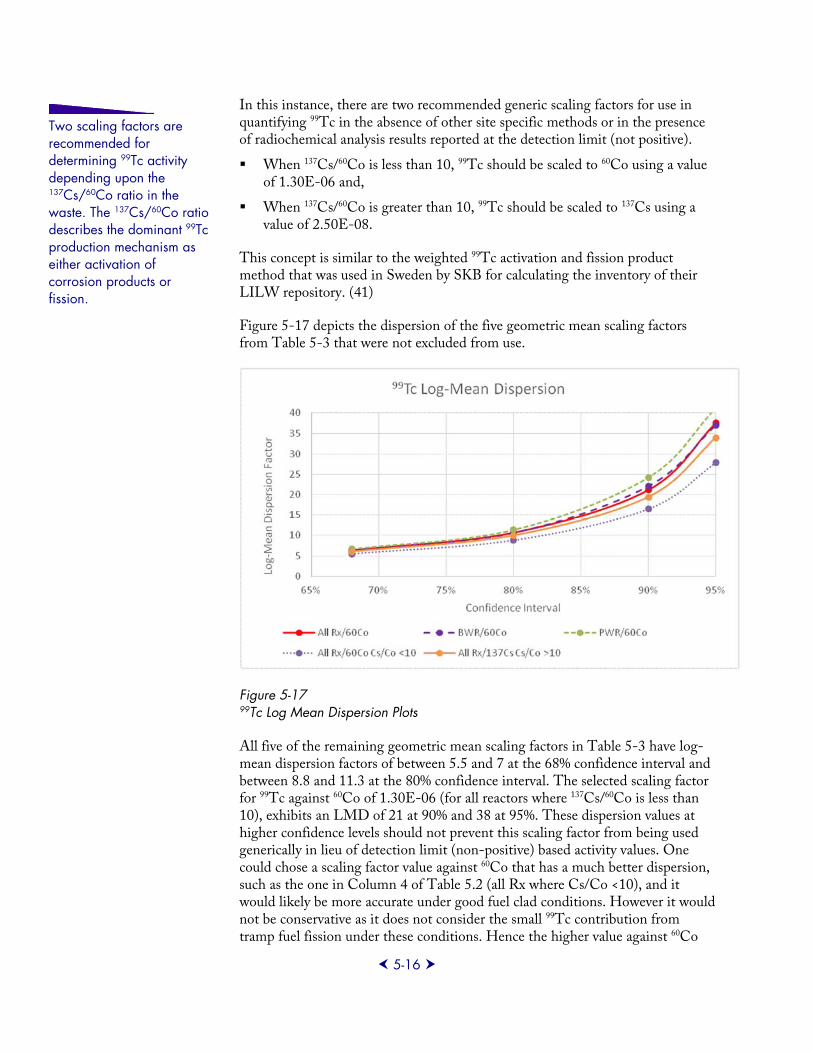
5-16
In this instance, there are two recommended generic scaling factors for use in quantifying 99Tc in the absence of other site specific methods or in the presence of radiochemical analysis results reported at the detection limit (not positive).
When 137Cs/60Co is less than 10, 99Tc should be scaled to 60Co using a value of 1.30E-06 and,
When 137Cs/60Co is greater than 10, 99Tc should be scaled to 137Cs using a value of 2.50E-08.
This concept is similar to the weighted 99Tc activation and fission product method that was used in Sweden by SKB for calculating the inventory of their LILW repository. (41)
Figure 5-17 depicts the dispersion of the five geometric mean scaling factors from Table 5-3 that were not excluded from use.
Figure 5-17 99Tc Log Mean Dispersion Plots
All five of the remaining geometric mean scaling factors in Table 5-3 have log-mean dispersion factors of between 5.5 and 7 at the 68% confidence interval and between 8.8 and 11.3 at the 80% confidence interval. The selected scaling factor for 99Tc against 60Co of 1.30E-06 (for all reactors where 137Cs/60Co is less than 10), exhibits an LMD of 21 at 90% and 38 at 95%. These dispersion values at higher confidence levels should not prevent this scaling factor from being used generically in lieu of detection limit (non-positive) based activity values. One could chose a scaling factor value against 60Co that has a much better dispersion, such as the one in Column 4 of Table 5.2 (all Rx where Cs/Co <10), and it would likely be more accurate under good fuel clad conditions. However it would not be conservative as it does not consider the small 99Tc contribution from tramp fuel fission under these conditions. Hence the higher value against 60Co
Two scaling factors are recommended for determining 99Tc activity depending upon the 137Cs/60Co ratio in the waste. The 137Cs/60Co ratio describes the dominant 99Tc production mechanism as either activation of corrosion products or fission.
9923195
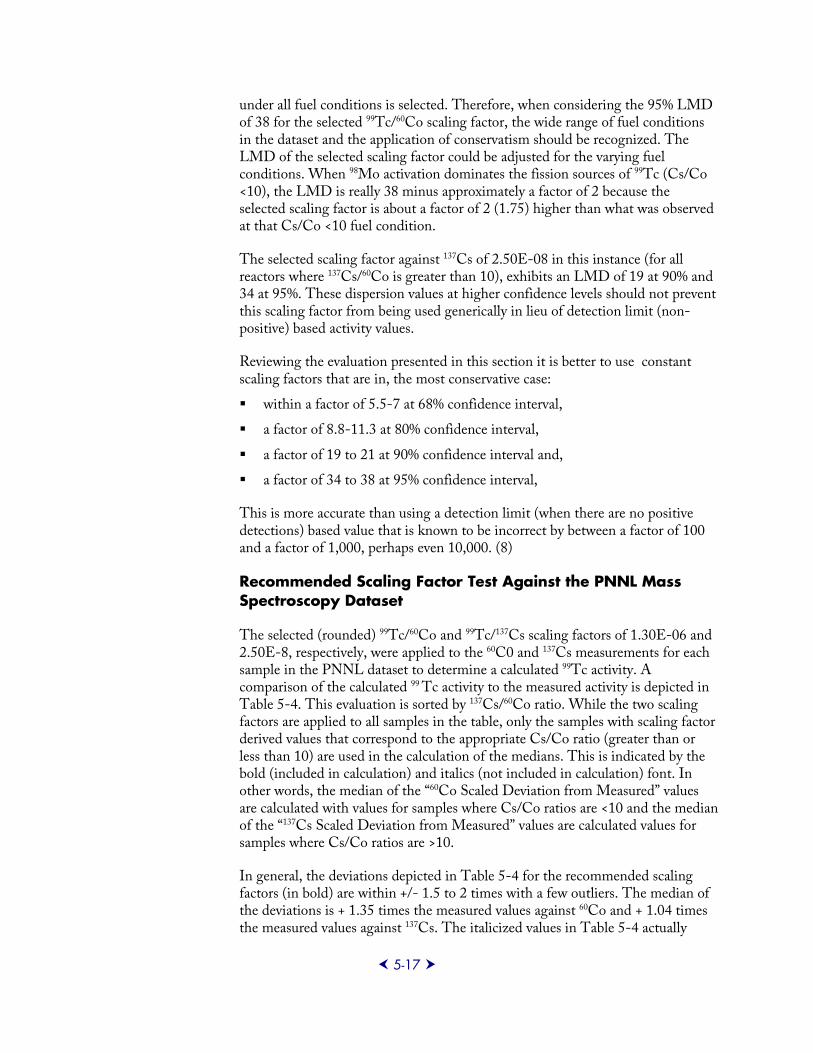
5-17
under all fuel conditions is selected. Therefore, when considering the 95% LMD of 38 for the selected 99Tc/60Co scaling factor, the wide range of fuel conditions in the dataset and the application of conservatism should be recognized. The LMD of the selected scaling factor could be adjusted for the varying fuel conditions. When 98Mo activation dominates the fission sources of 99Tc (Cs/Co <10), the LMD is really 38 minus approximately a factor of 2 because the selected scaling factor is about a factor of 2 (1.75) higher than what was observed at that Cs/Co <10 fuel condition.
The selected scaling factor against 137Cs of 2.50E-08 in this instance (for all reactors where 137Cs/60Co is greater than 10), exhibits an LMD of 19 at 90% and 34 at 95%. These dispersion values at higher confidence levels should not prevent this scaling factor from being used generically in lieu of detection limit (non-positive) based activity values.
Reviewing the evaluation presented in this section it is better to use constant scaling factors that are in, the most conservative case: within a factor of 5.5-7 at 68% confidence interval, a factor of 8.8-11.3 at 80% confidence interval,
a factor of 19 to 21 at 90% confidence interval and, a factor of 34 to 38 at 95% confidence interval,
This is more accurate than using a detection limit (when there are no positive detections) based value that is known to be incorrect by between a factor of 100 and a factor of 1,000, perhaps even 10,000. (8)
Recommended Scaling Factor Test Against the PNNL Mass Spectroscopy Dataset
The selected (rounded) 99Tc/60Co and 99Tc/137Cs scaling factors of 1.30E-06 and 2.50E-8, respectively, were applied to the 60C0 and 137Cs measurements for each sample in the PNNL dataset to determine a calculated 99Tc activity. A comparison of the calculated 99 Tc activity to the measured activity is depicted in Table 5-4. This evaluation is sorted by 137Cs/60Co ratio. While the two scaling factors are applied to all samples in the table, only the samples with scaling factor derived values that correspond to the appropriate Cs/Co ratio (greater than or less than 10) are used in the calculation of the medians. This is indicated by the bold (included in calculation) and italics (not included in calculation) font. In other words, the median of the “60Co Scaled Deviation from Measured” values are calculated with values for samples where Cs/Co ratios are <10 and the median of the “137Cs Scaled Deviation from Measured” values are calculated values for samples where Cs/Co ratios are >10.
In general, the deviations depicted in Table 5-4 for the recommended scaling factors (in bold) are within +/- 1.5 to 2 times with a few outliers. The median of the deviations is + 1.35 times the measured values against 60Co and + 1.04 times the measured values against 137Cs. The italicized values in Table 5-4 actually
9923195
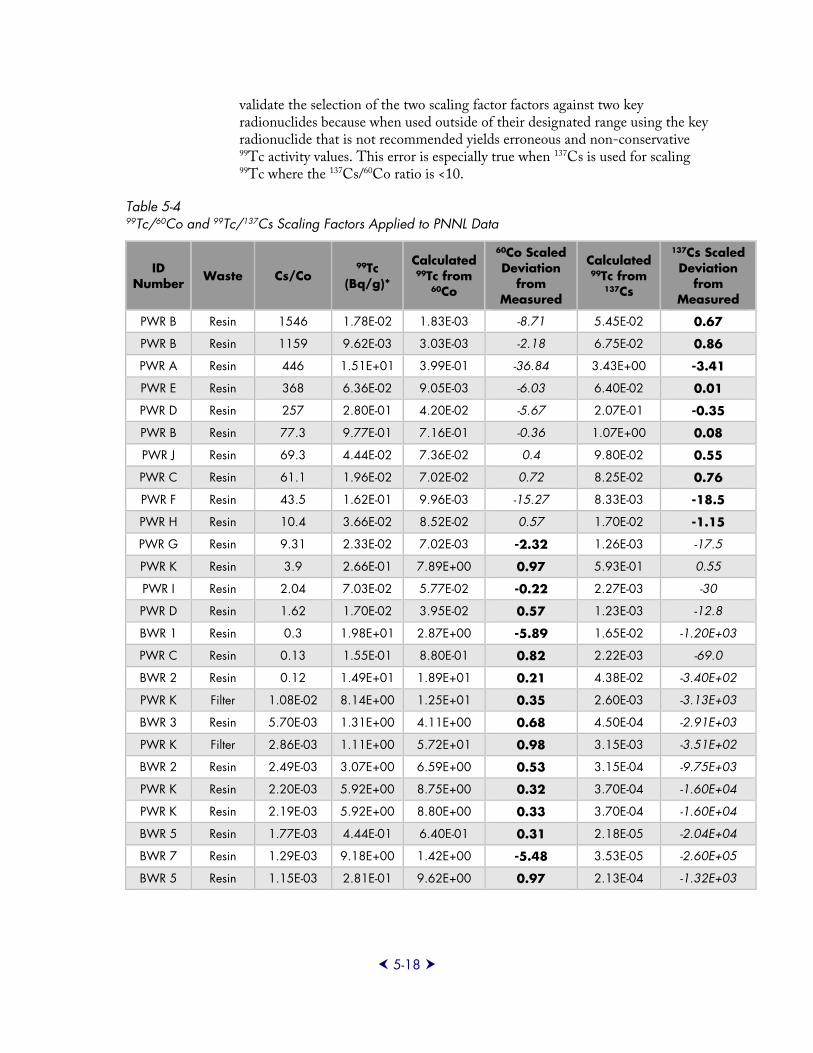
5-18
validate the selection of the two scaling factor factors against two key radionuclides because when used outside of their designated range using the key radionuclide that is not recommended yields erroneous and non-conservative 99Tc activity values. This error is especially true when 137Cs is used for scaling 99Tc where the 137Cs/60Co ratio is <10.
Table 5-4 99Tc/60Co and 99Tc/137Cs Scaling Factors Applied to PNNL Data
ID Number
Waste Cs/Co 99Tc
(Bq/g)*
Calculated 99Tc from
60Co
60Co Scaled Deviation
from Measured
Calculated 99Tc from
137Cs
137Cs Scaled Deviation
from Measured
PWR B Resin 1546 1.78E-02 1.83E-03 -8.71 5.45E-02 0.67
PWR B Resin 1159 9.62E-03 3.03E-03 -2.18 6.75E-02 0.86
PWR A Resin 446 1.51E+01 3.99E-01 -36.84 3.43E+00 -3.41
PWR E Resin 368 6.36E-02 9.05E-03 -6.03 6.40E-02 0.01
PWR D Resin 257 2.80E-01 4.20E-02 -5.67 2.07E-01 -0.35
PWR B Resin 77.3 9.77E-01 7.16E-01 -0.36 1.07E+00 0.08
PWR J Resin 69.3 4.44E-02 7.36E-02 0.4 9.80E-02 0.55
PWR C Resin 61.1 1.96E-02 7.02E-02 0.72 8.25E-02 0.76
PWR F Resin 43.5 1.62E-01 9.96E-03 -15.27 8.33E-03 -18.5
PWR H Resin 10.4 3.66E-02 8.52E-02 0.57 1.70E-02 -1.15
PWR G Resin 9.31 2.33E-02 7.02E-03 -2.32 1.26E-03 -17.5
PWR K Resin 3.9 2.66E-01 7.89E+00 0.97 5.93E-01 0.55
PWR I Resin 2.04 7.03E-02 5.77E-02 -0.22 2.27E-03 -30
PWR D Resin 1.62 1.70E-02 3.95E-02 0.57 1.23E-03 -12.8
BWR 1 Resin 0.3 1.98E+01 2.87E+00 -5.89 1.65E-02 -1.20E+03
PWR C Resin 0.13 1.55E-01 8.80E-01 0.82 2.22E-03 -69.0
BWR 2 Resin 0.12 1.49E+01 1.89E+01 0.21 4.38E-02 -3.40E+02
PWR K Filter 1.08E-02 8.14E+00 1.25E+01 0.35 2.60E-03 -3.13E+03
BWR 3 Resin 5.70E-03 1.31E+00 4.11E+00 0.68 4.50E-04 -2.91E+03
PWR K Filter 2.86E-03 1.11E+00 5.72E+01 0.98 3.15E-03 -3.51E+02
BWR 2 Resin 2.49E-03 3.07E+00 6.59E+00 0.53 3.15E-04 -9.75E+03
PWR K Resin 2.20E-03 5.92E+00 8.75E+00 0.32 3.70E-04 -1.60E+04
PWR K Resin 2.19E-03 5.92E+00 8.80E+00 0.33 3.70E-04 -1.60E+04
BWR 5 Resin 1.77E-03 4.44E-01 6.40E-01 0.31 2.18E-05 -2.04E+04
BWR 7 Resin 1.29E-03 9.18E+00 1.42E+00 -5.48 3.53E-05 -2.60E+05
BWR 5 Resin 1.15E-03 2.81E-01 9.62E+00 0.97 2.13E-04 -1.32E+03
9923195
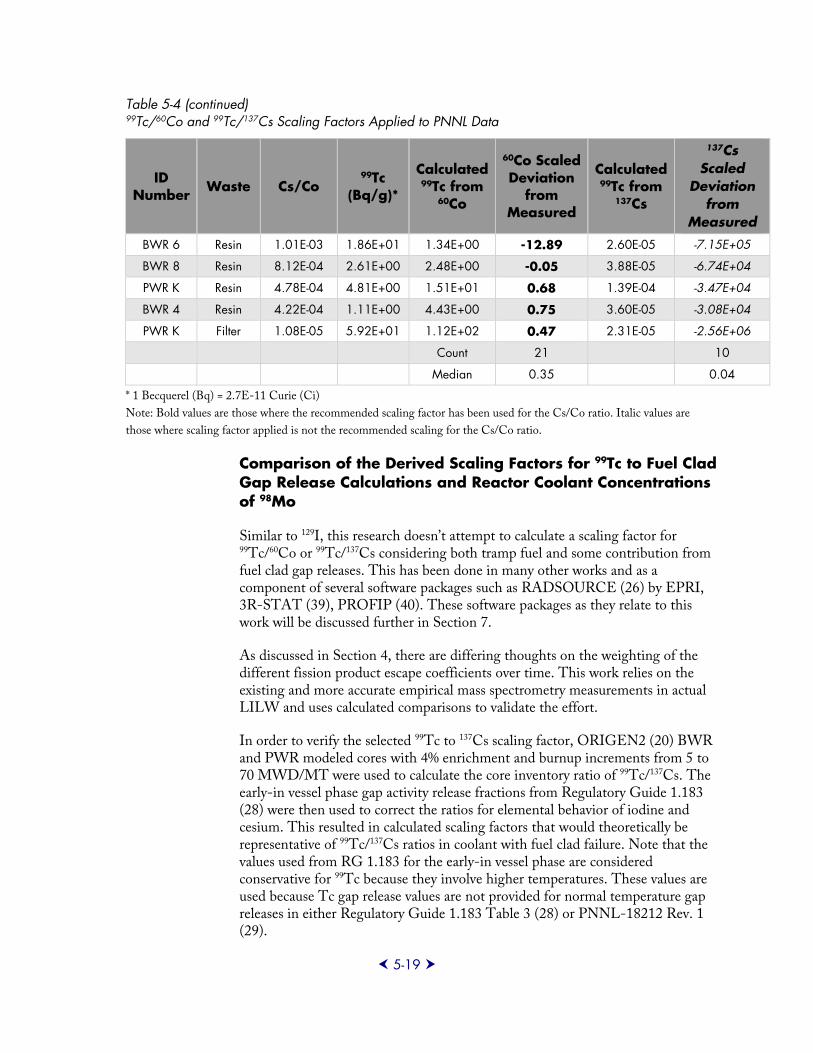
5-19
Table 5-4 (continued) 99Tc/60Co and 99Tc/137Cs Scaling Factors Applied to PNNL Data
ID Number
Waste Cs/Co 99Tc
(Bq/g)*
Calculated 99Tc from
60Co
60Co Scaled Deviation
from Measured
Calculated 99Tc from
137Cs
137Cs Scaled
Deviation from
Measured BWR 6 Resin 1.01E-03 1.86E+01 1.34E+00 -12.89 2.60E-05 -7.15E+05
BWR 8 Resin 8.12E-04 2.61E+00 2.48E+00 -0.05 3.88E-05 -6.74E+04
PWR K Resin 4.78E-04 4.81E+00 1.51E+01 0.68 1.39E-04 -3.47E+04
BWR 4 Resin 4.22E-04 1.11E+00 4.43E+00 0.75 3.60E-05 -3.08E+04
PWR K Filter 1.08E-05 5.92E+01 1.12E+02 0.47 2.31E-05 -2.56E+06
Count 21 10
Median 0.35 0.04
* 1 Becquerel (Bq) = 2.7E-11 Curie (Ci)
Note: Bold values are those where the recommended scaling factor has been used for the Cs/Co ratio. Italic values are
those where scaling factor applied is not the recommended scaling for the Cs/Co ratio.
Comparison of the Derived Scaling Factors for 99Tc to Fuel Clad Gap Release Calculations and Reactor Coolant Concentrations of 98Mo
Similar to 129I, this research doesn’t attempt to calculate a scaling factor for 99Tc/60Co or 99Tc/137Cs considering both tramp fuel and some contribution from fuel clad gap releases. This has been done in many other works and as a component of several software packages such as RADSOURCE (26) by EPRI, 3R-STAT (39), PROFIP (40). These software packages as they relate to this work will be discussed further in Section 7.
As discussed in Section 4, there are differing thoughts on the weighting of the different fission product escape coefficients over time. This work relies on the existing and more accurate empirical mass spectrometry measurements in actual LILW and uses calculated comparisons to validate the effort.
In order to verify the selected 99Tc to 137Cs scaling factor, ORIGEN2 (20) BWR and PWR modeled cores with 4% enrichment and burnup increments from 5 to 70 MWD/MT were used to calculate the core inventory ratio of 99Tc/137Cs. The early-in vessel phase gap activity release fractions from Regulatory Guide 1.183 (28) were then used to correct the ratios for elemental behavior of iodine and cesium. This resulted in calculated scaling factors that would theoretically be representative of 99Tc/137Cs ratios in coolant with fuel clad failure. Note that the values used from RG 1.183 for the early-in vessel phase are considered conservative for 99Tc because they involve higher temperatures. These values are used because Tc gap release values are not provided for normal temperature gap releases in either Regulatory Guide 1.183 Table 3 (28) or PNNL-18212 Rev. 1 (29).
9923195
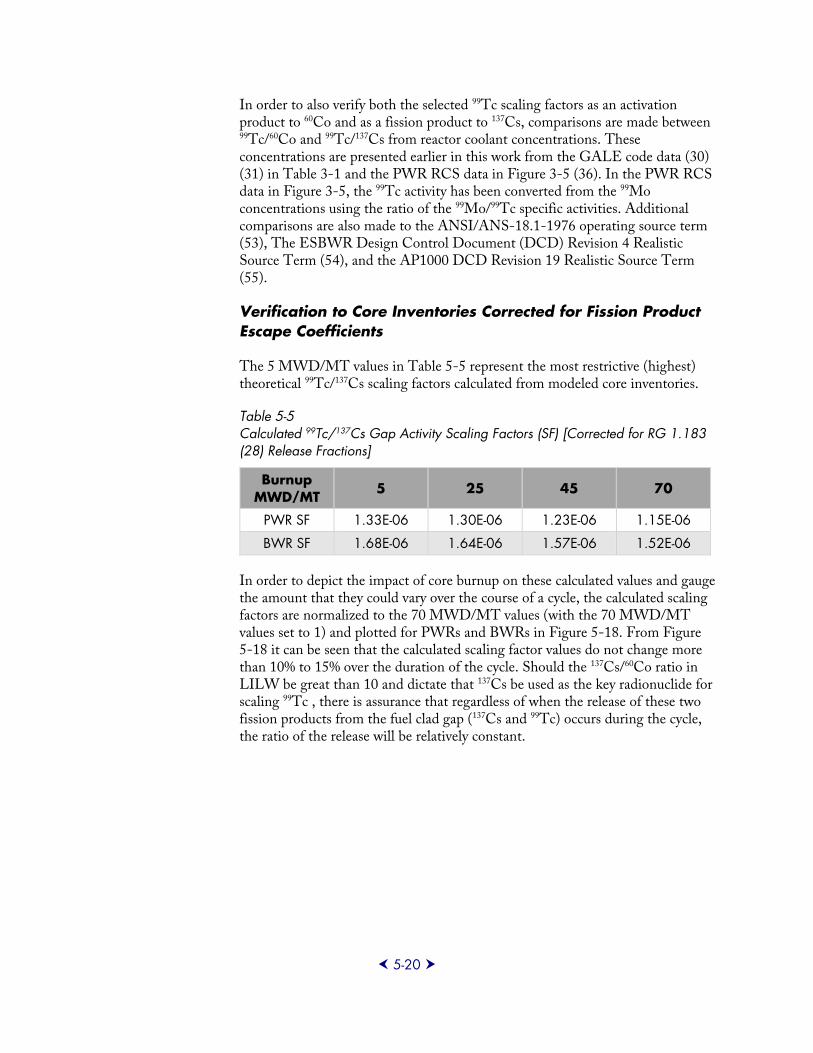
5-20
In order to also verify both the selected 99Tc scaling factors as an activation product to 60Co and as a fission product to 137Cs, comparisons are made between 99Tc/60Co and 99Tc/137Cs from reactor coolant concentrations. These concentrations are presented earlier in this work from the GALE code data (30) (31) in Table 3-1 and the PWR RCS data in Figure 3-5 (36). In the PWR RCS data in Figure 3-5, the 99Tc activity has been converted from the 99Mo concentrations using the ratio of the 99Mo/99Tc specific activities. Additional comparisons are also made to the ANSI/ANS-18.1-1976 operating source term (53), The ESBWR Design Control Document (DCD) Revision 4 Realistic Source Term (54), and the AP1000 DCD Revision 19 Realistic Source Term (55).
Verification to Core Inventories Corrected for Fission Product Escape Coefficients
The 5 MWD/MT values in Table 5-5 represent the most restrictive (highest) theoretical 99Tc/137Cs scaling factors calculated from modeled core inventories.
Table 5-5 Calculated 99Tc/137Cs Gap Activity Scaling Factors (SF) [Corrected for RG 1.183 (28) Release Fractions]
Burnup MWD/MT
5 25 45 70
PWR SF 1.33E-06 1.30E-06 1.23E-06 1.15E-06
BWR SF 1.68E-06 1.64E-06 1.57E-06 1.52E-06
In order to depict the impact of core burnup on these calculated values and gauge the amount that they could vary over the course of a cycle, the calculated scaling factors are normalized to the 70 MWD/MT values (with the 70 MWD/MT values set to 1) and plotted for PWRs and BWRs in Figure 5-18. From Figure 5-18 it can be seen that the calculated scaling factor values do not change more than 10% to 15% over the duration of the cycle. Should the 137Cs/60Co ratio in LILW be great than 10 and dictate that 137Cs be used as the key radionuclide for scaling 99Tc , there is assurance that regardless of when the release of these two fission products from the fuel clad gap (137Cs and 99Tc) occurs during the cycle, the ratio of the release will be relatively constant.
9923195
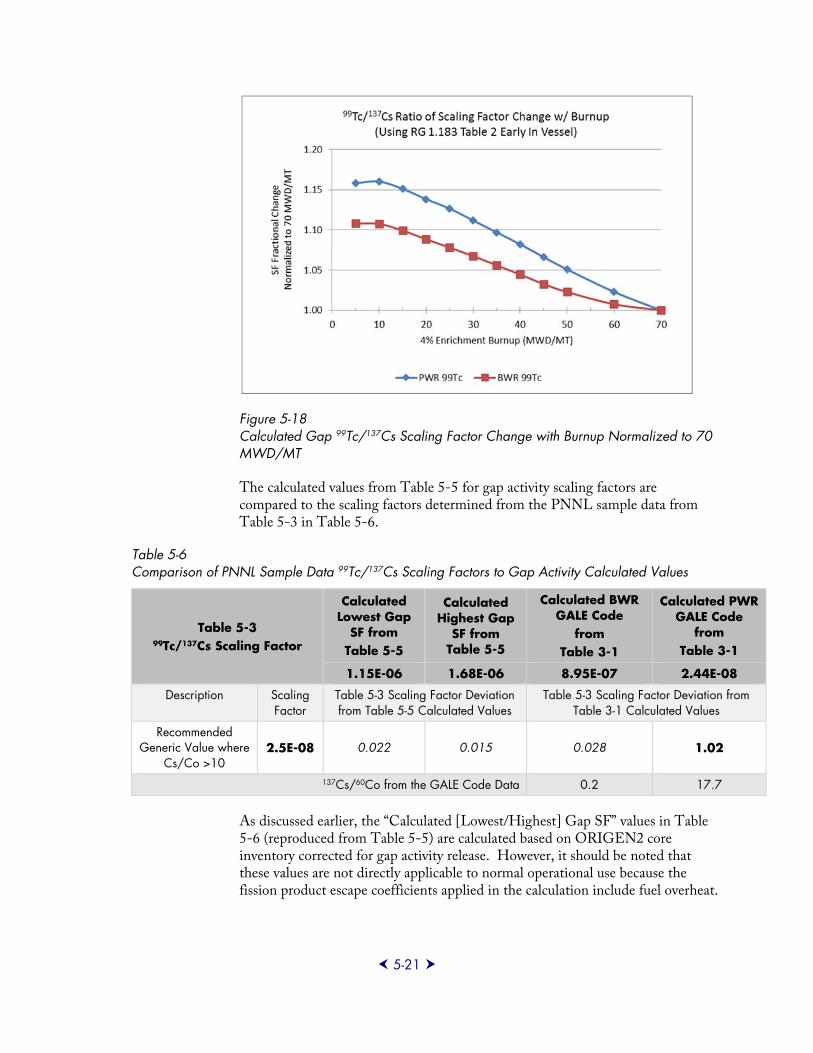
5-21
Figure 5-18 Calculated Gap 99Tc/137Cs Scaling Factor Change with Burnup Normalized to 70 MWD/MT
The calculated values from Table 5-5 for gap activity scaling factors are compared to the scaling factors determined from the PNNL sample data from Table 5-3 in Table 5-6.
Table 5-6 Comparison of PNNL Sample Data 99Tc/137Cs Scaling Factors to Gap Activity Calculated Values
Table 5-3 99Tc/137Cs Scaling Factor
Calculated Lowest Gap
SF from Table 5-5
Calculated Highest Gap
SF from Table 5-5
Calculated BWR GALE Code
from Table 3-1
Calculated PWR GALE Code
from Table 3-1
1.15E-06 1.68E-06 8.95E-07 2.44E-08
Description Scaling Factor
Table 5-3 Scaling Factor Deviation from Table 5-5 Calculated Values
Table 5-3 Scaling Factor Deviation from Table 3-1 Calculated Values
Recommended Generic Value where
Cs/Co >10 2.5E-08 0.022 0.015 0.028 1.02
137Cs/60Co from the GALE Code Data 0.2 17.7
As discussed earlier, the “Calculated [Lowest/Highest] Gap SF” values in Table 5-6 (reproduced from Table 5-5) are calculated based on ORIGEN2 core inventory corrected for gap activity release. However, it should be noted that these values are not directly applicable to normal operational use because the fission product escape coefficients applied in the calculation include fuel overheat.
9923195
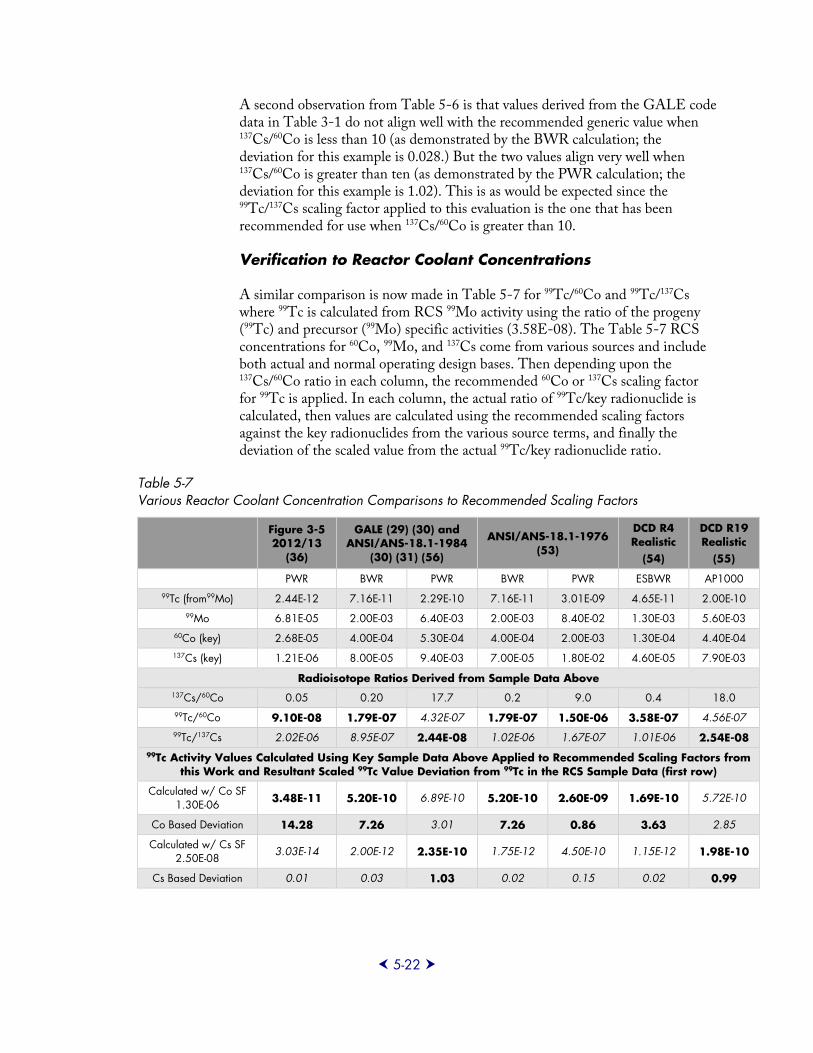
5-22
A second observation from Table 5-6 is that values derived from the GALE code data in Table 3-1 do not align well with the recommended generic value when 137Cs/60Co is less than 10 (as demonstrated by the BWR calculation; the deviation for this example is 0.028.) But the two values align very well when 137Cs/60Co is greater than ten (as demonstrated by the PWR calculation; the deviation for this example is 1.02). This is as would be expected since the 99Tc/137Cs scaling factor applied to this evaluation is the one that has been recommended for use when 137Cs/60Co is greater than 10.
Verification to Reactor Coolant Concentrations
A similar comparison is now made in Table 5-7 for 99Tc/60Co and 99Tc/137Cs where 99Tc is calculated from RCS 99Mo activity using the ratio of the progeny (99Tc) and precursor (99Mo) specific activities (3.58E-08). The Table 5-7 RCS concentrations for 60Co, 99Mo, and 137Cs come from various sources and include both actual and normal operating design bases. Then depending upon the 137Cs/60Co ratio in each column, the recommended 60Co or 137Cs scaling factor for 99Tc is applied. In each column, the actual ratio of 99Tc/key radionuclide is calculated, then values are calculated using the recommended scaling factors against the key radionuclides from the various source terms, and finally the deviation of the scaled value from the actual 99Tc/key radionuclide ratio.
Table 5-7 Various Reactor Coolant Concentration Comparisons to Recommended Scaling Factors
Figure 3-5 2012/13
(36)
GALE (29) (30) and ANSI/ANS-18.1-1984
(30) (31) (56)
ANSI/ANS-18.1-1976 (53)
DCD R4 Realistic
(54)
DCD R19 Realistic
(55)
PWR BWR PWR BWR PWR ESBWR AP1000 99Tc (from99Mo) 2.44E-12 7.16E-11 2.29E-10 7.16E-11 3.01E-09 4.65E-11 2.00E-10
99Mo 6.81E-05 2.00E-03 6.40E-03 2.00E-03 8.40E-02 1.30E-03 5.60E-03 60Co (key) 2.68E-05 4.00E-04 5.30E-04 4.00E-04 2.00E-03 1.30E-04 4.40E-04 137Cs (key) 1.21E-06 8.00E-05 9.40E-03 7.00E-05 1.80E-02 4.60E-05 7.90E-03
Radioisotope Ratios Derived from Sample Data Above 137Cs/60Co 0.05 0.20 17.7 0.2 9.0 0.4 18.0 99Tc/60Co 9.10E-08 1.79E-07 4.32E-07 1.79E-07 1.50E-06 3.58E-07 4.56E-07 99Tc/137Cs 2.02E-06 8.95E-07 2.44E-08 1.02E-06 1.67E-07 1.01E-06 2.54E-08
99Tc Activity Values Calculated Using Key Sample Data Above Applied to Recommended Scaling Factors from this Work and Resultant Scaled 99Tc Value Deviation from 99Tc in the RCS Sample Data (first row)
Calculated w/ Co SF 1.30E-06 3.48E-11 5.20E-10 6.89E-10 5.20E-10 2.60E-09 1.69E-10 5.72E-10
Co Based Deviation 14.28 7.26 3.01 7.26 0.86 3.63 2.85
Calculated w/ Cs SF 2.50E-08 3.03E-14 2.00E-12 2.35E-10 1.75E-12 4.50E-10 1.15E-12 1.98E-10
Cs Based Deviation 0.01 0.03 1.03 0.02 0.15 0.02 0.99
9923195
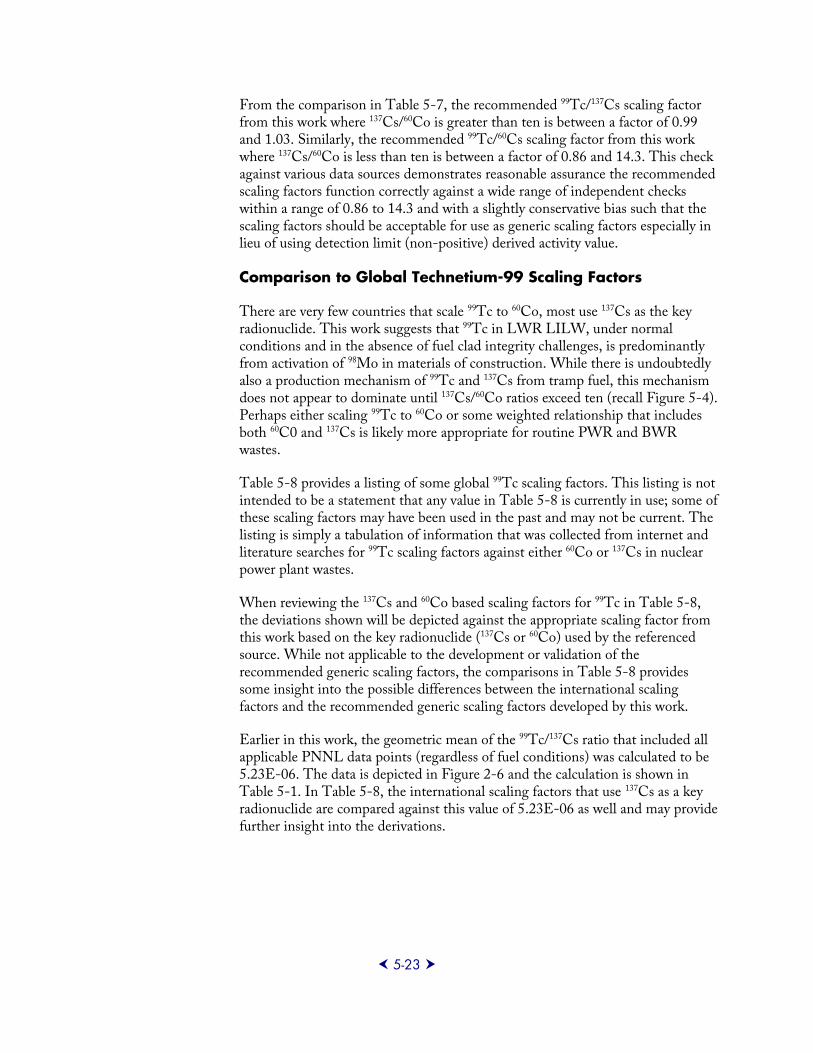
5-23
From the comparison in Table 5-7, the recommended 99Tc/137Cs scaling factor from this work where 137Cs/60Co is greater than ten is between a factor of 0.99 and 1.03. Similarly, the recommended 99Tc/60Cs scaling factor from this work where 137Cs/60Co is less than ten is between a factor of 0.86 and 14.3. This check against various data sources demonstrates reasonable assurance the recommended scaling factors function correctly against a wide range of independent checks within a range of 0.86 to 14.3 and with a slightly conservative bias such that the scaling factors should be acceptable for use as generic scaling factors especially in lieu of using detection limit (non-positive) derived activity value.
Comparison to Global Technetium-99 Scaling Factors
There are very few countries that scale 99Tc to 60Co, most use 137Cs as the key radionuclide. This work suggests that 99Tc in LWR LILW, under normal conditions and in the absence of fuel clad integrity challenges, is predominantly from activation of 98Mo in materials of construction. While there is undoubtedly also a production mechanism of 99Tc and 137Cs from tramp fuel, this mechanism does not appear to dominate until 137Cs/60Co ratios exceed ten (recall Figure 5-4). Perhaps either scaling 99Tc to 60Co or some weighted relationship that includes both 60C0 and 137Cs is likely more appropriate for routine PWR and BWR wastes.
Table 5-8 provides a listing of some global 99Tc scaling factors. This listing is not intended to be a statement that any value in Table 5-8 is currently in use; some of these scaling factors may have been used in the past and may not be current. The listing is simply a tabulation of information that was collected from internet and literature searches for 99Tc scaling factors against either 60Co or 137Cs in nuclear power plant wastes.
When reviewing the 137Cs and 60Co based scaling factors for 99Tc in Table 5-8, the deviations shown will be depicted against the appropriate scaling factor from this work based on the key radionuclide (137Cs or 60Co) used by the referenced source. While not applicable to the development or validation of the recommended generic scaling factors, the comparisons in Table 5-8 provides some insight into the possible differences between the international scaling factors and the recommended generic scaling factors developed by this work.
Earlier in this work, the geometric mean of the 99Tc/137Cs ratio that included all applicable PNNL data points (regardless of fuel conditions) was calculated to be 5.23E-06. The data is depicted in Figure 2-6 and the calculation is shown in Table 5-1. In Table 5-8, the international scaling factors that use 137Cs as a key radionuclide are compared against this value of 5.23E-06 as well and may provide further insight into the derivations.
9923195
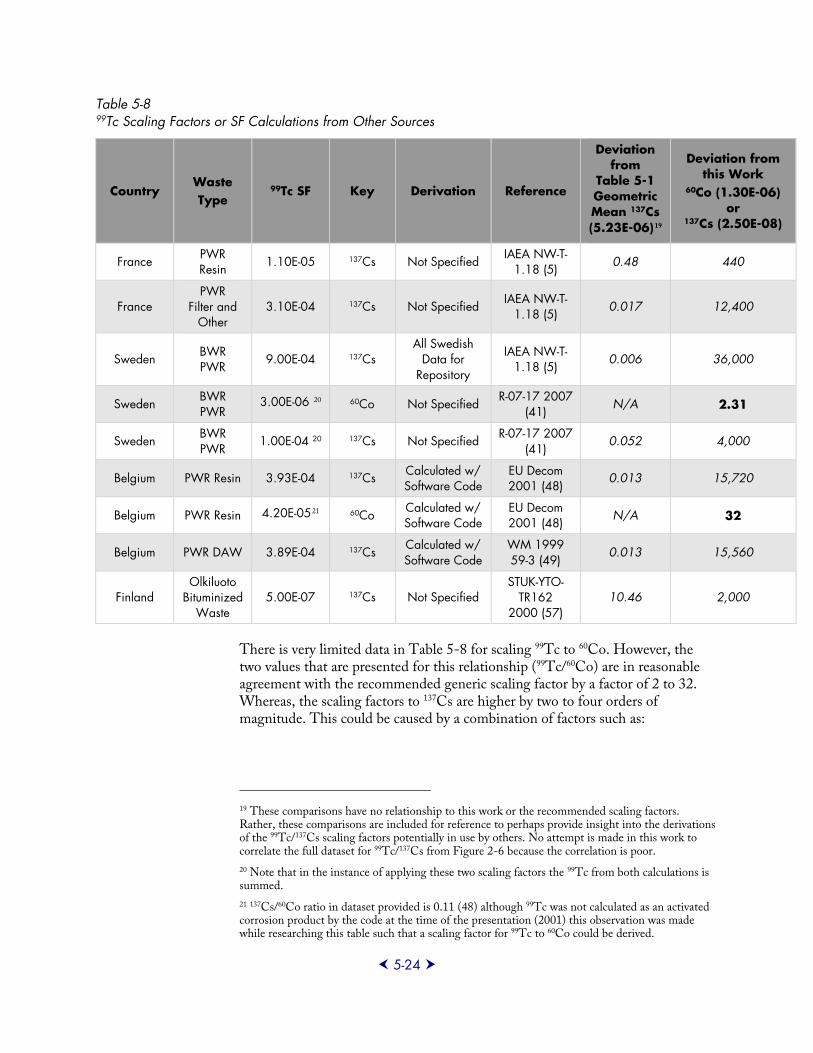
5-24
Table 5-8 99Tc Scaling Factors or SF Calculations from Other Sources
Country Waste Type
99Tc SF Key Derivation Reference
Deviation from
Table 5-1 Geometric Mean 137Cs (5.23E-06)19
Deviation from this Work
60Co (1.30E-06) or
137Cs (2.50E-08)
France PWR Resin
1.10E-05 137Cs Not Specified IAEA NW-T-1.18 (5)
0.48 440
France PWR
Filter and Other
3.10E-04 137Cs Not Specified IAEA NW-T-1.18 (5)
0.017 12,400
Sweden BWR PWR
9.00E-04 137Cs All Swedish
Data for Repository
IAEA NW-T-1.18 (5)
0.006 36,000
Sweden BWR PWR
3.00E-06 20 60Co Not Specified R-07-17 2007 (41)
N/A 2.31
Sweden BWR PWR
1.00E-04 20 137Cs Not Specified R-07-17 2007 (41)
0.052 4,000
Belgium PWR Resin 3.93E-04 137Cs Calculated w/ Software Code
EU Decom 2001 (48)
0.013 15,720
Belgium PWR Resin 4.20E-0521 60Co Calculated w/ Software Code
EU Decom 2001 (48)
N/A 32
Belgium PWR DAW 3.89E-04 137Cs Calculated w/ Software Code
WM 1999 59-3 (49)
0.013 15,560
Finland Olkiluoto
Bituminized Waste
5.00E-07 137Cs Not Specified STUK-YTO-
TR162 2000 (57)
10.46 2,000
There is very limited data in Table 5-8 for scaling 99Tc to 60Co. However, the two values that are presented for this relationship (99Tc/60Co) are in reasonable agreement with the recommended generic scaling factor by a factor of 2 to 32. Whereas, the scaling factors to 137Cs are higher by two to four orders of magnitude. This could be caused by a combination of factors such as:
19 These comparisons have no relationship to this work or the recommended scaling factors. Rather, these comparisons are included for reference to perhaps provide insight into the derivations of the 99Tc/137Cs scaling factors potentially in use by others. No attempt is made in this work to correlate the full dataset for 99Tc/137Cs from Figure 2-6 because the correlation is poor. 20 Note that in the instance of applying these two scaling factors the 99Tc from both calculations is summed. 21 137Cs/60Co ratio in dataset provided is 0.11 (48) although 99Tc was not calculated as an activated corrosion product by the code at the time of the presentation (2001) this observation was made while researching this table such that a scaling factor for 99Tc to 60Co could be derived.
9923195
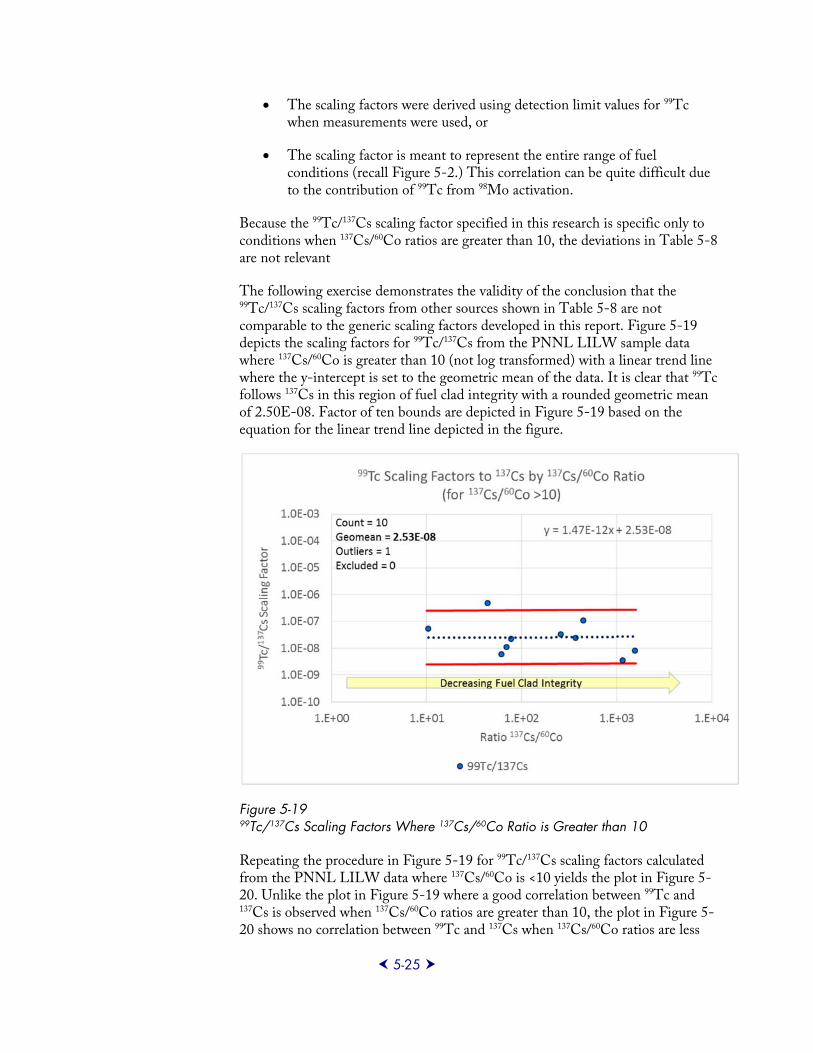
5-25
The scaling factors were derived using detection limit values for 99Tc when measurements were used, or
The scaling factor is meant to represent the entire range of fuel conditions (recall Figure 5-2.) This correlation can be quite difficult due to the contribution of 99Tc from 98Mo activation.
Because the 99Tc/137Cs scaling factor specified in this research is specific only to conditions when 137Cs/60Co ratios are greater than 10, the deviations in Table 5-8 are not relevant
The following exercise demonstrates the validity of the conclusion that the 99Tc/137Cs scaling factors from other sources shown in Table 5-8 are not comparable to the generic scaling factors developed in this report. Figure 5-19 depicts the scaling factors for 99Tc/137Cs from the PNNL LILW sample data where 137Cs/60Co is greater than 10 (not log transformed) with a linear trend line where the y-intercept is set to the geometric mean of the data. It is clear that 99Tc follows 137Cs in this region of fuel clad integrity with a rounded geometric mean of 2.50E-08. Factor of ten bounds are depicted in Figure 5-19 based on the equation for the linear trend line depicted in the figure.
Figure 5-19 99Tc/137Cs Scaling Factors Where 137Cs/60Co Ratio is Greater than 10
Repeating the procedure in Figure 5-19 for 99Tc/137Cs scaling factors calculated from the PNNL LILW data where 137Cs/60Co is <10 yields the plot in Figure 5-20. Unlike the plot in Figure 5-19 where a good correlation between 99Tc and 137Cs is observed when 137Cs/60Co ratios are greater than 10, the plot in Figure 5-20 shows no correlation between 99Tc and 137Cs when 137Cs/60Co ratios are less
9923195
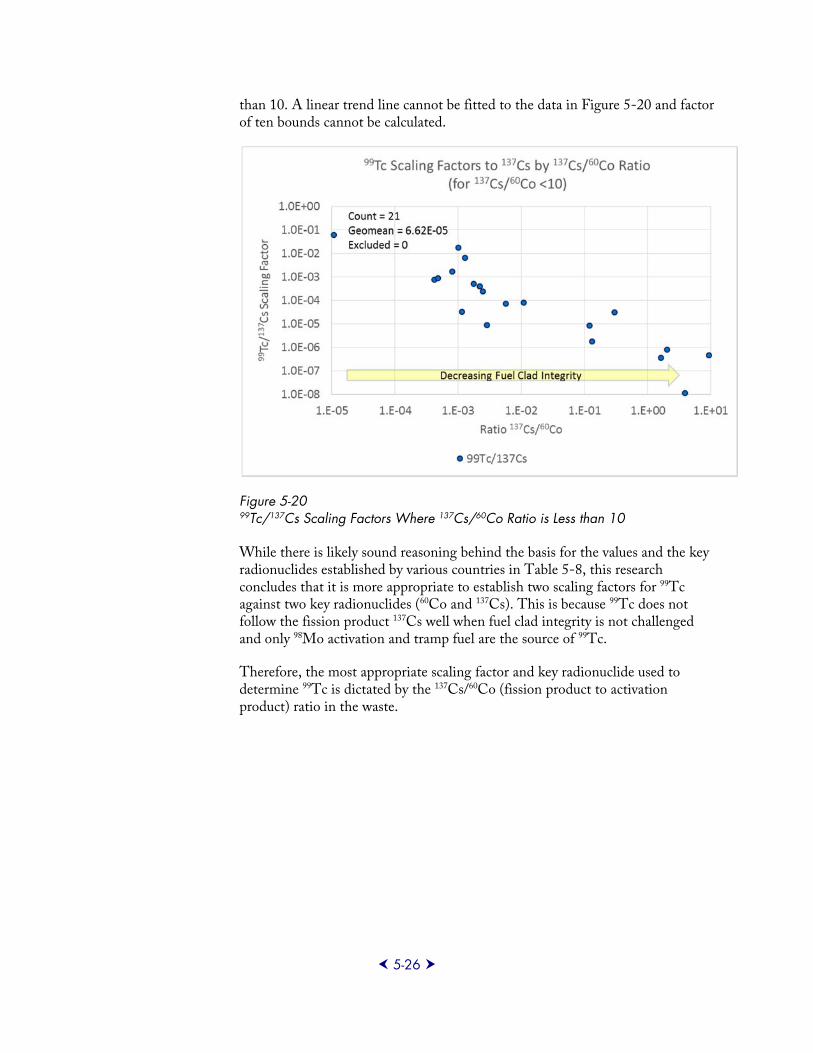
5-26
than 10. A linear trend line cannot be fitted to the data in Figure 5-20 and factor of ten bounds cannot be calculated.
Figure 5-20 99Tc/137Cs Scaling Factors Where 137Cs/60Co Ratio is Less than 10
While there is likely sound reasoning behind the basis for the values and the key radionuclides established by various countries in Table 5-8, this research concludes that it is more appropriate to establish two scaling factors for 99Tc against two key radionuclides (60Co and 137Cs). This is because 99Tc does not follow the fission product 137Cs well when fuel clad integrity is not challenged and only 98Mo activation and tramp fuel are the source of 99Tc.
Therefore, the most appropriate scaling factor and key radionuclide used to determine 99Tc is dictated by the 137Cs/60Co (fission product to activation product) ratio in the waste.
9923195
6-1
Section 6: Determining Iodine-129 When Cesium-137 Is Not Detected in LILW Samples
Today, with the progress in improving fuel clad integrity, it is common for LILW samples not to exhibit detectable 137Cs activity. This is especially true for dry wastes and filters that do not concentrate soluble radionuclides such as 137Cs. This work has concluded that there is no correlation between 60Co and 129I and thus far the only scaling factor provided for 129I is against the key radionuclide 137Cs. While it could be appropriate to conclude 129I is not present (or not present in quantities of concern) if 137Cs is not present, some regulatory processes may not accept this conclusion. Therefore, a reasonable yet conservative scaling factor for 129I to 60Co is developed for use when 137Cs is not detected, regardless of lack correlation in the data.
As depicted in Figure 2-4, a relationship between 129I and 60Co in the PNNL LILW sample data does not exist. Even in log space, the dispersion at 1σ is 67. An actual dispersion plot of the log transformed sample data for 129I/60Co is not presented elsewhere in this report because of this lack of fit. Similarly, in Figures 5-4 and 5-5, it has been shown that there is no correlation between measured fission products, 129I and 99Tc, even when a correlation would be expected. It has also been demonstrated that the source of the 99Tc in the LILW samples is primarily activation of the corrosion product 98Mo and, to a lesser extent, tramp fuel fission.
When 137Cs is not detected in a waste stream, the 137Cs/60C0 ratio will, by default, be <10 (zero). In this instance, the 99Tc activity in the waste stream is primarily from activation of 98Mo. This method to scale 129I to 60Co in the absence of 137Cs looks at the relationship between 99Tc and 129I originating from fission. The method makes the bounding, conservative assumption that, even though the 99Tc scaled to 60Co primarily originates from activation, for the purposes of developing a 129I/60Co scaling factor, the 99Tc in the waste is originates from fission of tramp fuel.
The ratio of 129I/99Tc from the ORIGEN2 (20) model used elsewhere in this work ranges between 1.80E-03 and 2.83E-03 for burnup between 5 and 70 MWD/MT. This relationship is not adjusted for gap release fractions from Table 3-1. This is because the 129I and 99Tc in this case is assumed to be from
9923195
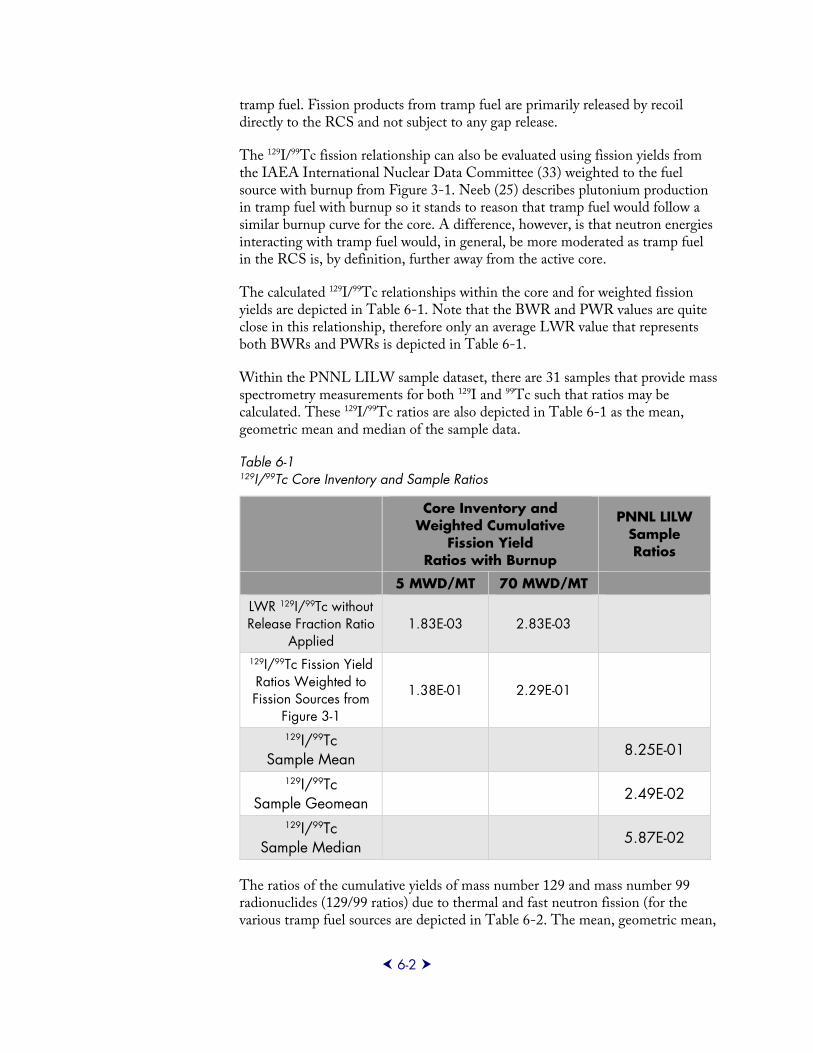
6-2
tramp fuel. Fission products from tramp fuel are primarily released by recoil directly to the RCS and not subject to any gap release.
The 129I/99Tc fission relationship can also be evaluated using fission yields from the IAEA International Nuclear Data Committee (33) weighted to the fuel source with burnup from Figure 3-1. Neeb (25) describes plutonium production in tramp fuel with burnup so it stands to reason that tramp fuel would follow a similar burnup curve for the core. A difference, however, is that neutron energies interacting with tramp fuel would, in general, be more moderated as tramp fuel in the RCS is, by definition, further away from the active core.
The calculated 129I/99Tc relationships within the core and for weighted fission yields are depicted in Table 6-1. Note that the BWR and PWR values are quite close in this relationship, therefore only an average LWR value that represents both BWRs and PWRs is depicted in Table 6-1.
Within the PNNL LILW sample dataset, there are 31 samples that provide mass spectrometry measurements for both 129I and 99Tc such that ratios may be calculated. These 129I/99Tc ratios are also depicted in Table 6-1 as the mean, geometric mean and median of the sample data.
Table 6-1 129I/99Tc Core Inventory and Sample Ratios
Core Inventory and Weighted Cumulative
Fission Yield Ratios with Burnup
PNNL LILW Sample Ratios
5 MWD/MT 70 MWD/MT
LWR 129I/99Tc without Release Fraction Ratio
Applied 1.83E-03 2.83E-03
129I/99Tc Fission Yield Ratios Weighted to Fission Sources from
Figure 3-1
1.38E-01 2.29E-01
129I/99Tc Sample Mean
8.25E-01
129I/99Tc Sample Geomean
2.49E-02
129I/99Tc Sample Median
5.87E-02
The ratios of the cumulative yields of mass number 129 and mass number 99 radionuclides (129/99 ratios) due to thermal and fast neutron fission (for the various tramp fuel sources are depicted in Table 6-2. The mean, geometric mean,
9923195
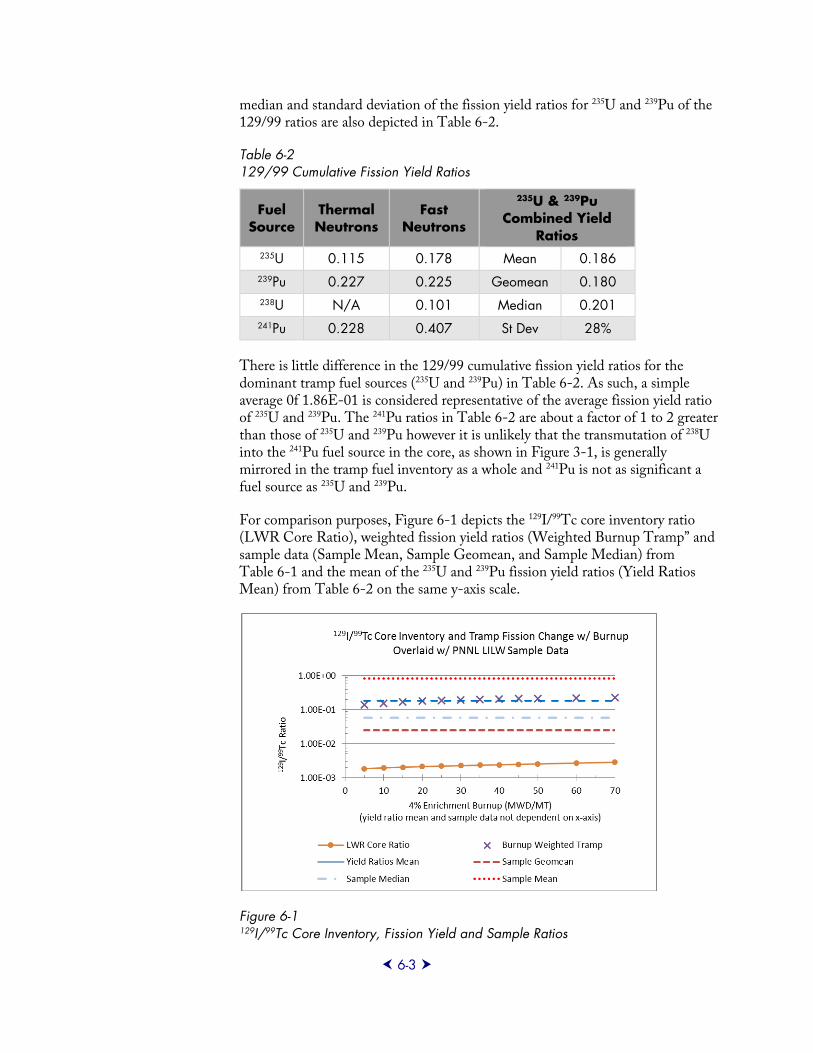
6-3
median and standard deviation of the fission yield ratios for 235U and 239Pu of the 129/99 ratios are also depicted in Table 6-2.
Table 6-2 129/99 Cumulative Fission Yield Ratios
Fuel Source
Thermal Neutrons
Fast Neutrons
235U & 239Pu Combined Yield
Ratios 235U 0.115 0.178 Mean 0.186 239Pu 0.227 0.225 Geomean 0.180 238U N/A 0.101 Median 0.201 241Pu 0.228 0.407 St Dev 28%
There is little difference in the 129/99 cumulative fission yield ratios for the dominant tramp fuel sources (235U and 239Pu) in Table 6-2. As such, a simple average 0f 1.86E-01 is considered representative of the average fission yield ratio of 235U and 239Pu. The 241Pu ratios in Table 6-2 are about a factor of 1 to 2 greater than those of 235U and 239Pu however it is unlikely that the transmutation of 238U into the 241Pu fuel source in the core, as shown in Figure 3-1, is generally mirrored in the tramp fuel inventory as a whole and 241Pu is not as significant a fuel source as 235U and 239Pu.
For comparison purposes, Figure 6-1 depicts the 129I/99Tc core inventory ratio (LWR Core Ratio), weighted fission yield ratios (Weighted Burnup Tramp” and sample data (Sample Mean, Sample Geomean, and Sample Median) from Table 6-1 and the mean of the 235U and 239Pu fission yield ratios (Yield Ratios Mean) from Table 6-2 on the same y-axis scale.
Figure 6-1 129I/99Tc Core Inventory, Fission Yield and Sample Ratios
9923195
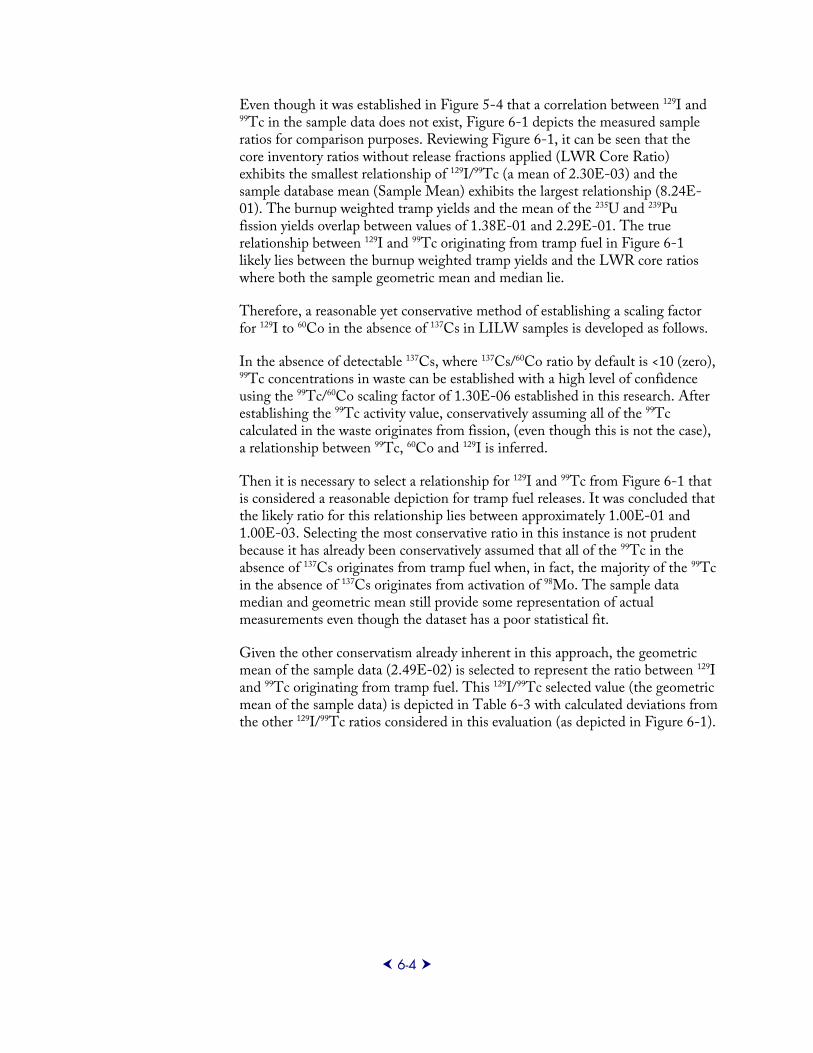
6-4
Even though it was established in Figure 5-4 that a correlation between 129I and 99Tc in the sample data does not exist, Figure 6-1 depicts the measured sample ratios for comparison purposes. Reviewing Figure 6-1, it can be seen that the core inventory ratios without release fractions applied (LWR Core Ratio) exhibits the smallest relationship of 129I/99Tc (a mean of 2.30E-03) and the sample database mean (Sample Mean) exhibits the largest relationship (8.24E-01). The burnup weighted tramp yields and the mean of the 235U and 239Pu fission yields overlap between values of 1.38E-01 and 2.29E-01. The true relationship between 129I and 99Tc originating from tramp fuel in Figure 6-1 likely lies between the burnup weighted tramp yields and the LWR core ratios where both the sample geometric mean and median lie.
Therefore, a reasonable yet conservative method of establishing a scaling factor for 129I to 60Co in the absence of 137Cs in LILW samples is developed as follows.
In the absence of detectable 137Cs, where 137Cs/60Co ratio by default is <10 (zero), 99Tc concentrations in waste can be established with a high level of confidence using the 99Tc/60Co scaling factor of 1.30E-06 established in this research. After establishing the 99Tc activity value, conservatively assuming all of the 99Tc calculated in the waste originates from fission, (even though this is not the case), a relationship between 99Tc, 60Co and 129I is inferred.
Then it is necessary to select a relationship for 129I and 99Tc from Figure 6-1 that is considered a reasonable depiction for tramp fuel releases. It was concluded that the likely ratio for this relationship lies between approximately 1.00E-01 and 1.00E-03. Selecting the most conservative ratio in this instance is not prudent because it has already been conservatively assumed that all of the 99Tc in the absence of 137Cs originates from tramp fuel when, in fact, the majority of the 99Tc in the absence of 137Cs originates from activation of 98Mo. The sample data median and geometric mean still provide some representation of actual measurements even though the dataset has a poor statistical fit.
Given the other conservatism already inherent in this approach, the geometric mean of the sample data (2.49E-02) is selected to represent the ratio between 129I and 99Tc originating from tramp fuel. This 129I/99Tc selected value (the geometric mean of the sample data) is depicted in Table 6-3 with calculated deviations from the other 129I/99Tc ratios considered in this evaluation (as depicted in Figure 6-1).
9923195
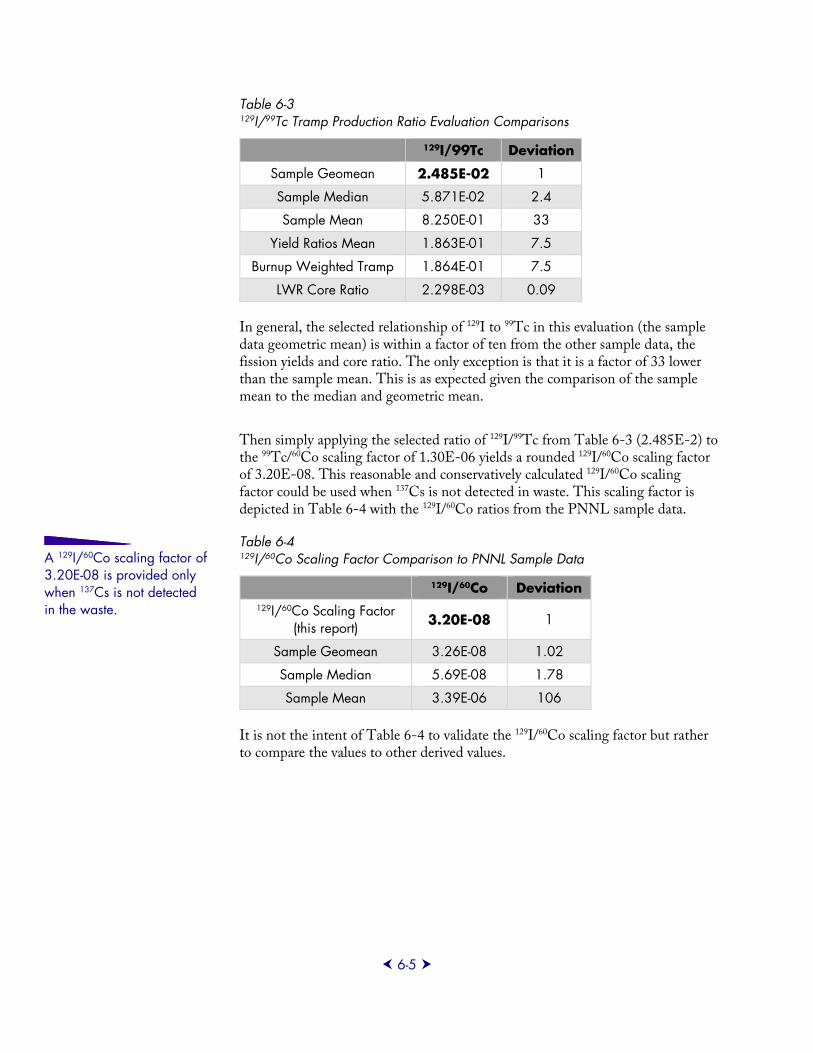
6-5
Table 6-3 129I/99Tc Tramp Production Ratio Evaluation Comparisons
129I/99Tc Deviation
Sample Geomean 2.485E-02 1
Sample Median 5.871E-02 2.4
Sample Mean 8.250E-01 33
Yield Ratios Mean 1.863E-01 7.5
Burnup Weighted Tramp 1.864E-01 7.5
LWR Core Ratio 2.298E-03 0.09
In general, the selected relationship of 129I to 99Tc in this evaluation (the sample data geometric mean) is within a factor of ten from the other sample data, the fission yields and core ratio. The only exception is that it is a factor of 33 lower than the sample mean. This is as expected given the comparison of the sample mean to the median and geometric mean.
Then simply applying the selected ratio of 129I/99Tc from Table 6-3 (2.485E-2) to the 99Tc/60Co scaling factor of 1.30E-06 yields a rounded 129I/60Co scaling factor of 3.20E-08. This reasonable and conservatively calculated 129I/60Co scaling factor could be used when 137Cs is not detected in waste. This scaling factor is depicted in Table 6-4 with the 129I/60Co ratios from the PNNL sample data.
Table 6-4 129I/60Co Scaling Factor Comparison to PNNL Sample Data
129I/60Co Deviation 129I/60Co Scaling Factor
(this report) 3.20E-08 1
Sample Geomean 3.26E-08 1.02
Sample Median 5.69E-08 1.78
Sample Mean 3.39E-06 106
It is not the intent of Table 6-4 to validate the 129I/60Co scaling factor but rather to compare the values to other derived values.
A 129I/60Co scaling factor of 3.20E-08 is provided only when 137Cs is not detected in the waste.
9923195
6-6
In conclusion, this research proposes a reasonably derived 129I/60Co scaling factor of 3.20E-08 when 137Cs is not detected. This scaling factor is considered conservative because it is based on the relationship between 99Tc/60Co and the assumption that all 99Tc present in the waste originated from fission when, in fact in the absence of 137Cs, it primarily originates from 98Mo activation.
Therefore, when 137Cs is not detected in LILW samples and a 129I scaling factor to 60Co is desired, a value of 3.20E-08 could be used with a high level of confidence that it will conservatively, yet reasonably, estimate the 129I activity present in the waste. It could also be concluded that if 137Cs is not present in waste then 129I is not present either.
9923195
7-1
Section 7: Software Codes Over the past several decades, software codes have been developed that provide some functionality for calculating 99Tc and 129I in LILW. Some are, at least in part, based on RCS sample activity (26) (39) whereas others are based only on calculations. (48) (49) This software discussion is not version specific and may not reflect the latest version of the software or whether the software is even currently used. It is not the intent of this research to compare the generic scaling factors determined within the output of various software packages. Rather a small summary of each software code is provided based on internet and literature searches.
What is relevant from this software discussion to this research are some of the assumptions or inputs that are used in the various software packages. For example, some of the codes use ORIGEN2 (20) for determining radionuclide ratios at assumed burnups similar to the methodology used in validating the empirically derived scaling factors in this work. The codes also use RCS sample data for projecting the release of radionuclides such as 129I. While this work doesn’t use significant individual plant RCS sample data, it does rely on design RCS source terms for validating the empirically derived scaling factors. Interestingly, from what has been found, none of the codes rely on 99Mo (or 99mTc) steady state RCS concentrations for inferring 99Tc in the RCS. This research has shown that the progeny (99Tc) can be directly determined from 99Mo.
EPRI RADSOURCE
EPRI RADSOURCE (26) was developed in 1992 and the technical manual is a good reference for the behavior of several HTM radionuclides. Several of the mass spectroscopy measurements used in the scaling factor development of this research were originally used to validate the RADSOURCE code.
Given some plant specific inputs, RADSOURCE uses RCS sample activity to develop scaling factors for use in LILW characterization. The code made several assumptions (17) such as:
Fission product ratios from typical tramp burn-up at 700 effective fuel power days using the ORIGEN2 model,
Similar release mechanisms of 129I and 137Cs for determining 129I,
9923195
7-2
Release rates for 90Sr, 99Tc and transuranic radionuclides (TRU) are proportional to their inventories in tramp fuel, and
Activated corrosion product scaling factors that are based on well verified values.
One caution of using RADSOURCE is that this code derives the scaling factor for steady state RCS operation. The user must decay correct that scaling factor to the time when the waste was characterized.
3R-STAT
3R-STAT was designed to calculate the release of 99Tc and 129I in the RCS over a given period of time using RCS sample activity for the radioiodine species. The assumption was that once released, the 99Tc and 129I will end up in the waste produced during the same time period. (17) 3R-STAT did not calculate scaling factors and required a separate mechanism for equating the activity release in the RCS to the activity in the waste (e.g., mCi/fuel cycle).
3R-STAT received a technical review and approval letter from the USNRC. (39) The code has been obtained by DW James Consulting.
PROFIP
The PROFIF code was developed by Commissariat à l'Energie Atomique Electricité de France (CEA) to calculate the quantity and balance of fission products and actinides in the primary circuit of French PWRs. (58) The code used RCS measurements of Kr, Xe, I and Cs species as inputs to the calculations. A 1998 study of the code (40) concluded that relative to 129I/137Cs:
129I exhibited a similar behavior to 137Cs,
Scaling factors for 129I to 137Cs were similar for both defective fuel and tramp fuel, and
Scaling factors for 129I to 137Cs were similar for steady state operations and transients.
PACTOLE
The PACTOLE code was developed by Commissariat à l'Energie Atomique Electricité de France (CEA) to calculate the quantity and balance of activation products in the primary circuit of French PWRs. (58) The code used RCS measurements of Co, Fe, Mn, Ag, and Sb species as inputs to the calculations. The code has advanced to predicting radiation fields in the plant with reasonable agreement. (25)
9923195
7-3
LLWAA
The LLWAA code was developed by Tractebel Energy Engineering for the Belgian utility Electrabel to calculate the inventories and/or scaling factors in LILW. (49) The code used RCS measurements of Co, Cs, I, and Cl- species as inputs to the calculations. Core inventories are derived using ORIGEN2. (20) Other code operating parameters such as mass, flow rates and clean-up efficiencies are specific to the plant design.
9923195

9923195
8-1
Section 8: Additional Considerations Elemental and Chemistry Considerations
The solubility and ionic characteristics of radionuclides influence their capture on filters and ion exchange resins. Cesium and iodine are typically predominantly soluble whereas cobalt and technetium can be soluble or insoluble. (5) Cesium and cobalt typically form cations whereas iodine and technetium typically form anions. These similarities and differences have been the subject of much discussion around the possible behavior of these elements as they are trapped or accumulate (primarily on filters and ion exchange resins) in LILW. For example, when scaling iodine to cesium both elements are primarily soluble so they will accumulate less on filters and more on resin. Neeb (25) concluded that iodine present in filters was likely caused by adsorption of soluble iodine onto oxides or onto the filter material rather than from insoluble iodine compounds. Similarly, Neeb (25) concluded that cesium detected in filters is likely attached by occlusion or adsorption at the surfaces of other solids.
Iodine is predominantly present as an anion (I-) and cesium is predominantly present as a cation (Cs+). (25) The ion exchange resins used for performing the bulk of primary purification, and the resin that accumulates the most activity, in both PWRs and BWRs, is normally a stoichiometric (1:1 equivalents/liter or eq/l) mixed bed. Infrequently, mixed beds may also contain less anion capacity than cation capacity if ordered specially. This is typically done to reduce waste volumes because most radioactive species are cations. As such, in general, more cation capacity allows for longer run times. Some pure cation resins may be used in radwaste processing in BWRs and PWRs or for de-lithiating the RCS in PWRs. Similarly, some pure anion resins are used for deborating the RCS in PWRs late in core life as opposed to using large dilution volumes. Pure anion resins may also be used in radwaste for removal of iodine and antimony. All of these resins typically get mixed together in spent resin tanks and/or spent resin disposal containers. Best and Miller came to a similar conclusion that with dominant use of mixed bed resin, both anion and cationic species of radionuclides would be removed and present in the waste. (14)
Iodine-129/Cesium-137 Behavior
The PNNL sample data has sufficient granularity to present some filter versus resin and resin depleted in anion capacity (Shutdown Bed) versus all resin comparisons for 129I/137Cs. These comparisons are depicted in Table 8-1.
9923195
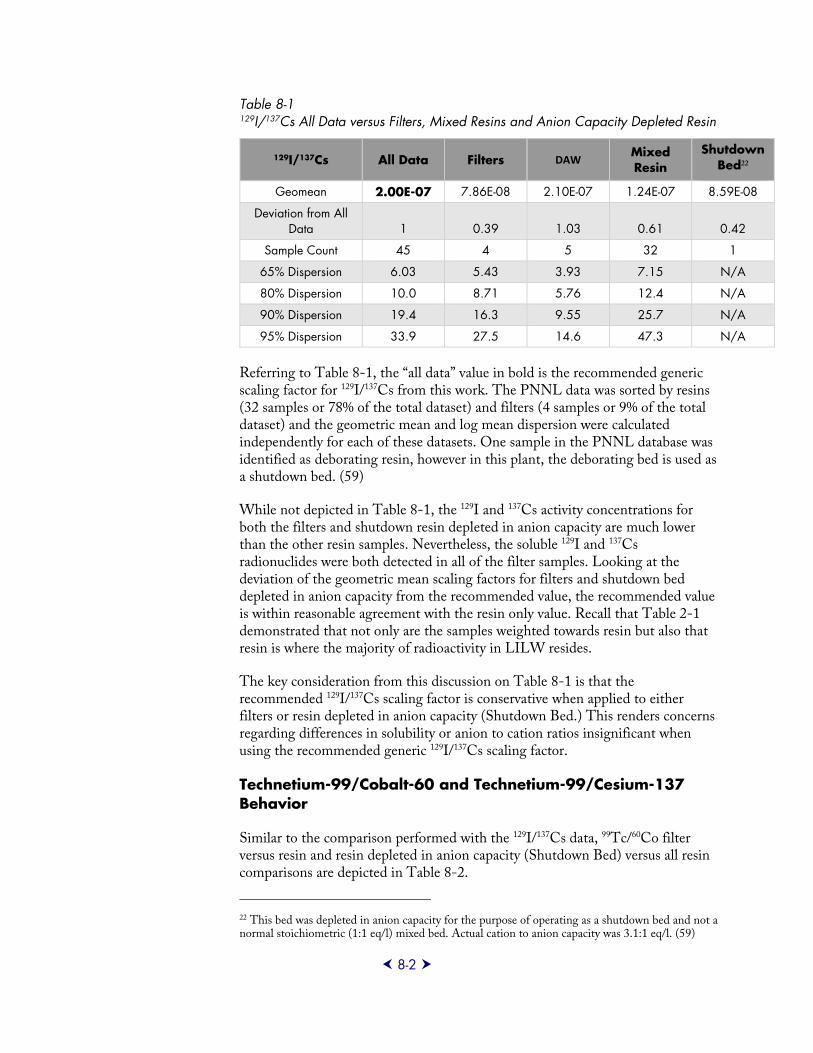
8-2
Table 8-1 129I/137Cs All Data versus Filters, Mixed Resins and Anion Capacity Depleted Resin
129I/137Cs All Data Filters DAW Mixed Resin
Shutdown Bed22
Geomean 2.00E-07 7.86E-08 2.10E-07 1.24E-07 8.59E-08
Deviation from All Data 1 0.39 1.03 0.61 0.42
Sample Count 45 4 5 32 1
65% Dispersion 6.03 5.43 3.93 7.15 N/A
80% Dispersion 10.0 8.71 5.76 12.4 N/A
90% Dispersion 19.4 16.3 9.55 25.7 N/A
95% Dispersion 33.9 27.5 14.6 47.3 N/A
Referring to Table 8-1, the “all data” value in bold is the recommended generic scaling factor for 129I/137Cs from this work. The PNNL data was sorted by resins (32 samples or 78% of the total dataset) and filters (4 samples or 9% of the total dataset) and the geometric mean and log mean dispersion were calculated independently for each of these datasets. One sample in the PNNL database was identified as deborating resin, however in this plant, the deborating bed is used as a shutdown bed. (59)
While not depicted in Table 8-1, the 129I and 137Cs activity concentrations for both the filters and shutdown resin depleted in anion capacity are much lower than the other resin samples. Nevertheless, the soluble 129I and 137Cs radionuclides were both detected in all of the filter samples. Looking at the deviation of the geometric mean scaling factors for filters and shutdown bed depleted in anion capacity from the recommended value, the recommended value is within reasonable agreement with the resin only value. Recall that Table 2-1 demonstrated that not only are the samples weighted towards resin but also that resin is where the majority of radioactivity in LILW resides.
The key consideration from this discussion on Table 8-1 is that the recommended 129I/137Cs scaling factor is conservative when applied to either filters or resin depleted in anion capacity (Shutdown Bed.) This renders concerns regarding differences in solubility or anion to cation ratios insignificant when using the recommended generic 129I/137Cs scaling factor.
Technetium-99/Cobalt-60 and Technetium-99/Cesium-137 Behavior
Similar to the comparison performed with the 129I/137Cs data, 99Tc/60Co filter versus resin and resin depleted in anion capacity (Shutdown Bed) versus all resin comparisons are depicted in Table 8-2.
22 This bed was depleted in anion capacity for the purpose of operating as a shutdown bed and not a normal stoichiometric (1:1 eq/l) mixed bed. Actual cation to anion capacity was 3.1:1 eq/l. (59)
9923195
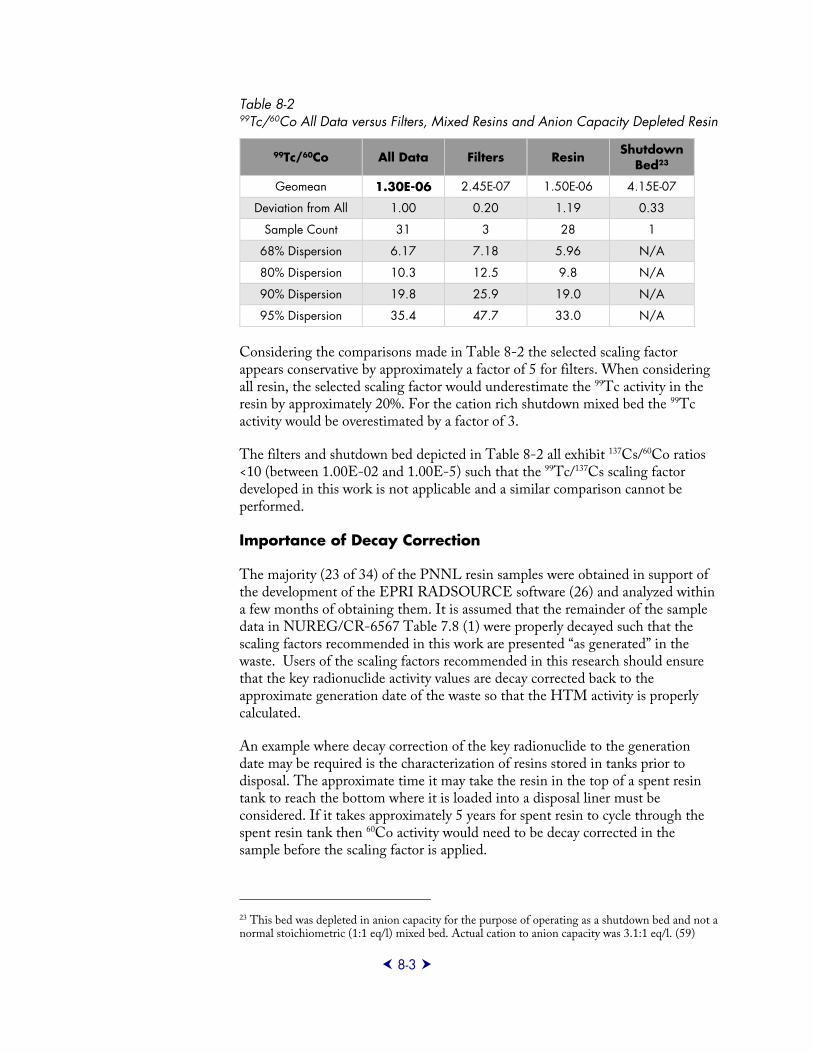
8-3
Table 8-2 99Tc/60Co All Data versus Filters, Mixed Resins and Anion Capacity Depleted Resin
99Tc/60Co All Data Filters Resin Shutdown
Bed23
Geomean 1.30E-06 2.45E-07 1.50E-06 4.15E-07
Deviation from All 1.00 0.20 1.19 0.33
Sample Count 31 3 28 1
68% Dispersion 6.17 7.18 5.96 N/A
80% Dispersion 10.3 12.5 9.8 N/A
90% Dispersion 19.8 25.9 19.0 N/A
95% Dispersion 35.4 47.7 33.0 N/A
Considering the comparisons made in Table 8-2 the selected scaling factor appears conservative by approximately a factor of 5 for filters. When considering all resin, the selected scaling factor would underestimate the 99Tc activity in the resin by approximately 20%. For the cation rich shutdown mixed bed the 99Tc activity would be overestimated by a factor of 3.
The filters and shutdown bed depicted in Table 8-2 all exhibit 137Cs/60Co ratios <10 (between 1.00E-02 and 1.00E-5) such that the 99Tc/137Cs scaling factor developed in this work is not applicable and a similar comparison cannot be performed.
Importance of Decay Correction
The majority (23 of 34) of the PNNL resin samples were obtained in support of the development of the EPRI RADSOURCE software (26) and analyzed within a few months of obtaining them. It is assumed that the remainder of the sample data in NUREG/CR-6567 Table 7.8 (1) were properly decayed such that the scaling factors recommended in this work are presented “as generated” in the waste. Users of the scaling factors recommended in this research should ensure that the key radionuclide activity values are decay corrected back to the approximate generation date of the waste so that the HTM activity is properly calculated.
An example where decay correction of the key radionuclide to the generation date may be required is the characterization of resins stored in tanks prior to disposal. The approximate time it may take the resin in the top of a spent resin tank to reach the bottom where it is loaded into a disposal liner must be considered. If it takes approximately 5 years for spent resin to cycle through the spent resin tank then 60Co activity would need to be decay corrected in the sample before the scaling factor is applied.
23 This bed was depleted in anion capacity for the purpose of operating as a shutdown bed and not a normal stoichiometric (1:1 eq/l) mixed bed. Actual cation to anion capacity was 3.1:1 eq/l. (59)
9923195
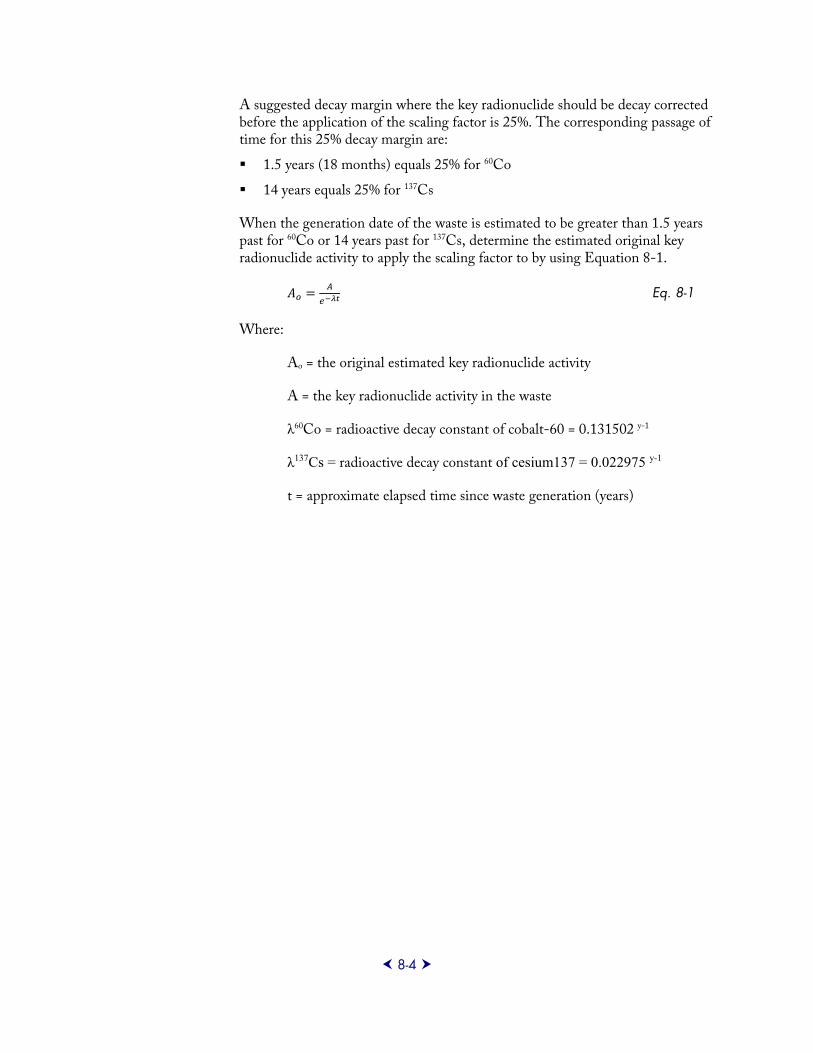
8-4
A suggested decay margin where the key radionuclide should be decay corrected before the application of the scaling factor is 25%. The corresponding passage of time for this 25% decay margin are:
1.5 years (18 months) equals 25% for 60Co
14 years equals 25% for 137Cs
When the generation date of the waste is estimated to be greater than 1.5 years past for 60Co or 14 years past for 137Cs, determine the estimated original key radionuclide activity to apply the scaling factor to by using Equation 8-1.
Eq. 8-1
Where:
Ao = the original estimated key radionuclide activity
A = the key radionuclide activity in the waste
λ60Co = radioactive decay constant of cobalt-60 = 0.131502 y-1
λ137Cs = radioactive decay constant of cesium137 = 0.022975 y-1
t = approximate elapsed time since waste generation (years)
9923195
9-1
Section 9: Summary of and Compatibility with Other EPRI Guidance
Historical EPRI Research Associated with LILW Scaling Factors
EPRI sponsored a significant scaling factor research effort for over 20 years between 1976 and 1999 and this section provides a brief summary of the results of those research efforts. Historical research results are largely consistent to this current research in regards to99Tc and 129I. Specifically, both historical research and current research agree that:
Reliable scaling factors for 99Tc and 129I should be obtained from mass spectrometry measurements.
Detection limit derived activity values should not be used for determining scaling factors.
In all but one of these historical reports, constant scaling factors for 99Tc and 129I were never recommended. This is not because they were not plausible but rather because the measurement data was considered not reliable and biased by the limitations of the measurement methods. Only TR-100740 (60) recommended constant scaling factors for 99Tc and 129I in dry active waste (DAW) and those values are superseded by the values provided in this current report.
NP-1494, Activity Levels of Transuranic Nuclides in Low-level Solid Waste for U.S Power Reactors (1980) (61)
As the title suggests this study primarily focused on attempting to correlate transuranic nuclides. There was some success in the correlation of transuranic nuclides to cerium-144 (144Ce.) The sum of 239Pu and 240Pu had the best correlation to 144Ce.
This report also reviewed pure beta emitters and some other easily measured fission and activation products, but did not specifically recommend any 99Tc or 129I scaling factors.
NP-2734, Solid Radwaste Radionuclide Measurements (1982) (62)
Reviewed assay methodology, identified common waste materials and geometries, observed sampling techniques, counting schemes, instruments and calculations.
9923195
9-2
15 nuclear power plant units were involved in this review
“Many” units at the time did dose rate to activity calculations to comply with shipping regulations. The research documented in NP-2734 was a gap analysis reviewing the impact of 10 CFR Part 61 implementation and what new analyses and/or methods might be required to quantify 3H, 14C, 59Ni, 63Ni, 60Co, 94Nb, 90Sr, 99Tc, 129I, 137Cs and transuranics radionuclides in waste.
Reviewed the correlation work from NP-1494 for transuranics.
NP-2734 did not specifically recommend any 99Tc or 129I scaling factors.
NP-4037, Radionuclides in Low-Level RadWaste 1985 (14)
This report evaluated the methods for collection of samples from two (2) PWRs and two (2) BWRs with 680 waste analyses. The results of these analyses were used to determine a scaling-factor approach and methodology that quantifies HTM radionuclides. The best data fitting results were obtained with the transuranic radionuclides and 63Ni.
Source terms were derived from the actual sample results, the application ORIGEN2 (20) for the fission product inventory, and American Nuclear Society (ANS) 18.1, revision 1, (56) for corrosion products.
Noted that 99Tc and 129I never play an active role in waste classification as compared to 137Cs, 63Ni, and/or transuranic radionuclides.
Provided various tables of scaling factors that included 137Cs/99Tc and 137Cs/129I. The scaling factors were derived based on radiochemical analysis results. The scaling factors did not fit well to the data and there were no specific recommendations for how to implement them.
NP-5077, Updated Scaling Factors in Low-level Radwaste 1987 (4)
Provided the technical basis for establishing industry wide scaling factors that related to the difficult-to-measure nuclides in waste streams for some radionuclides, specifically the transuranics and 63Ni.
Doubled the size of the EPRI sponsored off-site analysis of and database for LILW samples to ~1300. The results were documented in Appendix A of NP-5077.
Noted potential issues with the analysis of some nuclides (14C, 129I, and 99Tc, in particular) as nuclear power plant units reported values as positive when in fact they were probably at the detection limit or not detected.
9923195
9-3
NP-5677, Below Regulatory Concern Owners Group: Radionuclide Characterization of Potential BRC Waste Types from Nuclear Power Stations 1989 (63)
Work performed by Batelle, Pacific Northwest National Laboratories to do a detailed study of the radiological characterization of low activity radioactive waste that included the use of mass spectrometry.
The project collected 558 samples from 9 PWRs and 7 BWRs representing four waste types: dry active waste, oil, soil and secondary ion-exchange resins.
The report noted that the variability of radionuclide compositions for all waste types was sufficiently small to justify the use of a single, conservative radionuclide composition in waste generated at LWRs.
This report reviewed 58Co, 60Co, 137Cs, 134Cs, manganese-54 (54Mn), zirconium-95 (95Zr), niobium-95 (95Nb), ruthenuim-116 (116Ru), antimony-125 (125Sb), some zinc-65 (65Zn), silver-110m (110mAg), 144Ce, 14C, 55Fe, 90Sr, 129I, 238Pu, 239Pu, and 240Pu, but focused on a few specific nuclides. The report did not focus on 3H or 99Tc because it was believed, at the time, that the NP-5077 database was sufficient.
In order to evaluate the 129I, the higher activity samples were separated out for analysis of 129I.
A description of how the samples were prepared for mass spectrometry is captured in NP-5677.
Table 6-9 captures the DAW Scaling Factors. This table does not include a scaling factor for 99Tc. (Also, in this table, the values used to derive the scaling factors related to 14C and 129I included LLD values).
Of the samples, 23 14C and 11 129I analysis showed values less than LLD. They separated out 5 high activity samples and reanalyzed. These results were reported in Table 6-10 so that more accurate scaling factors could be derived for 129I
Table 6-11 compares the previous work to this new work (NP-5677) and reports that all of the scaling factors in this NP-5677 were lower than the industry reference (NP-5077) with the exception of the 90Sr/137Cs
The 129I scaling factors determined by mass spectrometry analysis results were ~10,000 times lower than NP-5077 because NP-5077 used or referenced LLD values. These LLD values are orders of magnitude higher. An interesting observation related to the improved scaling factor was the ratio was much closer to the actual core inventory model.
The scaling factors are all captured in the Tables in Chapter 7 of NP-5677.
TR-100740, Generic Scaling Factors for Dry Active Waste, 1992 (60)
This objective of this project was to evaluate existing measurement data from the sampling of actual DAW and review and provide generic scaling factor recommendations for PWRs and BWRs. The project compared the previous
9923195
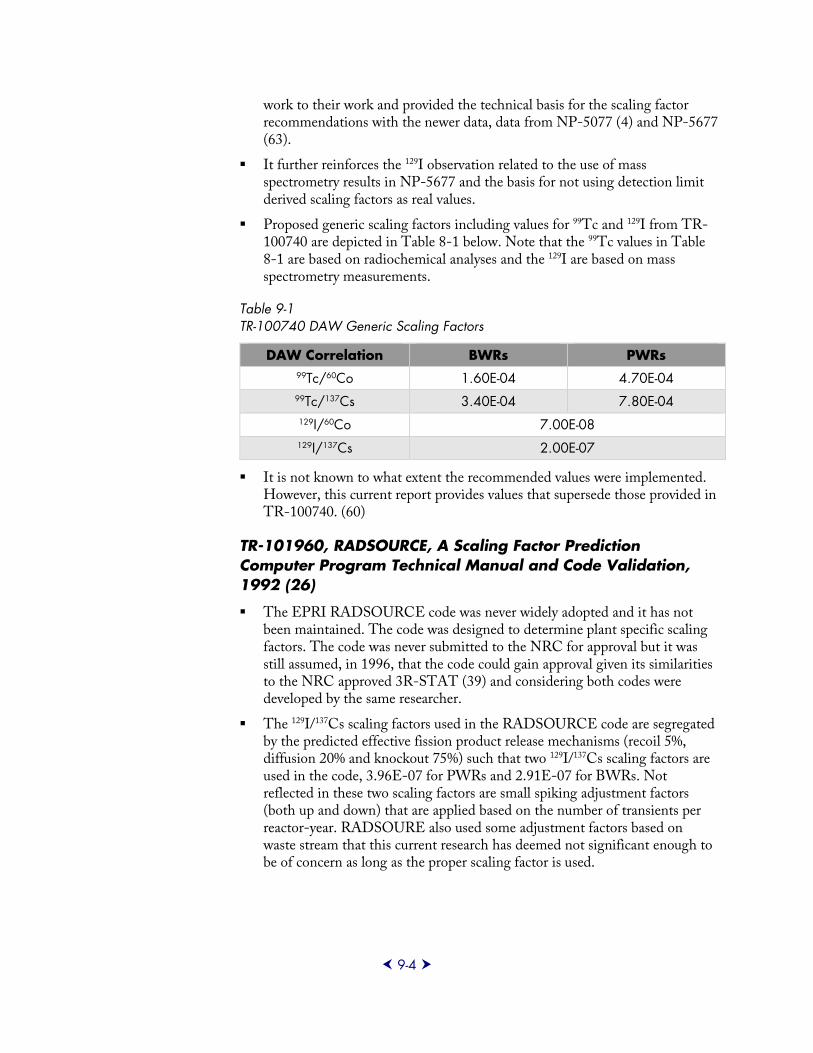
9-4
work to their work and provided the technical basis for the scaling factor recommendations with the newer data, data from NP-5077 (4) and NP-5677 (63).
It further reinforces the 129I observation related to the use of mass spectrometry results in NP-5677 and the basis for not using detection limit derived scaling factors as real values.
Proposed generic scaling factors including values for 99Tc and 129I from TR-100740 are depicted in Table 8-1 below. Note that the 99Tc values in Table 8-1 are based on radiochemical analyses and the 129I are based on mass spectrometry measurements.
Table 9-1 TR-100740 DAW Generic Scaling Factors
DAW Correlation BWRs PWRs 99Tc/60Co 1.60E-04 4.70E-04 99Tc/137Cs 3.40E-04 7.80E-04 129I/60Co 7.00E-08 129I/137Cs 2.00E-07
It is not known to what extent the recommended values were implemented. However, this current report provides values that supersede those provided in TR-100740. (60)
TR-101960, RADSOURCE, A Scaling Factor Prediction Computer Program Technical Manual and Code Validation, 1992 (26)
The EPRI RADSOURCE code was never widely adopted and it has not been maintained. The code was designed to determine plant specific scaling factors. The code was never submitted to the NRC for approval but it was still assumed, in 1996, that the code could gain approval given its similarities to the NRC approved 3R-STAT (39) and considering both codes were developed by the same researcher.
The 129I/137Cs scaling factors used in the RADSOURCE code are segregated by the predicted effective fission product release mechanisms (recoil 5%, diffusion 20% and knockout 75%) such that two 129I/137Cs scaling factors are used in the code, 3.96E-07 for PWRs and 2.91E-07 for BWRs. Not reflected in these two scaling factors are small spiking adjustment factors (both up and down) that are applied based on the number of transients per reactor-year. RADSOURE also used some adjustment factors based on waste stream that this current research has deemed not significant enough to be of concern as long as the proper scaling factor is used.
9923195
9-5
99Tc sources in the code are assumed to originate from tramp fuel and 98Mo activation without any contribution from the fuel clad gap. This assumption is somewhat contrary to the observation in this current research where 99Tc contributions from the fuel glad gap can be significant when 137Cs/60Co ratios exceed 100 (refer to Figure 5-3).
The RADSOURCE manual remains a good reference on fission product behavior. The 99Tc and 129I mass spectrometry samples used to validate the code are included in the data used to formulate the scaling factors in this current research.
TR-107201, Low Level Waste Characterization Guidelines, 1996 (17)
Recommended mass spectrometry derived scaling factors as the more accurate alternative to using detection limit values.
TR-109448, Utility use of Constant Scaling Factors, 1999 (18)
Presented methods to develop plant specific constant scaling factors based largely on existing historical sample results and with comparisons to industry data. The objective of this project was to provide appropriate technical bases for reduction of overall sample analysis costs by reducing the number of routine analyses performed for HTM radionuclides.
Recommended use of mass spectrometry for developing scaling factors for 99Tc and 129I and discouraged the use of values for these two radionuclides based on conventional analyses because of the inherent inaccuracy.
9923195

9923195
10-1
Section 10: References 1. Robertson, D. E. et. al. NUREG/CR-6567, PNNL-11659, Low-Level
Radioactive Waste Characterization, Classification, and Assessment: Waste Streams and Neutron-Activated Metals. Washington DC : USNRC, 2000.
2. USNRC. NRC Regulatory Issue Summary 2015-02 Reporting OF H-3, C-14, Tc-99, and I-129 on the Uniform Waste Manifest. Washington : USNRC, 2015.
3. Best, W. and Miller, A. EPRI NP-4037, Radionuclide Correlation in Low-Level Radwaste. Palo Alto : EPRI, 1985.
4. Best, W. and Miller, A. NP-5077, Updated Scaling Factors in Radwaste. Palo Alto : EPRI, 1987.
5. IAEA Nuclear Energy Series No. NW-T-1.18, Determination and Use of Scaling Factors for Waste Characterization in Nuclear Power Plants. IAEA. Vienna : IAEA, 2009. IAEA Pub 1363.
6. USNRC. Branch Technical Position Papers on Radioactive Waste Classification and Waste Form . Washington DC : USNRC, 1983.
7. —. IN 86-20, Low-Level Radioactive Waste Scaling Factors 10 CFR Part 61. Washington DC : USNRC, 1986.
8. Edwards, L. ML13260A075, Letter, Lisa Edwards EPRI to Don Lowman USNRC. Project Number 0800, Revision to NUREG/BR-0204, Instructions for Completeing NRC's Uniform Low-Level Radioactive Waste Manifest. Palo Alto : s.n., 2013.
9. James, D. and Kalinowski, T. 1019222, Investigation of Low Level Radioactive Waste Disposal and Practice, Recent Experience and Current Practices . Palo Alto : EPRI, 2009.
10. Currie, L. A. NUREG/CR-4007, Lower Limit of Detection: Definition and Elaboration of a Proposed Position for radiological Effluent and Environmental Measurements. Washington DC : USNRC, 1984.
11. Knoll, G. F. Radiation Detection and Measurement, 3rd edition. Hoboken : John Wiley and Sons, 2000.
12. USNRC. NUREG/BR-0204, Instructions for Completing NRC's Uniform Low-Level Radioactive Waste Manifest. Washington DC : USNRC, 1998.
13. Scaling Factor Evolution, Session 46. James, D. W. Tucson : Waste Management Symposia, 2007.
9923195
10-2
14. Best, W. T. and Miller, A. D. NP-4037, Radionuclide Correlations in Radwaste. Palo Alto : EPRI, 1985.
15. Teledyne Brown Engineering Laboratory. Database Query of 99Tc and 129I Radiochemical Analyses. 2014.
16. James, D and Vance, J. 1016120, An Evaluation of Alternative Classification Methods for Routine Low Level Waste From the Nuclear Power Industry. Palo Alto : EPRI, 2007.
17. EPRI. TR-107201, Low Level Waste Characterization Guidelines. Palo Alto : EPRI, 1996.
18. TR-109448, Utility Use of Constant Scaling Factors. Cline, J. E. Palo Alto : EPRI, 1999.
19. ISO 21238, Nuclear Energy - Nuclear Fuel Technology - Scaling Factor Method to Determine the Radioactivity of Low- and Intermediate-Level Radioactive Waste Packages Generated at Nuclear Power Plants. Geneva : International Standards Organization, 2007.
20. Croff, A. G. ORNL-5621, ORIGEN2 - A Revised and Updated Version of the Oak Ridge Isotope Generation and Depletion Code. Oak Ridge : Oak Ridge National Laboratory, 1980.
21. Cheng, B. 1019107, Fuel Reliability Monitoring and Failure Evaluation Handbook (2010): Revision 2. Palo Alto : EPRI, 2010.
22. Lin, C. C. Radiochemistry in Nuclear Power Reactors. Washington DC : National Academy Press, 1996. NAS-NS-3119.
23. ANS Working Group 5.4. NUREG/CR-2507, Background and Derivation of ANS-5.4 Standard Fission Product Release Model. Washington : USNRC, 1982.
24. —. ANSI/ANS 5.4-2011. American National Standard Method for Calculating the Fractional Release of Volatile Fission Products from Oxide Fuel. La Grange, IL : American Nuclear Society, 2011.
25. Neeb, Karl Heinz. The Radiochemistry of Nuclear Power Plants with Light Water Reactors. Berlin : Walter de Gruyter and Co, 1997.
26. Vance, J. N. et, al. TR-101960, RADSOURCE Volume 1, Part 1: A Scaling Factor Prediction Computer Program Technical Manual and Code Validation. Palo Alto, CA : Electric Power Research Institute, 1992.
27. Modelling the Activity of 129I in the Primary Coolant of a CANDU Reactor. Lewis, B. J. and Husain A. s.l. : Elsevier Science B. V., 2003, Vol. Journal of Nuclear Materials 312.
28. USNRC. Regulatory Guide 1.183, Alternative Radiological Source Terms for Evaluating Design Basis Accidents at Nuclear Power Reactors. Washington DC : USNRC, 2000.
29. Beyer, C. E. et. al. PNNL-18212 Rev. 1,, Update of Gap Release Fractions for Non-LOCA Events Utilizing the Revised ANS 5.4 Standard. Richland : PNNL, 2011.
9923195
10-3
30. Cardile, F. P. and Bellamy, R. R., et. al. NUREG-0016 Revision 1, Calculation of Releases of Radioactive Materials in Gaseous and Liquid Effluents from Boiling Water Reactors (BWR GALE Code). Washington DC : USNRC, 1979.
31. Chandrasekaran, T., et. al. NUREG-0017 Revision 1, Calculation of Releases of Radioactive Materials in Gaseous and Liquid Effluents from Pressurized Water Reactors (PWR GALE Code). Washington DC : USNRC, 1985.
32. Reynolds, S. ORNL-TM-4167, Theoretical and Practical Specific Activities and Other Properties of Common Radionuclides. Oak Ridge : Oak Ridge National Laboratory, 1973.
33. Nichols, A. L., et. al. INDC(NDS)-0534, Handbook of Nuclear Data for Safeguards: Database Extentions, August 2008. Vienna : International Atomic Energy Agency, 2008.
34. Evaluation of Cobals Sources in Westinghouse Designed Plants, Proceedings, Third Annual Conference of the Canadian Nuclear Society. Bergmann, C. A. Toronto : Canadian Nuclear Society, 1982. ISSN 0227-0129.
35. Thermodynamic Considerations and Predictions of the Primary Coolant Activity of 99Tc. Lewis, B. et. al. 340, s.l. : Elsevier, 2005, Journal of Nuclear Materials.
36. Heather Baxter, Primary Chemist Shearon Harris Plant. Personal Communication . 2014.
37. Hamilton, L. C. Modern Data Analysis, A First Course in Applied Statistics. Belmont : Brooks/Cole Publishing Company, 1990. ISBN 0-534-12846-7.
38. McPherson, G. Applying and Interpreting Statsitcs, A Comprehensive Guide. New York : Springer-Verlag, 2001. 0-387-95110-5.
39. USNRC. ML15051A411 3R-STAT. A TC-99 and I-129 Release Analysis Computer Code, Technical Evaluation Report and Approval Letter. Washington DC : USNRC, 1995.
40. Scaling Factors for 129I in PWR's Wastes. Leuthrot, C. Tuscon : Waste Management Symposia, 1998.
41. Almkvist, L. et. al. R-07-17, Low and Intermediate Level Waste in SFR-1. Stockholm : SKB, 2007. ISSN 1402-3091.
42. Modeling the Activity and Scaling Factor of 129I in Primary Coolant and CVCS Resin of Operating PWR. Hwang, K. H., Lee, K. J. Amsterdam : Elsevier, 2005, Vol. Annals og Nuclear Energy 32.
43. Accurate Determination of 129I Concentrations and 129I/137Cs Ratios in Spent Nuclear Resins by Accelerator Mass Spectrometry. Nottoli, E., et. al. Amsterdam : Elsevier, 2014, Vols. Applied Radiation and Isotopes, 86.
44. Radioactivity Determination and Measurement for Shallow Land Disposal of Low Level Radioactive Wastes. Matsui, M., Fujita, A., and Kashiwagi, M. Tokyo : Presented at The 12th Sino – Japanese Seminar on Nuclear Safety, 1997.
9923195
10-4
45. Dias, S. Measurement of I-129 in Spent IX Resins and Related Nuclear Systems by Accelerator Mass Spectrometry, OHRD Report No. 92-149-K. Toronto : Kinectrics under contract to Ontario Hydro, 1992.
46. A Model for Predicting Fission Product Activities in Reactor Coolant: Application of Model for Estimating I-129 Levels in Radioactive Waste. Lewis, B. J., Husain, A. Tucson : Waste Management Symposia, 2003.
47. Waste Characterization Procedures in Switzerland (12-1). Teichmann, S., Maxeiner, H., McGinnes, D. Tuscon : Waste Management Symposia, 2000.
48. Vanderperre, S. http://www.eudecom.be/network/eundetraf/pdf/Session7_Characterisation%20Methods_presentationBelgatom.pdf. European Website on Decommissioning of Nuclear Installations. [Online] 2001.
49. Determination and Declaration of Critical Nuclide Inventories in Belgian NPP Radwaste Streams (59-3). Lemmens, A., et. al. Tuscon : Waste Management Symposia, 1999.
50. STUK-YTO-TR162, Evaluation of the Waste Characterisation at the Olkiluoto Nuclear Power Plant. Kekki, T. and Tiitta, A. Helsinki : STUK, 2000. 951-712-373-6.
51. Koshiishi, Masato, et. al. Hitachi’s Activities for Suppression of Stress Corrosion Cracking, Hitachi Review Vol. 58 (2009), No.2. s.l. : GE Hitachi, 2009.
52. Understanding and Mitigating Ageing in Nuclear Power Plants, Materials and Operational Aspects of Plant Life Management (PLiM). Tipping, P. ed. Cambridge : Woodhead, 2010. 978-1-84569-511-8.
53. American Nuclear Society. ANS 18.1. ANSI N237-1976 Source Term Specification. La Grange Park IL : American National Standards Institute, 1976.
54. GE-Hitachi Nuclear Energy. ESBWR Design Control Document, Revision 4. 2007. Vol. Chapter 11.
55. Westinghouse Electric Company LLC. AP1000 Design Control Document, Revision 19. 2011. Vol. Chapter 11.
56. American Nuclear Society. ANSI/ANS-18.1-1984 Radioactive Source Term for Normal Operation of Light Water Reactors. La Grange Park IL : American National Standards Institute, 1984.
57. Kekki, T. and Titta, A. STUK-YTO-TR 162, Evaluation of the Radioactive Waste Characterisation at the Olkiluoto Nuclear Power Plant. Helsinki : STUK, Finland Radiation and Nuclear Safety Authority, 2000. 951-712-373-6.
58. French Codes for the Assessment of Difficult-to-Measure Radionuclides in Low Level Solid Wastes and in Contaminated Reactor Materials . Leuthrot, C. et. al. Tuscon : Waste Management Symposia, 1997.
59. Miller, Clint. Radwaste Engineer. Personal Communication. April 2015.
9923195
10-5
60. Vance, J. TR-100740, Generic Scaling Factors for Dry Active Waste. Palo Alto : EPRI, 1992.
61. Cliene, j. et. al. NP-1494, Activity Levels of Transuranic Nuclides in Low-Level Solid Waste for U. S. Power Reactors. Palo Alto : EPRI, 1980.
62. Helmholz, H., et. al. NP-2734, Solid Radwaste Radioduclide Measurements. Palo Alto : EPRI, 1982.
63. Robertson, D., et. al. NP-5677, Below Regulatory Concern Owners Group: Radionuclide Characterization of Potential BRC Waste Types from Nuclear Power Stations. Palo Alto : EPRI, 1989.
64. Buereau of Radiological Health. Radiological Health Handbook. Rockville : US Department of HealthEducation and Welfare, 1970.
65. Surface Concentration of Molybdenum in Types 316 and 304 Stainless Steel by Auger Electron Spectroscopy. Barnes, G. et. al. 6, s.l. : The Electrochemical Society, June 1972, Electrochemical Science and Technology, Vol. 119.
66. Feron, D. ed. Nuclear Corrosion Science and Engineering. Cambridge : Woodhead Publishing, 2012. 978-1-84569-565-5.
67. Alloy Optimization for PWR Heat Transfer Steam Generatot Tubing. Harrod, D. L., Gold, R. E., and Jacko, R. J. 7, Warrendale : Journal of Minerals, Metals and Materials Society (TMS), 2001, Vol. 53.
68. Localized Corrosion of Nuclear Grade Alloy 800 Under Steam Generator Layup, Startup and Operation Conditions. Lu, Y. 1, Chalk River : AECL Nuclear Review, 2012, Vol. 1.
69. Kocher, David C. Radioactive Decay Data Tables. Oak Ridge : USDOE, 1981.
9923195

9923195
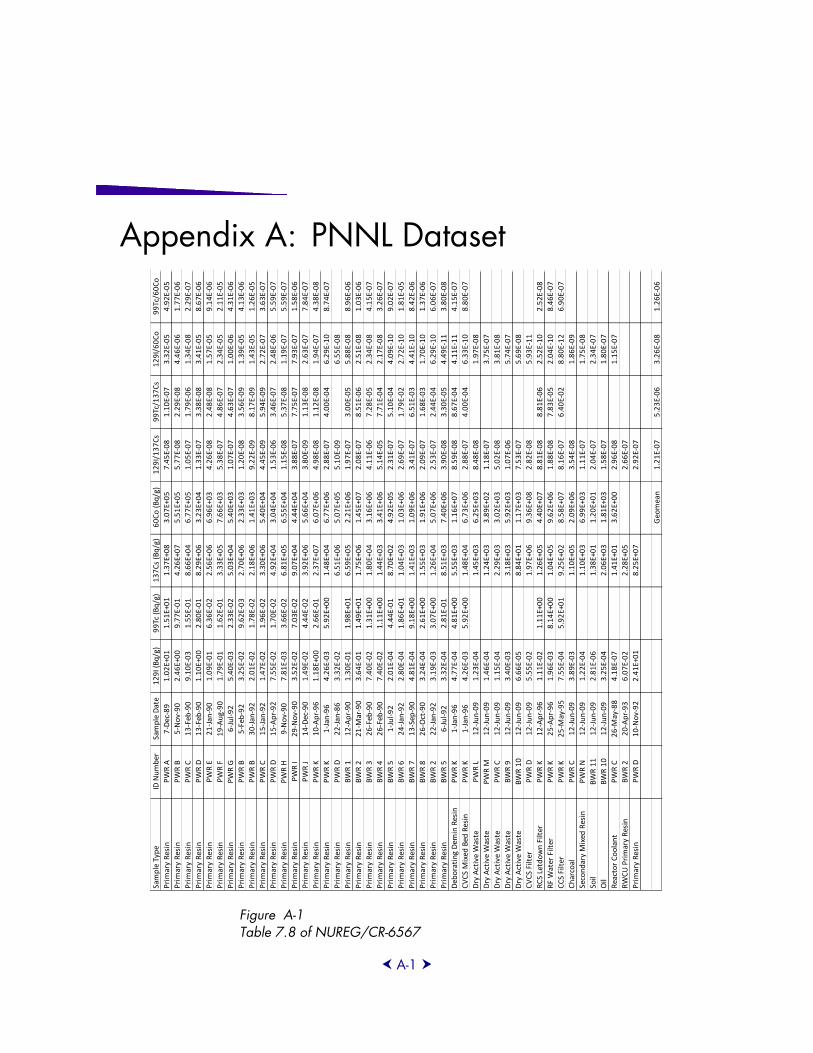
A-1
Appendix A: PNNL Dataset
Figure A-1 Table 7.8 of NUREG/CR-6567
Sample Type
ID Number
Sample Date
129I (Bq/g)
99Tc (Bq/g)
137Cs (Bq/g)
60Co (Bq/g)
129I/137Cs
99Tc/137Cs
129I/60Co
99Tc/60Co
Primary Resin
PWR A
7‐Dec‐89
1.02E+01
1.51E+01
1.37E+08
3.07E+05
7.45E‐08
1.10E‐07
3.32E‐05
4.92E‐05
Primary Resin
PWR B
5‐Nov‐90
2.46E+00
9.77E‐01
4.26E+07
5.51E+05
5.77E‐08
2.29E‐08
4.46E‐06
1.77E‐06
Primary Resin
PWR C
13‐Feb
‐90
9.10E‐03
1.55E‐01
8.66E+04
6.77E+05
1.05E‐07
1.79E‐06
1.34E‐08
2.29E‐07
Primary Resin
PWR D
13‐Feb
‐90
1.10E+00
2.80E‐01
8.29E+06
3.23E+04
1.33E‐07
3.38E‐08
3.41E‐05
8.67E‐06
Primary Resin
PWR E
21‐Jan
‐90
1.09E‐01
6.36E‐02
2.56E+06
6.96E+03
4.26E‐08
2.48E‐08
1.57E‐05
9.14E‐06
Primary Resin
PWR F
19‐Aug‐90
1.79E‐01
1.62E‐01
3.33E+05
7.66E+03
5.38E‐07
4.86E‐07
2.34E‐05
2.11E‐05
Primary Resin
PWR G
6‐Jul‐92
5.40E‐03
2.33E‐02
5.03E+04
5.40E+03
1.07E‐07
4.63E‐07
1.00E‐06
4.31E‐06
Primary Resin
PWR B
5‐Feb
‐92
3.25E‐02
9.62E‐03
2.70E+06
2.33E+03
1.20E‐08
3.56E‐09
1.39E‐05
4.13E‐06
Primary Resin
PWR B
30‐Jan
‐92
2.01E‐02
1.78E‐02
2.18E+06
1.41E+03
9.22E‐09
8.17E‐09
1.43E‐05
1.26E‐05
Primary Resin
PWR C
15‐Jan
‐92
1.47E‐02
1.96E‐02
3.30E+06
5.40E+04
4.45E‐09
5.94E‐09
2.72E‐07
3.63E‐07
Primary Resin
PWR D
15‐Apr‐92
7.55E‐02
1.70E‐02
4.92E+04
3.04E+04
1.53E‐06
3.46E‐07
2.48E‐06
5.59E‐07
Primary Resin
PWR H
9‐Nov‐90
7.81E‐03
3.66E‐02
6.81E+05
6.55E+04
1.15E‐08
5.37E‐08
1.19E‐07
5.59E‐07
Primary Resin
PWR I
29‐Nov‐90
3.52E‐02
7.03E‐02
9.07E+04
4.44E+04
3.88E‐07
7.75E‐07
7.93E‐07
1.58E‐06
Primary Resin
PWR J
14‐Dec‐90
1.49E‐02
4.44E‐02
3.92E+06
5.66E+04
3.80E‐09
1.13E‐08
2.63E‐07
7.84E‐07
Primary Resin
PWR K
10‐Apr‐96
1.18E+00
2.66E‐01
2.37E+07
6.07E+06
4.98E‐08
1.12E‐08
1.94E‐07
4.38E‐08
Primary Resin
PWR K
1‐Jan
‐96
4.26E‐03
5.92E+00
1.48E+04
6.77E+06
2.88E‐07
4.00E‐04
6.29E‐10
8.74E‐07
Primary Resin
PWR D
22‐Jan
‐86
3.32E‐02
6.51E+06
5.07E+05
5.10E‐09
6.55E‐08
Primary Resin
BWR 1
12‐Apr‐90
1.30E‐01
1.98E+01
6.59E+05
2.21E+06
1.97E‐07
3.00E‐05
5.88E‐08
8.96E‐06
Primary Resin
BWR 2
21‐M
ar‐90
3.64E‐01
1.49E+01
1.75E+06
1.45E+07
2.08E‐07
8.51E‐06
2.51E‐08
1.03E‐06
Primary Resin
BWR 3
26‐Feb
‐90
7.40E‐02
1.31E+00
1.80E+04
3.16E+06
4.11E‐06
7.28E‐05
2.34E‐08
4.15E‐07
Primary Resin
BWR 4
26‐Feb
‐90
7.40E‐02
1.11E+00
1.44E+03
3.41E+06
5.14E‐05
7.71E‐04
2.17E‐08
3.26E‐07
Primary Resin
BWR 5
1‐Jul‐92
2.01E‐04
4.44E‐01
8.70E+02
4.92E+05
2.31E‐07
5.10E‐04
4.09E‐10
9.02E‐07
Primary Resin
BWR 6
24‐Jan
‐92
2.80E‐04
1.86E+01
1.04E+03
1.03E+06
2.69E‐07
1.79E‐02
2.72E‐10
1.81E‐05
Primary Resin
BWR 7
13‐Sep
‐90
4.81E‐04
9.18E+00
1.41E+03
1.09E+06
3.41E‐07
6.51E‐03
4.41E‐10
8.42E‐06
Primary Resin
BWR 8
26‐Oct‐90
3.24E‐04
2.61E+00
1.55E+03
1.91E+06
2.09E‐07
1.68E‐03
1.70E‐10
1.37E‐06
Primary Resin
BWR 2
22‐Jan
‐92
3.19E‐03
3.07E+00
1.26E+04
5.07E+06
2.53E‐07
2.44E‐04
6.29E‐10
6.06E‐07
Primary Resin
BWR 5
6‐Jul‐92
3.32E‐04
2.81E‐01
8.51E+03
7.40E+06
3.90E‐08
3.30E‐05
4.49E‐11
3.80E‐08
Deborating Dem
in Resin
PWR K
1‐Jan
‐96
4.77E‐04
4.81E+00
5.55E+03
1.16E+07
8.59E‐08
8.67E‐04
4.11E‐11
4.15E‐07
CVCS Mixed
Bed
Resin
PWR K
1‐Jan
‐96
4.26E‐03
5.92E+00
1.48E+04
6.73E+06
2.88E‐07
4.00E‐04
6.33E‐10
8.80E‐07
Dry Active Waste
PWR L
12‐Jun‐09
1.23E‐04
1.45E+03
6.25E+03
8.48E‐08
1.97E‐08
Dry Active Waste
PWR M
12‐Jun‐09
1.46E‐04
1.24E+03
3.89E+02
1.18E‐07
3.75E‐07
Dry Active Waste
PWR C
12‐Jun‐09
1.15E‐04
2.29E+03
3.02E+03
5.02E‐08
3.81E‐08
Dry Active Waste
BWR 9
12‐Jun‐09
3.40E‐03
3.18E+03
5.92E+03
1.07E‐06
5.74E‐07
Dry Active Waste
BWR 10
12‐Jun‐09
6.66E‐05
8.84E+01
1.17E+03
7.53E‐07
5.69E‐08
CVCS Filter
PWR D
12‐Jun‐09
5.55E‐02
1.97E+06
9.36E+08
2.82E‐08
5.93E‐11
RCS Letdown Filter
PWR K
12‐Apr‐96
1.11E‐02
1.11E+00
1.26E+05
4.40E+07
8.81E‐08
8.81E‐06
2.52E‐10
2.52E‐08
RF Water Filter
PWR K
25‐Apr‐96
1.96E‐03
8.14E+00
1.04E+05
9.62E+06
1.88E‐08
7.83E‐05
2.04E‐10
8.46E‐07
CCS Filter
PWR K
25‐M
ay‐95
7.55E‐04
5.92E+01
9.25E+02
8.58E+07
8.16E‐07
6.40E‐02
8.80E‐12
6.90E‐07
Charcoal
PWR C
12‐Jun‐09
3.89E‐03
1.10E+05
2.09E+06
3.54E‐08
1.86E‐09
Secondary Mixed
Resin
PWR N
12‐Jun‐09
1.22E‐04
1.10E+03
6.99E+03
1.11E‐07
1.75E‐08
Soil
BWR 11
12‐Jun‐09
2.81E‐06
1.38E+01
1.20E+01
2.04E‐07
2.34E‐07
Oil
BWR 10
12‐Jun‐09
3.25E‐04
2.06E+03
1.81E+03
1.58E‐07
1.80E‐07
Reactor Coolant
PWR C
26‐M
ay‐88
4.18E‐07
1.41E+01
3.62E+00
2.96E‐08
1.15E‐07
RWCU Primary Resin
BWR 2
20‐Apr‐93
6.07E‐02
2.28E+05
2.66E‐07
Primary Resin
PWR D
10‐Nov‐92
2.41E+01
8.25E+07
2.92E‐07
Geomean
1.21E‐07
5.23E‐06
3.26E‐08
1.26E‐06
9923195

9923195
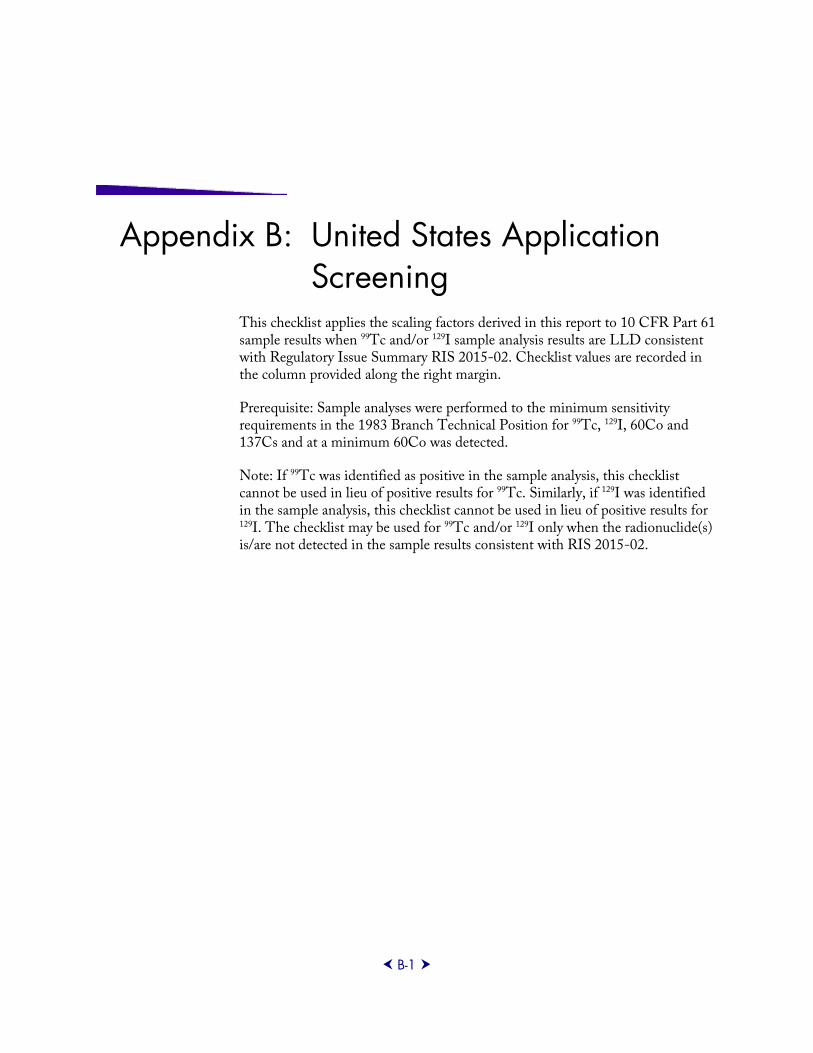
B-1
Appendix B: United States Application Screening
This checklist applies the scaling factors derived in this report to 10 CFR Part 61 sample results when 99Tc and/or 129I sample analysis results are LLD consistent with Regulatory Issue Summary RIS 2015-02. Checklist values are recorded in the column provided along the right margin.
Prerequisite: Sample analyses were performed to the minimum sensitivity requirements in the 1983 Branch Technical Position for 99Tc, 129I, 60Co and 137Cs and at a minimum 60Co was detected.
Note: If 99Tc was identified as positive in the sample analysis, this checklist cannot be used in lieu of positive results for 99Tc. Similarly, if 129I was identified in the sample analysis, this checklist cannot be used in lieu of positive results for 129I. The checklist may be used for 99Tc and/or 129I only when the radionuclide(s) is/are not detected in the sample results consistent with RIS 2015-02.
9923195
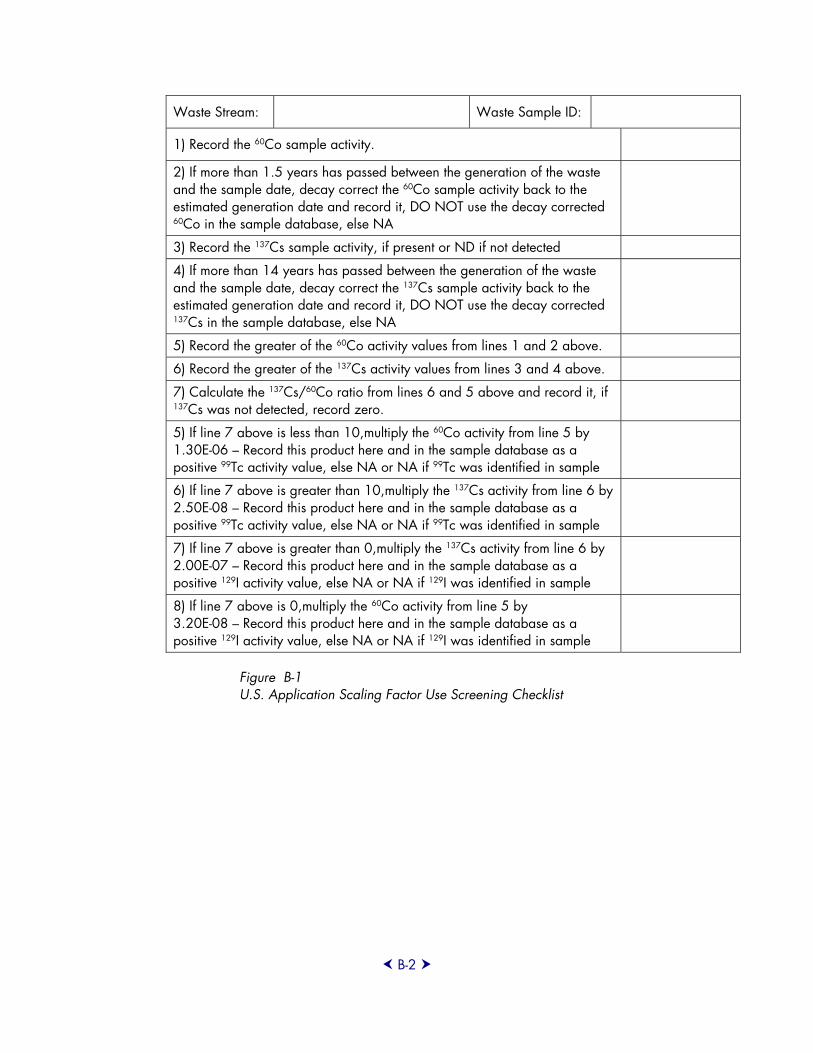
B-2
Waste Stream: Waste Sample ID:
1) Record the 60Co sample activity.
2) If more than 1.5 years has passed between the generation of the waste and the sample date, decay correct the 60Co sample activity back to the estimated generation date and record it, DO NOT use the decay corrected 60Co in the sample database, else NA
3) Record the 137Cs sample activity, if present or ND if not detected
4) If more than 14 years has passed between the generation of the waste and the sample date, decay correct the 137Cs sample activity back to the estimated generation date and record it, DO NOT use the decay corrected 137Cs in the sample database, else NA
5) Record the greater of the 60Co activity values from lines 1 and 2 above.
6) Record the greater of the 137Cs activity values from lines 3 and 4 above.
7) Calculate the 137Cs/60Co ratio from lines 6 and 5 above and record it, if 137Cs was not detected, record zero.
5) If line 7 above is less than 10,multiply the 60Co activity from line 5 by 1.30E-06 – Record this product here and in the sample database as a positive 99Tc activity value, else NA or NA if 99Tc was identified in sample
6) If line 7 above is greater than 10,multiply the 137Cs activity from line 6 by 2.50E-08 – Record this product here and in the sample database as a positive 99Tc activity value, else NA or NA if 99Tc was identified in sample
7) If line 7 above is greater than 0,multiply the 137Cs activity from line 6 by 2.00E-07 – Record this product here and in the sample database as a positive 129I activity value, else NA or NA if 129I was identified in sample
8) If line 7 above is 0,multiply the 60Co activity from line 5 by 3.20E-08 – Record this product here and in the sample database as a positive 129I activity value, else NA or NA if 129I was identified in sample
Figure B-1 U.S. Application Scaling Factor Use Screening Checklist
9923195

9923195
Electric Power Research Institute 3420 Hillview Avenue, Palo Alto, California 94304-1338 • PO Box 10412, Palo Alto, California 94303-0813 USA
800.313.3774 • 650.855.2121 • [email protected] • www.epri.com
The Electric Power Research Institute, Inc. (EPRI, www.epri.com)
conducts research and development relating to the generation, delivery
and use of electricity for the benefit of the public. An independent,
nonprofit organization, EPRI brings together its scientists and engineers
as well as experts from academia and industry to help address challenges
in electricity, including reliability, efficiency, affordability, health, safety
and the environment. EPRI also provides technology, policy and economic
analyses to drive long-range research and development planning, and
supports research in emerging technologies. EPRI’s members represent
approximately 90 percent of the electricity generated and delivered in
the United States, and international participation extends to more than
30 countries. EPRI’s principal offices and laboratories are located in
Palo Alto, Calif.; Charlotte, N.C.; Knoxville, Tenn.; and Lenox, Mass.
Together...Shaping the Future of Electricity
© 2015 Electric Power Research Institute (EPRI), Inc. All rights reserved. Electric Power Research Institute, EPRI, and TOGETHER...SHAPING THE FUTURE OF ELECTRICITY are registered service marks of the Electric Power Research Institute, Inc.
Program:
Radiation Safety Program
3002005564
9923195