Embed Size (px)
Citation preview
Human Journals
Research Article
July 2017 Vol.:9, Issue:4
© All rights are reserved by Dr. Shaikh Anwar Rafique et al.
Development of Highly Predictive 2D and 3D QSAR Models Combined
with MLR and kNN Technique of Chalcone Derivatives for Inhibition
of NO Production and Tumor Cell Proliferation
www.ijppr.humanjournals.com
Keywords: 3', 4', 5'-tri-methoxy chalcone, 2D & 3D QSAR,
kNN-MFA, DeltaEpsilon B, NO inhibition and tumor cell
proliferation.
ABSTRACT
A series of 23 molecules of 3', 4', 5'-tri-methoxy chalcone
derivatives reported in literature Yerra koteswara Rao et al
(2009) were used for development of 2D and 3D QSAR
models. The data set of 23 molecules were divided into training
and test set in the ratio of 70:30, The biological activity was
converted to the logarithmic scale (pIC50) in a mathematical
operation mode of the software. The statistically significant 2D-
QSAR models for NO inhibition activity are r2 =0.8145 and q
2
= 0.5130 and on tumor cell proliferation activity giving r2
=
0.7207 and q2
=0.5227. 3D QSAR results for internal (q2 =
0.6176, q2=0.7761) and external (predictive r
2 = 0.5055, r
2 =
0.4292) validation criteria. Thus, 3D QSAR models showed
that electrostatic effects dominantly determine the binding
affinities. 2D QSAR studies revealed that Sds CHE Index
descriptors were major contributing descriptor in case of No
inhibition activity and DeltaEpsilon B in the case of tumor cell
proliferation activity. Methods were performed using the kNN-
MFA method. The results derived may be useful in further
designing novel more potent agents.
Dr. Shaikh Anwar Rafique*1
, Umair Ahmed Nehal
Ahmed2, Prof. Dr.Mohammed Ibrahim
3
1Professor & Head, Department of Pharmaceutical
Chemistry,
M.C.E. Society’s, Allana College of Pharmacy, Pune,
Maharashtra - 411 001
2Research Scholar, Jawaharlal Nehru Technological
University, Hyderabad-500 085.
3Principal, Nizam Institute of Pharmacy, Nalgonda Dist,
Andhra Pradesh-508284.
Submission: 2 July 2017
Accepted: 10 July 2017
Published: 25 July 2017
www.ijppr.humanjournals.com
Citation: Dr. Shaikh Anwar Rafique et al. Ijppr.Human, 2017; Vol. 9 (4): 51-70. 52
1. INTRODUCTION:
Chalcones constitute an important group of natural products and serve as precursors for the
synthesis of different classes of flavonoids, which are common substances in plants.
Chalcones are open-chain flavonoids in which two aromatic rings are joined by a three
carbon a, unsaturated carbonyl system (1,3-diphenyl-2-propane-1-ones) [Avila et al 2008].
Chalcone derivatives have received a great deal of attention due to their relatively simple
structures, and wide variety of pharmacological activities reported for these compounds
include anti-inflammatory [Cheng et al], antibacterial[Rao et al 2009], antifungal [Sortino et
al 2007], and antitumor activities [Katsori &Achanta et al 2006]. These activities are largely
attributed due to the α,β-unsaturated ketone moiety. The introduction of various substituents
into the two aryl rings is also a subject of interest because it leads to useful structure–activity
relationship (SAR) conclusions and thus helps to synthesize pharmacologically active
chalcones [Kastori et al 2009]. In recent years, noteworthy advancement has been made by
computational chemistry, which led new challenges to drug discovery. Quantitative structure
activity relationship (QSAR) which has become an reputable tool for establishing quantitative
relationship between biological activity and physicochemical properties of the compounds in
a series using various statistical methods (linear regression and non-linear regression
analysis) and it helps to calculate the biological activities of newly designed analogues
contributing to the drug discovery process [Kulkarni et al 2008]. The core idea of the present
study is the search for novel 3’, 4’, 5'-tri methoxy chalcone analogs that would show a
promise to become useful as inhibitors of nitric oxide production and tumor cell proliferation.
A series of 3', 4', 5'-tri methoxy chalcone analogs which were reported [Rao et al 2009] are
chosen for QSAR study in order to establish the quantitative relationship between
physiochemical properties and biological activities of the compounds using QSAR pro
software (Vlife Science) [VLife software 2017].
The purpose of the present study is to investigate the physicochemical parameters responsible
for the inhibition of NO and tumor cell proliferation effect of 3’, 4’, 5’trimethoxy chalcone
derivatives and designing of novel substituted 3’, 4’, 5’trimethoxy chalcone derivatives with
potent protective activity. In the present investigation, three widely used techniques, viz.
stepwise forward variable selection method, Genetic algorithm and simulated annealing have
been applied for descriptor optimization and multiple linear regression analysis, principal
component regression and partial least square has been applied for two and three-dimensional
www.ijppr.humanjournals.com
Citation: Dr. Shaikh Anwar Rafique et al. Ijppr.Human, 2017; Vol. 9 (4): 51-70. 53
QSAR models development. The generated models provide insight into the influence of
various interactive fields on the activity and, thus, can help in designing and forecasting the
protecting effect of the novel of 3’, 4’, 5’trimethoxy chalcone molecules. The data set was
divided into training and test set as in 70:30 ratio.
Traditional QSAR does not directly take into account the three-dimensional nature of
molecules. However, three-dimensional QSAR uses steric and electrostatic parameters in an
attempt to define the three-dimensional shape and electrostatic fields of a molecule
responsible for binding to produce QSAR type equations for predicting the activity of
potential drug candidates [Thomas G 2003].
In 3D QSAR the 3D properties of a molecule are considered as a whole rather than by
considering individual substituent or moieties. The philosophy of 3D QSAR revolves around
the assumptions that the most important features of a molecule are its overall size and shape,
and its electronic properties (electronic field). Comparative molecular field analysis
(CoMFA) is an important method of 3D QSAR [Cramer et al 1988]. This is based on the
assumption that drug – receptor interactions are noncovalent and that changes in the steric
and/or electrostatic fields of the drug molecules [Patric 2006].
3D QSAR like traditional QSAR uses a group of compounds, the training set, with either
similar structures or having a common pharmacophore and same type of activities but
different potencies in an investigation. A 3D QSAR investigation is thus started by selecting
one member of the training set as a reference compound and identifying its pharmacophore.
The three-dimensional structure of a reference molecule is locked into a rectangular three-
dimensional lattice of so-called grid points that are usually set at a finite distance apart,
typically 2-angstrom units (0.2 mm), in the x, y, and z directions. A three or four digit
number locates each grid point. A suitable molecular mechanical probe, such as a sp3-
hybridized carbon atom with a charge of +1, is placed in turn at each of these grid points.
Three probes in common use are a proton (H+), a methyl carbonium ion (
+CH3) and water
(H2O). H+ is used for electrostatic,
+CH3 for steric and H2O for hydrophobic interactions.
The next stage of the analysis is to align the other molecules of the training set in the lattice
and measure their steric and electrostatic field. Aligning the pharmacophore of the set
molecules with that of reference molecule usually gives good analysis results.
www.ijppr.humanjournals.com
Citation: Dr. Shaikh Anwar Rafique et al. Ijppr.Human, 2017; Vol. 9 (4): 51-70. 54
Similarly, an alignment based on matching the positions of the common sections of the
structure of the set molecules, such as steroidal ring system, gives good analysis results. The
data from all the calculations are converted into a QSAR equation using statistical methods.
A series of 3’, 4’, 5’trimethoxy chalcone derivatives which were reported [1] are chosen for
QSAR study in order to establish a quantitative relationship between physiochemical
properties and biological activities of the compounds using MDS software (Vlife Science)
[VLife software 2017].
2. MATERIALS AND METHODS:
All molecular modeling studies (2D and 3D) were performed using the Molecular Design
Suite (VLife MDS software package, version 4.6; from VLife Sciences, Pune, India), on a
Dell computer with a Core I -3processor and a Windows 7 operating system. Structures were
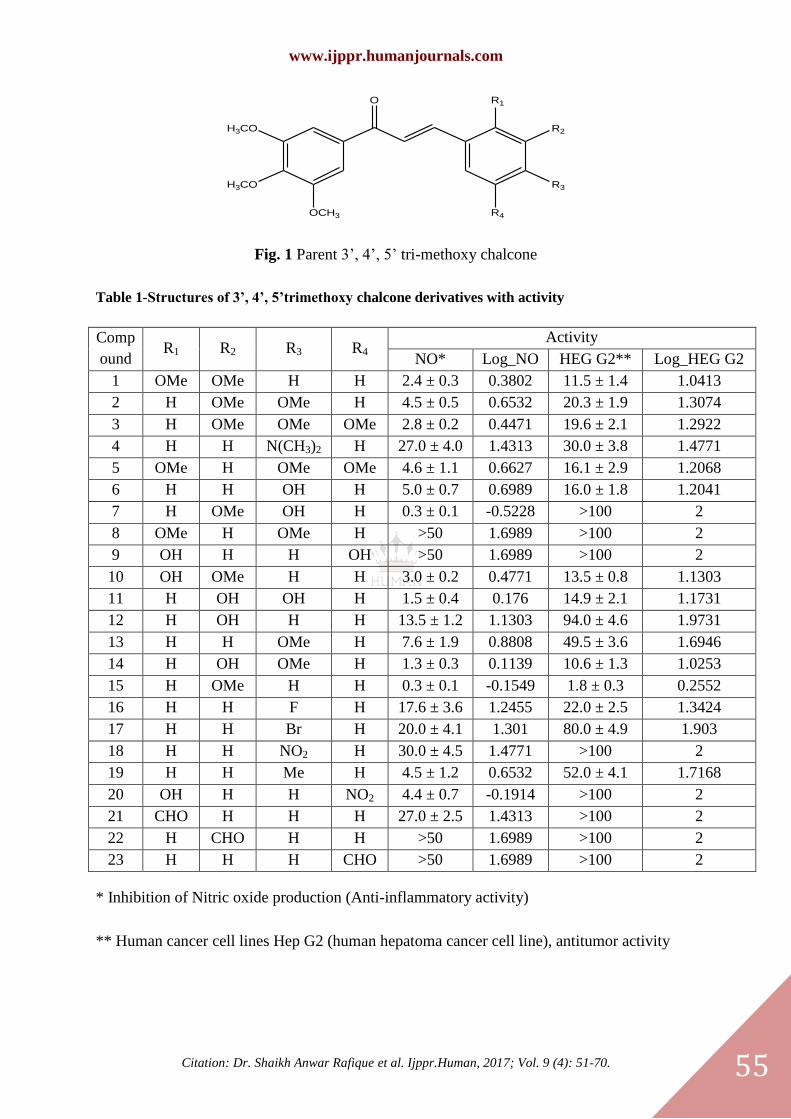
sketched using the 2D draw application and converted to 3D structures (Fig.1, Table 1).
2.1 BIOLOGICAL DATA
The inhibitors of nitric oxide production and tumor cell proliferation were taken from the
reported work [Rao et al 2009]. The total set of compounds were divided into a training set
for generating 2D and 3D QSAR models and a test set for validating the quality of the
models. Selection of the training set and test set molecules was done based on structural
diversity and a wide range of activity such that the test-set molecules represent a range of
biological activity similar to that of the training set; thus, the test set is truly representative of
the training set. The biological activity values [IC50 (µM)] reported in micro molar units were
converted to their negative logarithmic scale and subsequently used as the dependent variable
for the QSAR analysis. The values of IC50 along with the structure of the compounds in the
series are listed in Table 1
www.ijppr.humanjournals.com
Citation: Dr. Shaikh Anwar Rafique et al. Ijppr.Human, 2017; Vol. 9 (4): 51-70. 55
O
H3CO
H3CO
OCH3
R1
R2
R3
R4
Fig. 1 Parent 3’, 4’, 5’ tri-methoxy chalcone
Table 1-Structures of 3’, 4’, 5’trimethoxy chalcone derivatives with activity
Comp
ound R1 R2 R3 R4
Activity
NO* Log_NO HEG G2** Log_HEG G2
1 OMe OMe H H 2.4 ± 0.3 0.3802 11.5 ± 1.4 1.0413
2 H OMe OMe H 4.5 ± 0.5 0.6532 20.3 ± 1.9 1.3074
3 H OMe OMe OMe 2.8 ± 0.2 0.4471 19.6 ± 2.1 1.2922
4 H H N(CH3)2 H 27.0 ± 4.0 1.4313 30.0 ± 3.8 1.4771
5 OMe H OMe OMe 4.6 ± 1.1 0.6627 16.1 ± 2.9 1.2068
6 H H OH H 5.0 ± 0.7 0.6989 16.0 ± 1.8 1.2041
7 H OMe OH H 0.3 ± 0.1 -0.5228 >100 2
8 OMe H OMe H >50 1.6989 >100 2
9 OH H H OH >50 1.6989 >100 2
10 OH OMe H H 3.0 ± 0.2 0.4771 13.5 ± 0.8 1.1303
11 H OH OH H 1.5 ± 0.4 0.176 14.9 ± 2.1 1.1731
12 H OH H H 13.5 ± 1.2 1.1303 94.0 ± 4.6 1.9731
13 H H OMe H 7.6 ± 1.9 0.8808 49.5 ± 3.6 1.6946
14 H OH OMe H 1.3 ± 0.3 0.1139 10.6 ± 1.3 1.0253
15 H OMe H H 0.3 ± 0.1 -0.1549 1.8 ± 0.3 0.2552
16 H H F H 17.6 ± 3.6 1.2455 22.0 ± 2.5 1.3424
17 H H Br H 20.0 ± 4.1 1.301 80.0 ± 4.9 1.903
18 H H NO2 H 30.0 ± 4.5 1.4771 >100 2
19 H H Me H 4.5 ± 1.2 0.6532 52.0 ± 4.1 1.7168
20 OH H H NO2 4.4 ± 0.7 -0.1914 >100 2
21 CHO H H H 27.0 ± 2.5 1.4313 >100 2
22 H CHO H H >50 1.6989 >100 2
23 H H H CHO >50 1.6989 >100 2
* Inhibition of Nitric oxide production (Anti-inflammatory activity)
** Human cancer cell lines Hep G2 (human hepatoma cancer cell line), antitumor activity
www.ijppr.humanjournals.com
Citation: Dr. Shaikh Anwar Rafique et al. Ijppr.Human, 2017; Vol. 9 (4): 51-70. 56
Regression analysis method for model building. The result of MLR analysis using random
data selection and manual data selection methods is shown is shown in Table 2 and 3
respectively for all two activities.
2.2 MOLECULAR MODELING FOR 2D QSAR:
In 2D QSAR analysis, significant methods Multiple linear regression, principal component
regression and partial least square were applied to generate the 2D-QSAR model. The 2D
structures were converted to 3D structures by sending them to MDS software. Each
compound was energy minimized and batch optimized by using Merck Molecular Force Field
and charges followed by Austin Model-1. The Hamiltonian method was available in MOPAC
module with the convergence criterion 0.001 kcal/mol A˚ fixing Root Mean Square Gradients
(RMS) to 0.001 kcal/mol A˚. 2D descriptors (physicochemical and alignment independent)
were calculated for the optimized compounds on QSAR plus work sheet. The invariable
descriptors (the descriptors that are constant for all the molecules) were removed, as they do
not contribute to QSAR. Most stable structure for each compound was generated after energy
minimization and used for calculating various physicochemical descriptors like
thermodynamic, steric and electronic. The energy-minimized geometry was used for the
calculation of the various 2D descriptors (Individual, Chi, ChiV, Path count, Chi Chain, ChiV
Chain, Chain path count, Cluster, Path cluster, Kappa, Element Count, Estate number, Estate
contribution, Semi-empirical, Hydrophilic– hydrophobic, Polar surface area and Alignment
independent) and was considered as independent variables in the present study.
QSAR analysis was performed after removal of all the invariable columns, as they do not
contribute to the QSAR. The optimal test and training data set were generated using the
manual as well as the random data selection method. Sphere exclusion method was also
adopted for a division of training and test set. Sphere exclusion method is used for creating
training and test set from the data. This is a rational selection method which takes into
consideration both biological and chemical space for a division of data set. Dissimilarity
value provides handle to vary train/test set size. It needs to be adjusted by trial and error until
the desired division of training and test set is achieved. As a rule, the increase in dissimilarity
value will lead to increase in a number of molecules in the test set. All 23 molecules were
subjected to regression analysis using multiple linear regression analysis, as model building
methods coupled with stepwise forward backward variable selection method. Regression
analysis was carried out for a treatment of drug abuse disorders and the best model was cross
www.ijppr.humanjournals.com
Citation: Dr. Shaikh Anwar Rafique et al. Ijppr.Human, 2017; Vol. 9 (4): 51-70. 57
validated. Best two-dimensional QSAR results obtained by multiple linear regression
analysis, Partial Least Squares and Principal Component Regression are obtained shown in
Table 2, and 3 respectively.
2.3 MOLECULAR MODELING FOR 3D QSAR
In 3D QSAR All molecules were aligned by using a template based method and aligned
molecules were used for 3D QSAR taking consideration on RMS gradient between 0.1 to 0.5.
The significant method was used like kNN (nearest neighbor) [Ajmani et al 2006] and neural
network methods both methods were combined with the stepwise variable selection forward
backward method taking consideration of data in 70:30 ratio of training and test set. The
subjected molecules were used for 3D QSAR the Steric and electrostatic parameters used
with distance dependent function with the charge of Ga Steiger Marsili of constant 1 and cut
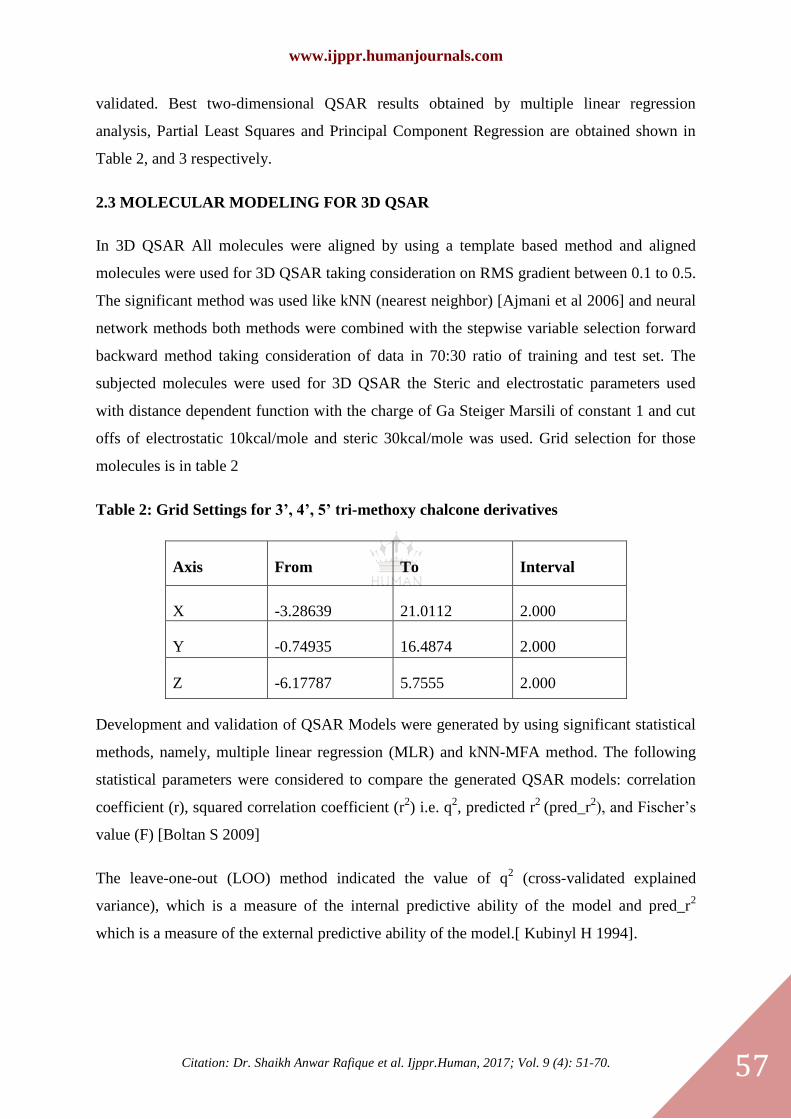
offs of electrostatic 10kcal/mole and steric 30kcal/mole was used. Grid selection for those
molecules is in table 2
Table 2: Grid Settings for 3’, 4’, 5’ tri-methoxy chalcone derivatives
Axis From To Interval
X -3.28639 21.0112 2.000
Y -0.74935 16.4874 2.000
Z -6.17787 5.7555 2.000
Development and validation of QSAR Models were generated by using significant statistical
methods, namely, multiple linear regression (MLR) and kNN-MFA method. The following
statistical parameters were considered to compare the generated QSAR models: correlation
coefficient (r), squared correlation coefficient (r2) i.e. q
2, predicted r
2 (pred_r
2), and Fischer’s
value (F) [Boltan S 2009]
The leave-one-out (LOO) method indicated the value of q2 (cross-validated explained
variance), which is a measure of the internal predictive ability of the model and pred_r2
which is a measure of the external predictive ability of the model.[ Kubinyl H 1994].

www.ijppr.humanjournals.com
Citation: Dr. Shaikh Anwar Rafique et al. Ijppr.Human, 2017; Vol. 9 (4): 51-70. 58
3. RESULTS AND DISCUSSION
Table 3: Results of MLR analysis using random data selection method for NO inhibition
activity of 3’, 4’, 5’trimethoxy chalcone derivatives
Sr.no. r2 q
2 r
2se q
2se F test Predr
2 Predr
2se n DOF
1 0.8145 0.5130 0.2405 0.3897 14.63 0.3798 0.7594 14 10
2 0.8214 0.5318 0.2649 0.4289 15.33 0.3225 0.7394 14 10
3 0.8594 0.6749 0.2195 0.3338 20.3821 0.2348 0.8142 14 10
The selection of the best model is based on the values of r2 (squared correlation coefficient),
q2 (cross-validated correlation coefficient), pred_r
2 (predicted correlation coefficient for the
external test set), F (Fisher ratio) value. High values of the F-test indicated that the model was
statistically significant. r2se, q
2se, and pred_r
2se are the standard errors terms for r
2, q
2 and
pred_r2 respectively. The statistically significant 2D-QSAR model is shown as follows.
3.1 Interpretation of the model -1for NO inhibition
Model-(Test set:15, 18, 19, 06, 07, 20 and 22)
pIC50 (column) = 1.3490 (SdsCHE-index) +0.7155 (SsFcount)+0.5113 (SsssCount) -3.5528
Statistics:
[n= 14; Degree of freedom= 10; r2 =0.8145; q
2=0.5130; F test=14.6325; r
2se=0.2405; q
2se=
0.3897; pred_r2= 0.3798; pred_r
2se = 0.7594]
From the equation, model 1 explains 81.45% (r2
= 0.8145) of the total variance in the training
set as well as it has internal (q2) and external (pred_r
2) predictive ability of 51.30 % and
37.98 % respectively. The F test shows the statistical significance of 99.99 % of the model
which means that probability of failure of the model is 1 in 10000. In addition, the
randomization test shows the confidence of 99.9999 (Alpha Rand Pred R^2 = 0.00000) that
www.ijppr.humanjournals.com
Citation: Dr. Shaikh Anwar Rafique et al. Ijppr.Human, 2017; Vol. 9 (4): 51-70. 59
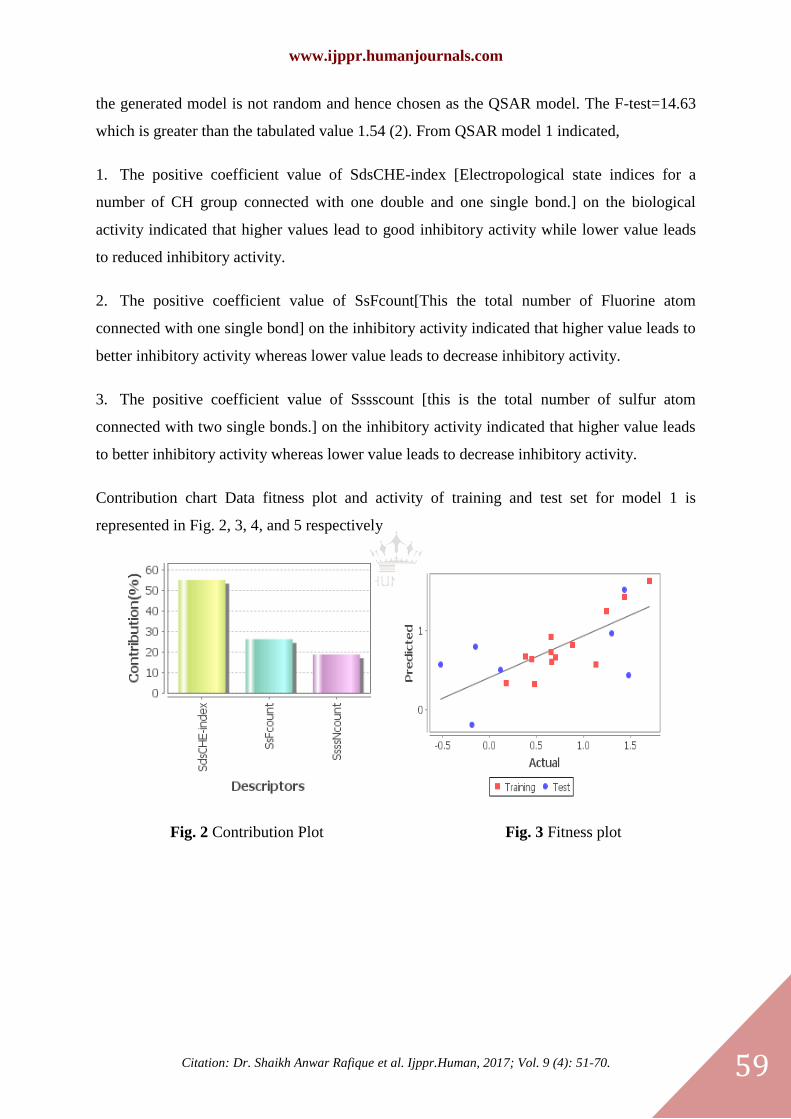
the generated model is not random and hence chosen as the QSAR model. The F-test=14.63
which is greater than the tabulated value 1.54 (2). From QSAR model 1 indicated,
1. The positive coefficient value of SdsCHE-index [Electropological state indices for a
number of CH group connected with one double and one single bond.] on the biological
activity indicated that higher values lead to good inhibitory activity while lower value leads
to reduced inhibitory activity.
2. The positive coefficient value of SsFcount[This the total number of Fluorine atom
connected with one single bond] on the inhibitory activity indicated that higher value leads to
better inhibitory activity whereas lower value leads to decrease inhibitory activity.
3. The positive coefficient value of Sssscount [this is the total number of sulfur atom
connected with two single bonds.] on the inhibitory activity indicated that higher value leads
to better inhibitory activity whereas lower value leads to decrease inhibitory activity.
Contribution chart Data fitness plot and activity of training and test set for model 1 is
represented in Fig. 2, 3, 4, and 5 respectively
Fig. 2 Contribution Plot Fig. 3 Fitness plot
www.ijppr.humanjournals.com
Citation: Dr. Shaikh Anwar Rafique et al. Ijppr.Human, 2017; Vol. 9 (4): 51-70. 60
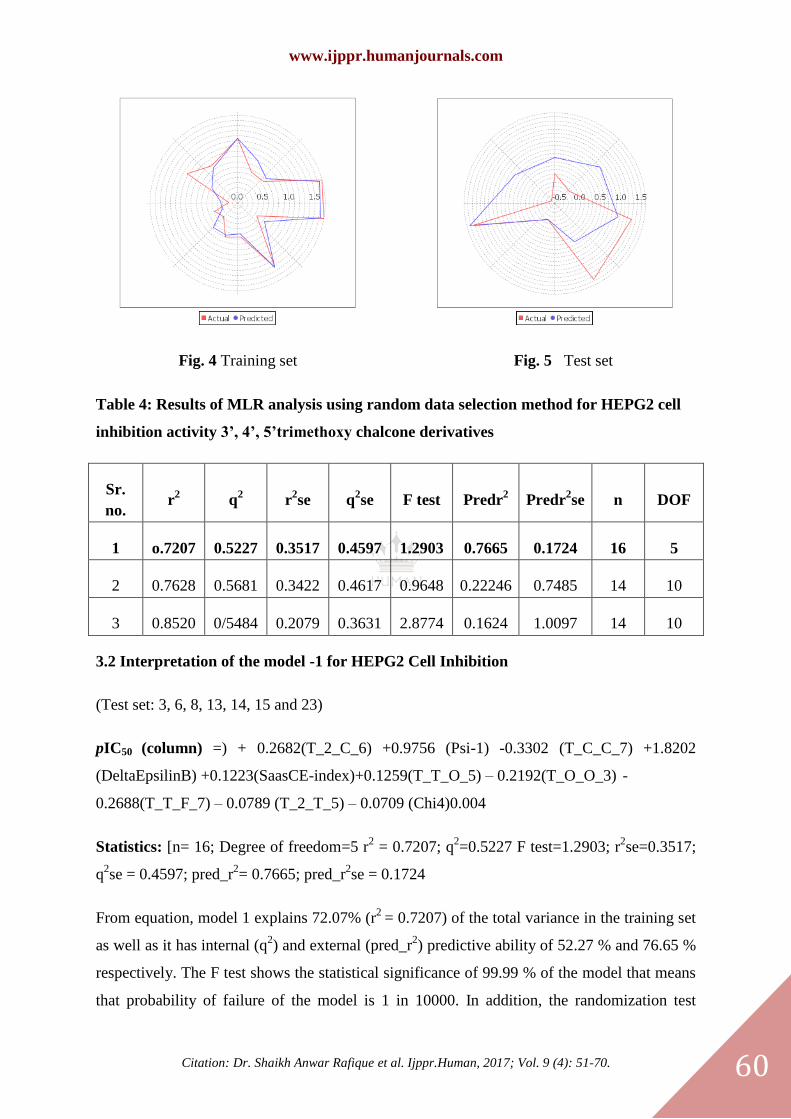
Fig. 4 Training set Fig. 5 Test set
Table 4: Results of MLR analysis using random data selection method for HEPG2 cell
inhibition activity 3’, 4’, 5’trimethoxy chalcone derivatives
Sr.
no. r
2 q
2 r
2se q
2se F test Predr
2 Predr
2se n DOF
1 o.7207 0.5227 0.3517 0.4597 1.2903 0.7665 0.1724 16 5
2 0.7628 0.5681 0.3422 0.4617 0.9648 0.22246 0.7485 14 10
3 0.8520 0/5484 0.2079 0.3631 2.8774 0.1624 1.0097 14 10
3.2 Interpretation of the model -1 for HEPG2 Cell Inhibition
(Test set: 3, 6, 8, 13, 14, 15 and 23)
pIC50 (column) =) + 0.2682(T_2_C_6) +0.9756 (Psi-1) -0.3302 (T_C_C_7) +1.8202
(DeltaEpsilinB) +0.1223(SaasCE-index)+0.1259(T_T_O_5) – 0.2192(T_O_O_3) -
0.2688(T_T_F_7) – 0.0789 (T_2_T_5) – 0.0709 (Chi4)0.004
Statistics: [n= 16; Degree of freedom=5 r2 = 0.7207; q
2=0.5227 F test=1.2903; r
2se=0.3517;
q2se = 0.4597; pred_r
2= 0.7665; pred_r
2se = 0.1724
From equation, model 1 explains 72.07% (r2
= 0.7207) of the total variance in the training set
as well as it has internal (q2) and external (pred_r
2) predictive ability of 52.27 % and 76.65 %
respectively. The F test shows the statistical significance of 99.99 % of the model that means
that probability of failure of the model is 1 in 10000. In addition, the randomization test

www.ijppr.humanjournals.com
Citation: Dr. Shaikh Anwar Rafique et al. Ijppr.Human, 2017; Vol. 9 (4): 51-70. 61
shows confidence of 99.9999 (Alpha Rand Pred R^2 = 0.00000) that the generated model is
not random and hence chosen as the QSAR model. The F-test=1.2903 which is greater than
the tabulated value 1.12195. From QSAR model 1,
1. Positive value of T_2_C_6 [This is any single or double bond separated from carbon atom
by six bond] on the inhibitory activity indicated that higher value leads to better inhibitory
activity whereas lower value leads to decrease inhibitory activity.
2. The positive coefficient value of Psi1 [Kubinyl H 1994] [This is a measure of hydrogen
bonding propensity of the molecule and or polar surface area.] on the inhibitory activity
indicated that higher value leads to better inhibitory activity whereas lower value leads to
decrease inhibitory activity.
3. The negative coefficient value of T_C_C_7 [This is the count of a number of any single
or double bonded carbon separated by other carbon by seven bonds] on the inhibitory activity
indicated that lower value leads to better inhibitory activity whereas higher value leads to
decrease inhibitory activity.
4. The positive coefficient value of DeltaEpsionB [Roy et al 2011] [A measure of the
contribution of unsaturation.]On the biological activity indicated that higher values lead to
good inhibitory activity while lower value leads to reduced inhibitory activity.
5. Positive coefficient value of SaasCEindex [Electropological state indices for number of
carbon atom connected with one single bond along with two aromatic bonds.]On the
biological activity indicated that higher values lead to good inhibitory activity while lower
value leads to reduced inhibitory activity
6. The positive coefficient value of T_T_O_5 [count of a number of oxygen atom separated
from any double or single bond by five bonds.]On the biological activity indicated that higher
values lead to good inhibitory activity while lower value leads to reduced inhibitory activity.
7. The negative coefficient value of T_O_O_3 [This is the count of a number of the oxygen
atom (single double or triple)separated from any other oxygen atoms by three bonds] on the
inhibitory activity indicated that lower value leads to better inhibitory activity whereas higher
value leads to decrease inhibitory activity.
www.ijppr.humanjournals.com
Citation: Dr. Shaikh Anwar Rafique et al. Ijppr.Human, 2017; Vol. 9 (4): 51-70. 62
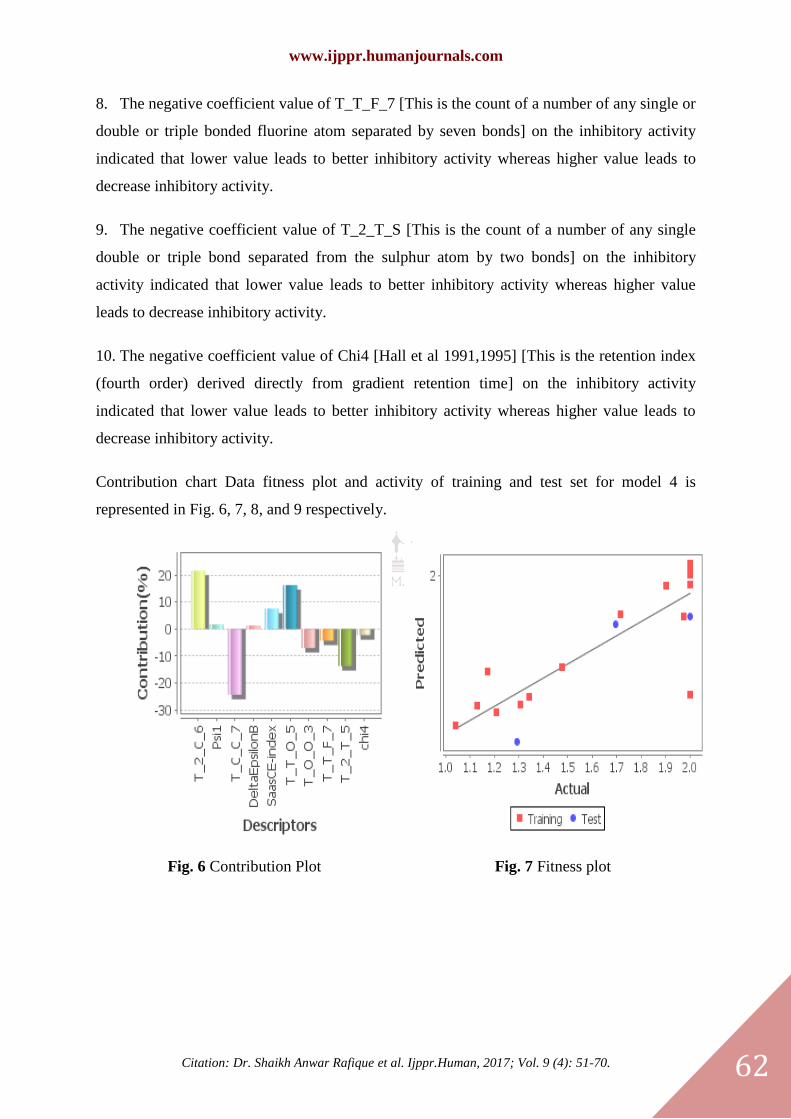
8. The negative coefficient value of T_T_F_7 [This is the count of a number of any single or
double or triple bonded fluorine atom separated by seven bonds] on the inhibitory activity
indicated that lower value leads to better inhibitory activity whereas higher value leads to
decrease inhibitory activity.
9. The negative coefficient value of T_2_T_S [This is the count of a number of any single
double or triple bond separated from the sulphur atom by two bonds] on the inhibitory
activity indicated that lower value leads to better inhibitory activity whereas higher value
leads to decrease inhibitory activity.
10. The negative coefficient value of Chi4 [Hall et al 1991,1995] [This is the retention index
(fourth order) derived directly from gradient retention time] on the inhibitory activity
indicated that lower value leads to better inhibitory activity whereas higher value leads to
decrease inhibitory activity.
Contribution chart Data fitness plot and activity of training and test set for model 4 is
represented in Fig. 6, 7, 8, and 9 respectively.
Fig. 6 Contribution Plot Fig. 7 Fitness plot
www.ijppr.humanjournals.com
Citation: Dr. Shaikh Anwar Rafique et al. Ijppr.Human, 2017; Vol. 9 (4): 51-70. 63
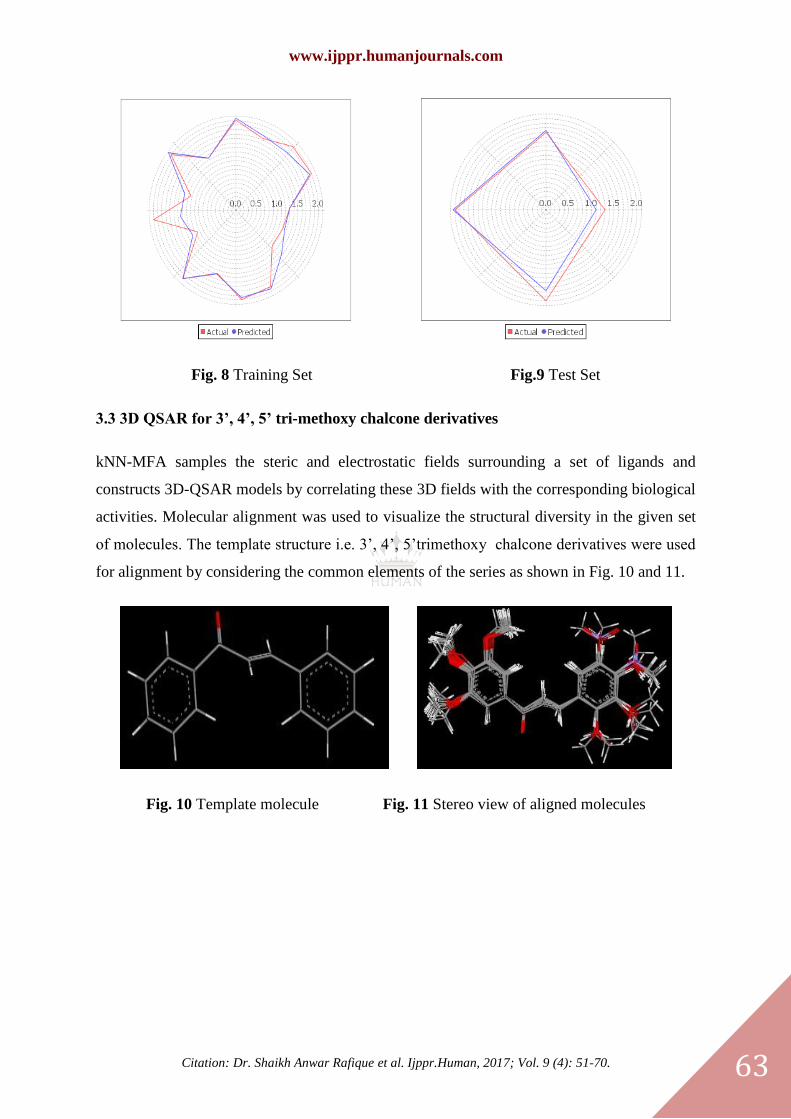
Fig. 8 Training Set Fig.9 Test Set
3.3 3D QSAR for 3’, 4’, 5’ tri-methoxy chalcone derivatives
kNN-MFA samples the steric and electrostatic fields surrounding a set of ligands and
constructs 3D-QSAR models by correlating these 3D fields with the corresponding biological
activities. Molecular alignment was used to visualize the structural diversity in the given set
of molecules. The template structure i.e. 3’, 4’, 5’trimethoxy chalcone derivatives were used
for alignment by considering the common elements of the series as shown in Fig. 10 and 11.
Fig. 10 Template molecule Fig. 11 Stereo view of aligned molecules
www.ijppr.humanjournals.com
Citation: Dr. Shaikh Anwar Rafique et al. Ijppr.Human, 2017; Vol. 9 (4): 51-70. 64
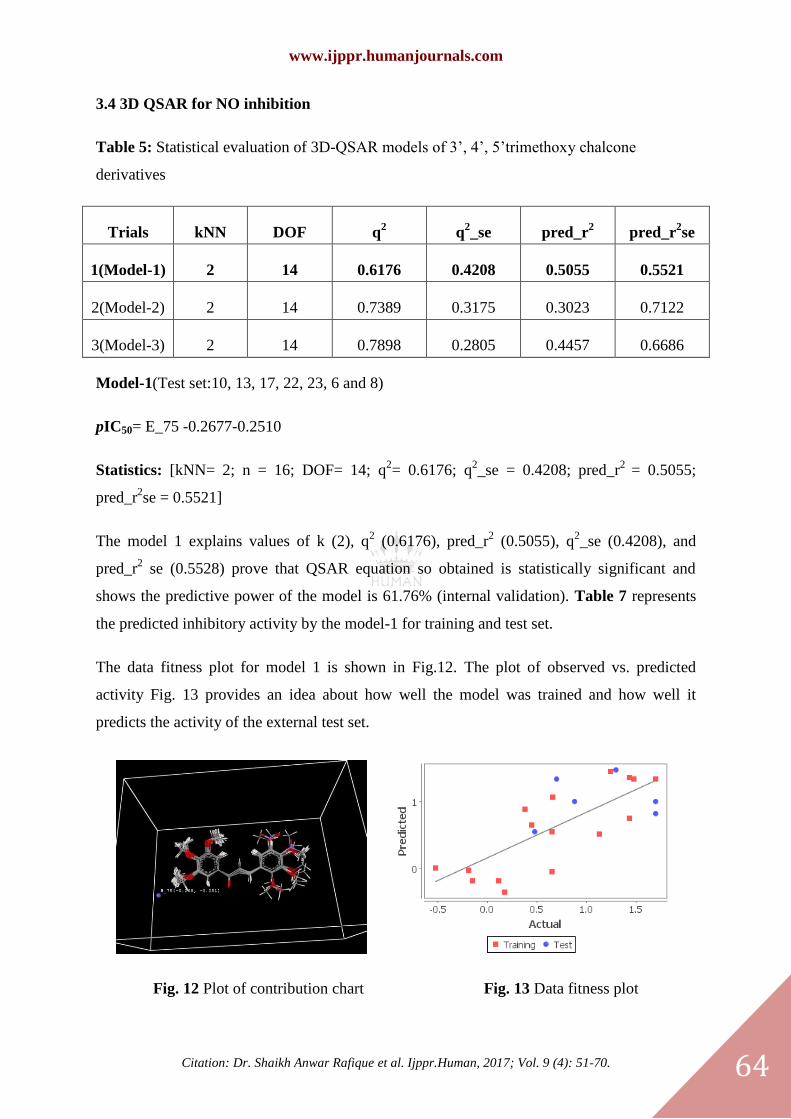
3.4 3D QSAR for NO inhibition
Table 5: Statistical evaluation of 3D-QSAR models of 3’, 4’, 5’trimethoxy chalcone
derivatives
Trials kNN DOF q2
q2_se pred_r
2 pred_r
2se
1(Model-1) 2 14 0.6176 0.4208 0.5055 0.5521
2(Model-2) 2 14 0.7389 0.3175 0.3023 0.7122
3(Model-3) 2 14 0.7898 0.2805 0.4457 0.6686
Model-1(Test set:10, 13, 17, 22, 23, 6 and 8)
pIC50= E_75 -0.2677-0.2510
Statistics: [kNN= 2; n = 16; DOF= 14; q2= 0.6176; q
2_se = 0.4208; pred_r
2 = 0.5055;
pred_r2se = 0.5521]
The model 1 explains values of k (2), q2 (0.6176), pred_r
2 (0.5055), q
2_se (0.4208), and
pred_r2 se (0.5528) prove that QSAR equation so obtained is statistically significant and
shows the predictive power of the model is 61.76% (internal validation). Table 7 represents
the predicted inhibitory activity by the model-1 for training and test set.
The data fitness plot for model 1 is shown in Fig.12. The plot of observed vs. predicted
activity Fig. 13 provides an idea about how well the model was trained and how well it
predicts the activity of the external test set.
Fig. 12 Plot of contribution chart Fig. 13 Data fitness plot
www.ijppr.humanjournals.com
Citation: Dr. Shaikh Anwar Rafique et al. Ijppr.Human, 2017; Vol. 9 (4): 51-70. 65
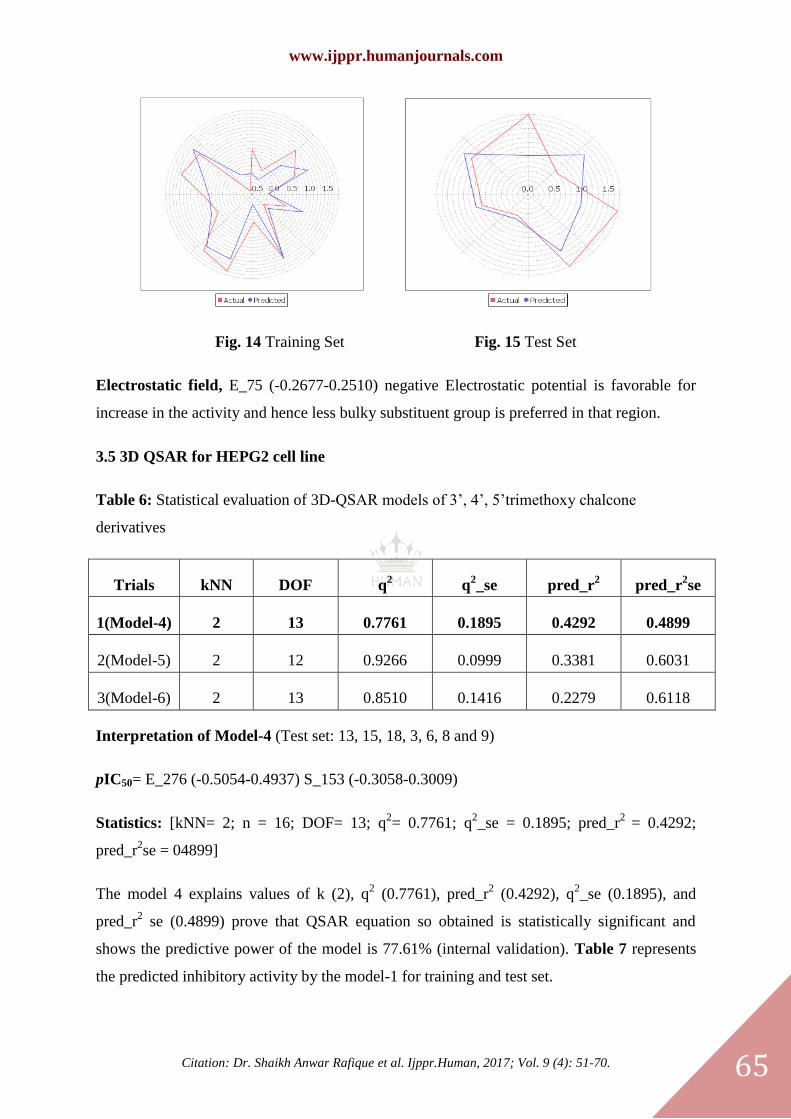
Fig. 14 Training Set Fig. 15 Test Set
Electrostatic field, E_75 (-0.2677-0.2510) negative Electrostatic potential is favorable for
increase in the activity and hence less bulky substituent group is preferred in that region.
3.5 3D QSAR for HEPG2 cell line
Table 6: Statistical evaluation of 3D-QSAR models of 3’, 4’, 5’trimethoxy chalcone
derivatives
Trials kNN DOF q2
q2_se pred_r
2 pred_r
2se
1(Model-4) 2 13 0.7761 0.1895 0.4292 0.4899
2(Model-5) 2 12 0.9266 0.0999 0.3381 0.6031
3(Model-6) 2 13 0.8510 0.1416 0.2279 0.6118
Interpretation of Model-4 (Test set: 13, 15, 18, 3, 6, 8 and 9)
pIC50= E_276 (-0.5054-0.4937) S_153 (-0.3058-0.3009)
Statistics: [kNN= 2; n = 16; DOF= 13; q2= 0.7761; q
2_se = 0.1895; pred_r
2 = 0.4292;
pred_r2se = 04899]
The model 4 explains values of k (2), q2 (0.7761), pred_r
2 (0.4292), q
2_se (0.1895), and
pred_r2 se (0.4899) prove that QSAR equation so obtained is statistically significant and
shows the predictive power of the model is 77.61% (internal validation). Table 7 represents
the predicted inhibitory activity by the model-1 for training and test set.
www.ijppr.humanjournals.com
Citation: Dr. Shaikh Anwar Rafique et al. Ijppr.Human, 2017; Vol. 9 (4): 51-70. 66
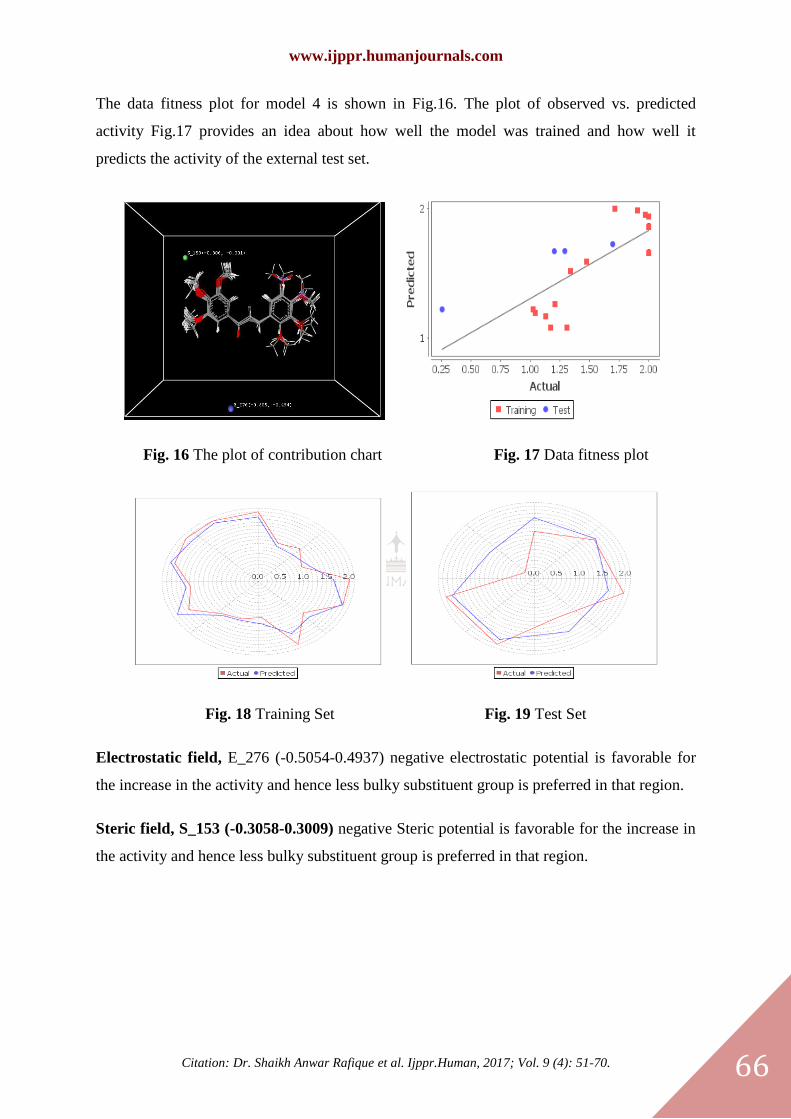
The data fitness plot for model 4 is shown in Fig.16. The plot of observed vs. predicted
activity Fig.17 provides an idea about how well the model was trained and how well it
predicts the activity of the external test set.
Fig. 16 The plot of contribution chart Fig. 17 Data fitness plot
Fig. 18 Training Set Fig. 19 Test Set
Electrostatic field, E_276 (-0.5054-0.4937) negative electrostatic potential is favorable for
the increase in the activity and hence less bulky substituent group is preferred in that region.
Steric field, S_153 (-0.3058-0.3009) negative Steric potential is favorable for the increase in
the activity and hence less bulky substituent group is preferred in that region.
www.ijppr.humanjournals.com
Citation: Dr. Shaikh Anwar Rafique et al. Ijppr.Human, 2017; Vol. 9 (4): 51-70. 67
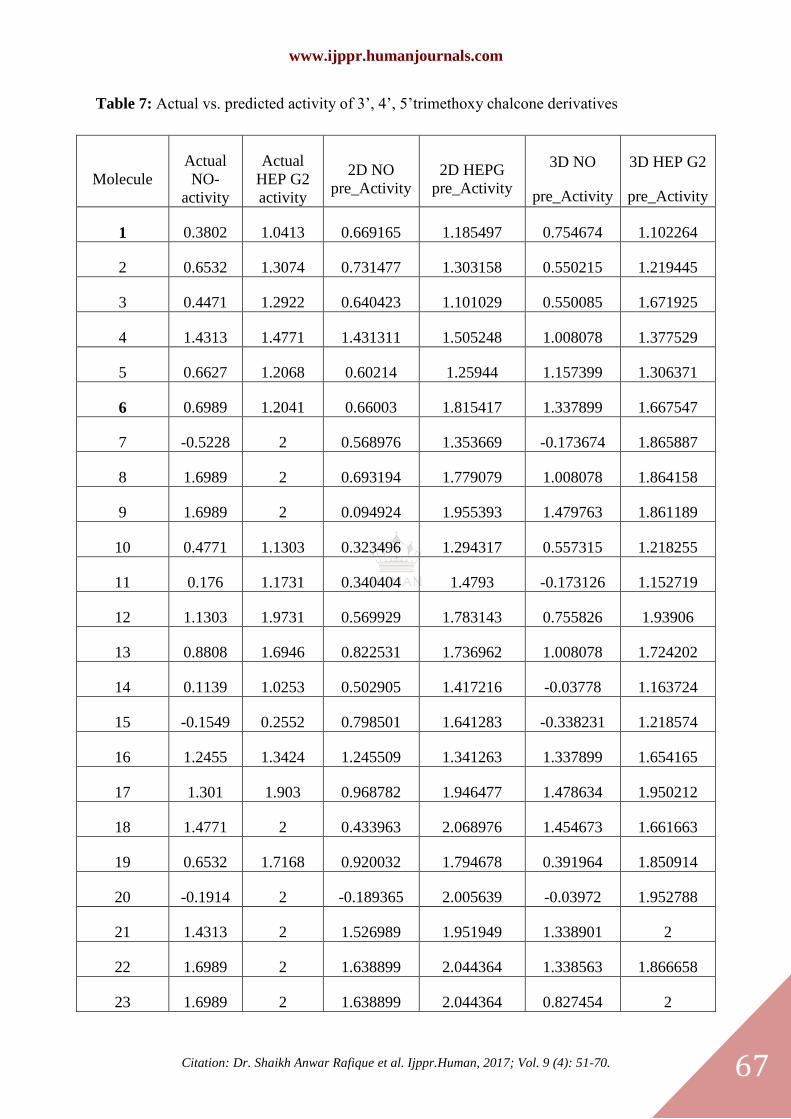
Table 7: Actual vs. predicted activity of 3’, 4’, 5’trimethoxy chalcone derivatives
Molecule
Actual
NO-
activity
Actual
HEP G2
activity
2D NO
pre_Activity
2D HEPG
pre_Activity
3D NO
pre_Activity
3D HEP G2
pre_Activity
1 0.3802 1.0413 0.669165 1.185497 0.754674 1.102264
2 0.6532 1.3074 0.731477 1.303158 0.550215 1.219445
3 0.4471 1.2922 0.640423 1.101029 0.550085 1.671925
4 1.4313 1.4771 1.431311 1.505248 1.008078 1.377529
5 0.6627 1.2068 0.60214 1.25944 1.157399 1.306371
6 0.6989 1.2041 0.66003 1.815417 1.337899 1.667547
7 -0.5228 2 0.568976 1.353669 -0.173674 1.865887
8 1.6989 2 0.693194 1.779079 1.008078 1.864158
9 1.6989 2 0.094924 1.955393 1.479763 1.861189
10 0.4771 1.1303 0.323496 1.294317 0.557315 1.218255
11 0.176 1.1731 0.340404 1.4793 -0.173126 1.152719
12 1.1303 1.9731 0.569929 1.783143 0.755826 1.93906
13 0.8808 1.6946 0.822531 1.736962 1.008078 1.724202
14 0.1139 1.0253 0.502905 1.417216 -0.03778 1.163724
15 -0.1549 0.2552 0.798501 1.641283 -0.338231 1.218574
16 1.2455 1.3424 1.245509 1.341263 1.337899 1.654165
17 1.301 1.903 0.968782 1.946477 1.478634 1.950212
18 1.4771 2 0.433963 2.068976 1.454673 1.661663
19 0.6532 1.7168 0.920032 1.794678 0.391964 1.850914
20 -0.1914 2 -0.189365 2.005639 -0.03972 1.952788
21 1.4313 2 1.526989 1.951949 1.338901 2
22 1.6989 2 1.638899 2.044364 1.338563 1.866658
23 1.6989 2 1.638899 2.044364 0.827454 2
www.ijppr.humanjournals.com
Citation: Dr. Shaikh Anwar Rafique et al. Ijppr.Human, 2017; Vol. 9 (4): 51-70. 68
3.6 Design and activity prediction of newer derivatives
From the best models obtained, some newer compounds were designed which had the better
activity than the reported one. The structures were not reported earlier anywhere is confirmed
by ChemSpider.
4. CONCLUSIONS:
In the present investigation, all proposed QSAR models were statistically significant, thus,
from above QSAR investigations, it could be concluded that 2D/3D descriptors properties of
substituted 3’, 4’, 5’trimethoxy chalcone derivatives are mainly involved in the treatment of
drug abuse disorders. The good correlation between experimental and predicted biological
activity for compounds in the test set further highlights the reliability of the constructed
QSAR model. The requirements for the more potent biological activity are explored with 2D,
3D, and group based QSAR studies. The 2D technique indicates the importance of SdsCHE-
index, SsFcount, Sssscount for inhibition of Nitric oxide production and T_2_C_6, Psi-1,
T_C_C_7, DeltaEpsilinB, SaasCE-index, T_T_O_5, T_O_O_3, T_T_F_7, T_2_T_5, Chi4
for Tumor cell proliferation activity of the compounds. The 3D QSAR analysis makes it
possible to relate chemical structures of ligands and their binding affinity with respect to
different bio targets by using the kNN-MFA techniques. Thus it provides a direct view of
factors expressed in terms of molecular fields (electrostatic, steric) affecting the binding
affinity. This, in turn, could give the reasonably good prediction of binding affinity. The
location and range of function values at the field points selected by the models provide clues
for the design of new molecules. Hence, this method is expected to provide a good alternative
for the drug design.
The 3D-QSAR model showed that electrostatic effects dominantly determine the binding
affinities for inhibition of Nitric oxide production, Steric and Electrostatic effect dominantly
determined the binding affinities for Tumor cell proliferation these QSAR models developed
in this study would be useful for the development of new drugs as a medicament for the NO
inhibition and tumor cell proliferation The 2D-QSAR studies revealed that SdsCHE index
and Psi-1 were the major contributing descriptors for both the activities respectively. The
descriptor values obtained in this study helped in the quantification of the structural features
of 3’, 4’, 5’trimethoxy chalcone derivatives.
www.ijppr.humanjournals.com
Citation: Dr. Shaikh Anwar Rafique et al. Ijppr.Human, 2017; Vol. 9 (4): 51-70. 69
5. ACKNOWLEDGMENT:
The author wishes to express gratitude to V-life Science Technologies Pvt. Ltd. Pune, for
providing the software for the study. Also, the authors are thankful to the trustee Allana
College of Pharmacy Pune for providing the necessary facilities to carry out the research
work.
6. REFERENCES:
[1] Rao YK, Fang SH, Tzeng YM. Synthesis and biological evaluation of 3’, 4’, 5’trimethoxy chalcone analogs
as inhibitors of nitric oxide production and tumor cell proliferation. Bioorg. Med. Chem. 2009; 17:7909-7914.
[2] Avila HP, Smania EF, Monache FD, Smania A, Structure–activity relationship of antibacterial chalcones. Jr.
Bioorg. Med. Chem. 2008; 16: 9790.
[3] Cheng JH, Hung CF, Yang SC, Wang J P, Won SJ, Lin C N, Synthesis and cytotoxic, anti-inflammatory,
and antioxidant activities of 2′,5′-di alkoxyl chalcones as cancer chemopreventive agents. Bioorg. Med.Chem.
2008;16:7270-7276.
[4] Sortino M, Delgado P, Juarez S, Quiroga J, Abonia R, Insuasty B, Nogueras M, Rodero L, Garibotto FM,
Enriz RD, Zacchino SA, Synthesis and antifungal activity of (Z)-5-arylidenerhodanines. Bioorg. Med. Chem.
2007; 15: 484-494.
[5] Vargas MLY, Castelli MV, Kuznetsov VV, Urbina GJM, Lopez SN, Sortino M., Enriz RD, Ribas JC,
Zacchino S, In vitro antifungal activity of new series of homoallylamines and related compounds with inhibitory
properties of the synthesis of fungal cell wall polymers. Bioorg. Med. Chem. 2003; 11: 1531-1550.
[6] Lopez SN, Castelli MV, Zacchino SA, Dominguez JN, Lobo G, Charris-Charris J, Cortes JC, Ribas JC,
Devia C, Rodriguez AM, Enriz RD, In vitro antifungal evaluation and structure–activity relationships of a new
series of chalcone derivatives and synthetic analogs with inhibitory properties against polymers of the fungal
cell wall. Bioorg. Med. Chem. 2001; 8:1999.
[7] Katsori AM, Hadjipavlou-Litina D. Chalcones in cancer: understanding their role in terms of QSAR Curr.
Med. Chem, 2009;16: 1062-1081.
[8] Achanta G, Modzelewska A, Feng L, Khan SR, Huang P, A Boronic-Chalcone Derivative Exhibits Potent
Anticancer Activity through Inhibition of the Proteasome. Mol. Pharmacol. 2006; 70:426-433.
[9] Modzelewska A, Pettit C, Achanta G, Davidson NE, Huang P, Khan SR, Anticancer activities of novel
chalcone and bis-chalcone derivatives. Bioorg. Med.Chem. 2006; 14: 3491-3495.
[10] Kumar S K, Hager E, Pettit C, Gurulingappa H, Davidson NE, Khan SR, Design, Synthesis, and Evaluation
of Novel Boronic-Chalcone Derivatives as Antitumor Agents. J. Med.Chem, 2003; 46:2813-2815.
[11]KULKARNI VM, AND BOTHARA KG, Drug Design, 3rd Ed. Pune: Nirali Prakashan; 2008.
[12] QSARpro, VLife Sciences Technologies, Pvt. Ltd. Pune, India. Available from:
http://www.vlifesciences.com 2017
[13] THOMAS G. (2003), Fundamentals of Medicinal chemistry, 1st Ed. New York, USA: John Wiley & Sons
Ltd; pp. 71, 90, 92, 138-141.
[14] CRAMER RD, PATTERSON DE, and BUNCE JD. (1988), Comparative molecular field analysis
(CoMFA). 1. Effect of shape on binding of steroids to carrier proteins. Journal of the American Chemical
Society, 110, pp. 5959-5967
[15] PATRIC GL. (2006), An Introduction to Medicinal chemistry, 3rd Ed. New York: Oxford University Press;
pp. 291, 294, 295.
[16] AJMANI S, JADHAV K, and KULKARNI S, Three-dimensional QSAR using the k-nearest neighbor
method and its interpretation. Journal of chemical information and modeling.2006; 46: pp. 24-31.
[17] Bolton S. Pharmaceutical statistics- Practical & Clinical applications, 5th
Ed. Informa Healthcare: New
York; 2009, Vol. 65, p 119.
www.ijppr.humanjournals.com
Citation: Dr. Shaikh Anwar Rafique et al. Ijppr.Human, 2017; Vol. 9 (4): 51-70. 70
[18]KUBINY H. (1994), Variable Selection in QSAR Studies. I. An Evolutionary Algorithm. Quantitative
Structure-Activity Relationships, 13 (3), pp. 285-294.
[19]Roy K, Das R. SAR and QSAR in Environmental Res., On some novel extended topochemical atom (ETA)
parameters for effective encoding of chemical information and modeling of fundamental physicochemical
properties. Taylor & Francis. 2011; 22: (5-6), 451-472
[20] Hall LH, Mohney BK, and Kier LB, The Electrotopological State: Structure Information at the Atomic
Level for Molecular Graphs, J. Chem. Inf. Comput. Sci. 1991; 31: 76.
[21] Hall LH and Kier LB. Electrotopological State Indices for Atom Types: A Novel Combination of
Electronic, Topological, and Valence State Information J. Chem. Inf. Comput. Sci. 1995; 35:1039-1045.