Embed Size (px)
Citation preview
Journal of Constructional Steel Research 58 (2002) 565–604www.elsevier.com/locate/jcsr
Development of improved welded momentconnections for earthquake-resistant design
J.M. Riclesa ∗, J.W. Fishera, Le-Wu Lua, E.J. Kaufmannb
a Department of Civil and Environmental Engineering, Lehigh University, 117 ATLSS Drive,Bethlehem PA 18015-4729 USA
b ATLSS Engineering Research Center, Lehigh University, 117 ATLSS Drive, Bethlehem PA 18015-4729, USA
Received 15 May 2001; received in revised form 16 August 2001; accepted 19 October 2001
Abstract
A comprehensive research program was conducted at Lehigh University to investigate thecauses of brittle failures observed in numerous welded connections during the 1994 Northridgeearthquake and ways to improve their ductility. In this program, tests on pre-Northridge con-nection details demonstrate that several weak links in the connection design and fabricationresulted in their premature failures. To develop improved details for welded unreinforced con-nections the effects of weld metal, weld access hole geometry, beam web attachment, conti-nuity plates, and panel zone strength on cyclic ductility were investigated using non-linearfinite element models and full-scale connection tests. The results from these studies arepresented, along with recommendations to insure ductile connection performance. 2002Elsevier Science Ltd. All rights reserved.
Keywords: Beam web attachment; Complete joint penetration groove welds; Continuity plates; Ductility;Finite element analysis; Full-scale test; Fracture; Inelastic rotation; Notch toughness; Panel zone; Seismic-resistant design; Steel moment-resisting frame; Weld access hole; Weld metal; Welded moment connec-tion
∗ Corresponding author.E-mail address: [email protected] (J.M. Ricles).
0143-974X/02/$ - see front matter 2002 Elsevier Science Ltd. All rights reserved.PII: S0143 -974X(01)00095-5
566 J.M. Ricles et al. / Journal of Constructional Steel Research 58 (2002) 565–604
1. Introduction
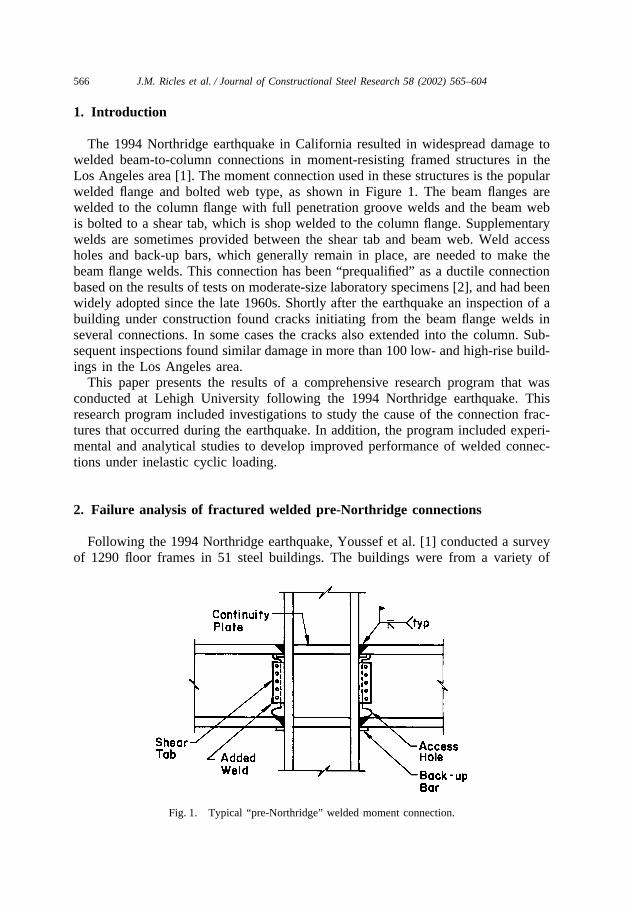
The 1994 Northridge earthquake in California resulted in widespread damage towelded beam-to-column connections in moment-resisting framed structures in theLos Angeles area [1]. The moment connection used in these structures is the popularwelded flange and bolted web type, as shown in Figure 1. The beam flanges arewelded to the column flange with full penetration groove welds and the beam webis bolted to a shear tab, which is shop welded to the column flange. Supplementarywelds are sometimes provided between the shear tab and beam web. Weld accessholes and back-up bars, which generally remain in place, are needed to make thebeam flange welds. This connection has been “prequalified” as a ductile connectionbased on the results of tests on moderate-size laboratory specimens [2], and had beenwidely adopted since the late 1960s. Shortly after the earthquake an inspection of abuilding under construction found cracks initiating from the beam flange welds inseveral connections. In some cases the cracks also extended into the column. Sub-sequent inspections found similar damage in more than 100 low- and high-rise build-ings in the Los Angeles area.
This paper presents the results of a comprehensive research program that wasconducted at Lehigh University following the 1994 Northridge earthquake. Thisresearch program included investigations to study the cause of the connection frac-tures that occurred during the earthquake. In addition, the program included experi-mental and analytical studies to develop improved performance of welded connec-tions under inelastic cyclic loading.
2. Failure analysis of fractured welded pre-Northridge connections
Following the 1994 Northridge earthquake, Youssef et al. [1] conducted a surveyof 1290 floor frames in 51 steel buildings. The buildings were from a variety of
Fig. 1. Typical “pre-Northridge” welded moment connection.
567J.M. Ricles et al. / Journal of Constructional Steel Research 58 (2002) 565–604
locations in Los Angeles, of different sizes, frame configuration, and constructiontype. The buildings were designed in the period from 1966 to 1994. The surveyidentified several different forms of crack patterns occurring near the beam flangeweld. They are defined as follows:
� G3 Top or bottom beam flange fracture in heat-affected zone.� C1 Incipient column flange crack.� C2 Complete column flange tearout or divot.� C3 Full or partial column flange crack in heat-affected zone.� C4 Full or partial column flange crack outside heat-affected zone.� C5 Laminar column flange tearing.� W1 Incipient beam flange weld crack, especially at weld root.� W2 Crack through weld metal, full or partial width of beam flange.� W3 Fracture at fusion line with beam flange.� W4 Fracture at fusion line with column flange.
Youssef et al. [1] reported that, based on the survey, the most common form ofdamage found was partial or complete fracture of the beam flange groove welds (W1and W2). About 40% of the inspected floor frames had some cracking in the bottomweld, and about 15% had some cracking in the top weld. Damage to the base metalwas found to occur most frequently as a fracture of the column flange adjacent tothe beam bottom flange weld; 15% of the floor frames inspected had one or moreincidences of this type of fracture. Youssef et al. [1] concluded that the observedcolumn flange and weld fracture patterns strongly suggested that the damage wasrelated to the condition at the weld root. The welded joints appeared to be brittle,with little evidence of inelastic behavior in the weldment or base metal. The fractureswere also attributed to a variety of other factors, including the weld process, qualityof workmanship, base metal properties, and connection design [3–5].
A study was undertaken at Lehigh University [6] in order to characterize the originof the fracture and material properties of failed connections, thereby permitting arational failure analysis to be made. A detailed analysis was performed of 19 fracturesremoved from five different buildings damaged during the Northridge earthquake.The fractures included the most common types of weld and column fractures reportedin the building survey. The buildings selected were located at different distances anddirections from the earthquake epicenter and each suffered a different extent of dam-age. The buildings were of sizes, designs, and ages representative of a large numberof the buildings damaged in the earthquake.
All 19 samples were removed from the beam bottom flange weld joints. This ispartly due to the higher frequency of bottom flange fractures but also because theywere more readily accessible for removal. The connection designs were all similarwith full penetration groove welded flanges and bolted shear tabs. The samples con-sisted of a relatively wide variety of beam and column sizes. The beam sizes rangedfrom W24 × 76 to W36 × 210, and the column sizes ranged from W14 × 120 toW14 × 398.
The most frequently represented fracture type among the 19 fracture samples was
568 J.M. Ricles et al. / Journal of Constructional Steel Research 58 (2002) 565–604
Type C3 (11 samples), which resulted in a fracture penetrating across the columnflange. Four samples exhibited fracture of the column, which formed a divot in thecolumn flange (Type C2). The remaining four samples fractured in the vicinity ofthe weld fusion line in the column flange (Type W4).
The fracture surfaces of all of the samples were analyzed in order to characterizethe fractures and to determine the location of fracture origin. In addition, the sizeand source of the originating defect was recorded. The fracture origins were exam-ined with a scanning electron microscope (SEM) to obtain information concerningthe fracture mechanism at the fracture initiation. The details are presented by Kauf-mann et al. [6].
From the SEM examinations, cleavage fracture was found to be the mechanismof crack propagation in all of the samples regardless of crack propagation path. Also,the location and source of fracture initiation was found to be the same in all of thesamples. Brittle fracture initiated close to the mid-width of the weld (near the columncenterline) usually from a weld root incomplete fusion flaw in this area arising fromentrapped slag or porosity at the back-up bar. A higher incidence of weld root incom-plete fusion is expected in this area due to the limited access for welding affordedby the weld access hole.
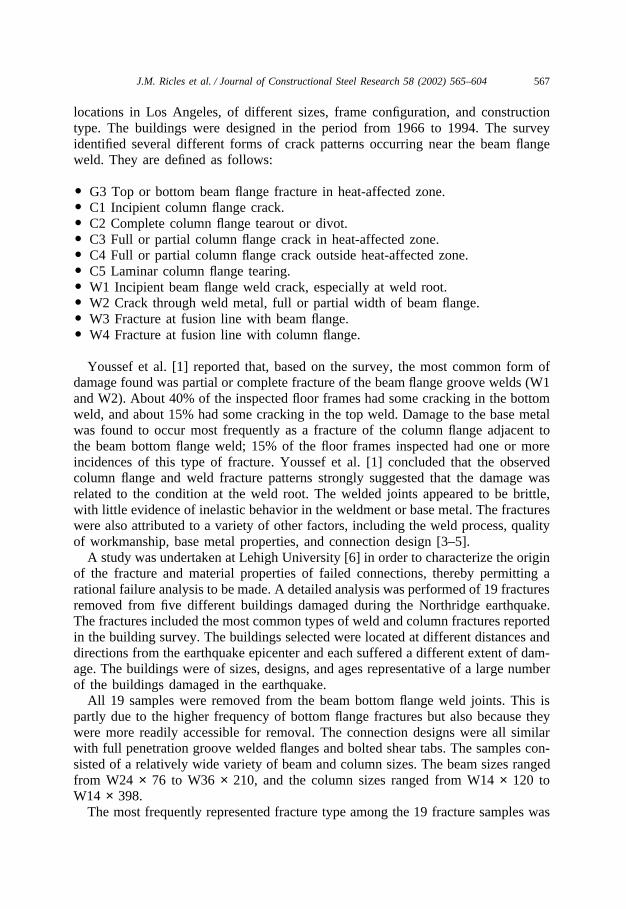
The depths of all fracture initiating root flaws, as well as the thickness of the weldback-up bar, were measured. A large range of flaw sizes (0.8 mm to 10 mm) thatinitiated connection fracture was found within the test samples. This suggests thatthe weld root flaw itself is not the primary reason for fracture but when coupledwith the notch introduced by the weld back-up bar (of thickness of 9.5 mm) providesa large effective flaw depth aeff of 10 to 20 mm. Figure 2 shows the distribution offracture-initiating effective flaw sizes within the limited test samples. The minimumeffective flaw size is represented by the weld backing thickness. The most frequentfracture-initiating effective flaw size is seen to be between 10 mm and 12 mm.
Fig. 2. Distribution of fracture initiating weld flaw sizes.
569J.M. Ricles et al. / Journal of Constructional Steel Research 58 (2002) 565–604
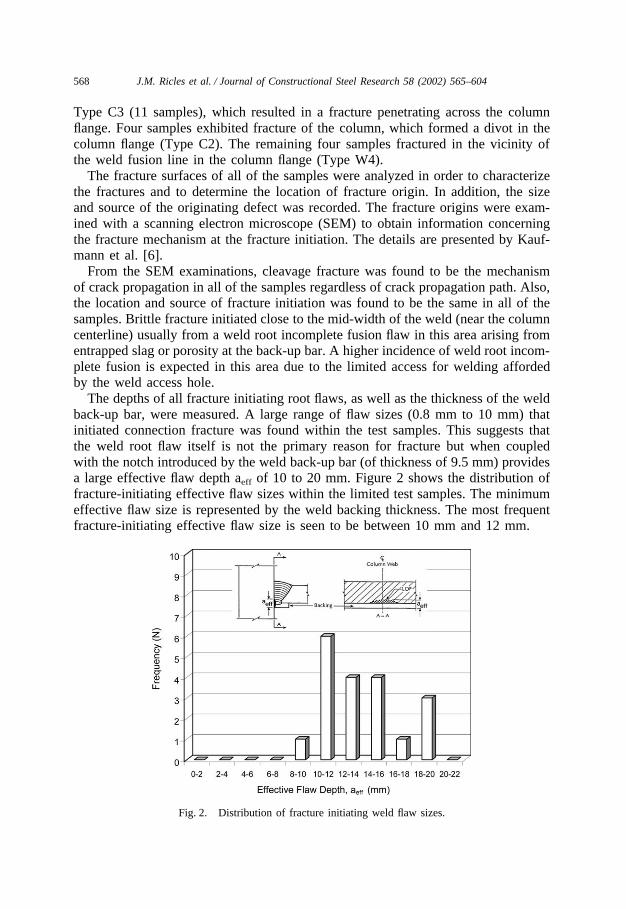
Another common factor among all of the fractured connections that were studiedis that the welds were deposited with E70T-4 electrodes, which were in commonuse prior to the Northridge earthquake. E70T-4 is a self-shielded, flux-cored wirewith a yield strength typically in the range of 415–448 MPa and a tensile strengthof about 585 MPa, and has been popular among fabricators because of its highdeposition rate. The notch toughness tests of weld metal removed from sixteen con-nection samples, other damaged building connections [5] and weld metal depositedin laboratory tests [6,7] have consistently shown that the E70T-4 weld metal providesa low level of notch toughness. This is consistent with the fractographic observationson the 19 samples that indicate that brittle fracture of all samples examined developedby crack instability from a crack-like flaw located within this low toughness weldmetal. Shown in Figure 3 is a comparison of CVN values of various weld metalsproduced in the laboratory, including: E70T-4; E70TG-K2 (another self-shielded,flux-core electrode); and E7018 that is used in the traditional shielded-metal-arcwelding process. At 21°C, the lower bound CVN energy is only about 14 Joules forthe E70T-4 electrode compared to 70 Joules and 180 Joules for the E70TG-K2 andE7018 electrodes, respectively.
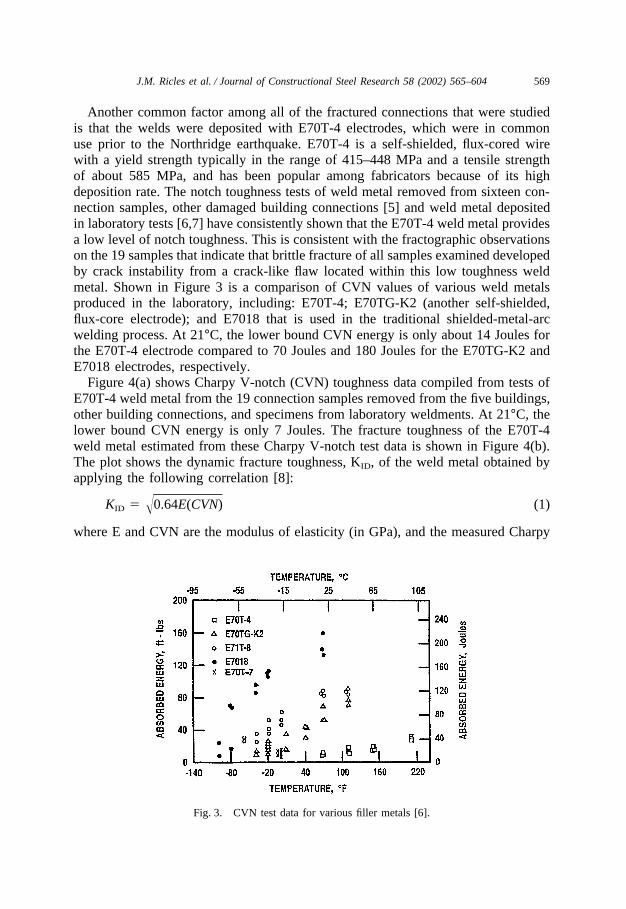
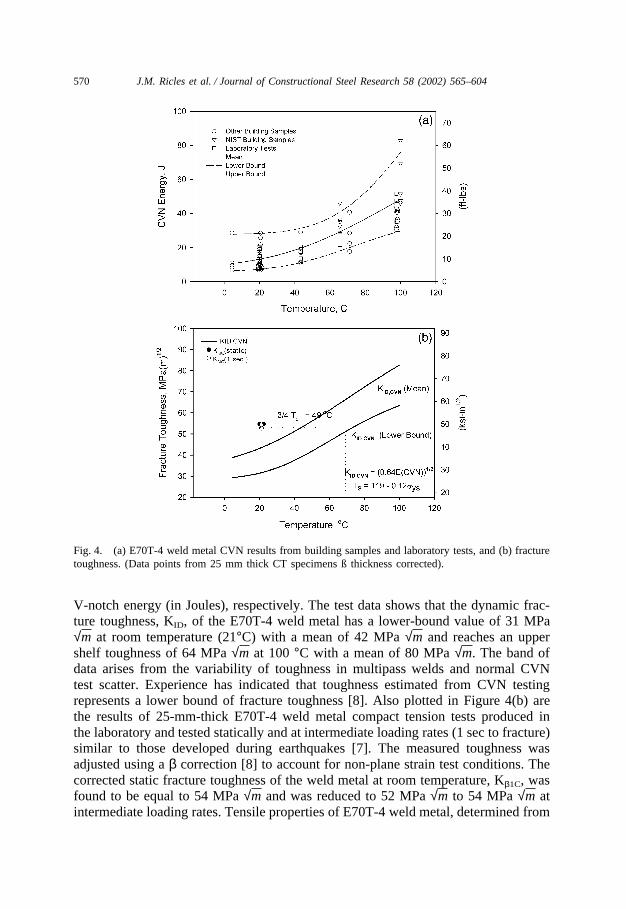
Figure 4(a) shows Charpy V-notch (CVN) toughness data compiled from tests ofE70T-4 weld metal from the 19 connection samples removed from the five buildings,other building connections, and specimens from laboratory weldments. At 21°C, thelower bound CVN energy is only 7 Joules. The fracture toughness of the E70T-4weld metal estimated from these Charpy V-notch test data is shown in Figure 4(b).The plot shows the dynamic fracture toughness, KID, of the weld metal obtained byapplying the following correlation [8]:
KID � �0.64E(CVN) (1)
where E and CVN are the modulus of elasticity (in GPa), and the measured Charpy
Fig. 3. CVN test data for various filler metals [6].
570 J.M. Ricles et al. / Journal of Constructional Steel Research 58 (2002) 565–604
Fig. 4. (a) E70T-4 weld metal CVN results from building samples and laboratory tests, and (b) fracturetoughness. (Data points from 25 mm thick CT specimens ß thickness corrected).
V-notch energy (in Joules), respectively. The test data shows that the dynamic frac-ture toughness, KID, of the E70T-4 weld metal has a lower-bound value of 31 MPa√m at room temperature (21°C) with a mean of 42 MPa √m and reaches an uppershelf toughness of 64 MPa √m at 100 °C with a mean of 80 MPa √m. The band ofdata arises from the variability of toughness in multipass welds and normal CVNtest scatter. Experience has indicated that toughness estimated from CVN testingrepresents a lower bound of fracture toughness [8]. Also plotted in Figure 4(b) arethe results of 25-mm-thick E70T-4 weld metal compact tension tests produced inthe laboratory and tested statically and at intermediate loading rates (1 sec to fracture)similar to those developed during earthquakes [7]. The measured toughness wasadjusted using a β correction [8] to account for non-plane strain test conditions. Thecorrected static fracture toughness of the weld metal at room temperature, Kβ1C, wasfound to be equal to 54 MPa √m and was reduced to 52 MPa √m to 54 MPa √m atintermediate loading rates. Tensile properties of E70T-4 weld metal, determined from
571J.M. Ricles et al. / Journal of Constructional Steel Research 58 (2002) 565–604
laboratory weldments [7] show a 0.2% offset yield point of about 448 MPa. Hence,the strain rate shift between the estimated dynamic toughness, KID, and the staticfracture toughness, K1C (which in this case is the corrected static fracture toughnessKβ1C), is [8,9]
TS � 119�0.12sy�65°C (2)
Applying a strain shift rate of 0.75TS to account for intermediate loading rates,such as that which occurs in an earthquake, shows good agreement between thelower-bound dynamic toughness from the CVN test data and the intermediate-rateK1C tests. Based on this strain rate shift, the CVN test data of Figure 4(a) shows arange of toughness that can be provided by E70T-4 weld metal at intermediate load-ing rates as 50 MPa �m to 75 MPa �m at room temperature.
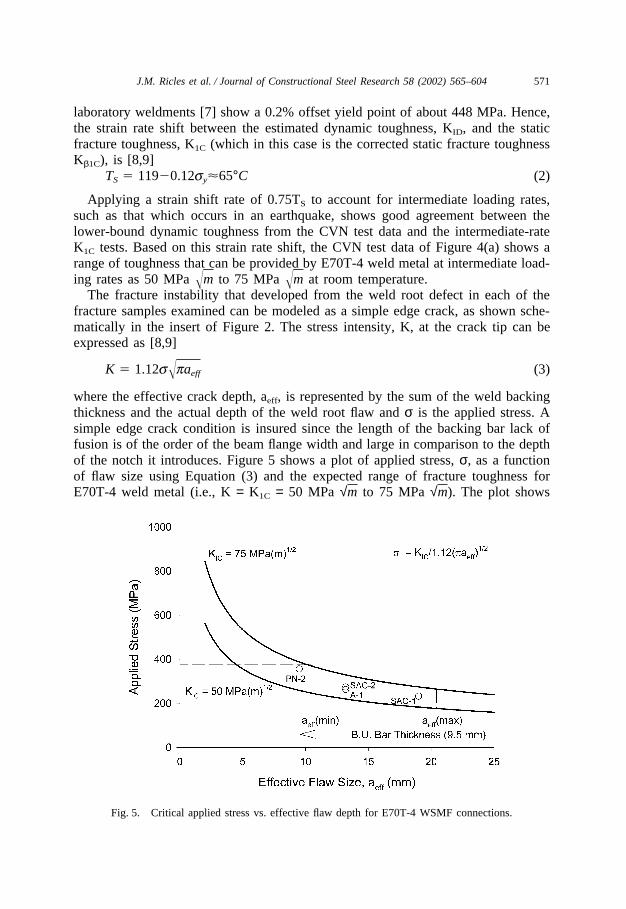
The fracture instability that developed from the weld root defect in each of thefracture samples examined can be modeled as a simple edge crack, as shown sche-matically in the insert of Figure 2. The stress intensity, K, at the crack tip can beexpressed as [8,9]
K � 1.12s�paeff (3)
where the effective crack depth, aeff, is represented by the sum of the weld backingthickness and the actual depth of the weld root flaw and σ is the applied stress. Asimple edge crack condition is insured since the length of the backing bar lack offusion is of the order of the beam flange width and large in comparison to the depthof the notch it introduces. Figure 5 shows a plot of applied stress, σ, as a functionof flaw size using Equation (3) and the expected range of fracture toughness forE70T-4 weld metal (i.e., K = K1C = 50 MPa √m to 75 MPa √m). The plot shows
Fig. 5. Critical applied stress vs. effective flaw depth for E70T-4 WSMF connections.
572 J.M. Ricles et al. / Journal of Constructional Steel Research 58 (2002) 565–604
the conditions of applied stress and flaw size under which crack instability willdevelop. For example, for flaw sizes on the order of the backing bar thickness (9.5mm), crack instability can occur at an applied stress of 258 MPa to 388 MPa, whichis in the range of the yield strength of A36 material that was typically used forbeams. The critical stress is further reduced by the presence of weld root flaws. Thisanalysis indicates that the cleavage fracture crack initiation which was observed inall welded connection samples would occur without significant yielding in the beamflange, and in cases where a large weld root defect existed fracture could occur underelastic stresses.
Propagation of the dynamic expanding crack will be influenced by the principalstresses and variations in material toughness. The combination of tensile stresses inthe beam flange and bending stresses in the column flange result in principal stressesthat can direct the crack in a variety of directions. This may lead to the developmentof fractures that extend across the column flange, divot-type fractures, or fracturesthat simply extend along the fusion line of the weld. The critical applied stress isalso influenced by other factors that increase or decrease the fracture stress. All ofthe fractures have tended to initiate at the mid-width of the beam flange. This is duein part to the higher probability of weld root defects at this location and also becauseof the higher stresses at this location; the stress distribution across the beam flangeis not uniform and with higher stresses at the web–flange junction (as will be dis-cussed later). Also, variations in weld procedure can introduce either tensile or com-pressive residual stresses at the weld root, which tends to decrease or increase theapplied stress at fracture.
3. Pre-Northridge connection tests
Following the Northridge earthquake, numerous experimental studies were con-ducted to investigate the various aspects that were believed to be associated withthe failures observed in the pre-Northridge connection and to improve connectionperformance.
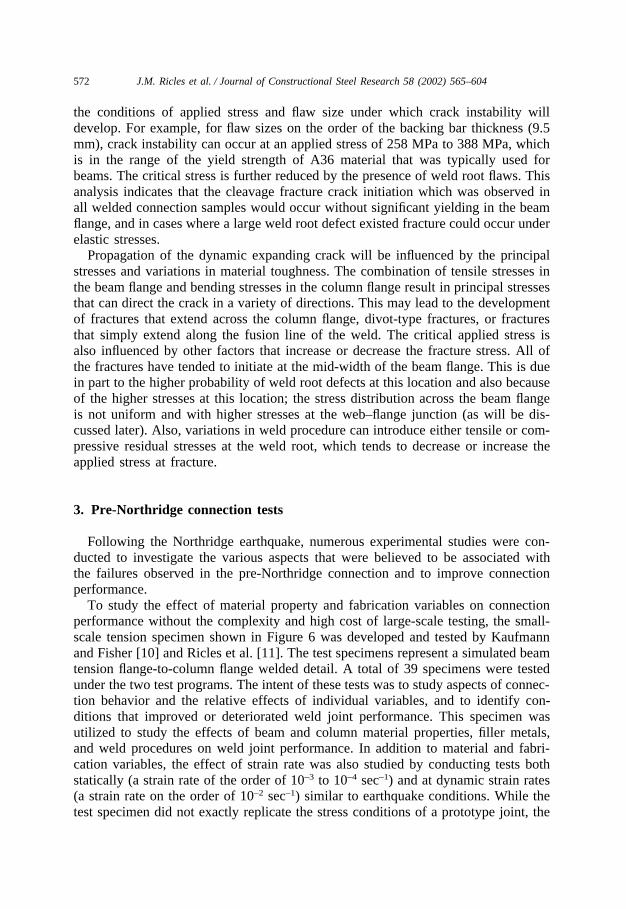
To study the effect of material property and fabrication variables on connectionperformance without the complexity and high cost of large-scale testing, the small-scale tension specimen shown in Figure 6 was developed and tested by Kaufmannand Fisher [10] and Ricles et al. [11]. The test specimens represent a simulated beamtension flange-to-column flange welded detail. A total of 39 specimens were testedunder the two test programs. The intent of these tests was to study aspects of connec-tion behavior and the relative effects of individual variables, and to identify con-ditions that improved or deteriorated weld joint performance. This specimen wasutilized to study the effects of beam and column material properties, filler metals,and weld procedures on weld joint performance. In addition to material and fabri-cation variables, the effect of strain rate was also studied by conducting tests bothstatically (a strain rate of the order of 10–3 to 10–4 sec–1) and at dynamic strain rates(a strain rate on the order of 10–2 sec–1) similar to earthquake conditions. While thetest specimen did not exactly replicate the stress conditions of a prototype joint, the
573J.M. Ricles et al. / Journal of Constructional Steel Research 58 (2002) 565–604
Fig. 6. Simulated beam flange-to-column flange test specimen.
results from the study were useful in screening the effect of the above variables onconnection performance.
The test specimen consists of a section of W14 × 176 (A572 Gr. 50) with oneflange removed. A pull plate was welded to the web of the section for gripping ina universal test machine. A 152-mm × 406-mm × 25.4 mm (A36 or A572) platewas then groove welded to the column flange face to simulate the beam flange con-nection. A coped web plate was also added to introduce welding access restrictionssimilar to welding the bottom flange of a connection. This plate was removed beforetesting to permit installation of a strain gauge at the beam mid-width close to theweld. Test specimens were fabricated using six different filler metals (E70T-4,E7018, E71T-8, E70TG-K2, E70T-6, and E70T-7), all of which were self-shielded,flux core filler metals except for the E7018 electrode. A 3.2-mm-diameter E70T-4electrode was used, similar to the electrode commonly used in moment connections.Welds were deposited with this electrode using both manufacturers’ recommendedwelding parameters and parameters that produced high heat input deposits, similarto those observed in numerous fractured connections in buildings. Shown in Figure3 is the Charpy V-notch toughness obtained for most of these filler metals. A widerange in Charpy V-notch toughness is apparent. E70T-4 and E70T-7 have no CVNtoughness requirement, while E70TG-K2, E7018, E71T-8, and E70T-6 have a mini-mum specified CVN impact toughness of 27 Joules at –29 °C. The low notch tough-ness measured for the E70T-4 weld metal of laboratory welded specimens is shownin Figure 3 (approximately 14 Joules at 21 °C), and is consistent with the CVN
574 J.M. Ricles et al. / Journal of Constructional Steel Research 58 (2002) 565–604
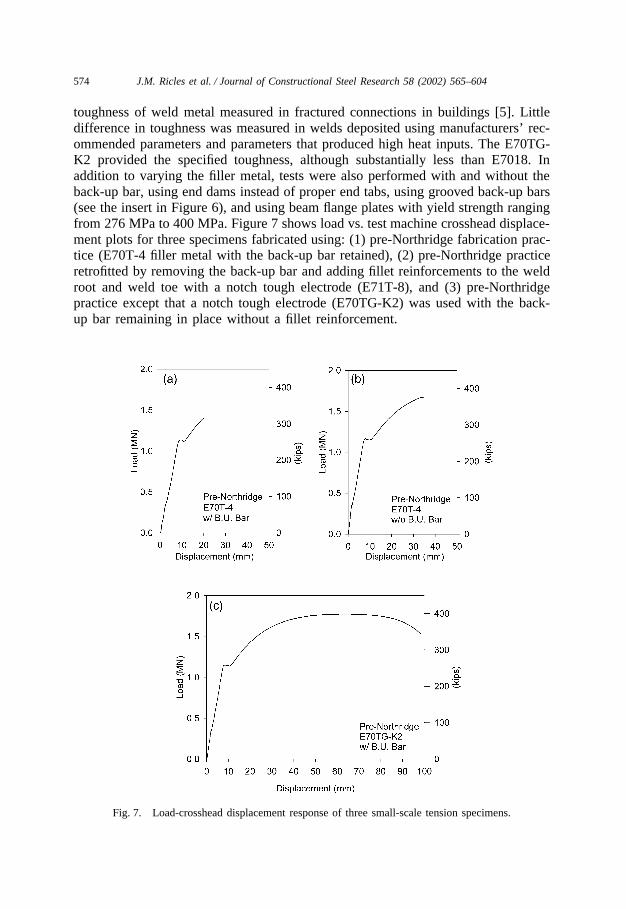
toughness of weld metal measured in fractured connections in buildings [5]. Littledifference in toughness was measured in welds deposited using manufacturers’ rec-ommended parameters and parameters that produced high heat inputs. The E70TG-K2 provided the specified toughness, although substantially less than E7018. Inaddition to varying the filler metal, tests were also performed with and without theback-up bar, using end dams instead of proper end tabs, using grooved back-up bars(see the insert in Figure 6), and using beam flange plates with yield strength rangingfrom 276 MPa to 400 MPa. Figure 7 shows load vs. test machine crosshead displace-ment plots for three specimens fabricated using: (1) pre-Northridge fabrication prac-tice (E70T-4 filler metal with the back-up bar retained), (2) pre-Northridge practiceretrofitted by removing the back-up bar and adding fillet reinforcements to the weldroot and weld toe with a notch tough electrode (E71T-8), and (3) pre-Northridgepractice except that a notch tough electrode (E70TG-K2) was used with the back-up bar remaining in place without a fillet reinforcement.
Fig. 7. Load-crosshead displacement response of three small-scale tension specimens.
575J.M. Ricles et al. / Journal of Constructional Steel Research 58 (2002) 565–604
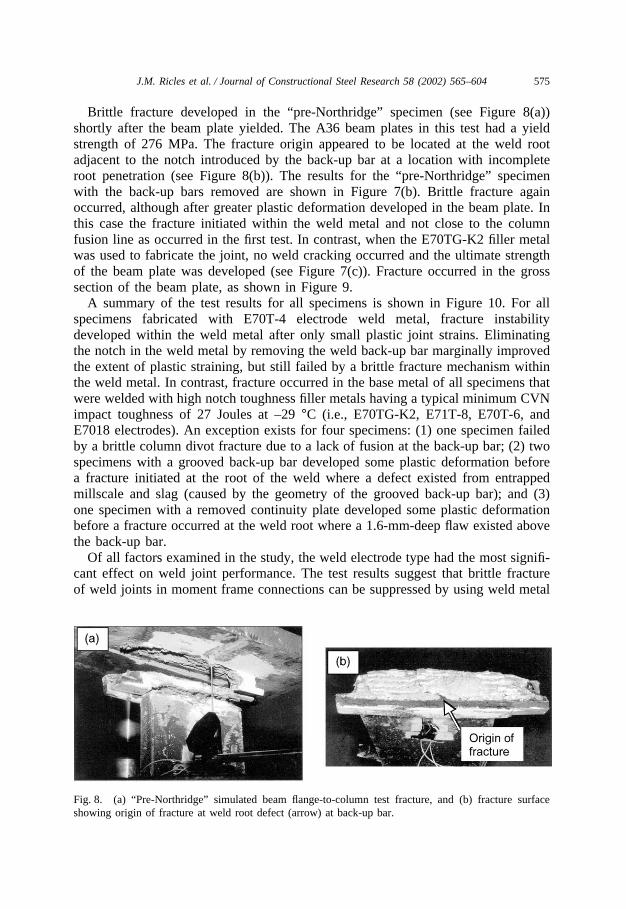
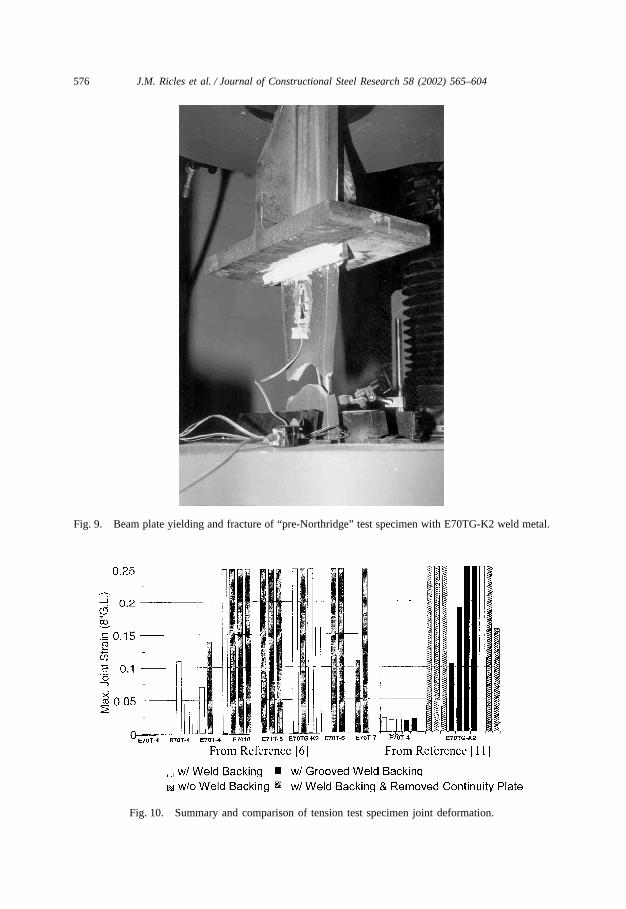
Brittle fracture developed in the “pre-Northridge” specimen (see Figure 8(a))shortly after the beam plate yielded. The A36 beam plates in this test had a yieldstrength of 276 MPa. The fracture origin appeared to be located at the weld rootadjacent to the notch introduced by the back-up bar at a location with incompleteroot penetration (see Figure 8(b)). The results for the “pre-Northridge” specimenwith the back-up bars removed are shown in Figure 7(b). Brittle fracture againoccurred, although after greater plastic deformation developed in the beam plate. Inthis case the fracture initiated within the weld metal and not close to the columnfusion line as occurred in the first test. In contrast, when the E70TG-K2 filler metalwas used to fabricate the joint, no weld cracking occurred and the ultimate strengthof the beam plate was developed (see Figure 7(c)). Fracture occurred in the grosssection of the beam plate, as shown in Figure 9.
A summary of the test results for all specimens is shown in Figure 10. For allspecimens fabricated with E70T-4 electrode weld metal, fracture instabilitydeveloped within the weld metal after only small plastic joint strains. Eliminatingthe notch in the weld metal by removing the weld back-up bar marginally improvedthe extent of plastic straining, but still failed by a brittle fracture mechanism withinthe weld metal. In contrast, fracture occurred in the base metal of all specimens thatwere welded with high notch toughness filler metals having a typical minimum CVNimpact toughness of 27 Joules at –29 °C (i.e., E70TG-K2, E71T-8, E70T-6, andE7018 electrodes). An exception exists for four specimens: (1) one specimen failedby a brittle column divot fracture due to a lack of fusion at the back-up bar; (2) twospecimens with a grooved back-up bar developed some plastic deformation beforea fracture initiated at the root of the weld where a defect existed from entrappedmillscale and slag (caused by the geometry of the grooved back-up bar); and (3)one specimen with a removed continuity plate developed some plastic deformationbefore a fracture occurred at the weld root where a 1.6-mm-deep flaw existed abovethe back-up bar.
Of all factors examined in the study, the weld electrode type had the most signifi-cant effect on weld joint performance. The test results suggest that brittle fractureof weld joints in moment frame connections can be suppressed by using weld metal
Fig. 8. (a) “Pre-Northridge” simulated beam flange-to-column test fracture, and (b) fracture surfaceshowing origin of fracture at weld root defect (arrow) at back-up bar.
576 J.M. Ricles et al. / Journal of Constructional Steel Research 58 (2002) 565–604
Fig. 9. Beam plate yielding and fracture of “pre-Northridge” test specimen with E70TG-K2 weld metal.
Fig. 10. Summary and comparison of tension test specimen joint deformation.
577J.M. Ricles et al. / Journal of Constructional Steel Research 58 (2002) 565–604
with a minimum notch toughness of 27 Joules at –29 °C in conjunction withimproved weld detailing such as removal of weld back-up bars and control of weldflaws through inspection.
Parallel to the simulated tension connection studies, two full-scale beam-and-col-umn assemblies with a “pre-Northridge” connection detail were dynamically tested.The specimens consisted of one-sided (i.e., exterior) connections. The column wasa W14 × 311, 3.886 m long, and made of A572 Gr. 50 steel. The beam was an A36steel W36 × 150 section, with a flange yield strength equal to 262 MPa, and 3.048m long. Dynamic load cycles were applied at the free end of the beam by two servo-controlled actuators. Two issues were considered in determining the loading rates.One was the response frequency of a typical multi-story steel structure and the otherwas the appropriate kinetic deformation rate of steel in the plastic range.
The first specimen tested was Specimen A-1, which was detailed to representtypically pre-Northridge practice. The second specimen was Specimen A-2, whichwas the same as Specimen A-1, but with the back-up bar and weld tabs removedand a 9.5-mm reinforcing fillet weld (E71T-8) added to its weld root. E70T-4 wasused as the filler metal in both specimens. The groove welds were ultrasonicallytested. In both specimens, ten high-strength A325 bolts, 25.4 mm in diameter, wereused to connect the beam web to a shear tab.
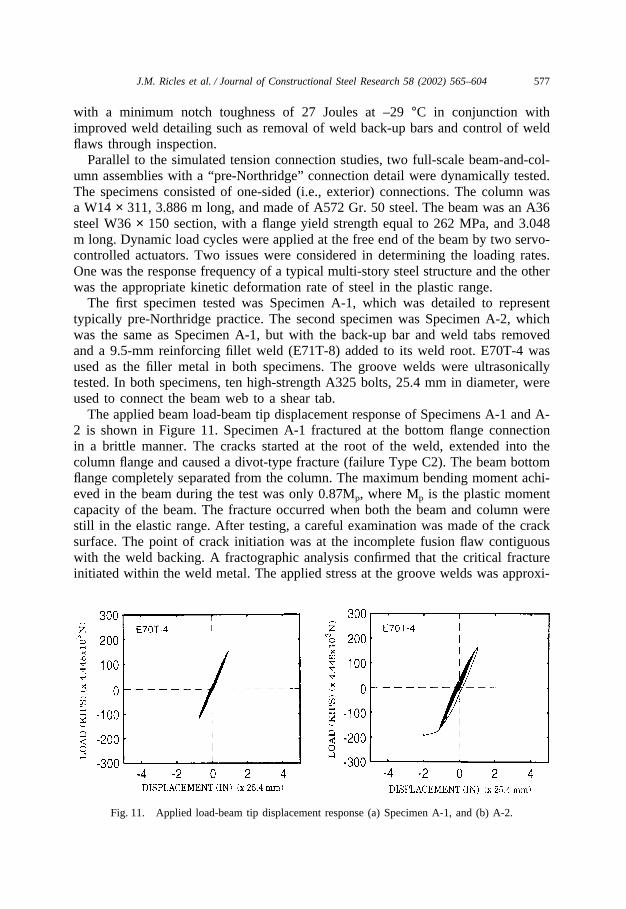
The applied beam load-beam tip displacement response of Specimens A-1 and A-2 is shown in Figure 11. Specimen A-1 fractured at the bottom flange connectionin a brittle manner. The cracks started at the root of the weld, extended into thecolumn flange and caused a divot-type fracture (failure Type C2). The beam bottomflange completely separated from the column. The maximum bending moment achi-eved in the beam during the test was only 0.87Mp, where Mp is the plastic momentcapacity of the beam. The fracture occurred when both the beam and column werestill in the elastic range. After testing, a careful examination was made of the cracksurface. The point of crack initiation was at the incomplete fusion flaw contiguouswith the weld backing. A fractographic analysis confirmed that the critical fractureinitiated within the weld metal. The applied stress at the groove welds was approxi-
Fig. 11. Applied load-beam tip displacement response (a) Specimen A-1, and (b) A-2.
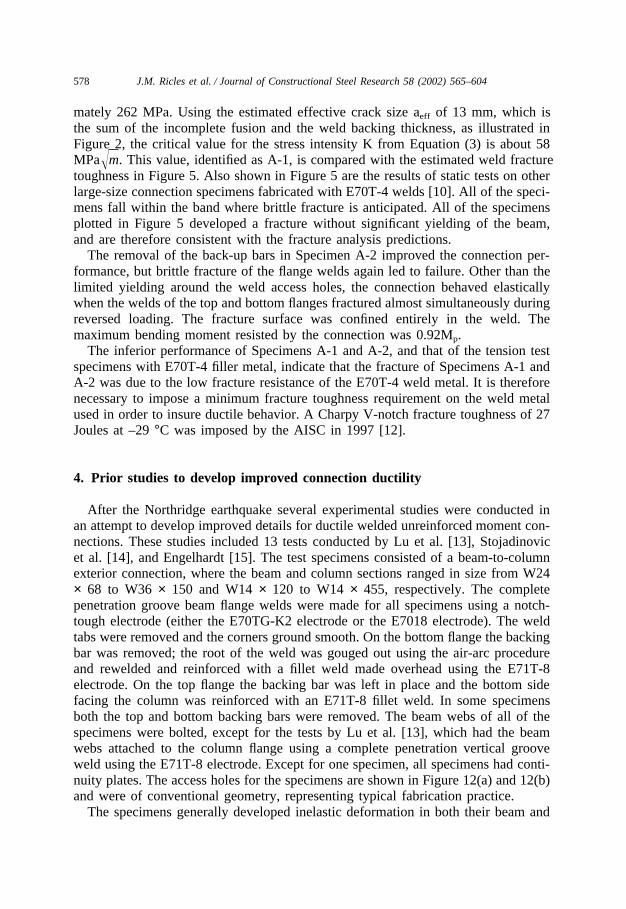
578 J.M. Ricles et al. / Journal of Constructional Steel Research 58 (2002) 565–604
mately 262 MPa. Using the estimated effective crack size aeff of 13 mm, which isthe sum of the incomplete fusion and the weld backing thickness, as illustrated inFigure 2, the critical value for the stress intensity K from Equation (3) is about 58MPa�m. This value, identified as A-1, is compared with the estimated weld fracturetoughness in Figure 5. Also shown in Figure 5 are the results of static tests on otherlarge-size connection specimens fabricated with E70T-4 welds [10]. All of the speci-mens fall within the band where brittle fracture is anticipated. All of the specimensplotted in Figure 5 developed a fracture without significant yielding of the beam,and are therefore consistent with the fracture analysis predictions.
The removal of the back-up bars in Specimen A-2 improved the connection per-formance, but brittle fracture of the flange welds again led to failure. Other than thelimited yielding around the weld access holes, the connection behaved elasticallywhen the welds of the top and bottom flanges fractured almost simultaneously duringreversed loading. The fracture surface was confined entirely in the weld. Themaximum bending moment resisted by the connection was 0.92Mp.
The inferior performance of Specimens A-1 and A-2, and that of the tension testspecimens with E70T-4 filler metal, indicate that the fracture of Specimens A-1 andA-2 was due to the low fracture resistance of the E70T-4 weld metal. It is thereforenecessary to impose a minimum fracture toughness requirement on the weld metalused in order to insure ductile behavior. A Charpy V-notch fracture toughness of 27Joules at –29 °C was imposed by the AISC in 1997 [12].
4. Prior studies to develop improved connection ductility
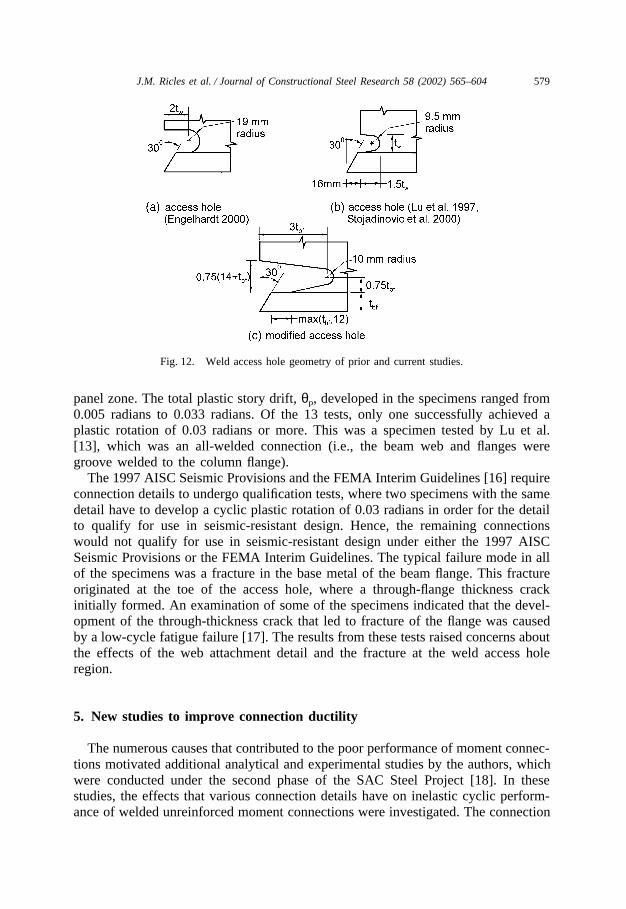
After the Northridge earthquake several experimental studies were conducted inan attempt to develop improved details for ductile welded unreinforced moment con-nections. These studies included 13 tests conducted by Lu et al. [13], Stojadinovicet al. [14], and Engelhardt [15]. The test specimens consisted of a beam-to-columnexterior connection, where the beam and column sections ranged in size from W24× 68 to W36 × 150 and W14 × 120 to W14 × 455, respectively. The completepenetration groove beam flange welds were made for all specimens using a notch-tough electrode (either the E70TG-K2 electrode or the E7018 electrode). The weldtabs were removed and the corners ground smooth. On the bottom flange the backingbar was removed; the root of the weld was gouged out using the air-arc procedureand rewelded and reinforced with a fillet weld made overhead using the E71T-8electrode. On the top flange the backing bar was left in place and the bottom sidefacing the column was reinforced with an E71T-8 fillet weld. In some specimensboth the top and bottom backing bars were removed. The beam webs of all of thespecimens were bolted, except for the tests by Lu et al. [13], which had the beamwebs attached to the column flange using a complete penetration vertical grooveweld using the E71T-8 electrode. Except for one specimen, all specimens had conti-nuity plates. The access holes for the specimens are shown in Figure 12(a) and 12(b)and were of conventional geometry, representing typical fabrication practice.
The specimens generally developed inelastic deformation in both their beam and
579J.M. Ricles et al. / Journal of Constructional Steel Research 58 (2002) 565–604
Fig. 12. Weld access hole geometry of prior and current studies.
panel zone. The total plastic story drift, θp, developed in the specimens ranged from0.005 radians to 0.033 radians. Of the 13 tests, only one successfully achieved aplastic rotation of 0.03 radians or more. This was a specimen tested by Lu et al.[13], which was an all-welded connection (i.e., the beam web and flanges weregroove welded to the column flange).
The 1997 AISC Seismic Provisions and the FEMA Interim Guidelines [16] requireconnection details to undergo qualification tests, where two specimens with the samedetail have to develop a cyclic plastic rotation of 0.03 radians in order for the detailto qualify for use in seismic-resistant design. Hence, the remaining connectionswould not qualify for use in seismic-resistant design under either the 1997 AISCSeismic Provisions or the FEMA Interim Guidelines. The typical failure mode in allof the specimens was a fracture in the base metal of the beam flange. This fractureoriginated at the toe of the access hole, where a through-flange thickness crackinitially formed. An examination of some of the specimens indicated that the devel-opment of the through-thickness crack that led to fracture of the flange was causedby a low-cycle fatigue failure [17]. The results from these tests raised concerns aboutthe effects of the web attachment detail and the fracture at the weld access holeregion.
5. New studies to improve connection ductility
The numerous causes that contributed to the poor performance of moment connec-tions motivated additional analytical and experimental studies by the authors, whichwere conducted under the second phase of the SAC Steel Project [18]. In thesestudies, the effects that various connection details have on inelastic cyclic perform-ance of welded unreinforced moment connections were investigated. The connection
580 J.M. Ricles et al. / Journal of Constructional Steel Research 58 (2002) 565–604
details investigated included: (1) geometry and size of the weld access hole, (2)beam web attachment, and (3) panel zone capacity. The analytical study involvedconducting a parametric study using non-linear finite element models of differentwelded unreinforced flange connection configurations. The results from this studyled to a better understanding of welded moment connection behavior under seismicloading conditions and to the development of improved connection details. Thesedesign details were verified by testing 11 full-scale specimens, and shown to produceductile welded unreinforced flange moment connections.
6. Finite element study
6.1. Finite element model
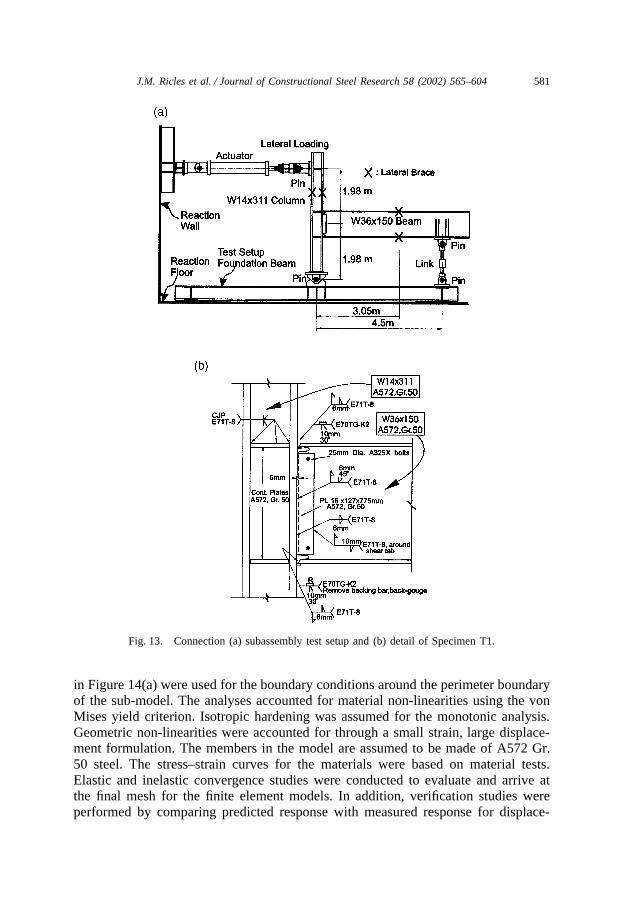
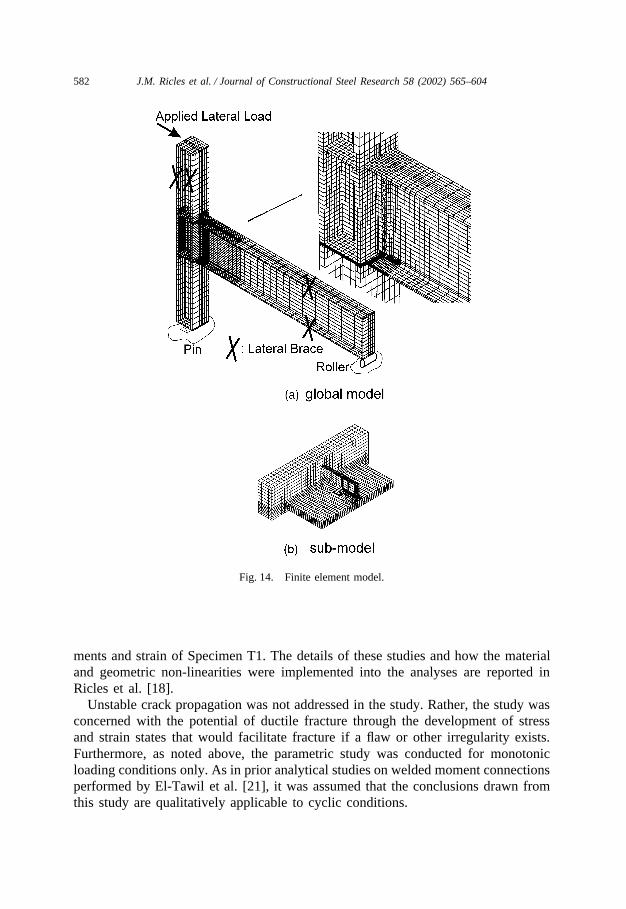
The connection subassembly shown in Figure 13 was used in the finite elementparametric study. This subassembly is the same utilized in the experimental studyfor exterior connections by Ricles et al. [18]. Specimen T1 was chosen as the controlspecimen for the analysis. It consisted of a W36 × 150 beam connected to a W14× 311 column. These member sizes are typical in moment-resisting frames (MRFs)in California for newer construction involving Grade 50 steel. The beam flanges arejoined to the column flange with field groove welds using the flux core arc weldingprocedure with E70TG-K2 electrodes. The bottom back-up bar was removed, back-gouged, and reinforced with a notch tough fillet weld, while the top back-up bar wasleft in place and reinforced with a closure fillet weld. The beam web was connected tothe column flange using a groove weld with supplemental fillet weld around all edgesof the shear tab. The shear tab served as an erection device during construction(through the use of erection bolts) and as a back-up bar for the web groove weld.Continuity plates were located on both sides of the column web. Different connectionconfigurations were created by changing some of the details of Specimen T1. Theseincluded the weld access hole, beam web attachment detail, and panel zonedoubler plates.
Three-dimensional finite element models of the connection subassembly weredeveloped for the parametric study using the general-purpose non-linear finiteelement analysis program ABAQUS [19]. The finite element model is shown inFigure 14, and consists of eight-node brick elements that utilize standard integration.The models included details such as the welds, shear tab, bolt holes and bolts, andthe top back-up bar (the bottom back-up bar was removed in the connection). Theanalyses in the parametric study were conducted by applying a prescribed monotonicdisplacement to the top of the column to achieve a story drift of 0.03 radians ofplastic rotation, the magnitude of plastic rotation that connections must achieve inqualification tests prescribed by AISC [12] and FEMA [16]. The bottom of the col-umn and the end of the beam in the model had pin and roller boundary conditions,respectively. The sub-model shown in Figure 14(b) was developed to obtainincreased accuracy in the computed local stress–strain state of the tension beamflange region of the connection. The displacement results of the global model shown
581J.M. Ricles et al. / Journal of Constructional Steel Research 58 (2002) 565–604
Fig. 13. Connection (a) subassembly test setup and (b) detail of Specimen T1.
in Figure 14(a) were used for the boundary conditions around the perimeter boundaryof the sub-model. The analyses accounted for material non-linearities using the vonMises yield criterion. Isotropic hardening was assumed for the monotonic analysis.Geometric non-linearities were accounted for through a small strain, large displace-ment formulation. The members in the model are assumed to be made of A572 Gr.50 steel. The stress–strain curves for the materials were based on material tests.Elastic and inelastic convergence studies were conducted to evaluate and arrive atthe final mesh for the finite element models. In addition, verification studies wereperformed by comparing predicted response with measured response for displace-
582 J.M. Ricles et al. / Journal of Constructional Steel Research 58 (2002) 565–604
Fig. 14. Finite element model.
ments and strain of Specimen T1. The details of these studies and how the materialand geometric non-linearities were implemented into the analyses are reported inRicles et al. [18].
Unstable crack propagation was not addressed in the study. Rather, the study wasconcerned with the potential of ductile fracture through the development of stressand strain states that would facilitate fracture if a flaw or other irregularity exists.Furthermore, as noted above, the parametric study was conducted for monotonicloading conditions only. As in prior analytical studies on welded moment connectionsperformed by El-Tawil et al. [21], it was assumed that the conclusions drawn fromthis study are qualitatively applicable to cyclic conditions.
583J.M. Ricles et al. / Journal of Constructional Steel Research 58 (2002) 565–604
6.2. Response indices
In the analyses cracks were not explicitly modeled. To evaluate and compare thedifferent analyzed connection configurations for ductile fracture potential, a ruptureindex was computed at different locations of the connection. The same approach hasbeen used by others [21] in analytical connection studies. The rupture index (RI) isdefined as:
RI �ep /ey
exp��1.5sm
seff� (4)
where εp, εy, sm, and seff are, respectively, the equivalent plastic strain, yield strain,hydrostatic stress, and equivalent stress (also known as the von Mises stress). Therupture index was motivated by the research of Hancock and Mackenzie [22] on theequivalent plastic rupture strain of steel for different conditions of stress triaxiality.The process of ductile fracture initiation is caused by high tensile triaxial stresses(i.e., high tensile hydrostatic stress) that result in damage accumulation throughmicrovoid nucleation and coalescence. The ratio of hydrostatic stress-to-von Misesstress (sm/seff) that appears in the denominator of Equation (4) is called the triaxialityratio (TR). High triaxiality can cause a large reduction in the rupture strain of amaterial, thereby limiting its ductility [23]. Thus, locations in a connection withhigher values for RI have a greater potential for fracture.
The ratio of equivalent plastic strain-to-yield strain that appears in the numeratorof Equation (4) is called the plastic equivalent strain (PEEQ) index. This index is ameasure of the local inelastic strain demand, and is also useful in comparing thedifferent analyzed configurations. The PEEQ index is computed by:
PEEQ Index ��2
3eijpeijp
ey(5)
where epij are the plastic strain components.The triaxiality ratio and PEEQ index were also computed at different locations of
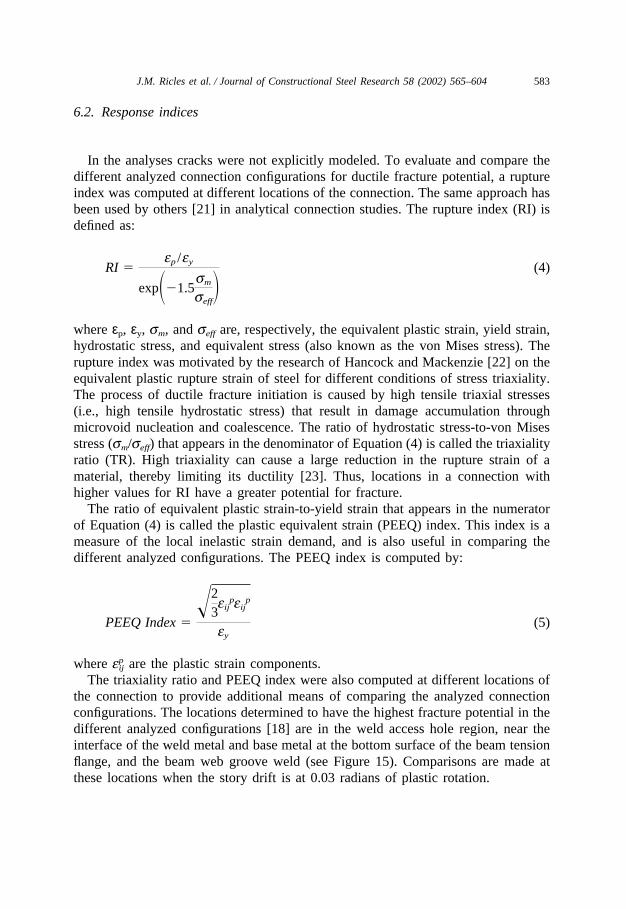
the connection to provide additional means of comparing the analyzed connectionconfigurations. The locations determined to have the highest fracture potential in thedifferent analyzed configurations [18] are in the weld access hole region, near theinterface of the weld metal and base metal at the bottom surface of the beam tensionflange, and the beam web groove weld (see Figure 15). Comparisons are made atthese locations when the story drift is at 0.03 radians of plastic rotation.
584 J.M. Ricles et al. / Journal of Constructional Steel Research 58 (2002) 565–604
Fig. 15. Regions of connection with highest fracture potential.
7. Finite element results
7.1. Weld access hole configuration
The investigation involved a detailed study to examine the fracture initiationpotential of access holes with different geometrical configurations and to developimproved configurations that have sufficient clearance for welding. The primary geo-metrical parameters were the overall length of the weld access hole, length of theflat portion of the weld access hole, slope of the weld access hole, and height of theweld access hole. The nine different weld access hole configurations, shown in Figure16, were selected for detailed evaluation. Configuration 1 is the configuration com-monly used in construction and in the numerous recent connection tests, includingthose conducted by Stojadinovic et al. [14] and Engelhardt [15]. It is similar to oneof the standard weld access hole geometries prescribed by AISC [24] for rolledsections. The diameter of the circular portion of the hole is 20 mm with a lengthequal to 1.5 times the thickness of the beam web. Configuration 2 is one without aweld access hole, which is not practical for actual fabrication but is studied forthe purpose of comparison. The size and geometry of the other configurations weredeveloped from configuration 1 with the intent to minimize the plastic strain demandand the rupture index in order to reduce the potential for fracture of the beam flangenear the weld access hole region. The diameter of the weld access hole in all theconfigurations is 20 mm, which is probably the smallest diameter that still permitsproper welding of the beam flanges. The prototype connection configuration used isthat of Specimen T1, where the beam web is welded directly to the column flangewith a groove weld and supplementary fillet welding is placed along the edges ofthe shear tab.
The profile of the PEEQ index value across the beam flange on a line that passesthrough the root of the weld access hole (point A in Figure 16) is shown in Figure17 for four selected configurations. Configuration 1 of the weld access hole is shownto have a high concentration of plastic strain in the middle of the flange, at the rootof the weld access hole where initiation of fracture occurred in the tests conductedby Stojadinovic et al. [14] and Engelhardt [15]. The maximum value of the PEEQindex that developed in the weld access hole region (the location is identified for
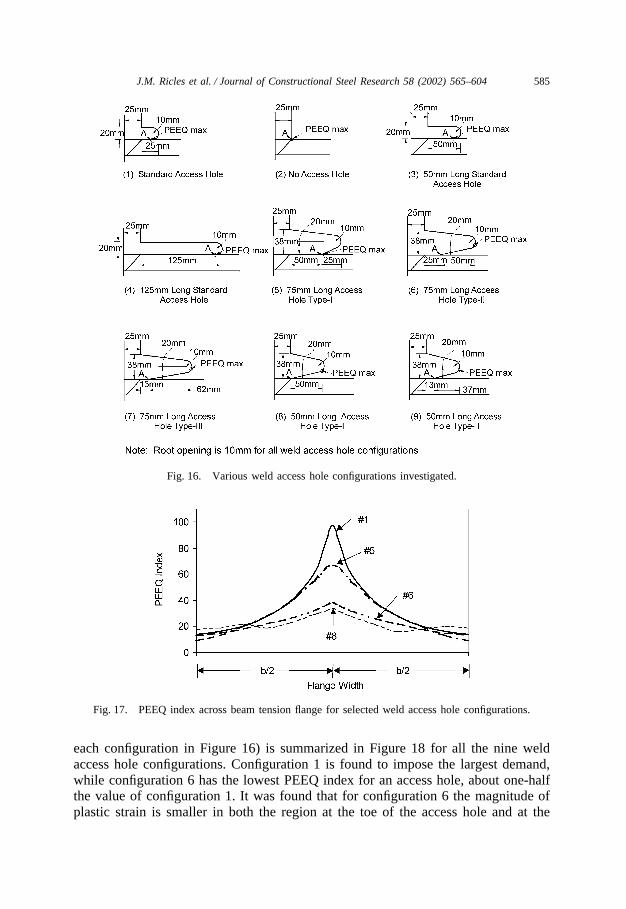
585J.M. Ricles et al. / Journal of Constructional Steel Research 58 (2002) 565–604
Fig. 16. Various weld access hole configurations investigated.
Fig. 17. PEEQ index across beam tension flange for selected weld access hole configurations.
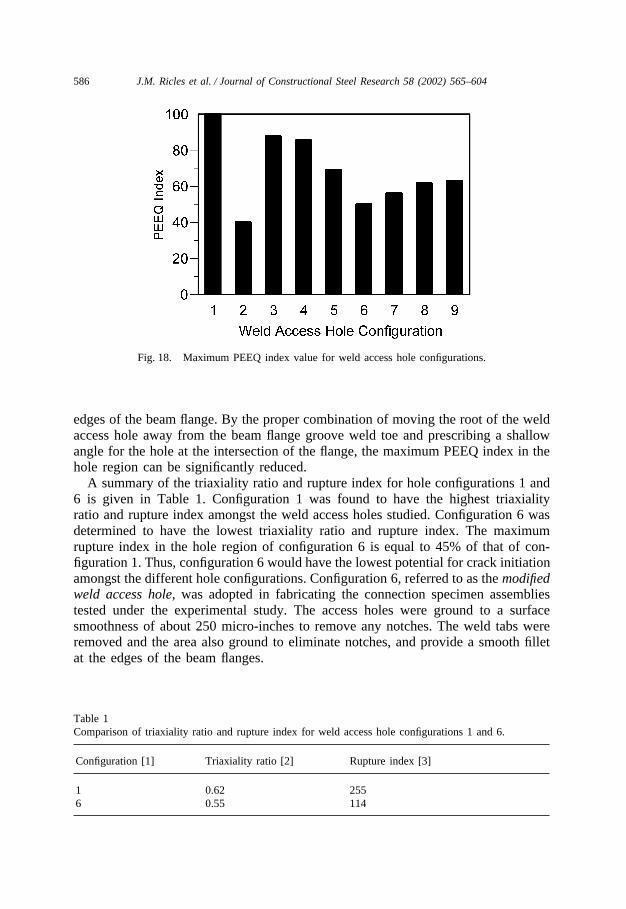
each configuration in Figure 16) is summarized in Figure 18 for all the nine weldaccess hole configurations. Configuration 1 is found to impose the largest demand,while configuration 6 has the lowest PEEQ index for an access hole, about one-halfthe value of configuration 1. It was found that for configuration 6 the magnitude ofplastic strain is smaller in both the region at the toe of the access hole and at the
586 J.M. Ricles et al. / Journal of Constructional Steel Research 58 (2002) 565–604
Fig. 18. Maximum PEEQ index value for weld access hole configurations.
edges of the beam flange. By the proper combination of moving the root of the weldaccess hole away from the beam flange groove weld toe and prescribing a shallowangle for the hole at the intersection of the flange, the maximum PEEQ index in thehole region can be significantly reduced.
A summary of the triaxiality ratio and rupture index for hole configurations 1 and6 is given in Table 1. Configuration 1 was found to have the highest triaxialityratio and rupture index amongst the weld access holes studied. Configuration 6 wasdetermined to have the lowest triaxiality ratio and rupture index. The maximumrupture index in the hole region of configuration 6 is equal to 45% of that of con-figuration 1. Thus, configuration 6 would have the lowest potential for crack initiationamongst the different hole configurations. Configuration 6, referred to as the modifiedweld access hole, was adopted in fabricating the connection specimen assembliestested under the experimental study. The access holes were ground to a surfacesmoothness of about 250 micro-inches to remove any notches. The weld tabs wereremoved and the area also ground to eliminate notches, and provide a smooth filletat the edges of the beam flanges.
Table 1Comparison of triaxiality ratio and rupture index for weld access hole configurations 1 and 6.
Configuration [1] Triaxiality ratio [2] Rupture index [3]
1 0.62 2556 0.55 114
587J.M. Ricles et al. / Journal of Constructional Steel Research 58 (2002) 565–604
7.2. Beam web attachment detail
Four different web attachment details were investigated. These include the boltedand welded web details that are summarized in Table 2. Web attachment detail I isthe same as the detail used in Specimen T1 (see Figure 13), where the beam webis groove welded to the column flange and supplemental fillet welds are placedaround the shear tab on the beam web. Detail II is similar to detail I, except thatthe supplemental fillet welds are omitted. Detail III has the beam web attached tothe shear tab by fillet welding, with no groove weld connecting the beam web tothe column flange. Detail IV is a bolted beam web connection using ten 25-mm-diameter A325X bolts to connect the beam web to the shear tab. The shear tab forall cases was fillet welded to the column flange. It is assumed that the modified weldaccess hole is adopted and that the beam flange groove welds are made using theE70TG-K2 electrode. In the bolted web attachment (i.e., detail IV) each bolt wasassumed to bear against the bolt hole, therefore the additional demand from boltslippage due to the beam web shear is not included in the analyses. All the detailshad column web continuity plates but no doubler plate. Doubler plates were notrequired in accordance with the current AISC LRFD seismic provisions [12].
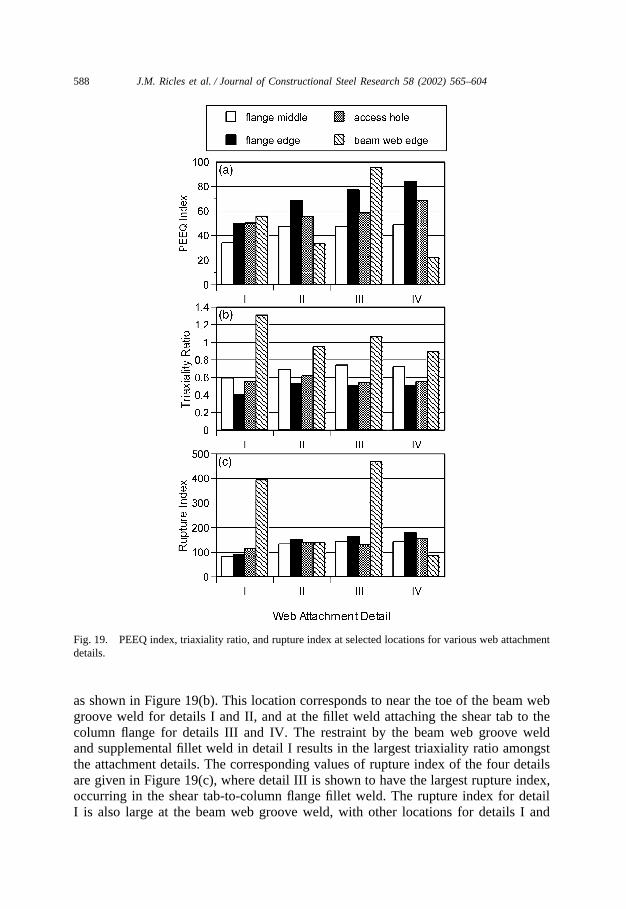
The results of the analyses are summarized in Figure 19, where values of the PEEQindex, triaxiality ratio, and rupture index at the edge and middle of the interface ofthe weld metal and base metal of the beam tension flange, the weld access holeregion, and the edge of the beam web are shown at an inelastic story drift of 0.03radians. These locations, identified in Figure 15, are the locations having the greatestpotential for fracture.
Figure 19(a) shows that the web attachment detail associated with detail III (filletwelded beam web-to-shear tab detail) has the overall largest PEEQ index, whichoccurs at the edge of the fillet weld attaching the shear tab to the column flange.The PEEQ index is shown to be largest at the edge of the beam flange for detailsII and IV (groove welded beam web detail and bolted beam web detail, respectively).For detail I (groove welded beam web with supplemental fillet weld detail) the largestvalue of the PEEQ index occurs at the edge of the beam web groove weld. However,this value is 1.73 times smaller compared to the PEEQ index at the same locationin detail III.
The triaxiality ratio is the largest for all the cases at the edge of the beam web,
Table 2FEM analysis matrix of beam web attachment details.
Case [1] Beam web groove weld [2] Fillet weld at shear tab Beam web bolts [4]edges [3]
I Yes 10 mm 2 erection boltsII Yes None 2 erection boltsIII None 10 mm 2 erection boltsIV None None 10 shear bolts
588 J.M. Ricles et al. / Journal of Constructional Steel Research 58 (2002) 565–604
Fig. 19. PEEQ index, triaxiality ratio, and rupture index at selected locations for various web attachmentdetails.
as shown in Figure 19(b). This location corresponds to near the toe of the beam webgroove weld for details I and II, and at the fillet weld attaching the shear tab to thecolumn flange for details III and IV. The restraint by the beam web groove weldand supplemental fillet weld in detail I results in the largest triaxiality ratio amongstthe attachment details. The corresponding values of rupture index of the four detailsare given in Figure 19(c), where detail III is shown to have the largest rupture index,occurring in the shear tab-to-column flange fillet weld. The rupture index for detailI is also large at the beam web groove weld, with other locations for details I and
589J.M. Ricles et al. / Journal of Constructional Steel Research 58 (2002) 565–604
III shown in Figure 19(c) to be relatively small. The rupture index at the edge ofthe beam web weld is over three times that at the beam flange in details I and III.Detail I is shown to have the smallest PEEQ and rupture index amongst the fourdetails at the interface of the beam tension flange and weld metal, as well as theaccess hole region. This is due to the beam web groove weld and supplemental filletweld creating a stiff web attachment, with out-of-plane local buckling of the beamweb restrained near the column face. Furthermore, an additional path of force transferexists. This results in lowering the demand on the beam flanges.
The above results suggest that the fracture potential of the beam flanges is reducedwhen the web of the beam is groove welded to the column and supplemental filletwelds are used. However, the fracture potential at the beam web groove weld isincreased due to the high restraint. A fracture of the beam web weld will alter thestress and strain distribution pattern and impose more demand on the beam flanges,possibly leading to less desirable performance of the connection.
As will be discussed next, the high local strain at the edge of the beam web grooveweld in detail I is caused by the weak panel zone, which has undergone significantinelastic shear deformations. In all the web attachment details no doubler plate exist.The ratio of panel zone-to-beam moment (Mpz/Mbm) is 1.02, where Mpz is the beammoment developed at the face of the column based on the panel zone nominal designstrength Ru (Equation (6) given below) and accounting for the column shear, andMbm is the beam moment at the column face due to the beam flexural capacity Mp
developing in the plastic hinge at a distance equal to one-half the beam depth fromthe column face.
7.3. Panel zone strength
The panel zone design shear strength Ru given by the current AISC LRFD seismicprovisions [12] is equal to:
Ru � fv0.6Fycdctp�1 �3bcftcf
2
dbdctp� (6)
where Fyc, bcf, tcf, dc, db and tp are the panel zone material yield strength, columnflange width, column flange thickness, column depth, girder depth, and panel zonethickness, respectively, and fv is the resistance factor (equal to 0.75). Equation (6)is based on the work of Krawinkler [25], where the panel zone is assumed to haveundergone an average shear strain that is four times the yield shear strain when thepanel zone strength is developed. The second term in Equation (6) accounts for theincrease in panel zone shear force beyond yielding due to the bending restraint ofthe column flanges. In design [12] Ru need not exceed the panel zone shear forcedetermined from 80% of the sum of the expected moment capacity Mpe of the beamsframing into the connection. For Grade 50 steel, Mpe is equal to 1.1Mp. The beammoment Mbm used throughout this paper is equal to approximately 1.1Mp, and there-fore is also equal to Mpe.
A weaker panel zone will result in more inelastic deformations occurring in thepanel zone. The effect of panel zone deformations on the ductile fracture potential
590 J.M. Ricles et al. / Journal of Constructional Steel Research 58 (2002) 565–604
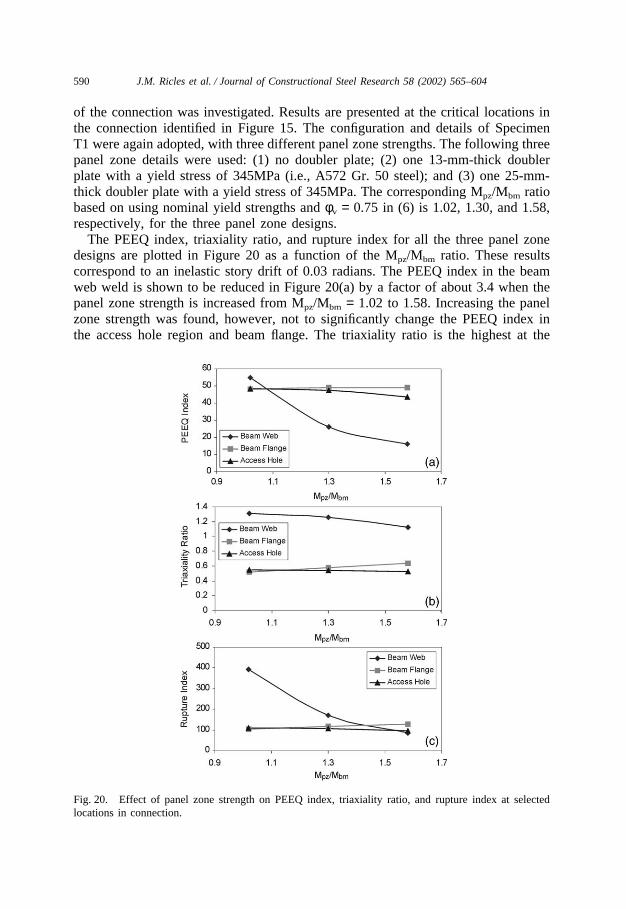
of the connection was investigated. Results are presented at the critical locations inthe connection identified in Figure 15. The configuration and details of SpecimenT1 were again adopted, with three different panel zone strengths. The following threepanel zone details were used: (1) no doubler plate; (2) one 13-mm-thick doublerplate with a yield stress of 345MPa (i.e., A572 Gr. 50 steel); and (3) one 25-mm-thick doubler plate with a yield stress of 345MPa. The corresponding Mpz/Mbm ratiobased on using nominal yield strengths and φv = 0.75 in (6) is 1.02, 1.30, and 1.58,respectively, for the three panel zone designs.
The PEEQ index, triaxiality ratio, and rupture index for all the three panel zonedesigns are plotted in Figure 20 as a function of the Mpz/Mbm ratio. These resultscorrespond to an inelastic story drift of 0.03 radians. The PEEQ index in the beamweb weld is shown to be reduced in Figure 20(a) by a factor of about 3.4 when thepanel zone strength is increased from Mpz/Mbm = 1.02 to 1.58. Increasing the panelzone strength was found, however, not to significantly change the PEEQ index inthe access hole region and beam flange. The triaxiality ratio is the highest at the
Fig. 20. Effect of panel zone strength on PEEQ index, triaxiality ratio, and rupture index at selectedlocations in connection.
591J.M. Ricles et al. / Journal of Constructional Steel Research 58 (2002) 565–604
beam web groove weld compared to other locations in the connection (see Figure20(b)) due to the high local restraint at the beam web-column flange interface. Aslight decrease occurs in the triaxiality ratio at this location with a stronger panelzone. The rupture index at the beam web weld is shown in Figure 20(c) to signifi-cantly decrease with an increase in panel zone strength, whereas the rupture indexat the beam flange and weld access hole region are almost constant with panelzone strength.
These results indicate that connections with a stronger panel zone, which conse-quently have a reduced shear deformation, have less fracture potential than connec-tions with a weak panel zone. The fracture potential of the groove welded beamweb attachment detail is significantly reduced, making this connection detail moreappealing. A stronger panel zone is, therefore, recommended for welded unreinforcedflange beam-to-column connections that have a groove welded beam web attachmentwith supplemental fillet welding.
To achieve a stronger panel zone design, only the first term in (6) could be usedin conjunction with omitting the factor of 0.8 that is applied to the beam momentdemand. Using this approach, a panel zone with a 13-mm-thick Grade 50 steeldoubler plate would be required for Specimen T1. For this configuration Mpz/Mbm
equals 1.07, where Mpz is based on nominal material properties and φv is equal to 0.75in (6). The corresponding rupture index at the beam web weld for this configuration isabout 172. The current AISC seismic design provisions [12] would not require adoubler plate for Specimen T1, and the corresponding rupture index would be equalto 392. Therefore, basing the panel zone strength Ru on only the first term in (6)results in a significant reduction of the rupture index at the beam web groove weld.
8. Experimental study
8.1. Test program
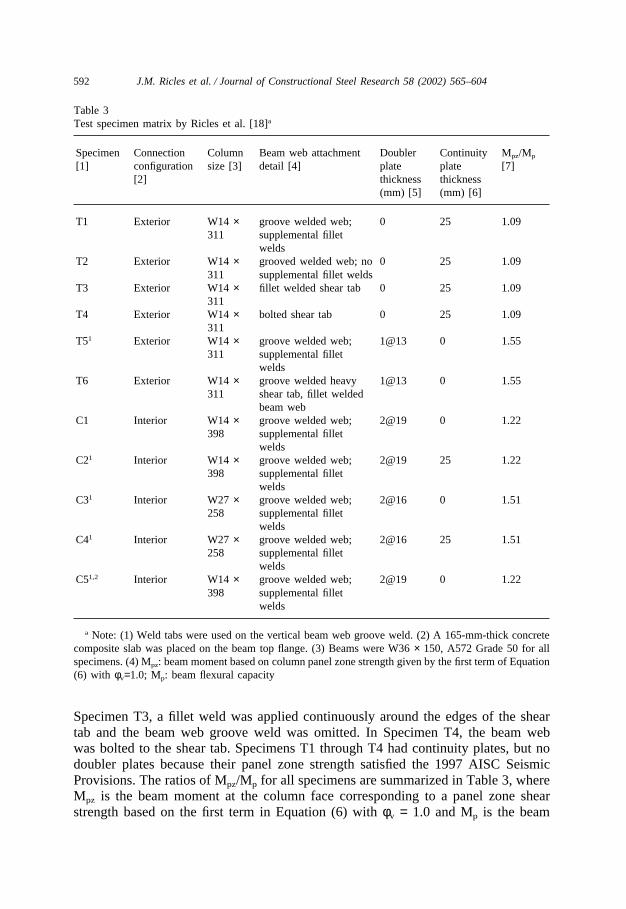
The results of the finite element parametric study were verified by the testing of11 full-scale specimens. The test matrix for the experimental study is given in Table3 and consisted of six exterior moment connections and five interior moment connec-tions. All of the specimens had complete penetration beam flange groove welds usingthe E70TG-K2 filler metal. The beam web attachment detail, panel zone strength,and use of continuity plates were varied among the specimens.
In the test matrix, Specimens T1, T2, T3, T4, T5, and T6 were exterior connec-tions. The beam and column were A572 Gr. 50 W36 × 150 and W14 × 311 sections,respectively. The beam web attachment and panel zone strength were the main vari-ables. Five different beam web attachment details were tested. Specimen T1 wasdescribed before, and consisted of a beam web detail that was welded directly inthe vertical position to the column flange with a full-length complete penetrationgroove weld, along with a supplementary fillet weld which was then applied continu-ously around the edges of the shear tab (Figure 13(b)). In Specimen T2, the welddetails were the same as T1 except that no supplementary fillet weld was placed. In
592 J.M. Ricles et al. / Journal of Constructional Steel Research 58 (2002) 565–604
Table 3Test specimen matrix by Ricles et al. [18]a
Specimen Connection Column Beam web attachment Doubler Continuity Mpz/Mp
[1] configuration size [3] detail [4] plate plate [7][2] thickness thickness
(mm) [5] (mm) [6]
T1 Exterior W14 × groove welded web; 0 25 1.09311 supplemental fillet
weldsT2 Exterior W14 × grooved welded web; no 0 25 1.09
311 supplemental fillet weldsT3 Exterior W14 × fillet welded shear tab 0 25 1.09
311T4 Exterior W14 × bolted shear tab 0 25 1.09
311T51 Exterior W14 × groove welded web; 1@13 0 1.55
311 supplemental filletwelds
T6 Exterior W14 × groove welded heavy 1@13 0 1.55311 shear tab, fillet welded
beam webC1 Interior W14 × groove welded web; 2@19 0 1.22
398 supplemental filletwelds
C21 Interior W14 × groove welded web; 2@19 25 1.22398 supplemental fillet
weldsC31 Interior W27 × groove welded web; 2@16 0 1.51
258 supplemental filletwelds
C41 Interior W27 × groove welded web; 2@16 25 1.51258 supplemental fillet
weldsC51,2 Interior W14 × groove welded web; 2@19 0 1.22
398 supplemental filletwelds
a Note: (1) Weld tabs were used on the vertical beam web groove weld. (2) A 165-mm-thick concretecomposite slab was placed on the beam top flange. (3) Beams were W36 × 150, A572 Grade 50 for allspecimens. (4) Mpz: beam moment based on column panel zone strength given by the first term of Equation(6) with φv=1.0; Mp: beam flexural capacity
Specimen T3, a fillet weld was applied continuously around the edges of the sheartab and the beam web groove weld was omitted. In Specimen T4, the beam webwas bolted to the shear tab. Specimens T1 through T4 had continuity plates, but nodoubler plates because their panel zone strength satisfied the 1997 AISC SeismicProvisions. The ratios of Mpz/Mp for all specimens are summarized in Table 3, whereMpz is the beam moment at the column face corresponding to a panel zone shearstrength based on the first term in Equation (6) with φv = 1.0 and Mp is the beam
593J.M. Ricles et al. / Journal of Constructional Steel Research 58 (2002) 565–604
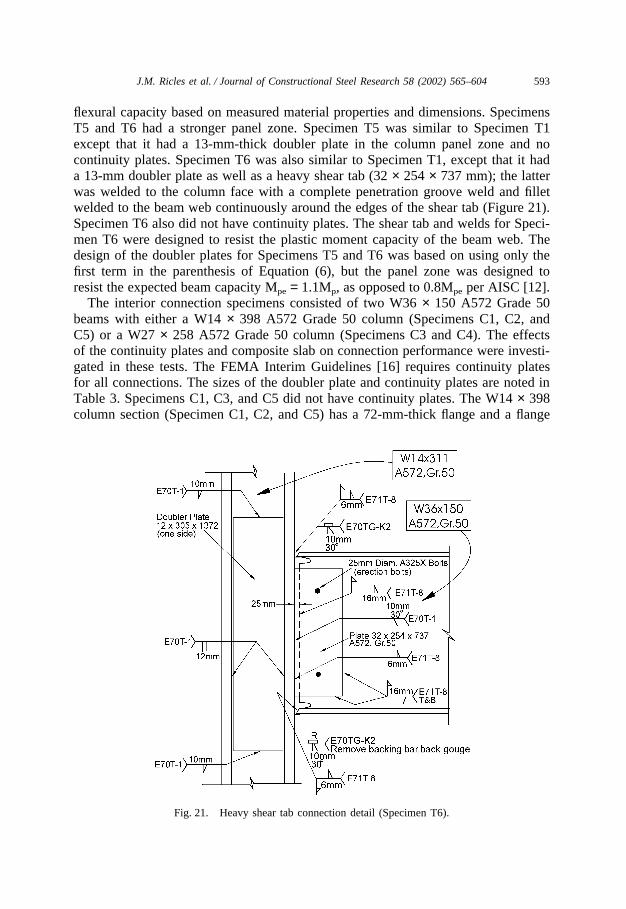
flexural capacity based on measured material properties and dimensions. SpecimensT5 and T6 had a stronger panel zone. Specimen T5 was similar to Specimen T1except that it had a 13-mm-thick doubler plate in the column panel zone and nocontinuity plates. Specimen T6 was also similar to Specimen T1, except that it hada 13-mm doubler plate as well as a heavy shear tab (32 × 254 × 737 mm); the latterwas welded to the column face with a complete penetration groove weld and filletwelded to the beam web continuously around the edges of the shear tab (Figure 21).Specimen T6 also did not have continuity plates. The shear tab and welds for Speci-men T6 were designed to resist the plastic moment capacity of the beam web. Thedesign of the doubler plates for Specimens T5 and T6 was based on using only thefirst term in the parenthesis of Equation (6), but the panel zone was designed toresist the expected beam capacity Mpe = 1.1Mp, as opposed to 0.8Mpe per AISC [12].
The interior connection specimens consisted of two W36 × 150 A572 Grade 50beams with either a W14 × 398 A572 Grade 50 column (Specimens C1, C2, andC5) or a W27 × 258 A572 Grade 50 column (Specimens C3 and C4). The effectsof the continuity plates and composite slab on connection performance were investi-gated in these tests. The FEMA Interim Guidelines [16] requires continuity platesfor all connections. The sizes of the doubler plate and continuity plates are noted inTable 3. Specimens C1, C3, and C5 did not have continuity plates. The W14 × 398column section (Specimen C1, C2, and C5) has a 72-mm-thick flange and a flange
Fig. 21. Heavy shear tab connection detail (Specimen T6).
594 J.M. Ricles et al. / Journal of Constructional Steel Research 58 (2002) 565–604
width-to-thickness (bf,col/tf,col) ratio of 5.83. The W27 × 258 section, having a 45-mm-thick flange, was selected as the column for Specimens C3 and C4 because the(bf,col/tf,col) ratio for the section is 8.06, and represents a column with a more slenderflange while satisfying the strong column–weak beam configuration of the 1997AISC Seismic Provisions. It was anticipated that continuity plates would be moreeffective in specimens with the more slender column flanges.
The interior connections had stronger panel zones to control panel zone defor-mation. The design of the doubler plates for the interior connection specimens wasbased on Equation (6) with the omission of the contribution of the second term inthe parenthesis, and therefore the design criteria was similar to that used for Speci-mens T5 and T6. The beam web attachment for the interior connection specimendetail consisted of a complete penetration groove welded beam web, similar to theweb detail of Specimen T1. Specimen C5 had a 165-mm-thick composite concreteslab on the top of the beam. Nineteen-mm-diameter shear studs were placed at 305-mm on center along the beam flange to develop composite action between the beamand slab. The first shear stud was located at 229-mm from the column face.
All the test specimens were fabricated using 2.4-mm diameter E70TG-K2 elec-trodes for the beam flange complete penetration groove welds, 1.6-mm diameterE70T-1 self-shielded electrode wire for the column panel zone doubler plate com-plete penetration groove welds, and 1.7-mm diameter E71T-8 electrode for the webgroove and fillet welds. Both the E70TG-K2 and E71T-8 satisfy the CVN toughnessrequirement of 27 Joules at –29 °C [12]. All welds conformed to the AWS 5.20Specification and Section 4.2 of AWS D1.1-94.
The weld tabs on the beam flanges were removed following placement of thegroove welds. The beam top flange back-up bar was left in place and a filletreinforcement weld was provided between the bottom surface of the back-up barand the column flange using an E71T-8 electrode. The beam bottom flange back-upbar was removed using the air arc process, back gouged, and reinforced with a filletweld using an E71T-8 electrode. Weld tabs were used at the ends of the weld tomake the vertical beam web groove weld for Specimens C2, C3, C4, C5, and T5,where the shear tab served as the back-up bar. After welding, the weld tabs wereremoved and the beam web groove weld was ground to produce a smooth profile(a roughness less than or equal to 250 micro-inches). No weld tabs were used forthe beam web groove weld of Specimens T1 and T2, however, the toes at the endsof the welds were ground to produce a smooth profile. The complete penetrationgroove welds for the beam flanges and web were inspected using the ultrasonic testprocedure. Welds were considered to pass inspection if they satisfied the AWS D1.1static loading criteria. The continuity plates were about the same thickness as thebeam flange and were welded to the column using complete penetration groovewelds.
The modified access hole shown in Figure 12(c) was used in all of the test speci-mens. The hole was drilled in Specimens T1, T2, T4, T5, and T6 and burned in allother specimens. The edges of the access hole were ground using a pencil-typegrinder to remove any notches and provide a smoothness corresponding to 250micro-inches of surface roughness.
595J.M. Ricles et al. / Journal of Constructional Steel Research 58 (2002) 565–604
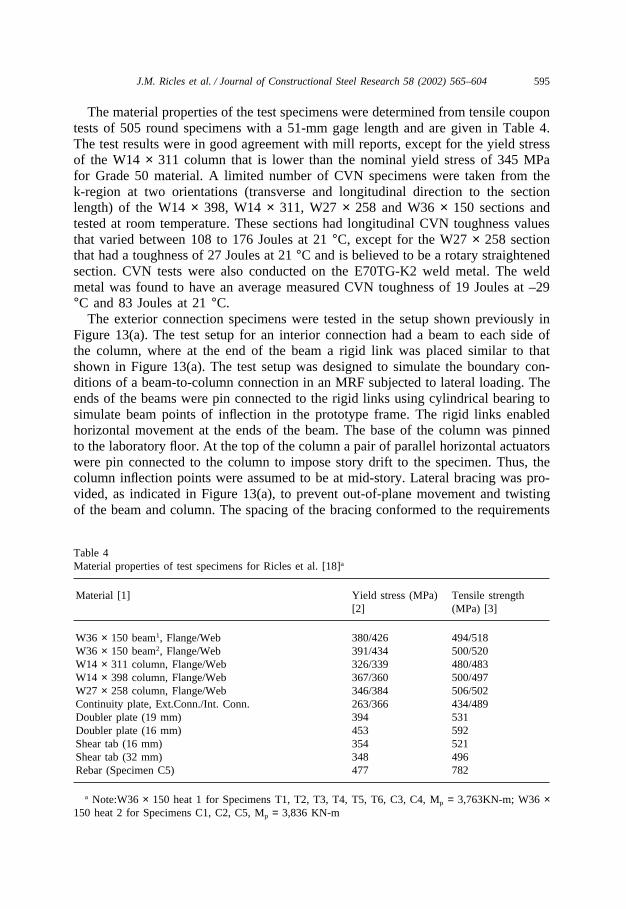
The material properties of the test specimens were determined from tensile coupontests of 505 round specimens with a 51-mm gage length and are given in Table 4.The test results were in good agreement with mill reports, except for the yield stressof the W14 × 311 column that is lower than the nominal yield stress of 345 MPafor Grade 50 material. A limited number of CVN specimens were taken from thek-region at two orientations (transverse and longitudinal direction to the sectionlength) of the W14 × 398, W14 × 311, W27 × 258 and W36 × 150 sections andtested at room temperature. These sections had longitudinal CVN toughness valuesthat varied between 108 to 176 Joules at 21 °C, except for the W27 × 258 sectionthat had a toughness of 27 Joules at 21 °C and is believed to be a rotary straightenedsection. CVN tests were also conducted on the E70TG-K2 weld metal. The weldmetal was found to have an average measured CVN toughness of 19 Joules at –29°C and 83 Joules at 21 °C.
The exterior connection specimens were tested in the setup shown previously inFigure 13(a). The test setup for an interior connection had a beam to each side ofthe column, where at the end of the beam a rigid link was placed similar to thatshown in Figure 13(a). The test setup was designed to simulate the boundary con-ditions of a beam-to-column connection in an MRF subjected to lateral loading. Theends of the beams were pin connected to the rigid links using cylindrical bearing tosimulate beam points of inflection in the prototype frame. The rigid links enabledhorizontal movement at the ends of the beam. The base of the column was pinnedto the laboratory floor. At the top of the column a pair of parallel horizontal actuatorswere pin connected to the column to impose story drift to the specimen. Thus, thecolumn inflection points were assumed to be at mid-story. Lateral bracing was pro-vided, as indicated in Figure 13(a), to prevent out-of-plane movement and twistingof the beam and column. The spacing of the bracing conformed to the requirements
Table 4Material properties of test specimens for Ricles et al. [18]a
Material [1] Yield stress (MPa) Tensile strength[2] (MPa) [3]
W36 × 150 beam1, Flange/Web 380/426 494/518W36 × 150 beam2, Flange/Web 391/434 500/520W14 × 311 column, Flange/Web 326/339 480/483W14 × 398 column, Flange/Web 367/360 500/497W27 × 258 column, Flange/Web 346/384 506/502Continuity plate, Ext.Conn./Int. Conn. 263/366 434/489Doubler plate (19 mm) 394 531Doubler plate (16 mm) 453 592Shear tab (16 mm) 354 521Shear tab (32 mm) 348 496Rebar (Specimen C5) 477 782
a Note:W36 × 150 heat 1 for Specimens T1, T2, T3, T4, T5, T6, C3, C4, Mp = 3,763KN-m; W36 ×150 heat 2 for Specimens C1, C2, C5, Mp = 3,836 KN-m
596 J.M. Ricles et al. / Journal of Constructional Steel Research 58 (2002) 565–604
of the 1997 AISC Seismic Provisions. Each specimen was extensively instrumented.The instrumentation enabled the forces in the various components of the test speci-men to be determined, as well as the contributions of the beam, panel zone, andcolumn to story drift to be measured.
The displacement history was based on the SAC Test Protocol [20] and consistedof imposing a series of prescribed quasi-static cyclic displacement to the top ofthe column.
8.2. Test results
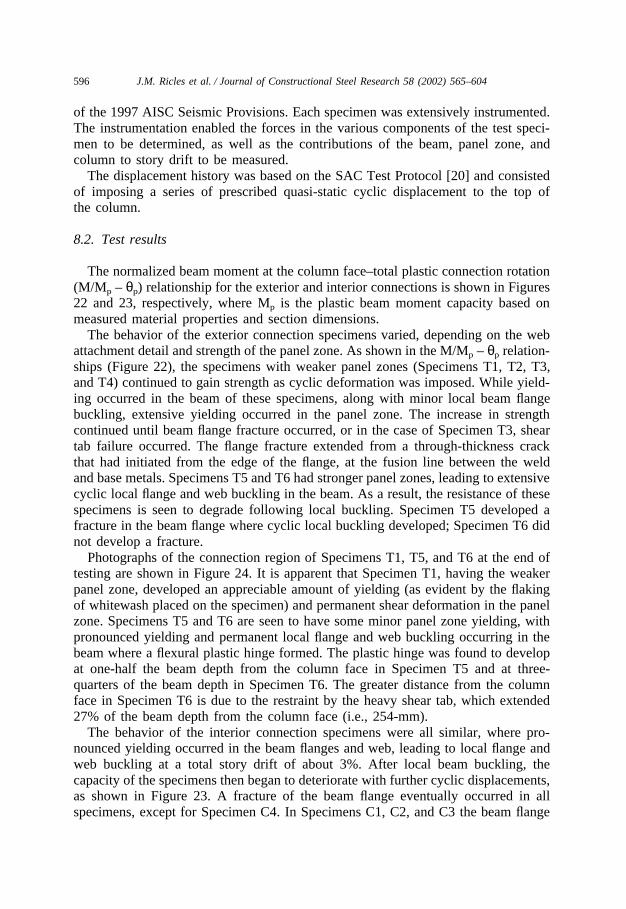
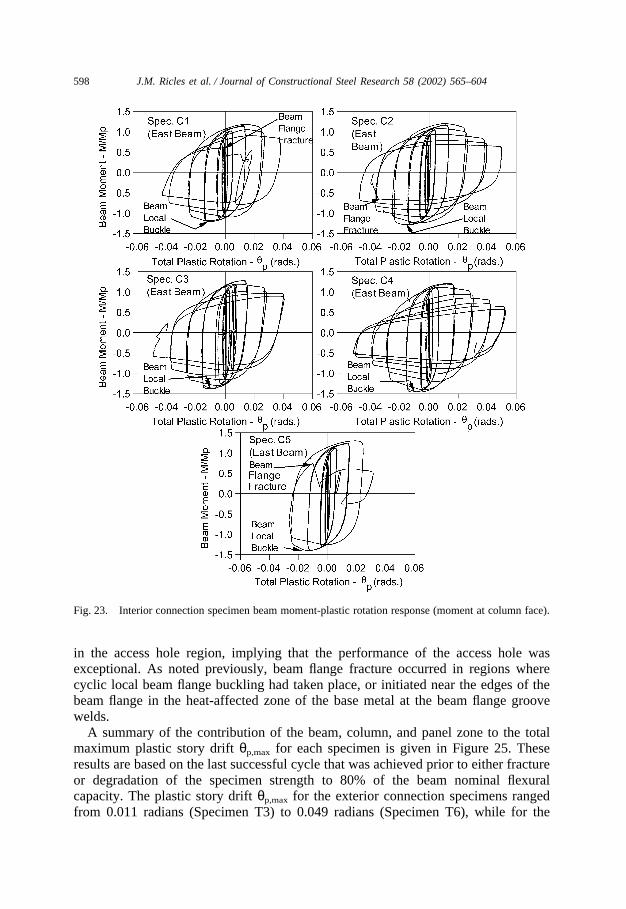
The normalized beam moment at the column face–total plastic connection rotation(M/Mp – θp) relationship for the exterior and interior connections is shown in Figures22 and 23, respectively, where Mp is the plastic beam moment capacity based onmeasured material properties and section dimensions.
The behavior of the exterior connection specimens varied, depending on the webattachment detail and strength of the panel zone. As shown in the M/Mp – θp relation-ships (Figure 22), the specimens with weaker panel zones (Specimens T1, T2, T3,and T4) continued to gain strength as cyclic deformation was imposed. While yield-ing occurred in the beam of these specimens, along with minor local beam flangebuckling, extensive yielding occurred in the panel zone. The increase in strengthcontinued until beam flange fracture occurred, or in the case of Specimen T3, sheartab failure occurred. The flange fracture extended from a through-thickness crackthat had initiated from the edge of the flange, at the fusion line between the weldand base metals. Specimens T5 and T6 had stronger panel zones, leading to extensivecyclic local flange and web buckling in the beam. As a result, the resistance of thesespecimens is seen to degrade following local buckling. Specimen T5 developed afracture in the beam flange where cyclic local buckling developed; Specimen T6 didnot develop a fracture.
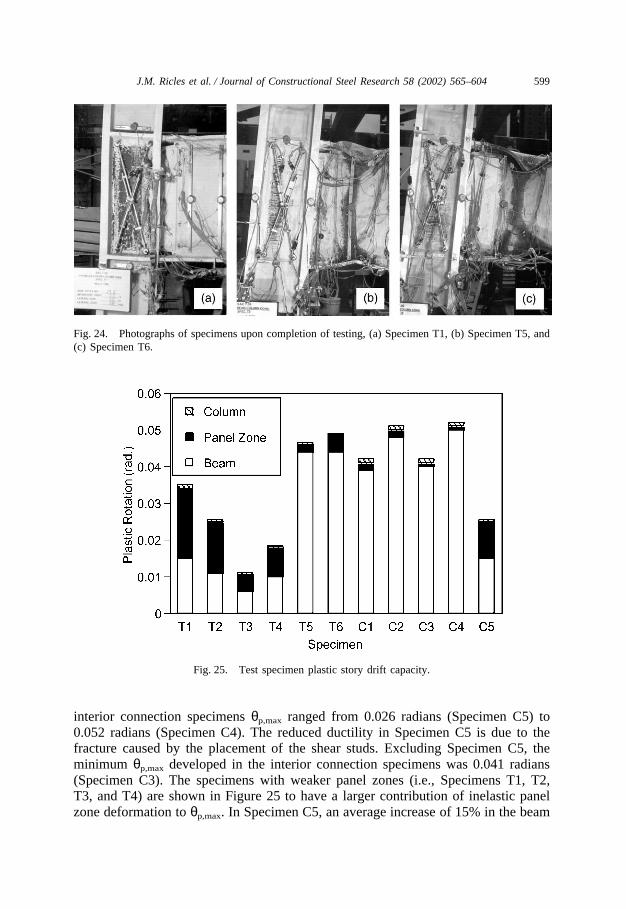
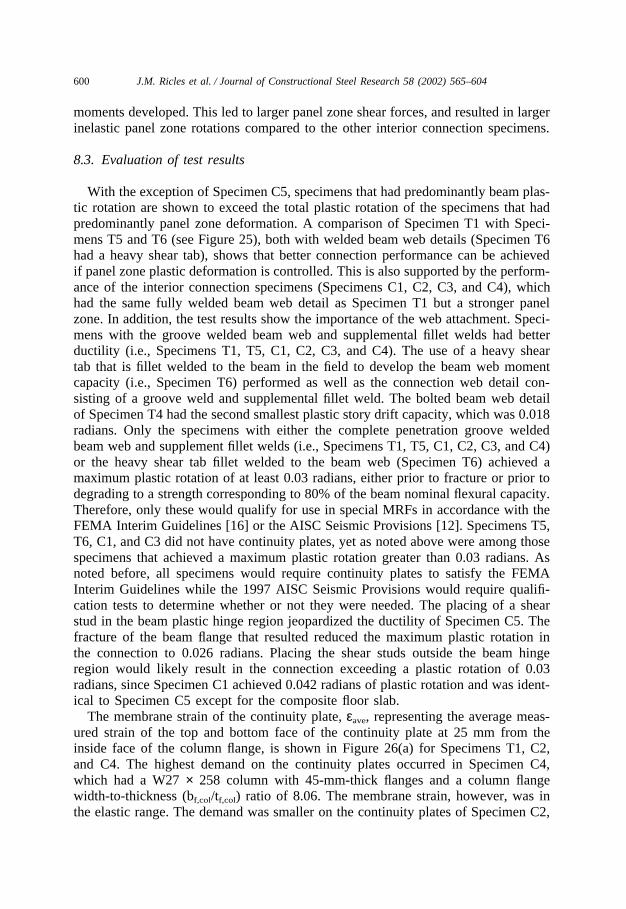
Photographs of the connection region of Specimens T1, T5, and T6 at the end oftesting are shown in Figure 24. It is apparent that Specimen T1, having the weakerpanel zone, developed an appreciable amount of yielding (as evident by the flakingof whitewash placed on the specimen) and permanent shear deformation in the panelzone. Specimens T5 and T6 are seen to have some minor panel zone yielding, withpronounced yielding and permanent local flange and web buckling occurring in thebeam where a flexural plastic hinge formed. The plastic hinge was found to developat one-half the beam depth from the column face in Specimen T5 and at three-quarters of the beam depth in Specimen T6. The greater distance from the columnface in Specimen T6 is due to the restraint by the heavy shear tab, which extended27% of the beam depth from the column face (i.e., 254-mm).
The behavior of the interior connection specimens were all similar, where pro-nounced yielding occurred in the beam flanges and web, leading to local flange andweb buckling at a total story drift of about 3%. After local beam buckling, thecapacity of the specimens then began to deteriorate with further cyclic displacements,as shown in Figure 23. A fracture of the beam flange eventually occurred in allspecimens, except for Specimen C4. In Specimens C1, C2, and C3 the beam flange
597J.M. Ricles et al. / Journal of Constructional Steel Research 58 (2002) 565–604
Fig. 22. Exterior connection specimen beam moment-plastic rotation response (moment at column face).
fracture occurred in the base metal close to the heat-affected zone of the completepenetration groove weld, propagating from a crack that initiated at the edge of theflange at the weld metal–base metal fusion line (similar to the fracture in SpecimenT1, T2, and T4). In Specimen C5, which had the composite slab and shear studswelded to the beam top flange, the fracture occurred suddenly in the east beam ata shear stud located 533 mm from the column face (equivalent to a distance of 0.58times the beam depth) where cyclic local buckling developed. The early fracture ofthe beam flange was a direct cause of the welding of the shear stud reducing thenotch toughness of the base metal, combined with large local strain demand fromthe effects of local flange buckling and yielding.
In all of the specimens no cracking or fractures were observed to have initiated
598 J.M. Ricles et al. / Journal of Constructional Steel Research 58 (2002) 565–604
Fig. 23. Interior connection specimen beam moment-plastic rotation response (moment at column face).
in the access hole region, implying that the performance of the access hole wasexceptional. As noted previously, beam flange fracture occurred in regions wherecyclic local beam flange buckling had taken place, or initiated near the edges of thebeam flange in the heat-affected zone of the base metal at the beam flange groovewelds.
A summary of the contribution of the beam, column, and panel zone to the totalmaximum plastic story drift θp,max for each specimen is given in Figure 25. Theseresults are based on the last successful cycle that was achieved prior to either fractureor degradation of the specimen strength to 80% of the beam nominal flexuralcapacity. The plastic story drift θp,max for the exterior connection specimens rangedfrom 0.011 radians (Specimen T3) to 0.049 radians (Specimen T6), while for the
599J.M. Ricles et al. / Journal of Constructional Steel Research 58 (2002) 565–604
Fig. 24. Photographs of specimens upon completion of testing, (a) Specimen T1, (b) Specimen T5, and(c) Specimen T6.
Fig. 25. Test specimen plastic story drift capacity.
interior connection specimens θp,max ranged from 0.026 radians (Specimen C5) to0.052 radians (Specimen C4). The reduced ductility in Specimen C5 is due to thefracture caused by the placement of the shear studs. Excluding Specimen C5, theminimum θp,max developed in the interior connection specimens was 0.041 radians(Specimen C3). The specimens with weaker panel zones (i.e., Specimens T1, T2,T3, and T4) are shown in Figure 25 to have a larger contribution of inelastic panelzone deformation to θp,max. In Specimen C5, an average increase of 15% in the beam
600 J.M. Ricles et al. / Journal of Constructional Steel Research 58 (2002) 565–604
moments developed. This led to larger panel zone shear forces, and resulted in largerinelastic panel zone rotations compared to the other interior connection specimens.
8.3. Evaluation of test results
With the exception of Specimen C5, specimens that had predominantly beam plas-tic rotation are shown to exceed the total plastic rotation of the specimens that hadpredominantly panel zone deformation. A comparison of Specimen T1 with Speci-mens T5 and T6 (see Figure 25), both with welded beam web details (Specimen T6had a heavy shear tab), shows that better connection performance can be achievedif panel zone plastic deformation is controlled. This is also supported by the perform-ance of the interior connection specimens (Specimens C1, C2, C3, and C4), whichhad the same fully welded beam web detail as Specimen T1 but a stronger panelzone. In addition, the test results show the importance of the web attachment. Speci-mens with the groove welded beam web and supplemental fillet welds had betterductility (i.e., Specimens T1, T5, C1, C2, C3, and C4). The use of a heavy sheartab that is fillet welded to the beam in the field to develop the beam web momentcapacity (i.e., Specimen T6) performed as well as the connection web detail con-sisting of a groove weld and supplemental fillet weld. The bolted beam web detailof Specimen T4 had the second smallest plastic story drift capacity, which was 0.018radians. Only the specimens with either the complete penetration groove weldedbeam web and supplement fillet welds (i.e., Specimens T1, T5, C1, C2, C3, and C4)or the heavy shear tab fillet welded to the beam web (Specimen T6) achieved amaximum plastic rotation of at least 0.03 radians, either prior to fracture or prior todegrading to a strength corresponding to 80% of the beam nominal flexural capacity.Therefore, only these would qualify for use in special MRFs in accordance with theFEMA Interim Guidelines [16] or the AISC Seismic Provisions [12]. Specimens T5,T6, C1, and C3 did not have continuity plates, yet as noted above were among thosespecimens that achieved a maximum plastic rotation greater than 0.03 radians. Asnoted before, all specimens would require continuity plates to satisfy the FEMAInterim Guidelines while the 1997 AISC Seismic Provisions would require qualifi-cation tests to determine whether or not they were needed. The placing of a shearstud in the beam plastic hinge region jeopardized the ductility of Specimen C5. Thefracture of the beam flange that resulted reduced the maximum plastic rotation inthe connection to 0.026 radians. Placing the shear studs outside the beam hingeregion would likely result in the connection exceeding a plastic rotation of 0.03radians, since Specimen C1 achieved 0.042 radians of plastic rotation and was ident-ical to Specimen C5 except for the composite floor slab.
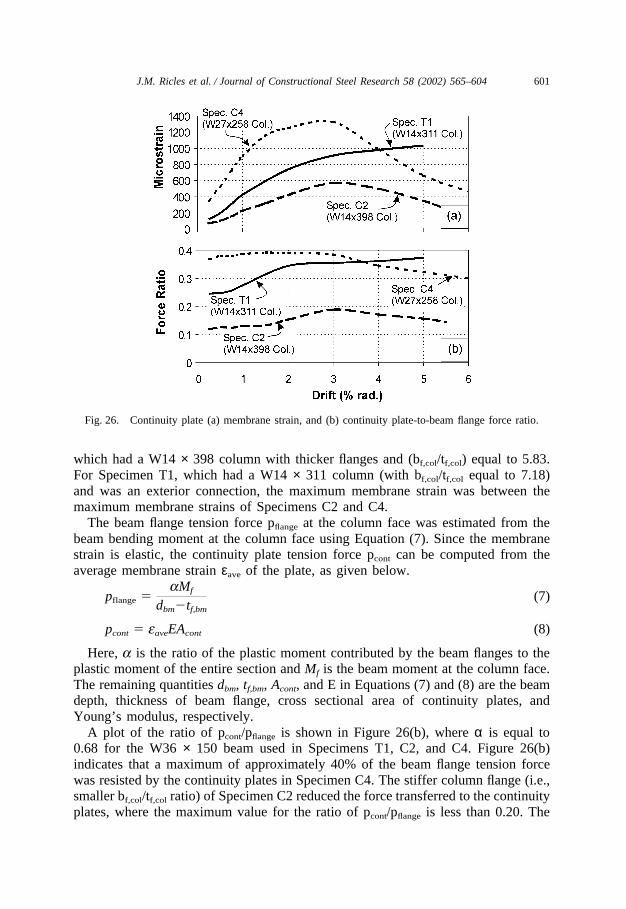
The membrane strain of the continuity plate, εave, representing the average meas-ured strain of the top and bottom face of the continuity plate at 25 mm from theinside face of the column flange, is shown in Figure 26(a) for Specimens T1, C2,and C4. The highest demand on the continuity plates occurred in Specimen C4,which had a W27 × 258 column with 45-mm-thick flanges and a column flangewidth-to-thickness (bf,col/tf,col) ratio of 8.06. The membrane strain, however, was inthe elastic range. The demand was smaller on the continuity plates of Specimen C2,
601J.M. Ricles et al. / Journal of Constructional Steel Research 58 (2002) 565–604
Fig. 26. Continuity plate (a) membrane strain, and (b) continuity plate-to-beam flange force ratio.
which had a W14 × 398 column with thicker flanges and (bf,col/tf,col) equal to 5.83.For Specimen T1, which had a W14 × 311 column (with bf,col/tf,col equal to 7.18)and was an exterior connection, the maximum membrane strain was between themaximum membrane strains of Specimens C2 and C4.
The beam flange tension force pflange at the column face was estimated from thebeam bending moment at the column face using Equation (7). Since the membranestrain is elastic, the continuity plate tension force pcont can be computed from theaverage membrane strain εave of the plate, as given below.
pflange �aMf
dbm�tf,bm
(7)
pcont � eaveEAcont (8)
Here, a is the ratio of the plastic moment contributed by the beam flanges to theplastic moment of the entire section and Mf is the beam moment at the column face.The remaining quantities dbm, tf,bm, Acont, and E in Equations (7) and (8) are the beamdepth, thickness of beam flange, cross sectional area of continuity plates, andYoung’s modulus, respectively.
A plot of the ratio of pcont/pflange is shown in Figure 26(b), where α is equal to0.68 for the W36 × 150 beam used in Specimens T1, C2, and C4. Figure 26(b)indicates that a maximum of approximately 40% of the beam flange tension forcewas resisted by the continuity plates in Specimen C4. The stiffer column flange (i.e.,smaller bf,col/tf,col ratio) of Specimen C2 reduced the force transferred to the continuityplates, where the maximum value for the ratio of pcont/pflange is less than 0.20. The
602 J.M. Ricles et al. / Journal of Constructional Steel Research 58 (2002) 565–604
ratio pcont/pflange for Specimens C2 and C4 was reduced after the onset of beam localbuckling occurred during the 3% story drift cycles. However, for Specimen T1,which had a weak panel zone, this ratio continuously increased until the beam flangefractured at 5% story drift. These results indicate that a connection with a weakpanel zone may result in an increase in the demand on the continuity plates. Inaddition, the slenderness (i.e., bf,col/tf,col ratio) of the column flange influences theeffectiveness of the continuity plate, where for more slender column flanges thecontinuity plates are more effective and transfer a larger proportion of the beamflange force to the panel zone.
9. Conclusions and design recommendations
Based on the research presented, the following conclusions and design recommen-dations are given.
Both small-scale simulated beam flange-to-column flange tests and full-scaledynamic cyclic tests of pre-Northridge connections show failure modes similar tothose observed in the field. Brittle fracture developed in the elastic range of responsefrom flaws in the low-toughness E70T-4 weld metal and geometric conditions.Acceptable connection performance appears to be obtainable by using a high-tough-ness weld metal in conjunction with removal of the back-up bars and other modifi-cations noted below. The new FEMA 350 Recommended seismic design criteria fornew steel moment-frame buildings [26] requires a filler metal toughness of 27 Joulesat –29 °C and 54 Joules at 21 °C for critically welded joints in seismic resisting sys-tems.
In connection tests with a notch tough filler metal and access holes with conven-tional geometry, ductile fracture initiating at the edges of the weld access hole wasobserved, degrading the performance of the connection. The modified access holegeometry consisting of a short, flat region on the beam flange of one beam flangethickness was found to result in good performance. The modified access holegeometry is recommended for welded unreinforced moment connections in specialMRFs, and has been adopted by FEMA 350.
The web attachment detail can significantly affect the ductility of a connectionthat has been fabricated using a notch tough filler metal. A beam web attachmentdetail consisting of a complete penetration groove welded web and supplementalfillet welds around the beam shear tab, or a heavy shear tab welded to the columnwith a complete penetration groove weld and fillet welded to the beam web, producedthe best results. The total plastic story drift capacity of test specimens with the groovewelded beam web detail and the modified access hole geometry ranged from 0.035to 0.052 radians. Weld tabs were found to improve the quality of the beam webgroove weld and thereby the connection performance. It is recommended that weldedunreinforced moment connections in special MRFs use one of these two weldedbeam web attachment details.
Test specimens with a weak panel zone and notch tough filler metal developedsignificant inelastic shear deformation in the panel zone, resulting in an increase in
603J.M. Ricles et al. / Journal of Constructional Steel Research 58 (2002) 565–604
the plastic strain demand on the beam web welds. Improved performance was achi-eved in specimens designed with their panel zone strength based on only the firstterm of the panel zone strength expression of the 1997 AISC Seismic Provisions.Thus, the design strength was based on only the yield capacity of the column panelzone. This procedure is recommended for the design of panel zones of welded unre-inforced moment connections.
The fracture toughness of the base metal is reduced where a shear stud is weldedto the beam flange, raising the potential for brittle fracture at shear studs that arelocated in the region of inelastic cyclic local flange bucking that cause small cracksto initiate. It is recommended that shear studs not be placed in the plastic hingeregion of the beam, where cyclic local beam flange buckling is expected.
The test results indicate that continuity plates are not always required. Specimenstested by the authors without continuity plates and no shear studs in the beam plastichinge region had a plastic story drift greater then 0.041 radians. These specimenshad column flange width-to-column flange thickness ratios ranging from 5.83(W14x398) to 8.06 (W27x258) and column flange thickness of 45 mm to 72 mm.The FEMA Interim Guidelines would require continuity plates in the prototype con-nections of all of the specimens, while the 1997 AISC Seismic Provisions requirecontinuity plates to match the specimen conditions of the qualification tests. Designrecommendations cannot be provided until further studies are completed.
Acknowledgements
This research described in this paper was supported by grants from the USNational Science Foundation, the National Institute of Standards and Technology,the SAC Joint Venture, and the Department of Community and Economic Develop-ment of the Commonwealth of Pennsylvania through the Pennsylvania InfrastructureTechnology Alliance.
References
[1] Youssef NFG, Bonowitz D, Gross JL. A survey of steel moment resisting frame buildings affectedby the 1994 northridge earthquake. NIST, Report No. NISTIR 5625, Gaithersburg, MD. 1995.
[2] Popov EP, Pinkney RB. Cyclic yield reversal in steel building connections. Journal of the StructuralDivision, ASCE 1969;95(ST3):327–53.
[3] Miller DK. Northridge: the role of welding clarified. Welding Innovation Quarterly 1994;XI(2).[4] Campbell HH. The Northridge fractures: are we learning the right lessons? Civil Engineering;
March 1995.[5] Tide RHR, Fisher JW, Kaufmann EJ. Substandard welding quality exposed: Northridge, California
earthquake, January 17, 1994, Asian Pacific Welding Congress, Auckland, New Zealand, 1996.[6] Kaufmann EJ, Fisher JW, Di Julio Jr, RM, Gross JL. Failure analysis of welded steel moment frames
damaged in the Northridge earthquake, National Institute of Standards and Technology, Report No.NISTIR 5944, January 1997.
[7] Xue M, Kaufmann EJ, Lu L-W, Fisher JW. Achieving ductile behavior of moment connections-partII. Modern Steel Construction; June 1996.
604 J.M. Ricles et al. / Journal of Constructional Steel Research 58 (2002) 565–604
[8] Barsom JM, Rolfe ST. Fracture and Fatigue Control in Structures: Applications of Fracture Mech-anics, 3rd ed., ASTM, Conshohocken, PA, 1999.
[9] Fisher JW, Dexter RD, Kaufmann EJ. Fracture mechanics of welded structural steel connections,Background Reports: Metallurgy, Fracture Mechanics, Welding, Moment Connections and FrameSystems Behavior, Report No. SAC 95-09, SAC Joint Venture, Sacramento, California, 1995.
[10] Kaufmann EJ, Fisher JW. A study of the effects of material and welding factors on moment frameweld joint performance using a small-scale tension specimen, SAC Technical Report 95-08, 1995.
[11] Ricles JM, Mao C, Kaufmann EJ, Lu L-W, Fisher JW. Dynamic tension tests of simulated weldedbeam flange connections, Report No. SAC/BD-00/07, SAC Joint Venture, Sacramento, California,2000.
[12] AISC. Seismic provisions for structural steel buildings, AISC, Chicago, IL, 1997.[13] Lu L-W, Xue M, Kaufmann EJ, Fisher JW. Cracking, repair and ductility enhancement of welded
moment connections, Proc NEHRP Conference and Workshop on Research on the Northridge, Cali-fornia Earthquake of January 17, 1994, Vol III pp. 637–46, Los Angeles, 1997.
[14] Stojadinovic B, Goel S, Lee K, Margarian AG, Ghoi JH. Parametric tests on unreinforced steelmoment connections. Journal of Structural Engineering, ASCE 2000;126(1):40–9.
[15] Engelhardt M. Cyclic testing of welded unreinforced moment connections, Unpublished report, Uni-versity of Texas, Austin, 2000.
[16] FEMA. Interim guidelines advisory no. 1, Report No. FEMA 267A (SAC-96-03), SAC Joint Ven-ture, Sacramento, California, 1997.
[17] Barsom J. Failure analysis of welded beam to column connections, Report No. SAC/BD-99/23, SACJoint Venture, Sacramento, California, 1999.
[18] Ricles JM, Mao C, Lu L-W, Fisher JW. Development and evaluation of improved ductile weldedunreinforced flange connections, Report No. SAC/BD-00/24, SAC Joint Venture, Sacramento, Cali-fornia, 2000.
[19] ABAQUS User’s Manual. Hibbit, Karlsson and Sorensen, Inc., Providence, Rhode Island, 1999.[20] SAC Joint Venture (SAC). Protocol for fabrication, inspection, testing, and documentation of beam–
column connection tests and other experimental specimens, Report No. SAC/BD-97/02, SAC JointVenture, Sacramento, California, 1997.
[21] El-Tawil S, Mikesell T, Vidarsson E, Kunnath S. Strength and ductility of fr welded-bolted connec-tions, Report No. SAC/BD-98/01, SAC Joint Venture, Sacramento, California, 1998.
[22] Hancock JW, MacKenzie AC. On the mechanisms of ductile failure in high-strength steels subjectedto multi-axial stress states. Journal Mech Phys Solids 1976;24:147–69.
[23] Lemaitre J. A course on damage mechanics. Berlin: Springer Verlag, 1996.[24] AISC. Load and resistance factor design specification for structural steel buildings, 2nd ed., AISC,
Chicago, Illinois, 1993.[25] Krawinkler H. Shear design of steel frame joints. AISC Engineering Journal 1978;15(3):82–91.[26] FEMA. Recommended seismic design criteria for new moment-resisting steel frame structures,
Report No. FEMA 350, FEMA, Washington, DC, 2000.


![Behavior of bolted angle connections subjected to combined ...daryanpub.com/userfiles/file/Articles/sdarticle2.pdf · welded moment connections of steel frames [1,2]. Since then,](https://img.pdfslide.net/doc/110x75/5e9942a22ea80b5629071f77/behavior-of-bolted-angle-connections-subjected-to-combined-welded-moment-connections.jpg)


![Pump Specifications - · PDF fileWith over 7,500 employees worldwide, HYDAC is ... NBR HFC Improved viscosity properties, ... [Nm] Moment (drive torque)](https://img.pdfslide.net/doc/110x75/5a8431547f8b9ac96a8b6b92/pump-specifications-over-7500-employees-worldwide-hydac-is-nbr-hfc-improved.jpg)