Embed Size (px)
Citation preview
ii
DEVELOPMENT OF ONLINE SPEED TRAP SYSTEM (DOSTS).
MAIZUL BIN HJ. ISHAK
A project report submitted in partial fulfillments of the
requirements for the award of the degree of
Master of Engineering (Electrical – Electrical Power)
Faculty of Electrical Engineering
Universiti Teknologi Malaysia
MAY 2006
vi
ABSTRACT
By generating TTL square wave of the output of a Doppler speed sensor principle
and its’ datasheet specification of DRS1000, connected to frequency to voltage converter
circuit, PIC 16F877 micro controller with Analog to Digital converter circuit and web
camera, a prototype of the Development of Online Speed Trap System (DOSTS) which
being created and programmed to detect the signal and calculate the vehicle’s speed. All
the data will be sending to GUI (at PC) through serial communication interface (RS232).
A development programming of Visual Basic (VB) GUI will gather all the important of
information or data as usual as required by the police traffic department for displaying it
on the PC monitor. The work in this project is to study, evaluate and compare the output
of Doppler principle especially DRS1000`s output, detecting for speed of the vehicles
will be the main focus. The study of the output Doppler principle will lead to be used in
the VB GUI. As a conclusion, the speed and image of car models using the same of
output of DRS 1000, Doppler sensor is verified via programming of VB GUI in term of
various speeds.
vii
ABSTRAK
Dengan menjanakan gelombang square TTL, sebagai output daripada sensor
kelajuan, Doppler; berdasarkan diatas prinsip dan datasheet spesifikasi DRS1000, ianya
dihubungkan kepada litar pertukaran frekuansi kepada voltan, PIC 16F877
microcontroller dengan litar pertukaran Analog kepada Digital dan kamera web; satu
prototaip daripada Pembangunan Sistem Perangkap Laju Secara Diatas Talian telah
dicipta dan diprogramkan untuk mengesan isyarat dan juga mengira kelajuan kenderaan.
Kesemua data tersebut akan dihantar ke GUI (di komputer) dengan melalui antaramuka
komunikasi Sesiri (RS232). Suatu pembangunan berprogram daripada Visual Basic (VB)
GUI akan mengumpulkan kesemua maklumat atau data yang penting seperti yang biasa
dikehendaki oleh pihak jabatan polis trafik dengan tujuan untuk paparan di monitor
komputer. Kerja-kerja didalam projek ini adalah bertujuan untuk pembelajaran, penilaian
dan pembezaan output daripada prinsip Doppler teristimewanya output daripada
DRS1000, yang mana pengesanan kelajuan kenderaan menjadi fokus utama.
Pembelajaran mengenai output daripada prinsip Doppler ini akan menjadi teraju utama
untuk digunakan didalam VB GUI. Sebagai kesimpulannya, imej dan kelajuan model
kereta yang menggunakan output yang sama dengan DRS1000, sejenis sensor Doppler
disahkan melalui pengaturcaraan VB GUI didalam pelbagai kelajuan.
viii
TABLE OF CONTENT
CHAPTER TITLE PAGE
DECLARATION iii
DEDICATION iv
ACKNOWLEDGEMENT v
ABSTRACT vi
ABSTRAK vii
TABLE OF CONTENTS viii
LIST OF FIGURES xi
LIST OF TABLES xiv
LIST OF SYMBOLS / ABBREVIATIONS xv
I INTRODUCTION
1.1 Overview 1
1.2 Project Background 2
1.3 Project Objectives 3
1.4 Scope of Project 4
1.5 Research Methodology 5
1.5.1 Overview 5
1.5.2 Project & Operation Concept 5
of Flow Diagram
1.6 Literature Review 7
1.6.1 Description of Laser Radar 7
Speed Trap
ix
1.6.2 Description of Microwave 9
Radar Speed Trap
1.6.3 Different Types of Radar Frequencies 11
1.6.4 S Band Radar (obsolete) 12
1.6.5 X Band Radar 13
1.6.6 Ku Band Radar 13
1.6.7 K Band Radar 13
1.6.8 Ka Band Radar 14
1.6.9 Wideband (Ka) Radar 15
1.7 Differential between Microwave Radar 15
and Laser Radar
1.8 Layout of Thesis 17
II CONCEPT OF DOPPLER
2.1 Doppler Effect History 18
2.2 An Example of Doppler Effect/Principle 20
2.3 Applications of Doppler Effect 21
2.4 An Example of Stationary Radar Doppler 22
2.4.1 Target echo frequency 23
2.4.2 Radar Doppler shift 23
2.5 An Example of Moving-mode Radar Doppler 25
2.6 The DRS1000 28
x
III PROJECT DESIGN
3.1 Schematic Design 32
3.2 Software Development 37
IV RESULT AND ANALYSIS
4.1 Overview 39
4.2 DOSTS Matlab Simulation 39
4.3 DOSTS Prototype Project 42
4.4 Frequency to Voltage Converter 44
(F/V Conv.) Circuit.
4.5 DOSTS Result Using Visual Basic. 46
V CONCLUSION AND RECOMMENDATIONS
FUTURE WORK
5.1 Conclusion 50
5.2 Recommendation of Future Works 51
REFERENCES 52
APPENDICES
APPENDIX A DOSTS Matlab Simulation APPENDIX B PIC 16F877 microcontroller - asm.file (MPLab v 7.33) APPENDIX C Programming of Visual Basic - Declaration APPENDIX D VB GUI Frame 1 APPENDIX E VB GUI Frame 2
xi
LIST OF FIGURES
FIGURE TITLE PAGE
1.1 Flow Project Diagram 6
1.2 Operation Flow Diagram 6
1.3 (a) LTI Marksman 20-20 equipment 8
1.3 (b) LTI Marksman 20-20 equipment 9
2.1 Picture of Christian Doppler 18
2.2 A train at stationary mode & in motion mode 20
2.3 An example of radar signal 22
2.4 An example of stationary radar spectrum 24
2.5 A moving mode spectrum opposite direction target 26
xii
2.6 A moving mode spectrum same direction (lane) target 27
front antenna
2.7 A moving mode spectrum same direction (lane) target 27
rear antenna
2.8 DRS1000 speed sensor 29
2.9 The application of non-contact speed measurement 29
3.1 Frequency to Voltage Converter Circuit (F/V Converter) 33
schematic diagram
3.2 PCB board layout for F/V Converter 33
3.3 PIC 16F877 microcontroller with Analog to Digital 35
Converter Circuit (PIC & A/D Converter) schematic
diagram
3.4 PCB board layout for PIC & A/D Converter 35
4.1 DOSTS Matlab Simulation 1 40
4.2 DOSTS Matlab Simulation 2 41
4.3 DOSTS Matlab Simulation 3 41
4.4 Sketch of DOSTS prototype project 42
4.5 Actual DOSTS prototype project 43
xiii
4.6 Module of car, web cam and highway 43
4.7 Signal generator & F/V Converter and PIC 43
with A/D Converter circuit
4.8 Laptop with displaying the VB GUI 44
4.9 Generating signal using signal generator to produce 44
same signal as DRS1000
4.10 Input F/V converter 45
4.11 Output F/V converter 45
4.12 VB GUI 1 - “Operator Detail” frame 46
4.13 VB GUI 2 - “Main Window - DOSTS” frame 47
4.14 VB GUI 3 - “Main Window - DOSTS” frame 48
4.15 Saving the captured image 49
xiv
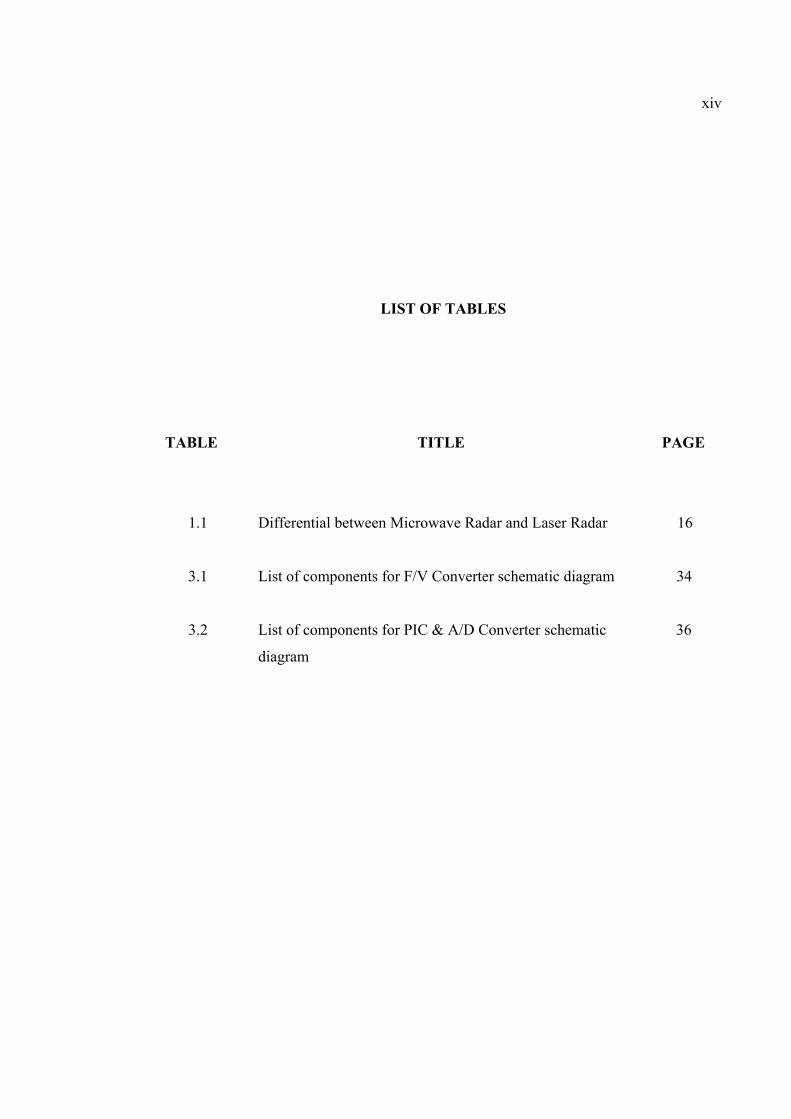
LIST OF TABLES
TABLE TITLE PAGE
1.1 Differential between Microwave Radar and Laser Radar 16
3.1 List of components for F/V Converter schematic diagram 34
3.2 List of components for PIC & A/D Converter schematic 36
diagram
xv
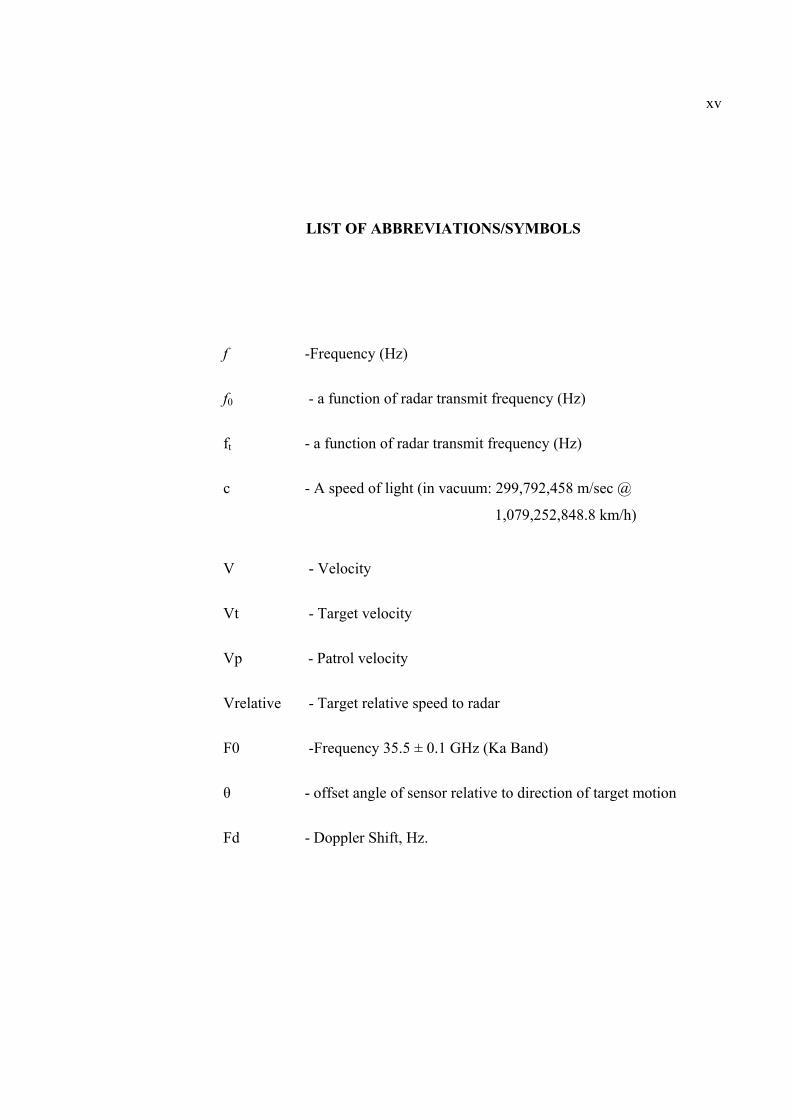
LIST OF ABBREVIATIONS/SYMBOLS
f -Frequency (Hz)
f0 - a function of radar transmit frequency (Hz)
ft - a function of radar transmit frequency (Hz)
c - A speed of light (in vacuum: 299,792,458 m/sec @
1,079,252,848.8 km/h)
V - Velocity
Vt - Target velocity
Vp - Patrol velocity
Vrelative - Target relative speed to radar
F0 -Frequency 35.5 ± 0.1 GHz (Ka Band)
- offset angle of sensor relative to direction of target motion
Fd - Doppler Shift, Hz.
CHAPTER 1
INTRODUCTION
1.1 Overview
In our modern civilization, speed trap system or vehicle detection and
surveillance technologies can be described as containing three components:
i. Transducer
ii. A signal processing device
iii. A data processing device
The function of the transducer is to detect the passage or presence of a
vehicle. The signal-processing device typically converts the transducer output into an
electrical signal and while the data processing device usually consists of computer
2
hardware and firmware that converts the electrical signal into traffic parameters.
In this case, traffic parameters mean vehicle presence, count, speed, class, gap,
headway, occupancy, weight and link travel time [1].
Speed Trap is a set of equipment that being used by government sector or
private sector such as the Royal Police in order to capture and measure the speed of
vehicles movement which over the speed limit at the certain area [2]. There are two
types of techniques for speed trap system that widely used in the worldwide market:
i. Speed trap using lasers technology technique called Laser Radar Speed
Trap.
ii. Speed trap using microwaves technology technique called Microwave
Radar Speed Trap.
Each technique has their own advantages and disadvantages, which will be
discuss later. The aim of this proposal is to study the output speed sensor, DRS1000
to be implement in a speed trap system in order to build a model, which uses the
microwaves technology technique (Ka Band Type) [3], [4].
1.2 Project Background
In this project proposal, Doppler Effect or Doppler principle is one of
technique from microwave technology technique appearing in continuous wave (CW)
3
is being implemented in the model. A company named, GMH Engineering,
Utah, U.S.A had produced a large of worldwide market sales regarding on Doppler
speed sensor – DRS1000 (microwaves technology technique – Ka Band type). The
output of this sensor, which is fixed in TTL square wave – fixed output 100 Hz/Mph
or 62.138 Hz/Kph (Kmh), was generated using frequency generator as the speed of
vehicles to be used with other hardware in the DOSTS prototype [3], [4].
The output of sensor then being connected and sent the data to Frequency to
Voltage circuit in order to convert the TTL square wave frequency to voltage within
high (5 Volt) or low (0 Volt). Then the data will be sent to PIC 16F877
microcontroller with Analog to Digital converter in order to be calculated and convert
to digital output. Digital output data then being send to VB GUI at computer through
serial communication port (RS232). Image also can be captured using the web
camera as the camera model which being connected using the Universal Serial Bus
(USB port). A develop programming of Visual Basic (VB) GUI will gathered all the
important of information or data that usually required by the police department for
issuing the over speed limit’s summon.
1.3 Project Objectives
Below are several projects’ objectives to be considered to:
1) Study the Doppler principles and its applications in vehicle speed detection or
measurement.
4
2) Implement and design a simple speed trap prototype using the output of
Doppler speed sensor (DRS1000).
3) Develop VB Graphical User Interface (GUI) that will appear the image,
operator’s detail, present time and date at computer.
4) Capture image of speeding vehicle in term of speed and the image will appear on
VB GUI at computer by using web camera as camera model.
1.4 Scope of Project
The scopes of this project are:
1) To study the possibility used from Doppler principles and its applications in term
of vehicle speed detection or measurement.
2) To generates the output of speed sensor- DRS1000, for varies vehicle speeds
using signal generator
3) To convert signal that being generated in term of speed of vehicles and display at
GUI using Visual Basic 6.0 (VB).
4) To interface web camera and computer for displaying the image that being
captured on VB GUI.
5
5) To produce results that usually being required by police department such as
date, time, speed limit, speed captured, operator data and etc.
1.5 Research Methodology
1.5.1 Overview
This chapter will describe about the processes from the beginning of this
project until the end. First part will describe about the general knowledge of flow
diagram and the second part will describe the operation of the project.
1.5.2 Project and Operation Concept Flow Diagram
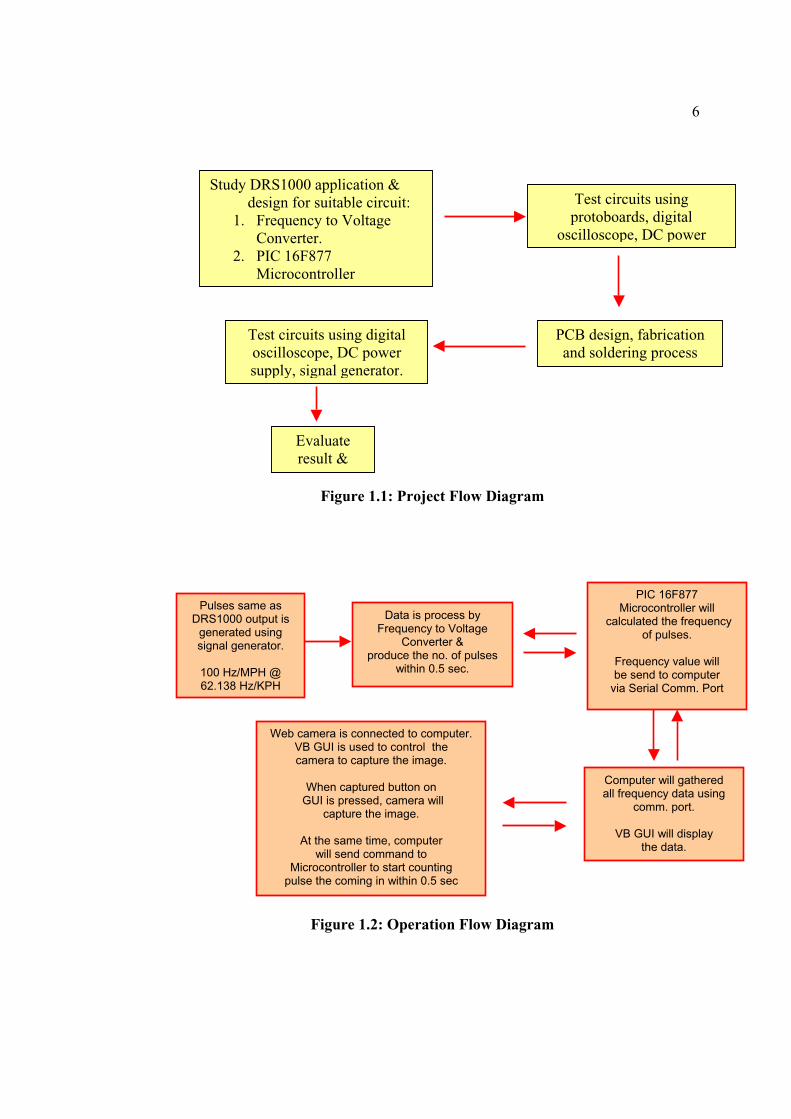
By referring to figure 3.1 and figure 3.2 show that the flow diagram of how to
start this project and the operation concept flow diagram of this project. Firstly, study
the DRS1000 application by referring to its` datasheets [3], [4].
All the circuits were joined and connected using protoboard and being test
using digital oscilloscope, multimeter and etc. After success being tested, Printed
Circuit Board (PCB) design was done by using any kind of suitable PCB designer
software. In this project, Protel DXP 2004 and EAGLE version 4.15 are introduced.
After PCB fabrication process success, all the circuits were test again in term of to get
the exact result and analysis.
6
Study DRS1000 application & design for suitable circuit:
1. Frequency to Voltage Converter.
2. PIC 16F877 Microcontroller
Test circuits using protoboards, digital
oscilloscope, DC power
PCB design, fabrication and soldering process
Test circuits using digital oscilloscope, DC power supply, signal generator.
Evaluateresult &
Figure 1.1: Project Flow Diagram
Pulses same asDRS1000 output is
generated usingsignal generator.
100 Hz/MPH @ 62.138 Hz/KPH
Data is process by Frequency to Voltage
Converter &produce the no. of pulses
within 0.5 sec.
PIC 16F877 Microcontroller will
calculated the frequency of pulses.
Frequency value will be send to computer
via Serial Comm. Port
Computer will gathered all frequency data using
comm. port.
VB GUI will display the data.
Web camera is connected to computer.VB GUI is used to control thecamera to capture the image.
When captured button on GUI is pressed, camera will
capture the image.
At the same time, computerwill send command to
Microcontroller to start counting pulse the coming in within 0.5 sec
Figure 1.2: Operation Flow Diagram
7
A signal generator is used to generate varies speed as same as DRS1000
output, which in TTL square wave. Computer is used as a tool to provide and
gathered all the data and appeared them through VB GUI. Web camera will focus the
image and capture it as a proof of speeding car in DOSTS prototype. Detailed
information will be discuss and shown at Result & Analysis chapter later.
1.6 Literature Review
1.6.1 Description of Laser Radar Speed Trap
Laser radars, also referred to as ladar or lidar, using pulsed laser light instead
of continuous microwaves (CW) to sense a target. Lasers are extremely pure
(coherent) light waves, similar to only one (pure) color of light. Notify that white
light consists of multiple wavelengths (colors) with random (non-coherent) phases.
Theodore Maiman of Hughes Aircraft Company (California) built the first working
laser using a ruby rod pumped by a flash lamp in May of 1960 [1]. Traffic laser used
solid-state diodes to generate laser light. Below are the meaning and short form for
the important words in Laser Technology technique:
i. LASER - Light Amplification by Stimulated Emissions of
Radiation
ii. RADAR - RAdio Detection And Ranging
iii. LADAR - LAser Detection And Ranging
8
iv. LIDAR - LIght Detection And Ranging
Laser radars transmit pulsed laser light to measure target range. The time it
takes for a laser light pulse to travel (at the speed of light) from the laser to the target
and back is used to compute the distance from the laser to target and back (distance
pulse travels = speed of light x time). Target range from laser half of this distance
(Range = 0.5 x speed of light x time). The change in target range over time (1/3
second typical) equals target velocity. Laser radar must transmit a minimum of 2
pulses to get at least 2 range measurements at 2 different times to compute speed. In
reality laser radars transmit tens to hundreds of pulses per second [1], [2].
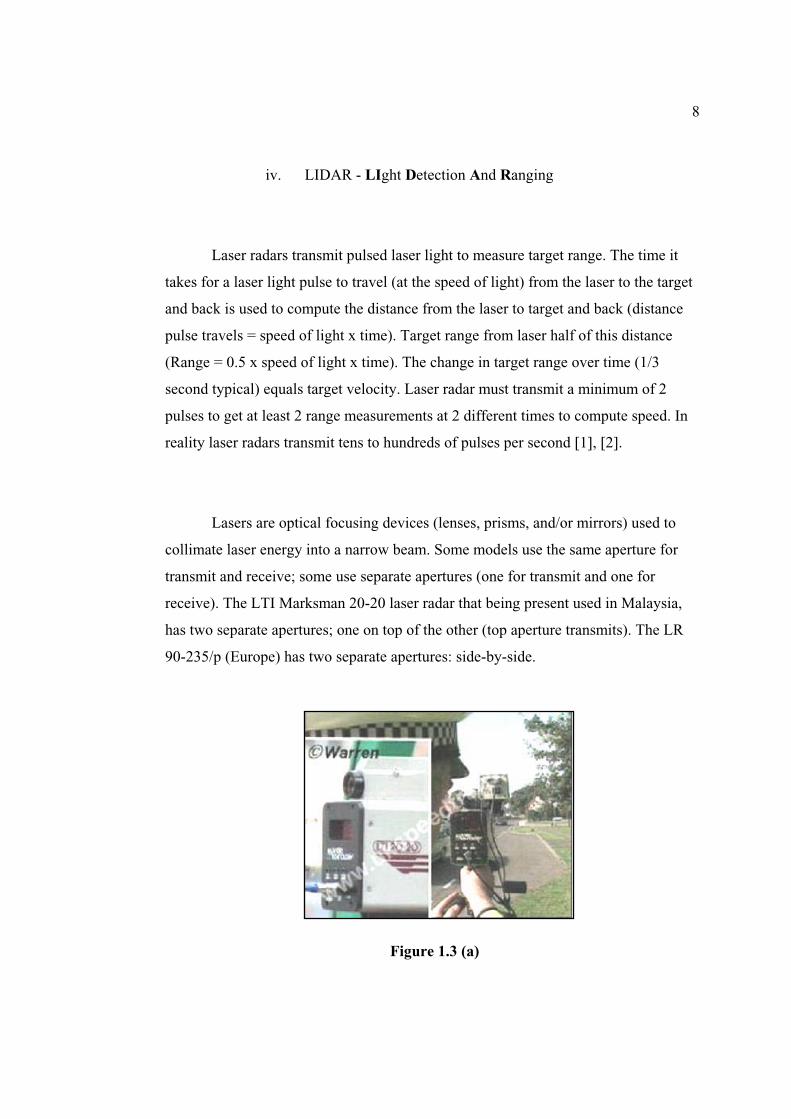
Lasers are optical focusing devices (lenses, prisms, and/or mirrors) used to
collimate laser energy into a narrow beam. Some models use the same aperture for
transmit and receive; some use separate apertures (one for transmit and one for
receive). The LTI Marksman 20-20 laser radar that being present used in Malaysia,
has two separate apertures; one on top of the other (top aperture transmits). The LR
90-235/p (Europe) has two separate apertures: side-by-side.
Figure 1.3 (a)
9
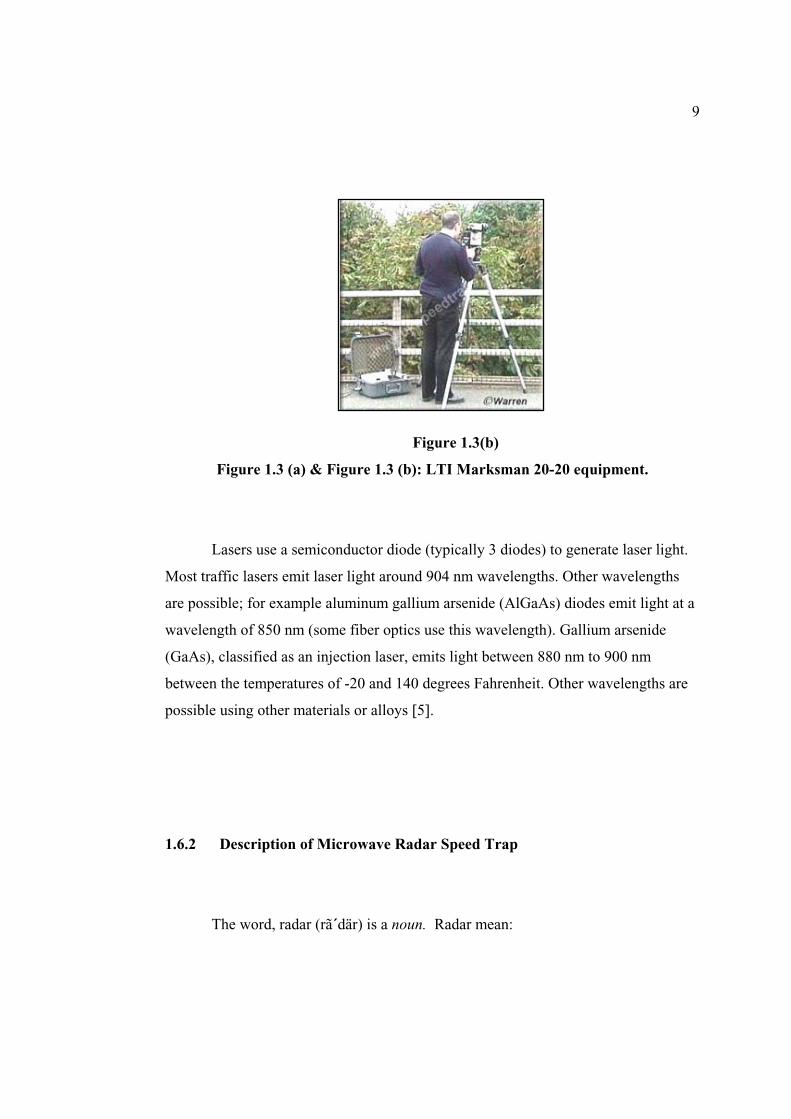
Figure 1.3(b)
Figure 1.3 (a) & Figure 1.3 (b): LTI Marksman 20-20 equipment.
Lasers use a semiconductor diode (typically 3 diodes) to generate laser light.
Most traffic lasers emit laser light around 904 nm wavelengths. Other wavelengths
are possible; for example aluminum gallium arsenide (AlGaAs) diodes emit light at a
wavelength of 850 nm (some fiber optics use this wavelength). Gallium arsenide
(GaAs), classified as an injection laser, emits light between 880 nm to 900 nm
between the temperatures of -20 and 140 degrees Fahrenheit. Other wavelengths are
possible using other materials or alloys [5].
1.6.2 Description of Microwave Radar Speed Trap
The word, radar (rã´där) is a noun. Radar mean:
10
Acronym for RAdio Detection And Ranging.
A remote sensor that emits electromagnetic waves (radio,
microwave, or light) in order to measure reflections for
detection purposes (presence, location, motion, etc.).
Radiolocation.
Field disturbance sensor.
All stationary microwave traffic radars measure on-coming traffic; some
models also (and/or) measure going (receding) traffic. Almost, all-moving mode
radars can operate from a stationary position or a moving patrol car. Moving mode
radars usually require a minimum patrol car speed for moving mode operation. All
moving mode radars (in moving mode) measure on-coming (opposite lane) traffic;
some can also (and/or) measure receding (opposite lane) traffic (requires aft antenna).
Some moving mode radars can measure targets traveling in the same-lane (direction)
as the patrol car (front and/or rear antenna). Same-lane radars require a minimum
speed difference (2 mph or MORE) between the target and patrol car. Moving radars
also measure patrol car speed (ground speed), most also display patrol measured
speed. Many radars track only one target at a time; some models have the option to
track and display two targets. In this case, the strongest (may be closest or largest)
target (echo) and the fastest (or a faster) target in the beam [1], [3].
Most microwave traffic radars have a relatively wide beam (9 to 25 degrees)
that easily covers several lanes of traffic at a relatively short. Detection range (in the
beam) varies with radar and target reflectivity and may be as low as 100 feet (30
meters) or less to 1 mile (1.6 kilometers) or more. Radar may track a distant large
target instead of a closer small target without any indication to the operator that
11
targets the radar is tracking. Usually, radar should be located as close to the road
in order to achieve accurate measurement [4].
1.6.3 Different Types of Radar Frequencies
There are several types of radar with different types of frequencies that
stated such as:
1. S Band Radar
2. X Band Radar
3. Ku Band Radar
4. K Band Radar
5. Ka Band Radar
6. Wide Ka Band Radar
12
1.6.4 S Band Radar (obsolete)
Automatic Signal Co. built one of the first traffic radars in 1947 for the state
police in U.S.A. Early radars were bulky and heavy systems (vacuum-tube
technology) that usually consisted of three or more separate pieces of equipment, an
antenna (sometimes 2 antennas - separate transmit and receive), a 45 pound (20 kg)
box (the tube transmitter, receiver and processor), a strip chart pen recorder for a
permanent record, and a needle meter calibrated in mph. Sometimes the antennas
mounted on a tripod and sometimes on the hood or fender of a patrol car. Some of the
early 1960s' models mounted the antennas in the back windshield of the patrol car
[1], [4].
The first traffic radars transmitted at 2.455 GHz in the S band (2 - 4 GHz).
Note that many microwave ovens transmit at about 2.45 GHz, and low power
unlicensed wireless communications transmit from 2.400 - 2.4835 GHz. S band radar
antenna beam widths varied from 15 to 20 degrees depending on model. These radars
operated from a stationary position only and measured receding as well as
approaching targets to an accuracy of about ± 2 mph. The maximum detection range
was an unimpressive 150 to 500 feet (45 to 150 meters); vacuum-tube receivers do
not have the sensitivity of solid-state receivers. Radar with a 150-feet detection range
would have less than 1.5 seconds to measure a target traveling 68 mph (100
feet/second or 109 kmh). Nowadays, the S band radars are obsolete [1], [4].
13
1.6.5 X Band Radar
X band radars have been around since 1965 and operate on a single frequency
(one 50 MHz channel). Radars in the X band have better all weather performance
(less signal attenuation in bad weather) than K or Ka bands. X band radars tend to
have wider beams than K or Ka radars. Some European countries use X band traffic
radars that transmit at 9.41 GHz or 9.90 GHz [1], [4].
1.6.6 Ku Band Radar
The Federal Communications Commission (FCC) has allocated 13.45 GHz in
the Ku band for traffic radar use in the United States; however Ku radars are not sold
or used in the U.S. Some European countries are reported to use Ku band (13.45
GHz) traffic radars.
1.6.7 K Band Radar
K band radars have been around since 1976 and operate on a single frequency
(one 200 MHz channel). These radars generally have more narrow beams than X
band radars, and wider beams than Ka band radars. Detection range decreases with
moisture
14
Some World War II radars operated in the K band around 24.1 GHz (in the
limits of K band traffic radar), which also happens to be in the water vapor absorption
band (centered at about 22.24 GHz); signals in the absorption band tend to become
absorbed by moisture in the atmosphere and do not have the range that other
frequency bands offer. For short range applications the effects may be tolerable on
relatively clear dry days [1], [4].
1.6.8 Ka Band Radar
In 1983 the U.S. FCC allocated the spectrum from 34.2 - 35.2 GHz (Ka band)
for traffic radar use, that same year Ka band photo (Across the Road) radars started
appearing in the United States. Nine years later in 1992 the FCC expanded the Ka
band spectrum allocated for traffic radar use to 33.4 - 36 GHz. Ka band radars
typically have more narrow beams than X or K band radars. Target detection range
dependents on moisture in the atmosphere (rain or humidity), the more moisture the
less range.
Many models have a frequency tolerance of ± 100 MHz (200 MHz
bandwidth); some models have a tolerance of ± 50 MHz (100 MHz bandwidth). An
advantage of 100 MHz bandwidth over a 200 MHz bandwidth (besides less chance of
interference) is more radar channels can be squeezed in the (Ka) band. The bandwidth
allocated to Ka band traffic radar is 2.6 GHz (36-33.4 GHz), or 2,600 MHz. Radar
with 200 MHz bandwidth has 13 channels (2600/200). Radar with 100 MHz
bandwidth has 26 channels (2600/100). At minimum 2 radars operating close to each
15
other should be separated by at least 2 channels (the greater the separation the
less chance of interference) [1], [4].
.
1.6.9 Wideband (Ka) Radar
Wideband radars (Ka band) operate on a single fixed frequency
(operator selects one of several available), and/or in a frequency hop mode. In
frequency hop mode the radar dwells on a fixed frequency for a fraction of a second
(on the order of 1/10 of a second or more) and hops to another frequency. The radar
cycles between a numbers of different frequencies. Wideband radars are intended to
defeat radar detectors [1], [4].
1.7 Differential between Microwave Radar and Laser Radar
In microwave traffic radars application, it’s required the operator to aim
exactly (only general direction) at one particular target, and is most effective when
traffic is light. Many microwave radars can be used from a moving patrol car. Traffic
laser radars can function in dense (or light) traffic, and require the operator to select
(aim crosshairs at) a particular target. Laser radars are not designed to operate from a
moving patrol car. Typically microwave radars have longer detection range than laser
light systems. Table 1 below shows the differential Between Microwave Radar and
Laser Radar requirement for application [1], [2].
16
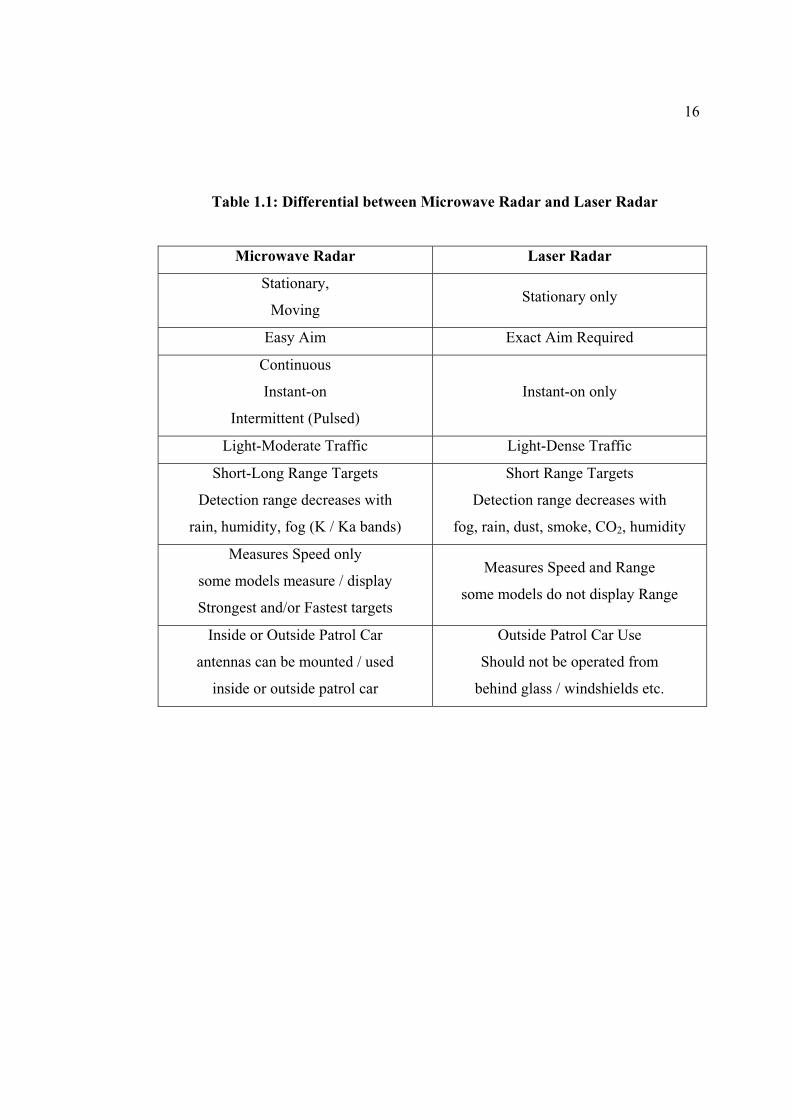
Table 1.1: Differential between Microwave Radar and Laser Radar
Microwave Radar Laser Radar
Stationary,
MovingStationary only
Easy Aim Exact Aim Required
Continuous
Instant-on
Intermittent (Pulsed)
Instant-on only
Light-Moderate Traffic Light-Dense Traffic
Short-Long Range Targets
Detection range decreases with
rain, humidity, fog (K / Ka bands)
Short Range Targets
Detection range decreases with
fog, rain, dust, smoke, CO2, humidity
Measures Speed only
some models measure / display
Strongest and/or Fastest targets
Measures Speed and Range
some models do not display Range
Inside or Outside Patrol Car
antennas can be mounted / used
inside or outside patrol car
Outside Patrol Car Use
Should not be operated from
behind glass / windshields etc.
17
1.8 Layout of Thesis
This section outlines the structure of the thesis.
Chapter 2 deals with the concept of Doppler, history of Doppler, the actual
DRS1000 concept which being implement into DOSTS prototype project and also
examples of calculations.
Chapter 3 discusses about the information for project design of DOSTS
prototype, which can be divided into two categories:
i) Schematic Design
ii) Software Development
Chapter 4 explains the result and analysis for actual DOSTS prototype
project including the DOSTS Matlab simulation that based on DRS1000 datasheet &
application.
Chapter 5 concludes the topics and suggests recommendation for future
works, which can be done due to small improvements or large improvements.