Embed Size (px)
Citation preview

P024-1
Development of pollutant build-up parameters for MIKE URBAN for Southeast Queensland, Australia
An LIU1, Prasanna EGODAWATTA1, Morten Just KJØLBY2, Ashantha GOONETILLEKE1
1 Queensland University of Technology, Australia, e-mail: [email protected];
[email protected]; [email protected]
2 DHI Denmark, Denmark, e-mail: [email protected]
Abstract: Accurate estimation of input parameters is essential to ensure the
accuracy and reliability of hydrologic and water quality modelling. Calibration is an approach to obtain accurate input parameters for comparing observed and simulated results. However, the calibration approach is limited as it is only
applicable to catchments where monitoring data is available. Therefore, methodology to estimate appropriate model input parameters is critical,
particularly for catchments where monitoring data is not available. In the research study discussed in the paper, pollutant build-up parameters derived from catchment field investigations and model calibration using MIKE URBAN are
compared for three catchments in Southeast Queensland, Australia. Additionally, the sensitivity of MIKE URBAN input parameters was analysed. It was found that
Reduction Factor is the most sensitive parameter for peak flow and total runoff volume estimation whilst Build-up rate is the most sensitive parameter for TSS load estimation. Consequently, these input parameters should be determined
accurately in hydrologic and water quality simulations using MIKE URBAN. Furthermore, an empirical equation for Southeast Queensland, Australia for the
conversion of build-up parameters derived from catchment field investigations as MIKE URBAN input build-up parameters was derived. This will provide guidance for allowing for regional variations in the estimation of input parameters for
catchment modelling using MIKE URBAN where monitoring data is not available.
Keywords: MIKE URBAN; Stormwater quality modelling; Pollutant build-up
1 Introduction Hydrologic and water quality modelling are important in urban stormwater
management. Modelling results are used to characterise the urban runoff, provide input to receiving water analysis, determine impacts, sizes and
combinations of stormwater treatment devices, and provide guidance to urban planning and development and contribute to improving urban water quality (Huber 1986). Consequently, the accuracy and reliability of modelling outcomes
play an essential role in decision-making in relation to stormwater management (Huber 1986, Tsihrintzis and Hamid 1997) .
The hydrologic and water quality modelling are two important processes which are generally viewed as quantity and quality simulations. In terms of quantity
simulation, it primarily includes rainfall input, runoff routing on the catchment surfaces and the flow into the drainage system (Beven 2001). Water quality
simulation include the pollutants build-up on catchment surfaces during dry periods and the wash-off during rainfall events, followed by the transport into the drainage system and subsequently to the catchment outlet. Different
mathematical approaches and process equations are employed to describe the corresponding simulation processes. For example, the time-area method and the
exponential build-up equation are two typical mathematical approaches for
P024-2
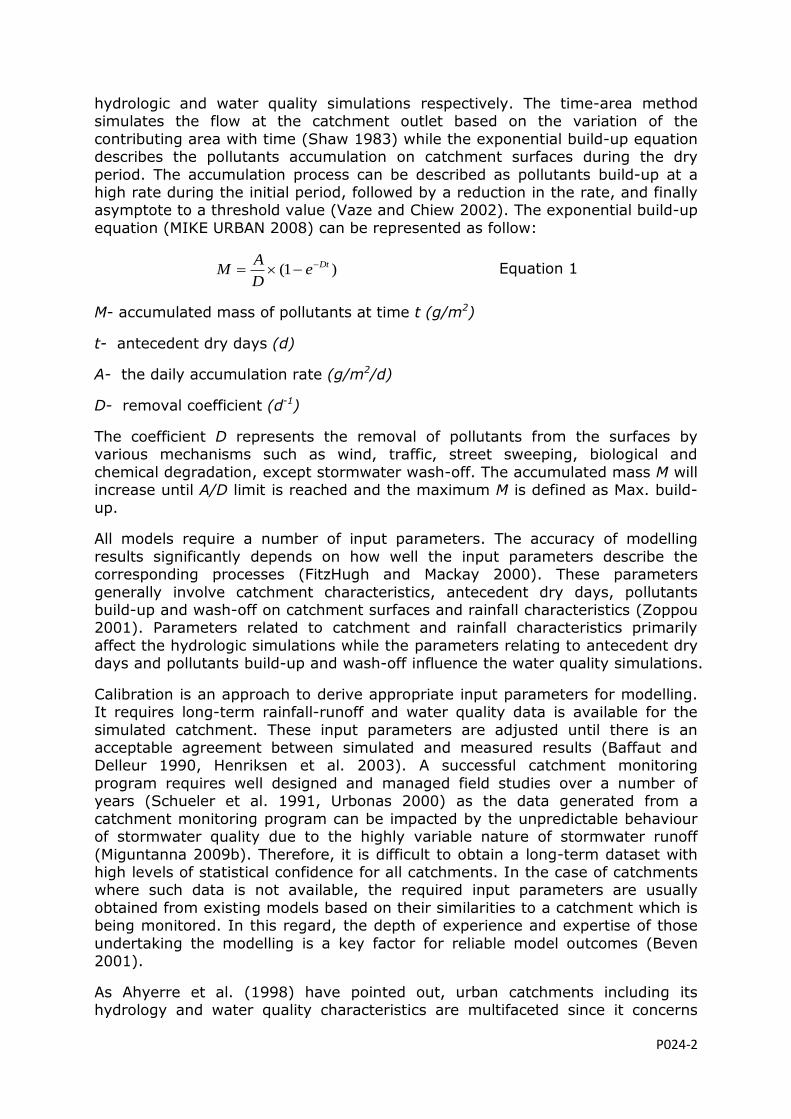
hydrologic and water quality simulations respectively. The time-area method simulates the flow at the catchment outlet based on the variation of the
contributing area with time (Shaw 1983) while the exponential build-up equation describes the pollutants accumulation on catchment surfaces during the dry
period. The accumulation process can be described as pollutants build-up at a high rate during the initial period, followed by a reduction in the rate, and finally asymptote to a threshold value (Vaze and Chiew 2002). The exponential build-up
equation (MIKE URBAN 2008) can be represented as follow:
)1( DteD
AM Equation 1
M- accumulated mass of pollutants at time t (g/m2)
t- antecedent dry days (d)
A- the daily accumulation rate (g/m2/d)
D- removal coefficient (d-1)
The coefficient D represents the removal of pollutants from the surfaces by various mechanisms such as wind, traffic, street sweeping, biological and
chemical degradation, except stormwater wash-off. The accumulated mass M will increase until A/D limit is reached and the maximum M is defined as Max. build-
up.
All models require a number of input parameters. The accuracy of modelling
results significantly depends on how well the input parameters describe the corresponding processes (FitzHugh and Mackay 2000). These parameters
generally involve catchment characteristics, antecedent dry days, pollutants build-up and wash-off on catchment surfaces and rainfall characteristics (Zoppou 2001). Parameters related to catchment and rainfall characteristics primarily
affect the hydrologic simulations while the parameters relating to antecedent dry days and pollutants build-up and wash-off influence the water quality simulations.
Calibration is an approach to derive appropriate input parameters for modelling. It requires long-term rainfall-runoff and water quality data is available for the
simulated catchment. These input parameters are adjusted until there is an acceptable agreement between simulated and measured results (Baffaut and Delleur 1990, Henriksen et al. 2003). A successful catchment monitoring
program requires well designed and managed field studies over a number of years (Schueler et al. 1991, Urbonas 2000) as the data generated from a
catchment monitoring program can be impacted by the unpredictable behaviour of stormwater quality due to the highly variable nature of stormwater runoff
(Miguntanna 2009b). Therefore, it is difficult to obtain a long-term dataset with high levels of statistical confidence for all catchments. In the case of catchments where such data is not available, the required input parameters are usually
obtained from existing models based on their similarities to a catchment which is being monitored. In this regard, the depth of experience and expertise of those
undertaking the modelling is a key factor for reliable model outcomes (Beven 2001).
As Ahyerre et al. (1998) have pointed out, urban catchments including its hydrology and water quality characteristics are multifaceted since it concerns
P024-3
many media, space and time scales. Therefore, input parameter values can significantly vary between different areas. According to Sartor and Boyd (1972),
pollutants build-up vary with the land use. Hence, different build-up parameter sets may be required to replicate pollutants accumulation in different land uses.
In addition, as pollutants build-up can be influenced by a range of factors such as local traffic conditions, it has been recommended that pollutants build-up should not only be related simply to land use but also to other site specific
characteristics (Novotny and Goodrich-Mahoney 1978).
It can be hypothesised that model parameters can be developed by detailed investigation of pollutant processes on catchment surfaces. This is particularly important for modelling catchments where monitoring data is not available. It
can be generally considered that data collected from catchment investigations can represent the local characteristics such as land use and traffic conditions,
which are closely related to hydrologic and water quality characteristics of the catchment. Therefore, the application of these data such as build-up data from catchment investigations in hydrologic and water quality modelling should
enhance the accuracy of modelling results.
Therefore, it is critical that for modelling catchments where monitoring data is not available, methodology is available to determine input parameters based on catchment characteristics. This paper describes the development of a
methodology for applying data from catchment investigations as input parameters for the MIKE URBAN model for water quality modelling. The research
outcomes provide a generic approach for the application of catchment investigation data for modelling. The data derived in this research are build-up parameters, which are among the most important parameters in water quality
modelling. In addition, a sensitivity analysis of MIKE URBAN model parameters was also performed to understand the relationship between input parameters
and model output, prior to undertaking calibration.
2 Materials and methods
2.1 Development of build-up parameters from catchment investigations
As discussed in Chapter 1, pollutants build-up varies with land use and specific
site characteristics. Therefore, solids build-up on road surfaces was investigated based on three types of land use, including residential, commercial and industrial areas at Gold Coast, Southeast Queensland (SEQ), Australia. For each land use,
four road surfaces were selected to allow for different site specific characteristics such as road surface conditions and traffic conditions. Two solids build-up
samples were collected from a 3m2 plot from each road surface representing two different antecedent dry periods. Consequently, a total of 24 solids build-up samples were collected from 12 road surfaces. The total solids (TS) load was
obtained for each sample by adding the laboratory testing results for total suspended solids (TSS) and total dissolved solids (TDS). TSS, TDS and TS load
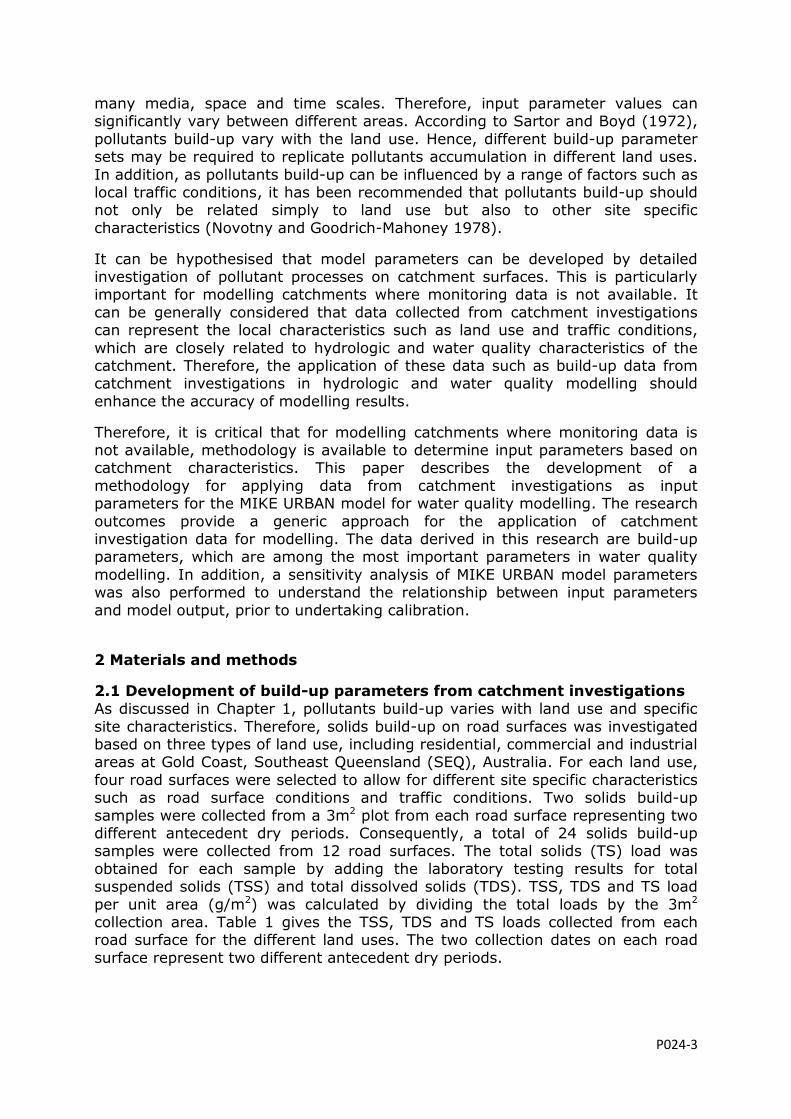
per unit area (g/m2) was calculated by dividing the total loads by the 3m2 collection area. Table 1 gives the TSS, TDS and TS loads collected from each road surface for the different land uses. The two collection dates on each road
surface represent two different antecedent dry periods.
P024-4
Table 1 Solids build-up for each road surface
Land use Road names Solids load (g/m2)
2009-01-16, 8 dry days 2009-05-01, 17 dry days
Residential
TSS TDS TS TSS TDS TS
Merloo Drive 0.25 0.09 0.34 1.01 0.26 1.27
Yarrimbah Drive 2.02 0.14 2.16 0.60 0.27 0.87
Winchester Drive 3.39 0.13 3.52 0.67 0.14 0.81
Carine Court 1.94 0.10 2.04 0.99 0.18 1.17
2009-12-06, 4 dry days 2009-04-24, 10 dry days
Commercial
TSS TDS TS TSS TDS TS
Hobgen Street 1.46 0.16 1.62 0.42 0.11 0.53
St Paul's Place 0.47 0.05 0.52 0.78 0.18 0.96
Via Roma 1.07 0.00 1.07 0.67 0.14 0.81
Thornton Street 1.31 0.43 1.74 0.91 0.27 1.18
2009-07-19, 4 dry days 2009-02-08, 5 dry days
Industrial
TSS TDS TS TSS TDS TS
Stevens Street 2.81 0.18 2.99 3.98 0.27 4.25
Lawrence Drive 1.00 0.09 1.09 2.03 0.13 2.16
Hilldon Court 1.82 0.12 1.94 1.02 0.06 1.08
Patrick Road 2.19 0.00 2.19 2.14 0.10 2.24
According to Table 1, solids build-up curves can be developed for each road surface by fitting these measured TS loads to Equation 1. The larger value of the
two TS data points on each road surface (such as 1.27 on Merloo Drive) was considered as the maximum build-up M while the other TS value with its antecedent dry period (such as 0.34 for 8 antecedent dry days on Merloo Drive)
were input into Equation 1 as the solids build-up value in t time to calculate the removal coefficient D. The accumulation rate A was determined by multiplying
the maximum build-up M by the removal coefficient D. Consequently, 12 build-up parameters sets (A, D and M) were generated for the 12 road surfaces in three land use types. The A, D and M were grouped respectively as the range based on
three land use types.
2.2 Model description
2.2.1 MIKE URBAN
MIKE URBAN is developed by the Danish Hydraulic Institute (DHI) (MIKE URBAN 2008) which is an integration of mathematical modelling procedures developed
for hydrologic, hydraulic and water quality simulations. MIKE URBAN supplies two engines, MOUSE and SWMM5, for modelling hydraulic, hydrology and water quality phenomena. In this research study, MOUSE was selected as the modelling
tool as it provides a comprehensive approach for modelling hydrology, hydraulics and stormwater quality (MIKE URBAN 2008). In the research study, the time-
area method was selected as the hydrologic modelling approach due to its simplicity, but at the same time the ability to provide relatively accurate results. In terms of water quality simulation, MIKE URBAN uses Equation 1 for replicating
pollutants build-up.
2.2.2 Input parameters There are a number of input parameters needed by MIKE URBAN for hydrologic, hydraulic and water quality modelling. However, not all parameters have to be
adjusted during calibration. Based on the review of previously used calibration
P024-5
parameters (Artina et al. 2007, Thorndahl et al. 2008, Thorndahl and Schaarup-Jensen 2008) and documentation from MIKE URBAN manuals (2008), eight
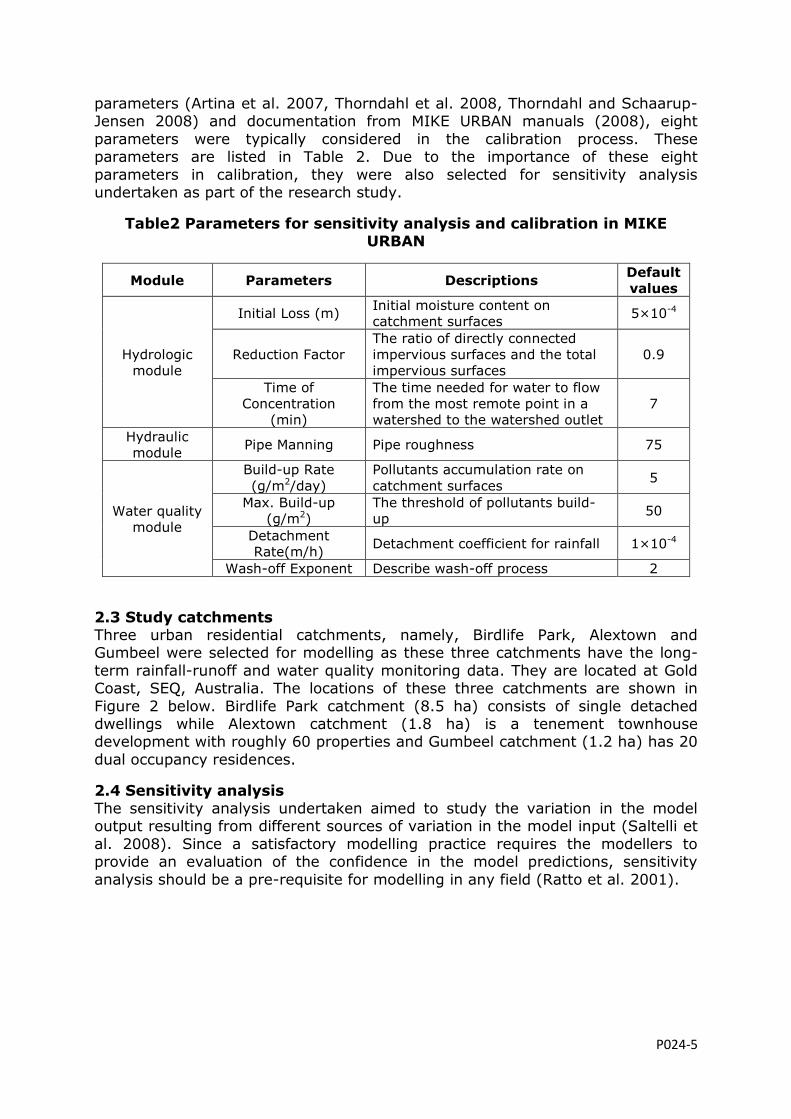
parameters were typically considered in the calibration process. These parameters are listed in Table 2. Due to the importance of these eight
parameters in calibration, they were also selected for sensitivity analysis undertaken as part of the research study.
Table2 Parameters for sensitivity analysis and calibration in MIKE URBAN
Module Parameters Descriptions Default
values
Hydrologic
module
Initial Loss (m) Initial moisture content on
catchment surfaces 5×10⁻⁴
Reduction Factor
The ratio of directly connected
impervious surfaces and the total
impervious surfaces
0.9
Time of
Concentration
(min)
The time needed for water to flow
from the most remote point in a
watershed to the watershed outlet
7
Hydraulic
module Pipe Manning Pipe roughness 75
Water quality
module
Build-up Rate
(g/m2/day)
Pollutants accumulation rate on
catchment surfaces 5
Max. Build-up
(g/m2)
The threshold of pollutants build-
up 50
Detachment
Rate(m/h) Detachment coefficient for rainfall 1×10⁻⁴
Wash-off Exponent Describe wash-off process 2
2.3 Study catchments Three urban residential catchments, namely, Birdlife Park, Alextown and Gumbeel were selected for modelling as these three catchments have the long-
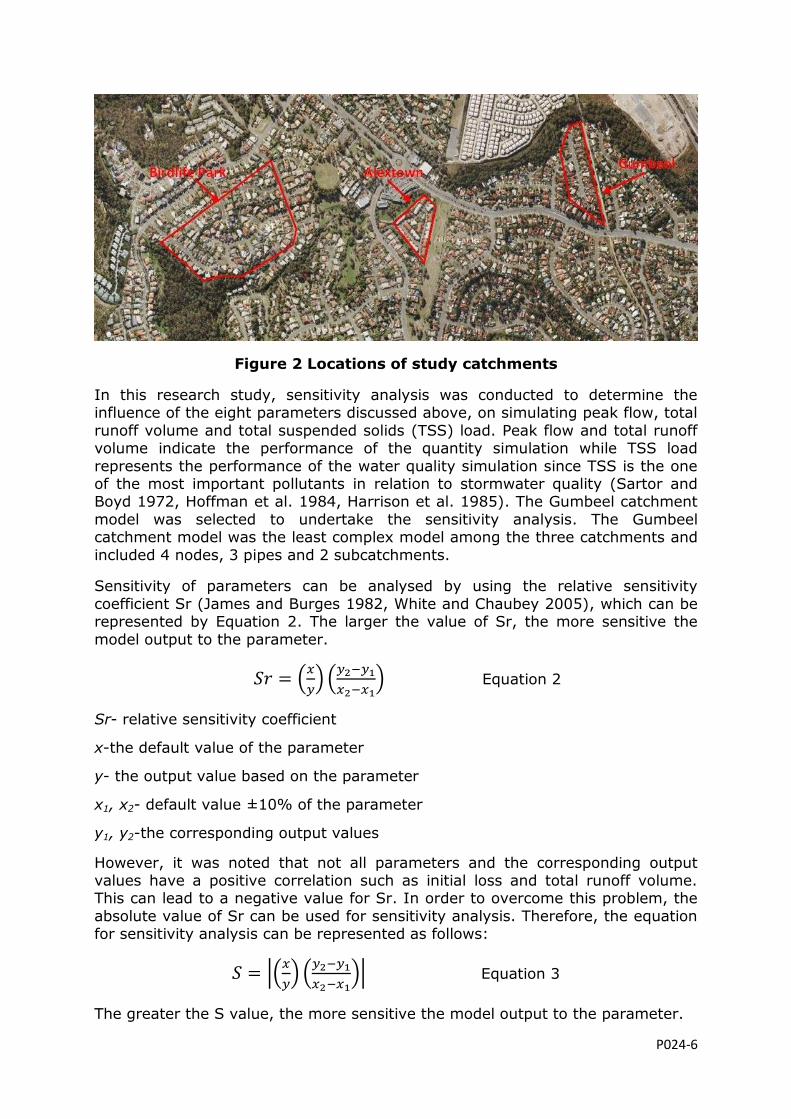
term rainfall-runoff and water quality monitoring data. They are located at Gold Coast, SEQ, Australia. The locations of these three catchments are shown in
Figure 2 below. Birdlife Park catchment (8.5 ha) consists of single detached dwellings while Alextown catchment (1.8 ha) is a tenement townhouse development with roughly 60 properties and Gumbeel catchment (1.2 ha) has 20
dual occupancy residences.
2.4 Sensitivity analysis The sensitivity analysis undertaken aimed to study the variation in the model output resulting from different sources of variation in the model input (Saltelli et
al. 2008). Since a satisfactory modelling practice requires the modellers to provide an evaluation of the confidence in the model predictions, sensitivity
analysis should be a pre-requisite for modelling in any field (Ratto et al. 2001).
P024-6
Figure 2 Locations of study catchments
In this research study, sensitivity analysis was conducted to determine the influence of the eight parameters discussed above, on simulating peak flow, total
runoff volume and total suspended solids (TSS) load. Peak flow and total runoff volume indicate the performance of the quantity simulation while TSS load
represents the performance of the water quality simulation since TSS is the one of the most important pollutants in relation to stormwater quality (Sartor and Boyd 1972, Hoffman et al. 1984, Harrison et al. 1985). The Gumbeel catchment
model was selected to undertake the sensitivity analysis. The Gumbeel catchment model was the least complex model among the three catchments and
included 4 nodes, 3 pipes and 2 subcatchments.
Sensitivity of parameters can be analysed by using the relative sensitivity
coefficient Sr (James and Burges 1982, White and Chaubey 2005), which can be represented by Equation 2. The larger the value of Sr, the more sensitive the
model output to the parameter.
(
) (
) Equation 2
Sr- relative sensitivity coefficient
x-the default value of the parameter
y- the output value based on the parameter
x1, x2- default value ±10% of the parameter
y1, y2-the corresponding output values
However, it was noted that not all parameters and the corresponding output values have a positive correlation such as initial loss and total runoff volume. This can lead to a negative value for Sr. In order to overcome this problem, the
absolute value of Sr can be used for sensitivity analysis. Therefore, the equation for sensitivity analysis can be represented as follows:
|(
) (
)| Equation 3
The greater the S value, the more sensitive the model output to the parameter.
P024-7
2.5 Calibration Model calibration is one of the most important requirements in hydrologic and
water quality modelling. It is undertaken to minimise the differences between simulated results and real world conditions. In the model calibration process,
selecting appropriate parameters for calibration plays a key role. In the research study, the eight parameters discussed above were adjusted during calibration. A trail-and-error approach was used until an acceptable agreement between
observed and simulated results was obtained.
Runoff discharge and TSS concentration recorded at the catchment outlets were applied to compare the goodness-of-fit between observed and simulated values. Two statistical parameters were used to describe the quality of simulation results,
namely, the root mean square error (RMSE) and the coefficient of determination (CD) (Loague and Green 1991). The equations used are given below:
∑ *( )
+ ⁄
Equation 4
∑ ( ̅)
∑ ( ̅)
⁄ Equation 5
S-simulated results
O-observed results
Ō-the average value of the observed results
n-the total number of observations
The RMSE value indicates the extent to which the simulations are overestimating
or underestimating observed values. The smaller the RMSE value, the closer the simulation result is to the observed data. The CD value describes the ratio of the scatter of the simulated values to that of the observed values. The CD value
being close to 1 means that the observed and simulated results match closely.
The rainfall events applied for the calibration of the three catchments are listed in Table 3. These rainfall events were selected based on the availability of recorded runoff discharge and TSS concentrations.
3 Results and discussions
3.1 Build-up parameters from catchments investigation
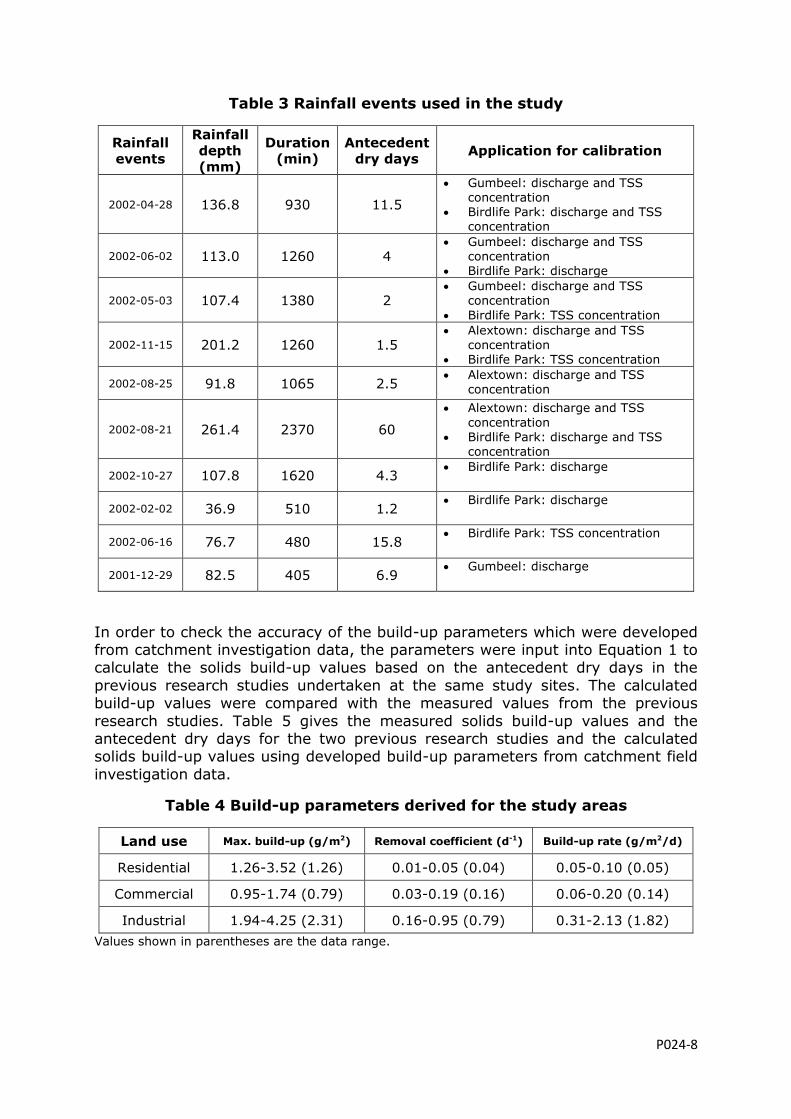
Based on the collection of build-up samples from road surfaces in the three land uses, a series of build-up parameters were developed. Table 4 gives the build-up
parameters derived from the study catchments based on the land use types using the approaches described in Section 2.1.
P024-8
Table 3 Rainfall events used in the study
Rainfall
events
Rainfall
depth
(mm)
Duration
(min)
Antecedent
dry days Application for calibration
2002-04-28 136.8 930 11.5
Gumbeel: discharge and TSS concentration
Birdlife Park: discharge and TSS concentration
2002-06-02 113.0 1260 4 Gumbeel: discharge and TSS
concentration Birdlife Park: discharge
2002-05-03 107.4 1380 2 Gumbeel: discharge and TSS
concentration
Birdlife Park: TSS concentration
2002-11-15 201.2 1260 1.5 Alextown: discharge and TSS
concentration Birdlife Park: TSS concentration
2002-08-25 91.8 1065 2.5 Alextown: discharge and TSS
concentration
2002-08-21 261.4 2370 60
Alextown: discharge and TSS
concentration Birdlife Park: discharge and TSS
concentration
2002-10-27 107.8 1620 4.3 Birdlife Park: discharge
2002-02-02 36.9 510 1.2 Birdlife Park: discharge
2002-06-16 76.7 480 15.8 Birdlife Park: TSS concentration
2001-12-29 82.5 405 6.9 Gumbeel: discharge
In order to check the accuracy of the build-up parameters which were developed from catchment investigation data, the parameters were input into Equation 1 to calculate the solids build-up values based on the antecedent dry days in the
previous research studies undertaken at the same study sites. The calculated build-up values were compared with the measured values from the previous
research studies. Table 5 gives the measured solids build-up values and the antecedent dry days for the two previous research studies and the calculated solids build-up values using developed build-up parameters from catchment field
investigation data.
Table 4 Build-up parameters derived for the study areas
Land use Max. build-up (g/m2) Removal coefficient (d-1) Build-up rate (g/m2/d)
Residential 1.26-3.52 (1.26) 0.01-0.05 (0.04) 0.05-0.10 (0.05)
Commercial 0.95-1.74 (0.79) 0.03-0.19 (0.16) 0.06-0.20 (0.14)
Industrial 1.94-4.25 (2.31) 0.16-0.95 (0.79) 0.31-2.13 (1.82)
Values shown in parentheses are the data range.
P024-9
Table 5 Comparison of observed and predicted build-up values
Data
sources Land use
Antecedent
dry days
Observed build-up
value(g/m2)
Calculated value using developed
parameters (g/m2)
Data from
Herngren
et al.
(2006)
Residential 2 0.82 0.13-0.69
Commercial 1 5.29 0.04-0.19
Industrial 7 2.29 1.32-3.74
Data from
Miguntanna
(2009a)
Residential 8 2.25 0.46-1.24
Commercial 11 4.06 0.40-1.24
Industrial 9 3.44 1.49-3.97
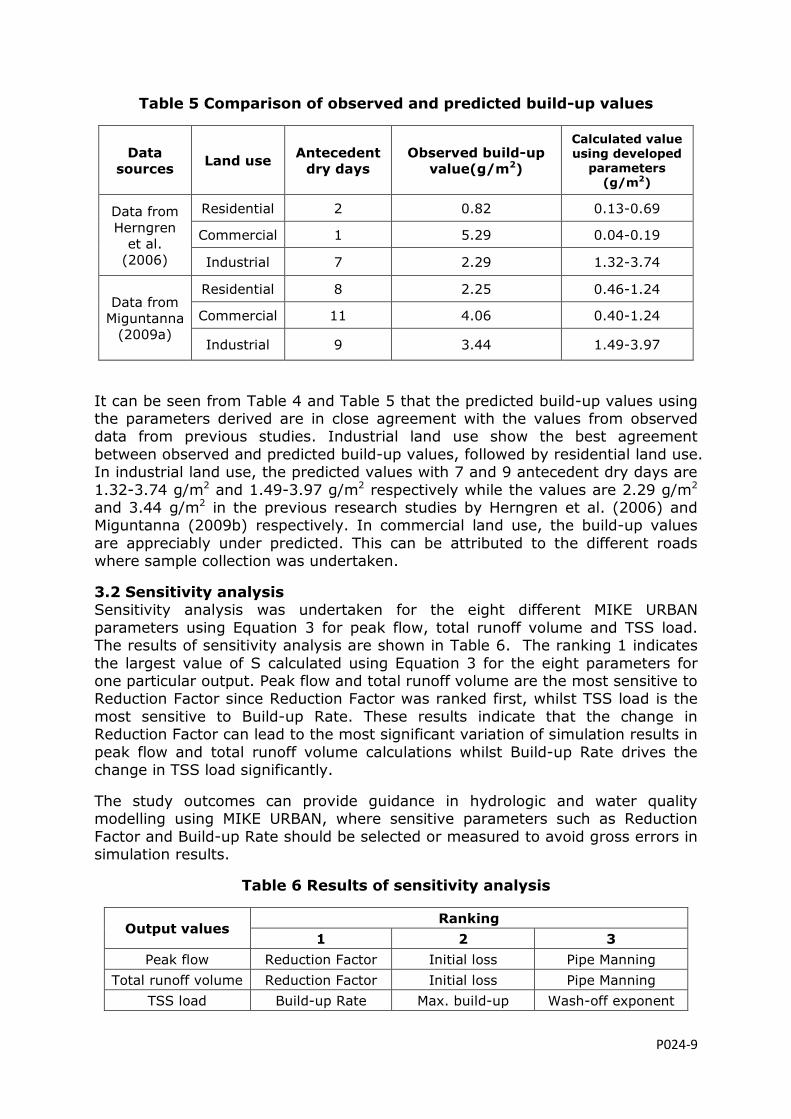
It can be seen from Table 4 and Table 5 that the predicted build-up values using the parameters derived are in close agreement with the values from observed data from previous studies. Industrial land use show the best agreement
between observed and predicted build-up values, followed by residential land use. In industrial land use, the predicted values with 7 and 9 antecedent dry days are
1.32-3.74 g/m2 and 1.49-3.97 g/m2 respectively while the values are 2.29 g/m2 and 3.44 g/m2 in the previous research studies by Herngren et al. (2006) and Miguntanna (2009b) respectively. In commercial land use, the build-up values
are appreciably under predicted. This can be attributed to the different roads where sample collection was undertaken.
3.2 Sensitivity analysis Sensitivity analysis was undertaken for the eight different MIKE URBAN
parameters using Equation 3 for peak flow, total runoff volume and TSS load. The results of sensitivity analysis are shown in Table 6. The ranking 1 indicates
the largest value of S calculated using Equation 3 for the eight parameters for one particular output. Peak flow and total runoff volume are the most sensitive to Reduction Factor since Reduction Factor was ranked first, whilst TSS load is the
most sensitive to Build-up Rate. These results indicate that the change in Reduction Factor can lead to the most significant variation of simulation results in
peak flow and total runoff volume calculations whilst Build-up Rate drives the change in TSS load significantly.
The study outcomes can provide guidance in hydrologic and water quality modelling using MIKE URBAN, where sensitive parameters such as Reduction
Factor and Build-up Rate should be selected or measured to avoid gross errors in simulation results.
Table 6 Results of sensitivity analysis
Output values Ranking
1 2 3
Peak flow Reduction Factor Initial loss Pipe Manning
Total runoff volume Reduction Factor Initial loss Pipe Manning
TSS load Build-up Rate Max. build-up Wash-off exponent
P024-10
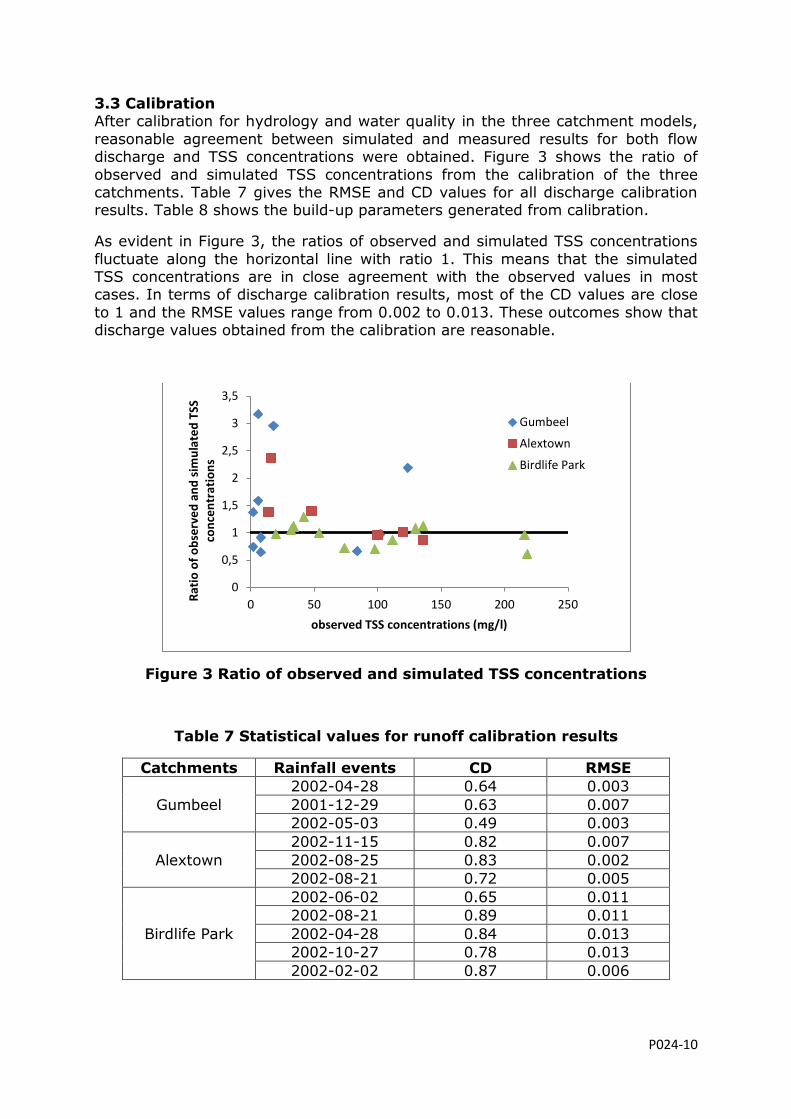
3.3 Calibration After calibration for hydrology and water quality in the three catchment models,
reasonable agreement between simulated and measured results for both flow discharge and TSS concentrations were obtained. Figure 3 shows the ratio of
observed and simulated TSS concentrations from the calibration of the three catchments. Table 7 gives the RMSE and CD values for all discharge calibration results. Table 8 shows the build-up parameters generated from calibration.
As evident in Figure 3, the ratios of observed and simulated TSS concentrations
fluctuate along the horizontal line with ratio 1. This means that the simulated TSS concentrations are in close agreement with the observed values in most cases. In terms of discharge calibration results, most of the CD values are close
to 1 and the RMSE values range from 0.002 to 0.013. These outcomes show that discharge values obtained from the calibration are reasonable.
Figure 3 Ratio of observed and simulated TSS concentrations
Table 7 Statistical values for runoff calibration results
Catchments Rainfall events CD RMSE
Gumbeel
2002-04-28 0.64 0.003
2001-12-29 0.63 0.007
2002-05-03 0.49 0.003
Alextown
2002-11-15 0.82 0.007
2002-08-25 0.83 0.002
2002-08-21 0.72 0.005
Birdlife Park
2002-06-02 0.65 0.011
2002-08-21 0.89 0.011
2002-04-28 0.84 0.013
2002-10-27 0.78 0.013
2002-02-02 0.87 0.006
0
0,5
1
1,5
2
2,5
3
3,5
0 50 100 150 200 250
Rat
io o
f o
bse
rve
d a
nd
sim
ula
ted
TSS
co
nce
ntr
atio
ns
observed TSS concentrations (mg/l)
Gumbeel
Alextown
Birdlife Park
P024-11
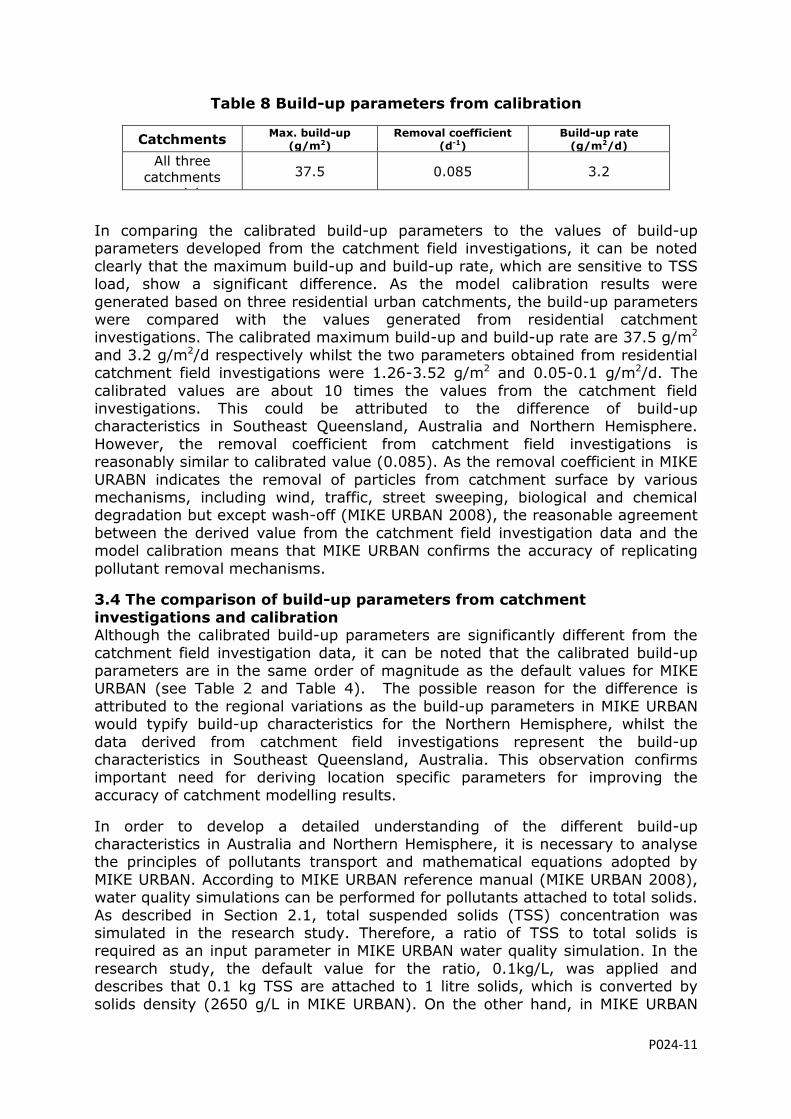
Table 8 Build-up parameters from calibration
Catchments Max. build-up
(g/m2) Removal coefficient
(d-1) Build-up rate
(g/m2/d)
All three
catchments
models
37.5 0.085 3.2
In comparing the calibrated build-up parameters to the values of build-up parameters developed from the catchment field investigations, it can be noted
clearly that the maximum build-up and build-up rate, which are sensitive to TSS load, show a significant difference. As the model calibration results were
generated based on three residential urban catchments, the build-up parameters were compared with the values generated from residential catchment investigations. The calibrated maximum build-up and build-up rate are 37.5 g/m2
and 3.2 g/m2/d respectively whilst the two parameters obtained from residential catchment field investigations were 1.26-3.52 g/m2 and 0.05-0.1 g/m2/d. The
calibrated values are about 10 times the values from the catchment field investigations. This could be attributed to the difference of build-up characteristics in Southeast Queensland, Australia and Northern Hemisphere.
However, the removal coefficient from catchment field investigations is reasonably similar to calibrated value (0.085). As the removal coefficient in MIKE
URABN indicates the removal of particles from catchment surface by various mechanisms, including wind, traffic, street sweeping, biological and chemical degradation but except wash-off (MIKE URBAN 2008), the reasonable agreement
between the derived value from the catchment field investigation data and the model calibration means that MIKE URBAN confirms the accuracy of replicating
pollutant removal mechanisms.
3.4 The comparison of build-up parameters from catchment
investigations and calibration Although the calibrated build-up parameters are significantly different from the
catchment field investigation data, it can be noted that the calibrated build-up parameters are in the same order of magnitude as the default values for MIKE URBAN (see Table 2 and Table 4). The possible reason for the difference is
attributed to the regional variations as the build-up parameters in MIKE URBAN would typify build-up characteristics for the Northern Hemisphere, whilst the
data derived from catchment field investigations represent the build-up characteristics in Southeast Queensland, Australia. This observation confirms important need for deriving location specific parameters for improving the
accuracy of catchment modelling results.
In order to develop a detailed understanding of the different build-up characteristics in Australia and Northern Hemisphere, it is necessary to analyse the principles of pollutants transport and mathematical equations adopted by
MIKE URBAN. According to MIKE URBAN reference manual (MIKE URBAN 2008), water quality simulations can be performed for pollutants attached to total solids.
As described in Section 2.1, total suspended solids (TSS) concentration was simulated in the research study. Therefore, a ratio of TSS to total solids is required as an input parameter in MIKE URBAN water quality simulation. In the
research study, the default value for the ratio, 0.1kg/L, was applied and describes that 0.1 kg TSS are attached to 1 litre solids, which is converted by
solids density (2650 g/L in MIKE URBAN). On the other hand, in MIKE URBAN
P024-12
Surface Runoff Quality (SRQ) module, the build-up parameters are only applicable to the fine solids fraction to determine the mass available for transport
to the catchment outlet (MIKE URBAN 2008). In this context, the percentage of pollutant load attached to the fine solids fraction also needs to be defined. In the
research study, the default percentage, 60%, was taken as the percentage of TSS load attached to the fine solids fraction. Therefore, it can be noted that only a fraction of input solids build-up contributes to the final TSS simulation results.
The equation related to the solids and attached pollutants in MIKE URBAN is as follows:
Equation 6
M- the load of pollutants attached to the fine solids fraction (kg/s)
PL- the ratio of solids and attached pollutants (kg/l)
S- the solids transport of the fine fraction (m3/s)
FL- the percentage of the total pollutant load attached to the fine fraction
Therefore, in the case of the research study, it can be noted that at each time step of the attached pollutant simulation, TSS load transported to the catchment
outlet accounts for 6% (0.1 kg/l ×60%) of all input solids as build-up on catchment surfaces. However, it is noteworthy that in Table 1, the total solids build-up from the catchment field investigation, the average percentage of TSS
on all solids loads is around 80%. A significant difference (around 10 times) between build-up parameters from catchment field investigations and calibration
study was noted. This would imply that there are significantly different pollutants build-up characteristics in SEQ, Australia and the Northern Hemisphere, thus resulting in different parameters values. In SEQ, Australia, TSS accounts for an
overwhelming percentage in all accumulated solids on road surfaces while in Northern Hemisphere, the percentage of TSS in all accumulated solids appears to
be relatively small. The build-up parameters definition in MIKE URBAN describes the solids with a small percentage of TSS whilst the catchment field investigations undertaken in SEQ, Australia shows the solids contain a relatively
very high percentage of TSS.
The study outcomes can provide guidance in the application of MIKE URBAN in SEQ, Australia. In terms of water quality simulation, the input parameters related to build-up would need a corresponding conversion. The conversion is
strongly correlated to the ratio of solids and attached pollutants, the percentage of the total pollutant load attached to the fine solids fraction and the percentage
of the attached pollutants on solids build-up. It is proposed that the conversion can be represented as follows:
Equation 7
BUm- the input parameters related to build-up in modelling (g/m2)
BUc- the build-up parameters from catchment investigation (g/m2)
PPc- the percentage of attached pollutant on all solids build-up from catchment
investigation
P024-13
According to the results of the sensitivity analysis, build-up parameters are the most sensitive in water quality modelling results. Therefore, the estimation of
build-up parameters is critical to ensure the accuracy of water quality modelling results. The conversion equation supplies an approach to estimate the input
parameters related to build-up parameters for MIKE URBAN based on field investigation data. Although the conversion equation was developed based on catchments in SEQ, Australia, it provides general guidance for MIKE URBAN
modellers to estimate input parameters from catchment field investigation data for other regions, particularly in the case of catchments where monitoring data is
not available. Use of field investigation data along with the definition of input parameters in modelling software can be an approach to estimate the values of required input parameters.
4 Conclusions This paper compared pollutant build-up parameters generated from catchment
field investigations and MIKE URBAN model calibration for a number of catchments in Southeast Queensland, Australia. Additionally, the sensitivity of MIKE URBAN input parameters in hydrologic and water quality simulations was
undertaken. From the research study undertaken, the following conclusions were derived:
Among the MIKE URBAN input parameters, Reduction Factor is the most sensitive parameter for peak flow and total runoff volume estimation, whilst
Build-up rate is the most sensitive parameter for TSS load estimation. Therefore, these input parameters should be selected carefully or measured
accurately for hydrologic and water quality simulations using MIKE URBAN. A methodology in which catchment field investigation data is applied as input
parameters to MIKE URBAN water quality modelling was developed and an
empirical equation for Southeast Queensland, Australia for converting catchment field investigation build-up data for input as MIKE URBAN build-up
parameters was derived. This provides guidance for modelling catchments where monitoring data are not available.
It was found that the input parameters in Southeast Queensland, Australia
are significantly different to the default values in MIKE URBAN, which may not necessarily represent the local characteristics. Therefore, the input
parameters should be selected carefully based on the region characteristics.
References Ahyerre, M., Chebbo, G., Tassin, B. and Gaume, E. (1998). Storm water quality modelling, an
ambitious objective? Water Science and Technology, 37, 205-213. Artina, S., Bolognesi, A., Liserra, T. and Maglionico, M. (2007). Simulation of a storm sewer
network in industrial area: comparison between models calibrated through experimental data. Environmental Modelling & Software, 22, 1221-1228.
Baffaut, C. and Delleur, J. W. (1990). Calibration of SWMM runoff quality model with expert
system. Journal of Water Resources Planning and Management, 116, 247-261. Beven, K. J. (2001). Rainfall-runoff modelling: the primer, John Wiley & Sons Ltd.
P024-14
FitzHugh, T. W. and Mackay, D. S. (2000). Impacts of input parameter spatial aggregation on an agricultural nonpoint source pollution model. Journal of Hydrology, 236, 35-53.
Harrison, R. M., Johnston, W. R., Ralph, J. C. and Wilson, S. J. (1985). The budget of lead,
copper and cadmium for a major highway. Science Total Environment, 46, 137-145. Henriksen, H. J., Troldborg, L., Nyegaard, P., Sonnenborg, T. O., Refsgaard, J. C. and Madsen,
B. (2003). Methodology for construction, calibration and validation of a national hydrological model for Denmark. Journal of Hydrology, 280, 52-71.
Herngren, L., Goonetilleke, A. and Ayoko, G. A. (2006). Analysis of heavy metals in road-
deposited sediments. Analytica. Chimica Acta, 571, 270-278. Hoffman, E. J., Mills, G. L., Latimer, J. S. and Quinn, J. G. (1984). Urban runoff as a source of
polycyclic aromatic hydrocarbons to coastal waters. Environmental Science and Technology, 18, 580-587.
Huber, C. W. (1986). Deterministic modelling of urban runoff quality, Berlin, Springler-Verlag. James, L. and Burges, S. (1982). Selection, calibration, and testing of hydrologic models.
Hydrologic modeling of small watersheds, 437-472. Loague, K. M. and Green, R. E. (1991). Statiscal and graphical methods for evaluating solute
transport models. Journal of Contaminant Hydrology, 7, 51-73. Miguntanna, N. (2009a). Nutrients build-up and wash-off processes in urban land uses. PhD,
Queensland University of Technology. Miguntanna, N. S. (2009b). Determining a set of surrogate parameters to evaluate urban
stormwater quality. Master, Queensland University of Technology MikeUrban (2008). Mike Urban Model User Manual, Danish Hydraulic Institute Ratto, M., Tarantola, S. and Saltelli, A. (2001). Sensitivity analysis in model calibration: GSA-
GLUE approach. Computer Physics Communications, 136, 212-224. Saltelli, A., Ratto, M., Andres, T., Campolongo, F., Cariboni, J., Gatelli, D., Saisana, M. and
Tarantola, S. (2008). Global sensitivity analysis: The Primer, John Wiley & Sons Ltd. Sartor, J. D. and Boyd, G. B. (1972). Water pollution aspects of street surface contaminant.
Washington, DC: United States Environmental Protection Agency. Schueler, T. R., Cumble, P. A. and Heraty, M. A. (1991). Current assessment of urban best
management practices: Techniques for reducing non-point source pollution in the coastal zones (Review Draft). Washington, D.C: Metropolitan Washington Council of Governments.
Shaw, E. M. (1983). Hydrology in Practice, London, Chapman & Hall. Thorndahl, S., Beven, K. J., Jensen, J. B. and Schaarup-Jensen, K. (2008). Event based
uncertainty assessment in urban drainage modelling, applying the GLUE methodology. Journal of Hydrology, 357, 421-437.
P024-15
Thorndahl, S. and Schaarup-Jensen, K. (2008). Comparative analysis of uncertainties in urban surface runoff modelling. In: the 6th International Conference on Sustainable Techniques and Strategies in Urban Water Management Lyon, France.
Tsihrintzis, V. A. and Hamid, R. (1997). Modelling and management of urban stormwater
runoff quality: A review. Water Resources Management, 11, 137-164. Urbonas, B. (2000). Assessment of stormwater best management practice effectiveness
(Chapter 7), Economic publishing Co, Inc. Vaze, J. and Chiew, F. H. S. (2002). Experimental study of pollutant accumulation on an urban
road surface. Urban Water, 4, 379-389. White, K. L. and Chaubey, I. (2005). Sensitivity analysis, calibration and validations for a
multisite and multivariable SWAT model. Journal of the American Water Resources Association, 41, 1077-1089.
Zoppou, C. (2001). Review of urban storm water models. Environmental Modelling &
Software, 16, 195-231.