Embed Size (px)
Citation preview
RESEARCH ARTICLE Open Access
Development of polymorphic microsatellitemarkers by using de novo transcriptomeassembly of Calanthe masuca and C. sinica(Orchidaceae)Chao Hu1,2,3, Hongxing Yang1,2, Kai Jiang1,2, Ling Wang1,2, Boyun Yang4, Tungyu Hsieh1,2,5, Siren Lan6*
and Weichang Huang1,2,6*
Abstract
Background: Calanthe masuca and C. sinica are two genetically closely related species in Orchidaceae. C. masuca iswidely distributed in Asia, whereas C. sinica is restricted to Yunnan and Guangxi Provinces in southwest China. Bothplay important roles in horticulture and are under the pressure of population decline. Understanding their geneticbackground can greatly help us develop effective conservation strategies for these species. Simple sequencerepeats (SSRs) are useful for genetic diversity analysis, presumably providing key information for the study andpreservation of the wild populations of the two species we are interested in.
Results: In this study, we performed RNA-seq analysis on the leaves of C. masuca and C. sinica, obtaining 40,916 and71,618 unigenes for each species, respectively. In total, 2,019/3,865 primer pairs were successfully designed from 3,764/7,189 putative SSRs, among which 197 polymorphic SSRs were screened out according to orthologous gene pairs.After mononucleotide exclusion, a subset of 129 SSR primers were analysed, and 13 of them were found to have highpolymorphism levels. Further analysis demonstrated that they were feasible and effective against C. masucaand C. sinica as well as transferable to another species in Calanthe. Molecular evolutionary analysis revealedfunctional pathways commonly enriched in unigenes with similar evolutionary rates in the two species, as well aspathways specific to each species, implicating species-specific adaptation. The divergence time between the twoclosely related species was tentatively determined to be 3.42 ± 1.86 Mya.
Conclusions: We completed and analysed the transcriptomes of C. masuca and C. sinica, assembling large numbers ofunigenes and generating effective polymorphic SSR markers. This is the first report of the development of expressedsequence tag (EST)-SSR markers for Calanthe. In addition, our study could enable further genetic diversity analysis andfunctional and comparative genomic studies on Calanthe.
Keywords: Polymorphic microsatellite, Next-generation sequencing, Population genetics, Divergence time
* Correspondence: [email protected]; [email protected] of Landscape, Fujian Agriculture and Forestry University, Fuzhou350002, China1Shanghai Key Laboratory of Plant Functional Genomics and Resources,Shanghai Chenshan Botanical Garden, Shanghai 201602, ChinaFull list of author information is available at the end of the article
© The Author(s). 2018 Open Access This article is distributed under the terms of the Creative Commons Attribution 4.0International License (http://creativecommons.org/licenses/by/4.0/), which permits unrestricted use, distribution, andreproduction in any medium, provided you give appropriate credit to the original author(s) and the source, provide a link tothe Creative Commons license, and indicate if changes were made. The Creative Commons Public Domain Dedication waiver(http://creativecommons.org/publicdomain/zero/1.0/) applies to the data made available in this article, unless otherwise stated.
Hu et al. BMC Genomics (2018) 19:800 https://doi.org/10.1186/s12864-018-5161-4
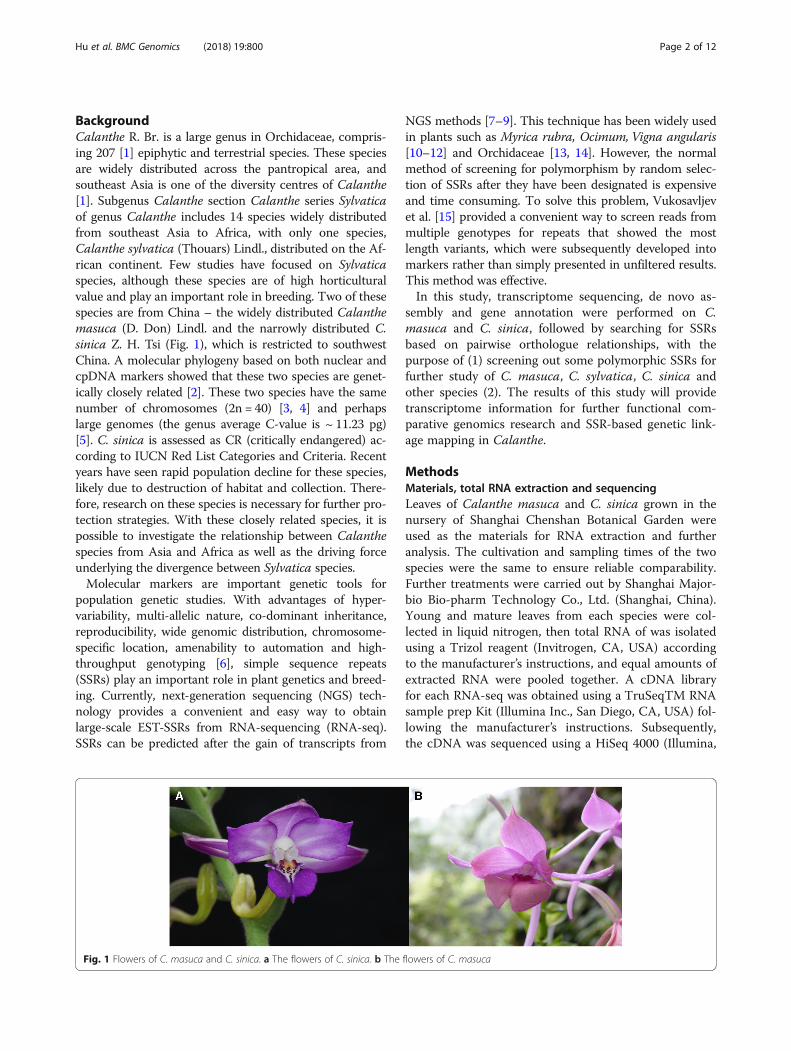
BackgroundCalanthe R. Br. is a large genus in Orchidaceae, compris-ing 207 [1] epiphytic and terrestrial species. These speciesare widely distributed across the pantropical area, andsoutheast Asia is one of the diversity centres of Calanthe[1]. Subgenus Calanthe section Calanthe series Sylvaticaof genus Calanthe includes 14 species widely distributedfrom southeast Asia to Africa, with only one species,Calanthe sylvatica (Thouars) Lindl., distributed on the Af-rican continent. Few studies have focused on Sylvaticaspecies, although these species are of high horticulturalvalue and play an important role in breeding. Two of thesespecies are from China – the widely distributed Calanthemasuca (D. Don) Lindl. and the narrowly distributed C.sinica Z. H. Tsi (Fig. 1), which is restricted to southwestChina. A molecular phylogeny based on both nuclear andcpDNA markers showed that these two species are genet-ically closely related [2]. These two species have the samenumber of chromosomes (2n = 40) [3, 4] and perhapslarge genomes (the genus average C-value is ~ 11.23 pg)[5]. C. sinica is assessed as CR (critically endangered) ac-cording to IUCN Red List Categories and Criteria. Recentyears have seen rapid population decline for these species,likely due to destruction of habitat and collection. There-fore, research on these species is necessary for further pro-tection strategies. With these closely related species, it ispossible to investigate the relationship between Calanthespecies from Asia and Africa as well as the driving forceunderlying the divergence between Sylvatica species.Molecular markers are important genetic tools for
population genetic studies. With advantages of hyper-variability, multi-allelic nature, co-dominant inheritance,reproducibility, wide genomic distribution, chromosome-specific location, amenability to automation and high-throughput genotyping [6], simple sequence repeats(SSRs) play an important role in plant genetics and breed-ing. Currently, next-generation sequencing (NGS) tech-nology provides a convenient and easy way to obtainlarge-scale EST-SSRs from RNA-sequencing (RNA-seq).SSRs can be predicted after the gain of transcripts from
NGS methods [7–9]. This technique has been widely usedin plants such as Myrica rubra, Ocimum, Vigna angularis[10–12] and Orchidaceae [13, 14]. However, the normalmethod of screening for polymorphism by random selec-tion of SSRs after they have been designated is expensiveand time consuming. To solve this problem, Vukosavljevet al. [15] provided a convenient way to screen reads frommultiple genotypes for repeats that showed the mostlength variants, which were subsequently developed intomarkers rather than simply presented in unfiltered results.This method was effective.In this study, transcriptome sequencing, de novo as-
sembly and gene annotation were performed on C.masuca and C. sinica, followed by searching for SSRsbased on pairwise orthologue relationships, with thepurpose of (1) screening out some polymorphic SSRs forfurther study of C. masuca, C. sylvatica, C. sinica andother species (2). The results of this study will providetranscriptome information for further functional com-parative genomics research and SSR-based genetic link-age mapping in Calanthe.
MethodsMaterials, total RNA extraction and sequencingLeaves of Calanthe masuca and C. sinica grown in thenursery of Shanghai Chenshan Botanical Garden wereused as the materials for RNA extraction and furtheranalysis. The cultivation and sampling times of the twospecies were the same to ensure reliable comparability.Further treatments were carried out by Shanghai Major-bio Bio-pharm Technology Co., Ltd. (Shanghai, China).Young and mature leaves from each species were col-lected in liquid nitrogen, then total RNA of was isolatedusing a Trizol reagent (Invitrogen, CA, USA) accordingto the manufacturer’s instructions, and equal amounts ofextracted RNA were pooled together. A cDNA libraryfor each RNA-seq was obtained using a TruSeqTM RNAsample prep Kit (Illumina Inc., San Diego, CA, USA) fol-lowing the manufacturer’s instructions. Subsequently,the cDNA was sequenced using a HiSeq 4000 (Illumina,
Fig. 1 Flowers of C. masuca and C. sinica. a The flowers of C. sinica. b The flowers of C. masuca
Hu et al. BMC Genomics (2018) 19:800 Page 2 of 12
San Diego, CA, USA) to obtain sequences of ~ 150 bpfrom both ends of each cDNA.
Illumina sequencing, data filtering, de novo assembly andunigene annotationRaw reads generated by the Illumina HiSeq platform(submitted to the NCBI database under accessionsSRR5478842 and SRR5478843) were first processed toobtain clean reads by trimming off adaptor-ligated re-gions and low-quality bases (Q < 20) using SeqPrep [16]and Sickle [17]. De novo transcriptome assembly wasperformed based on cleaned and qualified reads usingthe short-read assembly program Trinity [18] with de-fault parameters. The longest transcripts were defined asunigenes. Putative unigenes were compared against theNCBI protein non-redundant (NR) protein database andthe Swiss-Prot, Pfam and KEGG databases with anE-value cut-off of 1E-5 using BLASTx (BLAST + 2.2.25package) [19]. Gene ontology (GO) annotations describ-ing biological processes, molecular functions and cellularcomponents for each unigene were obtained by carryingout the program Blast2GO v.2.6.0 [20]. Kobas [21] wasrecruited to perform the KEGG metabolic pathwayannotation.
Orthologous gene identification and evolutionary ratecalculationOrthologous gene pairs between Calanthe masuca andC. sinica used for primer screening were identified bythe method of reciprocal best hits (RBH) based on theresults of the Basic Local Alignment Search Tool(BLAST) [22–25]. As the two species were phylogenetic-ally closely related, nucleotide sequences instead of pep-tide sequences of the unigenes were used to run aBLAST search to improve accuracy. A python script wasdeveloped to retrieve the RBH from the results of recip-rocal BLASTn (BLAST+ v 2.2.25 package), for which thecutoff was set as e-value = 1E-5.Orthologous gene groups were defined using the pro-
gram Inparanoid with default settings (version 4.1; [26]).Phalaenopsis equestris (Schauer) Rchb. f. was used as theoutgroup species [27]. The rate of non-synonymous sub-stitutions per non-synonymous substitution site (Ka),the rate of synonymous substitutions per synonymoussubstitution site (Ks), and the ratio of non-synonymousto synonymous substitution rates (Ka/Ks) for eachorthologous gene pair between C. masuca and C. sinicawere calculated using the method ‘GMYN’ implementedin the toolbox KaKs_Calculator (version 2.0; [28]). Tocalculate the Ka and Ks values, the peptide sequences ofeach pair of orthologous genes were first aligned usingthe program MAFFT [29] with default settings and werethen back-translated into nucleotide sequence alignmentusing the program PAL2NAL [30].
GO enrichment analysisGO enrichment analysis was performed using the Rpackage topGO [31], with Fisher’s exact test as themethod of enrichment evaluation, all unigenes with GOannotation as the whole list of background genes, andother parameters as default.
EST-SSR markers validationThe software Msatcommander [7] was run on the as-sembled transcript sequences to find SSR sites and gen-erate primers. The unigenes of two transcriptomes wereused to run Msatcommander with primer sets subse-quently designed automatically. SSR loci with variationsbetween two species were then screened out in twosteps. First, sequence pairs containing SSRs were ex-tracted from the Msatcommander results based onone-to-one correspondence by RBH search. Second, se-quences containing the same SSR type (including reversecomplement repeat sequences) but with different repeatnumbers were selected by comparing the information ofmicrosatellite repeats for each pair of orthologs. Theprimers for mononucleotide SSRs were then excluded.We only took the primer list of C. masuca as a result byconsidering that primers identified from two ortholo-gous unigenes will yield the same product.
Development and evaluation of EST-SSR markersGenomic DNA was isolated from silica-gel-dried leavesusing the DNAsecure Plant kit (TIANGEN Inc. Beijing,China) following the manufacturer’s protocol and storedin TE buffer (pH = 8.0). DNA purity and concentrationwere measured with a NanoDrop 2000c UV-Vis spectro-photometer (Thermo Fisher Scientific Inc., USA). DNAwas adjusted to a final concentration of 30 ng/ml andstored at − 20 °C until use.The primers of the selected SSR alleles were synthesized
and amplified, and an M13 (− 21) sequence was added tothe forward primers of these primers. An additional pri-mer labelled with fluorescent dye (5′FAM, 5′HEX, or 5′ROX), M13 (− 21), was also synthesized. All primers weresynthesized by Sangon Biological Engineering Technology& Service Co. (Shanghai, China). Amplification was car-ried out in a Thermocycler Mastercycler Gradient (Eppen-dorf, Germany) using a 20 μl reaction system containing10 μl of 2× Taq PCR Master Mix (TIANGEN Inc. Beijing,China), 8 μl of ddH2O, 0.2 μl of forward primer (10 μM),0.4 μl of reverse primer (10 μM) and 0.4 μl of fluorescentdye-labelled M13 primer (10 μM), and 1 μl of target DNAtemplate (0.5 ng/μl). First, PCR was performed for everypair of primers to determine the optimal annealingtemperature following Schuelke [32]: 5 min denaturationat 94 °C; 30 cycles of 30 s at 94 °C, 45 s at 53–65 °C, and45 s at 72 °C; 8 cycles of 30 s at 94 °C, 45 s at 53 °C, and45 s at 72 °C; a final 10 min extension at 72 °C; and 4 °C
Hu et al. BMC Genomics (2018) 19:800 Page 3 of 12
hold for storage. After determining the optimal annealingtemperature of each primer, amplification was performed.The PCR products were mixed according to the differ-
ent fluorescence colour (6-FAM:HEX:ROX = 1:1:1) andthen analysed on an ABI 3730 with internal size standardGS500 (GeneScanTM, Applied Biosystems, USA). Allelebinning and calling were conducted using Software Gene-Marker® V2.2.0 (SoftGenetics, USA). The number of al-leles (Na), observed heterozygosity (Ho), gene diversity(expected heterozygosity; He), and polymorphism infor-mation content (PIC) for each of the EST-SSR markerswere calculated using Cervus software [33].Before screening for polymorphisms of SSR primers in
multiple individuals, all selected primers were first amp-lified using a single sample, JX1 (C. masuca), and onlywell-amplified SSR primers were used for further testing.Then, we selected eight individuals from each popula-tion collected from Yunnan, Jiangxi, Napo, and Guangxiin China (Additional file 1) for polymorphic analysis. Fi-nally, we chose primers with high PIC values to amplify72 other individuals (24 from Jiangxi, 2 from Napo, 11from Yunnan, 15 from Taiwan and 20 from JinxiuGuangxi). In total, 96 accessions from five populationsof three species were used for genetic diversity analysis,including three Calanthe masuca populations (JX,GXJX, TW), one C. sinica population (GXNP) and oneC. triplicata population (YN) (Additional file 1).
Universality evaluation of SSR primersThe universality of the developed SSR primers inCalanthe was calculated by in silico PCR. The SSRprimers of C. masuca and C. sinica were searchedagainst the unigenes of each other and against the gen-ome sequences of P. equestris [27] and Dendrobiumcatenatum Lindl. [34]. e-PCR [35] version 2.3.9 was car-ried out with the SSR primers as queries and the uni-genes as databases with no mismatch allowed.
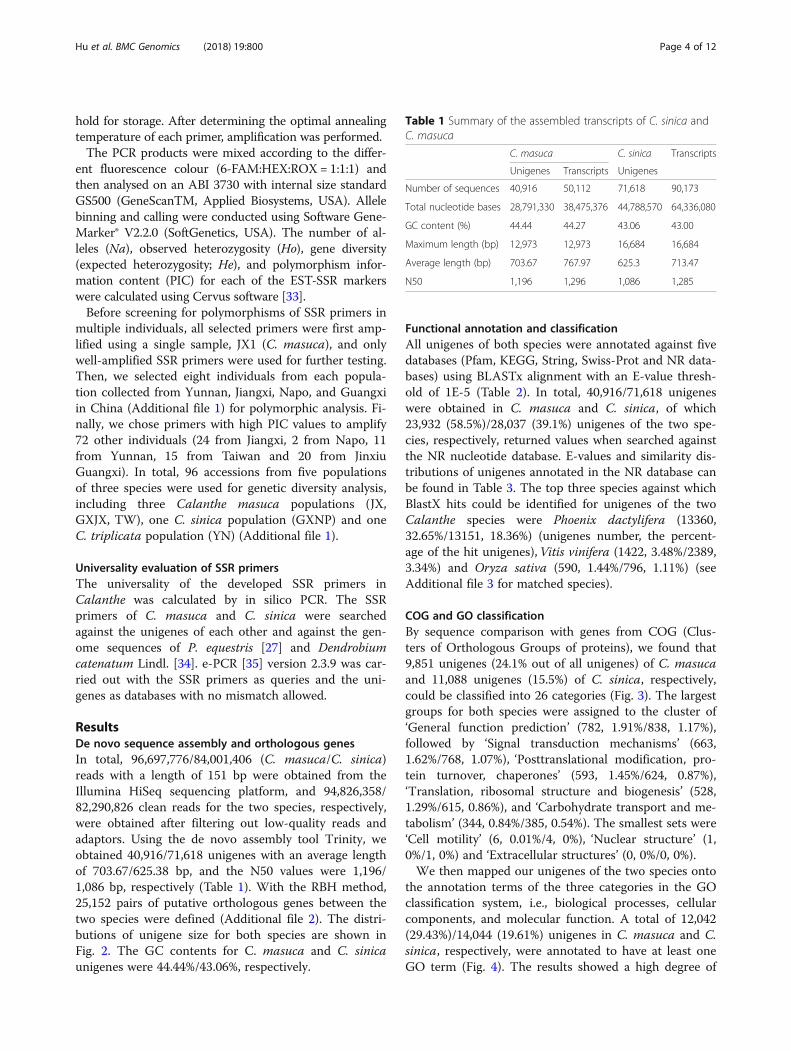
ResultsDe novo sequence assembly and orthologous genesIn total, 96,697,776/84,001,406 (C. masuca/C. sinica)reads with a length of 151 bp were obtained from theIllumina HiSeq sequencing platform, and 94,826,358/82,290,826 clean reads for the two species, respectively,were obtained after filtering out low-quality reads andadaptors. Using the de novo assembly tool Trinity, weobtained 40,916/71,618 unigenes with an average lengthof 703.67/625.38 bp, and the N50 values were 1,196/1,086 bp, respectively (Table 1). With the RBH method,25,152 pairs of putative orthologous genes between thetwo species were defined (Additional file 2). The distri-butions of unigene size for both species are shown inFig. 2. The GC contents for C. masuca and C. sinicaunigenes were 44.44%/43.06%, respectively.
Functional annotation and classificationAll unigenes of both species were annotated against fivedatabases (Pfam, KEGG, String, Swiss-Prot and NR data-bases) using BLASTx alignment with an E-value thresh-old of 1E-5 (Table 2). In total, 40,916/71,618 unigeneswere obtained in C. masuca and C. sinica, of which23,932 (58.5%)/28,037 (39.1%) unigenes of the two spe-cies, respectively, returned values when searched againstthe NR nucleotide database. E-values and similarity dis-tributions of unigenes annotated in the NR database canbe found in Table 3. The top three species against whichBlastX hits could be identified for unigenes of the twoCalanthe species were Phoenix dactylifera (13360,32.65%/13151, 18.36%) (unigenes number, the percent-age of the hit unigenes),Vitis vinifera (1422, 3.48%/2389,3.34%) and Oryza sativa (590, 1.44%/796, 1.11%) (seeAdditional file 3 for matched species).
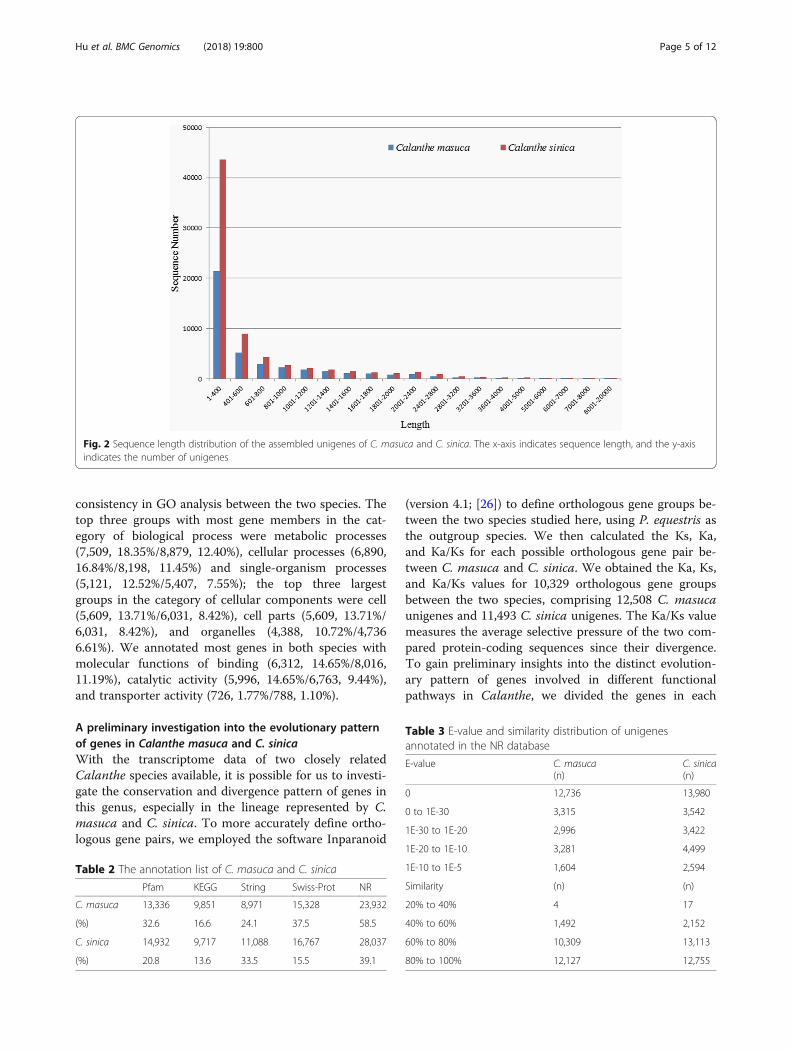
COG and GO classificationBy sequence comparison with genes from COG (Clus-ters of Orthologous Groups of proteins), we found that9,851 unigenes (24.1% out of all unigenes) of C. masucaand 11,088 unigenes (15.5%) of C. sinica, respectively,could be classified into 26 categories (Fig. 3). The largestgroups for both species were assigned to the cluster of‘General function prediction’ (782, 1.91%/838, 1.17%),followed by ‘Signal transduction mechanisms’ (663,1.62%/768, 1.07%), ‘Posttranslational modification, pro-tein turnover, chaperones’ (593, 1.45%/624, 0.87%),‘Translation, ribosomal structure and biogenesis’ (528,1.29%/615, 0.86%), and ‘Carbohydrate transport and me-tabolism’ (344, 0.84%/385, 0.54%). The smallest sets were‘Cell motility’ (6, 0.01%/4, 0%), ‘Nuclear structure’ (1,0%/1, 0%) and ‘Extracellular structures’ (0, 0%/0, 0%).We then mapped our unigenes of the two species onto
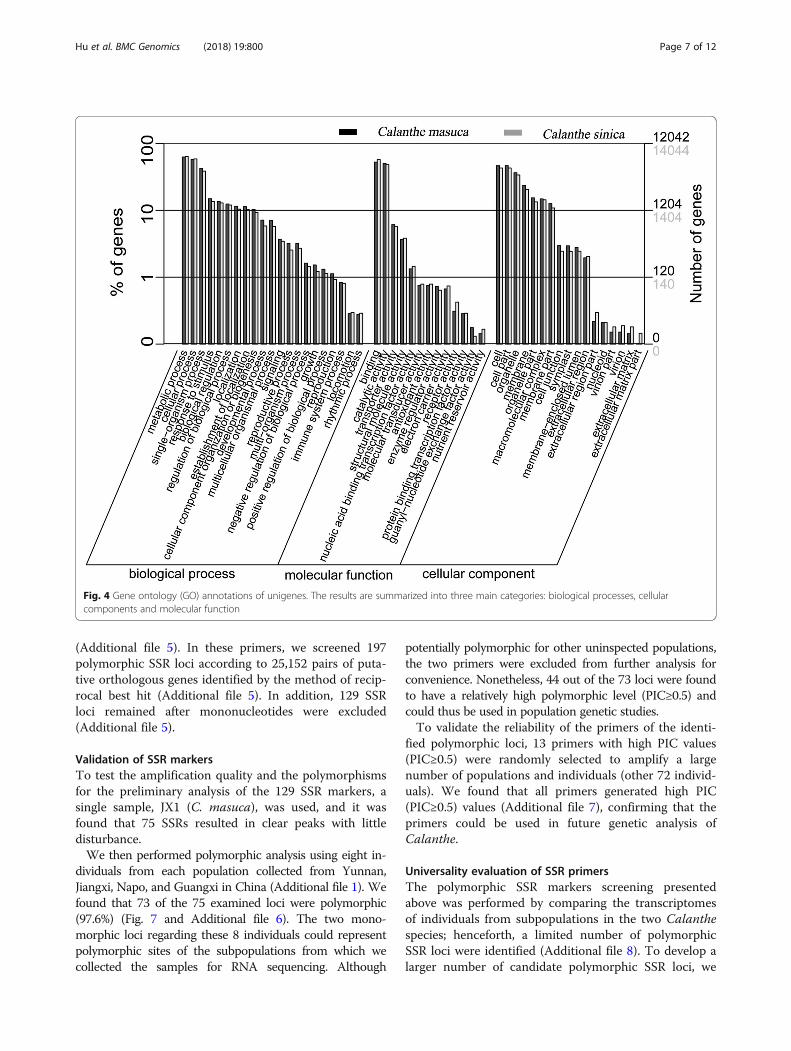
the annotation terms of the three categories in the GOclassification system, i.e., biological processes, cellularcomponents, and molecular function. A total of 12,042(29.43%)/14,044 (19.61%) unigenes in C. masuca and C.sinica, respectively, were annotated to have at least oneGO term (Fig. 4). The results showed a high degree of
Table 1 Summary of the assembled transcripts of C. sinica andC. masuca
C. masuca C. sinica Transcripts
Unigenes Transcripts Unigenes
Number of sequences 40,916 50,112 71,618 90,173
Total nucleotide bases 28,791,330 38,475,376 44,788,570 64,336,080
GC content (%) 44.44 44.27 43.06 43.00
Maximum length (bp) 12,973 12,973 16,684 16,684
Average length (bp) 703.67 767.97 625.3 713.47
N50 1,196 1,296 1,086 1,285
Hu et al. BMC Genomics (2018) 19:800 Page 4 of 12
consistency in GO analysis between the two species. Thetop three groups with most gene members in the cat-egory of biological process were metabolic processes(7,509, 18.35%/8,879, 12.40%), cellular processes (6,890,16.84%/8,198, 11.45%) and single-organism processes(5,121, 12.52%/5,407, 7.55%); the top three largestgroups in the category of cellular components were cell(5,609, 13.71%/6,031, 8.42%), cell parts (5,609, 13.71%/6,031, 8.42%), and organelles (4,388, 10.72%/4,7366.61%). We annotated most genes in both species withmolecular functions of binding (6,312, 14.65%/8,016,11.19%), catalytic activity (5,996, 14.65%/6,763, 9.44%),and transporter activity (726, 1.77%/788, 1.10%).
A preliminary investigation into the evolutionary patternof genes in Calanthe masuca and C. sinicaWith the transcriptome data of two closely relatedCalanthe species available, it is possible for us to investi-gate the conservation and divergence pattern of genes inthis genus, especially in the lineage represented by C.masuca and C. sinica. To more accurately define ortho-logous gene pairs, we employed the software Inparanoid
(version 4.1; [26]) to define orthologous gene groups be-tween the two species studied here, using P. equestris asthe outgroup species. We then calculated the Ks, Ka,and Ka/Ks for each possible orthologous gene pair be-tween C. masuca and C. sinica. We obtained the Ka, Ks,and Ka/Ks values for 10,329 orthologous gene groupsbetween the two species, comprising 12,508 C. masucaunigenes and 11,493 C. sinica unigenes. The Ka/Ks valuemeasures the average selective pressure of the two com-pared protein-coding sequences since their divergence.To gain preliminary insights into the distinct evolution-ary pattern of genes involved in different functionalpathways in Calanthe, we divided the genes in each
Fig. 2 Sequence length distribution of the assembled unigenes of C. masuca and C. sinica. The x-axis indicates sequence length, and the y-axisindicates the number of unigenes
Table 2 The annotation list of C. masuca and C. sinica
Pfam KEGG String Swiss-Prot NR
C. masuca 13,336 9,851 8,971 15,328 23,932
(%) 32.6 16.6 24.1 37.5 58.5
C. sinica 14,932 9,717 11,088 16,767 28,037
(%) 20.8 13.6 33.5 15.5 39.1
Table 3 E-value and similarity distribution of unigenesannotated in the NR database
E-value C. masuca(n)
C. sinica(n)
0 12,736 13,980
0 to 1E-30 3,315 3,542
1E-30 to 1E-20 2,996 3,422
1E-20 to 1E-10 3,281 4,499
1E-10 to 1E-5 1,604 2,594
Similarity (n) (n)
20% to 40% 4 17
40% to 60% 1,492 2,152
60% to 80% 10,309 13,113
80% to 100% 12,127 12,755
Hu et al. BMC Genomics (2018) 19:800 Page 5 of 12
species into 5 different groups according to their Ka/Ksvalues, namely, the group with strong purifying selection(Ka/Ks ≤ 0.5, abbreviated as SP), the group with inter-mediately purifying selection (0.5 < Ka/Ks ≤ 0.9, IP), thegroup with relaxed or nearly relaxed selection (0.9 < Ka/Ks ≤ 1.1, R), the group with intermediately positive orDarwinian selection (1.1 < Ka/Ks ≤ 1.5, ID), and thegroup with strong Darwinian selection (Ka/Ks > 1.5, SD).The top enriched GO terms in each corresponding
group were quite consistent between the two species(Additional file 4). For example, in the SP group of genesin both species, the biological process ‘oxidation-reduc-tion process’ (GO: 0055114) stood out as the mostenriched GO term, with 348 and 332 associated uni-genes in C. masuca and C. sinica, respectively. Similarly,‘folic acid-containing compound biosynthetic process’and ‘phosphate ion transport’ were among the top 3enriched GO terms in the IP group in both species. Asystematic comparison demonstrated that, in most cases,the shared enriched GO terms between correspondinggene groups of the two species outnumbered GO termsspecifically enriched in each species (Table 4), which fur-ther validated the assembly and annotation of ourRNA-seq data. Notably, the biological process ‘aldehydebiosynthetic process’ (GO: 0046184) was among the topthree enriched GO terms in both species, implyingfast-evolving indirect plant defence-responsive factorsthat could help Calanthe species adapt to local environ-ments [36].To understand the above evolutionary pattern in a real
time-scale of species evolution, we set to estimate the
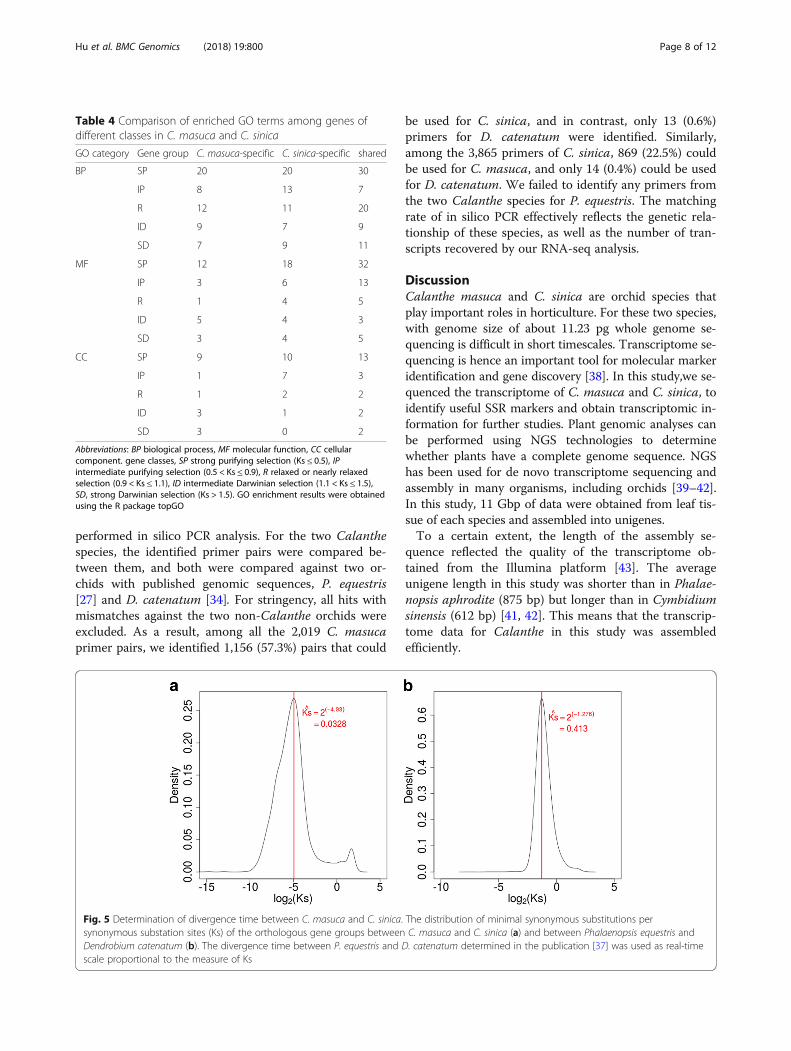
divergence time between the two closely relatedCalanthe species. For a more robust estimation, we de-termined the minimum Ks values for each of 10,329orthologous gene groups and determined the mode ofthe distribution of these Ks values at ~ 0.0328 (Fig. 5).Using the same method, we obtained orthologous genegroups between two epidendroid orchid species, i.e., P.equestris and D. catenatum, and calculated the Ks valuesfor each orthologue pair. The mode of distribution ofthe minimum Ks values of the orthologous gene groupsbetween P. equestris and D. catenatum was determinedat 0.413 (Fig. 5). With the divergence time between thesetwo epidendroid orchids estimated at ~ 43 Mya [37] andassuming that the non-synonymous substitution ratesbetween the two epidendroid and the two Calanthe spe-cies were close, we proposed that C. masuca and C.sinica diverged from each other approximately 3.42 ±1.86 Mya. This preliminary estimation of the divergencetime between C. masuca and C. sinica could be im-proved in the future with more data and informationavailable.
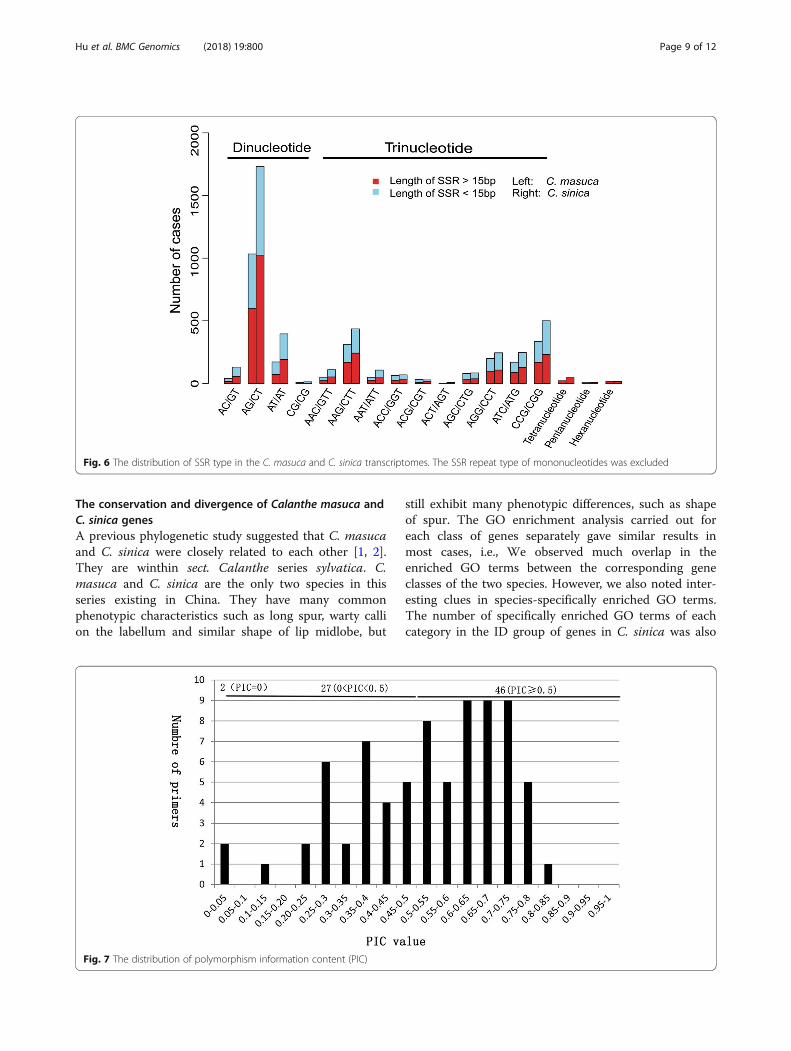
SSR identification, screening of variations and validationIn total, 3,764 putative SSRs in C. masuca and 7,189SSRs in C. sinica were identified. The majority of theSSRs in both species were either dinucleotides (1,137 inC. sinica and 2,058 in C. masuca) or trinucleotides(1,118 in C. sinica and 1,714 in C. masuca), with longermotifs accounting for only a small proportion (Fig. 6).Finally, 2,019/3,865 primer pairs were successfully desig-nated by Msatcommander for the two species
Fig. 3 Clusters of orthologous group classification of C. masuca and C. sinica
Hu et al. BMC Genomics (2018) 19:800 Page 6 of 12
(Additional file 5). In these primers, we screened 197polymorphic SSR loci according to 25,152 pairs of puta-tive orthologous genes identified by the method of recip-rocal best hit (Additional file 5). In addition, 129 SSRloci remained after mononucleotides were excluded(Additional file 5).
Validation of SSR markersTo test the amplification quality and the polymorphismsfor the preliminary analysis of the 129 SSR markers, asingle sample, JX1 (C. masuca), was used, and it wasfound that 75 SSRs resulted in clear peaks with littledisturbance.We then performed polymorphic analysis using eight in-
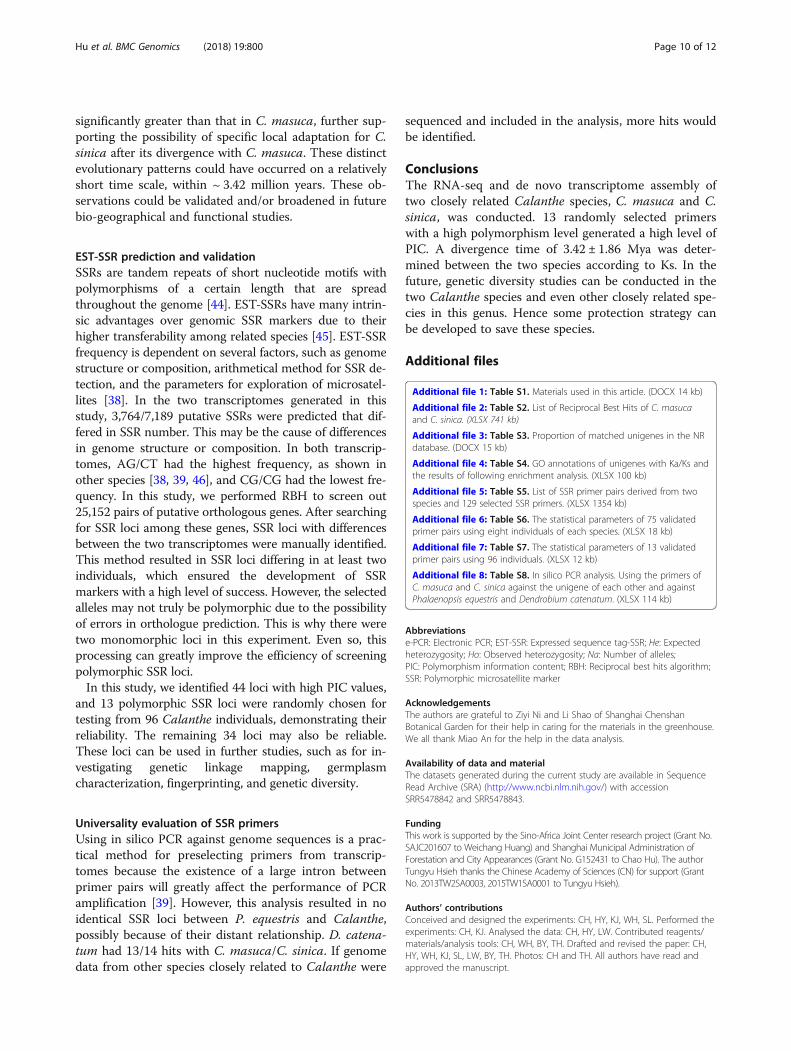
dividuals from each population collected from Yunnan,Jiangxi, Napo, and Guangxi in China (Additional file 1). Wefound that 73 of the 75 examined loci were polymorphic(97.6%) (Fig. 7 and Additional file 6). The two mono-morphic loci regarding these 8 individuals could representpolymorphic sites of the subpopulations from which wecollected the samples for RNA sequencing. Although
potentially polymorphic for other uninspected populations,the two primers were excluded from further analysis forconvenience. Nonetheless, 44 out of the 73 loci were foundto have a relatively high polymorphic level (PIC≥0.5) andcould thus be used in population genetic studies.To validate the reliability of the primers of the identi-
fied polymorphic loci, 13 primers with high PIC values(PIC≥0.5) were randomly selected to amplify a largenumber of populations and individuals (other 72 individ-uals). We found that all primers generated high PIC(PIC≥0.5) values (Additional file 7), confirming that theprimers could be used in future genetic analysis ofCalanthe.
Universality evaluation of SSR primersThe polymorphic SSR markers screening presentedabove was performed by comparing the transcriptomesof individuals from subpopulations in the two Calanthespecies; henceforth, a limited number of polymorphicSSR loci were identified (Additional file 8). To develop alarger number of candidate polymorphic SSR loci, we
Fig. 4 Gene ontology (GO) annotations of unigenes. The results are summarized into three main categories: biological processes, cellularcomponents and molecular function
Hu et al. BMC Genomics (2018) 19:800 Page 7 of 12
performed in silico PCR analysis. For the two Calanthespecies, the identified primer pairs were compared be-tween them, and both were compared against two or-chids with published genomic sequences, P. equestris[27] and D. catenatum [34]. For stringency, all hits withmismatches against the two non-Calanthe orchids wereexcluded. As a result, among all the 2,019 C. masucaprimer pairs, we identified 1,156 (57.3%) pairs that could
be used for C. sinica, and in contrast, only 13 (0.6%)primers for D. catenatum were identified. Similarly,among the 3,865 primers of C. sinica, 869 (22.5%) couldbe used for C. masuca, and only 14 (0.4%) could be usedfor D. catenatum. We failed to identify any primers fromthe two Calanthe species for P. equestris. The matchingrate of in silico PCR effectively reflects the genetic rela-tionship of these species, as well as the number of tran-scripts recovered by our RNA-seq analysis.
DiscussionCalanthe masuca and C. sinica are orchid species thatplay important roles in horticulture. For these two species,with genome size of about 11.23 pg whole genome se-quencing is difficult in short timescales. Transcriptome se-quencing is hence an important tool for molecular markeridentification and gene discovery [38]. In this study,we se-quenced the transcriptome of C. masuca and C. sinica, toidentify useful SSR markers and obtain transcriptomic in-formation for further studies. Plant genomic analyses canbe performed using NGS technologies to determinewhether plants have a complete genome sequence. NGShas been used for de novo transcriptome sequencing andassembly in many organisms, including orchids [39–42].In this study, 11 Gbp of data were obtained from leaf tis-sue of each species and assembled into unigenes.To a certain extent, the length of the assembly se-
quence reflected the quality of the transcriptome ob-tained from the Illumina platform [43]. The averageunigene length in this study was shorter than in Phalae-nopsis aphrodite (875 bp) but longer than in Cymbidiumsinensis (612 bp) [41, 42]. This means that the transcrip-tome data for Calanthe in this study was assembledefficiently.
Fig. 5 Determination of divergence time between C. masuca and C. sinica. The distribution of minimal synonymous substitutions persynonymous substation sites (Ks) of the orthologous gene groups between C. masuca and C. sinica (a) and between Phalaenopsis equestris andDendrobium catenatum (b). The divergence time between P. equestris and D. catenatum determined in the publication [37] was used as real-timescale proportional to the measure of Ks
Table 4 Comparison of enriched GO terms among genes ofdifferent classes in C. masuca and C. sinica
GO category Gene group C. masuca-specific C. sinica-specific shared
BP SP 20 20 30
IP 8 13 7
R 12 11 20
ID 9 7 9
SD 7 9 11
MF SP 12 18 32
IP 3 6 13
R 1 4 5
ID 5 4 3
SD 3 4 5
CC SP 9 10 13
IP 1 7 3
R 1 2 2
ID 3 1 2
SD 3 0 2
Abbreviations: BP biological process, MF molecular function, CC cellularcomponent. gene classes, SP strong purifying selection (Ks ≤ 0.5), IPintermediate purifying selection (0.5 < Ks ≤ 0.9), R relaxed or nearly relaxedselection (0.9 < Ks ≤ 1.1), ID intermediate Darwinian selection (1.1 < Ks ≤ 1.5),SD, strong Darwinian selection (Ks > 1.5). GO enrichment results were obtainedusing the R package topGO
Hu et al. BMC Genomics (2018) 19:800 Page 8 of 12
The conservation and divergence of Calanthe masuca andC. sinica genesA previous phylogenetic study suggested that C. masucaand C. sinica were closely related to each other [1, 2].They are winthin sect. Calanthe series sylvatica. C.masuca and C. sinica are the only two species in thisseries existing in China. They have many commonphenotypic characteristics such as long spur, warty callion the labellum and similar shape of lip midlobe, but
still exhibit many phenotypic differences, such as shapeof spur. The GO enrichment analysis carried out foreach class of genes separately gave similar results inmost cases, i.e., We observed much overlap in theenriched GO terms between the corresponding geneclasses of the two species. However, we also noted inter-esting clues in species-specifically enriched GO terms.The number of specifically enriched GO terms of eachcategory in the ID group of genes in C. sinica was also
Fig. 7 The distribution of polymorphism information content (PIC)
Fig. 6 The distribution of SSR type in the C. masuca and C. sinica transcriptomes. The SSR repeat type of mononucleotides was excluded
Hu et al. BMC Genomics (2018) 19:800 Page 9 of 12
significantly greater than that in C. masuca, further sup-porting the possibility of specific local adaptation for C.sinica after its divergence with C. masuca. These distinctevolutionary patterns could have occurred on a relativelyshort time scale, within ~ 3.42 million years. These ob-servations could be validated and/or broadened in futurebio-geographical and functional studies.
EST-SSR prediction and validationSSRs are tandem repeats of short nucleotide motifs withpolymorphisms of a certain length that are spreadthroughout the genome [44]. EST-SSRs have many intrin-sic advantages over genomic SSR markers due to theirhigher transferability among related species [45]. EST-SSRfrequency is dependent on several factors, such as genomestructure or composition, arithmetical method for SSR de-tection, and the parameters for exploration of microsatel-lites [38]. In the two transcriptomes generated in thisstudy, 3,764/7,189 putative SSRs were predicted that dif-fered in SSR number. This may be the cause of differencesin genome structure or composition. In both transcrip-tomes, AG/CT had the highest frequency, as shown inother species [38, 39, 46], and CG/CG had the lowest fre-quency. In this study, we performed RBH to screen out25,152 pairs of putative orthologous genes. After searchingfor SSR loci among these genes, SSR loci with differencesbetween the two transcriptomes were manually identified.This method resulted in SSR loci differing in at least twoindividuals, which ensured the development of SSRmarkers with a high level of success. However, the selectedalleles may not truly be polymorphic due to the possibilityof errors in orthologue prediction. This is why there weretwo monomorphic loci in this experiment. Even so, thisprocessing can greatly improve the efficiency of screeningpolymorphic SSR loci.In this study, we identified 44 loci with high PIC values,
and 13 polymorphic SSR loci were randomly chosen fortesting from 96 Calanthe individuals, demonstrating theirreliability. The remaining 34 loci may also be reliable.These loci can be used in further studies, such as for in-vestigating genetic linkage mapping, germplasmcharacterization, fingerprinting, and genetic diversity.
Universality evaluation of SSR primersUsing in silico PCR against genome sequences is a prac-tical method for preselecting primers from transcrip-tomes because the existence of a large intron betweenprimer pairs will greatly affect the performance of PCRamplification [39]. However, this analysis resulted in noidentical SSR loci between P. equestris and Calanthe,possibly because of their distant relationship. D. catena-tum had 13/14 hits with C. masuca/C. sinica. If genomedata from other species closely related to Calanthe were
sequenced and included in the analysis, more hits wouldbe identified.
ConclusionsThe RNA-seq and de novo transcriptome assembly oftwo closely related Calanthe species, C. masuca and C.sinica, was conducted. 13 randomly selected primerswith a high polymorphism level generated a high level ofPIC. A divergence time of 3.42 ± 1.86 Mya was deter-mined between the two species according to Ks. In thefuture, genetic diversity studies can be conducted in thetwo Calanthe species and even other closely related spe-cies in this genus. Hence some protection strategy canbe developed to save these species.
Additional files
Additional file 1: Table S1. Materials used in this article. (DOCX 14 kb)
Additional file 2: Table S2. List of Reciprocal Best Hits of C. masucaand C. sinica. (XLSX 741 kb)
Additional file 3: Table S3. Proportion of matched unigenes in the NRdatabase. (DOCX 15 kb)
Additional file 4: Table S4. GO annotations of unigenes with Ka/Ks andthe results of following enrichment analysis. (XLSX 100 kb)
Additional file 5: Table S5. List of SSR primer pairs derived from twospecies and 129 selected SSR primers. (XLSX 1354 kb)
Additional file 6: Table S6. The statistical parameters of 75 validatedprimer pairs using eight individuals of each species. (XLSX 18 kb)
Additional file 7: Table S7. The statistical parameters of 13 validatedprimer pairs using 96 individuals. (XLSX 12 kb)
Additional file 8: Table S8. In silico PCR analysis. Using the primers ofC. masuca and C. sinica against the unigene of each other and againstPhalaenopsis equestris and Dendrobium catenatum. (XLSX 114 kb)
Abbreviationse-PCR: Electronic PCR; EST-SSR: Expressed sequence tag-SSR; He: Expectedheterozygosity; Ho: Observed heterozygosity; Na: Number of alleles;PIC: Polymorphism information content; RBH: Reciprocal best hits algorithm;SSR: Polymorphic microsatellite marker
AcknowledgementsThe authors are grateful to Ziyi Ni and Li Shao of Shanghai ChenshanBotanical Garden for their help in caring for the materials in the greenhouse.We all thank Miao An for the help in the data analysis.
Availability of data and materialThe datasets generated during the current study are available in SequenceRead Archive (SRA) (http://www.ncbi.nlm.nih.gov/) with accessionSRR5478842 and SRR5478843.
FundingThis work is supported by the Sino-Africa Joint Center research project (Grant No.SAJC201607 to Weichang Huang) and Shanghai Municipal Administration ofForestation and City Appearances (Grant No. G152431 to Chao Hu). The authorTungyu Hsieh thanks the Chinese Academy of Sciences (CN) for support (GrantNo. 2013TW2SA0003, 2015TW1SA0001 to Tungyu Hsieh).
Authors’ contributionsConceived and designed the experiments: CH, HY, KJ, WH, SL. Performed theexperiments: CH, KJ. Analysed the data: CH, HY, LW. Contributed reagents/materials/analysis tools: CH, WH, BY, TH. Drafted and revised the paper: CH,HY, WH, KJ, SL, LW, BY, TH. Photos: CH and TH. All authors have read andapproved the manuscript.
Hu et al. BMC Genomics (2018) 19:800 Page 10 of 12
Ethics approval and consent to participateThe locations of material collected here are neither privately owned landsnor protected areas. No specific permits were required for our research.
Consent for publicationNot applicable.
Competing interestsThe authors declare that they have no competing interests.
Publisher’s NoteSpringer Nature remains neutral with regard to jurisdictional claims inpublished maps and institutional affiliations.
Author details1Shanghai Key Laboratory of Plant Functional Genomics and Resources,Shanghai Chenshan Botanical Garden, Shanghai 201602, China. 2ShanghaiChenshan Plant Science Research Center, Chinese Academy of Sciences,Shanghai Chenshan Botanical Garden, Shanghai 201602, China. 3Institute ofBotany, Chinese Academy of Sciences, Beijing 100093, China. 4School of LifeScience, Nanchang University, Nanchang 330031, China. 5Shanghai Institutesfor Biological Sciences, Chinese Academy of Sciences, Shanghai 200031,China. 6College of Landscape, Fujian Agriculture and Forestry University,Fuzhou 350002, China.
Received: 9 January 2018 Accepted: 11 October 2018
References1. Clayton D, Cribb P. The Genus Calanthe. Borneo: Natural History
Publications; 2013.2. Zhai JW, Zhang GQ, Li L, Wang M, Chen LJ, Chung SW, et al. A new
phylogenetic analysis sheds new light on the relationships in the Calanthealliance (Orchidaceae) in China. Mol Phylogenet Evol. 2014;77:216–22.
3. Tanaka R, Karasawa K, Ishida G. Karyomorphological observations onCalanthe of Japan. Bull Hiroshima Bot Gard. 1981:9–62.
4. Karasawa K, Ishida G. The genus calanthe. Tokyo: Yasaka Shobo (inJapanese); 1998.
5. Leitch IJ, Kahandawala I, Suda J, Hanson L, Ingrouille MJ, Chase MW, et al.Genome size diversity in orchids: consequences and evolution. Ann Bot.2009;104:469–81.
6. Parida SK, Kalia SK, Kaul S, Dalal V, Hemaprabha G, Selvi A, et al. Informativegenomic microsatellite markers for efficient genotyping applications insugarcane. Theor Appl Genet. 2009;118:327–38.
7. Faircloth BC. Msatcommander: detection of microsatellite repeat arrays andautomated, locus-specific primer design. Mol Ecol Resour. 2008;8:92–4.
8. Tang J, Baldwin SJ, Jacobs JM, van der Linden CG, Voorrips RE, Leunissen JA,et al. Large-scale identification of polymorphic microsatellites using an insilico approach. BMC Bioinformatics. 2008;9:374.
9. Castoe TA, Poole AW, de Koning AJ, Jones KL, Tomback DF, Oyler-McCanceSJ, et al. Rapid microsatellite identification from Illumina paired-endgenomic sequencing in two birds and a snake. PLoS One. 2012;7:e30953.
10. Chen H, Liu L, Wang L, Wang S, Somta P, Cheng X. Development andvalidation of EST-SSR markers from the transcriptome of adzuki bean (Vignaangularis). PLoS One. 2015;10:e0131939.
11. Jiao Y, Jia HM, Li XW, Chai ML, Jia HJ, Chen Z, et al. Development of simplesequence repeat (SSR) markers from a genome survey of Chinese bayberry(Myrica rubra). BMC Genomics. 2012;13:201.
12. Mahajan V, Rather IA, Awasthi P, Anand R, Gairola S, Meena SR, et al.Development of chemical and EST-SSR markers for Ocimum genus. IndCrop Prod. 2015;63:65–70.
13. Lu JJ, Suo NN, Hu X, Wang S, Liu JJ, Wang HZ. Development andcharacterization of 110 novel EST-SSR markers for Dendrobium officinale(Orchidaceae). Am J Bot. 2012;99:e415–20.
14. Jantasuriyarat C, Ritchuay S, Pattarawat P, Huehnea PS, Sureeporn KN.Development and transferability of EST-SSR and transferability of genomicSSR markers for genetic diversity assessment of Doritis. Biochem Syst Ecol.2012;45:57–65.
15. Vukosavljev M, Esselink GD, van 't Westende WP, Cox P, Visser RG, Arens P,et al. Efficient development of highly polymorphic microsatellite markers
based on polymorphic repeats in transcriptome sequences of multipleindividuals. Mol Ecol Resour. 2015;15:17–27.
16. John JS. SeqPrep. Available: https://github.com/jstjohn/SeqPrep. 2011.17. Joshi N, Fass J. Sickle: A sliding-window, adaptive, quality-based trimming
tool for FastQ files (Version 1.33)[Software]. 2011.18. Grabherr MG, Haas BJ, Yassour M, Levin JZ, Thompson DA, Amit I, et al. Full-
length transcriptome assembly from RNA-Seq data without a referencegenome. Nat Biotechnol. 2011;29:644–52.
19. Camacho C, Coulouris G, Avagyan V, Ma N, Papadopoulos J, Bealer K, et al.BLAST+: architecture and applications. BMC Bioinformatics. 2009;10:421.
20. Conesa A, Götz S, García-Gómez JM, Terol J, Talón M, Robles M. Blast2GO: auniversal tool for annotation, visualization and analysis in functionalgenomics research. Bioinformatics. 2005;21:3674–6.
21. Xie C, Mao X, Huang J, Ding Y, Wu J, Dong S, et al. KOBAS 2.0: a web serverfor annotation and identification of enriched pathways and diseases.Nucleic Acids Res. 2011;39:W316–22.
22. Altschul SF, Gish W, Miller W, Myers EW, Lipman DJ. Basic local alignmentsearch tool. J Mol Biol. 1990;215:403–10.
23. Altschul SF, Madden TL, Schäffer AA, Zhang J, Zhang Z, Miller W, et al.Gapped BLAST and PSI-BLAST: a new generation of protein database searchprograms. Nucleic Acids Res. 1997;25:3389–402.
24. Bork P, Dandekar T, Diaz-Lazcoz Y, Eisenhaber F, Huynen M, Yuan Y.Predicting function: from genes to genomes and back. J Mol Biol. 1998;283:707–25.
25. Moreno-Hagelsieb G, Latimer K. Choosing BLAST options for betterdetection of orthologs as reciprocal best hits. Bioinformatics. 2007;24:319–24.
26. O'brien KP, Remm M, Sonnhammer EL. Inparanoid: a comprehensivedatabase of eukaryotic orthologs. Nucleic Acids Res. 2005;33:D476–80.
27. Cai J, Liu X, Vanneste K, Proost S, Tsai WC, Liu KW, et al. The genomesequence of the orchid Phalaenopsis equestris. Nat Genet. 2015;47:65–72.
28. Wang D, Zhang Y, Zhang Z, Zhu J, Yu J. KaKs_Calculator 2.0: a toolkitincorporating gamma-series methods and sliding window strategies.Genomics Proteomics Bioinformatics. 2010;8:77–80.
29. Katoh K, Standley DM. MAFFT multiple sequence alignment softwareversion 7: improvements in performance and usability. Mol Biol Evol. 2013;30:772–80.
30. Suyama M, Torrents D, Bork P. PAL2NAL: robust conversion of proteinsequence alignments into the corresponding codon alignments. NucleicAcids Res. 2006;34:W609–12.
31. Alexa A, Rahnenfuhrer J topGO: enrichment analysis for gene ontology Rpackage version 2. 2010.
32. Schuelke M. An economic method for the fluorescent labeling of PCRfragments. Nat Biotechnol. 2000;18:233–4.
33. Kalinowski ST, Taper ML, Marshall TC. Revising how the computer programCERVUS accommodates genotyping error increases success in paternityassignment. Mol Ecol. 2007;16:1099–106.
34. Zhang GQ, Xu Q, Bian C, Tsai WC, Yeh CM, Liu KW, et al. The Dendrobiumcatenatum Lindl. genome sequence provides insights into polysaccharidesynthase, floral development and adaptive evolution. Sci Rep-UK. 2016;6:19029.
35. Schuler GD. Sequence mapping by electronic PCR. Genome Res. 1997;7:541–50.
36. Chehab EW, Kaspi R, Savchenko T, Rowe H, Negre-Zakharov F, KliebensteinD, et al. Distinct roles of jasmonates and aldehydes in plant-defenseresponses. PLoS One. 2008;3:e1904.
37. Zhang GQ, Liu KW, Li Z, Lohaus R, Hsiao YY, Niu SC, et al. The Apostasiagenome and the evolution of orchids. Nature. 2017;549:379–83.
38. Wei W, Qi X, Wang L, Zhang Y, Hua W, Li D, et al. Characterization of thesesame (Sesamum indicum L.) global transcriptome using Illumina paired-end sequencing and development of EST-SSR markers. BMC Genomics.2011;12:451.
39. An M, Deng M, Zheng S, Song Y. De novo transcriptome assembly anddevelopment of SSR markers of oaks Quercus austrocochinchinensis and Q.kerrii (Fagaceae). Ree Genet Genomes. 2016;12:103.
40. De Paolo S, Salvemini M, Gaudio L, Aceto S. De novo transcriptomeassembly from inflorescence of Orchis italica: analysis of coding and non-coding transcripts. PLoS One. 2014;9:e102155.
41. Zhang J, Wu K, Zeng S, Teixeira da Silva JA, Zhao X, Tian CE, et al.Transcriptome analysis of Cymbidium sinense and its application to theidentification of genes associated with floral development. BMC Genomics.2013;14:279.
Hu et al. BMC Genomics (2018) 19:800 Page 11 of 12

42. Su C, Chao Y, Chang A, Chen W, Chen C, Lee A, et al. De novo assembly ofexpressed transcripts and global analysis of the Phalaenopsis aphroditetranscriptome. Plant Cell Physiol. 2011;52(9):1501–14.
43. Chen X, Xie YH Sun XM. Development and characterization of polymorphicgenic-SSR markers in Larix kaempferi. Molecules. 2015;20:6060–7.
44. Zhou X, Dong Y, Zhao J, Huang L, Ren X, Chen Y, et al. Genomic surveysequencing for development and validation of single-locus SSR markers inpeanut (Arachis hypogaea L.). BMC Genomics. 2016;17:420.
45. Kong Q, Xiang C, Yu Z. Development of EST-SSRs in Cucumis sativus fromsequence database. Mol Ecol Notes. 2006;6:1234–6.
46. Zhang H, Wei L, Miao H, Zhang T, Wang C. Development and validation ofgenic-SSR markers in sesame by RNA-seq. BMC Genomics. 2012;13:316.
Hu et al. BMC Genomics (2018) 19:800 Page 12 of 12