Embed Size (px)
Citation preview

RESEARCH TECHNICAL REPORT
Development of Protection
Recommendations for Li-ion
Battery Bulk Storage:
Sprinklered Fire Test


Development of Protection Recommendations for Li-ion
Battery Bulk Storage: Sprinklered Fire Test
Prepared by
Benjamin Ditch
October 2016
FM Global 1151 Boston-Providence Turnpike
Norwood, MA 02062
PROJECT ID 0003053291

Disclaimer
The research presented in this report, including any findings and conclusions, is for informational
purposes only. Any references to specific products, manufacturers, or contractors do not constitute a
recommendation, evaluation or endorsement by Factory Mutual Insurance Company (FM Global) of
such products, manufacturers or contractors. FM Global does not address life, safety, or health issues.
The recipient of this report must make the decision whether to take any action. FM Global undertakes
no duty to any party by providing this report or performing the activities on which it is based. FM Global
makes no warranty, express or implied, with respect to any product or process referenced in this report.
FM Global assumes no liability by or through the use of any information in this report.

FM Global PUBLIC RELEASE
i
Executive Summary
A project was conducted to determine fire protection guidance for warehouse storage of cartoned Li-ion
batteries. The methodology for this project consisted of a comparison of the free-burn flammability
characteristics of a large-format polymer pouch Li-ion battery to FM Global standard commodities and
previously tested small-format Li-ion batteries in a rack storage array. A large-scale fire test then
assessed the performance of ceiling-level sprinkler protection. The goal of the experimental approach
was to maximize the application of the successful large-scale fire test result. For example, adequate
sprinkler protection established in a large-scale test may be applied to all Li-ion batteries that are shown
in the reduced-commodity evaluation to pose a hazard less than or equal to that of the battery used in
the large-scale test.
A supplemental task involved assessing the impact of internal ignition within a pallet load of batteries
versus the external ignition typically used in large-scale fire testing. An assessment of the effectiveness
of sprinkler water at suppressing a fire at a later stage of battery involvement than could be achieved in
the large-scale test was also conducted. Both of these tasks reinforce the sprinkler protection guidance
resulting from the successful large-scale fire test.
This project was conducted in partnership with the Property Insurance Research Group (PIRG) and in
collaboration with the Fire Protection Research Foundation (FPRF). The previous two phases of the
project included a use and hazard assessment reporti and a series of reduced-commodity fire tests
comparing the flammability characteristics of several Li-ion batteries and FM Global standard cartoned
commoditiesii, iii. These tests showed that bulk storage of small-format Li-ion batteries (i.e., 2.6 Ah)
exhibits similar fire growth leading to first sprinkler operation as cartoned commodities. Further, it was
determined that the time required for involvement of Li-ion batteries in a fully developed fire is on the
order of five minutes. These conclusions provided the basis for sprinkler protection recommendations
for small-format Li-ion batteries in bulk storage, with the goal of suppressing the fire before the
anticipated time of involvement of Li-ion batteries. The current project evaluated ceiling-only sprinkler
protection based on large-scale sprinklered fire test experience of cartoned Li-ion batteries.
The Li-ion battery available for this project was a 20 Ah, 3.3 V, polymer pouch battery with lithium iron
phosphate (LiFePO4) chemistry. The battery dimensions were 160 mm × 230 mm × 7.25 mm (6 in. × 9 in.
× 1/3 in.) and the state-of-charge (SOC) was nominally 50%. Packaging consisted of corrugated
containerboard cartons, where each carton contained 20 batteries separated by 10 levels of nested
i C. Mikolajczak, M. Kahn, K. White, and R. Long, "Lithium-Ion Batteries Hazard and Use Assessment," Report prepared for the Fire Protection Research Foundation, June 2011.
ii B. Ditch and J. de Vries, "Flammability Characterization of Lithium-ion Batteries in Bulk Storage," FM Global Technical Report, March 2013.
iii R. Thomas Long Jr., R. T. Long Jr., J. Sutula, and M. Kahn, "Li-ion Batteries Hazard and Use Assessment Phase IIB: Flammability Characterization of Li-ion Batteries for Storage Protection," Report prepared for the Fire Protection Research Foundation, 2013.

FM Global PUBLIC RELEASE
ii
plastic dividers. This packaging and battery layout was consistent with the previously tested small-
format Li-ion polymer batteriesii, iii.
All test evaluations were conduct by FM Global at the FM Global Research Campus in Rhode Island, USA.
The report findings are only valid under the following conditions:
- Storage height up to 4.6 m (15 ft)
- Ceiling height up to 12.2 m (40 ft)
- Bulk-packaged 20 Ah polymer pouch batteries in corrugated board cartons with heavy plastic
dividers at nominally 50% state-of-charge (SOC).
The flammability characteristics of the selected 20 Ah Li-ion polymer pouch battery were compared to
those of FM Global’s standard commodities and previously tested small-format Li-ion batteriesiv,v. This
test, referred to as “reduced-commodity,” was used to estimate the fire hazard present at the time of
first sprinkler operation in a sprinklered warehouse fire scenario. Measurements focused on the fire
development of each commodity and the time of battery involvement for the Li-ion products during a
free-burn rack storage fire test. Based on the result of the test presented in this report, and building
upon Referenceii, the following conclusions can be made:
The cartoned 20 Ah large-format battery used in the present study represented a higher hazard
than the previously tested 2.6 Ah small-format batteries (cylindrical and polymer pouch). This
conclusion is based on the following test results indicating that the large-format battery
contributed to the overall fire severity closer to the predicted time of sprinkler operation than
the small-format batteries:
o The predicted time of sprinkler operation was similar for all cartoned Li-ion batteries
and FM Global standard commodities included in this project. This result supports the
assumption that for three-tier-high, open-frame racks, the carton packaging dominates
the fire development leading to first sprinkler operation.
o Under free-burn conditions, the 20 Ah Li-ion polymer pouch battery used in this project
contributed to the overall severity of the rack storage 2 min 30 s (150 s) after igntion,
versus 5 minutes for the previously tested 2.6 Ah cylindrical and polymer pouch
batteries in Phase 2.
The product packaging, e.g., corrugated board containers and dividers, was identified as a key
factor driving the hazard in Li-ion batteries in storage. While the corrugated board cartons were
iv B. Ditch and J. de Vries, "Flammability Characterization of Lithium-ion Batteries in Bulk Storage," Technical Report, March, 2013. Available at www.fmglobal.com/researchreports.
v R. T. Long Jr., J. A. Sutula, M. J. Kahn, "Lithium Ion Batteries Hazard and Use Assessment Phase IIB - Flammability Characterization of Li-ion Batteries for Storage Protection," Fire Protection Research Foundation Report, 2013.

FM Global PUBLIC RELEASE
iii
shown to dominate the initial fire growth, the plastic content within the cartons was shown to
be a driving factor in the overall commodity hazard, in particular:
o Cartoned batteries containing significant quantities of plastics exhibited a similar rapid increase in the released energy due to plastics involvement early in the fire development.
For the large-format 20 Ah Li-ion polymer pouch batteries used in this project, the heavy plastic dividers contributed to the overall severity of the fire before involvement of the batteries.
For the power tool packs, tested in Phase 2vi, the heavy plastic case of the battery pack dominated the fire hazard and there was no observable contribution from the batteries.
o Cartoned batteries containing minimal plastics (e.g., the small-format Li-ion cylindrical and polymer batteries tested in Phase 2) exhibited a slower increase in energy release and a delay in the battery involvement due to heating of the batteries. In this case the plastic dividers represented a lesser combustible load than the heavy plastic dividers used for the 20 Ah polymer pouch battery.
Caution should be taken when extending the results of the testing presented in this report beyond the
specific combination of packaging and battery listed. Changes in the components of the packaging can
significantly impact the flammability characteristics of cartoned Li-ion batteries. One key aspect of the
packaging driving the fire hazard is the divider used to separate the batteries within the cartons.
Potential divider materials represent a wide range of fire properties and include liner board, fiber board,
thin or heavy plastic, and expanded foamvii. Even for the same battery, changing the liner material can
significantly impact the fire hazard. Changes in the Li-ion battery can also have a similar effect on the
overall hazard of the cartoned product. For instance, high SOC has been shown to increase the
likelihood and severity of thermal runawayviii. The quantity of electrolyte, which is the main combustible
source, is a function of the battery capacity and can also vary with the battery format (e.g., cylindrical or
polymer pouch). Thus even for the same packaging, changes in the battery can impact the fire hazard. A
new flammability assessment should be conducted when potentially significant changes to the cartoned
product are encountered.
The performance of ceiling-level sprinkler protection was then assessed with a large-scale sprinklered
fire test of the large-format 20 Ah polymer pouch batteries. The test was conducted using a three-tier-
vi B. Ditch and J. de Vries, "Flammability Characterization of Lithium-ion Batteries in Bulk Storage," Technical
Report, March, 2013. Available at www.fmglobal.com/researchreports.
vii M.M. Khan, A. Tewarson, and M. Chaos, "Combustion Characteristics of Materials and Generation of Fire Products," in SFPE Handbook of Fire Protection Engineering, P. DiNenno, Ed. Quincy, Massachusetts, New York: Springer, 2016, ch. Section 3, Chapter 4, pp. 1143-1232.
viii P. Ribiere, S. Grugeon, M. Morcrette, S. Boyanov, S. Laruelle, and G. Marlair, "Investigation on the Fire-Induced Hazards of Li-ion Battery Cells by Fire Calorimetry," Energy and Environmental Science, vol. 5, pp. 5271-5280, 2012. DOI: 10.1039/clee02218k.

FM Global PUBLIC RELEASE
iv
high rack-storage array, which represents storage up to 4.6 m (15 ft) high. Protection was provided by
quick-response, pendent sprinklers, having a 74oC (165oF) rated link with a K-factor of 320 L/min/bar1/2
(22.4 gpm/psi1/2) under a 12.2 m (40 ft) ceiling. In accordance with the established evaluation criteria,
the following conclusions can be made:
Storage up to 4.6 m (15 ft) under ceiling heights up to 12.2 m (40 ft) was adequately protected
by a fire protection system comprised of pendent sprinklers having a K-factor of 320 L/min/bar½
(22.4 gpm/psi½), with a nominal 74oC (165oF) temperature rating and a nominal RTI of 27.6 m½s½
(50 ft½s½), installed on 3.0 m 3.0 m (10 ft 10 ft) spacing at an operating pressure of 2.4 bar
(35 psig). This conclusion is based on one sprinkler operation extinguishing a large-scale test fire
without manual intervention.
Protection guidance established from the large-scale fire test can be reasonably applied to the
small-format (i.e., 2.6 Ah cylindrical and polymer pouch) Li-ion batteries previously tested for
this project. This conclusion is based on the results of the reduced-commodity test indicating
that the cartoned large-format battery used in this project represented a higher hazard in the
reduced-commodity test than the previously tested small-format batteries.
Three supplemental evaluations were then included to reinforce the sprinkler protection guidance
resulting from the successful large-scale fire test. The first evaluation assessed the likelihood and impact
of ignition resulting from thermal runaway of one or more batteries within a carton. The effectiveness of
sprinkler water at suppressing a fire at a later stage of battery involvement than was achieved in the
large-scale test was then conducted. Finally, literature data were reviewed to compare the minimum
water application rate needed to prevent flame spread along the carton packaging versus the sprinkler
protection used in the large-scale test. Based on the results of the tests presented in this report, the
following conclusions can be made:
For all small- and large-format Li-ion batteries used in this project, the development of a rack storage fire leading to sprinkler operation should be similar for both an ignition scenario where the fire initiates inside or outside of the carton. This conclusion is based on the following test results:
o Thermal runaway of the 20 Ah polymer pouch battery used in this project did not result in battery-to-battery propagation within the carton. Experimental data have shown that thermal runaway of up to three batteries simultaneously within a single carton did not propagate to the adjacent batteries within the same carton.
o There is not sufficient air within a carton to support combustion of a single 20 Ah polymer pouch battery. Thus, the fire propagation primarily occurs outside of the carton. In addition, review of literature data has shown that battery-to-battery

FM Global PUBLIC RELEASE
v
propagation following thermal runaway of small-format cylindrical batteries occurs after the carton has breachedix.
o Once an external fire is present, flame propagation along the carton material will dominate the fire development leading to sprinkler operation and will occur before the batteries contribute to the overall fire severity.
The sprinkler system used in the large-scale fire test was sufficient to protect against a fire where the Li-ion batteries were contributing more to the overall fire severity than occurred in the large-scale test. This conclusion is based on the following analysis:
o Intermediate-scale testing, designed to delay the application of protection water until the batteries were contributing to the overall fire, confirmed the adequacy of sprinkler protection guidance resulting from the successful large-scale fire test.
o In addition, review of literature data provided in Reference [x] has shown that a lower sprinkler discharge rate than used in the large-scale fire test can also control or suppress fire development along corrugated board cartons.
The best protection recommendations based on current knowledge, for each Li-ion battery included in
this project, are summarized below. All ceiling-level sprinkler protection should be installed in
accordance with FM Global Property Loss Prevention Data Sheet 2-0 (DS 2-0), Installation Guidelines for
Automatic Sprinklers, January 2014. The protection recommendations are:
Li-ion polymer pouch batteries (i.e., capacity up to 20 Ah at ≤ 50% SOC) and Li-ion cylindrical batteries (i.e., capacity up to 2.6 Ah at ≤ 50% SOC):
o For a single unconfined pallet load of batteries stored on the floor to a maximum of 1.5 m (5 ft) high, protect as an HC-3 occupancy per FM Global Property Loss Prevention Data Sheet 3-26, Fire Protection Water Demand for Nonstorage Sprinklered Properties, July 2011. Additionally, maintain a minimum of 3.0 m (10 ft) separation between adjacent combustibles.
o For batteries stored solid pile, palletized, or in racks up to 4.6 m (15 ft) under a ceiling up to 12.2 m (40 ft) high, protect with quick-response, pendent, sprinklers with a 165oF (74oC) nominal temperature rating. Protection options include:
K320 L/min/bar1/2 sprinklers @ 2.4 bar (K22.4 @ 35 psi). The water flow demand should allow for 12 sprinkler operations.
ix H. Webster, "Flammability Assessment of Bulk-Packed, Rechargeable Lithium-Ion Cells in Transport Category Aircraft," U.S. Department of Transportation Federal Aviation Administration, DOT/FAA/AR-06/38, September 2006.
x S. Thumuluru and Y. Xin, "An Experimental Study of Pre-Wetting on Fire Propagation in Parallel Panels," in Proceedings of the 13th International Fire Science and Engineering Conference (INTERFLAM 2015), Windsor, UK, 2013, pp. 317-326.

FM Global PUBLIC RELEASE
vi
K360 L/min/bar1/2 sprinklers @ 2.4 bar (K25.2 @ 35 psi). The water flow demand should allow for 12 sprinkler operations
o For batteries stored higher than 4.6 m (15 ft) or ceiling heights greater than 12.2 m (40 ft), store batteries in racks and protect with Scheme A per Section D.2.2.1 of FM Global Property Loss Prevention Data Sheet 7-29, Ignitable Liquid Storage in Portable Containers, April 2012 (DS 7-29).
Li-ion power tool packs (i.e., comprised of 18650-format cylindrical batteries with a total pack capacity up to 26 Ah at ≤ 50% SOC):
o Protect in-process storage of power tool packs as an HC-3 occupancy per FM Global Property Loss Prevention Data Sheet 3-26, Fire Protection Water Demand for Nonstorage Sprinklered Properties, July 2011. Limit in-process storage area to 19 m2 (200 ft2) and one pallet high. Additionally, maintain a minimum of 2.4 m (8 ft) separation between adjacent combustibles.
o For power tool packs stored up to 4.6 m (15 ft) high under a ceiling up to 12.2 m (40 ft), protect as FM Global standard cartoned unexpanded plastic (CUP) commodity per FM Global Property Loss Prevention Data Sheet 8-9, Storage of Class 1, 2, 3, 4 and Plastic Commodities, FM Global, July 2011.
o For power tool packs stored higher than 4.6 m (15 ft) or ceiling heights greater than 12.2 m (40 ft), store batteries in racks and protect with Scheme A per Section D.2.2.1 of DS 7-29.
Storage beyond the above listed conditions, including battery characteristics (e.g., SOC, quantity of
electrolyte, and format) and packaging components (e.g., cartons and dividers), requires a more robust
protection scheme to account for several unknowns that can negatively affect protection effectiveness.
Fire Protection Scheme A combines in-rack automatic sprinklers (IRAS) and horizontal barriers for
protection of high-hazard commodities, such as rack storage of ignitable liquids or level 3 aerosols.
Complete specifications and drawings can be found in Section D.2.2.1 of DS 7-29. Similar specifications
can be found in Section E.2 of FM Global Property Loss Prevention Data Sheet 7-31, Storage of Aerosol
Products, January 2012. This system design is expected to provide the highest level of protection
required for storage of the Li-ion batteries tested in this project and can be applied to array
configurations beyond the scope of this project.

FM Global PUBLIC RELEASE
vii
Abstract
Protection recommendations for warehouse storage of cartoned Li-ion batteries have been developed
through fire testing and comparison to analogous commodities with similar hazard characteristics. A
unique approach was developed that incorporated four different fire test evaluations, ranging from
small- to large-scale, with the goal of extending the application of a successful large-scale fire test to
additional types of Li-ion batteries. A reduced-commodity test evaluated the flammability characteristics
of large-format, 20 Ah Li-ion polymer batteries, compared to FM Global’s standard commodities and
previously tested small-format Li-ion batteries. The performance of ceiling-level sprinkler protection was
then assessed with a large-scale sprinklered fire test of the large-format 20 Ah polymer pouch batteries.
Two supplemental tasks reinforced the sprinkler protection guidance resulting from the large-scale fire
test. The impact of internal ignition within a pallet load of batteries versus the external ignition typically
used in large-scale fire testing was assessed through small-scale testing. Finally, the effectiveness of
sprinkler water at suppressing a fire at a later stage of battery involvement than could be achieved in
the large-scale test was assessed through intermediate-scale testing. Where applicable, best protection
recommendations based on current knowledge have been provided.

FM Global PUBLIC RELEASE
viii
Acknowledgements
The author thanks Mr. R. Chmura, Mr. J. Chaffee, Mr. M. Skidmore and the entire FM Global Research
Campus crew for their efforts in conducting the fire tests. There were several testing phases included in
this project that utilized the talented personnel of many laboratories. The diligent oversight of project
safety and hazardous material disposal by Mrs. J. Pitocco ensured personnel safety throughout this
project.
The author greatly acknowledges the discussion and input from the FM Global Engineering Standards
group. Their expertise in loss prevention allowed for definitive protection recommendations, improving
the practical application of this work.
The author further thanks Ms. Kathleen Almand, of the Fire Protection Research Foundation, and the
members of the Property Insurance Research Group for their insightful discussions. In addition, the
funding provided by PIRG members and other sponsors for the procurement of Lithium-ion batteries
and disposal services was essential to the economic feasibility of this project.
Finally, the author would like to thank Ms. Denise Staplins for processing this report.

FM Global PUBLIC RELEASE
ix
Table of Contents
Executive Summary ........................................................................................................................................ i
Abstract ........................................................................................................................................................ vii
Acknowledgements ..................................................................................................................................... viii
Table of Contents ..........................................................................................................................................ix
List of Figures ................................................................................................................................................xi
List of Tables ............................................................................................................................................... xiii
1. Introduction .......................................................................................................................................... 1
2. Experimental Program .......................................................................................................................... 2
2.1 Test Facility ................................................................................................................................. 2
2.2 Li-ion Battery Test Commodity ................................................................................................... 3
2.3 Heats of Combustion .................................................................................................................. 6
2.4 Carton Combustion Parameters and Moisture Content ............................................................. 6
3. Reduced-Commodity Test .................................................................................................................... 8
3.1 Test Configuration ....................................................................................................................... 8
3.1.1 Overview ........................................................................................................................ 8
3.1.2 Ignition ........................................................................................................................... 9
3.2 Documentation and Instrumentation ....................................................................................... 10
3.3 Test Results ............................................................................................................................... 12
3.3.1 Heat Release Rate ........................................................................................................ 12
3.3.2 Period of Flammability Characterization to Predict Sprinkler Response ..................... 14
3.3.2.1 Flame Attachment (Standard Video Recording) .......................................... 14
3.3.2.2 Internal Heat of Commodity (Thermocouples) ........................................... 16
3.3.2.3 Commodity Collapse .................................................................................... 17
3.3.3 Predicted Sprinkler Response ...................................................................................... 18
3.3.4 Time of Battery Involvement ....................................................................................... 20
4. Large-Scale Fire Test ........................................................................................................................... 22
4.1 Test Overview ........................................................................................................................... 22
4.2 Automatic Sprinkler Protection ................................................................................................ 23
4.3 Ignition ...................................................................................................................................... 24
4.4 Documentation and Instrumentation ....................................................................................... 24
4.5 Evaluation Criteria ..................................................................................................................... 26
4.6 Test Results and Data Analysis .................................................................................................. 27
4.6.1 Test Images .................................................................................................................. 28

FM Global PUBLIC RELEASE
x
4.6.2 Sprinkler Operations and Area of Commodity Damage .............................................. 32
4.6.3 Energy Release ............................................................................................................. 32
4.6.4 Ceiling Thermocouple (TC) Measurements ................................................................. 33
4.6.5 Evaluation of Internal Heating ..................................................................................... 35
5. Supplemental Experimental Evaluations ............................................................................................ 37
5.1 Internal Ignition......................................................................................................................... 37
5.2 Later Stage Suppression Test .................................................................................................... 39
5.2.1 Suppression Test 1: Aisle Face Ignition ........................................................................ 41
5.2.2 Suppression Test 2: Flue Face Ignition ......................................................................... 43
5.2.3 Comparison of Internal Heating ................................................................................... 46
6. Discussion ........................................................................................................................................... 49
6.1 Pre-wetting of Adjacent Combustibles ..................................................................................... 49
6.2 Application of Test Results to Protection Recommendations .................................................. 50
7. Conclusions ......................................................................................................................................... 52
8. Recommendations .............................................................................................................................. 56
References .................................................................................................................................................. 58

FM Global PUBLIC RELEASE
xi
List of Figures
2-1: Illustration of FM Global Large Burn Laboratory test locations. ......................................................... 3
2-2: Li-ion polymer pouch battery; outside foil pouch shown on left, internal components shown on right. (images courtesy of Exponent, Inc.) ..................................................................................... 4
2-3: Packaging images; individual carton shown on left and top view of packaging shown on right. ...... 5
2-4: Li-ion polymer pouch battery pallet layout; top view shown on left and elevation view shown on right. ............................................................................................................................................... 5
3-1: Elevation view of reduced-commodity test rack. ............................................................................... 9
3-2: Propane ring burner (left) within the rack and fire size within rack (right). ..................................... 10
3-3: Thermocouple locations used during the reduced-commodity test. ............................................... 11
3-4: Plan view schematic of camera locations (not to scale). .................................................................. 11
3-5: Convective heat release rates for 20 Ah polymer pouch battery and small-format Li-ion batteries and FM Global standard commodities. The time of each test has been slightly offset to align the initial fire growth period. ............................................................................................... 13
3-6: Close-up of convective heat release rates for FM Global standard commodities and Li-ion battery commodities; grouping based on similarity in growth curve. .............................................. 14
3-7: Test images shown in 30 s increments from ignition for the large-format polymer pouch batteries. ........................................................................................................................................... 15
3-8: Internal heating of commodity using TCs located within the test commodity. ............................... 17
3-9: Example of sprinkler link response during 20 Ah polymer pouch test; quick-response sprinkler with a 74oC (165oF) temperature rating below a 9.1 m (30 ft) ceiling. ............................................. 19
3-10: Determination of the time of battery involvement. ......................................................................... 21
4-1: Photo of large-scale test main array, before constructing the target array. .................................... 22
4-2: Plan view of large-scale test array. Li-ion battery commodity is shown as green cartons. Open circles represent the location of ceiling-level sprinklers. Ignition location at the base of the array is shown as a red star............................................................................................................... 23
4-3: Igniter locations within the rack, located at the rack uprights. (representative image shown)....... 24
4-4: Thermocouple locations used during the large-scale test. ............................................................... 25
4-5: Plan view schematic of camera locations (not to scale). .................................................................. 26
4-6: Images of large-scale fire test. .......................................................................................................... 29
4-7: Images of large-scale fire test (continued). ...................................................................................... 30
4-8: Post-test images showing extent of damage to test commodity. .................................................... 31
4-9: Sprinkler operation pattern and commodity damage. ..................................................................... 32
4-10: Total integrated energy. ................................................................................................................... 33
4-11: Ceiling level TC measurements. ........................................................................................................ 34
4-12: Contour plot of ceiling TC measurements at first sprinkler operation 90 s after ignition. ............... 34
4-13: Internal heating of commodity using TCs located within the test commodity. ............................... 36
5-1: Photos of internal ignition evaluation tests. ..................................................................................... 38
5-2: Intermediate-scale suppression test pallet design. The location of the ignition battery is identified with a red star and TC locations are shown with green circles. ....................................... 40
FM Global PUBLIC RELEASE
xii
5-3: Intermediate-scale suppression test ignition location. The location of the carton containing the ignition battery is identified with a red star. .............................................................................. 40
5-4: Photos of heater placement within ignition carton. Left photo shows a foil heater affixed to a battery on the fifth level (of ten levels) within the carton. Right photo shows the heater wiring exiting the carton. .................................................................................................................. 41
5-5: Photos of suppression Test 1. ........................................................................................................... 42
5-6: Suppression Test 1 convective heat release rate and predicted sprinkler response. ...................... 43
5-7: Photos of suppression Test 2. ........................................................................................................... 44
5-8: Photos of Test 2 reignition after shutdown of water application. .................................................... 45
5-9: Example photos of thermal runaway leading to battery rupture. .................................................... 45
5-10: Suppression Test 2 convective heat release rate and predicted sprinkler responses. ..................... 46
5-11: Internal heating of commodity using thermocouples located between the cartons of the test commodity. ....................................................................................................................................... 47
6-1: Photo demonstrating the fire spread in a parallel panel configuration (left) and plot of overall heat released as a function of the water flow rate for various ignition sizes (right). Courtesy of Thumuluru and Xin. ........................................................................................................................... 50

FM Global PUBLIC RELEASE
xiii
List of Tables
2-1: Lithium-ion battery specifications. [courtesy of Exponent, Inc.] ........................................................ 4
2-2: Combustible load per carton of batteries. .......................................................................................... 6
2-3: Heat of combustions for test commodities. ....................................................................................... 6
3-1: Predicted operation times for quick-response sprinklers with a link temperature rating of 74oC (165oF) at multiple ceiling heights. ........................................................................................... 19
4-1: Large-scale fire test setup summary ................................................................................................. 27


FM Global PUBLIC RELEASE
1
1. Introduction
Fire protection guidance for warehouse storage of lithium ion (Li-ion) batteries presently remains a
relatively unexplored topic within the fire protection community. At the same time, demand for Li-ion
batteries continues to grow for applications such as electric and hybrid electric vehicles, consumer
electronics, and energy storage systems. This is highlighted by a 2013 report that forecasted the global
Li-ion battery market will increase from US$11.7 billion in 2012 to US$33.1 billion by 2019 [1]. As
manufacturing capacity grows to meet the new global demand, so too will the volume of batteries
stored in warehouses.
The fire hazards inherent to Li-ion battery technology are well documented in many overview
documents [2, 3, 4, 5] and through experimental studies [6, 7, 8, 9, 10, 11, 12, 13]. The unique potential
for thermal runaway reactions to spread a fire differentiates Li-ion batteries from typical ordinary
combustible materials found in warehouse storage. As a result, neither FM Global Property Loss
Prevention Data Sheets nor National Fire Protection Association Standard 13, “Standard for the
Installation of Sprinkler Systems,” [14] currently contain specific, research based, sprinkler installation
recommendations or requirements for Li-ion battery storage. Consequently, the existing approach for
sprinkler protection often relies on designs for high-hazard commodities, e.g., automatic in-rack
sprinklers [15].
This report describes part of a multi-phase project conducted in conjunction with the Property Insurance
Research Group (PIRG) and in collaboration the Fire Protection Research Foundation (FPRF). The
previous two phases of the project included a use and hazard assessment report [16] and a series of
reduced-commodity fire tests comparing the flammability characteristics of several Li-ion batteries and
FM Global standard cartoned commodities [17, 15]. These tests showed that bulk storage of small-
format Li-ion batteries exhibits similar fire growth leading to first sprinkler operation as cartoned
commodities. Further, it was determined that the time required for involvement for Li-ion batteries in a
fully developed fire is on the order of five minutes. These conclusions provided the basis for developing
sprinkler protection recommendations for small-format Li-ion batteries in bulk storage, with the goal of
suppressing the fire before the anticipated time of involvement of the batteries. The current project
evaluates ceiling-only sprinkler protection based on large-scale sprinklered fire test experience of Li-ion
batteries.
A consultancy company, Exponent Inc., was retained by FPRF to provide a detailed description of the
batteries and prepare a summary report of the project findings [18].
FM Global donated the resources associated with conducting the research program, including storage
and cleanup of the Li-ion batteries. The batteries used in the test were donated by a private supplier.
Disposal and recycling services were donated by a waste management company specializing in disposal
of Li-ion batteries. The balance of the costs, which included program management services, was
supplied by PIRG.

FM Global PUBLIC RELEASE
2
2. Experimental Program
The methodology for this project consisted of a comparison of the free-burn flammability characteristics
of the available large-format Li-ion polymer pouch battery to FM Global standard commodities and
previously tested small-format Li-ion batteries in a rack-storage array. A large-scale fire test then
assessed the performance of ceiling-level sprinkler protection. The goal of this experimental approach
was to maximize the application of the successful large-scale fire test result. For example, adequate
sprinkler protection established in a large-scale test may be applied to all Li-ion batteries that are shown
in the reduced-commodity evaluation to pose a hazard less than or equal to that of the battery used in
the large-scale test.
A supplemental task for this project involved assessing the impact of internal ignition within a pallet load
of batteries versus the external ignition typically used in large-scale fire testing. A separate task assessed
the effectiveness of sprinkler water at suppressing a fire at a later stage of battery involvement than can
be achieved in the large-scale test. Both of these tasks reinforced the adequacy of sprinkler protection
guidance resulting from the successful large-scale fire test.
2.1 Test Facility Testing for this program was primarily conducted in the Large Burn Laboratory located in the Fire
Technology Laboratory at the FM Global Research Campus in West Glocester, Rhode Island, USA.
Figure 2-1 is a plan view of the LBL showing the north movable ceiling, the south movable ceiling, and
the 20-MW Fire Products Collector (FPC).
The 20-MW FPC, used for the reduced-commodity test described in Section 3, consists of an 11 m (36 ft)
diameter inlet that tapers down to a 3.0 m (10 ft) diameter duct. The inlet to the 20-MW FPC is at an
elevation of 11.3 m (37 ft). Gas concentration, velocity, temperature, and moisture measurements are
made within the FPC duct. Beyond the measurement location, the exhaust duct connects to a wet
electrostatic precipitator (WESP) prior to the gases venting to the atmosphere. The air exhaust rate was
set to 71 m3/s (150,000 ft3/min).
The north movable ceiling, used for the large-scale fire test described in Section 4, is smooth, flat, and
horizontal. The ceiling measures 24.4 m x 24.4 m (80 ft x 80 ft) and is adjustable for heights above the
floor ranging from 3.0 m to 18.3 m (10 ft to 60 ft). The air emission control system (AECS) exhaust
ducting consists of four extraction points, located at the lab ceiling, that merge into a single duct with a
cross sectional area of 6.1 m2 (66 ft2). Gas concentration, velocity, temperature, and moisture
measurements are made downstream of the manifold. Beyond the measurement location, the exhaust
duct connects to a wet electrostatic precipitator (WESP) prior to the gases venting to the atmosphere.
The air exhaust rate was to 94 m3/s (200,000 ft3/min).

FM Global PUBLIC RELEASE
3
Figure 2-1: Illustration of FM Global Large Burn Laboratory test locations.
2.2 Li-ion Battery Test Commodity The Li-ion battery available for this project was a 20 Ah polymer pouch battery and the specifications are
shown in Table 2-1. The battery is constructed by stacking alternating layers of electrodes, which are
then enclosed in foil pouches with heat-sealed seams, Figure 2-2.
It is important to note that the 20 Ah battery used in this project contained approximately 7%
electrolyte per total mass of the battery. This represents a similar combustible loading compared to the
smaller capacity Li-ion batteries (i.e., 2.6 Ah) used in the previous study, which contained approximately
5% electrolyte for the cylindrical battery and 8% for the polymer pouch battery [15]. The listed state-of-
charge is consistent with the typical storage condition for each battery.
The packaging, as received from the supplier, consisted of a 430 mm × 330 mm × 150 mm (16.75 in. x
12.81 in. x 5.75 in.) corrugated containerboard carton. Each carton contained 20 batteries separated by
nested polystyrene plastic dividers, Figure 2-3. This packaging and the battery layout is consistent with
the previously tested small-format Li-ion polymer batteries [15].
The pallet load design consisted of 56 cartons arranged among seven levels of eight cartons each for a
total of 1,120 batteries per pallet load, Figure 2-4. Consistent with the pallet design received from the
supplier, the cartons are arranged in a "doughnut shape," resulting in an open area at the center of
pallet. The orientation of the cartons alternated each level for stack stability and to ensure consistency
in the battery layout on all sides of the pallet load. The overall dimensions of the pallet load were
1,080 mm x 1,080 mm x 1,020 mm tall (42.5 in. x 42.5 in x 40.25 in.).

FM Global PUBLIC RELEASE
4
Table 2-1: Lithium-ion battery specifications. [courtesy of Exponent, Inc.]
Specification Value
Voltage 3.3 V
Capacity 20 Ah
Dimensions 7.25 mm x 160 mm x 227 mm
(0.3 in. x 6.3 in. x 8.9 in.)
Mass 490 g
(1.1 lb)
Chemistry Lithium iron phosphate
(LiFePO4)
Approximate Electrolyte Mass 34 g
(0.08 lb)
Approximate State-of-Charge 50%
Figure 2-2: Li-ion polymer pouch battery; outside foil pouch shown on left, internal components shown on right. (images courtesy of Exponent, Inc.)
Separator Anode
Cathode

FM Global PUBLIC RELEASE
5
Figure 2-3: Packaging images; individual carton shown on left and top view of packaging shown on right.
325 mm325 mm325 mm
10
76
mm
20
ce
lls
20 cells
20 cells 20
ce
lls
20
ce
lls
20 cells
20 cells
20
ce
lls
12
7 m
m
14
6 m
m
10
22
mm
1076 mm
Plan View Elevation View
Figure 2-4: Li-ion polymer pouch battery pallet layout; top view shown on left and elevation view shown on right.
As shown in Table 2-2, the combustible loading per carton of batteries is 86 ± 3.5 MJ. When supported
on an FM Global standard wood pallet, the combustible weight of the commodity is approximately
177 kg (390 lb); of this total the cartoned Li-ion battery commodity is 155 kg (340 lb) and the pallet 22 kg
(50 lb). The total chemical energy per pallet load is nominally 5,105 ± 117 MJ, based on the above
masses and the heat of combustion for each material listed in Section 2.3.

FM Global PUBLIC RELEASE
6
Table 2-2: Combustible load per carton of batteries.
Component Individual
Weight (kg) Quantity per Carton (ea)
Weight per Carton (kg)
Energy* (MJ)
Carton 0.6 1 0.6 8.3 ± 0.2
Plastic Divider 0.15 10 1.5 58.3 ± 1.5
Electrolyte 0.35 20 0.7 19.6 ± 2.0
Total: 2.8 86 ± 3.7
* Heat of combustion and uncertainty values are listed in Section 2.3.
2.3 Heats of Combustion Table 2-3 contains average chemical heat of combustion values for each component of the test
commodities. These are average values for each material type and up to 5% variance can be expected
with the exception of the Li-ion battery electrolyte. The heat of combustion value for diethyl carbonate
(DEC) was used as a representative estimate for electrolyte as it has been shown to be similar to other
organic carbonate solvents typically found in Li-ion battery electrolyte [9]. The exact composition of the
Li-ion battery electrolytes is unknown, therefore a variance of ±10% was assumed.
Table 2-3: Heat of combustions for test commodities.
Material Chemical Heat of Combustion, kJ/g (BTU/lb)
Representative Material
Reference
Wood pallet 12.4 ± 0.3
(5,300 ± 130) Red oak [19]
Corrugated and paper board 14.4 ± 0.4
(6,200 ± 170) Newspaper [19]
Unexpanded plastic 27.5 ± 0.7
(11,800 ± 300) Polystyrene [19]
Electrolyte 20.9 ± 2
(9,000 ± 860) Diethyl carbonate [20]
2.4 Carton Combustion Parameters and Moisture Content FM Global carefully controls the material properties of the corrugated board cartons used for
construction of all standard cartoned commodities. Testing of the flammability characteristics is
conducted with the fire propagation apparatus (FPA) [21]. Among the measurements are the thermal
response parameter (TRP)i and time to ignition under different heat flux exposures [22]. Measurements
for the carton material from the Li-ion batteries were within the benchmark values for the carton
material used for FM Global’s Class 2 standard commodity. Therefore, all commodities included in this
i TRP is a quantification of the ignition resistance of a material and relates the time to ignition to the net heat flux.

FM Global PUBLIC RELEASE
7
evaluation were expected to have a similar initial fire growth rate, before involvement of material
contained within the cartons.
In addition, the commodity moisture content of the outer cartons was controlled to within 6.0% ± 2% on
a dry basis for each test.

FM Global PUBLIC RELEASE
8
3. Reduced-Commodity Test
This section presents the results of the reduced-commodity fire test conducted to evaluate the relative
flammability characteristics of the large-format 20 Ah Li-ion polymer pouch battery compared to
FM Global’s standard commodities and previously tested small-format Li-ion batteries [15].
3.1 Test Configuration
3.1.1 Overview The test configuration was designed to capture the fire growth characteristics leading to sprinkler
operation in a warehouse storage scenario. As shown in Figure 3-1, the array consisted of a three-tier-
high, open-frame, single-row steel rack with overall dimensions of approximately 2.4 m long × 1.2 m
wide × 4.3 m tall (8 ft × 3.25 ft × 14 ft). This array size was used to represent rack storage up to 4.6 m
(15 ft), assuming nominally 1.5 m (5 ft) per tier.
The bottom tier of the array consisted of a non-combustible product (metal liner) supported on a wood
pallet. The non-combustible product was constructed to maintain the FM Global standard 1.07 m ×
1.07 m × 1.07 m (42 in. × 42 in. × 42 in.) commodity dimensions and representative airflow around the
commodity. The upper two tiers consisted of pallets loads of cartoned Li-ion batteries also stacked to
maintain the standard FM Global pallet load dimensions.
A summary of the pallet load design can be found in Section 2.2. The total chemical energy of the entire
reduced-commodity test array is 21,000 ± 480 MJ, i.e., four pallet loads of commodity plus two
additional wood pallets under the first-tier non-combustible product (5,105 x 4 + 278 x 2 ≈ 21,000 MJ).
It should be noted that the pallet design for previous reduced-commodity testing only had test
commodity lining the ignition flue of the test array [15]. The increased availability of test commodity for
this project allowed for the entire pallet load to be comprised of cartoned Li-ion batteries. Increasing the
quantity of batteries allows for greater lateral spread, thus longer duration for sprinkler operation
predictions. No impact on the time of battery involvement is expected because battery involvement is
predominantly due to the thermal exposure at the ignition flue, which does not change with additional
commodity. Comparisons of peak heat release rate between tests should be avoided due to the
discrepancy in quantity.

FM Global PUBLIC RELEASE
9
1.5
m
0.3
m Ring burner
Cartoned Li-ion Batteries
Ignition flue
Non-Combustible Non-Combustible
Reduced-Commodity Array
Side View
Containment
Pan #1
Pan #2
Figure 3-1: Elevation view of reduced-commodity test rack.
3.1.2 Ignition Ignition was achieved with a 0.33 m (13 in.) diameter propane ring burner centered in the transverse
flue 0.15 m (6 in.) below the second-tier test commodity, Figure 3-2. Propane was supplied at a rate of
30 L/min (1.06 ft3/min), resulting in a nominal 45 kW (chemical) heat release rate, calculated as
�̇�𝐶3𝐻8 = �̇̇�×𝜌×∆𝐻𝑐.
Here �̇̇� is the volume flow in m3/s, is the density of propane at 20oC (68oF) and 101.3 kPa (1 atm) with
a value of 1.88 kg/m3 (0.12 lb/ft3), and Hc is the net heat of complete combustion of propane with a
value of 46.0 kJ/g.
All fire size estimates in this report include the contribution from the propane ring burner ignition
source, which was constant for the test duration. The minimum measurable burner contribution was
estimated as 20 kW (convective).

FM Global PUBLIC RELEASE
10
Figure 3-2: Propane ring burner (left) within the rack and fire size within rack (right).
3.2 Documentation and Instrumentation Documentation for each test included video, still photography, and pertinent measurements necessary
to evaluate product performance. All instrumentation was calibrated in accordance with ISO 17025 [23].
The following instrumentation was installed within the laboratory space and the exhaust duct for the
20-MW FPC:
Environmental conditions, including relative humidity, dry-bulb temperature, and wet-bulb
temperature of the air inside and outside of the lab, were measured just prior to each test as
well as continually during each test with Vaisala HMT337 humidity and temperature
transmitters. Units are located within the laboratory space at four points surrounding the test
array and at one outdoor location near the air inlet to the laboratory.
Convective flow within the FPC duct was measured with a Type K, bare-bead, 6.4 mm (0.252 in.)
sheathed, chromel-alumel thermocouple and an impact tube averaging ring.
Combustion gases within the FPC duct were measured with non-dispersive infrared (NDIR) CO
and CO2 gas analyzers to calculate the generation of carbon monoxide and carbon dioxide; a
paramagnetic O2 analyzer to measure depletion of oxygen; a flame ionization detector (FID)
total hydrocarbon (THC) analyzer to measure the release of volatile organic compounds (VOC) as
equivalent methane.
A flow meter and metering valves monitored and controlled the propane flow to the ring
burner.
Twelve thermocouples were used to monitor internal heating of the commodity during the fire
test. Each thermocouple was a Type K, grounded junction, 1.6 mm (0.625 in.) diameter,
sheathed, chromel-alumel thermocouple. As shown in Figure 3-3, the thermocouples were
located 150 mm (6 in.) in from the ignition flue between the third and fourth level of cartons on

FM Global PUBLIC RELEASE
11
both the second- and third-tier commodity. Horizontally, thermocouples were located at the
midpoint of the pallet load and 150 mm (6 in.) from the outer edges.
Side Elevation View of Instrumentation
(Pallets South of Central Transverse Flue)
Plan View of Third Carton Level
(2nd
and 3rd
Tier Commodity)
Wood Pallet
Wood Pallet
N
Thermocouple located between battery
cartons, 150 mm from edge facing
ignition flue
Ignition location
Non-Combustible
15
0 m
m
150 mm
530 mm
Figure 3-3: Thermocouple locations used during the reduced-commodity test.
The video data included two high-definition video cameras set at floor level, one high-definition camera
elevated above the floor, and two infrared cameras (FLIR® T650sc long-wave IR (LWIR) and Bullard®
T4MAX) for observation of the fire. A schematic of camera locations is shown in Figure 3-4.
A.
A.B.
C.
A. High-definition video camera
B. FLIR T650sc infrared imaging camera
C. Bullard T4MAX thermal imaging camera
D. High-definition video camera, elevated above floor
D.
Figure 3-4: Plan view schematic of camera locations (not to scale).

FM Global PUBLIC RELEASE
12
3.3 Test Results
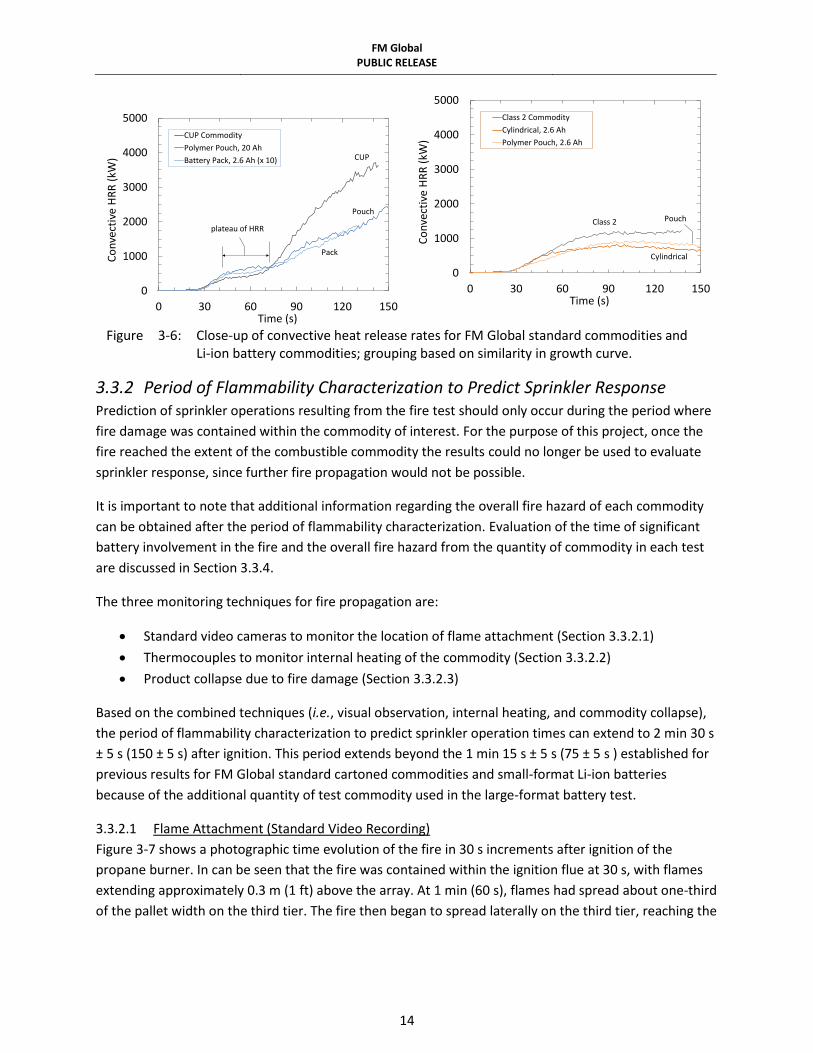
3.3.1 Heat Release Rate The convective heat release rates, determined from the temperature rise of the gas flow in the FPC, is
shown in Figure 3-5. Previous data from small-format Li-ion batteries and FM Global standard cartoned
commodities are included as reference. To simplify the comparison, the time of each test has been
slightly offset to align with the initial fire growth period of the 20 Ah polymer pouch battery. The data
series for CUP and Class 2 commodities, and Li-ion battery packs, are truncated when the test material
was largely consumed.
A close-up of the convective heat release rates is provided in Figure 3-6 to highlight the change in fire
development that occurs once the cartons are breached and the contents become involved. The
commodities are grouped based on their fire development, where materials that exhibit a fire
development similar to CUP commodity are shown in the left figure and those similar to Class 2
commodity are shown in the right figure.
The 20 Ah polymer pouch battery exhibited a steady increase in the initial growth until a nominal peak
value of 700 kW (convective) was achieved at 1 min (60 s). A delay in the fire growth was then observed
as a temporary plateau in the heat release curve until 1 min 15 s (75 s). The fire intensity steadily
increased to a value of 2,500 kW at 2 min 30 s (150 s) before exhibiting another temporary plateau until
3 min 10 s (190 s). The fire then increased to a value of 5,300 kW by 5 min 40 s (340 s) before a
prolonged plateau until 9 min 30 s (570 s). Though not shown on Figure 3-5, the heat release rate
increased to a maximum of 8,750 kW at 10 min 4 s (604 s), followed by a dip in the heat release until
13 min (780 s), before steadily declining as the combustible material was consumed. An estimated
10,300 ± 1,030 MJ (9,800 ± 980 BTU103) of convective energy was released during the data collection
portion (7,200 s total) of this test.
It should be noted that the convective heat release rate was used for this evaluation because it is
relevant to determine sprinkler activation and the chemical heat release of a Li-ion battery cannot be
accurately measured. The vent gases and combustion products of a Li-ion battery contain significant
percentages of CO2 and O2 formed from the thermal degradation processes (pyrolysis rather than
combustion) of the organic carbonates in the electrolyte. This form of CO2 and O2 production does not
involve the same energy release of typical combustion processes and may lead to an over-prediction of
the chemical heat release rate from carbon dioxide and oxygen consumption calorimetry [15].
Qualitatively, all commodities shown in Figure 3-5 exhibited a similar initial fire development as the
flames spread vertically along the corrugated board cartons that lined the fuel space above ignition.
After the initial fire development, the 20 Ah polymer pouch batteries exhibit an increased fire hazard
compared to the small-format cylindrical and polymer Li-ion batteries, in terms of fire growth rate. The
fire growth trend, however, is consistent with that of the power tool packs until the limited quantity of
battery packs was consumed. Quantified values of fire growth rate leading to sprinkler operation can be
found in Table 3-1.

FM Global PUBLIC RELEASE
13
Note: In Figure 3-5, “cylindrical” refers to the 18650 form factor batteries with a capacity of 2.6 Ah at
3.7 V; battery packs contained ten 18650 cylindrical batteries in a robust plastic casing. All small-format
batteries were at a nominal 50% state-of-charge, consistent with their normal storage condition [15].
As highlighted in Figure 3-6, the 20 Ah polymer pouch batteries exhibit a fire growth similar to CUP
commodity. It was previously established that the plateau in the heat release rate for CUP commodity
occurred as the flames penetrated the cartons and the plastic cups stored within became involved in the
fire [15]. For the 20 Ah polymer pouch batteries the subsequent increase in the heat release rate
indicates involvement of the batteries and is further discussed in Section 3-5. In the case of the power
tool packs, the heavy plastic cases of the battery pack dominated the fire hazard and there was no
observable contribution from the batteries before the product was consumed.
Figure 3-5: Convective heat release rates for 20 Ah polymer pouch battery and small-format Li-ion batteries and FM Global standard commodities. The time of each test has been slightly offset to align the initial fire growth period.
0
3000
6000
9000
0 120 240 360 480 600
Co
nve
ctiv
e H
RR
(kW
)
Time (s)
CUP Commodity
Polymer Pouch, 20 Ah
Battery Pack, 2.6 Ah (x 10)
Class 2 Commodity
Cylindrical, 2.6 Ah
Polymer Pouch, 2.6 Ah
CUP Commodity
Class 2 Commodity
Polymer Pouch, 20 Ah
Polymer Pouch, 2.6 Ah
Cylindrical, 2.6 Ah
Battery Pack, 2.0 Ah (x 10)
FM Global PUBLIC RELEASE
14
Figure 3-6: Close-up of convective heat release rates for FM Global standard commodities and
Li-ion battery commodities; grouping based on similarity in growth curve.
3.3.2 Period of Flammability Characterization to Predict Sprinkler Response Prediction of sprinkler operations resulting from the fire test should only occur during the period where
fire damage was contained within the commodity of interest. For the purpose of this project, once the
fire reached the extent of the combustible commodity the results could no longer be used to evaluate
sprinkler response, since further fire propagation would not be possible.
It is important to note that additional information regarding the overall fire hazard of each commodity
can be obtained after the period of flammability characterization. Evaluation of the time of significant
battery involvement in the fire and the overall fire hazard from the quantity of commodity in each test
are discussed in Section 3.3.4.
The three monitoring techniques for fire propagation are:
Standard video cameras to monitor the location of flame attachment (Section 3.3.2.1)
Thermocouples to monitor internal heating of the commodity (Section 3.3.2.2)
Product collapse due to fire damage (Section 3.3.2.3)
Based on the combined techniques (i.e., visual observation, internal heating, and commodity collapse),
the period of flammability characterization to predict sprinkler operation times can extend to 2 min 30 s
± 5 s (150 ± 5 s) after ignition. This period extends beyond the 1 min 15 s ± 5 s (75 ± 5 s ) established for
previous results for FM Global standard cartoned commodities and small-format Li-ion batteries
because of the additional quantity of test commodity used in the large-format battery test.
3.3.2.1 Flame Attachment (Standard Video Recording)
Figure 3-7 shows a photographic time evolution of the fire in 30 s increments after ignition of the
propane burner. In can be seen that the fire was contained within the ignition flue at 30 s, with flames
extending approximately 0.3 m (1 ft) above the array. At 1 min (60 s), flames had spread about one-third
of the pallet width on the third tier. The fire then began to spread laterally on the third tier, reaching the
0
1000
2000
3000
4000
5000
0 30 60 90 120 150
Co
nve
ctiv
e H
RR
(kW
)
Time (s)
CUP Commodity
Polymer Pouch, 20 Ah
Battery Pack, 2.6 Ah (x 10) CUP
Pouch
Pack
plateau of HRR
0
1000
2000
3000
4000
5000
0 30 60 90 120 150
Co
nve
ctiv
e H
RR
(kW
)
Time (s)
Class 2 Commodity
Cylindrical, 2.6 Ah
Polymer Pouch, 2.6 Ah
Class 2 Pouch
Cylindrical

FM Global PUBLIC RELEASE
15
extents of the commodity by 2 min 20 s (150 s). Lateral spread along the second-tier commodity began
at 3 min (180 s) after ignition.
30s 60s 90s
120 s 150 s 180 s
Figure 3-7: Test images shown in 30 s increments from ignition for the large-format polymer pouch batteries.

FM Global PUBLIC RELEASE
16
3.3.2.2 Internal Heat of Commodity (Thermocouples)
Internal heating of the commodity was measured with thermocouples located between battery cartons
150 mm (6 in.) in from the ignition flue. As detailed in Section 3.2, the thermocouples were located
between the third and fourth level of cartons on both the second- and third-tier commodity.
Horizontally, thermocouples were located at the midpoint of the pallet load and 150 mm (6 in.) from the
outer edges.
Figure 3-8 presents the thermocouple measurements acquired during the fire test. The convective heat
release rate is included for reference to the time evolvement of the fire. The threshold temperature of
180oC (356oF) was added based on the oxidation temperature of electrolyte that results in a high-rate
runaway reaction (peak rates > 100oC/min) [9]. A legend is provided to describe the thermocouple
location within the test array. Notable data series are additionally labeled using the following
convention: tier 2 or tier 3 (T2/3), north or south pallet load (N/S), and horizontal position of West,
center, or East (W/C/E). For example, T3-S-C references the thermocouple located at the center of the
third-tier pallet load on the south side of the rack.
For this test, the threshold temperature was first exceeded by the thermocouple on tier 3, South pallet
load, center location (T3-S-C) at 2 min 53 s (173 s) after ignition. Exceedance of the threshold
temperature is only one measure of the potential for battery involvement. Since the thermocouples are
located between the cartons, not directly connected to the batteries, high temperatures could also
occur due to involvement of the cartons or plastic dividers.

FM Global PUBLIC RELEASE
17
Figure 3-8: Internal heating of commodity using TCs located within the test commodity.
3.3.2.3 Commodity Collapse
Collapse of commodity due to fire damage is common in all rack storage tests and does not impact the
validity of the test. In the previous reduced-commodity tests with small-format Li-ion batteries, collapse
could significantly impact the fire development because the non-combustible portion of the pallet load
might be exposed [15]. This concern does not exist in the present study, where the entire pallet load
was comprised of Li-ion batteries. However, for comparison to the previous battery tests, collapse
should not occur during the period where sprinkler predictions are made. It was assumed that major
collapse, visually estimated as greater than 10% of the overall quantity of Li-ion batteries, was sufficient
to impact the fire development. All other commodity collapse was considered minor.
During the 20 Ah polymer pouch battery test, individual batteries began falling from the third tier of the
array sporadically at 3 min 48 s (228 s). A major collapse of commodity occurred at 7 min 15 s (435 s)
after ignition, followed by sporadic minor collapses. A catastrophic failure of the rack beam supporting
the third tier commodity occurred at 9 min 56 s (596 s), resulting in complete collapse of the
commodity. Based on these observations, collapse impacting the fire development (i.e., greater than
10% of available batteries) occurred at 9 min 56 s (596 s) after ignition.
0
2000
4000
6000
8000
10000
0
200
400
600
800
1000
0 120 240 360 480 600
Co
nve
ctiv
e H
RR
(kW
)
TC M
easu
rem
ent
(oC
)
Time (s)
West West
Center Center
East East
blank 1 blank 2
West West
Center East
Center East
Tier 3South Pallet North Pallet
Tier 2South Pallet North Pallet
temperaturethreshold
T3-S-CT3-N-C
T2-S-W
HRR

FM Global PUBLIC RELEASE
18
3.3.3 Predicted Sprinkler Response All sprinkler responses were calculated using the method described in Reference [15] and are based on
the convective heat release rates from ignition, which are illustrated in Figure 3-5. Figure 3-9 provides
the results of the predicted response of a quick-response sprinkler where the ceiling height was set to
9.1 m (30 ft) above the floor (i.e., 4.9 m (16 ft) above the array). The fire growth rate was calculated as a
10 s linear trend of the convective fire size leading up to link operation.
Table 3-1 contains complete sprinkler response calculations for quick-response sprinklers, having an RTI
of 27.6 (m-s)1/2 (50 (ft-s)1/2), with ceiling heights between 7.6 m and 12.2 m (25 ft and 40 ft) where the
storage array was nominally 4.6 m (15 ft) high. Corresponding values for small-format Li-ion batteries
and FM Global standard commodities are provided from Reference [15]. It should be noted that fire
growth rates nominally within a factor of two and �̇�𝑏𝑒 values nominally within 30% of the average are
considered equivalent.
For a ceiling height of 7.6 m (25 ft), the predetermined sprinkler operation temperature of 74oC (165oF)
was reached at 37 s after ignition for the 20 Ah polymer pouch test. The corresponding convective fire
size at link operation, �̇�𝑏𝑒, was 335 kW and the fire growth rate was 33 kW/s. Increasing the ceiling
height to 9.1 m (30 ft) resulted in a predicted link operation time of 41 s, �̇�𝑏𝑒 value of 480 kW, and a fire
growth rate of 34 kW/s.
In comparison to previously tested small-format Li-ion batteries, the 20 Ah polymer pouch batteries
exhibited similar flammability characteristics (�̇�𝑏𝑒 and fire growth rate) at the time of sprinkler
operation. When compared to FM Global standard commodities (both Class 2 and CUP), the 20 Ah
polymer pouch batteries tended to display slightly higher flammability characteristics at the time of
sprinkler operation.
Using full-pallet loads of batteries allowed for the prediction of sprinkler operations under greater
ceiling heights than the previous testing, as discussed in Section 3.1. As a result, Table 3-1 includes
sprinkler response calculations for 10.7 m and 12.2 m (35 ft and 40 ft) ceilings. The predicted link
operation times were 48 s for a 10.7 m (35 ft) ceiling and 58 s for a 12.2 m (40 ft) ceiling. The
corresponding �̇�𝑏𝑒 values were 549 kW and 688 kW, and fire growth rates were 15 kW/s and 11 kW/s,
respectively. The notable decrease in the fire growth rate (at sprinkler operation) compared to
calculations at 7.6 m and 9.1 m (25 ft and 30 ft) ceilings is a result of the predicted sprinkler operation
during the plateau portion of the heat release rate, which can be seen in Figure 3-9 around 1 min (60 s).

FM Global PUBLIC RELEASE
19
Figure 3-9: Example of sprinkler link response during 20 Ah polymer pouch test; quick-response sprinkler with a 74oC (165oF) temperature rating below a 9.1 m (30 ft) ceiling.
Table 3-1: Predicted operation times for quick-response sprinklers with a link temperature
rating of 74oC (165oF) at multiple ceiling heights.
Predicted Sprinkler Response
Ceiling Height = 7.6 m (25 ft)
Link Operation Qbe Fire Growth
(s) kW (kW/s)
Li-ion, 20 Ah Polymer Pouch 37 335 33
Li-ion, small-format† 43 270 20
Class 2 59 209 15
CUP 43 232 16
Ceiling Height = 9.1 ( 30 ft)
Li-ion, 20 Ah Polymer Pouch 41 480 34
Li-ion, small-format† 77 388 18
Class 2 65 367 24
CUP 52 321 11
Ceiling Height = 10.7 m (35 ft)
Li-ion, 20 Ah Polymer Pouch 48 549 15
Ceiling Height = 12.2 (40 ft)
Li-ion, 20 Ah Polymer Pouch 58 688 11 † Represented as the average of the values from the small-format 2.6 Ah cylindrical and polymer battery tests found in Reference [15].
0
200
400
600
800
0
1000
2000
3000
4000
0 60 120 180 240
Lin
k R
esp
on
se (
oC
), R
TI =
(
m-s
)1/2
Co
nve
ctiv
e H
RR
(kW
)
Time (s)
Convective HRR
Link Response
Sprinkler LinkOperation Time
27
.6
Link Operation Temperature

FM Global PUBLIC RELEASE
20
3.3.4 Time of Battery Involvement For the purpose of this study, battery involvement references the time during the fire development
when the batteries are observed to contribute significantly to the fire severity. In a warehouse storage
fire scenario, the determination of battery involvement is complicated by the large quantities of
combustible packaging components that comprise the test commodities, i.e., wood pallets, plastic
dividers, and cartons. By accounting for the contribution of the packaging, it is reasonable to attribute
any excess energy release to the combustion of Li-ion batteries.
Figures 3-10 presents the convective heat release rate measured during the early growth portion of the
fire. The convective heat release rates for FM Global standard Class 2 and CUP commodities are included
for reference. Following the approach used for testing of small-format Li-ion batteries [15], lower and
upper threshold values represent the range of time when the batteries became significantly involved in
the fire.
The lower threshold value represents the steady-state heat release of FM Global standard Class 2
commodity of 1,250 kW. Exceedance of this threshold value provides a conservative estimate of the
contribution to the overall fire severity from the contents stored within the cartons. Before this time,
the heat release rate can be attributed solely to the combustion of carton material. As shown in
Figure 3-10, the convective HRR for the Li-ion batteries exceeded the lower threshold value at
approximately 1 min 30 s (90 s) after ignition.
The time of battery involvement can also be estimated at a later stage in the fire development. As
discussed in Section 3-10, suppression tests have shown that the plastic dividers contribute to the fire
before the batteries become involved. Thus the increase of the convective HRR that occurs before the
plateau at approximately 2 min 30 s (150 s) can be (at least partially) attributed to the plastic dividers.
Subsequent exceedance of the upper threshold value at 3 min (180 s) corresponds to the latest time
after ignition that the Li-ion batteries are not significantly contributing to the fire severity.
Using the lower and upper threshold values, the time of significant involvement of the 20 Ah polymer
pouch battery is estimated to occur between ~ 1 min 30 s (90 s) and ~ 3 min 15 s (195 s) after ignition.
Taking the average of these values and rounding to the nearest 30 s increment results in a nominal time
of battery involvement of 2 min 30 s (150 s), under free-burn conditions. Before this time, the heat
release rate can be attributed to the combustion of packaging components. In comparison, the
previously tested small-format Li-ion batteries became involved in the fire significantly later at an
estimated 5 min (300 s) after ignition. Thus, the current battery represents a higher hazard commodity
based on the flammability characteristics leading to first sprinkler operation and time of battery
involvement in the fire.

FM Global PUBLIC RELEASE
21
Figure 3-10: Determination of the time of battery involvement.
21
FM G
lob
al
PU
BLIC
RELEA
SE

FM Global PUBLIC RELEASE
22
4. Large-Scale Fire Test
This section describes the large-scale sprinklered fire test conducted to determine automatic sprinkler
fire protection guidance for warehouse storage of cartoned Li-ion batteries. As discussed in Section 3,
the large-format 20 Ah Li-ion polymer pouch battery used in the present study represents a greater
hazard than previously tested small-format Li-ion batteries in cartoned warehouse storage [15]. As a
result, protection guidance established from the large-scale test can be applied to the small-format
cylindrical and polymer Li-ion batteries evaluated during this multi-phase project.
4.1 Test Overview Figure 4-1 presents a photo of the large-scale test array and Figure 4-2 presents an overview schematic
of the array and sprinkler layout. The main fuel array consisted of a three-pallet-load-high open-frame,
double-row steel rack under a 12.2 m (40 ft) ceiling. This array size represents rack storage up to 4.6 m
(15 ft). The main array measured approximately 7.3 m long × 2.3 m (24 ft × 7.5 ft) wide in a 6 × 2 pallet
load arrangement, and included 24 pallet loads of Li-ion battery commodity. The end pallet of each row
consisted of FM Global standard cartoned unexpanded plastic (CUP) commodity [24]. A single-row
target array containing four pallet loads of the CUP commodity was located across a 1.2 m (4 ft) aisle on
either side of the main array. Overall, the target arrays measured approximately 4.9 m × 3.0 m (16 ft ×
3 ft). Using the pallet load design, described in Section 2.2, this test included 26,880 batteries packaged
in 1,344 cartons.
Figure 4-1: Photo of large-scale test main array, before constructing the target array.

FM Global PUBLIC RELEASE
23
Note that the 24 pallet loads of batteries available for this project were less than the 72 pallet loads of
commodity used in a standard three-tier-high large-scale test. In a standard test, the main and target
arrays consist of an 8 × 2 and 6 × 2 pallet load arrangement, respectively [25, 26]. As a result, the
allowable extent of fire spread for the battery test is less than a standard test because the fire must be
contained within the extent of the test commodity. Further details on the evaluation criteria can be
found in Section 4.5.
CU
PC
UP
CU
PC
UP
CU
PC
UP
CU
PC
UP
CU
PC
UP
CU
PC
UP
N
3.0
m
3.0 m
1.2 m
Figure 4-2: Plan view of large-scale test array. Li-ion battery commodity is shown as green
cartons. Open circles represent the location of ceiling-level sprinklers. Ignition location at the base of the array is shown as a red star.
4.2 Automatic Sprinkler Protection Ceiling-level sprinkler protection was provided by an FM Approved sprinkler with a K-factor of
320 L/min/bar½ (22.4 gpm/psi½). The sprinkler was of pendent type, with a 74oC (165oF) temperature
rating and a nominal RTI of 27.6 m½s½ (50 ft½s½). A nominal operating pressure of 2.4 bar (35 psig)
provided a discharge of 500 L/min (133 gpm) per sprinkler, resulting in a 53 mm/min (1.3 gpm/ft2) water
density.

FM Global PUBLIC RELEASE
24
Sprinklers were located on 3.0 m × 3.0 m (10 ft × 10 ft) spacing. In accordance with FM Global Property
Loss Prevention Data Sheet 2-0, Installation Guidelines for Automatic Sprinklers [27], each sprinkler was
installed with the heat-sensing link 0.43 m (17 in.) below the ceiling and was oriented with the sprinkler
frame arms parallel to the sprinkler pipe. Consistent with FM Global standard procedures for a large-
scale fire test, each the sprinkler’s heat-sensing link was facing towards the north.
4.3 Ignition Ignition was achieved with two FM Global standard half igniters, which are 76 mm x 76 mm (3 in. x 3 in.)
cylinders of rolled cellu-cotton. Each igniter is soaked in 118 ml (4 oz.) of gasoline and sealed in a plastic
bag, Figure 4-3. The igniters were placed in an offset ignition orientation, 0.6 m (2 ft) east of center, in
the center transverse flue, between the uprights, of the eastern row of the main array. The igniters were
lit with a flaming propane torch at the start of each test and the fires were allowed to develop naturally.
Figure 4-3: Igniter locations within the rack, located at the rack uprights. (representative image shown)
4.4 Documentation and Instrumentation Documentation for each test included video, still photography, and pertinent measurements necessary
to evaluate sprinkler performance. All instrumentation was calibrated in accordance with ISO 17025
[23].
Environmental conditions, including relative humidity, dry-bulb temperature, and wet-bulb temperature
of the air inside and outside of the lab, were measured just prior to the test as well as continuously
during the test. In addition, the following standard instrumentation was installed:
Sprinkler protection was provided at 49 locations at the ceiling. Each sprinkler had its operating
mechanism included in an electric circuit to determine operation times.
Bare-bead, 0.8 mm (20-gage), chromel-alumel thermocouples, placed 165 mm (6-1/2 in.) below
the ceiling at 125 locations. These thermocouples have been shown to have a response time
index (RTI) of 8 ± 1 m1/2s1/2 (14.5 ± 1.8 ft1/2s1/2).

FM Global PUBLIC RELEASE
25
Bi-directional probes to measure ceiling jet velocity immediately below the ceiling. Probes were
located at four orthogonal locations with radial distances from the ceiling center of 2.1 m and
4.0 m (7 ft and 13 ft) [at 0.12 m (0.4 ft) below the ceiling], and 10.4 m (34 ft) [at 0.46 m (1.5 ft)
below the ceiling]. These measurements are available for future analysis but are not discussed in
this report.
Thermocouples imbedded in a cross-shaped steel angle, made from two 51 mm wide x 610 mm
long x 6 mm thick (2 in. x 24 in. x 0.25 in.) angle iron segments, attached to the center of the
ceiling. Measurements from these thermocouples are referred to as steel temperatures.
Flow meters and pressure controllers to monitor and control the sprinkler system.
Combustion gases within the FPC duct were measured with non-dispersive infrared (NDIR) CO
and CO2 gas analyzers to measure the generation of carbon monoxide and carbon dioxide; a
paramagnetic O2 analyzer to measure depletion of oxygen; a flame ionization detector (FID)
total hydrocarbon (THC) analyzer to measure the release of volatile organic compounds (VOC) as
equivalent methane. THC measurements are available for future analysis but are not discussed
in this report.
Front Elevation View of Instrumentation
(Pallets South of Central Transverse Flue)
Plan View of Third Carton Level
(1st
, 2nd
, and 3rd
Tier Commodity)
Wood Pallet
Wood PalletWood Pallet
Wood Pallet
N
Thermocouple located between battery
cartons, 150 mm from edge facing central
transverse flue
Ignition location
Figure 4-4: Thermocouple locations used during the large-scale test.
Eighteen thermocouples were used to monitor internal heating of the commodity during the fire
test. Each thermocouple was a Type K, grounded junction, 1.6 mm (0.625 in.) diameter,
sheathed, chromel-alumel thermocouple. The thermocouples were located 150 mm (6 in.) in
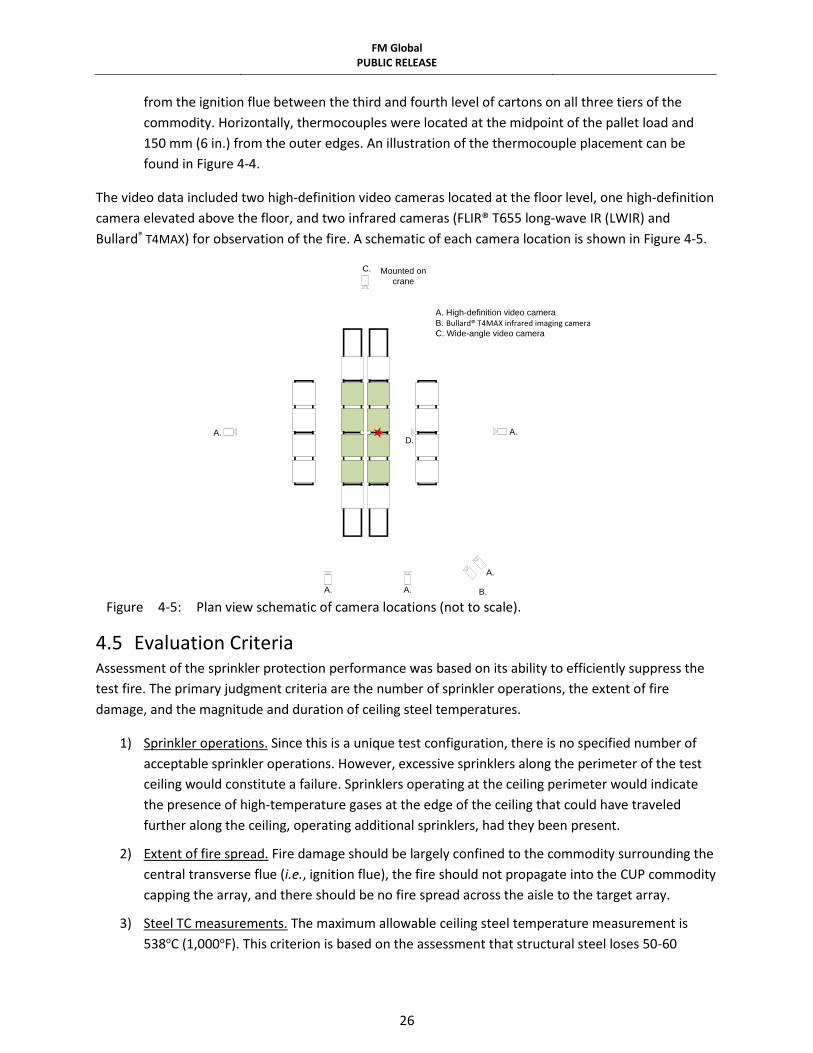
FM Global PUBLIC RELEASE
26
from the ignition flue between the third and fourth level of cartons on all three tiers of the
commodity. Horizontally, thermocouples were located at the midpoint of the pallet load and
150 mm (6 in.) from the outer edges. An illustration of the thermocouple placement can be
found in Figure 4-4.
The video data included two high-definition video cameras located at the floor level, one high-definition
camera elevated above the floor, and two infrared cameras (FLIR® T655 long-wave IR (LWIR) and
Bullard® T4MAX) for observation of the fire. A schematic of each camera location is shown in Figure 4-5.
A.
B.
A. High-definition video camera
B. Bullard® T4MAX infrared imaging cameraC. Wide-angle video camera
C. Mounted on
crane
A.
A.
D.A.
A. Figure 4-5: Plan view schematic of camera locations (not to scale).
4.5 Evaluation Criteria Assessment of the sprinkler protection performance was based on its ability to efficiently suppress the
test fire. The primary judgment criteria are the number of sprinkler operations, the extent of fire
damage, and the magnitude and duration of ceiling steel temperatures.
1) Sprinkler operations. Since this is a unique test configuration, there is no specified number of
acceptable sprinkler operations. However, excessive sprinklers along the perimeter of the test
ceiling would constitute a failure. Sprinklers operating at the ceiling perimeter would indicate
the presence of high-temperature gases at the edge of the ceiling that could have traveled
further along the ceiling, operating additional sprinklers, had they been present.
2) Extent of fire spread. Fire damage should be largely confined to the commodity surrounding the
central transverse flue (i.e., ignition flue), the fire should not propagate into the CUP commodity
capping the array, and there should be no fire spread across the aisle to the target array.
3) Steel TC measurements. The maximum allowable ceiling steel temperature measurement is
538oC (1,000oF). This criterion is based on the assessment that structural steel loses 50-60

FM Global PUBLIC RELEASE
27
percent of its load-bearing strength upon reaching the 538oC (1,000oF) threshold [28, 29]. The
loss of strength could cause failure of the ceiling structure resulting in collapse of the roof.
Values in excess of these thresholds during a test are taken as an indication of ineffective fire
protection.
4.6 Test Results and Data Analysis A summary of the test conditions and results is shown in Table 4-1. A single sprinkler operated at 1 min
30 s (90 s) after ignition and suppressed the fire. Fire damage remained within the confines of the array
and there was no jump to the target commodity. The results in terms of fire damage, steel
temperatures, and number of sprinkler operations were within levels specified in Section 4.5 indicating
that the sprinkler system provided adequate protection.
Table 4-1: Large-scale fire test setup summary
Test Configuration and Results Value
Test Configuration
Commodity Cartoned 20 Ah Li-ion batteries
Main array dimensions [pallet loads] 6 x 2 x 3
Target array dimensions [pallet loads] 4 x 1 x 3
Flue width, nominal [m (ft)] 0.15 (0.5)
Aisle width [m (ft)] 1.2 (4)
Storage height [m (ft)] 4.6 (15)
Ceiling height [m (ft)] 12.2 (40)
Main array located below - number of sprinklers 1
Ignition location relative to rack offset
Sprinkler response, nominal [RTI, m1/2s1/2 (ft1/2s1/2)] 27.6 (50)
Sprinkler rating [oC (oF)] 74 (165)
Sprinkler K-factor [L/min/bar1/2 (gpm/psi1/2)] 53 (22.4)
Sprinkler discharge pressure [bar (psi)] 2.4 (35)
Sprinkler spacing [m × m (ft × ft)] 3 × 3 (10 × 10)
Test Results
Sprinkler Operations 1
Total Chemical Energy Released [MJ (BTU x 103)] 100 ± 5 (90 ± 5)
Consumed Commodity [pallet load equivalent] < 1
Target Jump (west only) @ Time [min:s] No
Maximum Steel Temperature [oC (oF)] @ Time [min:s] 32oC (90oF) @ 1 min 30 s
Test Termination [min:s] 40:00

FM Global PUBLIC RELEASE
28
4.6.1 Test Images From the fire test images shown in Figures 4-6 and 4-7 it can be seen that the fire within the central
transverse flue reached the top of the array by 30 s after ignition. The fire continued to grow and at
1 min (60 s) flames extended approximately 1.5 m (5 ft) above the array. The sprinkler centered over the
main array operated at 1 min 30 s (90 s) as flames were spreading across the aisle face of the
commodity on the second and third tier, as well as across the longitudinal flue. By 2 min (120 s) the fire
was contained within the array, though involvement of the commodity on either side of the central
transverse flue on the first and second tiers persisted until approximately 2 min 30 s (150 s). The test
was conducted for 40 min (2,400 s) and required only minimal manual firefighter intervention to
extinguish a few lingering deep-seated flames.
The extent of damage to the test array is shown in Figure 4-8. All three tiers of commodity surrounding
ignition in the central transverse flues were heavily damaged. The top left image shows the damage
sustained to the east (aisle) face of the main array. The top right image shows the corresponding
damage to the commodity across the longitudinal flue after the east commodity was removed. In both
images, a portion of the cartons was charred or consumed allowing involvement of the internal plastic
dividers and batteries in the fire. Examples of the damage sustained by the commodity on either side of
the central transverse flue, adjacent to ignition, are shown in the bottom right image for the first tier
and bottom left image for the second tier.
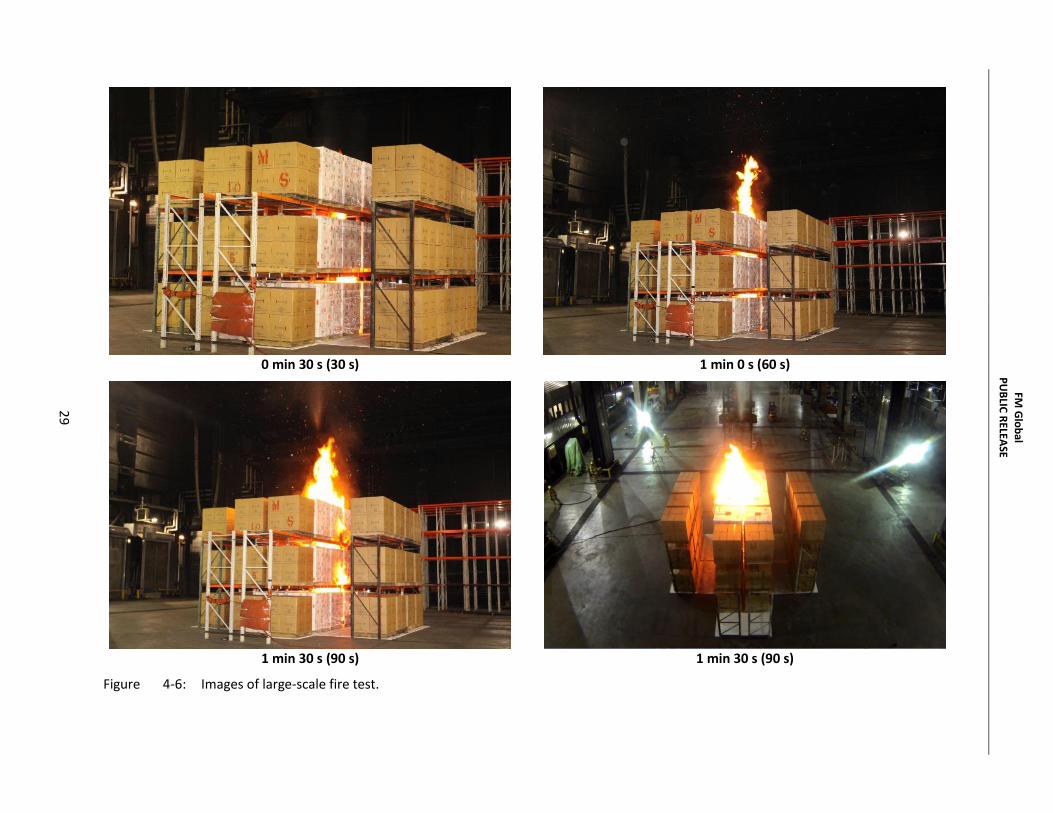
FM Global PUBLIC RELEASE
29
0 min 30 s (30 s) 1 min 0 s (60 s)
1 min 30 s (90 s) 1 min 30 s (90 s)
Figure 4-6: Images of large-scale fire test.
29
FM G
lob
al
PU
BLIC
RELEA
SE
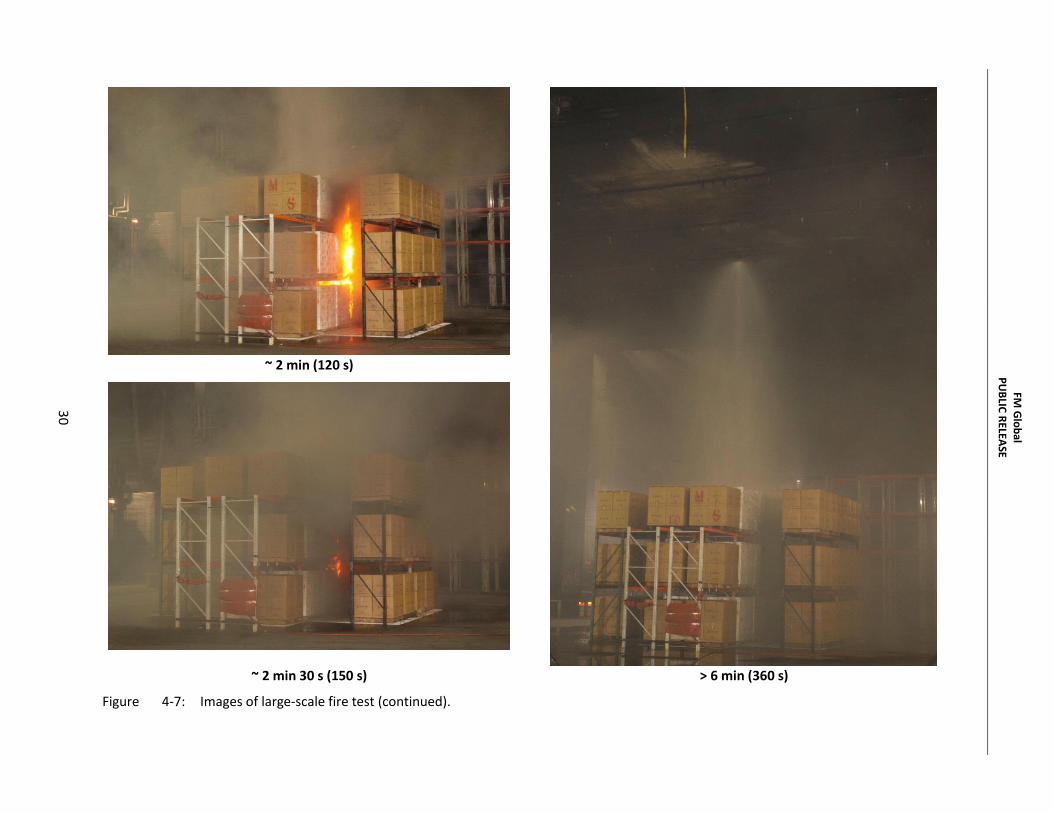
FM Global PUBLIC RELEASE
30
~ 2 min (120 s)
~ 2 min 30 s (150 s) > 6 min (360 s)
Figure 4-7: Images of large-scale fire test (continued).
30
FM G
lob
al
PU
BLIC
RELEA
SE

FM Global PUBLIC RELEASE
31
East (aisle) face of main array Commodity across longitudinal flue
First tier ignition flue Pallet load from second tier ignition flue
Figure 4-8: Post-test images showing extent of damage to test commodity.
31
FM G
lob
al
PU
BLIC
RELEA
SE

FM Global PUBLIC RELEASE
32
4.6.2 Sprinkler Operations and Area of Commodity Damage A plan view of the sprinkler operation pattern is presented in Figure 4-9. A single sprinkler, centered
over the main array, operated at 1 min 30 s (90 s) and suppressed the fire. The approximate extent of
commodity damage is shown in the figure by the shaded areas. Damage was primarily limited to the
ignition flue with some lateral fire spread along the sides of the pallet loads facing the longitudinal flue
and the aisle space. Charring of the cartons facing the open inner core of the pallet loads on the second
and third tiers was also observed.
CU
PC
UP
CU
PC
UP
CU
PC
UP
CU
PC
UP
CU
PC
UP
CU
PC
UP
Figure 4-9: Sprinkler operation pattern and commodity damage.
4.6.3 Energy Release Figure 4-10 presents the convective heat release rate and total integrated chemical energy produced
during the large-scale test. The convective heat release rate was estimated by applying the ceiling gas
temperature measurements made immediately below the fire test ceiling to fire plume and ceiling layer
correlations [30]. While not as accurate as the measurements made with the FPC for the Reduced-
Commodity test (Section 3.3.1), the estimated convective HRR provides a reasonable approximation of
the real-time fire development up to sprinkler operation. Convective measurements can be significantly
impacted by cooling from a sprinkler discharge and therefore may not reflect the heating condition
within the test array. For example, cooling of the fire plume gases above the test array or wetting of
thermocouples used to measure ceiling gas temperatures can occur even though the fire is still present
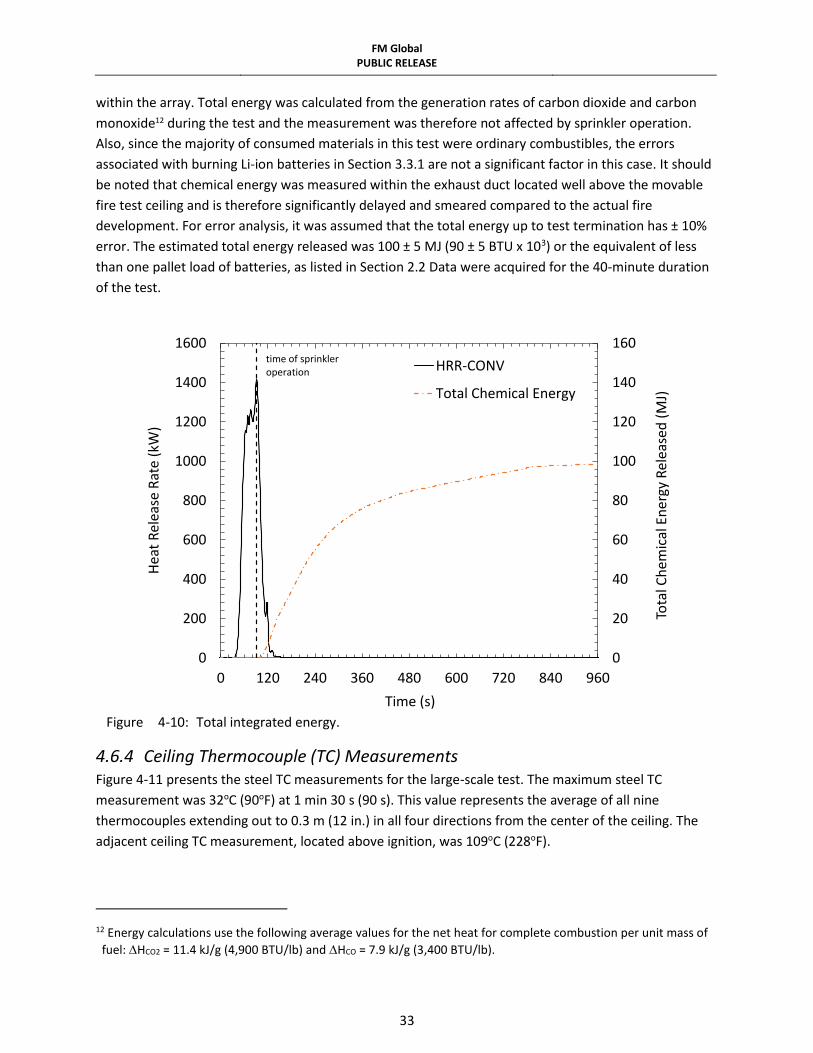
FM Global PUBLIC RELEASE
33
within the array. Total energy was calculated from the generation rates of carbon dioxide and carbon
monoxide12 during the test and the measurement was therefore not affected by sprinkler operation.
Also, since the majority of consumed materials in this test were ordinary combustibles, the errors
associated with burning Li-ion batteries in Section 3.3.1 are not a significant factor in this case. It should
be noted that chemical energy was measured within the exhaust duct located well above the movable
fire test ceiling and is therefore significantly delayed and smeared compared to the actual fire
development. For error analysis, it was assumed that the total energy up to test termination has ± 10%
error. The estimated total energy released was 100 ± 5 MJ (90 ± 5 BTU x 103) or the equivalent of less
than one pallet load of batteries, as listed in Section 2.2 Data were acquired for the 40-minute duration
of the test.
Figure 4-10: Total integrated energy.
4.6.4 Ceiling Thermocouple (TC) Measurements Figure 4-11 presents the steel TC measurements for the large-scale test. The maximum steel TC
measurement was 32oC (90oF) at 1 min 30 s (90 s). This value represents the average of all nine
thermocouples extending out to 0.3 m (12 in.) in all four directions from the center of the ceiling. The
adjacent ceiling TC measurement, located above ignition, was 109oC (228oF).
12 Energy calculations use the following average values for the net heat for complete combustion per unit mass of
fuel: HCO2 = 11.4 kJ/g (4,900 BTU/lb) and HCO = 7.9 kJ/g (3,400 BTU/lb).
0
20
40
60
80
100
120
140
160
0
200
400
600
800
1000
1200
1400
1600
0 120 240 360 480 600 720 840 960To
tal C
hem
ical
En
ergy
Rel
ease
d (
MJ)
Hea
t R
elea
se R
ate
(kW
)
Time (s)
HRR-CONV
Total Chemical Energy
time of sprinkler operation
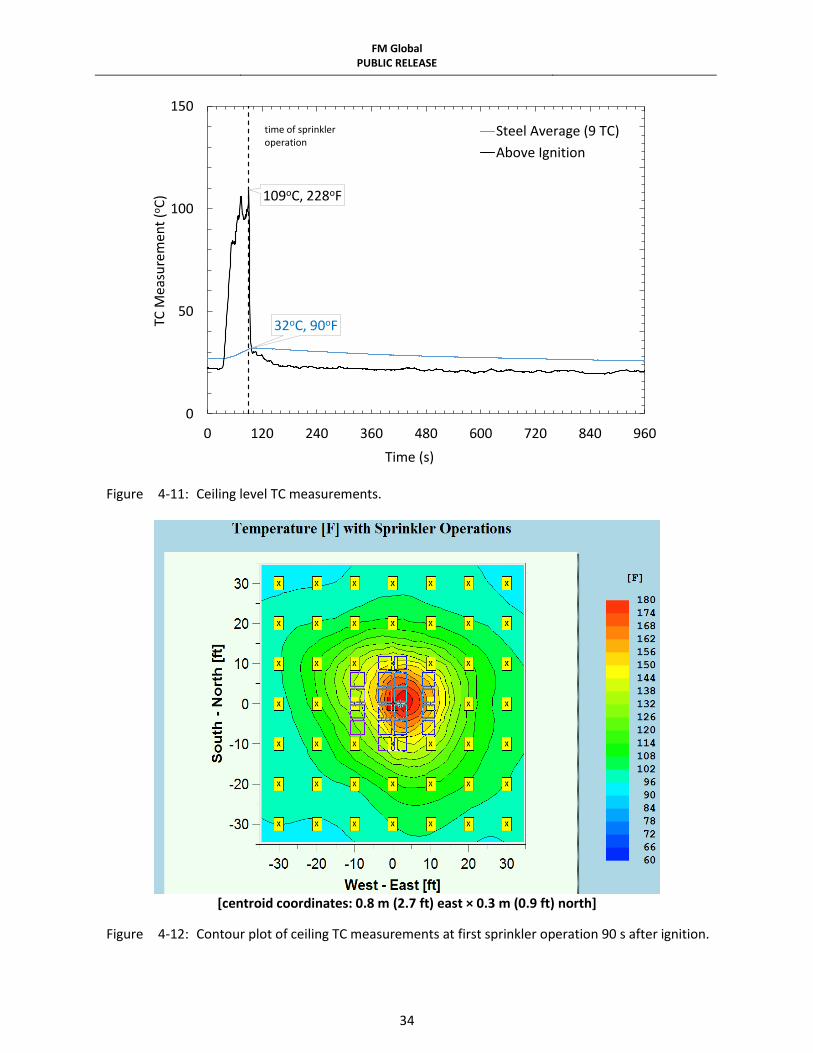
FM Global PUBLIC RELEASE
34
Figure 4-11: Ceiling level TC measurements.
[centroid coordinates: 0.8 m (2.7 ft) east × 0.3 m (0.9 ft) north]
Figure 4-12: Contour plot of ceiling TC measurements at first sprinkler operation 90 s after ignition.
32oC, 90oF
109oC, 228oF
0
50
100
150
0 120 240 360 480 600 720 840 960
TC M
easu
rem
ent
(oC
)
Time (s)
Steel Average (9 TC)
Above Ignition
time of sprinkler operation

FM Global PUBLIC RELEASE
35
Figure 4-12 presents the ceiling TC measurement contours at first sprinkler operation. The
corresponding location of the ceiling gas centroid was 0.8 m (2.7 ft) east × 0.3 m (0.9 ft) north, which
coincides with the ignition location. The alignment of the centroid with the ignition location indicates
the fire plume was centered over ignition.
4.6.5 Evaluation of Internal Heating Internal heating of the commodity was measured on all three tiers. As illustrated in Figure 4-4,
thermocouples were located in the pallet loads on the south side of the central transverse flue on both
the east and west side of the longitudinal flue.
Figure 4-13 presents the thermocouple measurements acquired during the large-scale fire test. A legend
is provided to describe the thermocouple locations within the test array. Notable data series are
additionally labeled using the following convention: tier number (T#), east or west pallet load (EP/WP),
and horizontal position of west, center, or east (W/C/E). For example, T1-EP-W references the first tier,
east row, west horizontal thermocouple location.
Unlike the Reduced-Commodity test, which was a free-burn fire, the convective heat release rate is not
included in Figure 4-13 for reference to the time evolvement of the fire. In a sprinklered test, convective
measurements can be significantly impacted by cooling from the discharged water and therefore may
not reflect the heating condition within the test array.
The peak TC measurement of 83oC (180oF) was recorded on tier 1, east pallet load, center location
(T1-EP-C) at 2 min 40 s (160 s) after ignition. This location was adjacent to ignition and shows the
prolonged heating of the commodity due to the sustained fire within the ignition flue after the sprinkler
operated at 1 min 30 s (90 s). Elevated measurements were also observed in the commodity in the east
row surrounding ignition at T2-EP-W, T2-EP-C, and T1-EP-W.
It is notable that wetting of the TCs can be observed from the reduction of the measurement from a
nominal ambient value of 25oC (77oF) to 19oC (66oF). Wetting was more prevalent on the upper two
tiers, which is consistent with post-test observations where significant water infiltration into the cartons
was noted during test cleanup.
No TC measurements were observed to exceed the threshold temperature of 180oC (356oF), which was
used for the Reduced-Commodity test to represent the oxidation temperature of electrolyte that results
in a high-rate runaway reaction (peak rates > 100oC/min) [9]. However, since these thermocouples are
located between cartons, not directly attached to the batteries, the actual temperature of the batteries
could have been significantly higher. Visual observations of batteries damaged during the test were
made during cleanup suggesting that the carton packaging was insulating the thermocouples from the
heat released by the batteries.

FM Global PUBLIC RELEASE
36
0
50
100
150
200
0 120 240 360 480 600
TC M
easu
rem
ent
(oC
)
Time (s)
East East
Center Center
West West
blank blank
East East
Center Center
West West
blank blank
East East
Center Center
West West
Tier 3West Pallet East Pallet
Tier 2West Pallet East Pallet
Tier 1West Pallet East Pallet
T1-EP-C
T2-EP-C
T2-EP-W
T1-EP-W
Figure 4-13: Internal heating of commodity using TCs located within the test commodity.

FM Global PUBLIC RELEASE
37
5. Supplemental Experimental Evaluations
Two supplemental experimental evaluations were conducted to address the potential for battery-to-
battery fire spread. Section 5.1 considers an internal ignition scenario, where thermal runaway of a
battery propagates to adjacent batteries. Section 5.2 evaluates the effectiveness of the sprinkler
protection at suppressing a fire at a later stage of battery involvement than was achieved in the large-
scale test.
5.1 Internal Ignition Four fire tests have been conducted to establish a reliable and consistent method for assessing the
potential to induce internal ignition of a pallet load of batteries. For this purpose, internal ignition refers
to a cascading effect where thermal runaway of one or more batteries propagates to the batteries
within adjacent cartons, without causing an external fire. Images of each test are shown in Figure 5-1
and descriptions of each test are as follows:
For the first test, a single battery was placed on top of a metal surface that was heated from
below with a propane burner. Thermal runaway of the battery was observed as an expansion of
the pouch battery due to conductive heating. The severity of the heating resulted in rupture of
the seams along the edges of the battery and an errant propane flame (from the heating source)
ignited the escaped electrolyte.
The second test consisted of a single battery heated to 343oC (650oF) via a foil heater affixed to
both sides of the battery. Thermal runaway began within five minutes of exposure. The battery
pouch expanded; however, the seams did not rupture and no fire occurred.
For the third test, foil heaters were again used to overheat one battery within a carton (which
contained 20 batteries). Limiting the space for the battery pouch to expand resulted in breach of
the seams and leaked electrolyte was observed as a discoloration of the carton. At the
completion of a 2-hour heating period, thermal runaway occurred in only three batteries: the
battery with the heaters was heavily damaged, while the adjacent batteries above and below
were partially expanded. The polystyrene plastic dividers were softened but not charred.
The fourth test was a repeat of the third test, except ignition of the flammable gases outside of
the carton was achieved with a propane pilot flame after a 1-hour heating period. The carton of
batteries burned to completion with a peak heat convective HRR of ~ 30 kW.
From these tests it can be concluded that thermal runaway of the polymer pouch battery used in this
project does not result in battery-to-battery propagation within a carton. It is therefore reasonable to
assume that thermal runaway of one or more batteries within a single carton will not propagate to
batteries within an adjacent carton. Thus an external fire, possibly initiated by ignition of escaping
electrolyte, is necessary to spread the fire beyond the carton where a thermal runaway occurs. Once an
external fire is present, flame propagation along the carton results in a similar fire development to the
external ignition scenario.

FM Global PUBLIC RELEASE
38
Test
1
Expansion of the battery pouch
Burning of electrolyte (with pilot flame)
Test
2
Undamaged battery pouch
Expansion of battery pouch
Test
3
Discoloration of carton from electrolyte
Contents of carton after 2 hr heat exposure
Test
4
Ignition of carton after 1 hr heat exposure
Fully developed fire
Figure 5-1: Photos of internal ignition evaluation tests. It is also worth noting that there is not enough air within a carton to burn a single battery. Each battery
(used in this project) contains 34 g (0.07 lb) of electrolyte. Using diethyl carbonate as a representative
electrolyte component, the stoichiometric equation and air-to-fuel ratio can be quantified as shown in
Eqs. 1 and 2. Assuming an air density of 1.2 kg/m3 (0.075 lb/ft3) combustion of each battery requires
0.2 m3 (7.1 ft3) of air. Each carton has dimensions of 0.43 m × 0.33 m × 0.15 m (16.75 in. × 12.8 in. ×
5.75 in.), or an empty volume of 0.02 m3 (0.7 ft3), which provides an order of magnitude less air than
needed to burn a single battery.
C5H10O3 + 6 (O2 + 3.76 N2) → 5 CO2 + 5 H2O + 22.6 N2 Eq. 1

FM Global PUBLIC RELEASE
39
𝐴𝐹 = 𝑚𝑎𝑖𝑟
𝑚𝑓𝑢𝑒𝑙=
6 𝑚𝑜𝑙 (32 𝑔 𝑚𝑜𝑙⁄ +3.76 ×28 𝑔 𝑚𝑜𝑙⁄ )
1 𝑚𝑜𝑙 ×118 𝑔 𝑚𝑜𝑙⁄= 7
𝑔
𝑔 Eq. 2
The conclusion that an external fire is necessary to propagate battery involvement to adjacent cartons
can also be reasonably applied to hard-cased Li-ion batteries, where rupture can be accompanied by
spattered molten aluminum and other ignition sources. In 2010, Webster studied the process of battery-
to-battery propagation in a carton containing one hundred 18650 cylindrical Li-ion batteries [31]. A
single battery was removed from the carton and replaced with an electric cartridge heater. During that
test, it was noted that the carton caught fire before the batteries adjacent to the heater experienced
thermal runaway. Webster conducted a larger version of this test in 2012, involving 50 cartons (5,000
batteries) stacked in a 2 × 4 × 6 arrangement [32]. Overheating of the adjacent batteries resulted in
thermal runaway and ignition of the released flammable gas outside of the carton. Subsequent spread
of the fire to adjacent cartons occurred due to the external fire.
5.2 Later Stage Suppression Test An intermediate-scale suppression evaluation using the water application apparatus was conducted to
determine the effectiveness of applied water at suppressing a battery fire. Since this test does not rely
on sprinkler response, water application can be delayed to a later stage of battery involvement than can
be achieved during the large-scale fire test. The combination of the intermediate- and large-scale tests
confirms that sprinklers can protect a growing rack storage fire, as well as a developed battery fire.
Test Design and Method
The pallet design for the intermediate-scale suppression test is shown in Figure 5-2. The design consists
of 21 cartons, arranged 3 wide x 1 deep x 7 high, resulting in dimensions of 0.97 m × 0.43 m. × 1.0 m
(38.3 in. × 16.75 in. × 40.25 in.). A metal liner was fabricated to fill the remaining portion of the pallet,
with dimensions of 1.1 m × 0.64 m × 1.0 m (42 in. × 25.25 in. × 40.25 in.).
The later stage suppression evaluation consisted of two tests, as shown in Figure 5-3. Test 1 involved a
single pallet load to represent thermal runaway of a carton facing the aisle of a rack storage
arrangement. Test 2 involved two pallet loads to represent thermal runaway of a carton facing the flue
of a rack storage arrangement. In both cases, thermal runaway was induced in a battery centrally
located within a carton using foil heaters as shown in Figure 5-4. The ‘ignition carton’ was located at the
middle of the bottom stack of the pallet load. A propane pilot flame was offset ~25.4 mm (1 in.) from
the face of the carton to ignite flammable gas that escaped from the carton.
Water application began after carton surfaces on the ignition side of the pallet were consumed. This
approach improved the potential that the batteries are contributing to the overall severity of the fire.
Water was applied using the water application apparatus (WAA), which provides a uniform water flux to
the top surface of an object [33], at a density13 of 12 mm/min (0.3 gpm/ft2). While water applied from
13 Note that the critical delivered flux to 3.0 m (10 ft) high rack storage of cartoned commodities ranges from 7.3 mm/min (0.18 gpm/ft2) for CUP to 11 mm/min (0.26 gpm/ft2) for CEP.
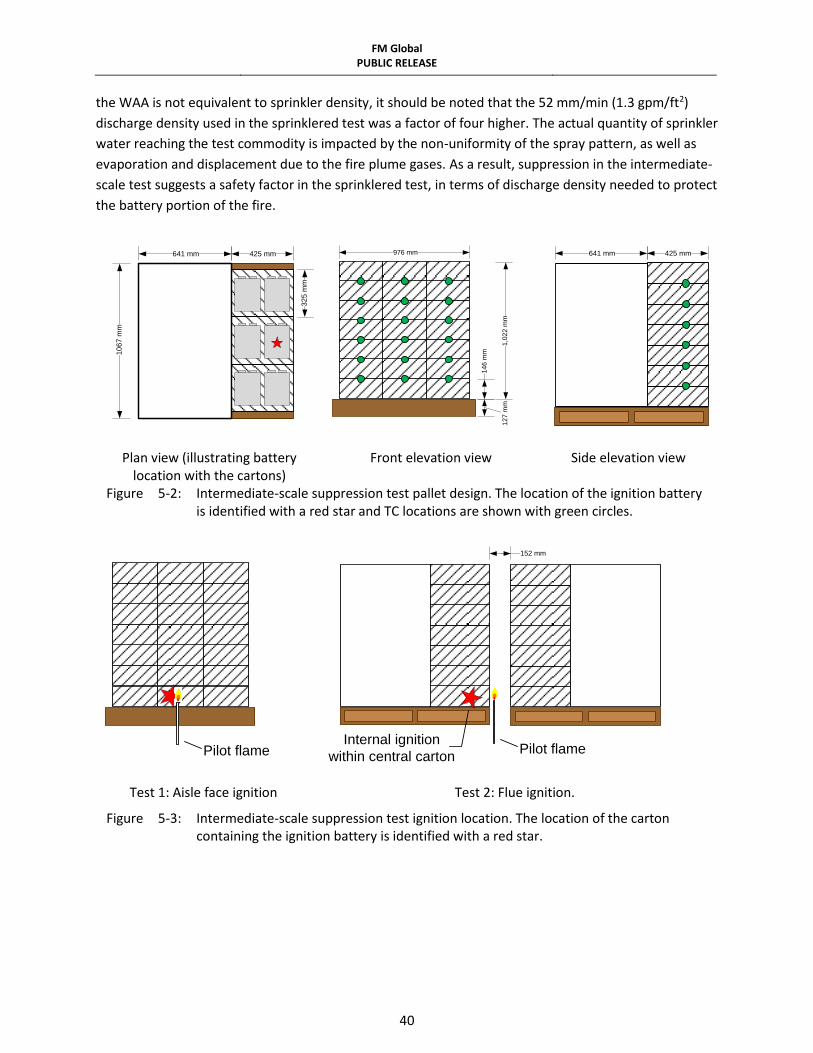
FM Global PUBLIC RELEASE
40
the WAA is not equivalent to sprinkler density, it should be noted that the 52 mm/min (1.3 gpm/ft2)
discharge density used in the sprinklered test was a factor of four higher. The actual quantity of sprinkler
water reaching the test commodity is impacted by the non-uniformity of the spray pattern, as well as
evaporation and displacement due to the fire plume gases. As a result, suppression in the intermediate-
scale test suggests a safety factor in the sprinklered test, in terms of discharge density needed to protect
the battery portion of the fire.
425 mm641 mm
10
67
mm
32
5 m
m
12
7 m
m
14
6 m
m
1,0
22
mm
976 mm
641 mm 425 mm
Plan view (illustrating battery location with the cartons)
Front elevation view Side elevation view
Figure 5-2: Intermediate-scale suppression test pallet design. The location of the ignition battery is identified with a red star and TC locations are shown with green circles.
Pilot flame
152 mm
Pilot flameInternal ignition
within central carton
Test 1: Aisle face ignition Test 2: Flue ignition.
Figure 5-3: Intermediate-scale suppression test ignition location. The location of the carton containing the ignition battery is identified with a red star.

FM Global PUBLIC RELEASE
41
Figure 5-4: Photos of heater placement within ignition carton. Left photo shows a foil heater affixed to a battery on the fifth level (of ten levels) within the carton. Right photo shows the heater wiring exiting the carton.
5.2.1 Suppression Test 1: Aisle Face Ignition The first suppression test was conducted using a single pallet load to represent ignition of an aisle-facing
carton. Photos of the test are shown in Figure 5-5. The foil heaters were set to 340oC (650oF) and the
pilot flame was ignited at 0 min. Thermal runaway, observed as wetting of the ignition carton due to
leaked electrolyte, occurred by 10 min 30 s (630 s). No ignition of the flammable contents within the
carton occurred and at 31 min 37 s (1,897 s) the pilot ignition flame was pushed against the cartons. The
cartons ignited and by 34 min (2,040 s) flames had traveled along a narrow vertical path to the top of
the pallet load. Since the base of the pilot flame was located at the vertical midpoint of the carton, the
lower portion of the carton saturated with electrolyte did not ignite. At 46 min (2,760), a propane torch
was used to ignite the lower portion of the carton. Fire spread across the entire face of the pallet load
leading to collapse of the center stack of cartons at 49 min (2,940 s). Water application, at a rate of
12 mm/min (0.3 gpm/ft2) began at 50 min 27 s (3,027 s) and the fire was suppressed within 5 min
(300 s). The test was terminated at 60 min (3,600 s) using a garden hose to extinguish a few lingering
flames shielded by the collapsed cartons.
During post-test inspection, it was estimated that 30% of the batteries showed signs of damage. The
majority of damaged batteries was located in the area adjacent to ignition, i.e., bottom of the center
stack of cartons. Minimal damage was observed on the batteries located in the outer stacks of cartons.
In addition, the fire was generally contained to the outside portion of the cartons (towards ignition),
including all the carton surfaces on the ignition side of the pallet load, with minimal penetration to the
inside portion of the cartons (towards the metal liner).
Figure 5-6 shows the convective heat release rate as well as the predicted response of a quick-response
sprinkler located 3.0 m (10 ft) above the array (following the method described in Section 3.3.3). Water
was applied to the fire 25 s after the predicted operation time of a quick-response sprinkler, 50 min 27 s
(3,027 s) versus 50 min 2 s (3,002 s). Additional delay in the time of water application was not possible
due to collapse of the commodity. The convective HRR peaked at ~300 kW, before water application,
and a total of 25.5 MJ of convective energy was released during the test. The carton surfaces on the
ignition side of the pallet load account for 65%, i.e., 16.5 MJ, of the total energy released14. Since the
14 Using the carton dimensions and heat of combustion listed in Section 2.2 and 2.3, respectively.

FM Global PUBLIC RELEASE
42
wood pallet was not involved in the fire, the remaining energy was contributed from the plastic dividers
and batteries.
31 min 37 s – pilot flame pushed against cartons 34 min 0 s – flame spread
46 min 0 s – secondary ignition 49 min 0 s – collapse of center stack
50 min 27 s – start of water application
55 min 27 s – suppressed fire
1 hr – test termination
(before fire fighter intervention)
Figure 5-5: Photos of suppression Test 1.

FM Global PUBLIC RELEASE
43
Figure 5-6: Suppression Test 1 convective heat release rate and predicted sprinkler response.
5.2.2 Suppression Test 2: Flue Face Ignition The second suppression test was conducted using two pallet loads separated by 150 mm (6 in.) to
represent ignition of a flue-facing carton. Photos of the test are shown in Figure 5-7. The foil heaters
were set to 340oC (650oF) and the pilot flame was ignited at 0 min. Smoke was observed exiting the
carton at the penetration for the heater cables at 10 min (600 s). Thermal runaway, observed as wetting
of the ignition carton due to leaked electrolyte, occurred by 19 min (1,140 s). There was no ignition of
the flammable contents within the carton and at approximately 32 min (1,920 s) the pilot ignition flame
was pushed against the cartons. The cartons ignited and by 38 min (2,280 s) the entire flue area was
involved in the fire and flames had traveled across the tops of the cartons. Water application, at a rate
of 12 mm/min (0.3 gpm/ft2) began at 41 min 10 s (2,470 s) and the fire was largely suppressed within
5 min (300 s). The combination of fire damage and wetting of the cartons caused the stacks to lean
towards each other, which impeded the water flow to the remaining burning surfaces and resulted in a
small deep-seated fire that was not extinguished.
At 60 min (3,600 s) the water flow was turned off to evaluate the potential for reignition. As shown in
Figure 5-8, the fire slowly redeveloped and began to spread along exposed combustible material. The
test was terminated at 75 min (4,500 s) with a fire hose stream.
3002 s
3027 stime of water application
0
50
100
150
200
250
300
0
50
100
150
200
2400 2700 3000 3300 3600
Hea
t R
elea
se R
ate
(kW
)
Spri
nkl
er T
emp
erat
ure
(oC
)
Time (s)
RTI = 27.6 (m-s)^1/2
Convective HRR
sprinkler activationtemperature (74oC)
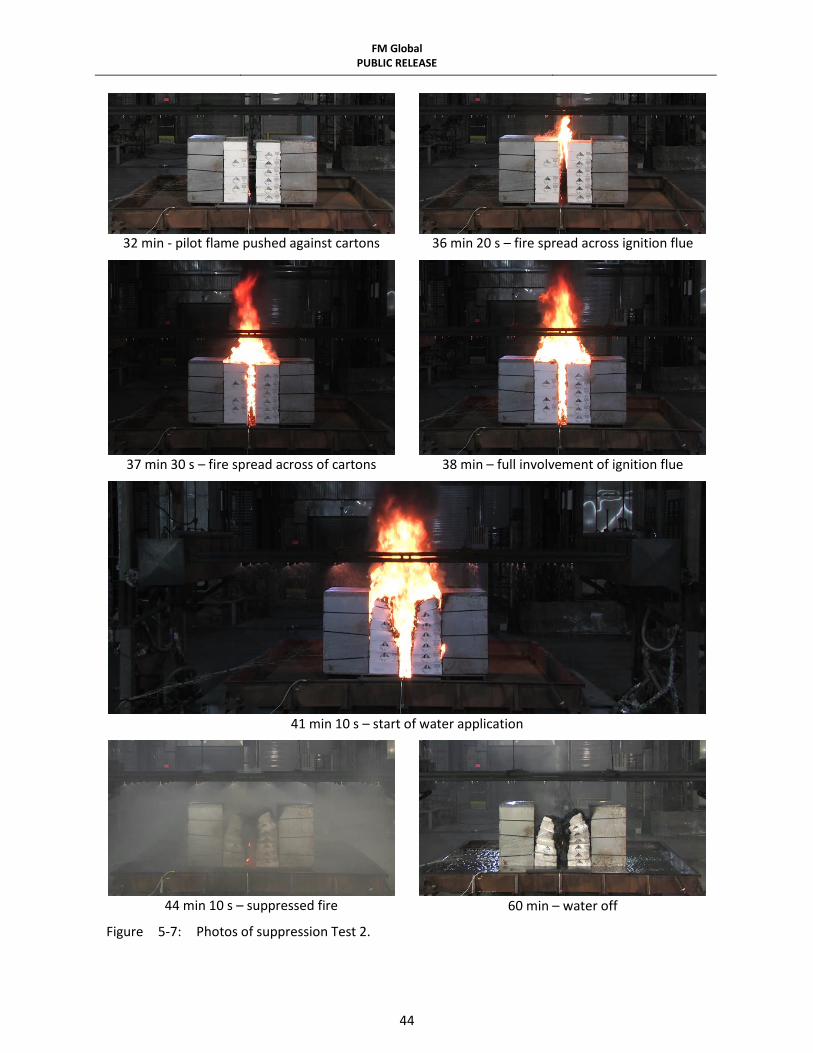
FM Global PUBLIC RELEASE
44
32 min - pilot flame pushed against cartons 36 min 20 s – fire spread across ignition flue
37 min 30 s – fire spread across of cartons 38 min – full involvement of ignition flue
41 min 10 s – start of water application
44 min 10 s – suppressed fire
60 min – water off
Figure 5-7: Photos of suppression Test 2.

FM Global PUBLIC RELEASE
45
During post-test inspection, it was estimated that at least 70% of the batteries showed signs of damage.
The most heavily damaged batteries were located in the area facing the ignition flue, though damaged
batteries were also observed on the backside of the cartons facing the non-combustible liners.
Figure 5-9 shows an example of a battery rupture that occurred well after the local fire was
extinguished. The fire had been suppressed for over 10 min before thermal runaway of a battery
resulting in a fire within the flue. The fire could not ignite the combustible material wetted by the water
discharge and the fire extinguished when the battery was consumed.
Front of array
Back of array
Figure 5-8: Photos of Test 2 reignition after shutdown of water application.
Figure 5-10 shows the convective heat release rate as well as the predicted response of a quick-response
sprinkler (following the method described in Section 3.3.3). Water was applied to the fire 2 min 48 s
(168 s) after the predicted operation time of a quick-response sprinkler, 41 min 10 s (2,470 s) versus
38 min 22 s (2,302 s). The convective HRR peaked at ~ 675 kW, before water application, and a total of
54 min 30 s – suppressed fire
56 min 10 s – battery rupture
Figure 5-9: Example photos of thermal runaway leading to battery rupture.

FM Global PUBLIC RELEASE
46
110 MJ convective energy was released during the test. The carton surfaces on the ignition side of the
pallet load account for 45%, i.e., 49 MJ, of the total energy released. Since the wood pallet was not
involved in the fire, the remaining energy was the contribution of the plastic dividers and batteries.
Figure 5-10: Suppression Test 2 convective heat release rate and predicted sprinkler responses.
5.2.3 Comparison of Internal Heating Internal heating of the commodity was measured with thermocouples located between each level of
battery cartons in the pallet load containing the internal ignition heater. As shown in Figure 5-2, 18
thermocouples were located 150 mm (6 in.) in from the ignition face of the pallet load. Horizontally,
thermocouples were located at the midpoint of the pallet load and 150 mm (6 in.) from the outer edges.
Additional description of the thermocouple type can be found in Section 3.2.
Figure 5-11 presents the thermocouple measurements acquired during Suppression Tests 1 and 2. A
legend is provided to describe the thermocouple location within the test array. Notable data series are
additionally labeled using the following convention: Level (1 through 6) and horizontal position of west,
center, or east (W/C/E). For example, L6C references the thermocouple located between the sixth and
seventh carton of center of the pallet load.
2302 s
2470 stime of water application
0
200
400
600
800
0
100
200
300
400
1800 2100 2400 2700 3000
Hea
t R
elea
se R
ate
(kW
)
Spri
nkl
er T
emp
erat
ure
(oC
)
Time (s)
RTI = 27.6 (m-s)^1/2
Convective HRR
sprinkler activationtemperature (74oC)

FM Global PUBLIC RELEASE
47
Sup
pre
ssio
n T
est
1
Sup
pre
ssio
n T
est
2
Figure 5-11: Internal heating of commodity using thermocouples located between the cartons of
the test commodity.
L1CL2C L3C
L4CL5C
L6C
0
20
40
60
80
100
120
140
160
180
2400 3000 3600
TC M
easu
rem
ent
(oC
)
Time (s)
L1S L1C L1N
L2S L2C L2N
L3S L3C L3N
L4S L4C L4N
L5S L5C L5N
L6S L6C L6N
South Center North
Level 1
Level 2
Level 3
Level 4
Level 5
Level 6 Data truncated at collapse of center stack of cartons
L1C
L2C
L3C
L4CL6C
0
20
40
60
80
100
120
0 600 1200 1800 2400 3000 3600 4200 4800
TC M
easu
rem
ent
(oC
)
Time (s)
L1S L1C L1N
L2S L2C L2N
L3S L3C L3N
L4S L4C L4N
L5S L5C L5N
L6S L6C L6N
South Center North
Level 1
Level 2
Level 3
Level 4
Level 5
Level 6
L5C erroneous, not shown

FM Global PUBLIC RELEASE
48
For Suppression Test 1, a maximum temperature of 756oC (1,390oF) was recorded by L4C at 50 min 25 s
(3,025 s) after ignition. A similar response was seen for other thermocouples located within the center
stack of cartons. This spike in temperature coincided with collapse of the center stack, which exposed
the thermocouple to combustion gases, and was likely not related to widespread thermal runaway of
the batteries within the cartons. Since these measurements no longer represent the heating condition
within the cartons, the data series for the thermocouples within the center stack have been truncated at
the time of collapse, i.e., 49 min (2,940 s). The remainder of thermocouples located at the outer stack of
cartons recorded peak temperature that were nominally consistent with ambient temperature.
For Suppression Test 2, a maximum temperature of 103oC (217oF) was recorded by L6C at 41 min 04 s
(2,464 s) after ignition. In general, higher temperatures were recorded at center stack of cartons
compared to the outer stacks. However, all thermocouples measured peak temperatures that were
elevated above ambient temperature. The reduced peak temperatures measured in Suppression Test 2
compared to Suppression Test 1, 103oC (217oF) versus 756oC (1,390oF), is due to the increased stability
of the cartons. Without collapse of the cartons, the thermocouples were not directly exposed to
combustion gases.
The combined results of Suppression Test 1 and 2 indicate that heat transfer between cartons is slow,
even in the presence of a large fire. The insulating properties of the cartons and the plastic dividers
effectively inhibit the fire development and delay battery involvement in the fire.
FM Global PUBLIC RELEASE
49
6. Discussion
6.1 Pre-wetting of Adjacent Combustibles Automatic sprinkler protection can prevent fire spread by pre-wetting adjacent combustibles. This
mechanism is particularly important for deep-seated fires where sprinkler water may not able to reach
burning materials. In the case of cartoned Li-ion batteries, battery-to-battery thermal propagation can
occur inside a carton even after the fire has been extinguished. The obvious questions is then, how
much pre-wetting is needed to prevent fire spread after the fire has been initially suppressed? The
discussion below addresses this question.
Thumuluru and Xin studied the effect of pre-wetting on fire propagation along corrugated board
surfaces [34]. Experiments were conducted using a 2.4 m (8 ft) tall parallel panel apparatus to represent
conditions of a rack storage fire, Figure 6-1 (left). The fuel load consisted of three layers of double-wall
corrugated board attached to non-combustible panel walls that were located on either side of a 0.3 m
(12 in.) wide propane sand burner.
Using a range of ignition sizes and water flow rates, a critical water flow rate beyond which the fire
would no longer spread along the corrugated board was identified. Figure 6-1 (right) shows the total
heat released over a 450 s period for ignition fire sizes of 48, 66, and 99 kW. It was found that a critical
water flow rate of 12 g/m/s (0.005 gpm/in.) was sufficient to prevent flame spread for all fire sizes
tested.
While not a parameter of the study, the critical water flow rate applied to the top of the fuel array is
also a function of the wall height exposed to the ignition fire. As the wall height increases, the quantity
of water reaching the base of the ignition fire will decrease due to evaporation. In the context of pre-
wetting, the height of the exposed wall used by Thumuluru and Xin [34] is greater than the height of a
single carton, or pallet load, of batteries. Thus the critical water flow rates of their work can be
reasonably applied to the battery reignition scenario.
Pre-wetting water flow rates expressed as mass flow rate per lateral width (g/m/s [gpm/in.]) can be
roughly compared to volumetric flow rate per unit area (mm/min [gpm/ft2]), i.e., sprinkler density, by
assuming that water applied to the top of a pallet load does not accumulate and flows uniformly to the
sides of the pallet load [35]. Using the dimensions of an FM Global standard pallet load, 1 g/m/s (4.05 x
10-4 gpm/in.) converts to 0.2 mm/min (0.005 gpm/ft2). As noted in Section 5.2, direct comparison
between sprinkler density and flow rate per unit area is not possible due to the non-uniformity of a
typical sprinkler discharge pattern, evaporation and displacement of discharged water due to the fire
plume gases, and evaporation of water flow along the commodity surfaces.
Following the commodity classification protocol, Xin and Tamanini [33] reported critical delivered water
flux (CDF) values for 3.0 m (10 ft) high rack storage of cartoned commodities ranging from 7.3 mm/min
(0.18 gpm/ft2) for cartoned unexpanded plastic (CUP) to 11 mm/min (0.26 gpm/ft2) for cartoned
expanded plastic (CEP) [33]. Discounting differences in the test configurations, the critical pre-wetting

FM Global PUBLIC RELEASE
50
flow rate of 12 g/m/s (0.005 gpm/in.) noted above, i.e., 2.4 mm/min (0.06 gpm/ft2), is on the order of
one third of the CDF values. This result is consistent with the conclusions of Thumuluru and Xin [34] who
argued that less water is needed to prevent fire spread than to control or suppress a growing fire.
With respect to the present project, adequate protection of a large-scale battery fire was accomplished
with a 53 mm/min (1.3 gpm/ft2) sprinkler density. Reducing the water density delivered to the top of the
commodity by half to account for the non-uniformity of the sprinkler discharge pattern, the
corresponding pre-wetting flow rate of 130 g/m/s (0.05 gpm/in) is a factor of 10 larger than the critical
pre-wetting flow rate determined by Thumuluru and Xin [34]. While there is no direct comparison
between pre-wetting flow and sprinkler density, it is reasonable to assume that reignition of the
batteries within a carton will not lead to fire spread over adjacent cartons once sprinklers are
discharging water.
Figure 6-1: Photo demonstrating the fire spread in a parallel panel configuration (left) and plot of overall heat released as a function of the water flow rate for various ignition sizes (right). Courtesy of Thumuluru and Xin.
6.2 Application of Test Results to Protection Recommendations Protection recommendations for warehouse storage of cartoned Li-ion batteries have been developed
through fire testing and comparison to commodities with similar hazard characteristics. In consultation
with the FM Global Engineering Standards group, which is responsible for the FM Global Property Loss
Prevention Data Sheets, protection recommendations have been established based on current
knowledge and may be amended if additional research specific to the hazard of Li-ion batteries is
conducted. The bases for the protection recommendations, which can be found in Section 8, are
described below and are specific to warehouse storage of cartoned Li-ion batteries and should not be
generally applied to other commodities or storage configurations.
Based on the results of the testing presented in this report, and building upon Reference [15], cartoned
Li-ion batteries exhibit a fire hazard similar to CUP commodity (Section 3.3). For limited storage heights,

FM Global PUBLIC RELEASE
51
this conclusion aligns with Hazard Class HC-3 of FM Global Property Loss Prevention Data Sheet 3-26,
Fire Protection Water Demand for Nonstorage Sprinklered Properties [36], which defines protection for
nonstorage facilities where the fire hazard could approach the equivalent of nominal 1.5 m (5 ft) high in-
process storage of CUP commodity. In addition, power tool packs exhibited no observable energy
contribution from the Li-ion batteries when stored up to 4.6 m (15 ft) high [15]. Therefore, for the
storage configuration tested in this project, i.e., 4.6 m (15 ft) high, power tool packs can be protected as
CUP commodity per FM Global Property Loss Prevention Data Sheet 8-9, Storage of Class 1, 2, 3, 4 and
Plastic Commodities [37] for ceiling heights up to 12.2 m (40 ft).
Storage beyond those included in this project or listed above, including battery characteristics (e.g., SOC,
quantity of electrolyte, and format) and packaging components (e.g., cartons and dividers) requires a
more robust protection scheme to account for several unknowns that can negatively affect protection
effectiveness. Fire Protection Scheme A combines in-rack automatic sprinklers (IRAS) and horizontal
barriers for protection of high-hazard commodities, such as rack storage of ignitable liquids or level 3
aerosols. Complete specifications and drawings can be found in Section D.2.2.1 of DS 7-29, Ignitable
Liquid Storage in Portable Containers, July 2014 [38]. Similar specifications can be found in Section E.2 of
FM Global Property Loss Prevention Data Sheet 7-31, Storage of Aerosol Products, January 2012 [39].
This system design is expected to provide the highest level of protection required for storage of the Li-
ion batteries tested in this project and can be applied to array configurations beyond the scope of this
project.
The previous phase of this project discussed how the low-flash point hydrocarbons commonly used
within the electrolyte for Li-ion batteries are prone to reignition [15]. While that discussion related to
testing with small-format batteries, a similar result has been observed for large-format batteries
(Section 5.2). Reignition is a concern for any battery chemistry using low-flash point hydrocarbons and
has been observed for multiple Li-ion battery chemistries. The impact of burning projectiles is expected
to be minimal where commodity is segregated away from other combustibles or where Scheme A
protection utilizing quick-response sprinklers is provided. The segregation distance recommendation
should reflect the propensity for projectiles based on the Li-ion battery design. For instance, hard-cased
cylindrical batteries are more prone to be ejected far distances than soft-cased polymer batteries and
therefore require a greater segregation distance.

FM Global PUBLIC RELEASE
52
7. Conclusions
A project was conducted to determine fire protection guidance for warehouse storage of cartoned Li-ion
batteries. Testing was conducted at multiple scales with the intent of expanding the application of a
large-scale sprinklered fire test to other Li-ion battery types. All evaluations were conducted at the
FM Global Research Campus in West Glocester, R.I., USA.
This project represents a unique approach to determining protection guidance due to the inordinate
cost and limitations of availability associated with testing of Li-ion batteries. The combined effects of
different storage height, ceiling height, protection system design, commodity type and composition are
yet to be well understood and should not be inferred from these test results alone. Additionally,
significant changes in the Li-ion battery design and chemistry may require additional research.
The applicable storage conditions are:
Rack storage heights up to 4.6 m (15 ft).
Ceiling heights up to 12.2 m (40 ft).
Bulk-packaged 20 Ah polymer pouch batteries in corrugated board cartons with heavy plastic
dividers at nominally 50% state-of-charge (SOC).
The methodology for this project consisted of bench-scale through large-scale evaluations using a 20 Ah
polymer pouch Li-ion battery, comprised of iron phosphate chemistry, at a nominal 50% SOC. The first
test evaluated the flammability characteristics of the selected Li-ion battery compared to FM Global’s
standard commodities and previously tested small-format Li-ion batteries. This was an intermediate-
scale free-burn fire test focused on measurement of the heat release rate and the time of significant
battery involvement. Subsequent predictions established the fire hazard present in a sprinklered fire
scenario and provided the basis for protection system guidance. Based on the result of the
intermediate-scale test, and building upon Reference [15], the following conclusions can be made:
The cartoned 20 Ah large-format battery used in the present study represent a higher hazard
than the previously tested 2.6 Ah small-format batteries (cylindrical and polymer pouch). This
conclusion is based on the following test results, which indicate that the large-format battery
contributed to the overall fire severity closer to the predicted time of sprinkler operation than
the small-format batteries:
o The predicted time of sprinkler operation was similar for all cartoned Li-ion batteries
and FM Global standard commodities included in this project. This result supports the
assumption that, for three-tier-high, open-frame racks, the carton packaging dominates
the fire development leading to first sprinkler operation.
o Under free-burn conditions, the 20 Ah Li-ion polymer pouch battery used in this project
contributed to the overall severity of the rack storage fire 2 min 30 s (150 s) after
igntion, versus 5 minutes (300 s) for the 2.6 Ah cylindrical and polymer pouch batteries
previously tested in Phase 2 [15].

FM Global PUBLIC RELEASE
53
The product packaging, e.g., corrugated board containers and dividers, was identified as a key
factor driving the hazard in Li-ion batteries in storage. While the corrugated board cartons were
shown to dominate the initial fire growth, the plastic content within the cartons was shown to
be a driving factor in the overall commodity hazard, in particular:
o Cartoned batteries containing significant quantities of plastics exhibited a similar rapid increase in the released energy due to plastics involvement early in the fire development.
For the large-format 20 Ah Li-ion polymer pouch batteries used in this project, the heavy plastic dividers contributed to the overall severity of the fire before involvement of the batteries.
For the power tool packs, tested in Phase 2 [15], the heavy plastic case of the battery pack dominated the fire hazard and there was no observable contribution from the batteries.
o Cartoned batteries containing minimal plastics (e.g., the small-format Li-ion cylindrical and polymer batteries tested in Phase 2 [15]) exhibited a slower increase in energy release and a delay in the battery involvement due to heating of the batteries. In this case the plastic dividers represented a lesser combustible load than the heavy plastic dividers used for the 20 Ah polymer pouch battery.
Caution should be taken when extending the results of the testing presented in this report beyond the
specific combination of packaging and battery listed. Changes in the components of the packaging can
significantly impact the flammability characteristics of cartoned Li-ion batteries. One key aspect of the
packaging driving the fire hazard is the divider used to separate the batteries within the cartons.
Potential divider materials represent a wide range of fire properties and include liner board, fiber board,
thin or heavy plastic, and expanded foam. Even for the same battery, changing the liner material can
significantly impact the fire hazard. Changes in the Li-ion battery can also have a similar effect on the
overall hazard of the cartoned product. For instance, high SOC has been shown to increase the
likelihood and severity of thermal runaway. The quantity of electrolyte, which is the main combustible
source, is a function of the battery capacity and can also vary with the battery format (e.g., cylindrical or
polymer pouch). Thus, even for the same packaging, changes in the battery can impact the fire hazard. A
new flammability assessment should be conducted when potentially significant changes to the cartoned
product are encountered.
The performance of ceiling-level sprinkler protection was then assessed with a large-scale sprinklered
fire test of the cartoned large-format 20 Ah polymer pouch batteries. The test was conducted using a
three-tier-high rack-storage array, which represents storage up to 4.6 m (15 ft) high. Protection was
provided by quick-response, pendent sprinklers, having a 74oC (165oF) rated link with a K-factor of
320 L/min/bar1/2 (22.4 gpm/psi1/2) under a 12.2 m (40 ft) ceiling. In accordance with the evaluation
criteria established in Section 4.5, and building upon Reference [15], the following conclusions can be
made:

FM Global PUBLIC RELEASE
54
Storage up to 4.6 m (15 ft) under ceiling heights up to 12.2 m (40 ft) is adequately protected by a
fire protection system comprised of pendent sprinklers having a K-factor of 320 L/min/bar½
(22.4 gpm/psi½), with a nominal 74oC (165oF) temperature rating and a nominal RTI of 27.6 m½s½
(50 ft½s½), installed on 3.0 m 3.0 m (10 ft 10 ft) spacing at an operating pressure of 2.4 bar
(35 psig). This conclusion is based on one sprinkler operation extinguishing a large-scale test fire
without manual intervention.
Protection guidance established from the large-scale fire test can be reasonably applied to the
small-format Li-ion batteries previously tested for this project. This conclusion is based on the
results of the reduced-commodity test indicating that the cartoned large-format battery used in
this project represented a higher hazard than the previously tested small-format batteries.
Three supplemental evaluations were then carried out to reinforce the sprinkler protection guidance
resulting from the successful large-scale fire test. The first evaluation assessed the likelihood and impact
of ignition resulting from thermal runaway of one or more batteries within a carton. The effectiveness of
sprinkler water at suppressing a fire at a later stage of battery involvement than was achieved in the
large-scale test was then assessed. Finally, literature data were reviewed to compare the minimum
water application rate needed to prevent flame spread along the carton packaging versus the sprinkler
protection used in the large-scale test. Based on the results of these supplemental tests the following
conclusions can be made:
For all small- and large-format Li-ion batteries used in this project, the development of a rack storage fire leading to sprinkler operation should be similar for both ignition scenarios where the fire initiates inside or outside of the carton. This conclusion is based on the following test results:
o Thermal runaway of the 20 Ah polymer pouch battery used in this project did not result in battery-to-battery propagation within the carton. Experimental data have shown that thermal runaway of up to three batteries simultaneously within a single carton did not propagate to the adjacent batteries within the same carton.
o There is not sufficient air within a carton to support combustion of a single 20 Ah polymer pouch battery. Thus, fire propagation primarily occurs outside of the carton. In addition, review of literature data has shown that battery-to-battery propagation following thermal runaway of small-format cylindrical batteries occurs only after the carton has breached [32].
o Once an external fire is present, flame propagation along the carton material will dominate the fire development leading to sprinkler operation and will occur before the batteries contribute to the overall fire severity.
The sprinkler system used in the large-scale fire test is sufficient to protect against a fire where the Li-ion batteries are contributing more to the overall fire severity than occurred in the large-scale test. This conclusion is based on the following analysis:

FM Global PUBLIC RELEASE
55
o Intermediate-scale testing, designed to delay the application of protection water until the batteries were contributing to the overall fire, confirmed the adequacy of sprinkler protection guidance resulting from the successful large-scale fire test.
o In addition, review of literature data provided in Reference [34] has shown that a lower sprinkler discharge rate than used in the large-scale fire test can also control or suppress fire development along corrugated board cartons.
An experimental methodology to develop sprinkler protection guidance for warehouse storage of Li-ion
batteries using a reduced quantity of commodity has been established. This methodology provides a
unique means of extending the application of a successful large-scale fire test to other Li-ion batteries by
a combination of small- to intermediate-scale fire tests. However, lacking complete large-scale
sprinklered fire test experience for each Li-ion battery, a conservative approach to establishing sprinkler
protection guidance should be taken.

FM Global PUBLIC RELEASE
56
8. Recommendations
Protection recommendations for warehouse storage of cartoned Li-ion batteries have been developed
through fire testing and comparison to commodities with similar hazard characteristics. In consultation
with the FM Global Engineering Standards group, which is responsible for the FM Global Property Loss
Prevention Data Sheets, protection recommendations have been established based on current
knowledge and may be amended if additional research specific to the hazard of Li-ion batteries is
conducted.
The best protection recommendations based on current knowledge, for each Li-ion battery included in
this project and Reference [15], are summarized below:
Li-ion polymer pouch batteries (capacity up to 20 Ah at ≤ 50% SOC) and Li-ion cylindrical batteries (capacity up to 2.6 Ah at ≤ 50% SOC):
o For a single unconfined pallet load of batteries stored on the floor to a maximum of 1.5 m (5 ft) high, protect as an HC-3 occupancy per FM Global Property Loss Prevention Data Sheet 3-26, Fire Protection Water Demand for Nonstorage Sprinklered Properties, July 2011. Additionally, maintain a minimum of 3.0 m (10 ft) separation between adjacent combustibles.
o For batteries stored solid pile, palletized, or in racks up to 4.6 m (15 ft) under a ceiling up to 12.2 m (40 ft) high, protect with quick-response, pendent, sprinklers with a 165oF (74oC) nominal temperature rating. Protection options include:
K320 L/min/bar1/2 sprinklers @ 2.4 bar (K22.4 @ 35 psi). The water flow demand should allow for 12 sprinkler operations.
K360 L/min/bar1/2 sprinklers @ 2.4 bar (K25.2 @ 35 psi). The water flow demand should allow for 12 sprinkler operations.
o For batteries stored higher than 4.6 m (15 ft) or ceiling heights greater than 12.2 m (40 ft), store batteries in racks and protect with Scheme A per Section D.2.2.1 of FM Global Property Loss Prevention Data Sheet 7-29, Ignitable Liquid Storage in Portable Containers, April 2012 (DS 7-29)
Li-ion power tool packs (i.e., comprised of 18650-format cylindrical batteries with a total pack capacity up to 26 Ah at ≤ 50% SOC):
o Protect in-process storage of power tool packs as an HC-3 occupancy per FM Global Property Loss Prevention Data Sheet 3-26, Fire Protection Water Demand for Nonstorage Sprinklered Properties, July 2011. Limit in-process storage area to 19 m2 (200 ft2) and one pallet high. Additionally, maintain a minimum of 2.4 m (8 ft) separation between adjacent combustibles.
o For power tool packs stored up to 4.6 m (15 ft) high under a ceiling up to 12.2 m (40 ft), protect as FM Global standard cartoned unexpanded plastic (CUP) commodity per

FM Global PUBLIC RELEASE
57
FM Global Property Loss Prevention Data Sheet 8-9, Storage of Class 1, 2, 3, 4 and Plastic Commodities, FM Global, July 2011.
o For power tool packs stored higher than 4.6 m (15 ft) or ceiling heights greater than 12.2 m (40 ft), store batteries in racks and protect with Scheme A per Section D.2.2.1 of DS 7-29.
All ceiling sprinklers should be installed in accordance with FM Global Property Loss Prevention Data
Sheet 2-0, Installation Guidelines for Automatic Sprinklers, January 2014.
Storage beyond the above listed conditions, including battery characteristics (e.g., SOC, quantity of
electrolyte, and format) and packaging components (e.g., cartons and dividers), requires a more robust
protection scheme to account for several unknowns that can negatively affect protection effectiveness.
Fire Protection Scheme A combines in-rack automatic sprinklers (IRAS) and horizontal barriers for
protection of high-hazard commodities, such as rack storage of ignitable liquids or level 3 aerosols.
Complete specifications and drawings can be found in Section D.2.2.1 of DS 7-29. Similar specifications
can be found in Section E.2 of FM Global Property Loss Prevention Data Sheet 7-31, Storage of Aerosol
Products, January 2012. This system design is expected to provide the highest level of protection
required for storage of the Li-ion batteries tested in this project and can be applied to array
configurations beyond the scope of this project.

FM Global PUBLIC RELEASE
58
References
1. Transparency Market Research, "Global Lithium Ion Battery Market - Industry Analysis, Size,
Share, Growth, Trends, and Forecast 2013 - 2019," Transparency Market Research, 2013.
2. M. Buser, "Lithium Batteries: Hazards and Loss Prevention," S+S Report International, pp. 10-17,
February 2011.
3. R. T. Long, M. Kahn, and C. Mikolajczak, "Lithium-Ion Battery Hazards," Fire Protection
Engineering, pp. 22-36, 4th Quarter 2012.
4. D. Lisbona and T. Snee, "A Review of Hazards Associated with Primary Lithium and Lithium-Ion
Batteries," Process Safety and Environmental Protection, vol. 89, no. 6, pp. 434-442, November
2011.
5. National Highway Traffic Administration (NHTSA), "Chevrolet Volt Battery Incident Overview
Report," Washington DC, DOT HS 811 573, January 20, 2012.
6. C. Arbizanni, G. Gabrielli, and M. Mastragostino, "Thermal Stability and Flammability of
Electrolytes for Lithium-ion Batteries," Journal of Power Sources, vol. 196, no. 10, pp. 4801-4805,
May 2011.
7. S.M. Summer, "Flammability Assessment of Lithium-Ion and Lithium-Ion Polymer Battery Cells
Designed for Airfcraft Power Usage," U.S. Department of Transportation Federal Aviation
Administration, Springfield VA, DOT/FAA/AR-09/55, 2010.
8. E.P. Roth, C. Crafts, D.H. Doughty, and J. McBreen, "Advanced Technology Development Program
for Lithium-Ion Batteries: Thermal Abuse Performance of 18650 Li-Ion Cells," Unlimited Release
SANDIA REPORT SAND2004-0584, March 2004.
9. D.P. Abraham, E.P. Roth, R. Kostecki, and D.H. Doughty, "Diagnostic Examination of Thermally
Abused High-Power Lithium-ion Cells," Journal of Power Sources, vol. 161, pp. 648-657, 2006.
10. P. Ribiere, S. Grugeon, M. Morcrette, S. Boyanov, S. Laruelle, and G. Marlair, "Investigation on the
Fire-Induced Hazards of Li-ion Battery Cells by Fire Calorimetry," Energy and Environmental
Science, vol. 5, pp. 5271-5280, 2012. DOI: 10.1039/clee02218k
11. F. Larsson, P. Andersson, and B.-E. Mellander, "Lithium-Ion Batter Aspects on Fires in Electrified
Vehicles on the Basis of Experimental Abuse Tests," Batteries, vol. 2, no. 9, 2016. DOI:
10.3390/batteries2020009

FM Global PUBLIC RELEASE
59
12. F. Larsson, P. Andersson, P. Blomqvist, A. Loren, and B.-E. Mellander, "Characteristics of Lithium-
Ion Batteries During Fire Tests," J. Power Sources, no. 271, pp. 414-420, 2014.
13. Y. Fu, S. Lu, X. Cheng, and H. Zhang, "An Experimental Study on the Burning Behaviours of 18650
Lithium Ion Batteries Using a Cone Calorimeter," J. Power Sources, no. 273, pp. 216-222, 2015.
14. National Fire Protection Association Standard 13 (NFPA 13), Standard for the Installation of
Sprinkler Systems, 2010.
15. B. Ditch and J. de Vries, "Flammability Characterization of Lithium-ion Batteries in Bulk Storage,"
FM Global, Technical Report J.I. 0003045375, March 2013.
16. C. Mikolajczak, M. Kahn, K. White, and R. T. Long Jr., "Lithium-Ion Batteries Hazard and Use
Assessment," Fire Protection Research Foundation, June, 2011.
17. R. Thomas Long Jr., R. T. Long Jr., J. Sutula, and M. Kahn, "Li-ion Batteries Hazard and Use
Assessment Phase IIB: Flammability Characterization of Li-ion Batteries for Storage Protection,"
Fire Protection Research Foundation, 2013.
18. R. T. Long, "Title TBD," Exponent, Inc., September, 2016.
19. M.M. Khan, A. Tewarson, and M. Chaos, "Combustion Characteristics of Materials and Generation
of Fire Products," in SFPE Handbook of Fire Protection Engineering, P. DiNenno, Ed. Quincy,
Massachusetts, New York: Springer, 2016, ch. Section 3, Chapter 4, pp. 1143-1232.
20. S. J. Harris, A. Timmons, and W. J. Pitz, "A Combustion Chemistry Analysis of Carbonate Solvents
in Li-Ion Batteries," Journal of Power Sources, vol. 193, pp. 855-858, 2009.
21. ASTM E 2058-09, Standard Test Method for Measurement of Synthetic Polymer Material
Flammability Using a Fire Propagation Apparatus (FPA), 2009.
22. A. Tewarson, "Flammability Parameters for Materials: Ignition, Combustion, and Fire
Propagation," Journal of Fire Science, vol. 10, pp. 188-241, 1994.
23. International Standards Organization (ISO/IEC) 17025:2005, General Requirements for the
Competence of Testing and Calibration Laboratories, 2005.
24. FM Global Property Loss Prevention Data Sheet 8-1, Commodity Classification, April April 2014.
25. FM Approvals Standard Class 2000, Approval Standard for Automatic Control Mode Sprinklers for
Fire Protection, March 2006.

FM Global PUBLIC RELEASE
60
26. FM Approvals Standard Class 2008, Approval Standard for Suppression Mode [Early Suppression -
Fast Response (ESFR)] Automatic Sprinklers, October 2006.
27. FM Global Property Loss Prevention Data Sheet 2-0, Installation Guidelines for Automatic
Sprinklers, January 2014.
28. American Institute of Steel Construction, Specifications for the Design, Fabrication, and Erection of
Structural Steel for Building. New York, 1978.
29. J. Milke, "Analytical Method for Determining Fire Resistance of Steel Members," in SFPE
Handbook of Fire Protection Engineering, P. DiNenno, Ed., 2002, ch. 4-9, pp. 4-212 to 4-238.
30. H-C Kung, H-Z You, and R. D. Spaulding, "Ceiling Flows of Growing Rack Storage Fires," in Twenty-
first Symposium (International) on Combustion, 1986, pp. 121-128.
31. H. Webster, "Fire Protection for the Shipment of Lithium Batteries in Aircraft Cargo
Compartments," U.S. Department of Transportation Federal Aviation Administration,
DOT/FAA/AR-10/31, November 2010.
32. H. Webster, "Preliminary Full-Scale Tests with Bulk Shipments of Lithium Batteries," FAA Fire
Safety Highlights 2012.
33. Y. Xin and F. Tamanini, "Assessment of Commodity Classification for Sprinkler Protection," Fire
Safety Science, vol. 9, pp. 527-538, 2008. doi: 10.3801/IAFSS.FSS.9-527
34. S. Thumuluru and Y. Xin, "An Experimental Study of Pre-Wetting on Fire Propagation in Parallel
Panels," in Proceedings of the 13th International Fire Science and Engineering Conference
(INTERFLAM 2015), Windsor, UK, 2013, pp. 317-326.
35. K. Meredith, J. de Vries, Y. Wang, and Y. Xin, "A Comprehensive Model for Simulating the
Interaction of Water with Solid Surfaces in Fire Suppression Environments," in Proceedings of the
Combustion Institute, 2013, pp. 2719-2726. 34(2)
36. FM Global Property Loss Preventation Data Sheet 3-26, Fire Protection Water Demand for
Nonstorage Sprinklered Properties, April 2014.
37. FM Global Property Loss Prevention Data Sheet 8-9, Storage of Class 1, 2, 3, 4 and Plastic
Commodities, July 2011.
38. FM Global Property Loss Prevention Data Sheet 7-29, Ignitable Liquids Storage in Portable
Containers, July, 2014.
39. FM Global Property Loss Prevention Data Sheet 7-31, Storage of Aerosol Products, January 2012.

FM Global PUBLIC RELEASE
61

FM Global PUBLIC RELEASE
62