Embed Size (px)
Citation preview

DEVELOPMENT OF QUALITY STANDARDS FOR
INCLUSION OF HIGH RECYCLED ASPHALT
PAVEMENT CONTENT IN ASPHALT MIXTURES –
PHASE II
TR-658
Final Report
March 2015
Sponsored by
Iowa Highway Research Board
Hosin “David” Lee, Principal Investigator
Clint Van Winkle, Graduate Research Assistant
Ali Mokhtari, Graduate Research Assistant
Taha Ahmed, Postdoctoral Research Scholar
Haena Kim, Graduate Research Assistant
Public Policy Center
University of Iowa
Chris Williams, Co-Principal Investigator
Sheng Tang, Graduate Research Assistant
InTrans
Iowa State University

ii
Disclaimer
The contents of this report reflect the views of the authors, who are responsible for the
facts and the accuracy of the information presented herein. The opinions, findings, and
conclusions expressed in this publication are those of the authors and not necessarily
those of the sponsors.
The sponsors assume no liability for the contents or use of the information contained in
this document. This report does not constitute a standard, specification, or regulation.
The sponsors do not endorse products or manufacturers. Trademarks or manufacturers'
names appear in this report only because they are considered essential to the objectives
of the document.
Statement of Non-Discrimination
Federal and state laws prohibit employment and/or public accommodation
discrimination on the basis of age, color, creed, disability, gender identity, national
origin, pregnancy, race, religion, sex, sexual orientation or veteran’s status. If you
believe you have been discriminated against, please contact the Iowa Civil Rights
Commission at 800-457-4416 or Iowa Department of Transportation's affirmative action
officer. If you need accommodations because of a disability to access the Iowa
Department of Transportation’s services, contact the agency's affirmative action officer
at 800-262-0003.
iii
1. REPORT NO.
2. GOVERNMENT ACCESSION NO.
3. RECIPIENT'S CATALOG NO.
4. TITLE AND SUBTITLE DEVELOPMENT OF QUALITY STANDARDS FOR INCLUSION OF
HIGH RECYCLED ASPHALT PAVEMENT CONTENT IN ASPHALT
MIXTURES – PHASE II
5. REPORT DATE
March 2015 6. PERFORMING ORGANIZATION CODE
7. AUTHOR(S) Hosin “David” Lee, Clint Van Winkle, Russell Carlson, Ali Mokhtari, Taha
Ahmed, Haena Kim, Sheng Tang, Chris Williams
8. PERFORMING ORGANIZATION REPORT NO.
9. PERFORMING ORGANIZATION NAME AND ADDRESS Public Policy Center
University of Iowa
227 South Quadrangle
Iowa City, IA 52242-1192
10. WORK UNIT NO. 11. CONTRACT OR GRANT NO
12. SPONSORING AGENCY NAME AND ADDRESS Iowa Highway Research Board
Iowa Department of Transportation
800 Lincoln Way, Ames, IA 50010
13. TYPE OF REPORT AND PERIOD COVERED Final Report 14. SPONSORING AGENCY CODE
15. SUPPLEMENTARY NOTES 16. ABSTRACT To conserve natural resources and energy, the amount of recycled asphalt pavement has been steadily increasing in the construction
of asphalt pavements. The objective of this study is to develop quality standards for inclusion of high RAP content. To determine if
the higher percentage of RAP materials can be used on Iowa’s state highways, three test sections with target amounts of RAP
materials of 30%, 35% and 40% by weight were constructed on Highway 6 in Iowa City. To meet Superpave mix design
requirements for mixtures with high RAP contents, it was necessary to fractionate the RAP materials. Three test sections with actual
RAP materials of 30.0%, 35.5% and 39.2% by weight were constructed and the average field densities from the cores were
measured as 95.3%, 94.0%, and 94.3%, respectively. Field mixtures were compacted in the laboratory to evaluate moisture
sensitivity using a Hamburg Wheel Tracking Device. After 20,000 passes, rut depths were less than 3mm for mixtures obtained
from three test sections. The binder was extracted from the field mixtures from each test section and tested to identify the effects of
RAP materials on the performance grade of the virgin binder. Based on Dynamic Shear Rheometer and Bending Beam Rheometer
tests, the virgin binders (PG 64-28) from test sections with 30.0%, 35.5% and 39.2% RAP materials were stiffened to PG 76-22, PG
76-16, and PG 82-16, respectively. The Semi-Circular Bending (SCB) test was performed on laboratory compacted field mixtures
with RAP amounts of 30.0%, 35.5% and 39.2% at two different temperatures of -18 and -30 °C. As the test temperature decreased,
the fracture energy decreased and the stiffness increased. As the RAP amount increased, the stiffness increased and the fracture
energy decreased. Finally, a condition survey of the test sections was conducted to evaluate their short-term pavement performance
and the reflective transverse cracking did not increase as RAP amount was increased from 30.0% to 39.2%.
17. KEY WORDS recycled asphalt pavement, high RAP content, fractionation
methods, high RAP mix design, Semi-Circular Bending test
18. DISTRIBUTION STATEMENT No restrictions.
19. SECURITY CLASSIF. (of this report) None
20. SECURITY CLASSIF. (of this page) None
21. NO. OF PAGES 47
22. PRICE N/A

iv
Technical Advisory Committee
Scott Schram, Iowa DOT, [email protected]
Jeffrey Schmitt, Iowa DOT, [email protected]
Bill Rosener, APAI, [email protected]
Larry Mattusch, APAI, [email protected]
Guy Sisler, Flint Hills Resources, [email protected]
Marla Kilburg, Flint Hills Resources, [email protected]
John Hinrichsen, [email protected]
Gary Netser, L.L. Pelling, [email protected]
Chuck Finnegan, L.L. Pelling, [email protected]
v
TABLE OF CONTENTS ABSTRACT .....................................................................................................................................1 1 INTRODUCTION ......................................................................................................................2 2 RECYCLED ASPHALT PAVEMENT MATERIALS ................................................................4
2.1 Fractionated RAP Materials from I-80 ..........................................................................4
3 INFLUENCE OF RAP ON BINDER GRADE ..........................................................................6 3.1 Test Sections ..................................................................................................................6 3.2 Binder Grade of Extracted Asphalt from Field Mixtures ..............................................7
4 MIX DESIGN OF FIELD MIXTURES .....................................................................................9 4.1 High-RAP Mix Design Results .....................................................................................9
5 LABORATORY EVALUATION OF FIELD MIXTURES ......................................................12
5.1 Hamburg Wheel Tracking Test ....................................................................................12 5.2 Semi-Circular Bending Test ........................................................................................14
6 FIELD PERFORMANCE OF HIGH RAP PAVEMENTS .......................................................25 6.1 Condition Survey of Test Sections ..............................................................................24
7 SUMMARY AND CONCLUSION ..........................................................................................28 7.1 Proposed Phase 3 Study ...............................................................................................29
8 REFERENCES .........................................................................................................................30

vi
LIST OF TABLES
Table 2-1: Iowa DOT RAP Stockpile Categorization Criteria & Allowable Usage .............. Error!
Bookmark not defined. Table 2-2: Sieve-Size-Separated RAP Material Composition Analysis .......Error! Bookmark not
defined. Table 3-1: Bending Beam Rheometer Data ................................... Error! Bookmark not defined. Table 4-1: Volumetric Mix Design Criteria ................................... Error! Bookmark not defined. Table 4-2: Percent RAP by Weight and by Binder Replacement ... Error! Bookmark not defined. Table 4-3: Volumetric Mix Design Results from Mixtures Used for Construction ............... Error!
Bookmark not defined. Table 5-1: Semi-Circular Bending Test Results .............................................................................23
Table 6-1: Density and Air Voids of Field Cores ...........................................................................25 Table 6-2: Transverse Cracking Developed in Three Test Sections ............ Error! Bookmark not
defined.
LIST OF FIGURES
Figure 3-1: Layout of Test sections on Highway 6 in Iowa City ... Error! Bookmark not defined. Figure 3-2: |G*| / sin (delta) vs temperature .................................. Error! Bookmark not defined.
Figure 4-1: Volumetric results of constructed test sections ........... Error! Bookmark not defined.
Figure 5-1: Hamburg Wheel Tracking Device and Specimens ready for testing Error! Bookmark
not defined. Figure 5-2: Hamburg Wheel Tracking Test Results of High-FRAP Field Mixtures.............. Error!
Bookmark not defined. Figure 5-3: Typical SCB load vs. average load line displacement (P-u) curve .. Error! Bookmark
not defined. Figure 5-4: Typical output graph obtained from MATLAB software .......... Error! Bookmark not
defined. Figure 5-5: Fracture Energy Results .............................................. Error! Bookmark not defined.
Figure 5-6: Fracture Toughness Results......................................... Error! Bookmark not defined. Figure 5-7: Fracture Stiffness Results ............................................ Error! Bookmark not defined.
Figure 5-8: Fracture Energy Results for New Hampshire Mixes .. Error! Bookmark not defined.
Figure 5-9: Fracture Toughness Results for New Hampshire Mixes ........... Error! Bookmark not
defined. Figure 5-10: Fracture Energy Results for Utah Mixes ................... Error! Bookmark not defined.
Figure 5-11: Fracture Toughness Results for Utah Mixes ............. Error! Bookmark not defined.
Figure 5-12: Fracture Energy Results for Minnesota Mixes......................................................... 20
Figure 5-13: Fracture Toughness Results for Minnesota Mixes ................................................... 20
Figure 5-14: Fracture Energy for Three Percentages of RAP at Different Temperatures ............. 21
Figure 5-15: Fracture Toughness at Different RAP Contents and Temperatures .......................... 21
Figure 5-16: Specimens for SCB Test........................................................................................... 22
Figure 5-17: A Typical Specimen under SCB Test Machine ........................................................ 22

vii
Figure 5-18: Plot of SCB test parameters and RAP content at two different temperatures .......... 24
Figure 6-1: Examples of low, medium, and high severity cracking ............ Error! Bookmark not
defined. Figure 6-2: Reflective Crack Length for Different Contents of RAP .......... Error! Bookmark not
defined.8

1
ABSTRACT
To conserve natural resources and energy, the amount of recycled asphalt pavement has
been steadily increasing in the construction of asphalt pavements. The objective of this
study is to develop quality standards for inclusion of high RAP content. To determine if
the higher percentage of RAP materials can be used on Iowa’s state highways, three test
sections with target amounts of RAP materials of 30%, 35% and 40% by weight were
constructed on Highway 6 in Iowa City. To meet Superpave mix design requirements for
mixtures with high RAP contents, it was necessary to fractionate the RAP materials.
Three test sections with actual RAP materials of 30.0%, 35.5% and 39.2% by weight
were constructed and the average field densities from the cores were measured as 95.3%,
94.0%, and 94.3%, respectively. Field mixtures were compacted in the laboratory to
evaluate moisture sensitivity using a Hamburg Wheel Tracking Device. After 20,000
passes, rut depths were less than 3mm for mixtures obtained from three test sections. The
binder was extracted from the field mixtures from each test section and tested to identify
the effects of RAP materials on the performance grade of the virgin binder. Based on
Dynamic Shear Rheometer and Bending Beam Rheometer tests, the virgin binders (PG
64-28) from test sections with 30.0%, 35.5% and 39.2% RAP materials were stiffened to
PG 76-22, PG 76-16, and PG 82-16, respectively. The Semi-Circular Bending (SCB) test
was performed on laboratory compacted field mixtures with RAP amounts of 30.0%,
35.5% and 39.2% at two different temperatures of -18 and -30 °C. As the test
temperature decreased, the fracture energy decreased and the stiffness increased. As the
RAP amount increased, the stiffness increased and the fracture energy decreased. Finally,
a condition survey of the test sections was conducted to evaluate their short-term
pavement performance and the reflective transverse cracking did not increase as RAP
amount was increased from 30.0% to 39.2%.

2
1 INTRODUCTION
Recycled asphalt pavement (RAP) has been used for many years in the United States and
it is considered as the world’s most recycled product. In Iowa, the proportion of asphalt
binder from RAP can be allowed up to 20% of the total binder content without changing
the prescribed standard virgin asphalt grade. When more than 20% RAP by binder
replacement is used, testing of the RAP’s recovered binder is recommended to determine
a proper performance grade of virgin binder to be used (McDaniel et al. 2000). However,
there was no significant difference in laboratory performance test results between the
high RAP mixes (between 21% and 30%) and the low RAP mixes (20% or less) (Maupin
et al. 2008). It was reported that viable mixes with higher RAP contents of up to 50% by
binder replacement could be designed (McDaniel et al. 2002). In 2008, the NAPA set a
goal to double the national average RAP content from 12 percent to 24 percent in the next
five years (NCAT 2010).
There is a lack of understanding about how the binder from the RAP contributes to the
overall mix. Viewpoints range from the RAP binder completely blends with the virgin
binder to that it does not blend at all (i.e., RAP acts in the mix like a “black rock”). The
Illinois DOT assumes 100% contribution for the residual asphalt binder from the RAP
which reduces the requirement for virgin asphalt binder by the full amount of asphalt
binder in the RAP. However, this assumption has been reported to be inaccurate and thus
could result in an erroneous Hot Mix Asphalt (HMA) job mix formula causing dry HMA
(Al-Qadi et al. 2007). Several studies have shown the contribution of RAP binder is
somewhere in between these two theories by examining the rheology of the resulting
binder (Stephens et al. 2001; Huang et al. 2005; Bennert et al. 2014).
Most agencies limit the quantity of RAP materials in asphalt mixtures and/or the amount
of recycled binder. For example, the Iowa DOT limits the use of RAP materials up to
15% by weight for the surface course while at least 70% of the total asphalt binder shall
be virgin asphalt. A contractor is allowed to use more than 15% when there is quality
control sampling and testing of the RAP materials meeting the requirements in the
specification (Iowa-DOT 2010). It has been reported that mixes with up to 40% RAP
materials by weight have performed better than mixes with 20% RAP materials in
Hamburg Wheel Tracking test (Boriack 2014; Diefenderfer and Nair 2014).
Without fractionating RAP materials, however, it is difficult to meet the mix design
criteria. Agencies have been successful in utilizing as much as 50% Fractionated RAP
(FRAP) materials, which would remove fine RAP materials passing a specific sieve size.
Because FRAP materials include less fine materials, it is feasible to produce mixtures that
would meet Superpave mix design requirements. For example, the Wisconsin DOT
3
requires that at least 80% of the total asphalt binder should be virgin but it may be
reduced to 75% when FRAP is used. Contractors may further reduce a percentage of
virgin binder below 75% if they can provide test results indicating the resultant binder
meets the originally specified grade (Wisconsin DOT 2009). In Florida, State Road 15A
was successfully constructed using asphalt mixtures containing 45 percent FRAP
(Udelhofen 2007). In Overland Park in Kansas, where the DOT limits the use of RAP to
20-25% without binder modification, the Antioch road under a high volume of traffic was
constructed using 35% FRAP mix meeting the Superpave mix design (Udelhofen 2010).
The main objective of this project is to develop quality standards for inclusion of high
RAP content in asphalt mixtures. A primary concern with high-RAP content mixtures is
the resultant performance grade of the blended asphalt binder. Many state DOT
specifications require the use of a ‘softer’ virgin asphalt binder (i.e. lower PG grade)
when the RAP materials account for a certain percentage of virgin binder replacement or
mixture weight.
This report presents both laboratory and field evaluation results of three test sections with
target amounts of RAP materials of 30%, 35%, and 40% by weight. However, due to
limitations in dispensing RAP materials in the field, the actual amounts of RAP materials
used to build the test sections were 30.0%, 35.5% and 39.2% by weight. First, a sieve-by-
sieve analysis was performed on the RAP material to identify the optimum sieve size to
fractionate RAP materials. Field mixtures were then tested for their moisture sensitivity
using a Hamburg Wheel Tracking (HWT) device and the low-temperature cracking using
Semi-Circular Bending (SCB) test. To identify the effect of RAP on the virgin binder, the
binder was extracted from the field mixtures to determine the performance grade. Finally,
to compare the short-term performance of three test sections with varying amounts of
RAP, a condition survey has been performed.
The results of the research is presented as new asphalt mix design with high RAP
contents, which was used to design asphalt mixtures with varying RAP contents for the
test sections. Both asphalt binder and mixture tests have been performed at all
temperature regimes to characterize the binder contained in RAP materials. In addition,
this study explored the possible role that fractionation may take in increasing RAP usage.
Test sections with varying RAP contents were monitored for their relative amounts of
reflective cracking in the field. Laboratory tests and field performance of asphalt mixtures
with high RAP contents would help pavement engineers design asphalt mixtures with
optimum RAP contents and increase the use of RAP materials while enhancing the long-
term performance of pavements in Iowa.

4
2 RECYCLED ASPHALT PAVEMENT MATERIALS
As shown in Table 2-1, Iowa DOT has adopted the categorization system that classifies
the RAP stockpiles into three types: classified RAP, certified RAP and unclassified RAP
so that the RAP materials with high-quality aggregate properties are allowed to be used in
various amounts in different pavement layers. The maximum RAP percentage allowed in
surface course mixtures is limited due to the exposure to traffic loading and
environmental conditions. The maximum allowable RAP usage for the surface layer is
further reduced for higher ESAL pavements. The Iowa DOT specifications are on the
conservative side of the Midwestern region by only allowing a maximum of 15%
Classified RAP usage in the surface course for any ESAL category and only 10%
Certified RAP in the surface course for pavements with less than or equal to 300,000
ESAL’s.
Table 2-1: Iowa DOT RAP Stockpile Categorization Criteria & Allowable Usage
Classified RAP Certified RAP Unclassified RAP
Requirements Documented source Undocumented Source Undocumented source
High Aggregate Quality Lower Aggregate Quality Unknown/Poor Aggregate
Stockpiled Separately Poor Stockpiling Poor Stockpiling
Meets Quality Control Meets Quality Control No Quality Control
Allowable
Usage 15% weight in surface 10% surface < 300K ESAL 0% surface for all ESAL
Min. 70% virgin AC 20% Interm. < 1M ESAL 10% Interm. < 1M ESAL
No limit in other layers 20% Base for all ESAL 10% Base for all ESAL
Source: Section 2303. Hot Mix Asphalt Mixtures. Iowa DOT Standard Specifications
2.1 Fractionated RAP Materials from I-80
Samples of RAP materials were obtained from classified RAP stockpiles at L.L. Pelling
Company’s asphalt plant. Millings were obtained at a high speed and a shallow depth
from the surface, resulting in a small amount of dust content of 10.7%. The purpose of
these RAP fractionation methods was to create new stockpiles with reduced fine
aggregate composition. As shown in Table 2-2, a component analysis was performed on
the RAP stockpile from I-80. An excessive amount of RAP materials passing No. 200
sieve is the main cause for not meeting the gradation requirements. Based on the sieve-
by-sieve analysis of RAP materials, RAP materials passing 5/16” sieve were discarded.
The gradation of RAP materials retained on a 5/16” sieve was very consistent and the
dust content was low whereas the fine RAP materials passing 5/16” sieve exhibited
higher recovered asphalt binder content and high dust content.

5
Table 2-2: Sieve-Size-Separated RAP Material Composition Analysis
Size of Recovered Aggregate Composition After Ignition Oven Burn-Off – (% Retained) Asphalt % of % of Dust
RAP ¾” ½” 3/8” No. 4 No. 8 No. 16 No. 30 No. 50 No. 100 No. 200 Pan Content % Stockpile Content
1 1/2” 0.0 3.9 4.7 27.5 20.1 13.9 9.6 7.6 3.8 1.4 7.6 4.66 4.15 3.30
1” 0.0 5.5 5.7 27.7 18.8 12.8 8.7 7.6 3.8 1.4 8.0 4.78 5.54 4.61
¾” 1.1 1.1 10.0 6.2 27.6 16.2 10.9 8.3 7.8 3.7 7.2 4.61 6.41 4.79
½” --- 20.8 10.6 20.8 13.6 9.6 7.0 6.2 3.3 1.2 7.0 4.09 12.68 9.26
3/8” --- --- 39.81 21.9 10.2 7.2 5.2 5.0 2.7 1.0 5.7 3.62 8.62 5.11
No. 4 --- --- --- 56.1 15.8 7.2 5.4 5.3 2.8 1.0 5.4 3.66 22.18 14.91
No. 8 --- --- --- --- 65.2 12.0 5.5 5.7 3.1 1.1 7.5 4.43 15.56 12.13
No. 16 --- --- --- --- --- 61.7 13.6 7.4 3.9 1.6 11.8 5.55 10.38 12.82
No. 30 --- --- --- --- --- --- 60.8 14.9 5.0 1.9 17.4 6.72 6.12 11.13
No. 50 --- --- --- --- --- --- --- 67.2 7.4 2.5 23.0 7.98 4.35 10.45
No. 100 --- --- --- --- --- --- --- --- 64.2 7.5 28.3 9.34 2.08 6.15
No. 200 --- --- --- --- --- --- --- --- --- 57.2 42.8 9.74 0.98 4.37
Normalized
Composite 0 3 6 20 20 14 10 9 5 2.1 9.6 4.75 99.1% 99.1%
Binder
Extraction 0 2 5 21 20 14 11 10 4 2.3 10.7 4.00
Estimated
Coarse RAP 0 5 10 34 16 10 7 6 4 1.4 6.7 4.02 59.6% 42.0%
Estimated
Fine RAP 0 0 0 0 26 21 15 14 7 3.2 13.8 5.86 40.4% 58.0%
6
3 INFLUENCE OF RAP ON BINDER GRADE
3.1 Test Sections
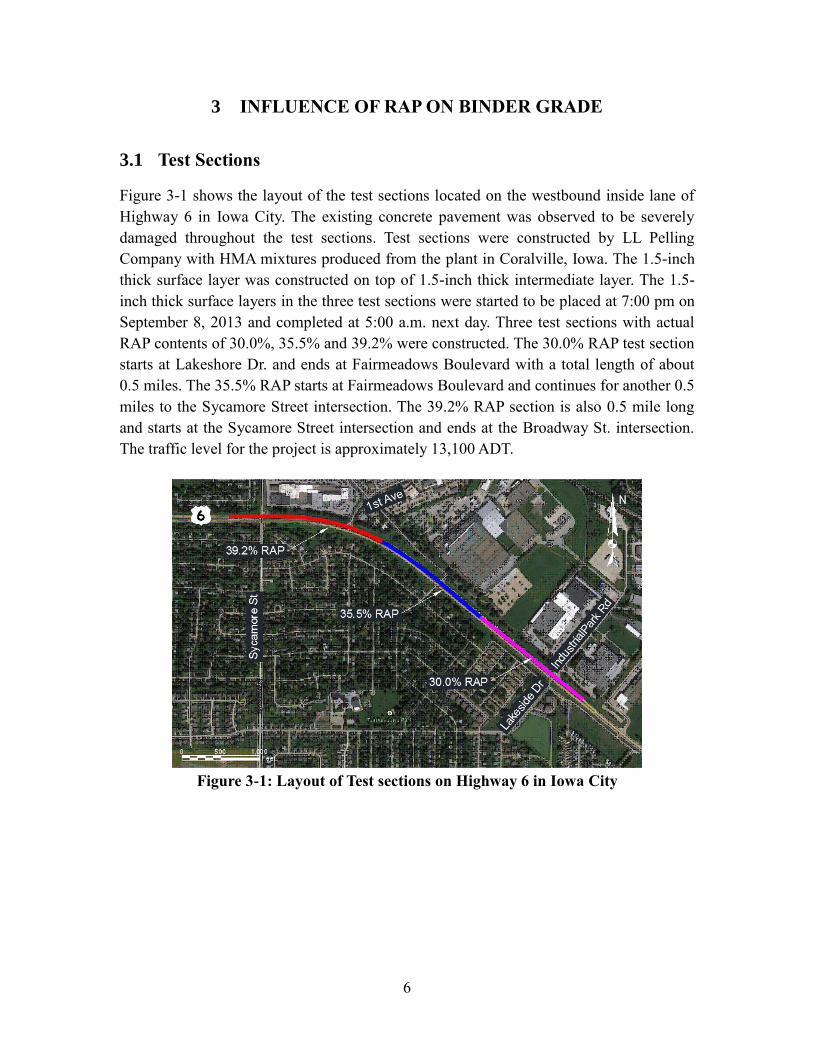
Figure 3-1 shows the layout of the test sections located on the westbound inside lane of
Highway 6 in Iowa City. The existing concrete pavement was observed to be severely
damaged throughout the test sections. Test sections were constructed by LL Pelling
Company with HMA mixtures produced from the plant in Coralville, Iowa. The 1.5-inch
thick surface layer was constructed on top of 1.5-inch thick intermediate layer. The 1.5-
inch thick surface layers in the three test sections were started to be placed at 7:00 pm on
September 8, 2013 and completed at 5:00 a.m. next day. Three test sections with actual
RAP contents of 30.0%, 35.5% and 39.2% were constructed. The 30.0% RAP test section
starts at Lakeshore Dr. and ends at Fairmeadows Boulevard with a total length of about
0.5 miles. The 35.5% RAP starts at Fairmeadows Boulevard and continues for another 0.5
miles to the Sycamore Street intersection. The 39.2% RAP section is also 0.5 mile long
and starts at the Sycamore Street intersection and ends at the Broadway St. intersection.
The traffic level for the project is approximately 13,100 ADT.
Figure 3-1: Layout of Test sections on Highway 6 in Iowa City

7
3.2 Binder Grade of Extracted Asphalt from Field Mixtures
To identify the effect of FRAP on the rutting potential of the virgin asphalt binder of PG
64-28, a Dynamic Shear Rheometer (DSR) test was performed on the asphalt binder
extracted from field mixtures with varying FRAP amounts. It should be noted, however,
that the extracted binder may not represent the actual blending level between virgin
binder and binder from FRAP in the field because the laboratory extraction process
would result in a better blending than the plant mixing process. As shown in Figure 3-2,
the extracted binders from field mixtures with 30.0%, 35.5% and 39.2% FRAP met the
minimum G*/sin delta value of 1 kPa for high temperatures of 76 ºC, 76 ºC, and 82 ºC,
respectively. These high temperatures are two or three levels higher than the high
temperature grade of 64 ºC for the virgin binder of PG 64-28. This result confirms that
the similar level of stiffening in the original binder occurred due to 30.0% and 35.5%
FRAP but more significant stiffening occurred with the 39.2% FRAP.
Figure 3-2: |G*| / sin (delta) vs temperature
To identify the effect of FRAP on the low-temperature cracking potential of the PG 64-28
virgin asphalt binder, the Bending Beam Rheometer (BBR) test was performed on asphalt
binder extracted from field mixtures. As summarized in Table 3-1, the extracted binders
from field mixtures with 30.0%, 35.5% and 39.2% FRAP met the minimum m-value of
0.300 and maximum stiffness value of 300 MPa for the low test temperatures of -12 ºC, -
6 ºC, and -6 ºC, respectively. These temperatures are one or two levels higher than the
low test temperature of -18 ºC of the virgin binder PG 64-28. This result confirms that the
similar level of stiffening of the original binder has occurred for all FRAP contents.
70 76 82 88
29% 2.89 1.55 0.84
34% 2.9 1.55 0.82
38% 2.68 1.36 0.71
0
0.5
1
1.5
2
2.5
3
3.5
|G*|
/sin
(del
ta)
kPa
Temperature °C
29%
34%
38%

8
Table 3-1: Bending Beam Rheometer Data
Temperature -6 °C -12 °C -18 °C
Percent RAP Stiffness m-Value Stiffness m-Value Stiffness m-Value
30.0% 201 0.301 354 0.271
35.5% 108 0.293 228 0.255
39.2% 77.6 0.367 200 0.275
Based on both DSR and BBR test results, the performance grade of extracted binders
from the field mixtures with 30.0%, 35.5% and 39.2% FRAP can be classified as PG 76-
22, PG 76-16, and PG 82-16, respectively. It can be concluded that the virgin binder of
PG 64-28 used to build the test sections was significantly stiffened by the FRAP amounts
due to the aged binder contained in the FRAP.

9
4 MIX DESIGN OF FIELD MIXTURES
The Superpave mix design was performed for a 10 million ESAL 1/2” mix with 30.0%,
35.5% and 39.2% FRAP materials by weight. Originally, PG 70-22 binder was specified
for the proposed test sections. However, due to a high RAP content, a softer PG 64-28
binder was adopted (15). Percent binder replacements by RAP materials can be calculated
as 20.1%, 24.7% and 29.0% for RAP materials of 30.0%, 35.5%, and 39.2% by weight
using the following formula:
% 𝐵𝑖𝑛𝑑𝑒𝑟 𝑅𝑒𝑝𝑙𝑎𝑐𝑒𝑚𝑒𝑛𝑡
=(% 𝑜𝑓 𝐵𝑖𝑛𝑑𝑒𝑟 𝐶𝑜𝑛𝑡𝑒𝑛𝑡 𝑖𝑛 𝑅𝐴𝑃 × % 𝑜𝑓 𝑅𝐴𝑃 𝑖𝑛 𝑀𝑖𝑥)
𝑇𝑜𝑡𝑎𝑙 % 𝑜𝑓 𝐵𝑖𝑛𝑑𝑒𝑟 𝑖𝑛 𝑡ℎ𝑒 𝑀𝑖𝑥 × 100
4.1 High-RAP Mix Design Results
Table 4-1 summarizes the volumetric design criteria for the HMA 10 million ESAL 1/2”
surface mixtures designed for this study. Volumetric properties were calculated at the
optimum binder content of each mix and compared against these mix design criteria.
Table 4-1: Volumetric Mix Design Criteria
Mixture
Property
Design
Air Voids
Voids Filled
w/ Asphalt
Voids in
Aggregate
Film
Thickness
Dust-Binder
Ratio
Maximum
Dust Content
Pa (%) VFA (%) VMA (%) (µm) D:B (% -No. 200)
DOT Spec. 4.0 70 – 80 Min. 14.0 8.0 – 13.0 0.6 – 1.4 10.0
Table 4-2 summarizes both design and actual percentages of RAP by weight, optimum
total binder contents, optimum virgin binder contents, and percentages of RAP by binder
replacement. First, the optimum total binder content was calculated for each mix. Second,
the amount of binder from FRAP was estimated and the remaining amount of virgin
binder was derived. Finally, the percentage of FRAP by binder replacement was
calculated. Due to a difficulty in weighing exact percentages of FRAP at the asphalt
plant, actual percentages of FRAP used for building test sections were slightly increased.
Table 4-2: Percent RAP by Weight and by Binder Replacement
% FRAP by weight
Design Actual Design Actual Design Actual
% FRAP by Weight 29% 30.0% 34% 35.5% 38% 39.2%
Optimum Total AC 4.70% 4.80% 4.50% 4.49% 4.30% 4.38%
Optimum Virgin AC 3.70% 3.82% 3.40% 3.33% 3.10% 3.10%
% FRAP by Binder 20.1% 20.4% 24.7% 25.9% 29.0% 29.3%

10
Similarly, in Table 4-3, a summary of the mix design results for high RAP mixes with
actual amounts of FRAP of 30.0% by weight (20.4% by binder replacement), 35.5% by
weight (25.9% by binder replacement) and 39.2% by weight (29.3% by binder
replacement). For each mix design, the optimum binder content was determined to
produce 4% air voids for the 10 million ESAL 1/2” HMA mix. The volumetric properties
of each mixture were determined at the optimum binder content and VMA, VFA,
combined aggregate gradation, film thickness and dust-binder ratio were analyzed for
each mix design.
Table 4-3: Volumetric Mix Design Results from Mixtures Used for Construction
Actual % FRAP by Weight 30.0% 35.5% 39.2%
% FRAP by Binder 20.4% 25.9% 29.3%
Optimum AC Content 4.80% 4.49% 4.38%
Max. Sp. Gr. (Gmm) 2.565 2.578 2.609
Core Sp. Gr. (Gmb) 2.497 2.507 2.549
Binder Sp. Gr. (Gb) 1.0183 1.0191 1.0196
Agg. Sp. Gr. (Gsb) 2.734 2.735 2.754
Water Absorp. (% Abs) 1.325 1.358 1.313
Effective Sp. Gr. (Gse) 2.778 2.778 2.81
Aggregate Surface Area 4.39 4.57 4.45
% Binder Abs. (Pba) 0.59 0.58 0.71
Effective Binder (Pbe) 4.24 3.94 3.67
Mix Design Criteria
VMA (%)>14 13 12.5 11.5
70<VFA (%)<80 79.6 78.0 80.0
Dust Content<10 3.8 4.2 4.4
8<Film Thick<13 9.7 8.6 8.2
0.6<DB Ratio<1.4 0.92 1.14 1.2
Volumetric mix design results are presented in Figure 4-1. The fractionation
method was effective in reducing the amount of fine aggregates from the original
stockpile and thereby improving volumetric properties. These volumetric properties of
the mixtures were significantly influenced by the optimum asphalt content of each
mixture. Despite a reduced amount of fine aggregate and dust content due to a
fractionation, all mix designs exhibited significantly lower optimum asphalt contents than
a typical HMA mixture. The improvement of a mixture’s volumetric properties was often
offset by the lower optimum asphalt content resulting in a lower asphalt film thickness
and a higher dust-binder ratio. The dust content was relatively low in the original RAP
stockpile and, as can be seen from Figure 3-3, the mix designs met all of the Superpave

11
mix design criteria except for the VMA. The VMA decreased as the amount of RAP
materials increased because of less binder content and the increase in the dust proportion.
The aggregates may not have been sufficiently crushed as the 10-million ESAL mix
resulting in a low optimum binder content. The potential long-term impact of not meeting
VMA requirement could lead to premature cracking and rutting due to low binder
content, a large amount of dust from RAP materials and a low amount of crushed
aggregates.
(a) Voids in the Mineral
Aggregate (VMA)
(b) Dust Content
(e) Dust to Binder Ratio
(b) Void filled with Asphalt (VFA)
(d) Film Thickness
(f) Optimum Asphalt Content
29% 34% 38%
Film Thick 9.7 8.6 8.2
0
2
4
6
8
10
12
14
29% 34% 38%
VMA (%) 13 12.5 11.5
0
2
4
6
8
10
12
14min
29% 34% 38%
VFA (%) 79.6 78 80
0
20
40
60
80
100
29% 34% 38%
DB Ratio 0.92 1.14 1.2
0
0.2
0.4
0.6
0.8
1
1.2
1.4
29% 34% 38%
Dust Content 3.8 4.2 4.4
0
2
4
6
8
10 max
29% 34% 38%
% RAP Binder 1.00% 0.98% 1.10%
% VirginBinder
3.70% 3.82% 3.40%
0.00%1.00%2.00%3.00%4.00%5.00%6.00%
Figure 4-1: Volumetric results of constructed test sections
12
5 LABORATORY EVALUATION OF FIELD MIXTURES
5.1 Hamburg Wheel Tracking Test
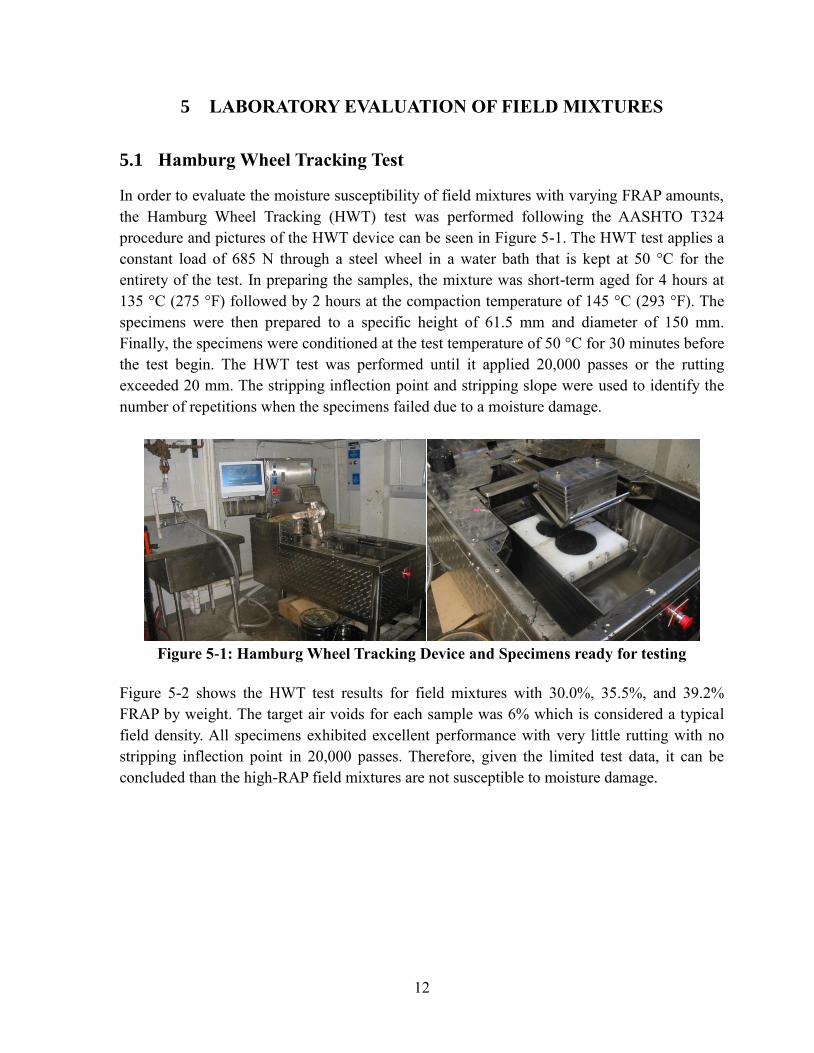
In order to evaluate the moisture susceptibility of field mixtures with varying FRAP amounts,
the Hamburg Wheel Tracking (HWT) test was performed following the AASHTO T324
procedure and pictures of the HWT device can be seen in Figure 5-1. The HWT test applies a
constant load of 685 N through a steel wheel in a water bath that is kept at 50 °C for the
entirety of the test. In preparing the samples, the mixture was short-term aged for 4 hours at
135 °C (275 °F) followed by 2 hours at the compaction temperature of 145 °C (293 °F). The
specimens were then prepared to a specific height of 61.5 mm and diameter of 150 mm.
Finally, the specimens were conditioned at the test temperature of 50 °C for 30 minutes before
the test begin. The HWT test was performed until it applied 20,000 passes or the rutting
exceeded 20 mm. The stripping inflection point and stripping slope were used to identify the
number of repetitions when the specimens failed due to a moisture damage.
Figure 5-1: Hamburg Wheel Tracking Device and Specimens ready for testing
Figure 5-2 shows the HWT test results for field mixtures with 30.0%, 35.5%, and 39.2%
FRAP by weight. The target air voids for each sample was 6% which is considered a typical
field density. All specimens exhibited excellent performance with very little rutting with no
stripping inflection point in 20,000 passes. Therefore, given the limited test data, it can be
concluded than the high-RAP field mixtures are not susceptible to moisture damage.

13
(a) 30.0% FRAP
(b) 35.5% FRAP
(c) 39.2% FRAP
Figure 5-2: Hamburg Wheel Tracking Test Results of High-FRAP Field Mixtures
-20
-15
-10
-5
0
0 5000 10000 15000 20000D
epth
mm
Passes
6.48% 6.44%Air Voids
-20
-15
-10
-5
0
0 5000 10000 15000 20000
Dep
th m
m
Passes
7.38% 6.00%Air Voids
-20
-15
-10
-5
0
0 5000 10000 15000 20000
Dep
th m
m
Passes
6.93% 6.75%Air Voids

14
5.2 Semi-Circular Bending Test
5.2.1 SCB Parameters and Measurements
Semi-circular bending (SCB) test was performed to evaluate the resistance of constructed
asphalt in terms of low temperature cracking. The work of fracture was calculated by the area
under load vs. load line displacement (P-u) curve shown in Figure 5-3. The test was stopped
when the load drops significantly (vertical line in Figure 5-3). Total work of fracture (Wf) was
calculated as the sum of the area under the left side of the vertical line (Mode 1) and right side
of the vertical line (Mode 2). Mode 1 data were obtained from the test output file while Mode
2 data were estimated using the MATLAB software by extrapolating the tail of the loading
curve (Buss and Williams 2013). A typical output data is presented in Figure 5-4.
Figure 5-3: Typical SCB load vs. average load line displacement (P-u) curve
Figure 5-4: Typical output graph obtained from MATLAB software

15
The area under the curve can be calculated using the following equation:
Wmode 1
where,
Pi = applied load (N) at the i load step application,
Pi+1= applied load (N) at the i +1 load step application,
ui = average displacement at the i step, and
ui+1 = average displacement at the i +1 step.
Wmode 2
where,
u = integration variable equal to average displacement, and
uc = average displacement value at which the test is stopped.
The work of total fracture is the sum of Wmode1 and Wmode2:
𝑊𝑓 = 𝑊𝑚𝑜𝑑𝑒 1 + 𝑊𝑚𝑜𝑑𝑒 2
Then, the fracture energy can be calculated using following equation:
f
f
lig
WG
A
where,
fG = fracture energy (J/m³)
ligA = (r-a) * t
Fracture toughness ( ICK ) is considered as the stress intensity factor at the critical load ( cP ).
The following equation can be used to calculate ICK :
. .IC I cK Y a
2
cc
P
rt
4.782 1.219 0.063exp 7.045I
a aY
r r
where,
cP = Peak load (MN)
r = sample radius (m)
t = sample thickness (m)
a = notch length (m)
IY = the normalized stress intensity factor (dimensionless)

16
5.2.2 Past Research about the SCB Test
To assess the low temperature cracking performance of warm mix asphalt (WMA), the SCB
test was performed on WMA samples at three different temperatures (-24, -12 and 0°C)
(Podolsky et al. 2014). As expected, the fracture energy increased as test temperature
increased. However, as shown in Figure 5-5, the average fracture energy values seemed to be
too high for all mixtures.
Fig 5-5: Fracture Energy Results (Podolsky et al. 2014)
As the test temperature increases, the fracture toughness is expected to increase. As can be
seen from Fig 5-6, the fracture toughness increased when the test temperature was increased
from -24 to -12°C but decreased when the test temperature increased from -12 to 0°C. The
reduction in fracture toughness can be attributed by the transition from elastic to viscoelastic
behavior when the temperature was increased from -12 to 0°C. As shown in Figure 5-7, the
stiffness decreased as the test temperature was increased.
Fig 5-6: Fracture Toughness Results (Podolsky et al. 2014)

17
Fig 5-7 Fracture Stiffness Results (Podolsky et al. 2014)
Recently, West et al. (2013) has performed a comprehensive SCB test and the fracture energy
and fracture toughness values are summarized for field mixtures from Utah, New Hampshire
and Minnesota in Figures 5-8 through Figure 5-13, respectively. As can be seen from these
figures, the fracture energy increased as the test temperature was increased. However, the
fracture energy did not always decreased as the amount of RAP materials was increased. The
average values of fracture energy were approximately 0.45, 0.6 and 0.3 kJ/m² for mixtures
from New Hampshire, Utah and Minnesota, respectively. Contrary to the study done by
Podolsky et al. (2014), the fracture toughness decreased as the temperature was increased.
Fig 5-8: Fracture Energy Results for New Hampshire Mixes (West et al. 2013)

18
Fig 5-9: Fracture Toughness Results for New Hampshire Mixes (West et al. 2013)
Fig 5-10: Fracture Energy Results for Utah Mixes (West et al. 2013)

19
Fig 5-11: Fracture Toughness Results for Utah Mixes (West et al. 2013)
Fig 5-12: Fracture Energy Results for Minnesota Mixes (West et al. 2013)

20
Fig 5-13: Fracture Toughness Results for Minnesota Mixes (West et al. 2013)
It is interesting to note that the control HMA mixtures tested by Podolsky (2014) exhibited a
high level of fracture energy of 1200 J/m² at -24ºC whereas the control HMA mixture
exhibited 500, 650 and 350 J/m² at -19 ºC , -25 ºC and -24 ºC, respectively, by West et al.
(2013). Tang (2014) investigated the fracture properties of high-RAP mixtures and examined
its variability with notch length, temperature and RAP content. Three different temperatures
were selected for SCB test on samples with the RAP contents of 30%, 40% and 50%. As
expected, the fracture energy increased as the test temperature was increased. However, the
fracture energy values did not show a good correlation with the amounts of the RAP materials.
As shown in Figure 5-14, the average values of fracture energy were 250, 300, 600 J/m² at -
30, -20 and -10°C, respectively. As shown in Figure 5-15, fracture toughness increased as the
test temperature was increased. However, there was no good correlation between the fracture
toughness and RAP amounts. Overall, the average values of fracture toughness were 300, 650
and 2100 J/m² at -30, -20 and -10°C, respectively.

21
Fig 5-14 Fracture Energy for Three Percentages of RAP at Different Temperatures
(Tang 2014)
Fig 5-15 Fracture Toughness at Different RAP Contents and Temperatures (Tang 2014)
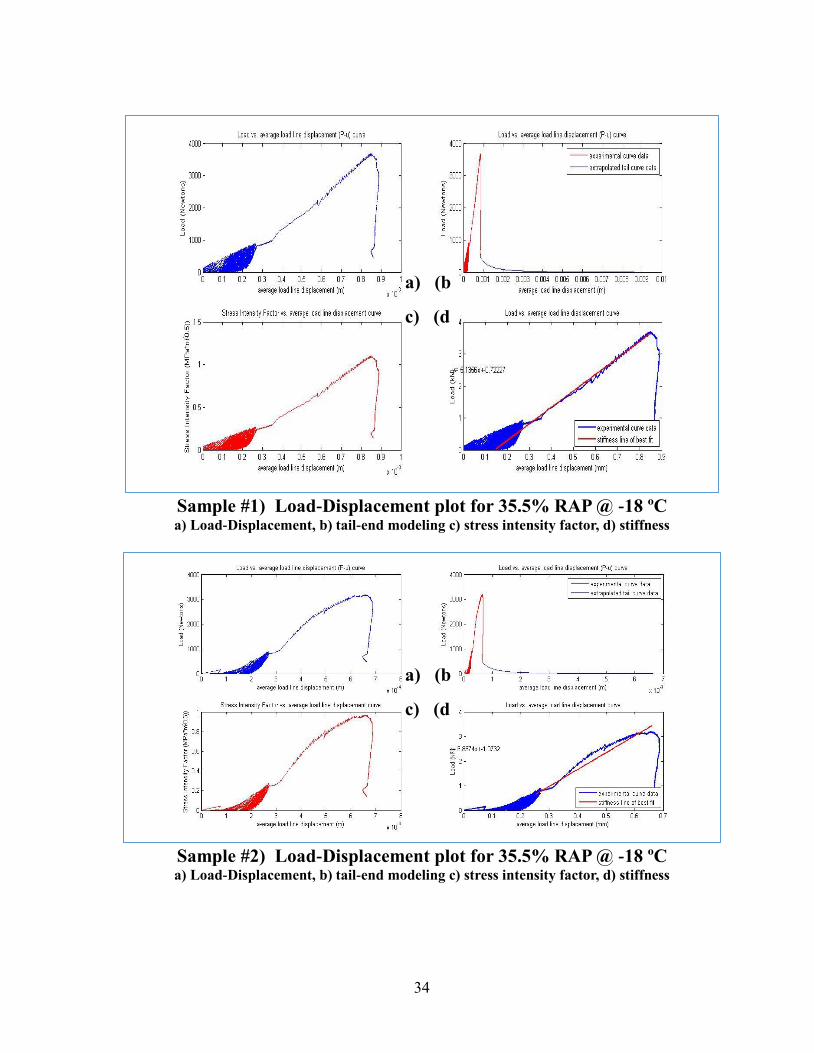
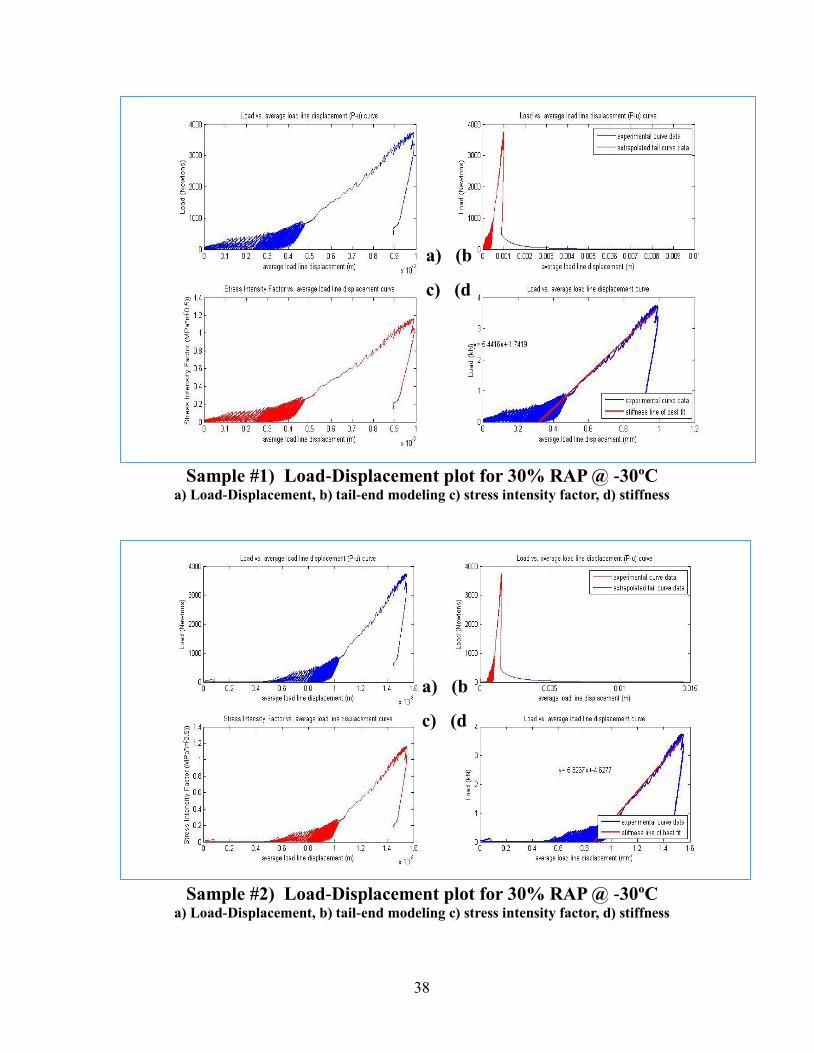
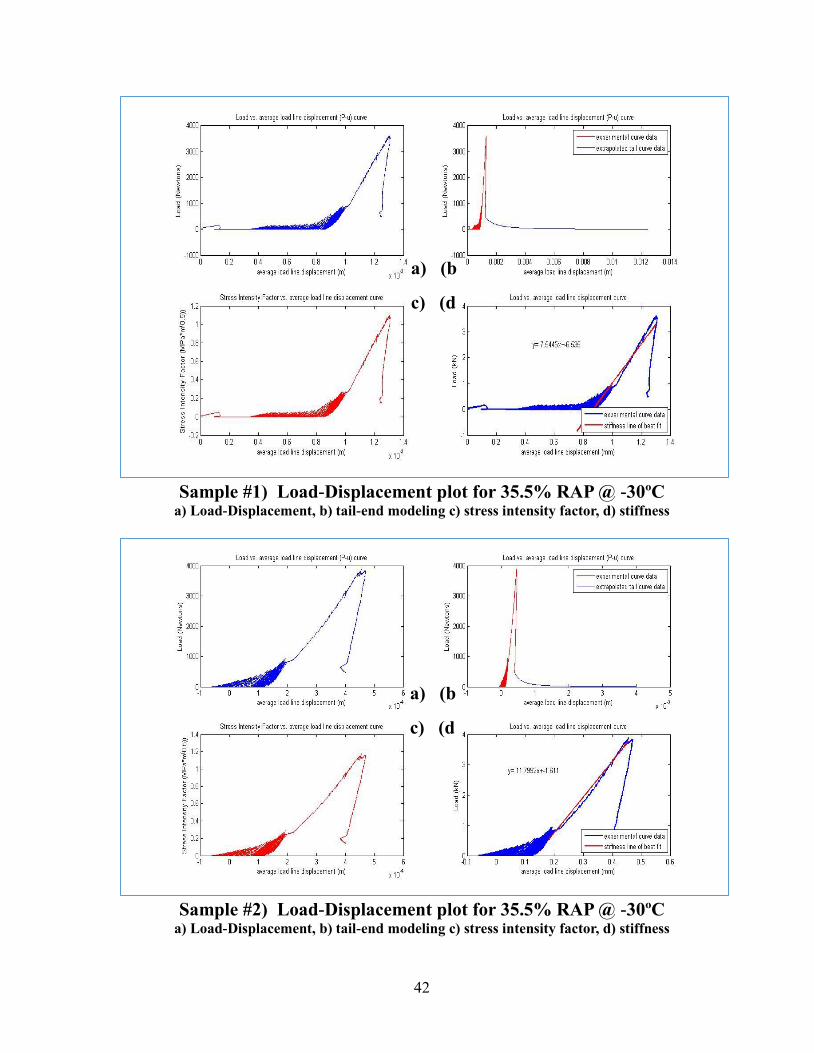
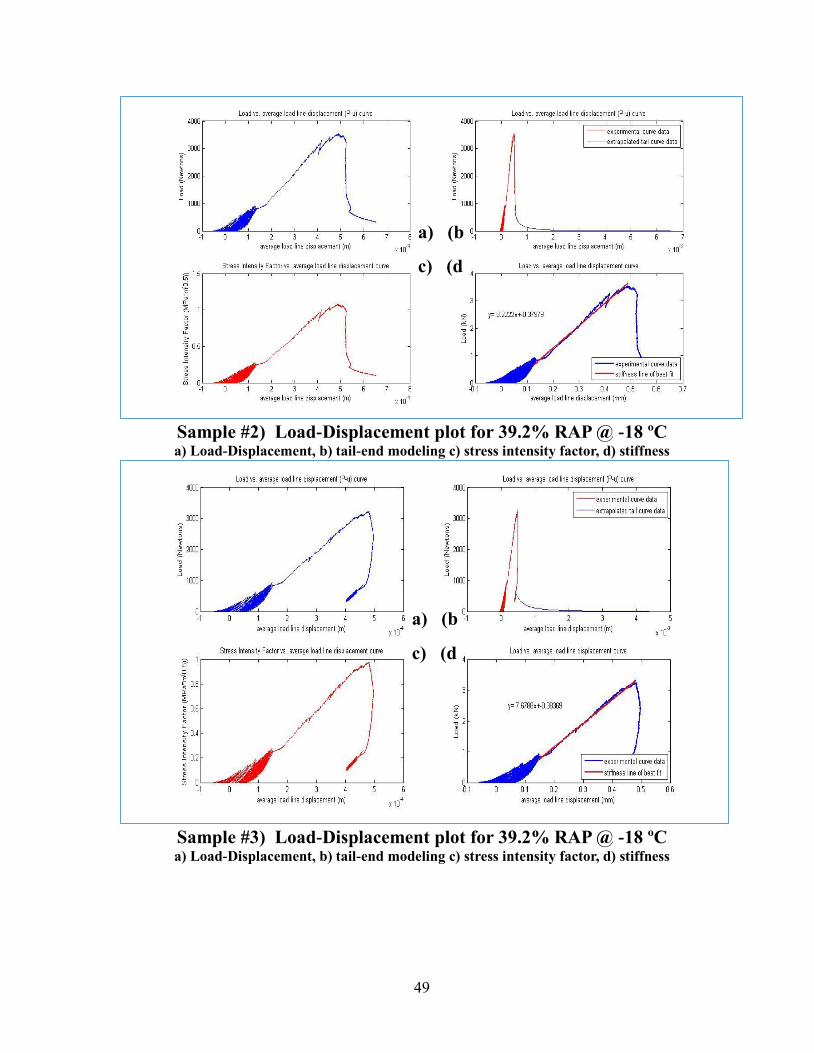
5.2.3 Results and Discussion
Fracture characteristics of field mixtures with varying RAP materials of 30.0%, 35.5%, and
39.2% by weight were measured using SCB test. For a given amount of RAP materials, three
specimens were tested at each of two different test temperatures of -18 and -30 °C. The
specimen and loading condition of SCB test are shown in Figure 5-16 and 5-17, respectively.

22
Figure 5-16: Specimens for SCB Test
Figure 5-17: A Typical Specimen under SCB Test Machine
The SCB test results were used to calculate fracture work (Wf), fracture energy (Gf), fracture
toughness (KIC), and stiffness (S) using the MATLAB software. Table 5-1 summarizes the
average value, the standard deviation and the covariance matrix computation (COV) of three
specimens for each test parameter. As shown in Figure 5-18, most specimens exhibited COV
values less than 25%, which indicates a satisfactory repeatability of the test procedure except
the specimens with 39.2% RAP content. As can be seen from Figure 5-18, as the test
temperature decreased, the fracture energy decreased and the stiffness increased. As the RAP
amount increased, the stiffness increased and the fracture energy decreased.

23
Table 5-1: Semi-Circular Bending Test Results
Temp. RAP
C % t Avg. STDEV Wf Wtail Avg. STDEV COV(%) Gf Gftail Avg. STDEV COV(%) kIC Avg. STDEV COV(%) S Avg. STDEV
25.2 1.45 0.39 957.20 258 0.93 3.98
25.6 1.16 0.31 688.43 203 0.99 6.00
25.3 0.9866 0.22 649.95 146 0.99 5.18
25.3 1.05 0.26 688.42 168 0.96 5.88
25.2 1.01 0.25 670.55 165 0.97 6.21
25.6 1.547 0.39 1007 251 1.10 5.09
25.3 0.83 0.22 545.34 142 0.98 7.78
25.1 1.0785 0.21 716.16 141 1.08 8.40
26 0.855 0.24 567.42 151 0.85 5.89
24.4 0.95 0.23 645.73 159 1.21 8.87
24.6 1.31 0.34 886.80 227 1.17 5.75
25 1.45 0.42 968.18 280 0.88 2.46
25.4 0.74 0.95 484.47 624 0.85 6.72
25.7 1.59 2.73 1030.00 - 0.97 3.36
25.5 1.07 0.32 700.04 212 0.91 4.67
24.4 0.90 0.24 616.62 165 1.06 7.13
25.3 0.62 0.91 411.08 - 1.17 13.82
25.2 0.90 0.30 593.84 196 1.10 8.98
-18
30
35.5
39.2
t (mm)
25.4 0.21
Stiffness (kN/mm)KIC (Mpa*m0.5)
0.97 0.03 3.49 5.05 1.020.08 7.09 765 56 7.3
Gf (J/m2)Wf (J)
1.20
0.92
25.4 0.21 1.20
25.5 0.47
0.08 6.39 789 49 6.2
0.01 1.41
1.01 0.08 8.06 5.73 0.58
610 6 0.9
0.18 16.43 5.69 3.21
0.97 0.12 11.96 7.36 1.31
7.59 834 61 7.3 1.08
42254145.56
0.15 1.13 1.25 110.25 39.5292738
3.459.984.930.051.11
1.694.926.780.060.91
30
-30
0.370.810.4925.039.2
24.7 0.31 1.24 0.09
25.535.5
Figure 5-18: Plot of SCB test parameters against RAP content
"'" ~ """ .. ~
~ " "'" , • " .., " = ,
"'" " 0
r-r-r-r-
r-r-
r-r-r-r-
r-r-
LO
~ " < , RAP Content ~ • 0.'
"'" ~ 0.' . 35 .5"
I T rl" r'" ....., I f----l- f-l- f- l-
" 1 39_2" fr 0.' t- f----, 0 0'
'" t- f----
0
." Temperl tu re r C) Temperl tu re f C)
" ,----" +_-------------4---1
~ lO +_------------~.~r_1 ~ Z C
o
." Temperature ("C)
RAP (ontent
· "'" • 35_5"
• 39.2"
--
--
--
--
--
--
-
I 1 _
~ = RAP Content
."" • 35 .5"
39.2"

24
6 FIELD PERFORMANCE OF HIGH RAP PAVEMENTS
On the night of September 8, 2013, three test sections, each with approximately 0.35 mile,
were constructed with a 1.5-inch thick surface layer on top of a 1.5-inch thick intermediate
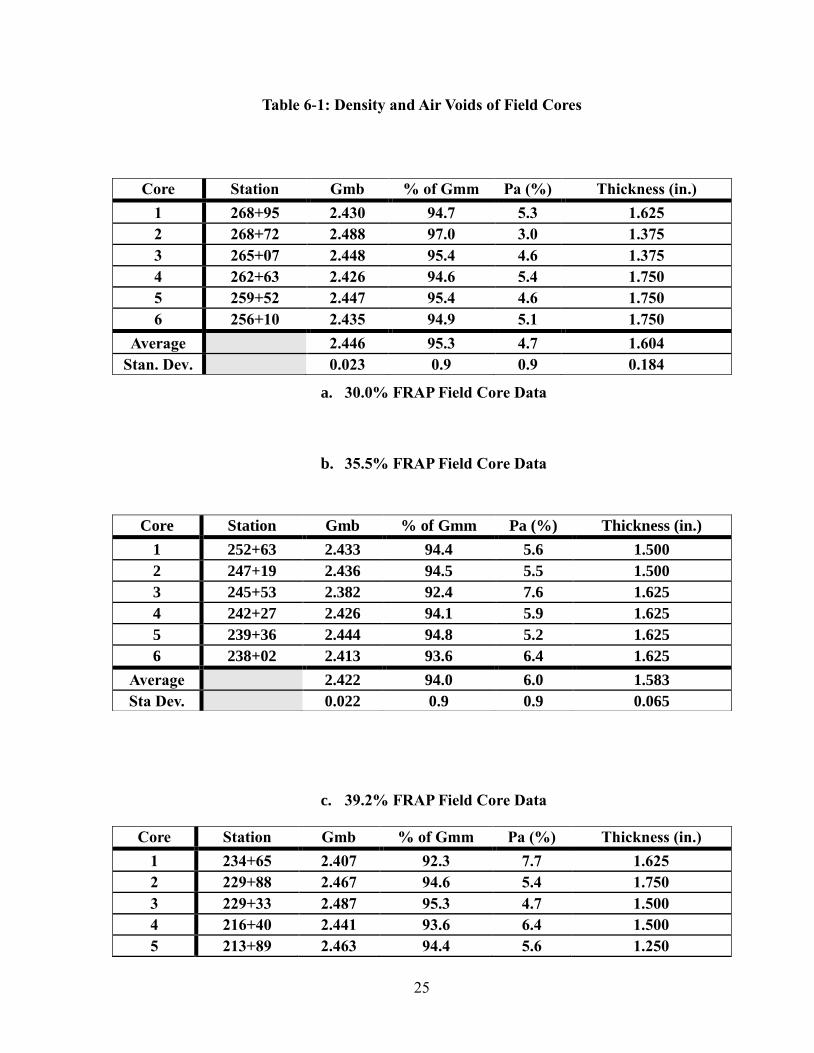
layer. The traffic level for the test sections is approximately 13,100 ADT with 24% trucks. As
summarized in Table 6-1, the average bulk-specific gravity of cores from the test sections with
30.0%, 35.5% and 39.2% FRAP were 2.446, 2.422 and 2.460, resulting in air voids of 4.7%,
6.0% and 5.7%, respectively. Since the target air voids are 6.0% +/- 2.0%, all three sections
met the field air void requirement.
6.1 Condition Survey of Test Sections
To evaluate the short-term performance of the test sections, a pavement condition survey was
performed on May 29, 2014, about 8 months after construction. Throughout the test section,
no distress was observed other than transverse cracking. As shown in Figure 6-1, a dominant
distress type was reflective joint cracking, which were typically spaced at about twenty feet
intervals. This extensive transverse cracking was likely caused by a combined effect of
underlying deteriorated concrete pavement joints and one of the coldest Iowa winters on the
record with many freeze and thaw cycles. Length and severity of transverse cracks were
measured and their results are summarized in Table 6-2. Considering RAP differences as the
only known factor for the evaluation of three test sections, the test section with 39.2% FRAP
performed the best followed by the test sections with 35.5% and 30.0% FRAP. Based on the
limited field data, it can be concluded that as the FRAP amount is increased; the amount of
transverse cracking is decreased.
25
Table 6-1: Density and Air Voids of Field Cores
a. 30.0% FRAP Field Core Data
b. 35.5% FRAP Field Core Data
c. 39.2% FRAP Field Core Data
Core Station Gmb % of Gmm Pa (%) Thickness (in.)
1 234+65 2.407 92.3 7.7 1.625
2 229+88 2.467 94.6 5.4 1.750
3 229+33 2.487 95.3 4.7 1.500
4 216+40 2.441 93.6 6.4 1.500
5 213+89 2.463 94.4 5.6 1.250
Core Station Gmb % of Gmm Pa (%) Thickness (in.)
1 268+95 2.430 94.7 5.3 1.625
2 268+72 2.488 97.0 3.0 1.375
3 265+07 2.448 95.4 4.6 1.375
4 262+63 2.426 94.6 5.4 1.750
5 259+52 2.447 95.4 4.6 1.750
6 256+10 2.435 94.9 5.1 1.750
Average 2.446 95.3 4.7 1.604
Stan. Dev. 0.023 0.9 0.9 0.184
Core Station Gmb % of Gmm Pa (%) Thickness (in.)
1 252+63 2.433 94.4 5.6 1.500
2 247+19 2.436 94.5 5.5 1.500
3 245+53 2.382 92.4 7.6 1.625
4 242+27 2.426 94.1 5.9 1.625
5 239+36 2.444 94.8 5.2 1.625
6 238+02 2.413 93.6 6.4 1.625
Average 2.422 94.0 6.0 1.583
Sta Dev. 0.022 0.9 0.9 0.065

26
6 209+39 2.493 95.6 4.4 1.250
Average 2.460 94.3 5.7 1.479
Stan. Dev. 0.032 1.2 1.2 0.200
(a) Low (b) Medium (c) High
Figure 6-1: Examples of low, medium, and high severity cracking
Table 6-2: Transverse Cracking Developed in Three Test Sections
Severity 30.0% FRAP 35.5% FRAP 39.2% FRAP
High 0 ft 12 ft 0 ft
Medium 288 ft 216 ft 84 ft
Low 411 ft 315 ft 366 ft
Total 699 ft 531 ft 450 ft
Section Length 1841 ft 1787 ft 1787 ft
Per 100’ Sta. 38.0 ft 29.7 ft 25.2 ft

27
Figure 6-2: Length of Reflective Cracking Measured from Each Test Section

28
7 SUMMARY AND CONCLUSION
This report discusses efforts to evaluate test sections constructed with varying amounts of
RAP materials. First, the sieve analysis of the classified RAP materials identified the
distribution of aggregates and binder associated with RAP materials retained on each sieve.
RAP materials were then fractionated by removing fine RAP materials passing the 5/16”
sieve. Mix designs were performed on mixtures with target amounts of Fractionated RAP
(FRAP) materials of 30%, 35% and 40% by weight and they passed all volumetric design
criteria except VMA. It can be concluded that the fractionation was effective in improving
volumetric properties of HMA mixtures with a high RAP content.
Three test sections with actual amounts of 30.0%, 35.5% and 39.2% FRAP were constructed
on Highway 6 in Iowa City, Iowa and the average field densities measured from the cores
were 95.3%, 94.0%, and 94.3%, respectively, which met density requirement of 94% ± 2.0%.
Superpave binder tests were then performed in order to determine the binder grade of
extracted binder from field mixtures with varying FRAP amounts. Based on the limited test
results, it can be concluded that as the RAP material is increased, both high and low
temperatures of performance grade of the asphalt binder are also increased.
Field mixtures were compacted in the laboratory to evaluate the moisture sensitivity using a
Hamburg Wheel Tracking (HWT) device and rut depths after 20,000 passes were less than
3mm for all three test sections. To evaluate the low temperature cracking resistance of asphalt
mixtures, the Semi-Circular Bending (SCB) test was performed on specimens with 30.0%,
35.5% and 39.2% RAP materials by weigh at two different temperatures of -18°C and -30°C.
As expected, the fracture energy decreased when the test temperature decreased. As the test
temperature decreased, the fracture energy decreased and the stiffness increased. As the RAP
amount increased, the stiffness increased and the fracture energy decreased.
Finally, a condition survey was performed on the test sections with varying FRAP contents to
evaluate their relative performances in the 8 months after construction. The test section with
39.2% FRAP performed the best followed by 35.5% FRAP and 30.0% FRAP. As the FRAP
amount was increased from 30.0% to 39.2%; the amount of transverse cracking decreased by
approximately by 34%.

29
7.1 Proposed Phase 3 Study
The phase 2 study demonstrated a potential of using RAP materials up to 40% by weight.
However, to further improve the low temperature cracking behavior, the use of the rejuvenator
should be considered. The main objective the phase 3 study is to develop a set of tools to
evaluate various rejuvenators for its effectiveness in chemically restoring the maltenes that
would be compatible with the original asphaltenes. The proposed research should be
performed in four tasks.
First, a diffusion of rejuvenators in hardened asphalt should be examined using Fourier
Transform Infrared Spectroscopy (FTIR). The absorbance differences for different
wavenumbers can be used to assess the diffusion rate of various rejuvenators. X-Ray
Fluorescence technology (XRF) should be also considered for evaluating the elements in the
diffused interface. Atomic Force Microscopy (AFM) should be used to measure the nanoscale
surface morphology and mechanical properties of the extracted asphalt with various
rejuvenators. How the rejuvenator diffuse with the extracted asphalt should be investigated to
identify the rejuvenation mechanism of extracted asphalt. Both topographical and mechanical
properties should be simultaneously captured by recording instantaneous force curves as the
AFM probe approaches and retracts from the diffused surface of the extracted asphalt with
various rejuvenators. The dissipated energy and elastic vs. damping ratio of diffused interface
should be measured at nanoscale pixel level and, as a result, a signature map should be
obtained.
Second, the effect of the rejuvenators on the PG grade of hardened asphalt should be
evaluated. A set of Superpave binder tests including Multiple Stress Creep Recovery (MSCR)
test should be performed on hardened asphalt with and without rejuvenators. Different types
and dosages of the rejuvenator should be added to the hardened asphalt to evaluate their
effects on the properties of hardened asphalt.
Third, the moisture susceptibility of high Recycled Asphalt Materials (RAM) mix with and
without rejuvenators should be evaluated using HWT device. The effects of rejuvenators on
the low-temperature characteristics of high-RAM mixtures should be examined using the
Disk-Shaped Compact Tension Test (DCT). Dynamic modulus and flow number of high
RAM mixtures should be measured using Asphalt Material Performance Tester (AMPT).
Fatigue performance of specimens with and without rejuvenators should be also evaluated.
Fourth, to evaluate field performance of high RAM mixtures with and without select
rejuvenator(s), test sections should be constructed. The field loose mixtures and cores should
be tested using HWT, DCT, AMPT testing equipment and compared against the test results of
laboratory mixtures. The short-term condition survey should be performed on the test sections
with or without select rejuvenator(s).
30
8 REFERENCES
Al-Qadi, I. L., M. A. Elseifi and S. H. Carpenter, “Reclaimed Asphalt Pavement – A
Literature Review,” Research Report FHWA-ICT-07-001, Illinois Center for
Transportation, March 2007.
Bennert, T., J. S. Daniel, and W. Mogawer. Strategies for Incorporating Higher RAP
Percentages: Review of Northeast States Implementation Trials. Presented at 93rd
Annual Meeting of the Transportation Research Board, Washington, D.C., 2014.
Boriack, P., S. W. Katicha, and G. W. Fintsch. A Laboratory Study on the Effect of High
RAP and High Asphalt Binder Content on the Stiffness, Fatigue Resistance and
Rutting Resistance of Asphalt Concrete. Presented at 93rd
Annual Meeting of the
Transportation Research Board, Washington, D.C., 2014.
Buss, A., & Williams, R. C. (2013). Investigation of Warm Mix Asphalt for Iowa
Roadways–Phase II.
Diefenderfer, S. and N. Harikrishnan. Evaluation of High RAP Mixture Production,
Construction, and Properties. Presented at 93rd
Annual Meeting of the Transportation
Research Board, Washington, D.C., 2014.
Huang, B., G. Li, D. Vukosavljevic, X. Shu and B. K. Egan, “Laboratory Investigation of
Mixing Hot-Mix Asphalt with Reclaimed Asphalt Pavement,” Transportation Research
Record: Journal of the Transportation Research Board, No. 1929, Washington, D.C.,
2005, pp. 37-45.
Iowa DOT, “Supplemental Specifications for Recycled Asphalt Pavement (RAP),”
effective on January 20, 2010.
Maupin, G. W., S. D. Diefenderfer and J. S. Gillespie, “Evaluation of Using Higher
Percentages of Recycled Asphalt Pavement in Asphalt Mixes in Virginia,” VTRC 08-
R22, VTRC, June 2008.
McDaniel, R. S. and R. M. Anderson, “Recommended Use of Reclaimed Asphalt
Pavement in the Superpave Mix Design Method: Technicians Manual,” NCHRP
Report 452, TRB, Washington, D.C., 2001.
McDaniel, R. S., H. Soleymani and A. Shah, “Use of Reclaimed Asphalt Pavement (RAP)
Under Superpave Specifications,” FHWA/IN/JRRP-2002/6, Purdue University, 2002.
NCAT, “Asphalt Technology News,” Vol. 22, No. 1, Spring 2010.
Podolsky, J. H., Buss, A., Williams, R. C., & Cochran, E. (2014). Comparative
performance of bio-derived/chemical additives in warm mix asphalt at low
temperature. Materials and Structures, 1-13.
Stephens, J. E., J. Mahoney, and C. Dippold, “Determination of the PG Binder Grade to
Use in a RAP Mix,” Report No. JHR 00-278, Connecticut Department of
Transportation, 2001.
Tang, S. (2014). Evaluate The Fracture and Fatigue Resistances of Hot Mix Asphalt
Containing High Percentage Reclaimed Asphalt Pavement (RAP) Materials at Low
and Intermediate Temperatures. Iowa State Thesis.
Udelhofen, G., “High RAP Design Works,” Asphalt Contractor, January 2007.
Udelhofen, G., “Overland Park Successfully Constructs First FRAP Project,” Asphalt
Contractor, May 2010.
West, R. C., Willis, J. R., & Marasteanu, M. O. (2013). Improved mix design, evaluation,

31
and materials management practices for hot mix asphalt with high reclaimed asphalt
pavement content: Transportation Research Board.
Wisconsin DOT, “Section 460 Hot Mix Asphalt Pavement,” 2010 Standard Specifications,
effective in December, 2009.

32
Appendix A: SCB Output Graphs
Sample #1) Load-Displacement plot for 30% RAP @ -18 ºC
a) Load-Displacement, b) tail-end modeling c) stress intensity factor, d) stiffness
Sample #2) Load-Displacement plot for 30% RAP @ -18 ºC a) Load-Displacement, b) tail-end modeling c) stress intensity factor, d) stiffness
a) (b
c) (d
a) (b
c) (d

33
Sample #3) Load-Displacement plot for 30% RAP @ -18 ºC
a) Load-Displacement, b) tail-end modeling c) stress intensity factor, d) stiffness
a) (b
c) (d
34
Sample #1) Load-Displacement plot for 35.5% RAP @ -18 ºC a) Load-Displacement, b) tail-end modeling c) stress intensity factor, d) stiffness
Sample #2) Load-Displacement plot for 35.5% RAP @ -18 ºC a) Load-Displacement, b) tail-end modeling c) stress intensity factor, d) stiffness
a) (b
c) (d
a) (b
c) (d

35
Sample #3) Load-Displacement plot for 35.5% RAP @ -18 ºC a) Load-Displacement, b) tail-end modeling c) stress intensity factor, d) stiffness
a) (b
c) (d

36
Sample #1) Load-Displacement plot for 39.2% RAP @ -18 ºC a) Load-Displacement, b) tail-end modeling c) stress intensity factor, d) stiffness
Sample #2) Load-Displacement plot for 39.2% RAP @ -18 ºC a) Load-Displacement, b) tail-end modeling c) stress intensity factor, d) stiffness
a) (b
c) (d
a) (b
c) (d

37
Sample #3) Load-Displacement plot for 39.2% RAP @ -18 ºC a) Load-Displacement, b) tail-end modeling c) stress intensity factor, d) stiffness
a) (b
c) (d
38
Sample #1) Load-Displacement plot for 30% RAP @ -30ºC
a) Load-Displacement, b) tail-end modeling c) stress intensity factor, d) stiffness
Sample #2) Load-Displacement plot for 30% RAP @ -30ºC
a) Load-Displacement, b) tail-end modeling c) stress intensity factor, d) stiffness
a) (b
c) (d
a) (b
c) (d

39
Sample #3) Load-Displacement plot for 30% RAP @ -30ºC
a) Load-Displacement, b) tail-end modeling c) stress intensity factor, d) stiffness
a) (b
c) (d

40
Sample #1) Load-Displacement plot for 35.5% RAP @ -30ºC
a) Load-Displacement, b) tail-end modeling c) stress intensity factor, d) stiffness
Sample #2) Load-Displacement plot for 35.5% RAP @ -30ºC
a) Load-Displacement, b) tail-end modeling c) stress intensity factor, d) stiffness
a) (b
c) (d
a) (b
c) (d

41
Sample #3) Load-Displacement plot for 35.5% RAP @ -30ºC
a) Load-Displacement, b) tail-end modeling c) stress intensity factor, d) stiffness
a) (b
c) (d
42
Sample #1) Load-Displacement plot for 35.5% RAP @ -30ºC
a) Load-Displacement, b) tail-end modeling c) stress intensity factor, d) stiffness
Sample #2) Load-Displacement plot for 35.5% RAP @ -30ºC
a) Load-Displacement, b) tail-end modeling c) stress intensity factor, d) stiffness
a) (b
c) (d
a) (b
c) (d

43
Sample #3) Load-Displacement plot for 35.5% RAP @ -30ºC
a) Load-Displacement, b) tail-end modeling c) stress intensity factor, d) stiffness
Al-Qadi, I. L., M. Elseifi and S. H. Carpenter (2007). "Reclaimed asphalt pavement–a
literature review."
Bennert, T., J. S. Daniel and W. Mogawer (2014). Strategies for Incorporating Higher RAP
Percentages: Review of Northeast States Implementation Trials. Transportation Research
Board 93rd Annual Meeting.
Boriack, P., S. W. Katicha, and G. W. Fintsch (2014). "A Laboratory Study on the Effect of
High RAP and High Asphalt Binder Content on the Stiffness, Fatigue Resistance and
Rutting Resistance of Asphalt Concrete." 93rd Annual Meeting of the Transportation
Research Board.
Buss, A. and R. C. Williams (2013). Investigation of Warm Mix Asphalt for Iowa Roadways–
Phase II.
Diefenderfer, S. and H. Nair (2014). Evaluation of High RAP Mixture Production,
Construction, and Properties. Transportation Research Board 93rd Annual Meeting.
Huang, B., G. Li, D. Vukosavljevic, X. Shu and B. K. Egan (2005). "Laboratory investigation
of mixing hot-mix asphalt with reclaimed asphalt pavement." Transportation Research
Record: Journal of the Transportation Research Board 1929(1): 37-45.
Iowa-DOT (2010). "Supplemental Specifications for Recycled Asphalt Pavement (RAP)."
Maupin Jr, G., S. D. Diefenderfer and J. S. Gillespie (2008). Evaluation of Using higher
percentages of recycled asphalt pavement in asphalt mixes in Virginia.
McDaniel, R., H. Soleymani and A. Shah (2002). "Use of reclaimed asphalt pavement (RAP)
under Superpave specifications: A regional pooled fund project."
a) (b
c) (d

44
McDaniel, R. S., H. Soleymani, R. M. Anderson, P. Turner and R. Peterson (2000).
"Recommended use of reclaimed asphalt pavement in the Superpave mix design method."
NCHRP Web document 30.
NCAT (2010). "Asphalt Technology News." Vol. 22, No. 1.
Podolsky, J. H., A. Buss, R. C. Williams and E. Cochran (2014). "Comparative performance
of bio-derived/chemical additives in warm mix asphalt at low temperature." Materials and
Structures: 1-13.
Stephens, J. E., J. Mahoney and C. Dippold (2001). "Determination of the PG Binder Grade to
Use in a RAP Mix." Report No. JHR 00-278, Connecticut Department of Transportation.
Tang, S. (2014). "Evaluate The Fracture and Fatigue Resistances of Hot Mix Asphalt
Containing High Percentage Reclaimed Asphalt Pavement (RAP) Materials at Low and
Intermediate Temperatures." Iowa State Thesis.
Udelhofen, G. (2007). "High RAP Design Works." Asphalt Contractor.
Udelhofen, G. (2010). "Overland Park Successfully Constructs First FRAP Project." Asphalt
Contractor.
West, R. C., J. R. Willis and M. O. Marasteanu (2013). Improved mix design, evaluation, and
materials management practices for hot mix asphalt with high reclaimed asphalt pavement
content, Transportation Research Board.
Wisconsin-DOT (2009). "Section 460 Hot Mix Asphalt Pavement." 2010 Standard
Specifications.
Appendix A: SCB Output Graphs
a) (b
c) (d

45
Sample #1) Load-Displacement plot for 30% RAP @ -18 ºC a) Load-Displacement, b) tail-end modeling c) stress intensity factor, d) stiffness
Sample #2) Load-Displacement plot for 30% RAP @ -18 ºC a) Load-Displacement, b) tail-end modeling c) stress intensity factor, d) stiffness
Sample #3) Load-Displacement plot for 30% RAP @ -18 ºC
a) Load-Displacement, b) tail-end modeling c) stress intensity factor, d) stiffness
a) (b
c) (d
a) (b
c) (d

46
Sample #1) Load-Displacement plot for 35.5% RAP @ -18 ºC a) Load-Displacement, b) tail-end modeling c) stress intensity factor, d) stiffness
a) (b
c) (d

47
Sample #2) Load-Displacement plot for 35.5% RAP @ -18 ºC a) Load-Displacement, b) tail-end modeling c) stress intensity factor, d) stiffness
Sample #3) Load-Displacement plot for 35.5% RAP @ -18 ºC a) Load-Displacement, b) tail-end modeling c) stress intensity factor, d) stiffness
a) (b
c) (d
a) (b
c) (d

48
Sample #1) Load-Displacement plot for 39.2% RAP @ -18 ºC a) Load-Displacement, b) tail-end modeling c) stress intensity factor, d) stiffness
a) (b
c) (d
49
Sample #2) Load-Displacement plot for 39.2% RAP @ -18 ºC a) Load-Displacement, b) tail-end modeling c) stress intensity factor, d) stiffness
Sample #3) Load-Displacement plot for 39.2% RAP @ -18 ºC a) Load-Displacement, b) tail-end modeling c) stress intensity factor, d) stiffness
a) (b
c) (d
a) (b
c) (d

50
Sample #1) Load-Displacement plot for 30% RAP @ -30ºC
a) Load-Displacement, b) tail-end modeling c) stress intensity factor, d) stiffness
Sample #2) Load-Displacement plot for 30% RAP @ -30ºC
a) Load-Displacement, b) tail-end modeling c) stress intensity factor, d) stiffness
a) (b
c) (d
a) (b
c) (d

51
Sample #3) Load-Displacement plot for 30% RAP @ -30ºC
a) Load-Displacement, b) tail-end modeling c) stress intensity factor, d) stiffness
a) (b
c) (d

52
Sample #1) Load-Displacement plot for 35.5% RAP @ -30ºC
a) Load-Displacement, b) tail-end modeling c) stress intensity factor, d) stiffness
Sample #2) Load-Displacement plot for 35.5% RAP @ -30ºC
a) Load-Displacement, b) tail-end modeling c) stress intensity factor, d) stiffness
a) (b
c) (d
a) (b
c) (d

53
Sample #3) Load-Displacement plot for 35.5% RAP @ -30ºC
a) Load-Displacement, b) tail-end modeling c) stress intensity factor, d) stiffness
a) (b
c) (d

54
Sample #1) Load-Displacement plot for 35.5% RAP @ -30ºC
a) Load-Displacement, b) tail-end modeling c) stress intensity factor, d) stiffness
Sample #2) Load-Displacement plot for 35.5% RAP @ -30ºC
a) Load-Displacement, b) tail-end modeling c) stress intensity factor, d) stiffness
a) (b
c) (d
a) (b
c) (d

55
Sample #3) Load-Displacement plot for 35.5% RAP @ -30ºC
a) Load-Displacement, b) tail-end modeling c) stress intensity factor, d) stiffness
a) (b
c) (d


![INDEX [publications.iowa.gov]publications.iowa.gov/28669/1/Iowa_Conservationist_Index_1952_19… · "Crawfish vs Tu1llt>," ~l'pt 53, p 166 cno·w "Fasl Gro,ving VY'inlt•l Sport,"](https://img.pdfslide.net/doc/110x75/5fd3468b8b61fb082725cec4/index-crawfish-vs-tu1llt-lpt-53-p-166-cnow-fasl-groving.jpg)


![INDEX [publications.iowa.gov]publications.iowa.gov/28918/1/Iowa_Conservationist_Index_1964_19… · INDEX IOWA CONSERVATIONIST, VOLUMES 23 AND 24 January. 1964, to December. 1965](https://img.pdfslide.net/doc/110x75/5f541c66934bff731c34d6a9/index-index-iowa-conservationist-volumes-23-and-24-january-1964-to-december.jpg)