Embed Size (px)
Citation preview

Development of rapid tests for the detection of L-malic
acid in wine using enzymes immobilized on paper via
carbohydrate-binding modules
Ana Catarina dos Reis Faria
Thesis to obtain the Master of Science Degree in
Biotechnology
Supervisor: Prof. Duarte Miguel de França Teixeira dos Prazeres
Examination Committee
Chairperson: Prof. Isabel Maria de Sá Correia Leite de Almeida
Supervisor: Prof. Duarte Miguel de França Teixeira dos Prazeres
Member of the Committee: Prof. Luís Manuel dos Anjos Ferreira
November 2014

i
Acknowledgements
I would like to thank all the people who contributed to the development of this work. First I would
like to thank my supervisor Prof. Miguel Prazeres for accepting me for this project, for the constant
guidance, support, patience and constructive critiques through the learning process of this master thesis.
I also would like to thank NZYTech, Lda for providing material required for this work, for the availability
and advices.
I also would like to thank my colleagues from the lab for providing a friendly and cooperative
atmosphere at work and also by the useful feedback and insightful comments on my work. I would like
to show my gratitude to Jorge Paulo who constantly helped me on my research and without his efforts
my job would have undoubtedly been more difficult. It was a pleasure to work with you all.
I would like to thank Cláudio for the constant encouragement, for cheer me up when I have needed
it the most, for his love and comprehension. Finally, words cannot express how grateful I am to my mom,
dad, stepfather, sister and brother for the unequivocal support throughout my academia life, for the love
and encouragement.
Thank you all.

ii
Abstract
L-malic acid influences the flavor and aroma of wine, and ultimately its quality. A close monitoring
of this compound is thus of utmost importance to wine makers. The objective of this work was to develop
a colorimetric, wax-printed microfluidic paper-based analytical device (µPAD) to detect L-malic acid in
wine suitable for the winemaking industry. The device relies on the immobilization of L-malate
dehydrogenase (MDH) and aspartate aminotransferase (AST) together with chromogenic reagents
(PMS-MTT system) onto paper, which in the presence of the analyte result in a purple product. The
color intensity increases proportionally with the analyte concentration, and detection can be achieved
by visual read-out or by quantification using a scanner and an image analysis software. The analytical
performance of the µPAD was linear from 5 to 150 mg/L with a limit of detection of 5.8 mg/L. Although
precise and with a good repeatability, after storage at 4 ºC devices present a low activity. Furthermore,
color inhomogeneity was present when a lateral-flow design was adopted.
Another goal of this work was to fuse the two analytical enzymes with the carbohydrate binding
module from C. thermocellum (CBM3), in order to achieve an affinity immobilization on cellulose and
overcome some of the previous limitations (stability, color inhomogeneity). AST-CBM3 was cloned,
produced and purified successfully. The analytical performance of the µPAD was not affected by the
use of AST-CBM3, but when in imidazole at pH 7.5, the reaction was faster (10 min) and the shelf-time
of the device increased. Real samples were analyzed and the results obtained were similar to those
obtained with a commercial kit, demonstrating that the µPAD is suitable to determine L-malic acid in
wine.
Keywords: Microfluidic paper-based analytical device, Colorimetric detection, L-malic acid,
Carbohydrate- binding module (CBM), Fusion proteins, Wine

iii
Resumo
O ácido málico é um ácido orgânico que influencia as propriedades organoléticas do vinho,
incluindo o sabor e o aroma, afetando a sua qualidade. Assim, é essencial a sua monitorização na
indústria vinícola. O objetivo deste trabalho é desenvolver um teste colorimétrico em microfluídica de
papel para detetar ácido málico em vinhos que seja adequado à indústria vinícola. O teste baseia-se
na imobilização das enzimas L-malato desidrogenase (L-MDH) e aspartato aminotransferase (AST)
juntamente com substratos colorimétricos em papel, que na presença do analito dão origem a um
produto roxo. A intensidade da cor obtida aumenta proporcionalmente com a concentração de ácido
málico. Esta pode ser detetada visualmente ou para uma quantificação precisa é necessário um scaner
e um programa de análise de imagens. O teste é linear entre 5 e 150 mg/L, com um limite de deteção
de 5.8 mg/L. Apesar de ser preciso e apresentar uma elevada repetibilidade, após armazenamento a 4
ºC, o dispositivo apresenta uma atividade reduzida e nos dispositivos de fluxo lateral foi observada uma
heterogeneidade na cor obtida.
Para contornar estas limitações, foram criadas duas proteínas de fusão, entre as enzimas
utilizadas e um módulo de ligação a carbohidratos de C. thermocellum (CBM3), para aumentar a
afinidade para a celulose. A AST-CBM3 foi clonada, produzida e purificada com sucesso, apresentando
uma elevada afinidade para a celulose. O desempenho analítico do dispositivo não foi diretamente
afetado pelo uso da AST-CBM3, contudo quando num tampão de imidazole a pH 7.5 a reação mostrou-
se mais rápida (10 min) e a estabilidade ao longo do tempo mais elevada. Procedeu-se à análise de
amostras reais e os resultados obtidos foram semelhantes aos obtidos com um kit comercial, o que
comprova que este dispositivo em papel é adequado para a deteção de ácido málico em vinhos.
Palavras-chave: Microfluídica em papel, Deteção colorimétrica, Ácido málico, Módulo de ligação a
carbohidratos, Proteínas de fusão, Vinho

iv
Table of contents
Acknowledgements .........................................................................................................................i
Abstract .......................................................................................................................................... ii
Resumo ......................................................................................................................................... iii
Table of contents ........................................................................................................................... iv
List of figures ................................................................................................................................. vi
List of tables ...................................................................................................................................x
List of abbreviations ...................................................................................................................... xi
Chapter 1. Introduction .............................................................................................................. 1
1.1 L-Malic acid, an organic acid present in wine .................................................................. 1
1.2 Microfluidic paper-based analytical devices (μPADs) ..................................................... 4
1.2.1 Paper structure ........................................................................................................ 5
1.2.2 Paper as a component of lateral flow tests ............................................................. 6
1.2.3 Fabrication technique of paper-based analytical devices........................................ 8
1.2.4 Paper functionalization – Bioactive paper ............................................................. 12
1.2.5 Detection methods used in µPADs ........................................................................ 14
1.3 Carbohydrate-binding modules ..................................................................................... 17
1.3.1 Carbohydrate binding module family 3 .................................................................. 18
Chapter 2. Objectives .............................................................................................................. 22
Chapter 3. Methods and Materials .......................................................................................... 23
3.1 Chemicals and Materials ............................................................................................... 23
3.2 Microfluidic paper analytical device (µPAD) fabrication ................................................ 23
3.3 Colorimetric detection of L-malic acid using a µPAD .................................................... 24
3.3.1 Physical immobilization of L-MDH and AST on paper ........................................... 24
3.3.2 Physical immobilization of L-MDH and AST with chromogenic reagents on paper –
Optimized protocol ......................................................................................................................... 24
3.4 µPAD optimization ......................................................................................................... 25
3.5 µPAD analytical performance ........................................................................................ 26
3.6 Self-stability ................................................................................................................... 26
3.7 Detection of L-malic acid using a lateral-flow µPAD ..................................................... 27

v
3.8 Construction of pET21a_AST-CBM3 and pET21a_MDH-CBM3 .................................. 27
3.8.1 Plasmids ................................................................................................................ 27
3.8.2 Construction of pET21a_AST-CBM3 and pET21a_MDH-CBM3 .......................... 28
3.9 Expression and purification of AST protein and fused protein AST-CBM3 ................... 29
3.10 Binding activity of AST-CBM3 fusion protein to cellulose.......................................... 31
3.11 Activity of AST-CBM3 fusion protein on paper .......................................................... 31
3.12 Detection of L-malic acid in wine ............................................................................... 33
3.12.1 Wines tested .......................................................................................................... 33
3.12.2 Colorimetric detection ........................................................................................... 33
3.12.3 UV detection of L-malic acid ................................................................................. 33
3.12.4 Spiking ................................................................................................................... 34
Chapter 4. Results and Discussion ......................................................................................... 35
4.1 Colorimetric detection of L-malic acid using a µPAD .................................................... 35
4.2 µPAD optimization ......................................................................................................... 36
4.3 µPAD analytical performance ........................................................................................ 40
4.4 Adaptation to a lateral flow test ..................................................................................... 43
4.5 AST-CBM3 fusion protein – Cloning, expression and purification ................................ 45
4.6 Binding activity of AST-CBM3 fusion protein to cellulose.............................................. 47
4.7 Activity of AST-CBM3 fusion protein on paper .............................................................. 48
4.8 L-malic acid detection in wine ........................................................................................ 54
Chapter 5. Conclusions and Future work ................................................................................ 60
Chapter 6. References ............................................................................................................ 62

vi
List of figures
Figure 1. Schematic representation of L-malic acid metabolic pathway in grapevine. Emphasis is placed
on the synthesis and catabolism by cytosolic and mitochondrial malate dehydrogenases, respectively.
L-malic acid catabolism may occur either by TCA cycle (green arrows) or by gluconeogenesis (blue
arrows), with the final goal of obtaining carbon or energy during grapevine ripening. The remaining
enzymes involved in the process are indicated with numbers: 1- Phosphoenolpyruvate carboxylase, 2-
Cytosolic phosphoenolpyruvate carboxykinase, 3- Cytosolic malic enzyme, 4- Mitochondrial malic
enzyme, 5- Mitochondrial phosphoenolpyruvate carboxykinase. Adapted from [5]. ............................... 2
Figure 2. Reaction scheme for the detection of L-malic acid using an UV method. NADH formed is
measured at 340 nm and is proportional to the amount of L-malic acid in the sample. .......................... 3
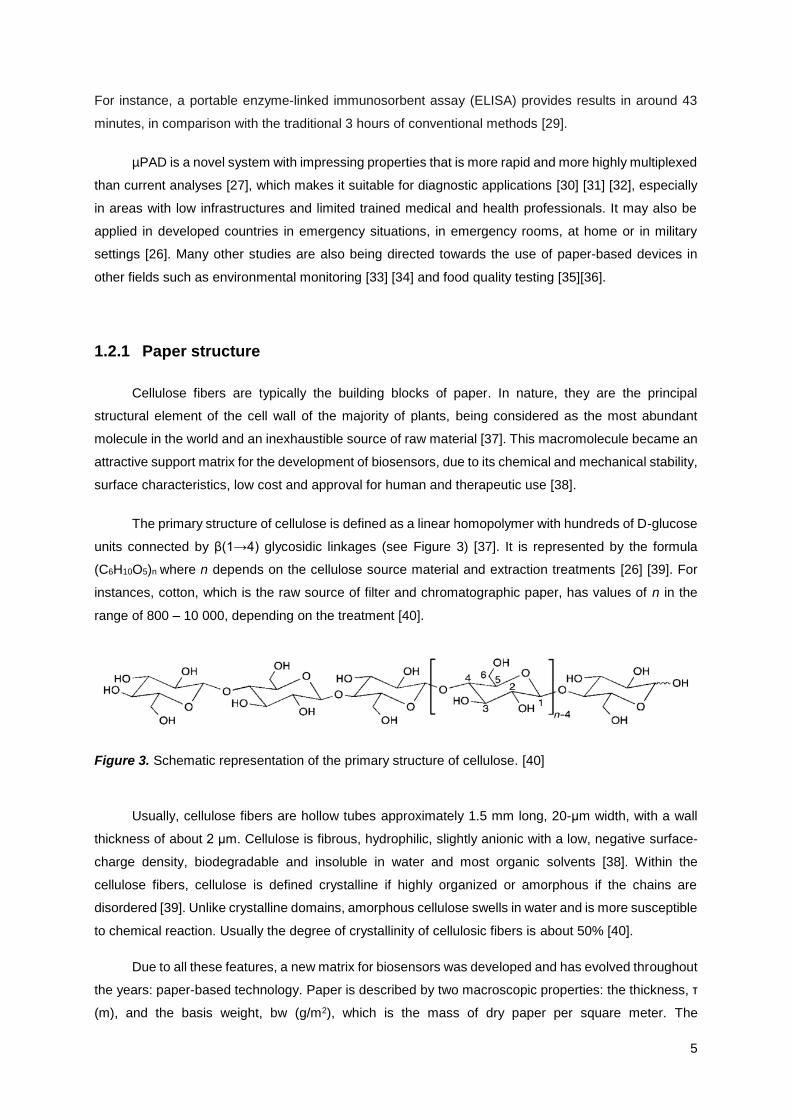
Figure 3. Schematic representation of the primary structure of cellulose. [40] ...................................... 5
Figure 4. Paper-based analytical device created by Whiteside’s group. A) Glucose is tested in the
circular region on the left, while protein is tested on the square region on the right. The circular region
on the top was used as a control. B) After addition on the central channel, the sample is guided to the
three reactive chambers by capillary action. Positive results for glucose and protein are presented on
the left and on the right, respectively. Adapted from [20] ........................................................................ 7
Figure 5. A) Front view of printed horizontal lines demonstrating the differences of width between the
lines before and after the melting process. B) Schematic representation of the spreading of molten wax
in paper with the variables to take in account for rational design of μPAD. WP - width of the printed line;
WG - separation between the edge of the lines before melting; WB - thickness of the hydrophobic barrier
defined as the middle point between the front and back widths (average width); WC - width of the
resulting channel after melting of the wax and L is the spreading of the wax in relation to the original
edge of the line. The black rectangles represent the wax before the heating step while the grey area
represents the wax after the heating step. Adapted from [41]. ............................................................. 12
Figure 6. Scheme illustrating CBM type A, B and C and the respective binding to with different regions
of a polysaccharide substrate. Adapted from [85]. ................................................................................ 18
Figure 7. Schematic representation of the C. thermocellum cellulosome. The multi-domain structural
protein CipA comprises nine homologous receptor known as cohesins (Coh), which have affinity to
dockerins (Doc) modules that are coupled with catalytic subunits. CBM3 is responsible for the
attachment of the whole complex to cellulose. Adapted from [89]. ....................................................... 19
Figure 8. Overall secondary structure of carbohydrate-binding module family 3 from Clostridium
thermocellum (PDB entry 1NBC). The cellulose-binding amino-acid residues of the planar strip are
highlight in green (Asp 56, His 57, Tyr 67, Arg 112 and Trp 118) while the anchor residues from chain
2 and 3 are labelled in orange (Gln 110, Asn 10 and Asn 16) and purple (Ser 12 and Ser 133),

vii
respectively. In addition, N- and C-termini are labelled as well the calcium ion, which is represented by
a grey sphere. The figure was generated by UCSF Chimera program. ................................................ 20
Figure 9. Design of the µPADs used in this work. A) 6 mm-diameter “spot”. B) Lateral-flow µPAD with
38.7 mm x 6 mm and circular compartments for sample (compartment 1) and reagent (compartments)
2 and 3) addition. The thickness of the printed wax lines in both structures is 0.4 mm. After melting and
diffusion of the wax, the width of the wax barriers increases to 1 mm. ................................................. 24
Figure 10. Protocol for ImageJ analysis of spots. A) A digital image of the paper spots used to detect L-
malic acid is obtained using a scanner. B) The image in A is converted to 8-bit grey scale digital image.
C) The image in B is inverted to produce a negative image and areas corresponding to the reaction
zones are selected in individual spots. .................................................................................................. 26
Figure 11. Maps of plasmids A) pET21a_AST, B) pET21a_MDH and C) pET21a_ZZ-CBM3 used to
clone CBM3-fusion proteins with XhoI restriction sites. All plasmids carry an ampicillin resistant marker
and contain a his-tag region. pET21a_ZZ-CBM3 was used as the source of the cbm3 gene and linker
that were cloned into pET21a_AST and pET21a_MDH. ....................................................................... 28
Figure 12. AST-CBM3 fusion protein amino acid sequence (577 residues). ....................................... 30
Figure 13. Reaction scheme of the colorimetric system developed to detect L-malic acid. Two enzymatic
reactions are coupled with a non-enzymatic reaction, where the NADH produced reacts with the
chromogenic substrates MTT and PMS, originating a final purple product in the presence of the analyte.
............................................................................................................................................................... 35
Figure 14. Evaluation of the reagents that can be spotted with the enzymes and allowed to dry at RT
without affecting the enzymatic reaction and consequently the color development. The system
components that were pre-added and dried are indicated below each pair of spots. The remaining
components were added alongside with L-malic acid or water in the test (+) and control spots (-),
respectively. ........................................................................................................................................... 36
Figure 15. Polyvinyl alcohol and Triton X-100 effect on the signal obtain. A) When no surfactants are
added, sample drops do not spread easily through the surface, affecting signal homogeneity. B) In the
presence of surfactants, spot surface became more hydrophilic, so drop spreading was facilitated and
a higher signal homogeneity was achieved........................................................................................... 37
Figure 16. Physical immobilization of L-MDH and AST enzymes onto a paper-based microspot and after
drying during 1 hour, a mixture with the chromogenic reagents and sample were added. For the control,
L-malic acid was substitute by water. The assay was performed on a paper-based microspots with A)
4-mm-diameter spot and B) 6-mm-diameter spot. ................................................................................ 37

viii
Figure 17. Evaluation of the minimum volume required to obtain an adequate visual read-out. Different
volumes of mix were spotted and dried. Tests were made with a solution of 600 mg/L of L-malic acid
supplemented with NAD+ and Tris plus glutamate. ............................................................................... 38
Figure 18. Schematic representation of the bioassay developed to detect L-malic acid using bioactive
paper. ..................................................................................................................................................... 39
Figure 19. Analytical performance of the bioassay developed to detect L-malic acid using enzymes
physically adsorbed onto a µPAD. A) Colors developed with increasing amounts of L-malic acid in the
0 to 600 mg/L range. The calibration curve was obtained by plotting the average mean grey intensity of
each spot as a function of the corresponding concentration (n = 5). B) Assay linearity between
concentrations of 5 and 150 mg/L of L-malic acid with an equation of y = 18.547 log10 [L-malic acid] –
10.849. Error bars were always determined from the standard deviation of n = 5 measurements. ..... 41
Figure 20. Time course stability of the µPADs developed to detect L-malic acid. Each spot in a device
(n = 3) was prepared with 5 µL of mix, dried and incubated at 4 ºC and room temperature, protected
from direct light exposition. Time course stability was determined taking into account the average mean
grey intensity determined for control (0 mg/L L-malic acid) and test spots (150 mg/L L-malic acid) on
day x and day 1, as described by equation 7. Error bars were determined from the standard deviations
of 3 measurements for each condition. ................................................................................................. 43
Figure 21. Schematic representation of a lateral-flow µPAD that allows the pre-deposition of all the
reagents needed for the assay. When a sample is added, fluid flows by capillarity dragging NAD+
alongside and ultimately reaching the reaction zone. The arrow represents flow direction. ................. 44
Figure 22. A) Maps of the pET21a_AST-CBM3 constructed. The vector contains an ampicillin resistance
marker and the fusion incorporates a his-tag region to facilitate protein purification. B) Agarose gel
analysis of pET21a_AST-CBM3 cloning. 1) NZYDNA Ladder III; 2) pET21a_AST-CBM3; 3)
pET21a_AST-CBM3 previously digested with XhoI. ............................................................................. 46
Figure 23. Coomassie Blue stained SDS-PAGE gel of fractions collected during the purification of AST
and AST-CBM3. 1) Precision Plus Protein™ Dual Color Standard; 2) AST from NZYTech; 3) CBM3
previously purified in our lab; 4) Feed sample for AST purification; 5) Flow-through fraction of AST
purification; 6) Elution fraction of AST; 7) Feed sample for AST-CBM3 purification; 8) Flow-through
fraction of AST-CBM3 purification; 9) Elution fraction of AST-CBM3. .................................................. 47
Figure 24. Capacity of AST-CBM3, AST and CBM3 proteins to bind to cellulose at pH 10. 3 µM of each
protein was added to the wells of a microfiltration plate containing 2 paper circles with 0.009 g each.
The concentration of proteins after and before incubation with paper was measured using a BCA kit (n
= 3) and the mass of protein adsorbed was calculated by mass balance. Errors were determined from
the standard deviation of triplicates. ...................................................................................................... 48

ix
Figure 25. Comparison of the average mean grey intensity of the signals recorded in µPADs prepared
without AST, with AST in ammonium sulfate, AST in imidazole and AST-CBM3. Each condition was
tested in triplicates and the error bars correspond to the standard deviation. ...................................... 49
Figure 26. Analytical performance of the bioassay developed to detect L-malic acid using AST-CBM3
and MDH enzymes immobilized onto a µPAD. A) Colors developed with increasing amounts of L-malic
acid in the 0 to 600 mg/L range and calibration curve obtained by plotting the average mean grey
intensity of each spot as a function of the corresponding concentration (n = 5). B) Assay linearity
between concentrations of 5 and 150 mg/L of l-malic acid with an equation of y = 0.2426 [L-malic acid]
+ 13.2. Errors were always determined from the standard deviation of n = 5 measurements. ............. 51
Figure 27. Calibration chart designed for the semi-quantitative detection of L-malic acid using µPADs
with AST-CBM3 fusion protein. ............................................................................................................. 52
Figure 28. Time course stability of µPAD containing AST or AST-CBM3. Each spot in a device (n = 3)
was prepared with 5 µL of mix, dried and incubated in the dark at room temperature (A) and 4 ºC (B).
Time course stability was determined taking into account the average mean grey intensity determine for
the analyte on the day x and day 1 as described by equation 6. Error bars were determined from the
standard deviations of 3 measurements for each condition. ................................................................. 53
Figure 29. Pre-treatment of red wine with activated carbon. Photographs and UV-vis spectrum are
shown before and after pre-treatment. .................................................................................................. 55
Figure 30. Calibration curve obtained for 5 to 300 mg/L of L-malic acid after 3 minutes of reaction using
NZYTech, L-malic acid UV detection kit. Each point represents the average of three determinations and
the errors were obtained from the standard deviation. .......................................................................... 57

x
List of tables
Table 1. Fabrication techniques for patterning paper with corresponding advantages and drawbacks.
Adapted from [25] [27] [45] [51]. .............................................................................................................. 9
Table 2. Signal homogeneity obtained when spots prepared by adding the 5 µL of reagent mix all at
once or stepwise, as 1 or 2.5 µL fractions, where used to analyses samples containing 300 and 600
mg/L of L-malic acid. Images were obtained using surface plot of ImageJ®. ........................................ 39
Table 3. Signal detected using a lateral-flow µPAD for the detection of standard solutions of L-malic
acid with concentrations that range between 0 and 600 mg/L. ............................................................. 44
Table 4. Comparison between the signals recorded in a µPAD after 10 minutes of reaction, when using
AST in ammonium sulfate, AST in imidazole or AST-CBM3 in imidazole. Standard solutions of L-malic
acid of 0, 50 and 150 mg/L were used. ................................................................................................. 49
Table 5. Signal detected using a lateral-flow µPAD using AST-CBM3 for the detection of two standard
solutions of L-malic acid with concentrations of 0 and 150 mg/L. ......................................................... 54
Table 6. Concentration of L-malic acid detected in commercial white and red wines using the µPAD
developed. A quantitative analyze was performed by measuring the mean grey intensity of three different
paper-based devices for the same sample (n = 3 spots ± standard deviation). The concentration shown
takes into account the dilution factor applied to each sample. .............................................................. 56
Table 7. Concentration of L-malic acid determined in white whites and red wines using µPAD and the
NZYTech L-malic acid, UV detection kit. The standard deviation (SD) corresponds to triplicates. ...... 58
Table 8. Analytical performance of the µPAD when white and red wine are spiked with known
concentrations of L-malic acid. Each concentration was evaluated in triplicates and the respective
standard deviation is present. ............................................................................................................... 59

xi
List of abbreviations
AFP α-fetoprotein
AKD Alkyl ketene dimer
ALP Alkaline phosphatase
AMPs Antimicrobial peptides
AST Aspartate aminotransferase enzyme
AuNP Gold nanoparticles
BSA Bovine serum albumin
CBD Cellulose-binding domains
CBM Cellulose binding modules
CBM3 Cellulose binding modules family 3
CEA Carcinoembryonic antigen
CipA Cellulosome-integrating protein A
CL-ELISA Chemiluminescence enzyme-linked immunosorbent assay
Coh Cohesin
FTIC Fluorescein isothiocyanate
ELISA Enzyme-linked immunosorbent assay
HPLC High performance liquid chromatography
L-MDH Malate dehydrogenase enzyme
LAB Lactic acid bacteria
LC–MS liquid chromatography–mass spectrometry
LOD Limit of detection
LOQ Limit of quantification
MLF Malolatic fermentation
MTT 3-(4,5-dimethylthiazol-2-yl)-2,5-diphenyltetrazolium bromide
NAD+ Nicotinamide adenine dinucleotide oxidase
NADH Nicotinamide adenine dinucleotide reduce
OIV International Organization of Vine and Wine
PDMS Poly(dimethylsiloxane)
POC Point-of-care diagnostics
PMS Phenazine methosulfate
RCA Rolling circle amplification
RT Room temperature
TBPB Tetrabromophenol blue
TCA cycle Citric acid cycle
TEM Transmission electron microscopy
μPAD Microfluidic paper-based analytical devices

1
Chapter 1. Introduction
Wine is a complex mixture of compounds that define its appearance, aroma, flavor and mouth-
feel properties. While some compounds arise directly from grape, others are formed or modified during
the winemaking process, having a positive or negative impact on the final product. Thus, it is essential
to control the winemaking process to accomplish the desired sensory characteristics. For instance, wine
flavor is one of the key drivers for consumers and it is highly affected by wine pH. Therefore, winemakers
are implementing strategies to produce wine with predetermined properties which ultimately improve its
final quality [1].
1.1 L-Malic acid, an organic acid present in wine
Organic acids are highly present in wine and their nature and concentration have a great impact
on wine organoleptic properties as well in biological stability [1]. L-Tartaric and L-Malic acids are the
main organic acids present in wines, representing 70-90% of its total acidity [2]. Wine acidity directly or
indirectly affects the winemaking process and ultimately the wine’s quality, including its organoleptic
properties and shelf-life [3].
L-Malic acid is a complex organic acid present in wine and is originated directly from grapes during
their development. Its synthesis occurs mainly through catabolism of sugars, more specifically via
glycolysis and citric acid cycle (TCA cycle) [4]. After β-carboxylation of phosphoenolpyruvate pathway,
oxaloacetate is formed and reduced to malate by a cytosolic malate dehydrogenase (Figure 1) and
harvested in grape berry vacuoles [5]. The L-malic acid formed may also enter the TCA cycle to produce
citrate and other metabolites. At the onset of ripening, this organic acid is degraded by mitochondrial
enzymes to be used as a carbon and energy source. Synthesis and catabolism of L-malic acid results
as a response to the metabolic changes occurring during grape development [5].
The balance between L-malic acid synthesis and catabolism is highly affected by temperature.
Actually, mitochondrial malate dehydrogenases which are responsible for malate degradation have
higher activity at higher temperatures, while the synthesis of malic acid by cytosolic isoform enzymes is
heat inactivated [6]. Therefore, grapes in warmer climates have faster rates of L-malic acid degradation
than in cold climate regions. Consequently, the levels of malic acid in grapes are usually lower in warm
viticultural regions. The content of L-malic acid can range between 1 to 10 g/L depending on grape
variety and climate region. In addition, this balance may also be affected by other pathways, such as
the accumulation of potassium [5].

2
L-malic acid plays an essential role in wine acidity level, which influences not only organoleptic
properties but also biological stability. For instance, when wine pH is higher than 3.5 the risk of microbial
spoilage increases [7]. Therefore, the production of high quality wines depends on the optimal
adjustment of wine acidity during the elaboration process, especially in cool-climate regions. However
artificial manipulation of sugars and flavourants in wine are prohibited in most countries, so when L-
malic acid levels are too high, wine must undergo a process known as Malolatic Fermentation (MLF)
[8]. This process is especially recommendable for most red and many white wines. In this case the
Figure 1. Schematic representation of L-malic acid metabolic pathway in grapevine. Emphasis is placed
on the synthesis and catabolism by cytosolic and mitochondrial malate dehydrogenases, respectively.
L-malic acid catabolism may occur either by TCA cycle (green arrows) or by gluconeogenesis (blue
arrows), with the final goal of obtaining carbon or energy during grapevine ripening. The remaining
enzymes involved in the process are indicated with numbers: 1- Phosphoenolpyruvate carboxylase, 2-
Cytosolic phosphoenolpyruvate carboxykinase, 3- Cytosolic malic enzyme, 4- Mitochondrial malic
enzyme, 5- Mitochondrial phosphoenolpyruvate carboxykinase. Adapted from [5].

3
winemaking process includes two main steps: alcoholic fermentation followed by malolatic fermentation.
During this second step, L-malic acid is decarboxylated into a weaker acid, L-lactic acid (or lactate) by
malolatic enzymes characteristic of Lactic acid bacteria (LAB). LAB preferably involved in this process
are isolated from wine and include Oenococcus oeni, Lactobacillus spp. and Pediococcus spp.. Malolatic
fermentation not only induces a wine deacidification by increasing the pH, but also replaces the acidic
flavor of malic acid by the smoother and fruity flavor of lactic acid [9] [10] [11]. In addition, some by-
products of malolatic fermentation contribute positively to the wine properties, such as diacetyl, which
imparts a buttery aroma and flavor [12].
During the winemaking process accurate analytical measurements of organic acids are required
in order to monitor the quality and properties of the final product. In the past years, several analytical
methods were developed to determine L-malic acid in wine such as spectrophotometry and
chromatography, including high performance liquid chromatography (HPLC) and liquid
chromatography–mass spectrometry (LC–MS) [13] [14] [15]. Although very accurate and precise, these
methods require prior sample treatment. On the other hand, Esteves and fellows [16] developed a
capillary electrophoresis method to determine simultaneously different organic acids present in red
Porto wines without requirement of sample preparation. Despite being very accurate, precise and
multiplex, the previous methods are quite complex and require skilled personal, expensive apparatuses
and very often require laborious sample preparation procedures.
According to the International Organization of Vine and Wine (OIV) L-malic acid can be
determined by an enzymatic method that consists on the oxidation of L-malic acid by nicotinamide
adenine dinucleotide (NAD+) in the presence of L-malate dehydrogenase (L-MDH). Given that this is an
endergonic reaction, an aspartate aminotransferase (AST) is coupled to convert oxaloacetate, thus
favoring L-malate consumption. Finally, the amount of NADH formed is measured using a
spectrophotometer, which is proportional to the amount of L-malic acid in wine (see Figure 2) [17]. The
main drawback is the requirement for specific equipment (e.g. a spectrophotometer) that most of the
times is not available to the common winemaker. Thus, wine analysis is usually carried out in certified
laboratories. In view of this reality, the development of an alternative system which could be used in site
directly by the winemakers would be highly advantageous. Thus, it would be interesting to develop a
rapid, low-cost and environmental friendly detection test for L-malic acid without the need of significant
sample preparation that would help winemakers to enhance wine final quality.
Figure 2. Reaction scheme for the detection of L-malic acid using an UV method. NADH formed is
measured at 340 nm and is proportional to the amount of L-malic acid in the sample.

4
1.2 Microfluidic paper-based analytical devices (μPADs)
Paper has been used in analytical and clinical chemistry for centuries, but nowadays there is a
growing trend to use it as substrate for sensors. Since 1960s, it is commercially used as a dipstick assay
format for point-of-care detection of glucose in urine [18]. In the late 1980s, immunorecognition was first
introduced to dipsticks. These are highly engineered and broadly used forms of paper-based diagnostic
assays, which can provide a “yes/no” detection of a wide range of analytes using labeled antibodies
[19]. However, these devices do not allow a quantitative analysis without a reader-based system and
neither a multiplex analysis. The current demand of the market for more sensitive, quantitative, portable
and multiplex devices is leading rapidly to an evolution of the existing assay formats into new platforms.
In 2007, George Whiteside’s group introduced microfluidic paper-based analytical devices
(μPADs) [20], a rising technology that combines some of the capabilities of conventional microfluidic
devices with the simplicity of detection methodologies. Basically, μPADs use hydrophobic microfluidics
channels patterned onto paper, which guides the flow of aqueous solutions on paper in a desired
manner. This provides the opportunity to have multiple tests on the same platform by creating different
reaction zones for different analyte detection.
Microfluidics is an interdisciplinary field that is define as “the study of flows that are simple or
complex, mono- or multiphasic which are circulating in artificial microsystems” [21]. Microfluidic-based
systems are very attractive platforms due to their size-effect. Basically, these portable platforms require
small reagent volume and lower power consumption, and more importantly, allow detections with high
resolution and sensitivity at low cost and much faster time [22]. Moreover, and due to the small scale of
microfluidics devices, the surface phenomena (e.g. capillary forces) become increasingly dominant over
volume phenomena. Thus a fluid can be driven by capillarity without the need for external pumps. Lateral
flow assays and paper-based analytical devices rely on this type of fluid motion, which are only possible
due to the intrinsic nature of its substrate, paper [23] [24].
Paper has become a promising platform because there is a global demand for simple, disposable
and cheap substrates for sensors. Besides that, it also confers some benefits compared to other type
of substrates such as glass. Being made from cellulose, an abundant polymer, paper presents several
advantages, including biodegradability, biocompatibility, three-dimensional fibrous structure, easiness
of production and modification, reasonable price and mechanical properties which allow capillary flow
[25]. These characteristics make paper a first-choice substrate for disposable sensors. In addition, it
may also be modified chemically to incorporate different functional groups that allow the immobilization
of proteins, DNA, or small molecules [26].
μPAD are designed to handle small volumes (e.g. 0.1-1 μL of reagent solution) and the fluid
movement is controlled by capillary action or evaporation, meaning that there’s no need for external
pumping [27]. Moreover, the high surface-to-volume ratio, porous structure, and the small volume of the
paper devices are the reasons for the drastic fall in the time necessary to complete certain analysis [28].
5
For instance, a portable enzyme-linked immunosorbent assay (ELISA) provides results in around 43
minutes, in comparison with the traditional 3 hours of conventional methods [29].
µPAD is a novel system with impressing properties that is more rapid and more highly multiplexed
than current analyses [27], which makes it suitable for diagnostic applications [30] [31] [32], especially
in areas with low infrastructures and limited trained medical and health professionals. It may also be
applied in developed countries in emergency situations, in emergency rooms, at home or in military
settings [26]. Many other studies are also being directed towards the use of paper-based devices in
other fields such as environmental monitoring [33] [34] and food quality testing [35][36].
1.2.1 Paper structure
Cellulose fibers are typically the building blocks of paper. In nature, they are the principal
structural element of the cell wall of the majority of plants, being considered as the most abundant
molecule in the world and an inexhaustible source of raw material [37]. This macromolecule became an
attractive support matrix for the development of biosensors, due to its chemical and mechanical stability,
surface characteristics, low cost and approval for human and therapeutic use [38].
The primary structure of cellulose is defined as a linear homopolymer with hundreds of D-glucose
units connected by β(1→4) glycosidic linkages (see Figure 3) [37]. It is represented by the formula
(C6H10O5)n where n depends on the cellulose source material and extraction treatments [26] [39]. For
instances, cotton, which is the raw source of filter and chromatographic paper, has values of n in the
range of 800 – 10 000, depending on the treatment [40].
Usually, cellulose fibers are hollow tubes approximately 1.5 mm long, 20-μm width, with a wall
thickness of about 2 μm. Cellulose is fibrous, hydrophilic, slightly anionic with a low, negative surface-
charge density, biodegradable and insoluble in water and most organic solvents [38]. Within the
cellulose fibers, cellulose is defined crystalline if highly organized or amorphous if the chains are
disordered [39]. Unlike crystalline domains, amorphous cellulose swells in water and is more susceptible
to chemical reaction. Usually the degree of crystallinity of cellulosic fibers is about 50% [40].
Due to all these features, a new matrix for biosensors was developed and has evolved throughout
the years: paper-based technology. Paper is described by two macroscopic properties: the thickness, τ
(m), and the basis weight, bw (g/m2), which is the mass of dry paper per square meter. The
Figure 3. Schematic representation of the primary structure of cellulose. [40]

6
corresponding bulk density of paper is given by the ratio between the basis weight and the thickness
(ρpaper = bw/τ). Whatman No. 1 filter paper, the most used in µPAD, has a thickness of 180 μm and a
basis weight of 87 g/m2, which corresponds to a density of ρpaper = 483 kg/m3 [38]. Since the density of
fibers, ρfiber, is approximately 1540 kg/m3 and paper density corresponds to 483 kg/m3, the pore fraction
of Whatman No.1 paper is 0.69 [38]. Some of the paper’s final properties, such as absorptivity, opacity,
strength and ink-paper interactions are influenced by the porosity. Besides that, porosity will also affect
the reagent deposition, sensitivity, specificity and reproducibility of the µPADs.
Paper properties like surface chemistry, contact angle and pore-structure distribution have an
impact both in the rate and in the extent of penetration of water, which in turn influence the capillary flow
[38]. Since paper is anisotropic, the mass distribution in a paper sheet is usually not constant in the z
(thickness) dimension presenting a higher density in the center than near the surface. Actually, it has
more horizontal fibers than vertical, so the lateral spreading of fluids in paper is usually more rapid than
vertical spreading [41]. The wicking speed is a key parameter for assay performance, because it
influences not only the contact time between sample and reagents, changing the reaction time, but also
the distribution of the reagents in the detection spot, which consequently affects the magnitude and
homogeneity of the signal development [42].
All these features influence the maximum quantity of biosensing molecules than can be attached
to cellulose. This can be estimated by multiplying the maximum density of the immobilized sensor
molecules and the specific surface area of the paper structure accessible to the biosensor. According
to Hong and co-workers [43], the accessibility of a biomolecule in a Whatman No. 1 filter papers is 9.8
m2/gcellulose . Considering that Whatman No. 1 filter paper has a maximum density of 1 mgbiomolecule/m2,
the capacity of this paper surface to take up biomolecules is 9.8 mg of biomolecule by g of cellulose
[38].
1.2.2 Paper as a component of lateral flow tests
Paper has been used as a platform for bioassays since 1957, when Free and fellows [18]
developed Clinistix, an enzyme-based, simple test for the detection of glucose in urine. It consisted of a
paper strip impregnated with glucose oxidase, peroxidase and a colorimetric agent, orthotolidine, which
in the presence of glucose turns blue. Few years later the test was a commercial product and a turning
point for diabetes diagnostics and management.
In 1982, Hawkes and co-workers [44] took advantage of immunorecognition and immobilized an
antigen to nitrocellulose filters. This was latter adapted to dipsticks and commercialized in point-of-care
(POC) diagnostics (e.g. pregnancy and diabetes tests). These devices are highly specific because they
rely on antibody-antigen interactions and were classified as ASSURED (Affordable, Sensitive, Specific,
User-friendly, Rapid and robust, Equipment-free, and Deliverable to end-users) point-of-care diagnostic
devices [25].

7
However, a global demand for multiplex and three-dimensional assays platforms emerged
overtime. Recently, Whiteside’s group [20] created a whole new paper-based assay that is based on
lateral flow and has the ability to detect multiple samples in parallel and in a relatively short period of
time onto the same device. It allows the simultaneous, visual detection of glucose and protein in an
artificial urine sample (Figure 4). Glucose assay is based on the enzymatic oxidation of iodide to iodine,
in which the presence of glucose results is a color change to brown. On the other hand, a positive result
in the protein assay is based on a color change of tetrabromophenol blue (TBPB) from yellow to blue.
These devices are based on lateral flow of a fluid that is introduced onto one end of the device
and moves by the action of capillary forces. Capillary flow rate is a key parameter of µPADs and is
defined as the migration speed of a sample front moving along the length of the test strip [45]. Lateral
flow offers advantages that are unique to paper and similar porous substrates [38]. The time taken for a
fluid front to migrate a certain distance with channel width constant, can be determined using the
following equation [45]:
𝒕 = 𝑽𝜼𝑳
𝜿𝑾𝑯𝜟𝑷=
𝜼𝑳𝟐
𝜿𝜟𝑷 (1)
where V represents the volume of fluid at the time instant t, η and κ are the fluid viscosity and the
permeability of the paper, respectively, WH is the area perpendicular to the flow and ΔP is the pressure
difference along the flow direction over the length L. Therefore, if both permeability and channel width
are constant, the flow time is influenced just by the length L.
In lateral flow, paper can act like a sample filtration, as demonstrated by Whiteside and fellows
[20], where while liquid wicks, large particles are trapped in the paper matrix. It is also possible to create
channels that guide the fluid to different chambers of reaction into the same device [20] [27]. Moreover,
a sample can be exposed consecutively to different binding sites along the eluted surface. Finally, lateral
Sample addition Protein
assay
reagent
s
Glucose
assay
reagents
10’
Artificial urine solution
containing glucose and protein
1 cm
Figure 4. Paper-based analytical device created by Whiteside’s group. A) Glucose is tested in the
circular region on the left, while protein is tested on the square region on the right. The circular region
on the top was used as a control. B) After addition on the central channel, the sample is guided to the
three reactive chambers by capillary action. Positive results for glucose and protein are presented on
the left and on the right, respectively. Adapted from [20]

8
flow allows the removal of unbound components from a region of paper with surface-capture groups
[38]. Retention of particles such as dirt is an attractive advantage of µPADs, since field samples may be
contaminated and the combination of paper and capillary action provides a mechanism for separating
these interfering components. Thus µPAD provides an attractive platform to perform assays in non-
sterile environments.
1.2.3 Fabrication technique of paper-based analytical devices
Patterned paper has provided a new inexpensive platform for portable assays, which is simpler
than the traditional microfluidic devices that are fabricated by etching or molding channels into glass,
silicone, PDMS, or other polymers. This process consists on the patterning of hydrophobic barriers onto
paper that are able to confine a fluid. Moreover, the channel is a matrix of hydrophilic cellulose fibers
that wick fluids along the path defined by the channel [27]. The resulting channels can be left open to
the atmosphere or sealed to thin polymer sheets [46].
Fabrication of paper-based analytical was first proposed in 2007 and consists on patterning
hydrophilic-hydrophobic contrast using a photolithography method to create capillary channels on paper
[20]. The first step of the process consists on the impregnation of the filter paper with a photoresist (SU-
8, SC) and on the application of a transparent film with the desired pattern (i.e. a mask) on top. The
photoresist is then selectively polymerized by exposure to UV light. Finally, the paper is washed with an
organic solvent, propan-2-ol, to remove the photoresist. However this technique is complex, time
consuming and the paper is exposed to organic solvents that influence the capillary flow of the fluids
and ultimately the assays performance [27].
According to the literature a number of techniques for fabricating paper-based microfluidics
devices are now available, such as plotting, which uses a modified desktop plotter to define a pattern
using a hydrophobic polymer, poly(dimethylsiloxane) (PDMS) [47]. Furthermore, an inkjet etching or
plasma oxidation method can be used to remove a hydrophobic coating of polystyrene deposited on a
sheet of paper [48] [49]. In addition, the use of a knife plotter to cut paper into patterns of microfluidic
channels has been described [50].
The techniques for fabricating µPADs are listed in Table 1 as well the different patterning agents
and the advantages and limitations of each. Different methods use different patterning hydrophobic
agents and the patterning process defines the width and length of the channels while the thickness of
the paper defines the height of the channel [27]. The characteristics of the paper influence the rate of
the wicking, which also depends on the characteristics of the environment namely temperature and
relative humidity [51].
Depending on the main goal to be achieved in paper-based sensors, the fabrication method can
be tuned to fulfill the needs of the end-user. The choice of the proper technique has to consider some

9
factors including material costs, fabrication process simplicity and the intended applications of paper-
based microfluidics devices [52].
Table 1. Fabrication techniques for patterning paper with corresponding advantages and drawbacks.
Adapted from [25] [27] [45] [51].
Fabrication technique
Patterning agent
Advantages Drawbacks
Photolithography Photoresist High resolution of
microfluidic channels
(channel width of 200 µm).
Requires expensive equipment
and an extra washing step to
remove un-crosslinked polymer;
Devices are vulnerable to
bending.
Plotting PDMS Hydrophilic channels not
exposed to polymers or
solvents;
Hydrophobic barriers are
flexible and patterning agent
is cheap.
Requires a customized plotter;
Cannot be readily applied to high
throughput production.
Inkjet etching Polystyrene Reagents can be inkjet into
the test zones using the
printer.
Requires a customized inkjet
printer and not suitable for mass
fabrication;
Hydrophilic areas exposed to
polymers or solvents.
Plasma
treatment
AKD Uses inexpensive patterning
agents.
Hydrophilic areas exposed to
polymers or solvents;
Metal masks must be made for
each pattern.
Inkjet printing AKD Uses very cheap AKD and
requires only a desktop
printer;
Produces massive devices
fast (<10 min) and simply.
Requires an extra heating step
after AKD deposition;
Requires modified ink jet
printers.
Flexography
printing
Polystyrene Allows direct roll-to-roll
production in existing printing
houses;
Avoids heat treatment of
printed patterns and requires
low ink levels.
Requires frequent cleaning to
avoid contamination and
different printing plates;
Print quality relies on the paper
surface.

10
Fabrication technique
Patterning agent
Advantages Drawbacks
Screen printing Wax Simple process. Low resolution of microfluidics
channels;
Requires different printing
screens for creating different
patterns.
Laser treatment Depend on
paper
types
High resolution (minimum
pattern size of about 62 μm).
Microfluidic channels do not
allow lateral flow of fluids;
Requires extra coating for liquid
flow.
Wax printing Wax Rapid (~5 minutes);
Requires only a
commercially available
printer and hot plate;
Hydrophilic channels not
exposed to polymers or
solvents;
The design of the patterns must
account for the spreading of the
wax in the paper;
Unstable at high temperatures.
Nowadays, wax printing is the best method to produce large lots of prototype μPAD with moderate
resolution. This simple and inexpensive method was introduced by Lu et al. [53] and consists in
patterning hydrophobic barriers of wax on the surface of paper using a commercially available printer
and hot plate. After printing patterns, the paper is heated to re-melt the wax, which spreads vertically
and laterally to generate complete hydrophobic barriers. Wax printing has a lower resolution than
photolithography. The smallest hydrophilic channels are approximately 560 µm which is higher
compared with the 200 µm that can be achieved with lithography [41].
Nevertheless wax printing has five main advantages [27] [41], namely: i) takes less than 5 minutes
to pattern a sheet of paper; ii) the hydrophilic channels and test zone are never exposed to photoresist
or other solvents that could contaminate them; iii) the cost of production of each device can be
approximately $0.001/cm2 (cost of printing a single 8.5 × 11 cm in sheet of Whatman no. 1 filter paper);
iv) sheets of paper patterned by wax printing can be fed directly into an inkjet printer for delivery of
reagents into the test zones of the devices; v) the method has the potential to be upgraded to large scale
processes.
Since paper is an anisotropic material, the lateral wax spreading is faster than the vertical
spreading. This complicates the design of the channels, because the dimensions of the printer pattern
do not correspond to the dimensions of the resulting hydrophobic barriers (see Figure 5A). Considering
11
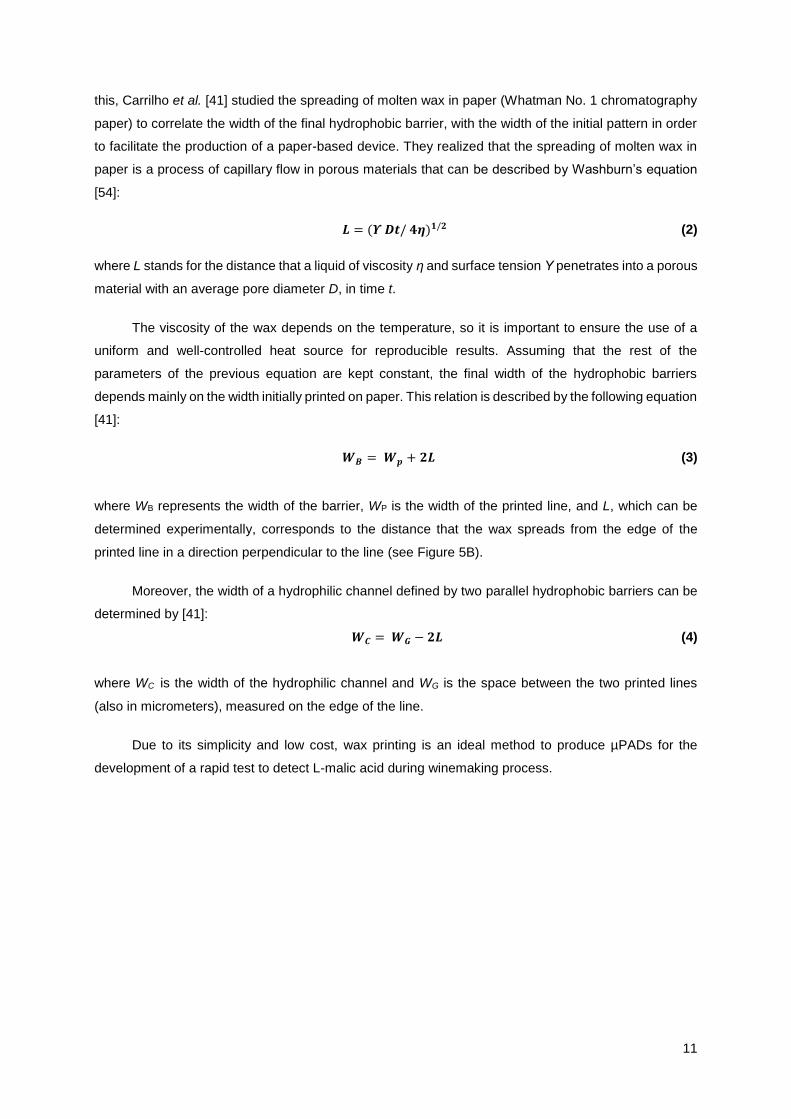
this, Carrilho et al. [41] studied the spreading of molten wax in paper (Whatman No. 1 chromatography
paper) to correlate the width of the final hydrophobic barrier, with the width of the initial pattern in order
to facilitate the production of a paper-based device. They realized that the spreading of molten wax in
paper is a process of capillary flow in porous materials that can be described by Washburn’s equation
[54]:
𝑳 = (𝜰 𝑫𝒕/ 𝟒𝜼)𝟏/𝟐 (2)
where L stands for the distance that a liquid of viscosity η and surface tension Υ penetrates into a porous
material with an average pore diameter D, in time t.
The viscosity of the wax depends on the temperature, so it is important to ensure the use of a
uniform and well-controlled heat source for reproducible results. Assuming that the rest of the
parameters of the previous equation are kept constant, the final width of the hydrophobic barriers
depends mainly on the width initially printed on paper. This relation is described by the following equation
[41]:
𝑾𝑩 = 𝑾𝒑 + 𝟐𝑳 (3)
where WB represents the width of the barrier, WP is the width of the printed line, and L, which can be
determined experimentally, corresponds to the distance that the wax spreads from the edge of the
printed line in a direction perpendicular to the line (see Figure 5B).
Moreover, the width of a hydrophilic channel defined by two parallel hydrophobic barriers can be
determined by [41]:
𝑾𝑪 = 𝑾𝑮 − 𝟐𝑳 (4)
where WC is the width of the hydrophilic channel and WG is the space between the two printed lines
(also in micrometers), measured on the edge of the line.
Due to its simplicity and low cost, wax printing is an ideal method to produce µPADs for the
development of a rapid test to detect L-malic acid during winemaking process.

12
Figure 5. A) Front view of printed horizontal lines demonstrating the differences of width between the
lines before and after the melting process. B) Schematic representation of the spreading of molten wax
in paper with the variables to take in account for rational design of μPAD. WP - width of the printed line;
WG - separation between the edge of the lines before melting; WB - thickness of the hydrophobic barrier
defined as the middle point between the front and back widths (average width); WC - width of the
resulting channel after melting of the wax and L is the spreading of the wax in relation to the original
edge of the line. The black rectangles represent the wax before the heating step while the grey area
represents the wax after the heating step. Adapted from [41].
1.2.4 Paper functionalization – Bioactive paper
A biosensor is defined as a device that couples a biological recognition system, often called a
bioreceptor, with a transducer, responsible for reporting a signal [55]. Therefore a bioactive paper can
be defined as a paper-based product bearing active biomolecules [26]. After μPAD production, it is
necessary to add a bioreceptor agent to turn it functional and specific for a given analyte of interest. The
retention of functionality, reaction rate and selectivity of the immobilized biomolecules is a crucial aspect.
For paper-based biosensors, the most used biological probes are enzymes, antibodies, DNA and
aptamers [27] [28] [56] [57]. The main concerns to retain fully or enhance bioreceptor activity should be
the following: i) control the location and density and ii) control the tertiary structure and orientation of
biomolecules [38].
Structure and surface chemistry influence the immobilization of biomolecules onto paper (e.g. the
quantity of bioreceptors attached) [58]. Actually it must facilitate biosensor immobilization, minimize non-
specific adsorption and be compatible with reporting strategies. All these should be taken into account
as well as reproducibility, cost and complexity of the immobilization process. [26] The strategies used
to immobilize bioreceptors on cellulose can be grouped into three categories: physical immobilization,
chemical immobilization and bioaffinity attachment. [26].
Physical immobilization of biomolecules onto cellulose does not require modification of the
biomolecule or surface, and therefore is usually fast, simple and economic. This method has the
advantage of keeping the denaturation process to a minimum [26]. Three physical immobilization
approaches can be used with cellulose: i) direct adsorption; ii) confinement and iii) adsorption of carrier
particles. Direct adsorption occurs via non-covalent interactions such as van der Waals forces, hydrogen
bonding and hydrophobic interactions. Since paper is highly hydrophilic it allows the rapid adsorption of
B A

13
the bioreceptor. Besides that, the anionic profile of cellulose contributes to the interaction with cationic
patches on proteins through electrostatic interactions, thus enhancing adsorption [59]. Confinement
consists on the covering of pre-deposited biomolecule with a semi-permeable film. These films can
either be made of polymers or actual membranes. On adsorption of carrier particles, the biomolecule is
immobilized onto or into colloidal particles which are then adsorbed onto the paper matrix. Colloidal
particles coupled with biomolecules are called bioactive ink. The biomolecules can either be added
during the polymerization process or covalently coupled to the carrier that is then printed, coated or
added during the paper making process [38]. Although it is easier to concentrate the colloidal particles
onto exterior surfaces of paper and biomolecules are protected from the external environment, there
could be mass-transfer limitations and pore-clogging which decrease biosensor efficiency [26].
It is important to highlight that the binding capacity of both biomolecules and paper surface are
affected by the pH, ionic strength and specific ion effect, as shown in a study performed by Jones and
is fellows using BSA as protein model and cellulose powder as matrix [59]. Furthermore, Halder and co-
workers [60] also proved that high-molecular-weight DNA adsorbed onto cellulose at pH 4, but not at
pH higher than 6 because of the high hydration of cellulose surface.
In the first μPAD produced by Whiteside and fellows [20], the group adopted direct adsorption as
a method to immobilize horseradish peroxidase and glucose oxidase onto paper to detect glucose. To
date this immobilization methodology is still the most used on μPAD functionalization. In addition, Khan
and co-workers [61] demonstrated that thermal stability of horseradish peroxidase increased 2-3 fold
after direct adsorption, meaning that enzyme deactivation on paper is less temperature sensitive than
in solution. This proves that bioactive paper has exceptional potential for low-cost, high flexibility
diagnostics and industrial application. However, it is also important to notice that proteins are usually
randomly oriented and not strongly adsorbed onto paper, due to lack of functional groups of cellulose
[38]. Thus, adsorbed molecules tend to slowly leach from the surface [58], requiring most of the times a
more aggressive immobilization strategy.
Chemical immobilization relies on covalent binding, providing therefore a strong immobilization of
the bioreceptor. The three more common approaches to chemically immobilize biomolecules onto
cellulose are: crosslinking, direct covalent bonding and bonding to a polymeric primer [26]. Since
cellulose has few functional groups, activation with a polymer or a small molecule to add surface
functional groups suitable for a subsequent bioconjugation reaction is required [26]. Besides, the
bioreceptor has also to be chemically modified and as a consequence the process becomes more
expensive and complex. Garcia and co-workers [62] developed a µPAD using a handheld stamping
process where cellulose surface was oxidized to present aldehyde groups, allowing a covalent coupling
of enzymes. This way they improved color uniformity, but at the same time the immobilized molecules
lost some activity, resulting in a lower sensitivity of the biosensor.
Bioaffinity attachment occurs via bioaffinity interactions between the matrix/ligand and a
biomolecule. In this case the orientation of the immobilized biomolecule is controlled ensuring full
biological activity and stability [26]. There are two types of bioaffinity immobilization. The first consists

14
on cellulose pre-coupled with an affinity ligand and then the target biomolecule is added. Innumerous
affinity pairs are known, namely antigen-antibody, protein-ligand, metal ion/ chelator (e.g.
streptavidin/biotin, Ni2+/ His-tag, respectively). However, this requires modifications on both the ligand
and the matrix, for instance His-tagged proteins can be immobilized onto a chelate-modified surface
namely, a nickel complex. As an alternative approach the protein is conjugated, using genetic
engineering techniques, to another molecule that has affinity towards cellulose, for instance a
carbohydrate binding-module (CBM) [26]. CBM is a protein domain found in a wide variety of cellulose
degrading enzymes [63]. CBMs not only adhere spontaneously to cellulose, but they can also be
genetically engineered and fused with proteins, antibodies or cells [64] [65] [66]. This way is possible to
strongly immobilize a bioreceptor and concentrate it onto cellulose. CBM features make them a
promising approach for biomolecules immobilization onto μPAD, as demonstrated by Rosa and fellows
[56]. Their properties and current applications will be explored further on Chapter 1.3.
1.2.5 Detection methods used in µPADs
Paper-based analytical devices offer the possibility to simple produce, mass-scalable devices at
an affordable price, but it is also necessary to create an analytical device with suitable transduction
methods. Currently, a variety of detection methods can be applied to μPADs that are compatible with
their simplicity, affordability and portability, such as electrochemical detection, chemiluminescence
detection, fluorescence detection and colorimetric detection.
Electrochemical detection requires a system with three-electrodes - a working electrode, a
counter electrode and a reference electrode - that are printed onto paper using conductive inks [25].
Dungchai and fellows were the first to adapt this method to paper-based microfluidics to simultaneous
detect glucose, lactate and uric acid in urine [67]. The sample was deposited on the center of the paper
and flowed to the reaction-sites that contained the electrodes. Oxidase enzymes in contact with the
substrates produce H2O2, which is then used to quantify the analytes. Screen-printing technology was
used to fabricate the electrodes and cyclic-voltammetry for signal read-out. In comparison with optical
detection, electrochemical detection is insensitive to light, dust and insoluble compounds [68], and
shows high sensitivity in the order of nM [45]. Still some assays are susceptible to interferences from
electrochemically active substances and to temperature. Moreover, this method requires one additional
fabrication step to deposit the conductive inks and it also involves reading instrumentation.
Chemiluminescence detection consists on the measuring of light emitted by certain chemical
reactions [69]. This is a simple, low cost and high sensitive method which measurement may be
performed in the dark [25]. Wang and co-workers [70] were the first to adapt a chemiluminescence
ELISA (CL-ELISA) to paper-based devices to detect tumor markers in real human serum samples, such
as α-fetoprotein (AFP), cancer antigen 125 (CA125) and carcinoembryonic antigen (CEA). Paper was
first treated with chitosan to covalently immobilize antibodies and then after surface blocking, antigens
bind to antibodies. Finally horseradish peroxidase labeled with cancer tumors antibodies formed a
sandwich assay and trigged the chemiluminescence reaction using a typical luminol-H2O2 system. The

15
emitted light was correlated with the concentration of the analyte and the sensitivity achieved allows the
use of this method for clinical applications.
Fluorescence detection is highly sensitive, but requires instrumentation for signal detection. In
addition, the use of optical brightening agents to turn commercial paper white confers paper a slight
fluorescence, resulting in high background signal [38]. Finally, a wide implementation of this detection
method to μPADs requires a reduction in the cost and advances in miniaturization of fluorescence
readers [45]. Ali and co-workers [71], developed a method to detect DNA, by DNA amplification.
Microgels coupled to an oligonucleotide that is complementary to the target DNA were used. DNA
detection occured in three steps: i) target DNA promoted ligation of a DNA primer to the microgel-bound
DNA, ii) rolling circle amplification (RCA) between the primer and a circle DNA, and iii) hybridization of
the RCA products and a fluorescent DNA probe.
The previous methods require instrumentation to read the signal, which could result in a
disadvantage, especially when using these devices in developing regions with low-resources or even in
developed countries in emergency situations, in military settings or at home. So it is important to highlight
colorimetric detection from the previous detection methods described.
Colorimetric detection is typically related to enzymatic or chemical color-change reactions [51]
with the advantage that the results can be visually assessed by the unaided eye. This method is simple
and one of the most applied to μPAD to detect a variety of analytes such as glucose, protein, particular
metals and biomarkers [32] [27] [33] [72] [30]. It allows not only a yes/no result but also a semi-
quantitative detection by visual comparison with a colored calibration chart, so it does not require specific
instrumentation [42]. Whiteside and fellows were pioneers in this technology and demonstrated that this
detection method is ideal for 2D [4,6] and 3D μPADs [73], for instance to detect glucose and protein in
artificial urine. Glucose assay was based on the enzymatic oxidation of a chromogenic agent, iodide, to
iodine, which in the presence of glucose results in a color shift to brown. On the other hand, the positive
result in protein assay results in a color change of tetrabromophenol blue from yellow to blue. Recently,
they also proved that this could be used for clinical testing of drug-related hepatotoxicity, developing a
multiplexed microfluidic assay designed for rapid, semi-quantitative measurement of aspartate
aminotransferase (AST) and alkaline phosphatase (ALT) in a fingerstick specimen [30]. Another study
reports on the development of a μPAD for the detection of foodborne pathogens in food samples as a
screening system [35]. Detection is achieved by measuring the color change when an enzyme
associated with a certain pathogen of interest reacts with a chromogenic substrate.
One disadvantage of the colorimetric detection that has been pointed out is that in lateral-flow
and flow through platforms the color distribution is heterogeneous, making it difficult to perform a visual
detection. Recently, Carrilho and co-workers [62], chemically modified paper surface by oxidation to
promote the conversion of hydroxyl groups into aldehyde groups, which were then chemically activated
for covalent coupling of enzymes. This approach clearly enhanced colorimetric detection and increased
the homogeneity of the signal obtained.
16
Gold nanoparticles (AuNP) are also a promising colorimetric reporting system that has already
been used in dipsticks and lateral flow tests coupled with antibodies. Particles with a size range between
10-50 nm have an intense red color when they are separated by a distance equivalent to a few particle
diameters. When gold nanoparticles aggregate, the color changes to purple. Zao and fellows [74]
developed an endonuclease (DNase I) enzyme assay, and an aptamer-based adenosine detection
assay on a paper-based device using AuNPs. In the first case, DNA-modified AuNP and cDNA were
mixed, originating particle aggregation and a blue color. Upon addition of DNase I, double stranded DNA
is cleaved and AuNP aggregates dissociate into disperse red AuNP. In the second assay, AuNP are
bound with an adenosine aptamer. After addition of adenosine, the aptamer dissociates from AuNPs to
bind to the target molecule, causing dispersion of the particles and bringing forth a red color. Another
study also used AuNPs to amplify an immunoassay signal using a dissolvable sugar applied to paper to
create programmable flow delays [72].
Quantitative colorimetric detection of analytes is possible by reflectance detection when the
intensity of the color that develops in the detection zone is a function of the concentration of the analyte
[75]. Reflectance detection is based on the measurement of the light reflected off of the surface of the
test zone. An ideal reader platform must address low-cost, simple operation, mobility, and connectivity
(e.g. desktop scanners or digital cameras) [45]. By using common imaging software, for example as
ImageJ or Adobe Photoshop, it is possible to measure the arithmetic mean of the pixel intensity within
the detection zone after subtraction of the mean intensity for the control region [75].
Calibration curves will typically follow nonlinear functions of the form 𝑦 = 𝑎 ln (𝑏𝑥) [76]. The
nonlinearity at high concentrations of analytes is due to color saturation. Although reflectance detection
is easy to analyze and requires simple equipment, the drawback is that the results are dependent on
the quality of the image and lighting conditions [27]. This problem can be solved by a white balance
correction, subtraction of the background color, or comparison with a calibration curve of standards of
known color and intensity [75].
Paper-based analytical devices represent a simple and user-friendly platform for diagnostic in
developing world. However they still require a trained healthcare provider to interpret the data they
provide and to prescribe any necessary treatment. For this reason, telemedicine is an attractive
alternative system for developing countries [75]. Using this approach, the result obtained can be
photographed by a camera on a mobile phone and then sent to a remote location where an expert
analyzes the image and prescribes an appropriate treatment. This revolutionary and promising approach
can be applied in other fields besides health diagnostic, such as environmental monitoring and food
quality control.

17
1.3 Carbohydrate-binding modules
Cellulose is the major polysaccharide component of plant cell walls and is degraded in nature into
simple soluble sugars by the concerted action of a number of bacterial and fungal enzymes. Cellulose
degradation became a theme of interest for researchers due to the insoluble nature and inherent stability
of this natural polymer, which constitutes a challenge for enzymatic hydrolysis [77].
In nature, the degradation of polysaccharides by glycoside hydrolases is relatively inefficient
because the glycosidic bonds of the insoluble substrates are inaccessible to the active site of these
enzymes. To overcome this, many glycoside hydrolases are modular, comprising catalytic and non-
catalytic sugar binding modules, which includes carbohydrate binding modules (CBMs) [78]. A CBM is
defined as a contiguous amino acid sequence within a carbohydrate-active enzyme with carbohydrate
binding activity, which facilitates the binding of hydrolytic enzymes to cellulose, enhancing its
degradation [79]. CBMs were initially defined as CBDs (cellulose-binding domains), because crystalline
cellulose was identified as their primary ligand. However, throughout the years it has been reported that
these modules have a diverse ligand specificity, so the term CBM (carbohydrate-binding module) was
proposed as a more inclusive term to describe all of the non-catalytic sugar-binding modules derived
from glycoside hydrolases [78].
Many organisms produce different CBMs. Depending on specific characteristics such as the
amino acid sequence, binding specificity and structure, CBMs can be classified into 71 different families
[80]. They range in size from only about 40 to approximately 200 amino acid residues [81]. It have been
reported CBMs that recognize a variety of substrates such as, xylan, chitin, a variety of glucans with
different linkages, and both crystalline and non-crystaline cellulose [82]. Depending on the family, CBMs
can be either ligand specific or non-specific (i.e. able to bind to a range of different carbohydrates) [78].
The carbohydrate binding capacity of CBMs can be attributed, in part, to the presence of several
aromatic amino acids in the binding sites which form a hydrophobic surface. Nevertheless, cellulose
surfaces are negatively charged, so the resulting interactions are dominated by double-layer repulsive
forces. However, following CBM binding, interfacial force profiles are less repulsive, which allow other
molecules to interact with cellulose surfaces. Although the orientation and positioning of the aromatic
residues have a strong influence in the specificity and affinity of these modules, other interactions such
as hydrogen bonds and calcium-mediated coordination are also relevant for CBM ligand recognition [83]
[84].
Considering the structural and functional similarities, CBMs families have been grouped in three
types (Figure 6). Type A CBMs interact with the flat surfaces of crystalline polysaccharides, primarily
cellulose (e.g. families CBM 1, 2, 3 and 10). Their bind sites comprise a planar hydrophobic platform
rich in aromatic amino acids residues. On the other hand, type B modules can bind to the internal regions
of single glycan chains (e.g. families CBM 6 and 36). Lastly, type C CBMs recognize small saccharides
containing from one to three monosaccharide units or, in the context of complex polysaccharides, the
termini of these polymers (e.g. families CBM 9, 13 and 66) [63].

18
Figure 6. Scheme illustrating CBM type A, B and C and the respective binding to with different regions
of a polysaccharide substrate. Adapted from [85].
Attractive commercial applications have been suggested to explore high stability binding of CBMs
to cellulosic surfaces. By using fusion technology, CBMs can be recombined with other biomolecules
such as proteins, antibodies and even cells [64] [65] [66]. The first commercial application was the use
of CBMs in fusion proteins as tags for affinity purification or immobilization. Since CBMs adsorb
spontaneously to cellulose, no pretreatment of the samples is required prior to the immobilization [84]
[86]. Thus, CBMs fusions offer the opportunity to immobilize biomolecules onto a cellulose matrix, but
also may be used in protein purification, to enhance bioprocessing enzymes and for bacterial adhesion
[84] [86] [65] [87] [88].
1.3.1 Carbohydrate binding module family 3
Cellulosomes are high-activity, multi-enzyme complexes, which act synergistically with various
enzymes in order to hydrolyze the crystalline cellulose and polysaccharides in plant cell walls. In nature,
these complexes have been identified in certain anaerobes including strain of the Clostridium bacterium,
such as Clostridium thermocellum. This gram-positive thermophilic bacterium is highly efficient in the
production of a multienzyme cellulolytic system, and consequently in the degradation of cellulose into
utilizable simple sugar [89].
C. thermocellum cellulosome has a structural multidomain protein called CipA (cellulosome-
integrating protein A), which consists of a single large polypeptide chain with 197 kDa that includes
different subunits with different functions (Figure 7) [90] [91]. CipA includes nine enzyme-binding cohesin
Amorphous
regions
Crystalline
region
Carbohydrate binding module Monosaccharide

19
modules, which interact with high affinity with dockerin modules present in the catalytic subunits, in order
to promote the integration and assembly of the hydrolytic enzymes into a complex cellulosome structure
[63] [92]. Furthermore, a C-terminal divergent dockerin present in the scaffoldins targets the cellulosome
to the bacterial cell envelope. Finally, the entire complex is anchored to cellulose via a CBM3 that is also
present in the scaffoldins (Figure 7) [89]. CBM3 is located between cohesin 2 and cohesion 3 and is
flanked by two linker regions rich in threonine and proline residues, in which the full-length linker from
Coh2 and Coh3 to CBM3 is 46 and 39 residues in length, respectively. The linker segments of peptide
have sufficient length and flexibility to allow the efficient orientation and operation of the catalytic site
making polysaccharide degradation more efficient [93].
The Carbohydrate-Binding Module 3 (CBM3) has 155 residues and is classified as a type A CBM,
which binds tightly to the surface of crystalline cellulose. Actually, CBM3 has a higher affinity to cellulosic
structures in plant cell walls compared with other type A CBMs, having an affinity constant of the order
of 106 M-1 [94] [95].
The 3D crystal structure of CBM3 from the C. thermocellum CipA scaffoldin was firstly proposed
by Tormo et al. [96]. It is manly based on nine β strands arranged in two antiparallel sheets and
connecting loops (Figure 8). A planar face without topographic obstacles provides closeness between
the CBM and cellulose [89]. In addition, CBM3 also contains a Ca2+ ion to stabilize the folding [91].
CBM3 has two defined surfaces located in opposite sites of the molecule. The bottom site is
characterized by a linear and strikingly planar array of polar and aromatic residues, such as His57 and
Tyr67. This site is responsible for establishing hydrogen bonding interactions with oxygen atoms and
hydroxyl groups of glucose moieties on adjacent chains of the cellulose microcrystal. On the other hand,
Figure 7. Schematic representation of the C. thermocellum cellulosome. The multi-domain structural
protein CipA comprises nine homologous receptor known as cohesins (Coh), which have affinity to
dockerins (Doc) modules that are coupled with catalytic subunits. CBM3 is responsible for the
attachment of the whole complex to cellulose. Adapted from [89].
Cellulosome

20
the top site is strictly conserved among all the members of the CBM3 family and presents mainly
residues of tyrosines and polar side chain, whose function is currently unknown [96].
Fusion-protein technology allows the conjugation of CBM3 with other biomolecules resulting in a
molecule with a bioactive domain and a binding domain with a high affinity to cellulose. This method has
been used in important studies to characterize CBM3 and has also allowed their application into different
biotechnological fields. For instance, the location of the binding site of CBM3 in crystalline cellulose was
studied by Lehtiö and co-workers [97] using CBM-ZZ fusion proteins labelled with gold-conjugated
antibodies and transmission electron microscopy (TEM). They suggested that CBM3 binds preferably
to the hydrophobic 110 face of cellulose crystals. Cellulose accessibility has also aroused a particular
interest in order to better understand enzymatic cellulose hydrolysis mechanisms. Hong and colleagues
[43] fused a CBM3 and a green fluorescent protein (GFP), in order to quantify the cellulose accessibility
to cellulose, reaching a value of accessibility of a biomolecule of 9.8 m2/gcellulose for Whatman No.1 filter.
Many other researchers have taken advantage of the stability and tenacious affinity that CBM3
presents towards cellulose and applied it in different fields of biotechnology. Recent applications of
CBM3 include protein immobilization onto cellulosic supports. For instance, Ofir et al. [98] described a
non-DNA microarray in which recombinant CBM3-containing fusion proteins are used for ligand
immobilization onto cellulose-coated glass slides, overcoming the major obstacles faced with protein
microarrays construction. This technology has the advantage of maintaining protein functionality after
Figure 8. Overall secondary structure of carbohydrate-binding module family 3 from Clostridium
thermocellum (PDB entry 1NBC). The cellulose-binding amino-acid residues of the planar strip are
highlight in green (Asp 56, His 57, Tyr 67, Arg 112 and Trp 118) while the anchor residues from chain
2 and 3 are labelled in orange (Gln 110, Asn 10 and Asn 16) and purple (Ser 12 and Ser 133),
respectively. In addition, N- and C-termini are labelled as well the calcium ion, which is represented by
a grey sphere. The figure was generated by UCSF Chimera program.

21
immobilization, higher signal noise ratio, extended stability of the printed microarray and does not require
a purification step to print test proteins. Additionally, Guerreiro and fellows [99] fused four antimicrobial
peptides (AMPs) to CBM3 in order to immobilize them into cellulosic supports. These fusion proteins
were expressed at high levels in Escherichia coli and both AMPs and CBM3 retained their intrinsic
biological activity.
Recently, Rosa et al. [56] described the use of a CBM3 fused with a ZZ fragment of the
staphylococcal protein A as an affinity immobilization technique to develop a wax printed µPAD for
molecular diagnostics of infectious diseases. Antibodies immobilized through biochemical coupling were
able to capture labeled-DNA strands and hybridized DNA using an FITC-labeled-DNA probe more
efficiently than the ones immobilized by physical adsorption. This strategy increased substantially the
efficiency of the µPAD, since it minimized the loss of antibodies during the preparation steps, which
resulted in a higher intensity and spatial confinement of signals.
Fusion-protein technology allows the conjugation of both affinity immobilization and CBM3-fusion
proteins without loss of activity of the target molecule which offers an attractive alternative for bioactive
paper fabrication. Thus, it would be of great interest to construct two fusion proteins, namely L-malate
dehydrogenase from E. coli with CBM3 and aspartate aminotransferase from E. coli with CBM3, which
are involved in the detection of L-malic acid in wines using an UV detection method, as described
previously in section 1.1. L-malate dehydrogenase (EC 1.1.1.37) is an enzyme that catalyzes the
conversion of malate into oxaloacetate using NAD/NADH coenzyme system [100]. In eukaryotes, it can
be within mitochondria and in the cytosol. On the other hand, aspartate aminotransferase (EC 2.6.1.1)
is a pyridoxal phosphate-dependent enzyme present in hepatocytes and myocytes that catalyzes the
reversible transfer of an amine group from glutamic acid to oxaloacetic acid, forming α-ketoglutaric acid
and aspartic acid. It is involved in amino acid metabolism and is commonly measured clinically as a
marker for live rand heart health [101]. These enzymes fused with CBM3 could be an add value to a
wax printed µPAD for quality control in winemaking process.

22
Chapter 2. Objectives
This thesis is performed within the frame of the project CBM sensor paper- Development of new
platforms for biomolecules immobilization onto cellulose (Agência de Inovação, project 30270), which
involves a partnership between the Portuguese company NZYTech, Lda (https://www.nzytech.com) and
Instituto Superior Técnico. The main goal of the work presented here is to develop a new and rapid
colorimetric detection method for L-malic acid that is suitable for the winemaking industry. Since L-malic
acid is responsible for wine’s organoleptic properties and ultimately for the wine’s quality, the availability
of a simple method that could be used without additional instrumentation would be valuable for
winemakers.
The specific goal is to develop and optimize a µPAD with immobilized L-malate dehydrogenase
(MDH), aspartate aminotransferase (AST) and chromogenic reagents to detect L-malic acid in wines.
The L-malic acid UV method commercialized by NZYTech is first modified to allow colorimetric detection
and then transferred to paper strips. A wax printing method is implemented to design microfluidic
structures (channels or closed chambers) on paper best suited to the bioassay developed. The analytical
performance of the µPAD is assessed, procedures and parameters like reagent deposition, drying time,
storage conditions and shelf-life are optimized. Additionally, the analytical performance and shelf-life of
the µPADs are compared using two biomolecule immobilization strategies, physical adsorption and
bioaffinity. In bioaffinity immobilization, two fusion proteins are constructed by combining the analytical
enzymes L-malate dehydrogenase and aspartate aminotransferase from E. coli with CBM3 from C.
thermocellum CipA scaffoldin. Calibration charts that correlate a given concentration of analyte with a
specific color are constructed, in order to allow a rapid and simple semi-quantitative quantification.
Finally, the paper devices developed are used to determine L-malic acid in real samples (white and red
wine) and the results obtained will be compared with the ones obtained with kits commercially available.

23
Chapter 3. Methods and Materials
3.1 Chemicals and Materials
L-malic acid, D-(+)-trehalose dehydrate, phenazine methosulphate, 3-(4,5-dimethylthiazol-2-yl)-
2,5-diphenyltetrazolium bromide, imidazole, NaHepes, NaCl, polyvinyl alcohol 98 -99% hydrolyzed and
L-glutamic acid monosodium salt monohydrate were all purchased from Sigma-Aldrich (St. Louis, MO).
Tris (Eurobio, Madrid, Spain), CaCl2 (Panreac Química S.L.U., Barcelona Spain), activated carbon
(Merck, Darmstadt, Germany). MDH, ASP and NAD+ were kindly provided by NZYTech. 1% (v/v)
polyvinyl alcohol was prepared in pre-heated water at 80 ºC and dissolved for 8 hours. Then, 4 drops of
Triton X-100 (Merck, Darmstadt, Germany) were added.
3.2 Microfluidic paper analytical device (µPAD) fabrication
All assays involving paper were performed using Whatman No.1 chromatography paper (catalog
number: 3001-878; Whatman™, GE Healthcare©, Buckinghamshire, UK). This paper is made out of
pure cellulose, is hydrophilic, homogeneous, pure, biocompatible and relatively inexpensive [41]. It has
a thickness of 0.18 mm and is available in sheets of 25 x 25 cm. Device designs were developed with
the drawing software Inkscape® in a 148 mm × 210 mm sheets.
Hydrophobic barriers were patterned onto Whatman No.1 chromatography paper using the wax
printing method. A Xerox ColorQube 8570 color printer designed to print wax-based inks was used. The
sheets of Whatman No.1 chromatography paper were directly fed into the printer. The print head
dispenses ink (melted wax) on the surface of the paper, where it cools and solidifies instantaneously
without further spreading. The ink is made of a mixture of hydrophobic compounds including
carbamates, hydrocarbons and dyes that melts around 120 ºC. The default printer settings were used
for image-quality printing. In this work, arrays of 6 mm and 4 mm diameter circles or compartments
(hereafter referred to as “spots”, see Figure 9A) drawn with 0.4 mm line thickness were printed and
compared. A lateral flow device with 38.7 mm x 6 mm and three 6 mm circular compartments and with
0.4 mm barriers was also tested as shown in Figure 9B. Once printed, the paper devices are heated to
150 °C on a heat plate with temperature sensor (MR Hei-Standard, Heidolph Instruments©, Schwabach,
Germany) for 2 min. In this critical step it is important to use a flat, uniformly heated surface for heating
the paper in order to create a uniform three-dimensional hydrophobic barrier. On the reverse side of the
paper, adhesive tape was used as a support to enhance control over fluid flow as well as to prevent
leakage during the assay, while the printed side was used for application of reagents and sample [102].

24
3.3 Colorimetric detection of L-malic acid using a µPAD
A colorimetric method for the detection of L-malic acid in wines using paper devices was
developed by adapting the NZYTech kit L-malic acid, UV method [103] and a colorimetric enzymatic
procedure for the determination of L-malic acid described in the literature [104].
3.3.1 Physical immobilization of L-MDH and AST on paper
In a first approach, 2 µL of L-malate dehydrogenase (2 mg/mL with 3960 U/mL) and 2 µL of
aspartate aminotransferase (2 mg/mL with 536 U/mL) were physically adsorbed onto the 6 mm spots
(Fig. 9A) and allowed to air dry for 1 hour. Then, 5 µL of a mixture containing 11 % (v/v) NAD+, 22 %
(v/v) MTT (7.4 mM), 8.9 % (v/v) PMS (100 µM), 4.4 % (v/v) Tris (1M) plus L- glutamate (1 M) and 53.3
% (v/v) Millipore-purified water were added followed by the addition of 5 µL of a standard solution of 600
mg/L of L-malic acid in water. After 40 minutes of drying at room temperature the colored signal was
recorded with a scanner (HP scanjet 4400c) or with a photographic camera (Olympus E-PM1). In order
to optimize this assay on paper, the possibility of spotting the individual reagents together with the
enzymes in the first step was assessed by maintaining the volume of the mixture constant.
3.3.2 Physical immobilization of L-MDH and AST with chromogenic reagents on
paper – Optimized protocol
Preliminary experiments with the paper devices prepared above showed that the addition of an
enzyme stabilizer such as trehalose (0.3 M) and of surfactants like polyvinyl alcohol and triton X-100
was required to improve the performance of the bioassay. The protocol for the preparation of the 6 mm-
diameter spots was thus modified, involving the sequential addition of the following reagents: i) 1 µL of
a solution of 10% (w/v) trehalose in water; ii) 0.7 µL of a solution containing 1% (w/v) polyvinyl alcohol
and triton X-100 (4 drops) in water (25 mL); iii) 5 µL of a reagent solution containing 2% (v/v) aspartate
Figure 9. Design of the µPADs used in this work. A) 6 mm-diameter “spot”. B) Lateral-flow µPAD with
38.7 mm x 6 mm and circular compartments for sample (compartment 1) and reagent (compartments 2
and 3) addition. The thickness of the printed wax lines in both structures is 0.4 mm. After melting and
diffusion of the wax, the width of the wax barriers increases to 1 mm.
A B
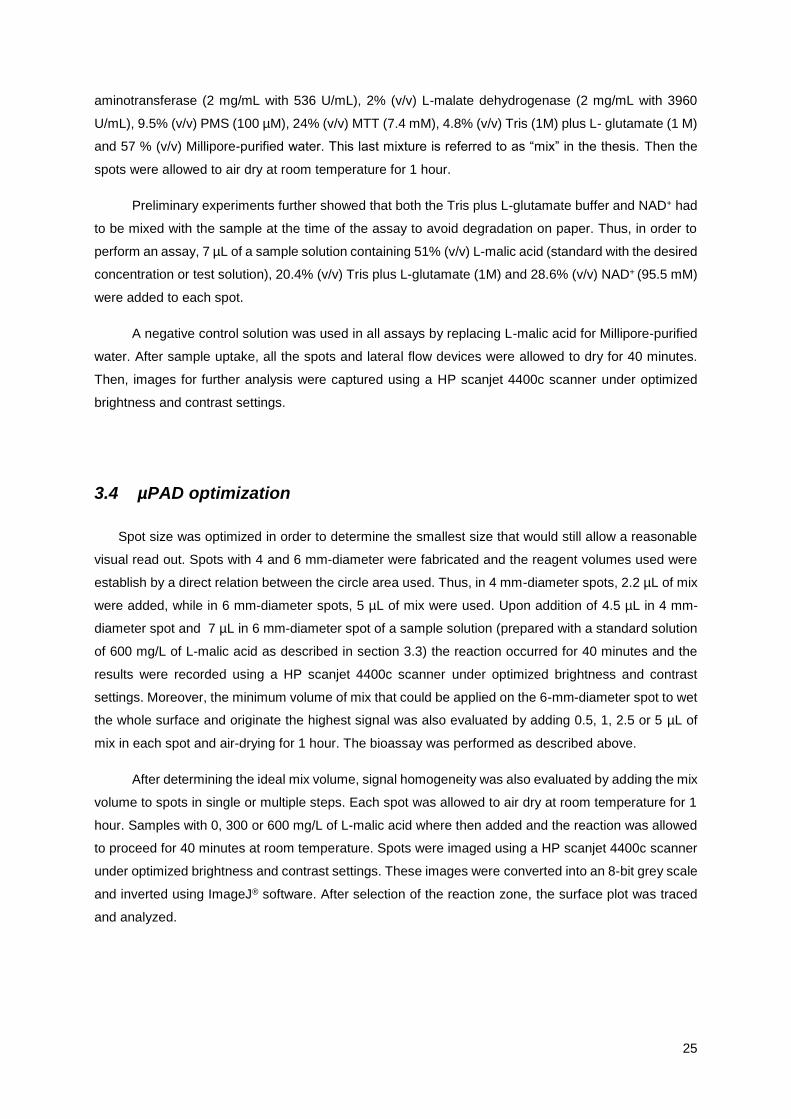
25
aminotransferase (2 mg/mL with 536 U/mL), 2% (v/v) L-malate dehydrogenase (2 mg/mL with 3960
U/mL), 9.5% (v/v) PMS (100 µM), 24% (v/v) MTT (7.4 mM), 4.8% (v/v) Tris (1M) plus L- glutamate (1 M)
and 57 % (v/v) Millipore-purified water. This last mixture is referred to as “mix” in the thesis. Then the
spots were allowed to air dry at room temperature for 1 hour.
Preliminary experiments further showed that both the Tris plus L-glutamate buffer and NAD+ had
to be mixed with the sample at the time of the assay to avoid degradation on paper. Thus, in order to
perform an assay, 7 µL of a sample solution containing 51% (v/v) L-malic acid (standard with the desired
concentration or test solution), 20.4% (v/v) Tris plus L-glutamate (1M) and 28.6% (v/v) NAD+ (95.5 mM)
were added to each spot.
A negative control solution was used in all assays by replacing L-malic acid for Millipore-purified
water. After sample uptake, all the spots and lateral flow devices were allowed to dry for 40 minutes.
Then, images for further analysis were captured using a HP scanjet 4400c scanner under optimized
brightness and contrast settings.
3.4 µPAD optimization
Spot size was optimized in order to determine the smallest size that would still allow a reasonable
visual read out. Spots with 4 and 6 mm-diameter were fabricated and the reagent volumes used were
establish by a direct relation between the circle area used. Thus, in 4 mm-diameter spots, 2.2 µL of mix
were added, while in 6 mm-diameter spots, 5 µL of mix were used. Upon addition of 4.5 µL in 4 mm-
diameter spot and 7 µL in 6 mm-diameter spot of a sample solution (prepared with a standard solution
of 600 mg/L of L-malic acid as described in section 3.3) the reaction occurred for 40 minutes and the
results were recorded using a HP scanjet 4400c scanner under optimized brightness and contrast
settings. Moreover, the minimum volume of mix that could be applied on the 6-mm-diameter spot to wet
the whole surface and originate the highest signal was also evaluated by adding 0.5, 1, 2.5 or 5 µL of
mix in each spot and air-drying for 1 hour. The bioassay was performed as described above.
After determining the ideal mix volume, signal homogeneity was also evaluated by adding the mix
volume to spots in single or multiple steps. Each spot was allowed to air dry at room temperature for 1
hour. Samples with 0, 300 or 600 mg/L of L-malic acid where then added and the reaction was allowed
to proceed for 40 minutes at room temperature. Spots were imaged using a HP scanjet 4400c scanner
under optimized brightness and contrast settings. These images were converted into an 8-bit grey scale
and inverted using ImageJ® software. After selection of the reaction zone, the surface plot was traced
and analyzed.

26
3.5 µPAD analytical performance
The ability of the bioactive paper strips to quantify different amounts of L-malic acid using the
colorimetric bioassay was tested. Paper strips with spots containing physically adsorbed enzymes were
prepared and tested using the optimized protocol described in section 3.3. Standard solutions with
different concentrations of L-malic acid (0, 5, 10, 20, 50, 100, 150, 200, 300, 600 mg/L) were
supplemented with 20.4 %(v/v) Tris plus L-glutamate (1M) and 28.6 %(v/v) NAD+ (95.5 mM) and
deposited in the center of the spots. After 40 minutes of drying at room temperature, the results were
recorded using a HP scanjet 4400c scanner and a Olympus E-PM1 camera.
It is possible to perform a quantitative analysis using an image processing program. All spots
were analyzed by measuring the mean grey intensity using ImageJ® software as exemplified in Figure
10 and as described by Jokerst [35]. Using this software, the original digital image is first converted to
an 8-bit grey scale image (Figure 10B), which is then inverted (Figure 10C), so that the grey intensity
measured increases with the decreasing grey color developed. Then the reaction zone is selected and
the mean grey intensity is measured. The size of the circumferences used to select the reaction zone
was kept constant during this work. Moreover, the average mean grey intensity was calculated by
discounting the mean grey intensity of the negative control.
3.6 Self-stability
Shelf stability of the bioactive paper spots was evaluated by preparing devices with trehalose,
polyvinyl alcohol, triton X-100 and reagent mix using the optimized protocol as described in section 3.3.
Subsequently, the devices were stored at 4 ºC or room temperature for a time period of 18 days. During
storage, devices were protected from direct light exposure, since both MTT and PMS are light sensitive
compounds. Spots were tested over a period of several days using 7 µL of a solution containing the
analyte (0 or 150 mg/L of L-malic acid), Tris plus glutamate and NAD+. Analysis were performed in
triplicate on each testing day and the mean grey intensity of spots was determined using ImageJ (see
section 3.3)
Figure 10. Protocol for ImageJ analysis of spots. A) A digital image of the paper spots used to detect L-
malic acid is obtained using a scanner. B) The image in A is converted to 8-bit grey scale digital image.
C) The image in B is inverted to produce a negative image and areas corresponding to the reaction
zones are selected in individual spots.
A
B
C

27
3.7 Detection of L-malic acid using a lateral-flow µPAD
The colorimetric assay developed to detect L-malic acid in bioactive paper was adapted to a
lateral flow assay using the 38.7 mm x 6 mm devices shown in Figure 9B. In a first approach the volumes
that could be applied in each compartment were evaluated using an orange food dye. For both the
middle spot and the reaction zone spot, volumes of 0.5, 1, 1.5 and 2 µL were tested in order to verify
the maximum volume that could be applied without leakage from the channels.
For a lateral-flow µPAD the following protocol was established: i) 1 µL of a solution of 10%
trehalose in water and ii) 0.7 µL of a solution containing 1% polyvinyl alcohol and triton X-100 (4 drop)
in water (25 mL) were added to the middle and reaction spots. Then, 1.5 µL of mix were added to the
reaction spot, while 2 x 1 µL of NAD+ were added to the middle spot. Analysis were performed by adding
28 µL of a solution containing 71 % (v/v) of an L-malic acid standard or test sample and 29 % (v/v) Tris
plus L-glutamate (1M) to the first compartment. After air-drying for 40 minutes the µPADs were scanned
as described above.
3.8 Construction of pET21a_AST-CBM3 and pET21a_MDH-CBM3
3.8.1 Plasmids
Plasmids pET21a_AST and pET21a_MDH (see Figure 11A and B) were kindly provided by
NZYTech, Lda and used to transform E. coli DH5α (Invitrogen, Carlsbad, CA) by electroporation.
Plasmid pET21a_ZZ-CBM3 (see Figure 11C), which was available in the lab, was genetically modified
to introduce one upstream restriction site for XhoI restriction enzyme and to remove the stop codon.
This plasmid was subsequently used to provide the cbm3 gene together with a linker region. This linker
segment has sufficient length and flexibility to allow the efficient orientation and operation of both
proteins that will be engineered.

28
3.8.2 Construction of pET21a_AST-CBM3 and pET21a_MDH-CBM3
Cells containing pET21a_AST, pET21a_MDH and pET21_ZZ-CBM3 were grown in falcon tubes
containing 5 mL of LB medium supplemented with 100 μg/mL ampicillin by incubating overnight at 37
ºC with a shaking rate of 250 rpm. Subsequently, cells were harvested by centrifugation at 4 000 rpm
and 4 ºC, for 10 minutes. Plasmids were purified using a High pure plasmid isolation kit (Roche)
according to the manufacturer recommended protocol. Plasmid concentration was determined using
Nanodrop spectrophotometer (Nanovue Plus, GE) and solutions were concentrated using a DNA
speedVac concentrator.
Three µg of pET21a_AST and pET21a_MDH were linearized with XhoI (Thermo scientific) for 2
hours at 37 ºC. An agarose gel electrophoresis (agarose 1% in TAE buffer 1X) was performed and the
linearized vectors were extracted and purified using a purification kit (NZYTech) according to the
manufacturer instructions. Plasmids concentration were determined using Nanodrop
spectrophotometer. Since the linearized plasmids have blunt ends, a treatment with alkaline
phosphatase was performed to remove 5’ end phosphates to prevent recircularization of the vectors.
Thus, 1 µL of alkaline phosphatase (Roche, Basel, Switzerland) was added to a solution containing 30
µL of previously digested DNA, 5 µL of buffer and water for 50 µL of total volume.
The cbm3 gene from pET21a_ZZ-CBM3 was amplified by PCR using the forward primer 5'-
ggggtaaagaaccgctcgagcaccacca-3' and the reverse primer 5'-tggtggtgctcgagcggttctttacccc-3'. The PCR
reaction was carried out based on KOD (Novagen) protocol: 50 µL reaction containing KOD Taq
polymerase (1 µL), 10 ng of pET21a_ZZ-CBM3 (1 µL), 10 µM of forward and reverse primers (1.5 µL),
200 µM dNTPs (5 µL), MgSO4 (3 µL), ddH2O (32 µL) and KOD buffer (5 µL). Cycling conditions
comprised 4 steps. The first step was performed at 95 °C for 2 minutes to activate the polymerase. The
A B C
Figure 11. Maps of plasmids A) pET21a_AST, B) pET21a_MDH and C) pET21a_ZZ-CBM3 used to
clone CBM3-fusion proteins with XhoI restriction sites. All plasmids carry an ampicillin resistant marker
and contain a his-tag region. pET21a_ZZ-CBM3 was used as the source of the cbm3 gene and linker
that were cloned into pET21a_AST and pET21a_MDH.

29
second step was at 95 °C for 20 sec to denature the DNA and the next step was at 67.1 ºC for 10 sec
which is the lowest primer melting temperature. The final step was at 70°C for 2.4 minutes. Forty cycles
of steps 2, 3 and 4 were performed. Then, the PCR product was digested for 2 hours at 37 ºC using the
restriction enzyme XhoI (Thermo scientific) and subjected to agarose electrophoresis (agarose 1% in
TAE buffer 1X). The cbm3 gene from pET21a_ZZ-CBM3 was finally purified from the gel using a
purification kit (NZYTech). Fragment concentration was determined using the Nanodrop
spectrophotometer.
Ligation between the vector (pET21a_AST and pET21a_MDH) and the fragment (cbm3 gene)
was performed using a 3:1 insert/vector ratio. The mass of insert used (ng of insert) was determined
according to the following equation:
𝒏𝒈 𝒐𝒇 𝒊𝒏𝒔𝒆𝒓𝒕 = 𝒏𝒈 𝒐𝒇 𝒗𝒆𝒄𝒕𝒐𝒓×𝒌𝒃 𝒊𝒏𝒔𝒆𝒓𝒕
𝒌𝒃 𝒗𝒆𝒄𝒕𝒐𝒓 × 𝟑 (5)
where kb of insert and vector corresponds to the kilobase pairs of cbm3 (0.516 kb) and pET21a_AST
(6.561) pET21a_MDH (6.309), respectively. Ligation was carried out with 2 µL of T4 ligase (Promega),
2 µL T4 ligase buffer and ddH2O in a final volume of 20 µL for 3 hours at room temperature and overnight
at 4 ºC. Subsequently, E. coli DH5α cells (Invitrogen, Carlsbad, CA) were transformed by electroporation
(2500 V) with 1 µL of ligation mixtures and ressuspended in 1 mL of LB medium for 1 hour, at 37 ºC and
250 rpm. After that, cells were harvested by centrifugation at 4000 rpm for 1 minute. Cells were then
ressuspended in 100 µL of supernatant, plated on LB agar supplemented with 100 μg/mL ampicillin and
incubated overnight at 37 ºC.
Several colonies were picked from LB plates and grown in LB liquid medium supplemented with
100 μg/mL ampicillin, at 37 ºC, 250 rpm overnight. Cells banks were prepared with 20 µL of glycerol
(99%) and 80 µL of cells suspension and stored at -80 ºC. To confirm if the cloning was successful, cells
were harvested by centrifugation at 4 000 rpm, 4 ºC, for 10 minutes and pET21a_AST-CBM3 and
pET21a_MDH-CBM3 were purified using a High pure plasmid isolation kit (Roche) according with
manufacture recommended protocol. Plasmid concentration was determined using Nanodrop
spectrophotometer and a digestion with XhoI was performed at 37 ºC for 2 hours. Finally, the result was
confirmed by agarose electrophoresis and by sequence.
3.9 Expression and purification of AST protein and fused protein AST-
CBM3
AST-CBM3 is a fusion protein that combines an aspartate aminotransferase from E.coli with a
CBM3 module from C. thermocellum CipA. The primary structure of this protein is represented in Figure
12. According to the ExPASYs Compute pI/Mw software, AST-CBM3 has a molecular weight of 63.5
kDa.

30
Plasmids pET21a_AST and pET21a_AST-CBM3 were used to transform E. coli BL21 (DE3)
(Novagen), a strain which is suitable for protein production, because it does not express some
proteases. Transformed cells were then used to inoculate 5 mL of LB supplemented with 100 μg/mL
ampicillin and incubated overnight at 37 ᵒC with a shaking rate of 250 rpm. Subsequently, cells were
diluted down to an OD600 of 0.1 and used to inoculate 500 mL of LB media supplemented with 100 μg/mL
ampicillin. Growth was carried out at 37 ᵒC with a shaking rate of 250 rpm. At an OD600 between 0.4 and
0.6, protein expression was induced with 1M of isopropyl β- D-1-thiogalactopyranoside (IPTG) for 16
hours at 37 ᵒC (250 rpm). Cells were harvested by centrifugation (Eppendorf centrifuge 5810R) at 4 000
rpm, 4 ºC, for 10 minutes and the pellet was resuspended in 30 mL of load buffer (10 mM imidazole, 50
mM NaHepes, 1 M NaCl, 5 mM CaCl2, pH 7.5). Cells were then disrupted by sonication (Branson
Sonifier 250) for 6 x 30 seconds on ice with interruptions of 30 seconds. Centrifugation at 15 000 g, 4
ºC, for 15 minutes was used to separate the supernatant containing the proteins of interest from cell
debris (Eppendorf centrifuge 5810R). The resulting supernatant was filtered using a 0.22 μm syringe
filter (Milipore, Milex®- GV).
Purification of his-tagged proteins AST-CBM3 and AST was performed by immobilized metal ion
affinity chromatography (IMAC) using 4 mL of a Ni sepharoseTM 6 fast flow (GE Healthcare) resin. After
packing in an appropriate column (Agilent Bond Elut Reservoir, Agilent Technology, Santa Clara, CA),
5 column volumes of Millipore-purified water was added to wash the resin with a peristaltic pump at a
speed rate of 1 mL/min (Qlabo). Then, the column was equilibrated with 10 column volumes of binding
buffer (10 mM imidazole, 50 mM NaHepes, 1 M NaCl and 5 mM CaCl2, pH 7.5). Upon sample dilution
0.75 times in the binding buffer, 20 mL were loaded on the column. At the same time, aliquots of 1 mL
of eluate were collected and the absorbance at 280 nm was measured using a spectrophotometer
(Spectra max Plus 384). Binding buffer was loaded into the column until the absorbance of the collected
aliquots equaled the absorbance of the binding buffer, which means that all the unbound proteins were
eluted. After that, elution buffer (300 mM imidazole, 50 mM NaHepes, 1 M NaCl and 5 mM CaCl2, pH
7.5) was added to elute the protein of interest. Aliquots with eluted protein were selected by measuring
absorbance at 280 nm and pooled. The protein was kept on the elution buffer and stored at 4 ºC.
Figure 12. AST-CBM3 fusion protein amino acid sequence (577 residues).

31
Purity and molecular weight of the purified proteins were evaluated by sodium dodecyl sulfate–
polyacrylamide gel electrophoresis (SDS–PAGE). AST from NZYTech and CBM3 previously purified in
our lab were used as standards. Then, 25 µL of Bio-Rad (Hercules, CA, USA) loading buffer and 5 µL
of dithiothreitol (DTT) were added to 20 µL of sample at 100°C for 10 min. A volume of 20 µL of these
samples was then applied in a pre-cast gel prepared using a 40% acrylamide/bis-acrylamide solution
(Bio-Rad, Hercules, CA). A molecular weight marker from Bio-Rad (Precision Plus Protein Dual-color
standard) was used. The electrophoresis was performed at 90V for 2 h using a running buffer containing
25 mM Tris-HCl, 192 mM glycine and 0.1% (w/v) SDS at pH 8.3. Finally, gels were stained using
Coomassie method for 1 hour and de-stained by washing three times during 30 min with 30% (v/v)
ethanol and 10% (v/v) acetic acid, until background color disappeared. Images of SDS-PAGE were
obtained using an Olympus E-PM1 camera.
The purified AST and AST-CBM3 concentration was determined using the Pierce® BCA Protein
Assay kit (microplate procedure), according to the manufacturer’s instructions [105].
3.10 Binding activity of AST-CBM3 fusion protein to cellulose
The ability of AST-CBM3 to bind to cellulose was studied and compared with AST and CBM3.
Two circles of Whatman No.1 chromatography paper with 0.009 g each were cut and introduced into
the wells of MultiScreen-HV 96-well plates equipped with a Durapore 0.45 microns hydrophilic
membrane (Milipore). Then, 100 µL of a solution containing 5 % Tris (1 M) plus glutamate (1 M) pH 10
and 95 % of Millipore-purified water were added per well and incubated for 30 minutes at room
temperature and with a shaking rate of 300 rpm in order to equilibrate the paper. After removing the
solution by filtration, 100 µL of AST-CBM3 fusion protein (3 µM) diluted in the previous buffer was added
to each well and incubated for 30 minutes (room temperature, 300 rpm). The same protocol was
performed with the AST and CBM3 controls. The concentration of proteins before and after filtration was
measured using the Pierce® BCA Protein Assay kit (microplate procedure), according to the
manufacturer’s instructions[105]. The binding activity was calculated as the amount (pmol) of protein
adsorbed per gram of paper used in the assay.
3.11 Activity of AST-CBM3 fusion protein on paper
The catalytic activity of AST-CBM3 immobilized on 6 mm-diameter spots wax-printed on paper
(Figure 9A) was assessed in an indirect way by using the bioassay developed to detect L-malic acid.
Spot preparation was performed as described previously on section 3.3. Briefly, a solution containing
10 % of trehalose was first added to the spot followed by a solution containing 1% polyvinyl alcohol and
triton X-100. Then, 5 µL of a reagent solution containing 2 % (v/v) AST-CBM3 (2.69 mg/mL), 2 % (v/v)

32
L-MDH, 9.5% (v/v) PMS (100 µM), 24% (v/v) MTT (7.4 mM), 4.8% (v/v) Tris (1M) plus L- glutamate (1
M) and 57% (v/v) Millipore-purified water were added. The activity of AST-CBM3 was compared with
the activity of AST from NZYtech (solubilized in 3.2 M of ammonium sulfate) and of AST produced in
the lab (solubilized in 300 mM of Imidazole) by performing a similar protocol. The molar concentration
of enzymes in the reagent solution was kept constant. Moreover, a control test without AST enzyme
was also performed. After addition of the reagents the spots were allowed to air dry at room temperature
for 1 hour. Next, 7 µL of a sample solution containing 51% (v/v) L-malic acid, 20.4% (v/v) Tris plus L-
glutamate (1M) and 28.6% (v/v) NAD+ (95.5 mM) were added to each spot. Standard solutions with 0,
5, 10, 20, 50, 100, 150, 200, 300, 600 mg/L were tested. After 5 minutes of reaction the signal was
recorded using a camera (Olympus E-PM1) and after 40 minutes of completely air drying at room
temperature the signal was recorded using a scanner (HP scanjet 4400c) under optimized brightness
and contrast settings. The average mean grey intensity of each spot was evaluated using ImageJ® as
described in detail in section 3.5. Calibration curves, linearity and limits of detection were evaluated and
compared with those obtained using AST. In addition, a calibration chart was designed using Inkscape®
to associate a concentration or a range of concentrations to a color. This allows to the final user to
perform a semi-quantitative analysis by comparing the color obtained with the colors in the calibrating
chart.
The shelf stability of µPADs prepared with AST-CBM3 and AST in imidazole buffer were
compared. Spots with 6 mm-diameter were wax-printed on paper and prepared with trehalose, polyvinyl
alcohol, triton X-100 and 5 µL of a reagent solution containing all the reagents required for the assay as
described in section 3.3. As described in section 3.5, µPADs were stored at 4 ºC and room temperature
for a time period of 18 days in order to determine their lifetime. Spots were tested over a period of
several days with 7 µL of a solution containing the analyte (0 or 150 mg/L of L-malic acid), Tris plus
glutamate and NAD+. Triplicates were performed on each testing day with both solutions and the mean
grey intensity of the spots generated was analyzed using ImageJ (see section 3.5).
In addition, to study if AST-CBM3 had any impact on color uniformity on lateral-flow µPADs,
bioactive paper was prepared as described in section 3.7. Briefly, 1.5 µL of mix was added to the
reaction zone, while 2 x 1 µL of NAD+ was added to the middle compartment. After 1 hour of air–drying,
28 µL of a sample solution containing 71 % (v/v) L-malic acid (standard solution with 0 and 150 mg/L),
29 % (v/v) Tris plus L-glutamate (1M) were added in the sample compartment. After air-drying for 40
minutes the channels were scanned.

33
3.12 Detection of L-malic acid in wine
3.12.1 Wines tested
White and red wines commercially available were tested. Each wine was identified with the
following numbers: 1. Porta da Ravessa white wine, 2. Vinho Regional Alentejano – Pingo Doce white
wine, 3. Lezíria white wine, 4. Porta da Ravessa red wine, 5. Vinho Regional Alentejano – Pingo Doce
red wine, 6. Lezíria red wine.
3.12.2 Colorimetric detection
As proof of concept, the L-malic acid content of white and red wines was tested using the
colorimetric µPAD developed. While white wine samples only required sample dilution prior to analysis,
red wines were pre-treated with activated carbon in order to remove colored compounds. Thus, 0.025 g
of activated carbon were added to 500 µL of red wine and centrifuged for 3 minutes at 14 000 rpm.
Then, samples were filtered using a 0.22 µm seringe filter (Milipore, Milex®- GV). In order to confirm that
0.025 g of activated carbon are sufficient to remove the majority of the color, 200-750 nm UV-vis spectra
were recorded before and after a 40 times-diluted sample of red wine number 4 was treated. Water was
used as a blank for the UV-vis spectrum.
Wines without dilution and diluted 5, 10 and 50 times were analyzed for L-malic acid using paper
devices with 6-mm diameter spots. Both the spot and the samples were prepared as described in section
3.3. After 40 minutes of air-drying, spots were scanned and analyzed using ImageJ® as described in
section 3.5.
3.12.3 UV detection of L-malic acid
To validate the results of L-malic acid concentration determined with the µPADs developed, wine
samples were also analyzed using the L-malic acid, UV detection kit kindly provided by NZYTech, Lda
[103]. All the wines tested were used without sample pretreatment except for a dilution of 5 and 10
times. The detection was performed in 96-well microplates. Before the addition of MDH, the absorbance
at 340 nm at room temperature was measured using a microplate reader (SPECTRAmax PLUS 384).
Upon enzyme addition and after 3 minutes of reaction, the absorbance was measured at 340 nm at
room temperature, using the same microplate reader. Standard solutions of L-malic acid in water with
concentrations between 5 and 300 mg/L were used on the day of preparation to obtain the calibration
curve. Moreover the blank contain all the constituents of the reaction, except the substrate, L-malic acid,
which was replaced by water. The assay was performed using triplicates of both samples and standard
solutions.

34
3.12.4 Spiking
Accuracy of the µPAD developed to quantify L-malic acid was assessed by adding known
concentrations of L-malic acid to white wine number 3 and red wine number 4. The white wine was
diluted 50 times and then both white and red wine (50 mL) were spiked with 1.3, 2.5 and 5.0 mg of L-
malic acid. Subsequently, 500 µL of red wine spiked was pre-treated with 0.025 g of activated carbon,
centrifuged for 3 minutes at 14 000 rpm and filtered using a 0.22 µm seringe filter (Milipore, Milex®- GV).
7 µL of a solution containing 51% (v/v) of wine spiked, 20.4% (v/v) Tris plus L-glutamate (1M) and 28.6%
(v/v) NAD+ (95.5 mM) were added to each spot. Upon air-dried and scanned, each spot was analyzed
by measuring the mean grey intensity using ImageJ® as described in section 3.5. L-malic acid content
was calculated and compared with the theoretical value expected.

35
Chapter 4. Results and Discussion
4.1 Colorimetric detection of L-malic acid using a µPAD
One of the goals of this work was to develop a rapid colorimetric detection method for L-malic acid
using a µPAD. The underlying method is based on two enzymatic reactions, involving L-malate
dehydrogenase (MDH) and aspartate aminotransferase (AST), and one non-enzymatic reaction (see
Figure 13). In the first reaction, L-malate dehydrogenase (L- MDH) catalyzes the conversion of L-malic
acid plus NAD+ to oxaloacetate plus NADH. In turn, this NADH molecule transfers its hydrogen to the
phenazine methosulphate (PMS) and 3-(4.5-dimethylthiazol-2-yl)-2.5- diphenyltetrazolium bromide
(MTT) system, reducing MTT and producing a water-insoluble, purple-colored MTT formazan. In the
second enzymatic reaction, aspartate aminotransferase catalyzes the conversion of oxaloacetate plus
L-glutamate to L-aspartate and 2-oxoglutarate. This reaction is essential in the detection method,
because the dehydrogenation of L-malic acid into oxaloacetate by L-malate dehydrogenase is a highly
endergonic reaction (ΔG°=+29.7 kJ/mol) [106], i.e. the equilibrium reaction strongly favors the reactants
over the products. Thus, the addition of AST favors the consumption of oxaloacetate, which pulls the
MDH reaction towards the formation of oxaloacetate and consequently favors the formation of the purple
formazan.
As a first approach, both enzymes were physically adsorbed onto a 6 mm-diameter paper spot
and allowed to air dry for 1 hour. Then, the remaining reagents (5 µL of NAD+, MTT, PMS, Tris + L-
glutamate and water) were added to the spot together with the analyte (5 µL of 600 mg/L of L-malic
acid). After 20 minutes, it is possible to see a color change from yellow to purple due to the presence of
L-malic acid (Figure 14A). Although this shows that the reaction occurs with the enzymes adsorbed to
paper, the goal is to have all the reagents required for the assay spotted and dried on paper a priori,
and then still be able to detect the presence of L-malic acid. The results obtained when each of the
individual reagents (PMS, MTT, Tris plus glutamate and NAD+) were spotted together with the enzymes
are presented in Figure 14B-E. According to Figure 14 B, C and E, when MTT, PMS, NAD+ are spotted
together with the enzymes and allowed to dry, the reaction still occurs after the addition of the remaining
reagents and of the analyte. Interestingly, when Tris plus glutamate buffer is spotted with the enzymes
Figure 13. Reaction scheme of the colorimetric system developed to detect L-malic acid. Two enzymatic
reactions are coupled with a non-enzymatic reaction, where the NADH produced reacts with the
chromogenic substrates MTT and PMS, originating a final purple product in the presence of the analyte.
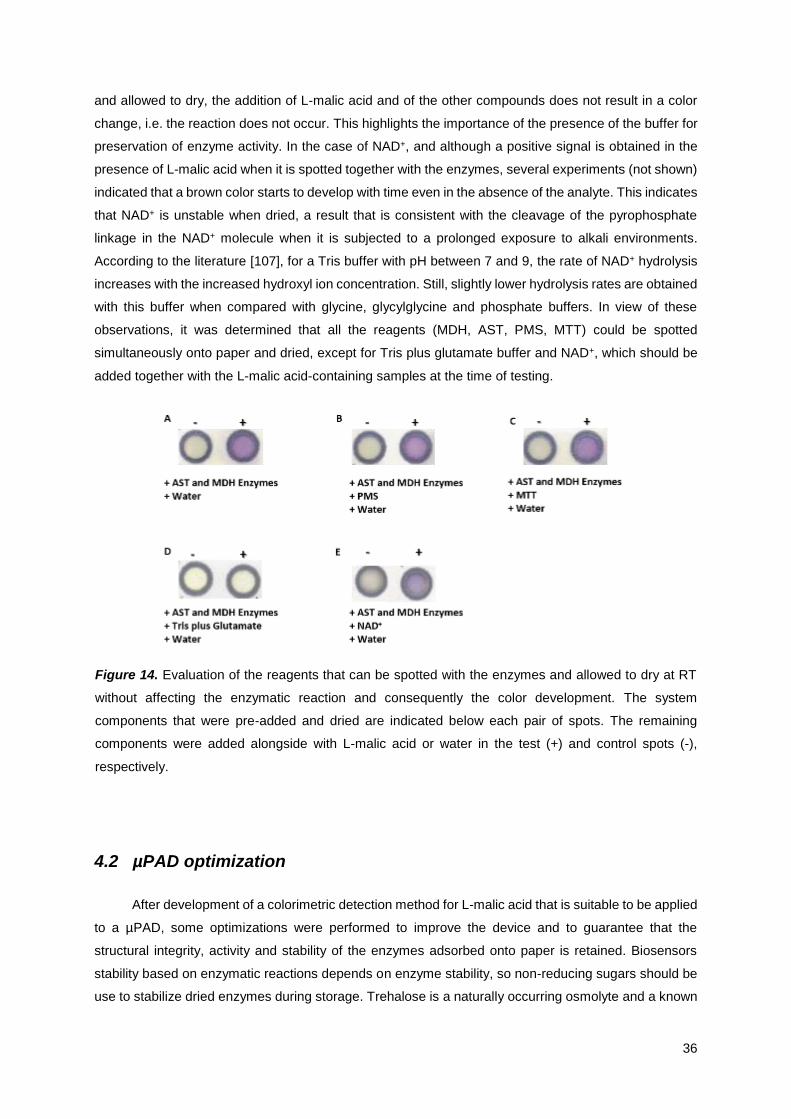
36
and allowed to dry, the addition of L-malic acid and of the other compounds does not result in a color
change, i.e. the reaction does not occur. This highlights the importance of the presence of the buffer for
preservation of enzyme activity. In the case of NAD+, and although a positive signal is obtained in the
presence of L-malic acid when it is spotted together with the enzymes, several experiments (not shown)
indicated that a brown color starts to develop with time even in the absence of the analyte. This indicates
that NAD+ is unstable when dried, a result that is consistent with the cleavage of the pyrophosphate
linkage in the NAD+ molecule when it is subjected to a prolonged exposure to alkali environments.
According to the literature [107], for a Tris buffer with pH between 7 and 9, the rate of NAD+ hydrolysis
increases with the increased hydroxyl ion concentration. Still, slightly lower hydrolysis rates are obtained
with this buffer when compared with glycine, glycylglycine and phosphate buffers. In view of these
observations, it was determined that all the reagents (MDH, AST, PMS, MTT) could be spotted
simultaneously onto paper and dried, except for Tris plus glutamate buffer and NAD+, which should be
added together with the L-malic acid-containing samples at the time of testing.
4.2 µPAD optimization
After development of a colorimetric detection method for L-malic acid that is suitable to be applied
to a µPAD, some optimizations were performed to improve the device and to guarantee that the
structural integrity, activity and stability of the enzymes adsorbed onto paper is retained. Biosensors
stability based on enzymatic reactions depends on enzyme stability, so non-reducing sugars should be
use to stabilize dried enzymes during storage. Trehalose is a naturally occurring osmolyte and a known
Figure 14. Evaluation of the reagents that can be spotted with the enzymes and allowed to dry at RT
without affecting the enzymatic reaction and consequently the color development. The system
components that were pre-added and dried are indicated below each pair of spots. The remaining
components were added alongside with L-malic acid or water in the test (+) and control spots (-),
respectively.

37
universal protein stabilizer [108]. Upon testing that trehalose does not affect L-malic acid detection, 0.3
M of trehalose was added to each spot during device preparation to promote retention of enzyme
activity, as proposed by Whiteside’s group [75].
After spotting and drying the reagent mixture on paper, a hydrophobic layer is formed and upon
sample addition the drop to not spread all over the surface, as shown in Figure 15A, which decreased
the homogeneity of the signal developed. To overcome this issue, two surfactants namely, polyvinyl
alcohol and Triton X-100 were added to all spots after trehalose addition as suggested in a protocol
reported on the literature [109]. These surfactants increase the hydrophilicity of the surface upon reagent
addition, allows sample drops to spread easily across the spots and results in a higher color
homogeneity (Figure 15B).
In µPAD development the major cost comes from the reagents [45], so it is important to minimize
the reagent volume used. Therefore, the reaction zone size was evaluated in order to make it as small
as possible, while still allowing a good visual read-out. Spots with 4 and 6 mm-diameter were tested as
shown in Figure 16. Although the smaller spots require less reagent volumes, it is more difficult for the
user to observe the result, due to the reduced size of the device which becomes even smaller after wax
melting. As mentioned previously, paper is an anisotropic material, so the dimensions of the printed
features do not translate directly to the dimensions of the hydrophobic patterns in paper [41]. On the
other hand, 6-mm-diameter spots still require a small reagent volume and are large enough to allow a
good visual readout. Consequently, spots with this diameter were used throughout this work.
Figure 16. Physical immobilization of L-MDH and AST enzymes onto a paper-based microspot and after
drying during 1 hour, a mixture with the chromogenic reagents and sample were added. For the control,
L-malic acid was substitute by water. The assay was performed on a paper-based microspots with A)
4-mm-diameter spot and B) 6-mm-diameter spot.
Figure 15. Polyvinyl alcohol and Triton X-100 effect on the signal obtain. A) When no surfactants are
added, sample drops do not spread easily through the surface, affecting signal homogeneity. B) In the
presence of surfactants, spot surface became more hydrophilic, so drop spreading was facilitated and
a higher signal homogeneity was achieved.
Signal Signal
A B

38
Moreover, the minimum volume of reagent mixture that could be applied on the 6-mm-diameter
spot to wet the whole surface and developing a higher signal was also evaluated. Different volumes of
mix were applied onto each spot namely, 0.5, 1, 2.5 and 5 µL and after drying for 1 hour, 7 µL of a
solution containing L-malic acid, Tris plus glutamate and NAD+ was added. Dispensing volumes smaller
than 0.5 µL is not advisable, because liquid do not spread all over the reaction zone. According to Figure
17, 5 µL is the minimum volume of mix that presents a high visual signal and homogeneity. Volumes
higher than 5 µL take more time to dry and the signal obtained is similar. Hence 5 µL of mix was
established as the volume to be used further on in all the assays.
Analyzing the spot that has 5 µL of mix in Figure 17 is possible to notice that the color developed
tends to accumulate close to the walls of the spot. This phenomenon is known as the coffee ring effect.
It occurs because a drop tends to spread by capillary flow from the center to the edge, bringing
suspended particles to the spot walls [110]. Consequently, after evaporation the particle concentration
is higher in the edges of the spots than in the center. A study to evaluate whether surface saturation
overcomes this effect was conducted by adding the 5 µL of mix all at once or stepwise as 1 or 2.5 µL
fractions. Each spot was analyzed after addition of a standard solution with 300 and 600 mg/L of L-malic
acid supplemented with Tris plus glutamate buffer and NAD+, using surface plot from ImageJ®. These
concentrations were chosen because they have a higher average mean grey intensity, so it is easier to
study the surface homogeneity. According with Table 2 the differences in surface homogeneity obtained
when the 5 µL mix is added in fractions of 1 µL or at once are evident. Signal homogeneity is clearly
higher when adding 5 µL of mix in fractions of 1 µL. This occurs because 1 µL is sufficient to cover all
spot surface and dries faster, so the molecules do not spread as much as adding 5 µL at once, resulting
in a smaller coffee ring effect. However it is important to highlight that enzymes are not strongly
immobilized onto paper, so upon sample addition, biomolecules may tend to slightly spread to the edges
of the spots. Although signal homogeneity is improved, adding 5 times 1 µL to each spot is time
consuming. Furthermore, the mean grey intensity values of spots obtained when using ImageJ® do not
differ that much. This is because the software measures the mean grey value within the selected area,
which corresponds to the sum of the grey values of all the pixels in the selection divided by the number
of pixels. Consequently, a single 5 µL addition was adopted as the reagent spotting procedure used
throughout this work.
Figure 17. Evaluation of the minimum volume required to obtain an adequate visual read-out.
Different volumes of mix were spotted and dried. Tests were made with a solution of 600 mg/L of L-
malic acid supplemented with NAD+ and Tris plus glutamate.
0.5 µL 1 µL 2.5 µL 5 µL

39
Table 2. Signal homogeneity obtained, when spots prepared by adding the 5 µL of reagent mix all at
once or stepwise, as 1 or 2.5 µL fractions, where used to analyses samples containing 300 and 600
mg/L of L-malic acid. Images were obtained using surface plot of ImageJ®.
Concentration
(mg/L)
5 µL 2.5 µL 1 µL
300
600
Considering the previous results, the protocol used to prepare the µPAD and run the L-malic acid
bioassay was established as shown in Figure 18.
Figure 18. Schematic representation of the bioassay developed to detect L-malic acid using bioactive
paper.

40
4.3 µPAD analytical performance
The ability of the µPAD to detect different amounts of L-malic acid was tested, as well the linearity,
repeatability, sensitivity and detection limit of the method. Therefore, various concentration of substrate
were added to each spot while the mix volume was held constant. Then, all paper spots were digitalized
after drying. The colors developed with the increasing concentration of substrate are represented in
Figure 19A. This experiment shows that in the absence of L-malic acid, no signal is obtained, while with
the increase in the concentration of L-malic acid, a color change occurs from light yellow to purple.
Therefore, it is possible to perform a semi-quantitative analysis by visual read-out. However, this is only
reliable for concentrations higher than 20 mg/L of L-malic acid, where the differences between
concentrations become more evident. In addition, the mean grey intensity of each spot was measured
as described in Section 3.5. A plot with the mean grey intensity as a function of the L-malic acid
concentration in the sample deposited is each spot is shown in Figure 19A. The average mean grey
intensity increases with the increasing concentration of substrate, reaching a saturation point at around
200 mg/L of L-malic acid. Assay linearity was also assessed by plotting the average mean grey intensity
as a function of the logarithm of the concentration of L-malic acid (see Figure 19B). The assay is linear
from 5 to 150 mg/L with a correlation coefficient of 0.984. In addition, the relative standard deviation
calculated for all concentrations was in the range of 0.9 – 3.5 mg/L (n = 5), representing a notorious
precision of the method. Thus, when used in conjunction with image analysis, the method is suitable for
a quantitative analyze of samples with L-malic acid concentrations within the range of 5 to 150 mg/L.
In addition, assay repeatability was also assessed by performing independent measurements
under the same conditions. Solutions of L-malic acid with concentrations of 0, 50 and 150 mg/L were
tested on four separate days and the mean grey intensity was determined using ImageJ®. Then, the
repeatability was calculated as the standard deviation of the average of the average mean grey intensity
determined each day. The results obtained for 50 mg/L and 150 mg/L of L-malic acid were 25.9 ± 5.1
mg/L and 38.5 ± 4.8 mg/L, respectively. Consequently, for these concentrations the method reveals a
good repeatability.

41
The L-malic acid limit of detection (LOD) is defined as the lowest concentration of substrate that
can be detected. On the other hand, the limit of quantification (LOQ) is defined as the lowest amount of
L-malic acid that can be quantified. The LOD was determined as three times the standard deviation of
the blank, while the LOQ was calculated as ten times the standard deviation of the blank, according with
the following equations [111]:
y = 18.547x - 10.849R² = 0.9839
0
5
10
15
20
25
30
35
0.50 1.00 1.50 2.00 2.50
Ave
rage
me
an g
rey
inte
nsi
ty
Log10 [L-malic acid]
Figure 19. Analytical performance of the bioassay developed to detect L-malic acid using enzymes
physically adsorbed onto a µPAD. A) Colors developed with increasing amounts of L-malic acid in the
0 to 600 mg/L range. The calibration curve was obtained by plotting the average mean grey intensity of
each spot as a function of the corresponding concentration (n = 5). B) Assay linearity between
concentrations of 5 and 150 mg/L of L-malic acid with an equation of y = 18.547 log10 [L-malic acid] –
10.849. Error bars were always determined from the standard deviation of n = 5 measurements.
B
0
5
10
15
20
25
30
35
40
45
0 100 200 300 400 500 600 700
Ave
rage
me
an g
rey
Inte
nsi
ty
L-malic acid concentration (mg/L)
A
0 mg/L 5 20 50 100 150 300 600
n = 5
n = 5
42
𝑳𝑶𝑫 = 𝟑. 𝑺𝑫 𝑳𝑶𝑸 = 𝟏𝟎. 𝑺𝑫 (6)
A LOD value of 5.8 mg/L was obtained, which is higher to the value reported when using the L-
malic acid, UV method protocol from NZYTech (0.25 mg/L), which relies on a spectrometry detection
method [103]. Still, this commercial kit is only linear between 5 and 300 mg/L of L-malic acid. In addition,
a LOQ value of 19.8 mg/L was determined.
The determination of the shelf-life of the µPAD developed is essential to prove the usefulness of
the bioassay. Thus, the lifetime of the paper devices were evaluated during storage at room temperature
and 4 ºC. µPADs with 6-mm spots were pre-prepared with 5 µL of mix, dried at ambient conditions and
incubated at the test temperatures. The devices were protected from direct light exposition, because
both MTT and PMS are light sensitive compounds. Devices were tested with water (control sample) and
150 mg/L (test sample) of L-malic acid supplemented with Tris plus glutamate and NAD+, over a period
of several days, by measuring the mean grey intensity of spots using ImageJ. Through time, control
spots started developing a brown color regardless of the presence of L-malic acid, indicating that the
devices were losing stability and authenticity. Thus, to monitor if the control still had a similar average
mean grey intensity as the day 1, a relation between the signal intensity obtained for the control on day
1 (IC0) and for the control on day x (ICx) was established: 𝐼𝐶0
𝐼𝐶𝑥⁄ . Whenever this ratio was found to be
higher than 1, the bioassay was considered as no longer viable. On the other hand, when the ratio was
similar to 1, time course stability for the detection of 150 mg/L was analyzed by using the following
parameter:
𝑰 =𝑰𝒙− 𝑰𝑪𝒙
𝑰𝟎− 𝑰𝑪𝟎 (7)
where Ix and I0 represent the average mean grey intensity determined for the analyte on day x and day
1, respectively. Figure 20 shows the time course stability of the devices when stored at 4 ºC and room
temperature. After 4 days at room temperature, µPADs lost 88 % of activity and after 7 days were no
longer viable. On the other hand, when stored at 4 ºC the µPADs remained functional for 18 days but
with 26 % of their initial activity. Therefore, none of the temperatures tested guaranteed the time course
stability of the device.

43
Figure 20. Time course stability of the µPADs developed to detect L-malic acid. Each spot in a device
(n = 3) was prepared with 5 µL of mix, dried and incubated at 4 ºC and room temperature, protected
from direct light exposition. Time course stability was determined taking into account the average mean
grey intensity determined for control (0 mg/L L-malic acid) and test spots (150 mg/L L-malic acid) on
day x and day 1, as described by equation 7. Error bars were determined from the standard deviations
of 3 measurements for each condition.
4.4 Adaptation to a lateral flow test
One of major features of µPADs is their simplicity and user friendliness. Usually, all the reagents
need to perform the assay are deposited onto paper and the final user just needs to add the test sample.
In the bioassay developed, NAD+ was found to be unstable when mixed with the other components in
the test. For this reason, NAD+ has to be added together with the test sample to each spot at the time
of the assay. To overcome this limitation, a lateral flow µPAD was developed as presented in Figure 21.
The µPAD contains a compartment for NAD+ that is separate from the reaction zone where the other
reagents necessary for the bioassay are present. The device has 38.7 mm x 6 mm and both
compartments have 6-mm-diameter, as the previous spots used. After sample addition, liquid flows via
capillary forces towards the reaction zone, dragging NAD+ alongside. The maximum volume of NAD+
and mix were optimized using 0.5, 1, 1.5 and 2 µL of an orange food dye (data not shown). The results
showed that 1 µL is the maximum volume that can be pipetted as a single addition in the middle
compartment without fluid spreading into the adjacent channels. On the basis of these results, ideal
volumes of 1.5 µL of mix and 2 x 1 µL of NAD+ were established for the reaction and middle spots,
respectively.
-0.4
-0.2
0.0
0.2
0.4
0.6
0.8
1.0
1.2
1 3 5 7 9 11 13 15 17 19
Tim
e c
ou
rse
sta
bili
ty,
I
Time (days)
4 ºC RT

44
This design of the lateral-flow µPAD was tested by adding 28 µL of standard solutions with 0, 10,
50, 100, 300 and 600 mg/L of L-malic acid in the sample input spot. The µPADs were incubated at
ambient conditions in petri dishes. As demonstrated in Table 3, a color change occurs in the presence
of L-malic acid. However, a gradient in the color developed with the increasing concentration of L-malic
acid added is not clearly visible. Moreover, inhomogeneity of the color distribution with accumulation in
the edges of the reaction zone is also noticed, an outcome which is typical of lateral-flow tests. This
makes it difficult to have a reliable visual read-out and ultimately to perform semi-quantitative and
quantitative analysis.
Table 3. Signal detected using a lateral-flow µPAD for the detection of standard solutions of L-malic
acid with concentrations that range between 0 and 600 mg/L.
Concentration of L-malic acid
(mg/L) Signal recorded
0
10
50
100
300
600
This phenomenon occurs because when fluids spread by capillary flow through the channel,
solubilized, non-adsorbed molecules are dragged along and accumulate on the far edge. Furthermore,
the pre-added enzymes are adsorbed to the porous structure of paper by electrostatic interactions,
Figure 21. Schematic representation of a lateral-flow µPAD that allows the pre-deposition of all the
reagents needed for the assay. When a sample is added, fluid flows by capillarity dragging NAD+
alongside and ultimately reaching the reaction zone. The arrow represents flow direction.

45
which are weak when compared to covalent or affinity bonds. Thus, upon sample addition, enzymes
and other components may desorb back into the fluid, migrating further to the edges of the reaction
zone. This means that most of the enzymatic reaction will take place here and consequently, that the
color developed only appears on the edges of reaction zone, leading to a coffee ring effect. According
to the literature, a way to overcome this disadvantage of lateral-flow µPADs, is to find a balance between
the dimensions of the µPAD, the type of paper selected, and the volume of reagents spotted [42].
Thinner papers such as the one used here (Whatman No.1 chromatography paper) have a better
analytical performance. Recently, it was also demonstrated that chemical immobilization of enzymes
enhances color uniformity [62]. Therefore, one of the goals of this work is to immobilize both AST and
MDH onto paper using CBM3 module, in order to prevent enzyme desorption upon sample addition and
thus confine the color development not only to the edges of the devices but to the whole reaction zone.
In addition, the stability of deposited NAD+ overtime was also assessed by preparing lateral flow
µPADs, as described above and storing them at 4 ºC, protected from direct light exposition. Each µPAD
was tested with 0 and 150 mg/L of L-malic acid over a period of two weeks just by visual comparison
with a µPADs prepared on the day of test. Throughout 2 weeks, µPADs produced signals similar to the
ones obtained in the first day, confirming that the proposed design is able to guarantee the stability of
pre-deposited NAD+ onto paper during that time.
4.5 AST-CBM3 fusion protein – Cloning, expression and purification
Fusion technology allows the combination of CBMs with enzymes of interest, in this case L-malate
dehydrogenase and aspartate aminotransferase. MDH is directly involved in the conversion of L-malic
acid, while AST favors the equilibrium reaction in the direction of L-malic acid consumption. Therefore,
AST not only reduces the reaction time, but also increases the signal obtained. CBM3 is an ideal
candidate for a fusion protein, because as demonstrated previously in our lab it enhances the
immobilization of proteins on paper [56]. After several attempts to engineer pET21a_MDH-CBM3, the
cloning method was not successfully achieved. On the other hand, the engineered pET21a_AST-CBM3
was obtained by cloning a cbm3 gene from pET21a_ZZ-CBM3 into pET21a_AST with a final size of
7074 bp, as demonstrated in Figure 22A. To confirm the cloning, a digestion with XhoI enzyme was
performed and analyzed by agarose gel electrophoresis. In Figure 22B, lane 3, it is possible to notice
the presence of a 6561 bp fragment, which corresponds to pET21a_AST, and of a smaller 513 pb
fragment, which corresponds to the cbm3 gene. This proved the insertion of cbm3 gene onto
pET21a_AST-CBM3. The construction was also confirmed by sequencing. Two positive colonies were
grown in LB medium supplemented with ampicillin and seed banks were stored at -80 ºC. Furthermore
pET21a_AST-CBM3 was transformed into E. coli BL21 (DE3), a strain which is suitable for the
production of fusion-proteins.

46
After expression, cell lysis by sonication and purification by Ni-affinity chromatography, an SDS-
PAGE was performed to evaluate the expression and purification of the AST-CBM3 fusion protein. AST
was also expressed and purified as a control. Lanes 6 and 9 in the SDS-PAGE gel of Figure 23
correspond to AST and AST-CBM3 purified fractions, respectively. The molecular weight of the AST
and CBM3 (lane 3) are 45 kDa and 17.6 kDa, respectively. AST-CBM3 fusion protein is well expressed
in E. coli BL21 strains with the expected protein weight of approximately 63.5 kDa (predicted using
ExPASYs Compute pI/Mw). Moreover, comparing the samples loaded in the Ni-column with the flow-
through and elution fractions obtained in both cases (lanes 4, 5 and 6 for AST, lanes 7, 8 and 9 for AST-
CBM3) it is clear that the target proteins are absent from the flow through (lanes 5 and 8) and present
essentially on the elution fractions (lanes 6 and 9). Purified AST protein presents a final concentration
of 9 µM, while AST-CBM3 has a final concentration of 42 µM.
Figure 22. A) Maps of the pET21a_AST-CBM3 constructed. The vector contains an ampicillin resistance
marker and the fusion incorporates a his-tag region to facilitate protein purification. B) Agarose gel
analysis of pET21a_AST-CBM3 cloning. 1) NZYDNA Ladder III; 2) pET21a_AST-CBM3; 3)
pET21a_AST-CBM3 previously digested with XhoI.
A B

47
4.6 Binding activity of AST-CBM3 fusion protein to cellulose
CBM3 from C. thermocellum is known for its high affinity to cellulose [96] and as described
previously, it may constitute an added value to immobilized biomolecules onto µPADs [56]. To
investigate whether the fusion of AST with CBM3 has any effect on the affinity to cellulose, the capacity
of the recombinant protein to bind to Whatman No. 1 filter paper was evaluated and compared with AST
and CBM3. Two circles of Whatman No.1 filter paper with 6 mm diameter (~0.009 g/circle) were placed
in the well of a filtration microplate equipped with hydrophilic membranes and impregnated with a Tris
plus glutamate buffer at pH 10, in order to equilibrate the paper. After buffer filtration, 100 µL of a solution
containing 3 µM of AST-CBM3 was added to the wells and incubated for 30 minutes. The same protocol
was performed with CBM3 and AST as controls. Subsequently, the amount of protein in the solution
before and after adsorption to paper was measured using the BCA method and the amount of enzyme
adsorbed per gram of paper was calculated by mass balance (Figure 24). The ability of AST-CBM3 to
bind cellulose is approximately 1.9-fold higher when compared with AST, but 29 % lower when
compared with CBM3. The binding capacity of the fusion-protein is not equal to CBM3 alone, most likely
due to the tertiary structure adopted by the fusion-protein. Cellulose-binding amino-acid residues of the
planar strip of CBM3 may not all be on the surface of the protein and available to establish interactions
with cellulose. Still, these results show that the CBM3 domain of the fusion protein is active and with a
high cellulose binding capacity.
Figure 23. Coomassie Blue stained SDS-PAGE gel of fractions collected during the purification of AST
and AST-CBM3. 1) Precision Plus Protein™ Dual Color Standard; 2) AST from NZYTech; 3) CBM3
previously purified in our lab; 4) Feed sample for AST purification; 5) Flow-through fraction of AST
purification; 6) Elution fraction of AST; 7) Feed sample for AST-CBM3 purification; 8) Flow-through
fraction of AST-CBM3 purification; 9) Elution fraction of AST-CBM3.

48
4.7 Activity of AST-CBM3 fusion protein on paper
The catalytic activity of AST-CBM3 was also assessed and compared with the activity of AST
using the µPAD with 6-mm spots developed to detect L-malic acid. To find out whether AST-CBM3 has
any effect on the bioassay, 2 % (v/v) of enzyme with 2.69 mg/mL was used on the mix (prepared as
described in section 3.11) to be added onto each spot. Both AST produced by NZYTech and AST
produced in the lab were introduced in the experiment with the same concentration to be used as
controls. Moreover, a reaction without AST was also performed. Table 4 presents the color developed
10 minutes after adding samples with 0, 50 and 150 mg/L of L-malic acid. On spots without AST, it is
possible to notice that for 150 mg/L of L-malic acid there is a poor color development. This confirms the
importance of AST in the colorimetric assay. On the other hand, when comparing AST in 3.2 M of
ammonium sulfate (provided by NZYTech) and AST in 300 mM of imidazole, there is a clear difference
between the colors developed just after 10 minutes of reaction. AST in imidazole produced a higher
color change for the two concentrations tested. However, it is important to highlight that when using AST
in ammonium sulfate, after 20 minutes of reaction, a purple color it also visible, as demonstrated in
section 4.3. In addition, the result obtained with AST-CBM3 is similar to the one obtained with AST in
imidazole, indicating that AST-CBM3 fusion-protein is active.
Figure 24. Capacity of AST-CBM3, AST and CBM3 proteins to bind to cellulose at pH 10. 3 µM of each
protein was added to the wells of a microfiltration plate containing 2 paper circles with 0.009 g each.
The concentration of proteins after and before incubation with paper was measured using a BCA kit (n
= 3) and the mass of protein adsorbed was calculated by mass balance. Errors were determined from
the standard deviation of triplicates.
0
1000
2000
3000
4000
5000
6000
7000
8000
CBM3 AST-CBM3 AST
Enzy
me
Ad
sorb
ed
(p
mo
l.g-1
pap
er)

49
Table 4. Comparison between the signals recorded in a µPAD after 10 minutes of reaction, when using
AST in ammonium sulfate, AST in imidazole or AST-CBM3 in imidazole. Standard solutions of L-malic
acid of 0, 50 and 150 mg/L were used.
Enzyme Signal recorded
0 mg/L 50 mg/L 150 mg/L
Without AST
AST in Ammonium sulfate
AST in Imidazole
AST-CBM3
Considering the previous results the average mean grey intensity of the spots was determined
after 40 minutes of reaction to assess if AST in both buffers and AST-CBM3 have any impact on the
final signal (Figure 25). Results show that the average mean grey intensity obtained in the absence of
AST is lower when compared with a situation where AST is present. This was expected, since AST
promotes L-malic acid consumption by MDH and consequently the signal recorded is higher. On the
other hand, µPADs prepared with AST in imidazole or in ammonium sulfate, and AST-CBM3 shows a
similar average mean grey intensity. However, when enzymes are in imidazole, the reaction is much
faster, so this buffer is preferable over ammonium sulfate.
Figure 25. Comparison of the average mean grey intensity of the signals recorded in µPADs prepared
without AST, with AST in ammonium sulfate, AST in imidazole and AST-CBM3. Each condition was
tested in triplicates and the error bars correspond to the standard deviation.
0
10
20
30
40
50
60
50 mg/L 150 mg/L
Ave
rage
me
an g
rey
inte
nsi
ty
Concentration of -Lmalic acid
s/ AST AST in ammonium sulfate AST in imidazole AST-CBM3

50
Once proven that AST-CBM3 maintains the ability to catalyze the conversion of oxaloacetate and
L-glutamate and thus enhance the L-malate consumption, the analytical performance of the fusion
protein on paper was evaluated by studying linearity, repeatability, sensitivity and detection limit of the
µPADs. Various concentration of L-malic acid (0, 5, 10, 20, 50, 100, 150, 200, 300 and 600 mg/L) were
added together with Tris plus glutamate and NAD+ to each spot, while the mix volume was held constant.
Then, all spots were digitalized after 40 minutes of air drying. The colors developed with the increasing
concentration of substrate and the correspondent calibration curve are represented in Figure 26A. The
bioassay behavior using the fusion protein is similar to the one obtained with AST in ammonium sulfate,
with an increase in concentration of L-malic acid resulting in an increased purple color. Still, it was
noticed that the colors developed are more intense. Once again, the mean grey intensity of each spot
was determined as described in section 3.5. A plot with the mean grey intensity determined as a function
of L-malic acid concentration in the samples assayed is shown in Figure 26A. The average mean grey
intensity increases with the increasing concentration of substrate reaching the same saturation point
than when using AST (~200 mg/L of L-malic acid). A difference in assay linearity was noticed, since in
this case the average mean grey intensity increases linearly with the concentration of L-malic acid,
instead of logarithmically (see Figure 26B). The assay was linear from 5 to 150 mg/L with a correlation
coefficient of 0.987. Moreover, the relative standard deviation calculated across all sample
concentrations was in the range of 2 – 5.5 mg/L (n = 5), which is slightly higher than the one observed
when using AST (0.9 – 3.5 mg/L). Thus, the method was found suitable for a quantitative analyze of
samples with concentrations within the range of 5 to 150 mg/L and its precision was retained.
The assay repeatability was studied by performing independent measurements under the same
conditions on four separate days, using solutions of L-malic acid with concentrations of 0, 50 and 150
mg/L. Mean grey intensity of each spot was determined using ImageJ® and repeatability was calculated
as standard deviation of the average of the average mean grey intensity across the four days. The
results obtained for 50 mg/L and 150 mg/L of L-malic acid were 23.5 ± 1.8 mg/L and 43.0 ± 8.7 mg/L,
respectively. Thus, for these concentrations the method maintains repeatability as good as when using
AST enzyme.
In addition, the L-malic acid limit of detection (LOD) calculated according to equation 6 was equal
to 9.2 mg/L. This value is slightly higher than the value reported before for AST (5.8 mg/L of L-malic
acid), but also to the value described for L-malic acid, UV method protocol from NZYTech (0.25 mg/L)
[103]. On the other hand, the LOQ calculated was 30.7 mg/L, which is higher than the value for AST.
Taken together, the previous results show that the use of AST-CBM3 instead of AST does not affect the
bioassay analytical performance, i.e. the AST domain in the fusion protein retains its intrinsic biological
activity.

51
Although µPADs allow a quantitative analysis, for the final user sometimes a semi-quantitative
analysis is enough for most purposes. This type of semi-quantification detection of L-malic acid is
possible by visual comparison of the color developed with a colored chart like the one represented in
Figure 27. This calibration chart was designed taking into account the concentrations whose color
development is sufficiently different to make an accurate interpretation of the results. Thus, a semi-
quantitative analysis is possible from 20 mg/L of L-malic acid. Semi-quantitative analysis has the
advantage that it does not require the use of specific instrumentation.
y = 0.2426x + 13.2R² = 0.9886
0
10
20
30
40
50
60
0 20 40 60 80 100 120 140 160
Ave
rage
me
an g
rey
inte
nsi
ty
L-malic acid concentration (mg/L)
Figure 26. Analytical performance of the bioassay developed to detect L-malic acid using AST-CBM3
and MDH enzymes immobilized onto a µPAD. A) Colors developed with increasing amounts of L-malic
acid in the 0 to 600 mg/L range and calibration curve obtained by plotting the average mean grey
intensity of each spot as a function of the corresponding concentration (n = 5). B) Assay linearity
between concentrations of 5 and 150 mg/L of l-malic acid with an equation of y = 0.2426 [L-malic acid]
+ 13.2. Errors were always determined from the standard deviation of n = 5 measurements.
B
0
10
20
30
40
50
60
0 100 200 300 400 500 600 700
Ave
rage
me
an g
rey
inte
nsi
ty
L-malic acid concentration (mg/L)
A
n = 5
0 mg/L 5 20 50 100 150 300 600
n = 5

52
CBM3 in fusion-proteins is known for conferring proteins a higher stability [98]. Thus, the shelf-
life of µPADs prepared with AST-CBM3 and AST in imidazole buffer stored at room temperature and 4
ºC was evaluated and compared. µPADs with 6-mm spots were pre-prepared with 5 µL of mix, dried at
ambient conditions and incubated at the test temperatures in the dark. Devices were tested with water
(control sample) and 150 mg/L (test sample) of L-malic acid supplemented with buffer and NAD+ over a
period of several days, by measuring the mean grey intensity of spots using ImageJ. Time course
stability was determined as described previously in section 4.3. Figure 28A shows the time course
stability when the device is stored at room temperature for 14 days. After 4 days of storage, both µPADs
with AST-CBM3 or AST displayed 50 % of the initial activity. The devices were active up to 14 days.
However, at this point the control spots started to develop a brown color after control sample addition.
Enzymes in imidazole are more stable at room temperature than AST in ammonium sulfate (compared
with Figure 20, section 4.3). Figure 28B presents the time course stability when the devices are stored
at 4ºC. Once again, no significant differences between AST and AST-CBM3 are visible. Devices were
active for 18 days, conserving ~60 % of the initial activity, which contrasts with the 26 % activity of AST
in ammonium sulfate (compared with Figure 20, section 4.3).
Figure 27. Calibration chart designed for the semi-quantitative detection of L-malic acid using µPADs
with AST-CBM3 fusion protein.
0 mg/L 20 – 50 mg/L > 150 mg/L

53
The effect of AST-CBM3 on a lateral flow µPAD was evaluated. In this case, while MDH is
physically adsorbed on paper, AST-CBM3 is immobilized with a defined orientation. µPADs were
prepared with 2 x 1 µL of NAD+ and 1.5 µL of mix volume (with 65 nM of each enzyme), and 28 µL of a
sample with 0 and 150 mg/L of L-malic acid were used to check the activity. The channels were
incubated into a petri dish and the reaction occurred at ambient conditions. Table 5 shows the signals
recorded for each concentration. As expected, a color change occurred. However, it is evident that AST-
CBM3 has no impact on the inhomogeneity of the color distribution typical in lateral flow tests which
used AST (see Table 3). Nevertheless it is important to highlight that this bioassay is based on two
enzymatic reactions and AST-CBM3 is not directly involved on the conversion of the analyte of interest,
and consequently on the colorimetric reaction. Thus, it is believed that the use of MDH fused with CBM3
will contribute to overcome this limitation and redistribute the color development across the whole
reaction zone.
-0.1
0.1
0.3
0.5
0.7
0.9
1.1
1.3
1.5
1.7
1 3 5 7 9 11 13 15
Tim
e co
urs
e st
ab
ilit
y, I
Time (days)
AST-CBM3 AST
Figure 28. Time course stability of µPAD containing AST or AST-CBM3. Each spot in a device (n = 3)
was prepared with 5 µL of mix, dried and incubated in the dark at room temperature (A) and 4 ºC (B).
Time course stability was determined taking into account the average mean grey intensity determine for
the analyte on the day x and day 1 as described by equation 6. Error bars were determined from the
standard deviations of 3 measurements for each condition.
A
B
0.0
0.2
0.4
0.6
0.8
1.0
1.2
1.4
1 3 5 7 9 11 13 15 17 19
Tim
e co
urs
e st
ab
ilit
y, I
Time (days)
AST-CBM3 AST

54
Table 5. Signal detected using a lateral-flow µPAD using AST-CBM3 for the detection of two standard
solutions of L-malic acid with concentrations of 0 and 150 mg/L.
L-malic acid concentration (mg/L) Signal
0
150
4.8 L-malic acid detection in wine
L-Malic acid is one of the major organic acids present in wines and directly affects wine’s quality,
including the organoleptic properties and also shelf-life [3]. Proof of concept experiments were
performed using a μPAD functionalized with MDH and AST-CBM3 for the colorimetric detection of L-
malic acid in commercial white and red wines. Since the µPADs rely on a colorimetric detection, a
sample pre-treatment was performed to remove colored compounds from red wine. Red wine color is
mainly due to polyphenols, namely non-flavonoids and flavonoids, which are 5 times more abundant
than in white wines [112]. One method to remove phenols from wine during winemaking process is the
use of activated carbon [113]. Upon addition of activated carbon to red wine number four diluted 40
times a centrifugation step was performed followed by filtration. To access whether activated carbon
removes the majority of colored compounds in wine, an UV-vis spectrum across the 200-700 nm
wavelength range was recorded for a sample with and without pre-treatment (Figure 29). For the sample
before pre-treatment it is possible to notice the presence of two characteristic peaks of polyphenols,
namely at 270 - 280 nm, specific for phenolic acids and flavonoids, and at 520 nm, specific for
anthocyanins [114]. Anthocyanins are responsible for the initial purple-red color of young red wines, but
during wine aging more stable pigments are responsible for wine color stabilization such as pigmented
polymers and pyranoanthocyanins, which result in a shift of 20 – 40 nm in an UV-vis spectrum. Both
arise from the interactions between anthocyanins and other phenolic compounds especially flavan-3-
ols including catechins and procyanidin. After removing color from red wine at pH 3.5 by pre-treatment
with activated carbon, a flat spectrum with no peaks is obtained, indicating that both polyphenols and
anthocyanins are extracted from the wine.
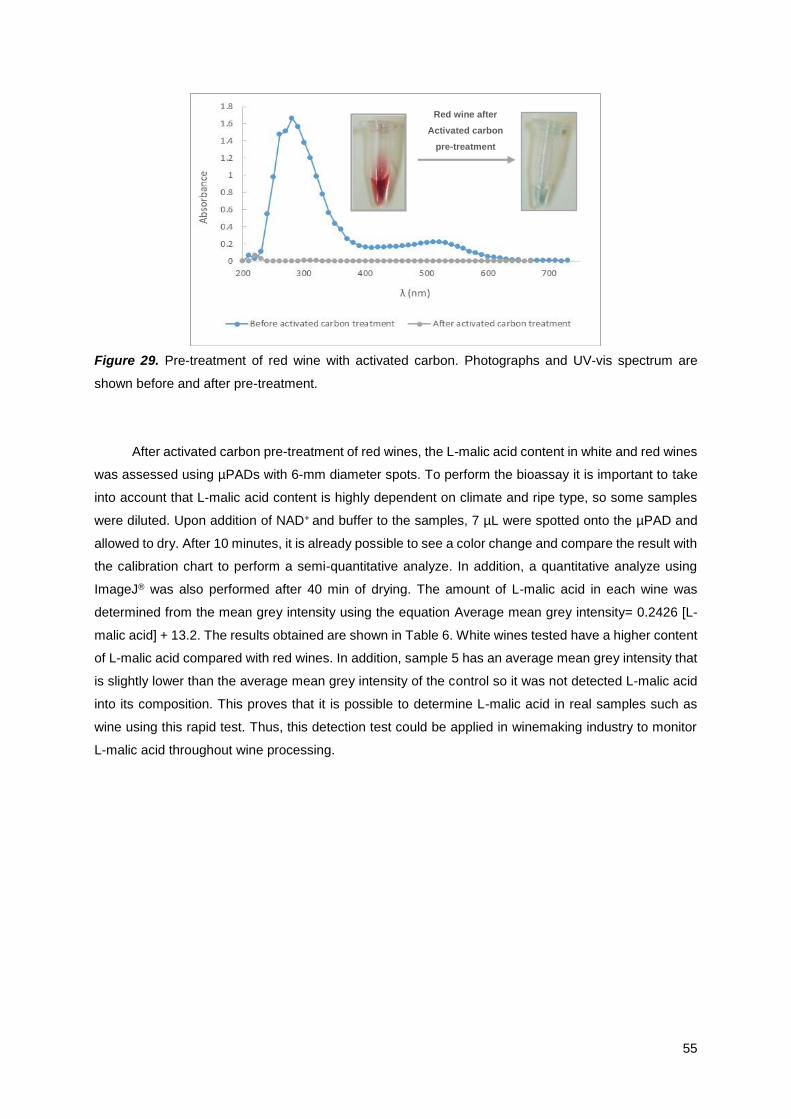
55
After activated carbon pre-treatment of red wines, the L-malic acid content in white and red wines
was assessed using µPADs with 6-mm diameter spots. To perform the bioassay it is important to take
into account that L-malic acid content is highly dependent on climate and ripe type, so some samples
were diluted. Upon addition of NAD+ and buffer to the samples, 7 µL were spotted onto the µPAD and
allowed to dry. After 10 minutes, it is already possible to see a color change and compare the result with
the calibration chart to perform a semi-quantitative analyze. In addition, a quantitative analyze using
ImageJ® was also performed after 40 min of drying. The amount of L-malic acid in each wine was
determined from the mean grey intensity using the equation Average mean grey intensity= 0.2426 [L-
malic acid] + 13.2. The results obtained are shown in Table 6. White wines tested have a higher content
of L-malic acid compared with red wines. In addition, sample 5 has an average mean grey intensity that
is slightly lower than the average mean grey intensity of the control so it was not detected L-malic acid
into its composition. This proves that it is possible to determine L-malic acid in real samples such as
wine using this rapid test. Thus, this detection test could be applied in winemaking industry to monitor
L-malic acid throughout wine processing.
Figure 29. Pre-treatment of red wine with activated carbon. Photographs and UV-vis spectrum are
shown before and after pre-treatment.
Red wine after
Activated carbon
pre-treatment

56
Table 6. Concentration of L-malic acid detected in commercial white and red wines using the µPAD
developed. A quantitative analyze was performed by measuring the mean grey intensity of three different
paper-based devices for the same sample (n = 3 spots ± standard deviation). The concentration shown
takes into account the dilution factor applied to each sample.
Sample Dilution
(vol:vol)
Semi-quantitative
analysis
µPAD signal ±
SD
µPAD [L-malic
acid] (mg/L ± SD)
Wh
ite w
ine
1 1:10
45.9 ± 2.4 1352.0 ± 100.1
2 1:10
43.3 ± 0.5 1244.5 ± 22.7
3 1:50 17.6 ± 1.4 2097.3 ± 292.8
Red
Win
e 4 1:1 18.8 ± 2.5 23.3 ± 10.3
5 1:1 - -
6 1:5
29.5 ± 0.2 336.8 ± 4.9
Currently in the market there is a variety of commercial kits to detect and quantify L-malic acid,
including NZYTech’s L-malic acid, UV detection kit [103], which was used to validate the amount of L-
malic acid detected in the selected wines using the µPADs. The method is based on the coupling of two
enzymes, L-malate dehydrogenase (L- MDH), which catalyzes the interconversion of malate plus NAD+
to oxaloacetate plus NADH, and aspartate aminotransferase (AST), which catalyzes the conversion
oxaloacetate plus L-glutamate to L-aspartate and 2-oxoglutarate. Then the amount of NADH consumed
is measured and is stoichiometrically related with the amount of L-malic acid present in a sample. The
method was adapted to 96-well microplates and a calibration curve for 3 minutes of reaction was
constructed in the range of 0 – 300 mg/L of L-malic acid. ΔAbsL-malic acid was calculated from the following
equation:
∆𝐴𝑏𝑠𝐿−𝑚𝑎𝑙𝑖𝑐 𝑎𝑐𝑖𝑑 = 𝐴𝑏𝑠𝑥𝑡 − 𝐴𝑏𝑠𝑥0𝑡
𝐴𝑏𝑠𝑥𝑡0− 𝐴𝑏𝑠𝑥0𝑡0
which relates the ratio of the absorption difference between sample and blank after 3 minutes of reaction
(Absxt and Absx0t, respectively) with the absorbance difference between sample and blank before the
reaction starts (Absxt0 and Absx0t0, respectively). The average of triplicate values were used to obtain the
values of ΔAbsL-malic acid for different malic acid concentrations and construct the calibration curve shown
in Figure 30.
(8)

57
Thus, the equation ΔAbsL-malic acid = 0.0008[L-malic acid concentration] +0.0088 with a correlation
coefficient of 0.9917 was used to confirmed the content of L-malic acid in the wines tested. In addition,
the effect of activated carbon in L-malic acid content was evaluated by performing the pretreatment
previously described and comparing the L-malic content with and without treatment. It was noticed that
the treatment with activated carbon does not affect the content of L-malic acid that is detected.
Consequently, the pre-treatment protocol implemented for red wines using activated carbon to remove
phenols is adequate.
Moreover the commercial kit was use to confirm the L-malic acid content in the previous wines
tested. The results obtained are present in Table 7. Comparing the concentrations of L-malic acid
determined using both methods, it is possible to notice a good correlation between the UV method and
the µPAD developed. This demonstrates that this µPAD is a suitable platform to determine L-malic acid
in wine.
Figure 30. Calibration curve obtained for 5 to 300 mg/L of L-malic acid after 3 minutes of reaction using
NZYTech, L-malic acid UV detection kit. Each point represents the average of three determinations and
the errors were obtained from the standard deviation.
y = 0.0008x + 0.0088R² = 0.9917
0.000
0.050
0.100
0.150
0.200
0.250
0.300
0 50 100 150 200 250 300 350
ΔA
bs
L-m
alic
aci
d
L-malic acid concentration (mg/L)

58
Table 7. Concentration of L-malic acid determined in white whites and red wines using µPAD and the
NZYTech L-malic acid, UV detection kit. The standard deviation (SD) corresponds to triplicates.
Sample µPAD [L-malic acid]
(mg/L ± SD)
UV [L-malic acid]
(mg/L ± SD) W
hit
e w
ine
1 1352.0 ± 100.1 1658.3 ± 64.7
2 1244.5 ± 22.7 1147.2 ± 146.5
3 2097.3 ± 292.8 3120.0 ± 62.5
Red
Win
e
4 23.3 ± 10.3 13.1 ± 7.1
5 0 0
6 336.8 ± 4.9 218.1 ± 41.1
The accuracy of µPAD using AST-CMB3 was also evaluated by spiking analysis. Therefore, know
amounts of L-malic acid were added to white wine number three and red wine number four. Since the
white wine has a higher content of L-malic acid, it was diluted 50 times and then spiked with the analyte.
To 50 mL of white and red wine solution, 1.3, 2.5 and 5.0 mg of L-malic acid were added in order to
spike the sample with a low, medium and high concentration. After that, red wine was pre-treated with
activated carbon. Finally, the concentration was determined by measuring the mean grey intensity using
ImageJ® and finally compared with the theoretical value expected. Table 8 shows the results obtained
both for a white and red wine. The results show that the concentration determined in the spiked samples
is higher than in the non-spiked samples, as expected. In addition, comparing the expected values with
the experimental data, a slight decrease in the L-malic acid content is observed. Thus, the recovery
percentage was calculated according to the equation suggested by IPAC (Instituto de acreditação) [115]:
% 𝑹 = [𝑪𝒐𝒏𝒄𝒆𝒏𝒕𝒓𝒂𝒕𝒊𝒐𝒏 𝒐𝒇 𝒔𝒑𝒊𝒌𝒆𝒅 𝒔𝒂𝒎𝒑𝒍𝒆]−[𝑪𝒐𝒏𝒄𝒆𝒏𝒕𝒓𝒂𝒕𝒊𝒐𝒏 𝒐𝒇 𝒏𝒐𝒏−𝒔𝒑𝒊𝒌𝒆𝒅 𝒔𝒂𝒎𝒑𝒍𝒆]
[𝑺𝒑𝒊𝒌𝒆𝒅 𝒄𝒐𝒏𝒄𝒆𝒏𝒕𝒓𝒂𝒕𝒊𝒐𝒏]𝒙 𝟏𝟎𝟎% (9)
Both wines show a high recovery percentage in the detection of spiking samples using a µPAD.
Regarding the low recovery percentage for a spiking of 25 mg/L of the red wine, it could result due to
errors in the weighting process once the amount added is too small. Still, the µPAD shows a great
accuracy, indicating that this device have a great potential for the quantitative determination in
winemaking process. Moreover this also indicates that this method is not susceptible to interferences
present in wine.

59
Table 8. Analytical performance of the µPAD when white and red wine are spiked with known
concentrations of L-malic acid. Each concentration was evaluated in triplicates and the respective
standard deviation is present.
Spiked
(mg/L)
White wine Red wine
Know
concentration
Found
concentration % R
Know
concentration
Found
concentration % R
No
spike 18.3 - 21.4 -
25 44.3 36.8 ± 13.8 74.1 % 47.4 27.5 ± 1.6 24.3 %
50 68.3 61.0 ± 1.7 85.4 % 71.4 85.4 ± 4.1 127.9 %
100 118.3 77.1 ± 5.3 58.8 % 121.4 106.3 ± 3.5 84.8 %

60
Chapter 5. Conclusions and Future work
Throughout the years µPADs emerged has a promising platform for the development of expedite
and inexpensive analytical solutions in developing and developed nations. This work represents the first
steps towards the development of an innovating µPAD to detect L-malic acid in wines.
An enzymatic assay based on two enzymes and a non-enzymatic reaction was optimized and
adapted to a µPAD designed with 6 mm circular reaction chambers confined by hydrophobic waxes,
which produces a purple final product when in the presence of L-malic acid. The bioassay was
demonstrated to be viable when malate dehydrogenase and aspartate aminotransferase are physically
immobilized together with chromogenic reagents. Moreover, the pre-addition of trehalose, polyvinyl
alcohol and triton X-100 to paper, enhanced the signal obtained. Upon sample addition supplemented
with NAD+ and Tris plus glutamate, the color produced was demonstrated to be proportional to the
amount of L-malic acid used. This indicates that the protocol established is suitable for the detection of
the analyte of interest.
The µPAD developed combines a good analytical performance between 5 -150 mg/L of L-malic
acid with reliability and sensitivity. Although the device has a low limit of detection, the storage stability
is relatively low. The colorimetric system was successfully adapted to a lateral-flow µPAD that allows
the deposition of NAD+ onto paper with the remaining reagents required for the assay. Even though the
reaction occurred, a color inhomogeneity was observed most likely due to the weak enzyme
immobilization strategy adopt.
To enhance the affinity of both enzymes involved in the assay to cellulose, the possibility to fuse
them with a CBM3 from C. thermocellum, a protein domain known for its high affinity towards cellulose,
was evaluated. While AST-CBM3 was successfully cloned, problems with the MDH-CBM3 fusion were
recurrent, indicating that the cloning strategy needs to be redesigned.
This was the first time that an AST-CBM3 fused protein was cloned and expressed. This protein
has a molecular weight of 63.5 kDa and the affinity to Whatman No. 1 filter paper was evaluated and
compared with AST and CBM3. It was demonstrated that AST-CBM3 has an affinity towards paper 2
times higher than AST and approximately 1.5 times lower than CBM3. This means that the CBM3
domain in the fusion protein remained active and conserved part of its biological activity. Moreover it
was demonstrated that the analytical performance of the µPAD when using AST-CBM3 fusion protein
was not affected. Additionally, it was observed that when AST and AST-CBM3 are in imidazole buffer
at pH 7.5, the reaction is much faster, allowing a visual read-out just after 10 minutes of sample addition,
and the time course stability increases. However, when AST-CBM3 was used on a lateral-flow µPAD
no significant differences were achieved. So far, AST-CBM3 seems to have no positive or either
negative impact on the µPAD developed, but it is important to highlight that this enzyme is not directly
involved on the conversion of L-malic acid. Thus, it is believed that only when using both enzymes fused

61
with CBM3, it will be possible to conclude about the real impact of carbohydrate binding module fusions
on the assay.
Even so, this work represents a significant achievement for the field of wine quality industry. To
allow a semi-quantitative analysis without external equipment, a calibration chart was designed which
correlates a given concentration of L-malic acid with a specific color (light yellow, light red and deep
purple). Still, if a quantitative analysis is required, a scanner and an image analysis software can be
used to convert the colored signal into an L-malic acid titer. Therefore, this device serves as a cost-
effective, rapid and simple detection method that could be utilized by non-trained personnel.
As a proof of concept, the µPAD with AST-CBM3 fusion protein was used to detect L-malic acid
in a range of white and red wines. The amount detected was found to be similar to the values obtain
using a commercial UV detection method. In addition, wine samples were spiked with known amount of
L-malic acid, to evaluate if there was any compound present in wine that interferes with the detection.
The values detected were similar to the expected and the recovery percentages were high. This not only
indicates that the method is accurate, but also that there are no interfering compounds in the wines
tested.
This thesis presents a novel application of paper-based analytical devices with great potential for
the winemaking industry. Therefore, to accomplish the ultimate goal of this work, a MDH-CBM3 fusion
protein should be successfully cloned and expressed. Then, the effect of both fusion proteins with CBM3
on the µPAD analytical performance, shelf-life and color uniformity should be evaluated. Ultimately, it
would be interesting to develop a 3D-µPAD that could incorporate the pre-treatment of red wines with
activated carbon to minimize the number of steps performed by the end-user.

62
Chapter 6. References
[1] J. H. Swiegers, E. J. Bartowsky, P. A. Henschke, and I. S. Pretorius, “Yeast and bacterial modulation of wine aroma and flavour,” Aust. J. Grape Wine Res., vol. 11, pp. 139–173, 2005.
[2] J. Su, T. Wang, Y. Wang, Y.-Y. Li, and H. Li, “The use of lactic acid-producing, malic acid-producing, or malic acid-degrading yeast strains for acidity adjustment in the wine industry.,” Appl. Microbiol. Biotechnol., vol. 98, no. 6, pp. 2395–413, 2014.
[3] H. Volschenk and H. J. J. Van Vuuren, “Malic Acid in Wine : Origin , Function and Metabolism during Vinification,” South African J. Enol. Vitic., vol. 27, no. 2, pp. 123–136, 2006.
[4] C. Sweetman, L. G. Deluc, G. R. Cramer, C. M. Ford, and K. L. Soole, “Regulation of malate metabolism in grape berry and other developing fruits.,” Phytochemistry, vol. 70, no. 11–12, pp. 1329–44, 2009.
[5] C. Conde, P. Silva, N. Fontes, A. C. P. Dias, R. M. Tavares, M. J. Sousa, A. Agasse, S. Delrot, and H. Gerós, “Biochemical Changes throughout Grape Berry Development and Fruit and Wine Quality,” Food, vol. 1, pp. 1–22, 2007.
[6] I. E. Responses, A. N. Lakso, and W. M. Kliewer, “The Influence of Temperature in Grape Berries Malic Acid Metabolism”, Plant Physiol., vol. 56, pp. 370–372, 1975.
[7] M. Toit and I. S. Pretorius, “Microbial Spoilage and Preservation of Wine : Using Weapons from Nature ’s Own Arsenal- A Review,” South African J. Enol. Vitic., vol. 21, pp. 74–96, 2000.
[8] S. Liu, “Malolactic fermentation in wine – beyond deacidification,” J. Appl. Microbiol., vol. 92, pp. 589–601, 2002.
[9] A. Costantini, E. Garc, and M. V. Moreno-arribas, “Biochemical Transformations Produced by Malolactic Fermentation,” Wine Chem. Biochem., vol. 1, pp. 27–58, 2009.
[10] A. Matthews, A. Grimaldi, M. Walker, E. Bartowsky, P. Grbin, and V. Jiranek, “Lactic Acid Bacteria as a Potential Source of Enzymes for Use in Vinification,” Appl. Environ. Microbiol., vol. 70, pp. 5715–5731, 2004.
[11] J. A. N. C. Nielsen, C. H. A. S, and D.- Hørsholm, “Control of Flavor Development in Wine during and after Malolactic Fermentation by Oenococcus oeni,” Appl. Environ. Microbiol., vol. 65, pp. 740–745, 1999.
[12] E. J. Bartowsky and P. a Henschke, “The ‘buttery’ attribute of wine-diacetyl-desirability, spoilage and beyond,” Int. J. Food Microbiol., vol. 96, pp. 235–52, 2004.
[13] S. Sua and F. Huidobro, “A review of the analytical methods to determine organic acids in grape juices and wines,” Food Res. Int., vol. 38, pp. 1175–1188, 2005.
[14] U. Regmi, M. Palma, and C. G. Barroso, “Direct determination of organic acids in wine and wine-derived products by Fourier transform infrared (FT-IR) spectroscopy and chemometric techniques.,” Anal. Chim. Acta, vol. 732, pp. 137–44, 2012.
63
[15] Z. Kerem, B. Bravdo, O. Shoseyov, and Y. Tugendhaft, “Rapid liquid chromatography–ultraviolet determination of organic acids and phenolic compounds in red wine and must,” J. Chromatogr. A, vol. 1052, no. 1–2, pp. 211–215, 2004.
[16] V. I. Esteves, S. S. F. Lima, D. L. D. Lima, and A. C. Duarte, “Using capillary electrophoresis for the determination of organic acids in Port wine,” Anal. Chim. Acta, vol. 513, no. 1, pp. 163–167, 2004.
[17] “Compendium of international methods of analysis - OIV: L-Malic acid [Reference: OIV-MA-AS313-11] [Online] [Cited: 13th August, 2014]. http://www.oiv.int/oiv/info/enmethodesinternationalesvin.”
[18] A. H. Free, E. C. Adams, M. Lou Kercher, M. Helen, and M. H. Cook, “Simple Specific Test for Urine Glucose,” Clin. Chem., vol. 3, pp. 163–168, 1956.
[19] G. a Posthuma-Trumpie, J. Korf, and A. van Amerongen, “Lateral flow (immuno)assay: its strengths, weaknesses, opportunities and threats. A literature survey.,” Anal. Bioanal. Chem., vol. 393, no. 2, pp. 569–82, 2009.
[20] A. W. Martinez, S. T. Phillips, M. J. Butte, and G. M. Whitesides, “Patterned paper as a platform for inexpensive, low-volume, portable bioassays.,” Angew. Chem. Int. Ed. Engl., vol. 46, no. 8, pp. 1318–1320, 2007.
[21] P. Tabeling, Introduction to microfluidics, 1st Edition, United States: Oxford University Press, 2005.
[22] Y. F. Soon-Eng Ong, Sam Zhang, Hejun Du, “Fundamental principles and applications of microfluidic systems,” Front. Biosci., vol. 13, pp. 2757–2773, 2008.
[23] D. Mark, S. Haeberle, G. Roth, F. von Stetten, and R. Zengerle, “Microfluidic lab-on-a-chip platforms: requirements, characteristics and applications.,” Chem. Soc. Rev., vol. 39, no. 3, pp. 1153–82, 2010.
[24] H. a. Stone and S. Kim, “Microfluidics: Basic issues, applications, and challenges,” AIChE J., vol. 47, no. 6, pp. 1250–1254, 2001.
[25] E. W. Nery and L. T. Kubota, “Sensing approaches on paper-based devices: a review,” Anal. Bioanal. Chem., vol. 405, no. 24, pp. 7573–95, 2013.
[26] J. M. Chem, J. Credou, and T. Berthelot, “Cellulose : from biocompatible to bioactive material,” J. Mater. Chem., vol. 2, pp. 4767–4788, 2014.
[27] A. W. Martinez, S. T. Phillips, G. M. Whitesides, and E. Carrilho, “Diagnostics for the developing world: microfluidic paper-based analytical devices.,” Anal. Chem., vol. 82, no. 1, pp. 3–10, 2010.
[28] S. Wang, L. Ge, X. Song, M. Yan, S. Ge, J. Yu, and F. Zeng, “Simple and covalent fabrication of a paper device and its application in sensitive chemiluminescence immunoassay.,” Analyst, vol. 137, no. 16, pp. 3821–7, 2012.
64
[29] X. Y. Liu, C. M. Cheng, A. W. Martinez, K. A. Mirica, X. J. Li, S. T. Phillips, M. Mascareñas, and G. M. Whitesides, “A portable microfluidic paper-based device for ELISA,” Micro Electro Mech. Syst. (MEMS), 2011 IEEE 24th Int. Conf. on. IEEE, pp. 75–78, 2011.
[30] N. R. Pollock, J. P. Rolland, S. Kumar, P. D. Beattie, S. Jain, F. Noubary, V. L. Wong, R. a Pohlmann, U. S. Ryan, and G. M. Whitesides, “A paper-based multiplexed transaminase test for low-cost, point-of-care liver function testing.,” Sci. Transl. Med., vol. 4, pp. 1–10, 2012.
[31] S. a Bhakta, R. Borba, M. Taba, C. D. Garcia, and E. Carrilho, “Determination of nitrite in saliva using microfluidic paper-based analytical devices.,” Anal. Chim. Acta, vol. 809, pp. 117–22, 2014.
[32] X. Yang, O. Forouzan, T. P. Brown, and S. S. Shevkoplyas, “Integrated separation of blood plasma from whole blood for microfluidic paper-based analytical devices.,” Lab Chip, vol. 12, no. 2, pp. 274–80, 2012.
[33] M. M. Mentele, J. Cunningham, K. Koehler, J. Volckens, and C. S. Henry, “Microfluidic Paper-Based Analytical Device for Particulate Metals,” Anal. Chem., vol. 84, pp. 4474–4480, 2012.
[34] Y. Sameenoi, P. Panymeesamer, N. Supalakorn, K. Koehler, O. Chailapakul, C. S. Henry, and J. Volckens, “Microfluidic Paper-Based Analytical Device for Aerosol Oxidative Activity,” Environ. Sci. Technol., vol. 47, pp. 932–940, 2013.
[35] J. C. Jokerst, J. a Adkins, B. Bisha, M. M. Mentele, L. D. Goodridge, and C. S. Henry, “Development of a paper-based analytical device for colorimetric detection of select foodborne pathogens.,” Anal. Chem., vol. 84, no. 6, pp. 2900–7, 2012.
[36] L. Cai, Y. Wu, C. Xu, and Z. Chen, “A Simple Paper-Based Microfluidic Device for the Determination of the Total Amino Acid Content in a Tea Leaf Extract,” J. Chem. Educ., vol. 90, pp. 232–234, 2013.
[37] K. Mazeau, “Conformations, Structures, and Morphologies of Celluloses” in Polysaccharides: Structural Diversity and Functional Versatility, 2nd Edition, Severian Dumitriu, pp. 41–69, 2005.
[38] R. Pelton, “Bioactive paper provides a low-cost platform for diagnostics,” Trends Anal. Chem., vol. 28, no. 8, pp. 925–942, 2009.
[39] R. J. Moon, A. Martini, J. Nairn, J. Simonsen, and J. Youngblood, “Cellulose nanomaterials review: structure, properties and nanocomposites.,” Chem. Soc. Rev., vol. 40, no. 7, pp. 3941–3994, 2011.
[40] D. Klemm, B. Heublein, H.-P. Fink, and A. Bohn, “Cellulose: fascinating biopolymer and sustainable raw material.,” Angew. Chem. Int. Ed. Engl., vol. 44, no. 22, pp. 3358–93, 2005.
[41] E. Carrilho, A. W. Martinez, and G. M. Whitesides, “Understanding Wax Printing : A Simple Micropatterning Process for Paper-Based Microfluidics,” Anal. Chem., vol. 81, no. 16, pp. 7091–7095, 2009.
[42] E. Evans, E. F. M. Gabriel, W. K. T. Coltro, and C. D. Garcia, “Rational selection of substrates to improve color intensity and uniformity on microfluidic paper-based analytical devices.,” Analyst, vol. 139, no. 9, pp. 2127–32, 2014.

65
[43] J. Hong, X. Ye, and Y.-H. P. Zhang, “Quantitative determination of cellulose accessibility to cellulase based on adsorption of a nonhydrolytic fusion protein containing CBM and GFP with its applications.,” Langmuir, vol. 23, no. 25, pp. 12535–40, 2007.
[44] E. Niday, P. Box, and C.- Basei, “A Dot-lmmunobinding Assay for Monoclonal and Other Antibodies,” Anal. Biochem., vol. 119, pp. 142–147, 1982.
[45] A. K. Yetisen, M. S. Akram, and C. R. Lowe, “Paper-based microfluidic point-of-care diagnostic devices.,” Lab Chip, vol. 13, no. 12, pp. 2210–51, 2013.
[46] K. M. Schilling, A. L. Lepore, J. a Kurian, and A. W. Martinez, “Fully enclosed microfluidic paper-based analytical devices.,” Anal. Chem., vol. 84, no. 3, pp. 1579–85, 2012.
[47] D. A. Bruzewicz, M. Reches, and G. M. Whitesides, “Low-Cost Printing of Poly ( dimethylsiloxane ) Barriers To Define Microchannels in Paper,” vol. 80, no. 9, pp. 4718–4723, 2008.
[48] K. Abe, K. Suzuki, and D. Citterio, “Inkjet-Printed Microfluidic Multianalyte Chemical Sensing Paper,” Anal. Chem., vol. 80, no. 18, pp. 6928–6934, 2008.
[49] X. Li, J. Tian, T. Nguyen, and W. Shen, “Paper-Based Microfluidic Devices by Plasma,” Anal. Chem., vol. 80, pp. 9131–9134, 2008.
[50] E. M. Fenton, M. R. Mascarenas, G. P. López, and S. S. Sibbett, “Multiplex lateral-flow test strips fabricated by two-dimensional shaping.,” ACS Appl. Mater. Interfaces, vol. 1, no. 1, pp. 124–9, 2009.
[51] X. Li, D. R. Ballerini, and W. Shen, “A perspective on paper-based microfluidics: Current status and future trends.,” Biomicrofluidics, vol. 6, no. 1, pp. 11301–1130113, 2012.
[52] D. D. Liana, B. Raguse, J. J. Gooding, and E. Chow, “Recent advances in paper-based sensors.,” Sensors, vol. 12, no. 9, pp. 11505–26, 2012.
[53] Y. Lu, W. Shi, L. Jiang, J. Qin, and B. Lin, “Rapid prototyping of paper-based microfluidics with wax for low-cost, portable bioassay.,” Electrophoresis, vol. 30, no. 9, pp. 1497–500, 2009.
[54] E. W. Washburn, “The dynamic of capillary flow,” Phys. Rev., vol. 17, pp. 280–283, 1921.
[55] T. Vo-Dinh and B. Cullum, “Biosensors and biochips: advances in biological and medical diagnostics.,” Fresenius. J. Anal. Chem., vol. 366, no. 6–7, pp. 540–51, 2008.
[56] A. M. M. Rosa, a F. Louro, S. a M. Martins, J. Inácio, A. M. Azevedo, and D. M. F. Prazeres, “Capture and detection of DNA hybrids on paper via the anchoring of antibodies with fusions of carbohydrate binding modules and ZZ-domains.,” Anal. Chem., vol. 86, no. 9, pp. 4340–7, 2014.
[57] S. Su, R. Nutiu, C. D. M. Filipe, Y. Li, R. Pelton, V. Uni, M. S. West, O. Ls, and R. V April, “Adsorption and Covalent Coupling of ATP-Binding DNA Aptamers onto Cellulose,” Langmuir, Am. Chem. Soc., no. 1, pp. 1300–1302, 2007.
[58] F. Kong and Y. F. Hu, “Biomolecule immobilization techniques for bioactive paper fabrication.,” Anal. Bioanal. Chem., vol. 403, no. 1, pp. 7–13, 2012.

66
[59] K. L. Jones and C. R. O. Melia, “Protein and humic acid adsorption onto hydrophilic membrane surfaces : effects of pH and ionic strength,” J. Memb. Sci., vol. 165, pp. 31–46, 2000.
[60] E. Halder, D. K. Chattoraj, and K. P. Das, “Adsorption of biopolymers at hydrophilic cellulose-water interface.,” Biopolymers, vol. 77, no. 5, pp. 286–95, 2005.
[61] M. S. Khan, X. Li, W. Shen, and G. Garnier, “Thermal stability of bioactive enzymatic papers.,” Colloids Surf. B. Biointerfaces, vol. 75, no. 1, pp. 239–46, 2010.
[62] P. D. T. Garcia, T. M. G. Cardoso, C. D. Garcia, E. Carrilho, and W. K. T. Coltro, “A handheld stamping process to fabricate microfluidic paper-based analytical devices with chemically modified surface for clinical assays,” RSC Adv., 2014.
[63] C. M. G. A. Fontes and H. J. Gilbert, “Cellulosomes : Highly Efficient Nanomachines Designed to Deconstruct Plant Cell Wall Complex Carbohydrates,” Annu. Rev. Biochem., vol. 79, pp. 655–681, 2010.
[64] W. Lewis, E. Keshavarz-moore, J. Windust, D. Bushell, and N. Parry, “Construction and Evaluation of Novel Fusion Proteins for Targeted Delivery of Micro Particles to Cellulose Surfaces,” Wiley Intersci., vol. 94, pp. 625–632, 2006.
[65] G. Hussack, Y. Luo, L. Veldhuis, J. C. Hall, J. Tanha, and R. Mackenzie, “Multivalent Anchoring and Oriented Display of Single-Domain Antibodies on Cellulose,” Sensors, vol. 9, pp. 5351–5367, 2009.
[66] M. Tolba, O. Minikh, L. Y. Brovko, S. Evoy, and M. W. Griffiths, “Oriented immobilization of bacteriophages for biosensor applications.,” Appl. Environ. Microbiol., vol. 76, no. 2, pp. 528–35, 2010.
[67] W. Dungchai, O. Chailapakul, and C. S. Henry, “Electrochemical detection for paper-based microfluidics.,” Anal. Chem., vol. 81, no. 14, pp. 5821–6, 2009.
[68] Z. Nie, F. Deiss, X. Liu, O. Akbulut, and G. M. Whitesides, “Integration of paper-based microfluidic devices with commercial electrochemical readers.,” Lab Chip, vol. 10, no. 22, pp. 3163–9, 2010.
[69] W. K. Tomazelli Coltro, C.-M. Cheng, E. Carrilho, and D. P. de Jesus, “Recent advances in low-cost microfluidic platforms for diagnostic applications.,” Electrophoresis, pp. 1–16, 2014.
[70] S. Wang, L. Ge, X. Song, J. Yu, S. Ge, J. Huang, and F. Zeng, “Paper-based chemiluminescence ELISA: lab-on-paper based on chitosan modified paper device and wax-screen-printing.,” Biosens. Bioelectron., vol. 31, no. 1, pp. 212–8, 2012.
[71] M. M. Ali, S. D. Aguirre, Y. Xu, C. D. M. Filipe, R. Pelton, and Y. Li, “Detection of DNA using bioactive paper strips.,” Chem. Commun., vol. 43, pp. 6640–6642, 2009.
[72] B. Lutz, T. Liang, E. Fu, S. Ramachandran, P. Kauffman, and P. Yager, “Dissolvable fluidic time delays for programming multi-step assays in instrument-free paper diagnostics.,” Lab Chip, vol. 13, no. 14, pp. 2840–7, 2013.

67
[73] A. W. Martinez, S. T. Phillips, and G. M. Whitesides, “Three-dimensional microfluidic devices fabricated in layered paper and tape.,” Proc. Natl. Acad. Sci. U. S. A., vol. 105, no. 50, pp. 19606–11, 2008.
[74] W. Zhao, M. M. Ali, S. D. Aguirre, M. A. Brook, and Y. Li, “Paper-Based Bioassays Using Gold Nanoparticle Colorimetric Probes,” Anal. Chem., vol. 80, no. 22, pp. 8431–8437, 2008.
[75] A. W. Martinez, S. T. Phillips, E. Carrilho, S. W. Thomas, H. Sindi, and G. M. Whitesides, “Simple telemedicine for developing regions: camera phones and paper-based microfluidic devices for real-time, off-site diagnosis.,” Anal. Chem., vol. 80, no. 10, pp. 3699–707, 2008.
[76] A. K. Ellerbee, S. T. Phillips, A. C. Siegel, K. a Mirica, A. W. Martinez, P. Striehl, N. Jain, M. Prentiss, and G. M. Whitesides, “Quantifying colorimetric assays in paper-based microfluidic devices by measuring the transmission of light through paper.,” Anal. Chem., vol. 81, no. 20, pp. 8447–52, 2009.
[77] E. a Bayer, R. Lamed, B. a White, and H. J. Flint, “From cellulosomes to cellulosomics.,” Chem. Rec., vol. 8, no. 6, pp. 364–77, 2008.
[78] A. B. Boraston, D. N. Bolam, H. J. Gilbert, and G. J. Davies, “Carbohydrate-binding modules : fine-tuning polysaccharide recognition,” Biochem. J., vol. 382, pp. 769–781, 2004.
[79] J. E. Hyeon, S. D. Jeon, and S. O. Han, “Cellulosome-based, Clostridium-derived multi-functional enzyme complexes for advanced biotechnology tool development: advances and applications.,” Biotechnol. Adv., vol. 31, no. 6, pp. 936–44, 2013.
[80] “CAZY: Carbohydrate-active Enzime. [Online] [Cited 22nd July, 2014] http://www.cazypedia.org/index.php/Carbohydrate-binding_modules#Types.”
[81] A. B. Boraston, E. Ficko-blean, and M. Healey, “Carbohydrate Recognition by a Large Sialidase Toxin from,” Biochemistry, vol. 46, pp. 11352–11360, 2007.
[82] B. W. Mclean, A. B. Boraston, D. Brouwer, N. Sanaie, C. A. Fyfe, R. A. J. Warren, D. G. Kilburn, and C. A. Haynes, “Carbohydrate-binding Modules Recognize Fine Substructures of Cellulose,” J. Biol. Chem., vol. 277, no. 52, pp. 50245–50254, 2002.
[83] R. Nigmatullin, R. Lovitt, C. Wright, M. Linder, T. Nakari-Setälä, and M. Gama, “Atomic force microscopy study of cellulose surface interaction controlled by cellulose binding domains.,” Colloids Surf. B. Biointerfaces, vol. 35, no. 2, pp. 125–35, 2004.
[84] O. Shoseyov, Z. Shani, and I. Levy, “Carbohydrate Binding Modules : Biochemical Properties and Novel Applications,” Microbiol. Mol. Biol. Rev., vol. 70, no. 2, pp. 283–295, 2006.
[85] “CAZY: Carbohydrate-active Enzime - Types of CBMs. [Online] [Cited 25th August, 2014] http://www.cazypedia.org/index.php/Carbohydrate-binding_modules#Types.”
[86] M. Linder, T. Nevanen, L. So, O. Bengs, and T. T. Teeri, “Improved Immobilization of Fusion Proteins via Cellulose-Binding Domains,” Biotechnol. Bioeng., vol. 60, no. 5, pp. 642–647, 1998.

68
[87] A. Fishman, I. Levy, U. Cogan, and O. Shoseyov, “Stabilization of horseradish peroxidase in aqueous-organic media by immobilization onto cellulose using a cellulose-binding-domain,” J. Mol. Catal. B Enzym., vol. 18, pp. 121–131, 2002.
[88] A. a Wang, A. Mulchandani, and W. Chen, “Specific adhesion to cellulose and hydrolysis of organophosphate nerve agents by a genetically engineered Escherichia coli strain with a surface-expressed cellulose-binding domain and organophosphorus hydrolase.,” Appl. Environ. Microbiol., vol. 68, no. 4, pp. 1684–9, 2002.
[89] O. Yaniv, G. Fichman, I. Borovok, Y. Shoham, E. a Bayer, R. Lamed, L. J. W. Shimon, and F. Frolow, “Fine-structural variance of family 3 carbohydrate-binding modules as extracellular biomass-sensing components of Clostridium thermocellum anti-σI factors.,” Acta Crystallogr. D. Biol. Crystallogr., vol. 70, no. Pt 2, pp. 522–34, 2014.
[90] W. H. Schwarz, “The cellulosome and cellulose degradation by anaerobic bacteria,” Appl. Microbiol. Biotechnol., vol. 56, no. 5–6, pp. 634–649, 2001.
[91] S. Biology, O. Yaniv, E. Morag, E. A. Bayer, and R. Lamed, “Structure of a family 3a carbohydrate-binding module from the cellulosomal scaffoldin CipA of Clostridium thermocellum with flanking linkers : implications for cellulosome structure,” Struct. Biol. Cryst. Commun., vol. 69, pp. 733–737, 2013.
[92] B. A. Pinheiro, J. L. A. Brás, S. Najmudin, A. L. Carvalho, L. M. A. Ferreira, J. a. M. Prates, and C. M. G. A. Fontes, “Flexibility and specificity of the cohesin–dockerin interaction: implications for cellulosome assembly and functionality,” Biocatal. Biotransformation, vol. 30, no. 3, pp. 309–315, 2012.
[93] G. Carrard, a Koivula, H. Söderlund, and P. Béguin, “Cellulose-binding domains promote hydrolysis of different sites on crystalline cellulose.,” Proc. Natl. Acad. Sci. U. S. A., vol. 97, no. 19, pp. 10342–7, 2000.
[94] A. W. Blake, L. Mccartney, E. Flint, D. N. Bolam, B. Alisdair, H. J. Gilbert, J. P. Knox, J. E. Flint, and A. B. Boraston, “Understanding the Biological Rationale for the Diversity of Cellulose-directed Carbohydrate-binding Modules in Prokaryotic Enzymes,” J. Biol. Chem., vol. 281, no. 39, pp. 29321–29329, 2006.
[95] P. Tomme, a Boraston, B. McLean, J. Kormos, a L. Creagh, K. Sturch, N. R. Gilkes, C. a Haynes, R. a Warren, and D. G. Kilburn, “Characterization and affinity applications of cellulose-binding domains.,” J. Chromatogr. B. Biomed. Sci. Appl., vol. 715, no. 1, pp. 283–96, 1998.
[96] J. Tormo, R. Lamed, a J. Chirino, E. Morag, E. a Bayer, Y. Shoham, and T. a Steitz, “Crystal structure of a bacterial family-III cellulose-binding domain: a general mechanism for attachment to cellulose.,” EMBO J., vol. 15, no. 21, pp. 5739–51, 1996.
[97] J. Lehtiö, J. Sugiyama, M. Gustavsson, L. Fransson, M. Linder, and T. T. Teeri, “The binding specificity and affinity determinants of family 1 and family 3 cellulose binding modules.,” Proc. Natl. Acad. Sci. U. S. A., vol. 100, no. 2, pp. 484–9, 2003.
[98] K. Ofir, Y. Berdichevsky, I. Benhar, R. Azriel-rosenfeld, R. Lamed, Y. Barak, E. A. Bayer, and E. Morag, “Versatile protein microarray based on carbohydrate-binding modules,” Proteomics, vol. 5, pp. 1806–1814, 2005.

69
[99] C. I. P. D. Guerreiro, C. M. G. a Fontes, M. Gama, and L. Domingues, “Escherichia coli expression and purification of four antimicrobial peptides fused to a family 3 carbohydrate-binding module (CBM) from Clostridium thermocellum.,” Protein Expr. Purif., vol. 59, no. 1, pp. 161–8, 2008.
[100] P. Minárik, N. Tomášková, M. Kollárová, and M. Antalík, “Malate Dehydrogenases – Structure and Function,” Gen. Physiol. Biophys., vol. 21, pp. 257–265, 2002.
[101] X.-J. Huang, Y.-K. Choi, H.-S. Im, O. Yarimaga, E. Yoon, and H.-S. Kim, “Aspartate Aminotransferase (AST/GOT) and Alanine Aminotransferase (ALT/GPT) Detection Techniques,” Sensors, vol. 6, no. 7, pp. 756–782, 2006.
[102] A. W. Martinez, S. T. Phillips, Z. Nie, C.-M. Cheng, E. Carrilho, B. J. Wiley, and G. M. Whitesides, “Programmable diagnostic devices made from paper and tape.,” Lab Chip, vol. 10, no. 19, pp. 2499–504, 2010.
[103] “NZYTech, Lda: L-malic acid, UV method catalogue number: AK00011 [Online] [Cited: September 22nd, 2013] https://www.nzytech.com/site/vmchk/Analytical-Test-Kits/L-Malic-acid-UV-method.”
[104] M. F. S. Peres, C. Laluce, and E. A. L. Gattás, “Colorimetric Enzymatic Assay of L -Malic Acid Using Dehydrogenase from Baker’s Yeast,” Food Technol. Biotechnol., vol. 46, no. 2, pp. 229–233, 2008.
[105] “Thermo Scientific - Pierce TM BCA Protein Assay Kit. [Online] [Cited: April 3rd, 2014 https://www.piercenet.com/instructions/2161296.pdf,”
[106] D. L. Nelson and M. M. Cox, Lehninger Principles of Biochemistry, 4th Edition. New York: W.H. Freeman, pp. 612–613.
[107] D. Anderson, “The Effect of Buffers on Nicotinamide Dinucleotide Hvdrolvsis,” J. Biol. Chem., vol. 238, no. 4, pp. 1475–1478, 1963.
[108] J. K. Kaushik and R. Bhat, “Why is trehalose an exceptional protein stabilizer? An analysis of the thermal stability of proteins in the presence of the compatible osmolyte trehalose.,” J. Biol. Chem., vol. 278, no. 29, pp. 26458–65, 2003.
[109] S. J. Vella, P. Beattie, R. Cademartiri, A. Laromaine, A. W. Martinez, S. T. Phillips, K. A. Mirica, and G. M. Whitesides, “Supplemental Information Measuring Markers of Liver Function Using a Micro-Patterned Paper Device Designed for Blood from a Fingerstick,” Anal. Chem., vol. 84, pp. 1–11, 2012.
[110] P. J. Yunker, T. Still, M. a Lohr, and a G. Yodh, “Suppression of the coffee-ring effect by shape-dependent capillary interactions.,” Nature, vol. 476, no. 7360, pp. 308–11, 2011.
[111] K. Yamada, S. Takaki, N. Komuro, K. Suzuki, and D. Citterio, “An antibody-free microfluidic paper-based analytical device for the determination of tear fluid lactoferrin by fluorescence sensitization of Tb3+.,” Analyst, vol. 139, no. 7, pp. 1637–43, 2014.
[112] A. L. Waterhouse, “Wine Phenolics,” Ann. N. Y. Acad. Sci., vol. 957, pp. 21–36, 2002.

70
[113] R. Devesa-rey, G. Bustos, J. M. Cruz, and A. B. Moldes, “Bioresource Technology Optimisation of entrapped activated carbon conditions to remove coloured compounds from winery wastewaters,” Bioresour. Technol., vol. 102, no. 11, pp. 6437–6442, 2011.
[114] C. Santos-buelga and V. De Freitas, “Influence of Phenolics on Wine Organoleptic Properties,” in Wine Chemistry and Biochemistry, New York: Springer New York, pp. 529–570, 2009.
[115] “‘IPAC acreditação - Guia para a quantificação de incerteza em ensaios químicos’ [Online] [Cited: October 15th, 2014] http://www.ipac.pt/docs/publicdocs/regras/ogc002.pdf.”


![$ECCIQi`d DB PL]BLICr^CiCDNIE:S, DRENSA Y … · tiva esta planta tintórea, que contiene un aceite volátil, agua, cera, celulosa, ácido málico, ... frán, la materia colorante](https://img.pdfslide.net/doc/110x75/5bb697f209d3f260638c2a9a/ecciqid-db-plblicrcicdnies-drensa-y-tiva-esta-planta-tintorea-que-contiene.jpg)