Embed Size (px)
Citation preview

Development of Width Spread Model for High
Carbon Steel Wire Rods in Flat Rolling Process
Kyunghun Lee Division of Marine Engineering, Korea Maritime and Ocean University, Busan, Rep. of Korea
Email: [email protected]
Byungmin Kim and Namjin Kim School of Mechanical Engineering, Pusan National University, Busan, Rep. of Korea
Email: {bmkim, njk9119}@pusan.ac.kr
Abstract—High carbon steel wire rods rolled by flat rolling
process are used to manufacture intermediate products of
various shaped wires such as a saw blade, spring wire and
piano wire. To achieve a desired geometry and dimensional
accuracy, it is important to predict and control the width
spread amount caused by the flat rolling. This study
developed the width spread model for the high carbon steel
wire in the flat rolling process by using the design of
experiments (DOE) and FE analysis. The process variables
considered in this study were the reduction of height, roll
diameter, initial wire diameter and friction coefficient. The
obtained FE analysis results were fitted to a second-order
polynomial equation using multiple regression analysis. The
spread formula was derived by solving the second-order
polynomial equation. Finally, the width spread amount
predicted using the proposed spread formula was compared
with experiment results. The proposed width spread model
led to a good agreement with the experimental results.
Therefore, the proposed model can provide a valuable
guideline for the prediction of wire width spread in the
actual high carbon steel wire production.
Index Terms—width spread model, flat rolling process, high
carbon steel wire, DOE, FE analysis
I. INTRODUCTION
Flattened wires are widely used to manufacture
intermediate products of various shaped wires such as a
saw blade, spring wire, piston ring and guide rail. In the
flat rolling process depicted in Fig. 1, cold drawn wire is
rolled between flat rolls for one or several passes to
achieve the desired combination of thickness and width.
Since the product is semi-manufactured, it is important to
be able to control and predict the width spread in order to
obtain the desired geometry for the customer [1]. In the
flat rolling process, wire is placed on a three-dimensional
deformation; thus, the plastic flow is considerably
complex. In addition, numerous factors affect the width
spread, such as the wire diameter, material, reduction of
height, roll diameter, roll material and friction coefficient.
Consequently, it is difficult to predict the width spread of
the wire. Many researchers have attempted to consider all
Manuscript received April 8, 2018; revised June 30, 2018.
of these factors simultaneously to derive general formulas
for the lateral spread. Wusatowski [2] proposed general
empirical formulas considering the initial shape of the
billet and the roll diameter to estimate the lateral spread
of mild steel for practical rolling temperature ranges and
plain sections. Shinokura et al. [3] proposed a new spread
formula that considered geometrical variables and had
only one coefficient. It had a high accuracy for every type
of pass. Saito et al. [4] proposed general empirical
formulas for various roll shapes such as square-oval,
square-diamond and round-oval through experimental
results from shape rolling. Kazeminezhad et al. [5]
investigated the effects of the material properties and roll
speed on the width of the contact area and width spread
of rolled wire, and developed a theoretical relationship
between the reduction in height and the width of the
contact area of the wire. Recently, many researchers have
used the FE analysis to investigate the deformation
behavior of wire in the flat rolling process. Iankov [6]
predicted the width spread of a final product using finite
element simulation and compared the predictions with
experimental results. Vallelano et al. [7] investigated the
contact stress distributions prevailing in the roll-wire
contact zone, as well as residual stresses in the resulting
flat wire, as a function of the deformation inhomogeneity
induced in the material. Kazeminezhad et al. [8]
investigated the creation of macroscopic shear bands due
to material flow tracks in the cross section of wire after
flat rolling using the combined finite and slab element
method. Shuai et al. [9] proposed spread model for TC4
alloy rod during the three-roll tandem rolling process.
The diameter of inscribed circle of pass has an upmost
effect on spread. Wang et al. [10] investigated the effect
of nominal friction coefficients in spread formulas.
This study deal with the width spread of the high
carbon steel wire in the flat rolling process by using the
design of experiment (DOE) and FE analysis. The
process variables considered in this study were the
reduction of height, roll diameter, initial wire diameter
and friction coefficient. We carried out FE simulations by
developing reliable 3D-FE models using DEFORM
343© 2018 Int. J. Mech. Eng. Rob. Res
International Journal of Mechanical Engineering and Robotics Research Vol. 7, No. 4, July 2018
doi: 10.18178/ijmerr.7.4.343-347

d0
h1
W1
Upper roll
Lower roll
Initial wire
Flattened wire
Figure 1. Schematic illustration of wire flat rolling process.
software, a commercially finite element platform. The
obtained simulation results were fitted to a second-order
polynomial equation using multiple regression analysis.
The spread formula was derived by solving the second-
order polynomial equation. Finally, the width spread
amount predicted using the proposed spread formula was
compared with experiment results. The proposed width
spread model led to a good agreement with the
experimental results. Therefore, the proposed model can
provide a valuable guideline for the prediction of wire
width spread in the actual high carbon steel wire
production.
II. SPREAD FORMULA FOR WIRE FLAT ROLILNG
PROCESS
The parameter that was analyzed for the flat rolling
process was the width spread of the wire, i.e., the
difference between the initial width and the maximum
width of the wire after the flat rolling process. The mean
vertical stress between the rolls and strip can be defined
as the normal pressure s, corresponding to a lateral
compressive stress of ms, where m is a function of the
geometry of the plastic zone, rolling temperature and
composition. The value of m lies between that of plane
strain and plane stress deformation condition, i.e. 0 ≤ m ≤
0.5. Neglecting the stress in the longitudinal direction,
then from the Levy-Mises plastic stress-strain relations,
we have [11]:
1 0
0 1
ln /
ln /
W Wp
h h or 01
0 1
p
hW
W h,
10
2
p (1)
where W0, W1, h0 and h1 are the initial width, final width,
initial height and final height of strip, respectively.
Wusatowski proposed the following relationship for the
spread in the strip rolling process [11,12].
01
0 1
' ' ' '
p
hWa b c d
W h (2)
where p is a function of the roll diameter and the ratio of
the initial width to the height of the strip. The variables a’,
b’, c’ and d’ are correction factors that differ slightly
from unity and allow for variations in the steel
composition, rolling temperature, rolling speed, and roll
material, respectively. Equation (2) is similar to Eq. (1),
which was derived from the experimental results. The
difference between Eq. (1) and (2) is due to the existence
of stress in the longitudinal direction.
To develop a width spread formula for the flat rolling
of wire rods, W0 = h0 = d0 is assumed, where d0 is the
initial wire diameter. Because Eq. (2) has five correction
factors, it is inconvenient to use in industry because
numerous experiments are required to determine them. In
this study, the correction factors in Eq. (2) were
simplified using two correction factors, A and p, for the
wire flat rolling process, as follows:
0
1 0
1
p
hW AW
h (3)
where A and p are correction factors for the flat rolling of
wire rods. For the calculation of the width spread of wire
rods using the above equation, it is necessary to
determine the correction factors of the spread formula.
III. PREDICTION METHOD OF WIDTH SPREAD AMOUNT
FOR FLAT ROLLING OF WIRE RODS
A. Procedure for Prediction of Width Spread
To develop a spread formula for the flat rolling of wire
rods, the DOE and FE analysis were carried out. The
prediction procedure is summarized as follows:
Step 1. Set process variables: The process variables
were determined as d0, dR, μ and Δh/h0, i.e., the initial
wire diameter, roll diameter, friction coefficient and
reduction of height, respectively.
Step 2. Design of experiments: A Box-Behnken design
was carried out using the selected variables to decide FE
analysis cases.
Step 3. Conduct FE analysis: FE analysis was
performed to predict the width spread amount of the
rolled wire rods using DEFORM.
Step 4. Calculate width spread using second-order
polynomial equation: The width spread of the rolled wire
rods was calculated using a second-order polynomial
equation by substituting the process variables selected in
Step 1.
Step 5. Plot W1/W0 with respect to h0/h1: Using the
calculated data from Step 4, W1/W0 was plotted with
respect to h0/h1.
Step 6. Plot log(W1/W0) with respect to log(h0/h1) : In
order to extract the correction factors (A, p), log(W1/W0)
was plotted with respect to log(h0/h1).
Step 7. Extract correction factors (A, p): Using the
graph of log(W1/W0) versus log(h0/h1), the correction
factors (A, p) were extracted by a linear equation.
Step 8. Predict width spread using spread formula: The
width spread of the wire rods in flat rolling process was
predicted by the spread formula derived in Step 7 by
substituting W0 and h0/h1.
B. Design of Experiments
The Box-Behnken design model was used to determine
the process variables for the width spread of the wire rods,
such as the reduction of height, wire diameter, roll
diameter and friction coefficient between the rolls and
wire. The number of computational experiments needed
to obtain a response such as the width spread can be
344© 2018 Int. J. Mech. Eng. Rob. Res
International Journal of Mechanical Engineering and Robotics Research Vol. 7, No. 4, July 2018
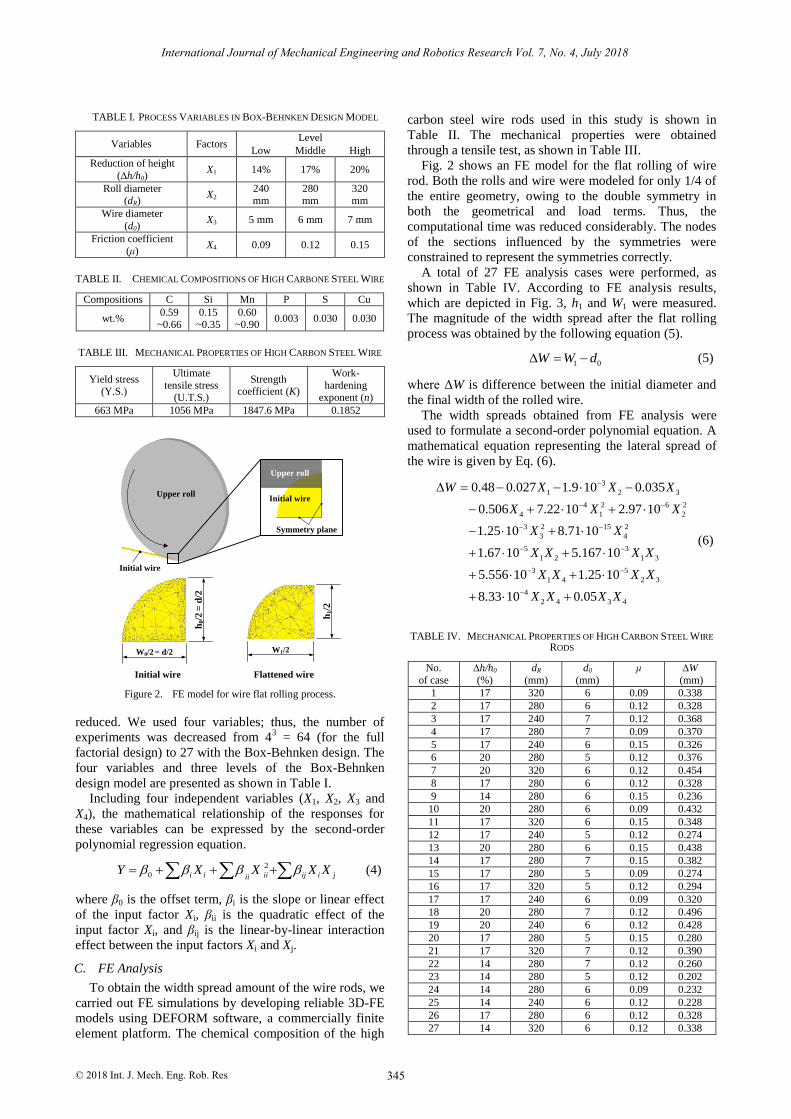
TABLE I. PROCESS VARIABLES IN BOX-BEHNKEN DESIGN MODEL
Variables Factors Level
Low Middle High
Reduction of height
(∆h/h0) X1 14% 17% 20%
Roll diameter (dR)
X2 240 mm
280 mm
320 mm
Wire diameter
(d0) X3 5 mm 6 mm 7 mm
Friction coefficient (μ)
X4 0.09 0.12 0.15
TABLE II. CHEMICAL COMPOSITIONS OF HIGH CARBONE STEEL WIRE
Compositions C Si Mn P S Cu
wt.% 0.59
~0.66
0.15
~0.35
0.60
~0.90 0.003 0.030 0.030
TABLE III. MECHANICAL PROPERTIES OF HIGH CARBON STEEL WIRE
Yield stress (Y.S.)
Ultimate
tensile stress (U.T.S.)
Strength coefficient (K)
Work-
hardening exponent (n)
663 MPa 1056 MPa 1847.6 MPa 0.1852
Upper roll
Initial wire
Initial wire
Upper roll
Symmetry plane
h0/2
= d
/2
W0/2 = d/2
h1/2
W1/2
Initial wire Flattened wire
Upper roll
Initial wire
Initial wire
Upper roll
Symmetry plane
h0/2
= d
/2
W0/2 = d/2
h1/2
W1/2
Initial wire Flattened wire
Figure 2. FE model for wire flat rolling process.
reduced. We used four variables; thus, the number of
experiments was decreased from 43 = 64 (for the full
factorial design) to 27 with the Box-Behnken design. The
four variables and three levels of the Box-Behnken
design model are presented as shown in Table I.
Including four independent variables (X1, X2, X3 and
X4), the mathematical relationship of the responses for
these variables can be expressed by the second-order
polynomial regression equation.
2
0 i i ii ij i jiiY X X X X (4)
where β0 is the offset term, βi is the slope or linear effect
of the input factor Xi, βii is the quadratic effect of the
input factor Xi, and βij is the linear-by-linear interaction
effect between the input factors Xi and Xj.
C. FE Analysis
To obtain the width spread amount of the wire rods, we
carried out FE simulations by developing reliable 3D-FE
models using DEFORM software, a commercially finite
element platform. The chemical composition of the high
carbon steel wire rods used in this study is shown in
Table II. The mechanical properties were obtained
through a tensile test, as shown in Table III.
Fig. 2 shows an FE model for the flat rolling of wire
rod. Both the rolls and wire were modeled for only 1/4 of
the entire geometry, owing to the double symmetry in
both the geometrical and load terms. Thus, the
computational time was reduced considerably. The nodes
of the sections influenced by the symmetries were
constrained to represent the symmetries correctly.
A total of 27 FE analysis cases were performed, as
shown in Table IV. According to FE analysis results,
which are depicted in Fig. 3, h1 and W1 were measured.
The magnitude of the width spread after the flat rolling
process was obtained by the following equation (5).
1 0 W W d (5)
where ΔW is difference between the initial diameter and
the final width of the rolled wire.
The width spreads obtained from FE analysis were
used to formulate a second-order polynomial equation. A
mathematical equation representing the lateral spread of
the wire is given by Eq. (6).
3
1 2 3
4 2 6 2
4 1 2
3 2 15 2
3 4
5 3
1 2 1 3
3 5
1 4 2 3
4
2 4 3 4
0.48 0.027 1.9 10 0.035
0.506 7.22 10 2.97 10
1.25 10 8.71 10
1.67 10 5.167 10
5.556 10 1.25 10
8.33 10 0.05
W X X X
X X X
X X
X X X X
X X X X
X X X X
(6)
TABLE IV. MECHANICAL PROPERTIES OF HIGH CARBON STEEL WIRE
RODS
No.
of case
∆h/h0
(%)
dR
(mm)
d0
(mm)
μ ∆W
(mm)
1 17 320 6 0.09 0.338
2 17 280 6 0.12 0.328
3 17 240 7 0.12 0.368
4 17 280 7 0.09 0.370
5 17 240 6 0.15 0.326
6 20 280 5 0.12 0.376
7 20 320 6 0.12 0.454
8 17 280 6 0.12 0.328
9 14 280 6 0.15 0.236
10 20 280 6 0.09 0.432
11 17 320 6 0.15 0.348
12 17 240 5 0.12 0.274
13 20 280 6 0.15 0.438
14 17 280 7 0.15 0.382
15 17 280 5 0.09 0.274
16 17 320 5 0.12 0.294
17 17 240 6 0.09 0.320
18 20 280 7 0.12 0.496
19 20 240 6 0.12 0.428
20 17 280 5 0.15 0.280
21 17 320 7 0.12 0.390
22 14 280 7 0.12 0.260
23 14 280 5 0.12 0.202
24 14 280 6 0.09 0.232
25 14 240 6 0.12 0.228
26 17 280 6 0.12 0.328
27 14 320 6 0.12 0.338
Upper roll
Initial wire
Initial wire
Upper roll
Symmetry plane
h0/2
= d
/2
W0/2 = d/2
h1/2
W1/2
Initial wire Flattened wire
345© 2018 Int. J. Mech. Eng. Rob. Res
International Journal of Mechanical Engineering and Robotics Research Vol. 7, No. 4, July 2018

where ΔW is difference between the initial diameter and
the final width of the wire, and X1, X2, X3 and X4 are the
reduction of height, roll diameter, wire diameter, and
friction coefficient between the rolls and wire,
respectively.
The fitting model was evaluated according to the
correlation coefficient (R2) between the FE analysis
results and the values of the response variable predicted
using the model, as shown in Fig. 3. The R2-value was
0.99, which showed that the deviation between the FE
analysis results and the mathematical model was small.
Therefore, the mathematical model for the width spread
agreed well with the FE analysis.
To develop a width spread formula for the wire flat
rolling process, the second-order polynomial Eq. (6) was
modified by Eq. (3). The selected process variables are
shown in Table V.
Then width spread of the wire was calculated by the
second-order polynomial Eq. (6). Using the calculated
data, W1/W0 was plotted with respect to h0/h1, as shown in
Fig. 4. To extract the correction factors, log(W1/W0) was
plotted with respect to log(h0/h1), as shown in Fig. 5.
According to the linear relationship between log(W1/W0)
and log(h0/h1), the correction factors A and p were
determined to be 0.9720 and 0.4498, respectively, and the
spread formula was obtained, as shown in Eq. (7). 0.4498
01
0 1
0.9720
hW
W h (7)
The width spread of rolled wire rods can be predicted
easily using Eq. (7), by substituting W0 and h0/h1.
IV. EXPERIMENTAL VERIFICATION
Experimental tests were conducted to verify the
effectiveness of the spread formula. Table VI shows the
experiment case of the flat rolling of wire. A rolling
machine with two cylindrical rolls 320 mm in diameter
was used for the flat rolling of wire. High carbon steel
wire rod was used, and the initial wire diameter was 6.3
mm. The wire was drawn from a 10 mm wire rod
manufactured by hot rolling. The friction coefficient
between the rolls and wire is approximately 0.1~0.15
when lubrication is applied at room temperature. A
commercial lubricant was applied at the inlet and outlet
of the rolling machine. The reduction of height was 14,
17, and 20%, respectively.
Fig. 6 shows the cross sections of the flattened wire
obtained from the experiment. According to the
experimental results, the maximum width of the wire
increased with the increase in the reduction of height. The
FE analysis results, the predicted results, and the
experimental results for the maximum width of the wire
are compared in Table VII.
TABLE V. SELECTED PROCESS VARIABLES FOR SPREAD FORMULA
Reduction of
height
(Δh/h0)
Roll diameter
(dR)
Wire diameter
(d0)
Friction
coefficient
(μ)
14~20% 320 mm 6.3 mm 0.12
TABLE VI. EXPERIMENTAL CONDITIONS FOR VERIFICATION
No. of case Wire diameter
(d0) Roll diameter
(dR) Reduction of height (Δh/h0)
1
6.3 mm 320 mm
14%
2 17%
3 20%
0.20 0.25 0.30 0.35 0.40 0.45 0.50
0.20
0.25
0.30
0.35
0.40
0.45
0.50
Late
ral
spre
ad
-Math
emati
cal
Mod
el (
mm
)
Lateral spread-FEM results (mm)
Figure 3. Relationship between FEM results and mathematical model.
1.10 1.15 1.20 1.25 1.301.02
1.03
1.04
1.05
1.06
1.07
1.08
1.09
1.10
W
1/W
0
h0/h
1
Figure 4. Relationship between W1/W0 and h0/h1.
0.065 0.070 0.075 0.080 0.085 0.090 0.095 0.1000.016
0.018
0.020
0.022
0.024
0.026
0.028
0.030
0.032
log
(W1
/W0
)
log(h0/h1)
1 0 0 1( / ) 0.0123 0.4498 ( / )log W W log h h
Figure 5. Relationship between log(W1/W0) and log(h0/h1).
(a) Case 1 (b) Case 2 (c) Case 3
Figure 6. Cross-sectional shapes of flat rolled wire rods.
346© 2018 Int. J. Mech. Eng. Rob. Res
International Journal of Mechanical Engineering and Robotics Research Vol. 7, No. 4, July 2018

TABLE VII. COMPARISON OF EXPERIMENTAL, SPREAD FORMULA AND
FE ANALYSIS RESULTS
No. of case Width of flattened wire (mm)
Experiment Spread formula FE analysis
1 6.676 6.552 (-1.9 %) 6.554 (-1.8 %)
2 6.783 6.657 (-1.9 %) 6.658 (-1.8 %)
3 6.926 6.768 (-2.3 %) 6.778 (-2.1 %)
The FE analysis and spread formula results are fairly
similar but differ from the experimental results. The
experimental values are larger than both the spread
formula and the FE analysis values, with a maximum
error of 2.3%. Several reasons for this difference are
suggested. The friction between the wire and rolls and the
temperature caused by plastic deformation heat did not
exhibit a significant influence, but this error was due to
the mechanical anisotropy of the wire and the insufficient
material model [13]. In this study, the mechanical
anisotropy of wire was not considered, because an
isotropy model was used in the FE simulation. For more
exact predictions, it is necessary to consider the
mechanical anisotropy of the drawn wire and use a more
sophisticated material model.
V. CONCLUSIONS
In this study, the prediction model of width spread for
high carbon steel wire rods in flat rolling process based
on the DOE and FE analysis. Furthermore, the proposed
spread formula was validated through FE analysis and
experimental results. The main conclusions are as
follows:
(1) A spread formula for the flat rolling of wire rods
was developed by modifying the spread formula for
the flat rolling of strips. The number of correction
factors in the spread formula was reduced from five
(a’, b’, c’, d’, p) to two (A, p) for simplicity.
(2) FE analysis was performed using DEFORM-3D in
order to estimate the width spread amount. And
after, a second-order polynomial equation was
derived using the FE analysis results. The
correction factors A and p were determined to be
0.9720 and 0.4498, respectively, as shown in Eq.
(7).
(3) The proposed width spread model led to the high
dimensional precision. This research results
provide a valuable guideline for the prediction of
wire width spread in actual high carbon steel wire
production.
ACKNOWLEDGMENT
This work was supported by the National Research
Foundation of Korea(NRF) grant funded by the Korea
government(MSIP; Ministry of Science, ICT & Future
Planning) (No. 2017R1C1B5017016).
REFERENCES
[1] B. Carlsson, “The contact pressure distribution of flat rolling of
wire,” J Mater Process Technol, vol. 73, no. 1-3, pp. 1-6, January 1998.
[2] Z. Wusatowski, Fundamental of Rolling; London: Pergamon Press Ltd., 1969, pp. 501-530.
[3] T. Shinokura and K. Takai, “A new method for calculating spread
in rod rolling,” J of Appl Metalwork, vol. 2, no. 2, pp. 94-99, January 1982.
[4] Y. Saito, Y. Takahashi, M. Moriga, and K. Kato, “A new method for calculating deformation and force parameters in steel rod
rolling and its application to roll pass design,” J Jpn Soc Technol
Plast, vol. 24, no. 273, pp. 1070-1077, October 1983. [5] M. Kazeminezhad and A. Karimi Taheri, “A theoretical and
experimental investigation on wire flat rolling process using deformation pattern,” Mater Des, Vol. 26, No. 2, pp. 99-103, April
2005.
[6] R. Iankov, “Finite element simulation of profile rolling of wire,” J Mater Process Technol, vol. 142, no. 2, pp. 355-361, November
2003. [7] C. Vallellano, P. A. Cabanillas, and F. J. García -Lomas,
“Analysis of deformations and stresses in flat rolling of wire,” J
Mater Process Technol, vol. 195, no. 1-3, pp. 63-71, January 2008. [8] M. Kazeminezhad and A. Karimi Taheri, “The prediction of
macroscopic shear bands in flat rolled wire using the finite and slab element method,” Mater Lett, vol. 60, no. 27, pp. 3265-3268,
November 2006.
[9] M. Shuai, Q. Huang, Y. Zhu, and L. Pan, “Spread model for TC4 alloy rod during the three-roll tandem rolling process,” Rare Met
Mater Eng, vol. 42, no. 5, pp. 909-913, May 2013. [10] H. Y. Wang, Y. K. Hu, F. Gao, D. W. Zhao, and D. H. Zhang,
“Nominal friction coefficient in spread formulas based on lead
rolling experiments,” Trans Nonferrous Met Soc China, vol. 25, no. 8, pp. 2693-2700, August 2015.
[11] N. R. Chitkara and W. Johnson, “Some experimental results concerning spread in the rolling of lead,” J Basic Eng, vol. 88, no.
2, pp. 489-499, June 1966.
[12] A. Helmi and J. M. Alexander, “Geometric factors affecting spread in hot steel,” J Iron Steel Inst, vol. 206, pp. 1110-1117,
November 1968. [13] T. Massé, Y. Chastel, P. Montmitonnet, C. Bobadilla, N. Persem,
and S. Foissey , “Impact of mechanical anisotropy on the
geometry of flat-rolled fully pearlitic steel wires,” J Mater Process Technol, vol. 211, no. 1, pp. 103-112, January 2011.
Kyunghun Lee received his B.S. and Ph.D.
degrees in Mechanical Engineering from Pusan National University, Rep. of Korea, in 2007
and 2013, respectively. Now he is an assistant professor of Division of Marine Engineering at
Korea Maritime and Ocean University in
Busan, Rep. of Korea. His current research interests included design and analysis of metal
forming process.
Byungmin Kim received his B.S., M.S. and
Ph.D. degrees in Mechanical Engineering from Pusan National University, Rep. of Korea, in
1979, 1984 and 1987, respectively. Now he is a
professor of School of Mechanical Engineering at Pusan National University in Busan, Rep. of
Korea.
Namjin Kim received his B.S. and M.S
degrees in Mechanical Engineering from Pusan
National University, Rep. of Korea, in 2015 and 2017, respectively.
347© 2018 Int. J. Mech. Eng. Rob. Res
International Journal of Mechanical Engineering and Robotics Research Vol. 7, No. 4, July 2018