Embed Size (px)
Citation preview

JOURNAL OF EASTERN EUROPEAN AND CENTRAL ASIAN RESEARCH Vol.8 No.1 (2021)
www.ieeca.org/journal 121
DEVELOPMENT SCENARIOS FOR THE TAXI SERVICES MARKET IN VIETNAM IN TERMS OF COMPETITIVENESS
Pham Thi Thanh Hong Hanoi University of Science and Technology, Vietnam
Nguyen Thi Thu Thuy Hanoi University of Science and Technology, Vietnam
ABSTRACT The objective of this study is scenario forecasting of the growth prospects of the service operators’ market using Vietnam as an example. The study is based on the results of a survey of 231 Hanoi residents who use traditional taxi services and app-based taxi services (TTS&ABTS). Using an integrated model, the quality of taxi services (TS) was assessed based on the satisfaction level with the individual components of the services provided. The perception features of TTS&ABTS in the context of different categories of respondents have been revealed. Using IPA analysis, the competitiveness of the taxi operators in the country has been determined. Considering the impact of external factors that create risks and opportunities for the development of TS, economic scenarios for the development of TTS&ABTS have been simulated. The results can be useful in the legislative regulation of the taxi market (TM) in Vietnam and the development of effective marketing strategies by taxi operators. Keywords: Vietnam, taxi market, competitiveness, service quality, traditional taxi service, app-based taxi
service
DOI: http://dx.doi.org/10.15549/jeecar.v8i1.657
INTRODUCTION Taxis are one of the prime modes of
transportation in Vietnam. With the implementation of Decision No. 24/QD-BGTVT by the Ministry of Transport of Vietnam (Ministry of Transport of Vietnam, 2016), which promotes the cost reduction of Vietnamese taxis and booking services via mobile apps, the demand for taxis in Vietnam is increasing. With an increase in the number of taxi service (TS) users to 20 million, the revenue in this sector is
expected to reach $3,021 million in 2021, a 5% increase from before the pandemic (Statista, 2021).
Due to the popularity of taxis in Vietnam and the use of aggressive marketing strategies on pricing and innovation, competition between traditional taxi companies and order services for them is increasing since a wave of new global companies is emerging in the global market (Mordor Intelligence, 2021; Orlova et al., 2016; Yen et al., 2020). Taxi companies move from

Development scenarios for the taxi services market… Pham Thi Thanh Hong, Nguyen Thi Thu Thuy
www.ieeca.org/journal 122
providing traditional TS to orders via apps, making the process more convenient, faster and transparent for consumers (Tien et al., 2020). The massive investment of car manufacturers in delivery services stimulates even more growth of this passenger transportation industry, which, in turn, restrains the demand for traditional TS (Semin et al., 2020). Economically, not only does competition increase in the taxi market (TM) but also social tension among the population and taxi drivers as well (ReportLinker, 2019). Because of the large number of older people without mobile apps, there is still a significant demand for a traditional taxi in the domestic market (Statista, 2021). In the process of expansion of foreign tech companies, the economic losses of national ride-hailing companies such as Go-Viet, FastGo and Viettel (ReportLinker, 2019) are increasing, forcing them to unite and seek governmental protection since the regulatory framework for protectionism has not been established by law. In order to protect the national taxi business, regulators create administrative barriers to the operation of tech platforms while inhibiting future innovative business models (Pham, 2018). This, in turn, is a severe detriment to the information economy in Vietnam, since today the TM is one of the most dynamically developing sectors. This study, then, is aimed at substantiating the current needs of consumers in the TM in Vietnam and creating forecasts for taxi operators using Hanoi as an example. The results of the study can help regulators to effectively manage the market for the interests of foreign and domestic taxi companies and achieving maximum economic effect. Also, it can be useful in developing marketing strategies to improve the quality of services to ensure the competitiveness of TM operators.
LITERATURE REVIEW
Service quality is a standout among the most principal research subjects for the past few decades (Nguyen-Phuoc et al., 2021; McKenzie, 2015; Pamucar et al., 2021). Researchers quite differ, though, in the dimensions used to evaluate TS satisfaction. Commonly, researchers applied the model of five service quality’ dimensions, including tangibility, reliability, responsiveness, assurance, and empathy, and
came to a conclusion about the impacts to customer satisfaction in the public transport sector (Azudin et al., 2018; Mensah & Ankomah, 2018). However, Wong et al. (2018) proposed an alternative methodology to evaluate the service quality of urban taxis and developed a level-of-service standard for taxi customers to monitor performance. Their ten service aspects related to the amount of time consumed when taking taxis, services and facilities provided for finding taxis, internal environments of taxis, and personal services provided by taxi drivers. A model was developed to identify the priority areas for improvement of urban TS quality. Based on the numerical score of overall TS quality, a six-level service standard, similar to academic grading, was introduced to improve the general public's understanding of the current service level. The paper discussed the potential policy implications to enhance the TS quality in Hong Kong, which can be applied to other metropolitan cities that provide similar urban TS.
In a different approach, Paronda et al. (2017) present a comparative analysis of Key Performance Indicators (KPIs) of TNCs vs Conventional Taxis. The KPIs include travel speed, reliability, passenger expense, and quality of service. Travel diaries from regular riders of Uber, GrabCar and Conventional Taxi’s were kept for 30 days in order to gather data and compare its KPIs.
Shen et al. (2015) examined the actual influence of the telephone/online booking system on TS performance, based on the operational statistics of the TM in Suzhou City, China. The results indicated that in current operation modes, the use of the telephone/online booking system could benefit passengers, but actually makes few differences to the TS providers.
Rasheed and Sherali (2019) aimed to evaluate customers’ satisfaction using mobile app-based TS in the city of Lahore. Their study investigated six service quality parameters that three online taxi companies - Careem, Uber and A-Taxi - offer to their customers. The study recommended that fares should be rational, customers should not be inappropriately swapped for rides and government should develop a regulatory framework for taxi
Development scenarios for the taxi services market… Pham Thi Thanh Hong, Nguyen Thi Thu Thuy
www.ieeca.org/journal 123
numbers, fares and service standards. Fang and Shen (2015) provided a systematic
account of the impact of e-hailing applications’ wide adoption on the taxi system, first proposing a spatial equilibrium model that not only balances the supply and demand of TS but also captures both the taxi drivers’ and customers’ possible adoption of the newly emerging e-hailing applications in a well-regulated TM. Lastly, a numerical example was presented to compare the TS with and without the e-hailing application and evaluated two types of e-hailing applications.
Suhami et al. (2018) measured customer satisfaction levels on the service attributes of Uber. Specifically, this study addressed the issues of Uber’s service attributes with customer satisfaction and return usage. The results of the study revealed that Uber’s service attributes - namely safety, price, convenience, and information and communications technology (ICT) - do influence customer satisfaction and return usage. This study found that it is imperative for Uber operators to improve their services and provide better services that fit current consumer demands on public transportation.
Few works, however, have focused on comparing customers’ satisfaction between app-based taxi and traditional TS and the role of each dimension of quality service on the demand for taxis.
METHODOLOGY Data Collection Data from customer surveys will be used in
this research. The target population for this study was identified as all passengers in Hanoi who have travelled with both types of TS during June-September 2020. The questionnaire survey would be ended, and the data would be neglected from analysis, if respondents had not taken the two types of TS over this period. Data collection was also conducted through an online self-administered questionnaire using Google Docs, and the link was shared on social media (Facebook). Respondents were directed to a website containing the questionnaire via the shared link to answer/complete the answer. A total of 231 responses were received for an
overall response rate of 61.33%. A sample of 231 people is sufficient to ensure
the representativeness of the survey results at a significance value of p=0.1, as this value is acceptable to ensure a high reliability of the results (Jae, 2015). And, according to Hashim (2010), a 100 people sample is sufficient.
The questionnaire survey consisted of three sections. Section A contained demographic items. Demographic information included gender, age, race, occupational status, academic qualification, monthly family income, average monthly transportation cost, length of experience in using the MBT App, all reasons for using TS.
Section B dealt with assessing satisfaction with the quality of the TS provided and their importance to customers. Section C was aimed at identifying risks and opportunities for TTS&ABTS. All items in section B and C were rated using a seven-point Likert/interval Scale ranging from 1 (strongly disagree) to 7 (strongly agree) (Taherdoost, 2019). To ensure questionnaire reliability and validity, we invited three experts with at least two years of experience of work in TS consulting to examine and modify the questionnaire. A pilot survey was conducted before the questionnaire was finalized, about two weeks before the main survey, and about 30 taxi customers were interviewed to verify the feasibility of the survey approach and ensure the clarity of wording in the questionnaire. Cronbach's alpha was used as a statistical confirmation of the questionnaire reliability, using Statistica 12.0 software.
Dimensions of Service Quality In this study, the SERVPERF scale was
employed to measure TS quality with some modifications that fit comparison purposes and specific characteristics of TS quality (Pamucar et al., 2021; Leong et al., 2015; Mensah & Ankimah, 2018).
The service attributes considered were tangibility, reliability, convenience, safety and empathy, as described below:
1. Tangibility pertains to the physically visible aspects used by taxi firms to communicate their image and signal quality to customers.

Development scenarios for the taxi services market… Pham Thi Thanh Hong, Nguyen Thi Thu Thuy
www.ieeca.org/journal 124
Three questions were used to measure tangibility including (Q1) Vehicles are in good condition; (Q2) Drivers are well dressed and appear neat; (Q3) The Internet website of the company is legible.
2. Reliability refers to the ability of taxi providers to provide reliable service dependably and accurately. Five questions were used to measure reliability: (Q4) Drivers are dependable and reassuring; (Q5) Booking is not cancelled after confirmation; (Q6) Providers keep general terms and conditions of service; (Q7) Clear, accurate and comprehensive information of the trips is provided; (Q8) Payment methods are trustworthy.
3. Convenience emphasizes the ability of taxi firms to provide service at customers’ convenience. Five items were used to evaluate convenience: (Q9) TS is available in my area; (Q10) I can book a car easily; (Q11) Payment method is convenient; (Q12) I can get the car fast; (Q13) I do not have to wait a long time to book and take a car.
4. Safety relates to the ability of taxi firms to convey confidence and trust. Four items were used to evaluate safety including (Q14) Details of drivers are provided; (Q15) The security policy is available; (Q16) Drivers have good driving skills and make me feel safe; (Q17) Drivers can be trusted.
5. Empathy is the understanding of customers’ sentiments to make them feel important and exceptional, the caring and individualized attention taxi firms provide to their customers. The three items used were (Q18) Feel treated individually; (Q19) Drivers understand my specific expectations of service; (Q20) Taxi firms care about my assessment of the service.
Questionnaire Section B is aimed at measuring the integrated index of respondents' satisfaction with the TS quality and assessing the importance of these components by formulas:
1
m
i ij ijj
SQ W P=
= ×∑ , (1)
1
m
ij ij ijj
W I I=
= ∑ , (2)
where: SQi is an integrated index of the TS quality to an
individual i; Wij is the weighting factor of item statement j to
an individual i. Elements j correspond to questions Q1-Q20 of the questionnaire;
Pij is perception of individual i with respect to performance (the score of the satisfaction level with the service quality) on item statement j;
Iij is the importance score of item statement j to an individual i obtained from the questionnaire;
m is the number of quality elements. IPA analysis was used to determine the
priorities for improving TS quality for the components Q1-Q20, and a 2-dimensional matrix (Esmailpour et al., 2020) based on the criteria of customer satisfaction with individual indicators of service quality and their importance was built. The division of the matrix into quadrants was carried out according to the weighted average value of these criteria.
Assessment of Development Scenarios of
TTS&ABTS Kolmogorov differential equations (Flandoli et
al., 2021) were used to model scenarios for the TTS&ABTS development:
( ) ( ) ( ) ( )
( ) ( ) ( ) ( )
( ) ( ) ( ) ( )
RR R IR I SR S
IRI R I I SI S
SRS R IS I S S
dp t p t p t p tdt
dp t p t p t p tdt
dp t p t p t p tdt
λ λ λ
λ λ λ
λ λ λ
= − × + × + ×
= × − × + ×
= × + × − ×
∑ ∑ ∑
∑ ∑ ∑
∑ ∑ ∑
(3)
where pR(t), pI(t), pS(t) are the probabilities of scenarios R, I, S, respectively; λij is the intensity of the flows leading to the transition from scenario i to scenario j.
Next, scenarios of TTS&ABTS development are accepted: 1) expansion of the controlled market segment (favorable impact of external factors) – scenario R; 2) preservation of market positions (positive impact of some factors is compensated by the negative impact of others) – scenario I; 3) market share reduction – scenario S.
The intensity of the flows provided by this

Development scenarios for the taxi services market… Pham Thi Thanh Hong, Nguyen Thi Thu Thuy
www.ieeca.org/journal 125
method was determined based on the respondents' assessments of the questionnaire Section C, which contains questions aimed at assessing the degree of risks/opportunities for TTS&ABTS development and their significance. Respondents rated the following items on TTS&ABTS separately: (F1) the deterrent to the expansion of demand for TS is the high cost price of the service; (F2) TS suffers from a decline in demand as a result of the high travel cost due to a high market monopolization; (F3) TS fails to compete with other passenger transport modes; (F4) the Covid-19 pandemic contributed to a market reorientation to individual transportation (taxis) which is safer than public; (F5) the partial shift to distance work, distance learning, service industry and mass events restrictions reduced demand for passenger transportation and TS in particular; (F6) the market growth factor is the decline in poverty and the increase in citizens' ability to pay; (F7) a well-developed transport infrastructure is an incentive to increase the volume of TS; (F8) the competitive advantage of TS is its safety, which leads to increased demand for it; (F9) historically the priority of customers is given to traditional TS; (F10) trends in TM show the increasing role of digitalization and innovation; (F11) Vietnam is characterized by a low level of development of IT; (F12) transnational corporations play a positive role in the development of the TS market. The questions are based on current trends in market development (ReportLinker, 2019; Statista, 2021) and the changes due to the Covid-19 pandemic (Megits et al., 2020; Mordor Intelligence, 2021).
The range of possible values for indicators F1-F12 is divided into five equal intervals, corresponding to the impact of risks/opportunities on TS development: [1; 2.2] – low, [3.4; 4.6] – medium, [5.8; 7] – high, (2.2; 3.4), (4.6; 5.8) – intermediate levels. Depending on the nature of the impact on the development prospects of a certain type of TS, the indicators F1-F12 are differentiated into stimulants (which create development opportunities) and de-stimulants (which create risks for development). Indicators F1-F3, F5 regardless of the type of TS (traditional or app-based TS) create a risk for development, so they are de-stimulants. Indicators F4, F6-F8, F12 create
opportunities for TS development. Indicators F9, F11 are stimulators for traditional TS and de-stimulants for app-based TS; F10 – opposite.
Scenario I – the actual state of the industry - was taken as the basis for the scenario simulation of TS development. The stimulant low level and de-stimulant high level corresponds to the transition from scenario I to scenario S. The stimulant high level and de-stimulant low level contributes to the transition from scenario I to scenario R. Flow intensity values are calculated by formula (4):
( )1
n
IR S k ik ikk
W Wλ µ=
= × ∑ , (4)
Where: λ1R(S) is the flow intensity promoting the
transition from scenario I to scenario R or S; μk is the probability of assigning the indicator F
to the level stimulating the transition to the corresponding scenario;
Wik is the score of the significance of the k-th indicator for the i-th respondent;
n is the number of indicators F. The probabilities of assigning indicators F to
levels are determined by the method of fuzzy sets by the formulae:
1, 1 2.23.4 , 2.2 3.4
1.2
k
L kk
FF F
µ≤ ≤
= −< <
2.2 , 2.2 3.41.2
1, 3.4 4.65.8 , 4.6 5.8
1.2
kk
M k
kk
F F
FF F
µ
− < <
= ≤ ≤ − < <
(5)
4.6 , 4.6 5.81.2
1, 5.8 7
kk
H
k
F F
Fµ
− < <= ≤ ≤
Where: μL is the probability of assigning the indicator F
to a low level; μM is the probability of assigning the indicator F
to the average level;
μH is the probability of assigning the indicator F

Development scenarios for the taxi services market… Pham Thi Thanh Hong, Nguyen Thi Thu Thuy
www.ieeca.org/journal 126
to a high level; F is the score value of the indicator.
RESEARCH RESULTS Service Quality Measurement In order to statistically assess the reliability of
the questionnaire for assessing the service
quality of TTS&ABTS, the values of Cronbach's alpha were calculated based on the respondents' scores on the questions (Table 1).
The Cronbach's alpha values for the whole questionnaire were 0.87 and are within the normative limits of 0.7-0.9 (Hair et al., 2017), which indicates the questionnaire’s reliability and the possibility of using it.
Table 1: Values of the Cronbach's alpha of the questionnaire for assessing the TS quality
Indicator Cronbach's
alpha Indicator Cronbach's
alpha Indicator Cronbach's
alpha Q1 0.89 Q8 0.87 Q15 0.88 Q2 0.86 Q9 0.88 Q16 0.88 Q3 0.88 Q10 0.86 Q17 0.87 Q4 0.89 Q11 0.87 Q18 0.86 Q5 0.87 Q12 0.87 Q19 0.87 Q6 0.86 Q13 0.87 Q20 0.87
Q7 0.87 Q14 0.89 From the questionnaire
0.87
Source: author’s work.
The research results show that the quality of app-based TS rated by customers is higher than that of traditional taxis. This result is in line with the advantages of technology taxis. App-based taxi firms can mobilize a much larger number of cars, allowing them to quickly pick up and drop off passengers. While app-based TS is assessed by customers as higher than
traditional taxis regarding reliability and convenience, the latter received better scores in terms of empathy. There is no significant difference in customers’ perceived service quality with respect to tangibility attribute (Table 2).
Table 2: The service quality scores between TTS&ABTS
[1] Indicator [2] Traditional TS [3] App-based TS [4] Mean [5] Std.
deviation [6] Mean [7] Std.
deviation [8] Tangibility [9] Q1 [10] 4.15 [11] 0.75 [12] 4.18 [13] 0.59
[14] Q2 [15] 3.59 [16] 0.59 [17] 4.25 [18] 0.61 [19] Q3 [20] 3.88 [21] 0.70 [22] 4.33 [23] 0.56
[24] Average [25] 3.87 [26] - [27] 4.25 [28] - [29] Reliability [30] Q4 [31] 3.88 [32] 0.76 [33] 4.33 [34] 0.57
[35] Q5 [36] 4.20 [37] 0.65 [38] 4.14 [39] 0.64 [40] Q6 [41] 4.00 [42] 0.70 [43] 3.97 [44] 0.55 [45] Q7 [46] 3.74 [47] 0.79 [48] 3.97 [49] 0.57 [50] Q8 [51] 3.47 [52] 0.74 [53] 4.37 [54] 0.60
[55] Average [56] 3.86 [57] - [58] 4.16 [59] -

Development scenarios for the taxi services market… Pham Thi Thanh Hong, Nguyen Thi Thu Thuy
www.ieeca.org/journal 127
Table 2: Continued [60] Convenience [61] Q9 [62] 3.97 [63] 0.75 [64] 4.07 [65] 0.59
[66] Q10 [67] 3.83 [68] 0.59 [69] 4.29 [70] 0.61 [71] Q11 [72] 3.90 [73] 0.70 [74] 4.16 [75] 0.56 [76] Q12 [77] 3.97 [78] 0.74 [79] 4.48 [80] 0.53 [81] Q13 [82] 3.89 [83] 0.53 [84] 4.27 [85] 0.46
[86] Average [87] 3.91 [88] - [89] 4.25 [90] - [91] Safety [92] Q14 [93] 4.27 [94] 0.79 [95] 3.86 [96] 0.68
[97] Q15 [98] 4.16 [99] 0.83 [100] 4.11 [101] 0.60 [102] Q16 [103] 4.08 [104] 0.80 [105] 3.75 [106] 0.67 [107] Q17 [108] 4.17 [109] 0.72 [110] 3.79 [111] 0.58
[112] Average [113] 4.17 [114] - [115] 3.88 [116] -
[117] Empathy [118] Q18 [119] 4.23 [120] 0.61 [121] 3.84 [122] 0.52 [123] Q19 [124] 4.22 [125] 0.67 [126] 3.66 [127] 0.61 [128] Q20 [129] 4.21 [130] 0.68 [131] 3.92 [132] 0.53
[133] Average [134] 4.22 [135] - [136] 3.81 [137] -
Source: author’s work. The Perception of Service Quality of
Different Demographic Groups TS quality is perceived differently by
passengers according to their demographic background. For a comprehensive assessment of the TS quality by the formulas (1, 2), integrated
indices of the service quality were calculated, the values of which in the context of different categories of respondents are shown in Figures 1, 2.
Figure 1: The perception of service quality of different age and career groups. Source: author’s work.
The results show that customers of different
ages have different assessments of the service quality of the two types of taxis. Young people tend to evaluate the app-based TS with a higher score because they are familiar with technological applications. Meanwhile, seniors in general find ride-hailing application rather complicated to use. Besides, other information
resources that this ride-hailing application provides, which are considered useful, are not exploited much by seniors. Customers over 55 rated app-based TS only 3.42 in terms of convenience, while the group under 40 years old rated the attribute at a higher level, 4.24.
Passengers with different occupations show different judgments on TS quality. Specifically,
Development scenarios for the taxi services market… Pham Thi Thanh Hong, Nguyen Thi Thu Thuy
www.ieeca.org/journal 128
while students and the self-employed rated tech-based taxis at a higher average score, officers tend to appreciate traditional TS, probably because traditional taxi firms usually
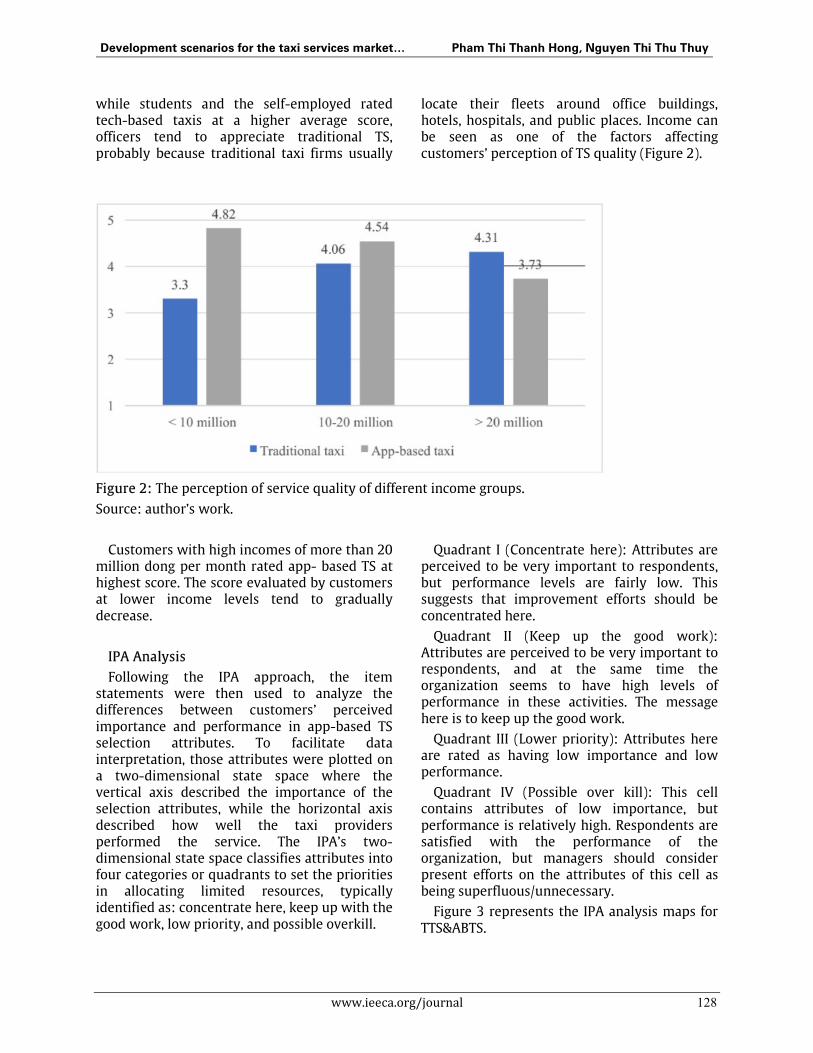
locate their fleets around office buildings, hotels, hospitals, and public places. Income can be seen as one of the factors affecting customers’ perception of TS quality (Figure 2).
Figure 2: The perception of service quality of different income groups.
Source: author’s work.
Customers with high incomes of more than 20 million dong per month rated app- based TS at highest score. The score evaluated by customers at lower income levels tend to gradually decrease.
IPA Analysis Following the IPA approach, the item
statements were then used to analyze the differences between customers’ perceived importance and performance in app-based TS selection attributes. To facilitate data interpretation, those attributes were plotted on a two-dimensional state space where the vertical axis described the importance of the selection attributes, while the horizontal axis described how well the taxi providers performed the service. The IPA’s two-dimensional state space classifies attributes into four categories or quadrants to set the priorities in allocating limited resources, typically identified as: concentrate here, keep up with the good work, low priority, and possible overkill.
Quadrant I (Concentrate here): Attributes are perceived to be very important to respondents, but performance levels are fairly low. This suggests that improvement efforts should be concentrated here.
Quadrant II (Keep up the good work): Attributes are perceived to be very important to respondents, and at the same time the organization seems to have high levels of performance in these activities. The message here is to keep up the good work.
Quadrant III (Lower priority): Attributes here are rated as having low importance and low performance.
Quadrant IV (Possible over kill): This cell contains attributes of low importance, but performance is relatively high. Respondents are satisfied with the performance of the organization, but managers should consider present efforts on the attributes of this cell as being superfluous/unnecessary.
Figure 3 represents the IPA analysis maps for TTS&ABTS.

Development scenarios for the taxi services market… Pham Thi Thanh Hong, Nguyen Thi Thu Thuy
www.ieeca.org/journal 129
Traditional TS App-based TS
Figure 3: The IPA analysis maps. Source: author’s work.
The attributes with the highest score of
importance for each dimension are: Q1 on tangibility, Q6 on reliability, Q12 on convenience, Q16 on safety, and Q20 on empathy. The attributes with the lowest score of importance for each dimension are: Q2 on tangibility for app-based TS and Q3 for traditional TS, Q8 on reliability, Q11 on convenience, Q14 on safety, and Q19 on empathy. Overall, convenience ranks first in terms of average importance score (3.88), while empathy has the lowest average score (2.29 for traditional TS and 2.30 for app-based TS). Reliability and service price are evaluated as second and third. The importance scores obtained considerably support the highest influence of those predictors on customers’ satisfaction in the regression results. While
customers highly appreciate firms’ attentiveness and promptness in dealing with their questions, requests, problems and complaints, they seem to not seek so much for personal attention and good communication from the driver.
Development Scenarios of TTS&ABTS Improving the quality of the highest priority
for the consumer elements that form the "Concentrate here" quadrant will contribute to customer satisfaction growth and industry development. But besides internal factors, which are determined by TS and are reflected in the quality of services, external factors have an impact on the development opportunities of traditional TS and app-based TS (Table 3).
Table 3: Degree of risks/opportunities for TTS&ABTS
Indicator
Assessment of degree, scores
Probabilities of assignment to levels Indicator’s importance Traditional
TS App-based
TS Traditional TS App-based TS
F1 3.1 3.8 μL=0.25; μM=0.75 μM=1 0.06 F2 2.6 3 μL=0.65; μM=0.33 μL=0.33; μM=0.67 0.08 F3 3.1 2.5 μL=0.25; μM=0.75 μL=0.75; μM=0.25 0.05 F4 4.2 4.9 μM=1 μM=0.75; μH=0.25 0.08

Development scenarios for the taxi services market… Pham Thi Thanh Hong, Nguyen Thi Thu Thuy
www.ieeca.org/journal 130
Table 2: Continued F5 3.9 3.1 μM=1 μL=0.25; μM=0.75 0.08 F6 4.2 4.7 μM=1 μM=0.92; μH=0.08 0.12 F7 5.1 5.2 μM=0.58; μH=0.42 μM=0.50; μH=0.50 0.12 F8 6.1 6.5 μH=1 μH=1 0.13 F9 3.2 μL=0.17; μM=0.83 4.18 F10 4.9 μM=0.75; μH=0.25 6.77 F11 3.1 μL=0.25; μM=0.75 6.37 F12 1.3 3.6 μL=1 μM=1 0.10
Scores of the degree of risks/opportunities for
traditional TS compared to app-based TS revealed a more significant impact of such risks as competition with other types of passenger transportation, a lower degree of safety in general and anti-epidemiological safety in particular and the negative impact of multinational corporations' participation in the market. The advantage of traditional TS compared to an app-based TS is its lower cost.
DISCUSSION AND CONCLUSION
This study has developed an approach to forecasting the development of the TS market together with traditional taxis in Vietnam and technology platforms for ordering TS online. The advantage of the proposed approach is the possibility to assess service quality and prioritize services to satisfy consumers (customers) in order to improve the service quality of national taxi companies and increase competitiveness. The approach is based on the econometric model of integrated assessment, IPA analysis, which helped to develop TM scenarios with the functioning of existing taxi operators in modern conditions, given the market risk factors and the TM development potential in Vietnam. This approach is applicable both for assessing the TS market as a whole and its segments, such as TTS&ABTS, as demonstrated by the study’s results. Depending on the evaluated factors, scenarios of TM development can be short-term, medium-term, or long-term.
The research has revealed that for TTS&ABTS a scenario of preservation of market positions has the highest probability. It does not involve significant changes in the TS market structure in the medium term as a result of external factors. The probability of this scenario for traditional TS
was 60.06%, and for app-based, 65.57%. The scenario probability of controlled market segment expansion, assuming the predominant impact of positive factors, was 25.80% for traditional TS, and 34.43% for app-based. For app-based TS, the simulation results do not reveal a significant impact of destabilizing factors that could lead to a market share reduction. The corresponding scenario probability is estimated at 0%. The probability of market share reduction for traditional TS was 14.14% due to lower competitiveness compared to app-based. Realizing the development potential of this service is possible with an increase in customer satisfaction with such components of service quality as compliance with the general terms of service, providing complete information about trips, a broad regional representation of TS, providing information about drivers and improving their skill, all of which are priorities for customers. Therefore, it seems advisable for the regulatory authorities in Vietnam to not restrain app-based TS, but to stimulate traditional TS to improve the quality of services.
The study has some limitations, however. The sample is mainly from Hanoi, so it cannot represent the whole of Vietnam, nor the evaluation of quality by customers in developed countries.
ACKNOWLEDGEMENTS We wish to thank the team of the Journal of
Eastern European and Central Asian Research for their insightful and valued comments. We are also very grateful to the Autonomous Non-Profit Organization “Publishing House Scientific Review”, Russia, for providing free access for data to make scientific research and for technical support and academic editing.
Development scenarios for the taxi services market… Pham Thi Thanh Hong, Nguyen Thi Thu Thuy
www.ieeca.org/journal 131
REFERENCES Azudin, N., Norhashim, M., & Nachiappan, G.
(2018). Service quality of Uber in a small city: a case study of Ipoh Uber drivers. Journal of Advanced Research in Business, 2(1), 19–25. http://dx.doi.org/10.1018/j.jarims.2018.10.018
Esmailpour, J., Aghabayk, K., Vajari, M., & De Gruyter, C. (2020). Importance – Performance Analysis (IPA) of bus service attributes: a case study in a developing country. Transportation Research Part A: Policy and Practice, 142, 129–150. https://doi.org/10.1016/j.tra.2020.10.020
Fang, H., & Shen, Z.J.M. (2015). Modeling taxi services with smartphone-based e-hailing applications. Transportation Research Part C: Emerging Technologies, 58, 93–106. https://doi.org/10.1016/j.trc.2015.06.023
Flandoli, F., Luo, D., & Ricci, C. (2021). A numerical approach to Kolmogorov equation in high dimension based on Gaussian analysis. Journal of Mathematical Analysis and Applications, 493(1), 124505. https://doi.org/10.1016/j.jmaa.2020.124505
Hair, J.F., Hult, G.M., Ringle, C.M., & Sarstedt, M. (2017). A primer on partial least squares structural equation modeling (PLS-SEM). Thousand Oaks, CA: Sage Publications. https://us.sagepub.com/en-us/nam/a-primer-on-partial-least-squares-structural-equation-modeling-pls-sem/book244583#preview
Hashim, Y. (2010). Determining sufficiency of sample size in management survey research activities. International Journal of Organisational Management and Entreprenuership Development, 6, 119–130. https://www.researchgate.net/publication/259822166_DETERMINING_SUFFICIENCY_OF_SAMPLE_SIZE_IN_MANAGEMENT_SURVEY_RESEARCH_ACTIVITIES
Jae, K. (2015). How to choose the level of significance: a pedagogical note. https://mpra.ub.uni-muenchen.de/66373/
Leong, L.-Y., Hew, T.-S., Lee, V.-H., & Ooi, K.-B. (2015). An SEM–artificial-neural-network analysis of the relationships between SERVPERF, customer satisfaction and loyalty among low-cost and full-service airline. Expert Systems with Applications, 42(19),
6620–6634. https://doi.org/10.1016/j.eswa.2015.04.043
McKenzie, B. (2015). Perspectives on retail service quality: findings from the Baltic states. Journal of Eastern European and Central Asian Research, 2(2), 10. https://doi.org/10.15549/jeecar.v2i2.105
Megits, N., Neskorodieva, I., & Schuster, J. (2020). Impact assessment of the COVID-19 on trade between Eastern Europe and China. Journal of Eastern European and Central Asian Research, 7(3), 385–399. https://doi.org/10.15549/jeecar.v7i3.579
Mensah, I., & Ankimah, P. (2018). Taxi service quality and satisfaction among commuters in the Accra metropolitan area. Aussie-Sino Studies, 4(4), 1–9. https://www.researchgate.net/publication/331558354_Taxi_Service_Quality_And_Satisfaction_Among_Commuters_In_The_Accra_Metropolitan_Area
Ministry of Transport of Vietnam. (2016). Decision No. 24/QD-BGTVT. https://thuvienphapluat.vn/van-ban/Cong-nghe-thong-tin/Quyet-dinh-24-QD-BGTVT-thi-diem-ung-dung-khoa-hoc-cong-nghe-quan-ly-van-tai-hanh-khach-theo-hop-dong-306217.aspx
Mordor Intelligence. (2021). Vietnam taxi market - growth, trends, COVID-19 impact, and forecasts (2021–2026). https://www.mordorintelligence.com/industry-reports/vietnam-taxi-market
Nguyen-Phuoc, D.Q., Tran, A.T.P., Nguyen, T.V., Le, P.T., & Su, D.N. (2021). Investigating the complexity of perceived service quality and perceived safety and security in building loyalty among bus passengers in Vietnam – a PLS-SEM approach. Transport Policy, 101, 162–173. https://doi.org/10.1016/j.tranpol.2020.12.010
Orlova, L.V., Sakhabieva, G.A., Vasyaycheva, V.A., & Pronina, N.N. (2016). Impact of educational attainment on the development of female entrepreneurship in Kazakhstan. Indian Journal of Science and Technology, 9(11), 197–204. https://doi.org/10.17485/ijst/2016/v9i11/89426
Pamucar, D., Yazdani, M., Montero-Simo, M.J., Araque-Padilla, R.A., & Mohammed, A. (2021). Multi-criteria decision analysis

Development scenarios for the taxi services market… Pham Thi Thanh Hong, Nguyen Thi Thu Thuy
www.ieeca.org/journal 132
towards robust service quality measurement. Expert Systems with Applications, 170, 114508. https://doi.org/10.1016/j.eswa.2020.114508
Paronda, A.G.A., Regidor, J.R.F., & Napalang, M.S.G. (2017). Comparative analysis of transportation network companies (TNCs) and conventional taxi services in Metro Manila. In Proceedings of 23rd Annual Conference of the Transportation Science Society of the Philippines. https://vdocuments.mx/comparative-analysis-of-transportation-network-companies-tncs-.html
Pham, A. (2018). Going digital: from innovation to inclusive growth in Vietnam. Jaipur: CUTS International. https://www.academia.edu/37548607/Going_Digital_From_Innovation_to_Inclusive_Growth_in_Vietnam_pdf
Rasheed, H., & Sherali, Z. (2019). Autonomous cars: research result, issues, and future challenges. IEEE Communications Surveys & Tutorials, 21(2), 1275–1313.
ReportLinker. (2019). Vietnam taxi market - growth, trends, and forecast (2019–2024). https://www.reportlinker.com/p05786676/Vietnam-Taxi-Market-Growth-Trends-and-Forecast.html
Semin, A., Vasiljeva, M., Sokolov, A., Kuznetsov, N., Maramygin, M., Volkova, M., Zekiy, A., Elyakova, I., & Nikitina, N. (2020). Improving early warning system indicators for crisis manifestations in the Russian economy. Journal of Open Innovation: Technology, Market, and Complexity, 6(4), 171. https://doi.org/10.3390/joitmc6040171
Shen, J., Qiu, F., Zhang, X., & An, C. (2015). Demi-flexible operating policies to promote the performance of public transit in low-demand areas. Transportation Research Part A: Policy and Practice, 80, 215–230. https://doi.org/10.1016/j.tra.2015.08.003
Statista. (2021). Ride-hailing & taxi. https://www.statista.com/outlook/368/127/ride-hailing-taxi/vietnam
Suhami, M., Talib, S., Bachok, S., & Saleh, M. (2018). Service attributes, customer satisfaction and return usage: a case of Uber Malaysia. Journal of Tourism, Hospitality &
Culinary Arts, 10(2), 81–103. https://fhtm.uitm.edu.my/images/jthca/Vol10Issue2/Chap-7.pdf
Taherdoost, H. (2019). What is the best response scale for survey and questionnaire design; review of different lengths of rating scale / attitude scale / Likert scale. International Journal of Academic Research in Management, 8(1), 1–10. http://elvedit.com/journals/IJARM/archive/volume-08-2019/
Tien, N.H., Ngoc, N.M., & Anh, D.B.H. (2020). Sustainability of coastal tourism development: comparative analysis of Vietnam's Northern and Southern provinces. Journal of Southwest Jiaotong University, 55(6). https://doi.org/10.35741/issn.0258-2724.55.6.35
Wong, R.C.P., Szeto, W.Y., Yang, L., & Wong, S.C. (2018). Public transport policy measures for improving elderly mobility. Transport Policy, 63, 73–79.
Yen, N.T.H., Hung, N.T., Duc, L.D.M., Thuy, V.H.N., & Thuy, N.T.M. (2020). Factors affecting real estate prices – evidence from macroeconomic data in Vietnam. Journal of Southwest Jiaotong University, 55 (4). http://jsju.org/index.php/journal/article/view/710
ABOUT THE AUTHORS
Nguyen Thi Thu Thuy, email: [email protected]
Dr. Pham Thi Thanh Hong is an Associate Professor. She currently works at the School of Economics and Management of the Hanoi University of Science and Technology, Vietnam. Her research interests include service management, digital economy, and digital transformation.
Dr. Nguyen Thi Thu Thuy currently works at the School of Economics and Management of the Hanoi University of Science and Technology, Vietnam. Her research interests include economics, consumer behavior, and digital economy.