Embed Size (px)
Citation preview
The Pennsylvania State University
The Graduate School
The College of Health and Human Development
DEVELOPMENTAL ASPECTS OF TASK PERSISTENCE AND ITS
RELATIONSHIP WITH READING SKILLS
A Dissertation in
Biobehavioral Health
by
Saradha Ramesh
© 2008 Saradha Ramesh
Submitted in Partial Fulfillment of the Requirements
for the Degree of
Doctor of Philosophy
May 2008
The thesis of Saradha Ramesh was reviewed and approved* by the following:
Gerald E. McClearn Evan Pugh Professor of Health and Human Development and Biobehavioral Health Chair of Committee
Stephen A. Petrill Professor of Human Development and Family Science The Ohio State University Special Member Thesis Advisor
George P. Vogler Professor of Biobehavioral Health
David J. Vandenbergh Associate Professor of Biobehavioral Health Research Associate, The Center for Development and Health Genetics Neuroscience Faculty, The Neuroscience Institute, The Huck Institutes for the Life Sciences
Susan McHale Professor of Human Development and Family studies
Byron C. Jones Professor of Biobehavioral Health Professor in Charge of the Graduate Program
*Signatures are on file in the Graduate School
iii
ABSTRACT
In this study, the etiology of stability and change in task persistence and also the
relationship of task persistence with reading related skills were examined using a twin
sample (N=367 pairs) from a longitudinal Western Reserve Reading project. Twins were
in kindergarten or first grade during the first assessment, and they were followed every
year for cognitive and behavioral assessments. This study was based on three waves of
assessments. A task persistence composite was formed from teacher and tester ratings of
the children’s behavior observed at classroom and at home. Multivariate developmental
genetic models were used to examine the genetic and non-genetic contributions to
stability and change in task persistence. The findings suggested that genetic factors
contributed to stability, and change was substantially due to nonshared environmental
influences unique to individuals along with age-specific genetic influences at an earlier
occasion. Quantitative differences in the genetic and environmental influences on task
persistence were observed between boys and girls. In addition, relationships between task
persistence, reading-related skills and general cognitive ability were modest. The
relationships were mainly through genetic links and to some extent through nonshared
environmental effects.
iv
TABLE OF CONTENTS
LIST OF FIGURES………………………………………………………………………vi
LIST OF TABLES…………………………………………………………………..…...vii
ACKNOWLEDGEMENTS………………………………………………………….…..ix
Chapter 1 INTRODUCTION ..................................................................................................1
Psychological aspects of task persistence........................................................................1 Psychobiological aspects of Effortful control.................................................................2
Developmental course...............................................................................................2 Gender........................................................................................................................3 Neuroscience.............................................................................................................3 Molecular Genetics....................................................................................................4
Task Persistence: Developmental quantitative genetics perspective.............................5 Task persistence: Stability and change.....................................................................7
Relationship between task persistence and reading skills............................................11 Statement of problem......................................................................................................17 Objectives of the study...................................................................................................19 Significance of the study................................................................................................20
Chapter 2 METHODS ...........................................................................................................22
Sample and procedure.....................................................................................................22 Measures..........................................................................................................................24
Task persistence.......................................................................................................24 General cognitive ability.........................................................................................28 Reading related skills..............................................................................................28
Analytic methods.............................................................................................................30 Quantitative genetic models...........................................................................................31
Longitudinal models to assess stability and change..............................................31 Analysis with reading related skills........................................................................34
Statistical models..........................................................................................................34 Cholesky model.......................................................................................................34 Common factor independent pathway model........................................................36 Simplex model.........................................................................................................37 Latent growth curve model.....................................................................................38
v
Sex Difference analyses..................................................................................................40 Model fitting ...................................................................................................................42
Chapter 3 RESULTS..............................................................................................................44
Descriptive Statistics.......................................................................................................44 Genetic analyses..............................................................................................................45
Saturated model: Cholesky decomposition............................................................47 Longitudinal analyses..............................................................................................51
Independent pathway model............................................................................51 Simplex.model..................................................................................................52 Latent growth curve model..............................................................................55
Heterogeneity..................................................................................................................57 Analysis with reading related skills...............................................................................59
Task persistence and letter identification.............................................................. 61 Task persistence and word identification...............................................................62 Task persistence and word attack...........................................................................62 Task persistence and phonological awareness.......................................................63 Task persistence and expressive vocabulary..........................................................63 Task persistence and general cognitive ability......................................................64 Task persistence and reading comprehension........................................................64
Chapter 4 DISCUSSION........................................................................................................65
Stability and change........................................................................................................65 Sex differences................................................................................................................70 Relationship between task persistence and reading related skills................................71
Chapter 5 CONCLUSIONS...................................................................................................74
Limitations.......................................................................................................................74 Implications.....................................................................................................................77
BIBLIOGRAPHY...................................................................................................................80
vi
LIST OF FIGURES
Figure 1: Cholesky decomposition model for one twin ....................................................35
Figure 2: Common factor independent pathway model for one twin in a pair..................36
Figure 3: Simplex model....................................................................................................37
Figure 4: Growth curve model for one twin in a pair .......................................................39
Figure 5: Heterogeneity model for monozygotic females ................................................41
vii
LIST OF TABLES
Table 2-1: Descriptive data of items in the task persistence composite............................26
Table 2-2: Factor loadings (varimax rotation) on items of task persistence factor...........27
Table 3-1: Descriptive Statistics of Task Persistence Scores by Zygosity........................44
Table 3-2: Descriptive Statistics of Task Persistence Scores by Sex................................45
Table 3-3: Within-Wave and Cross-Wave Twin correlations of Task Persistence Scores
.............................................................................................................................46
Table 3-4: Standardized Path Coefficients from Cholesky model of Task
Persistence..........................................................................................................................48
Table 3-5: Genetic, Shared and Nonshared Environmental Variances and Correlations of
Task Persistence from a Cholesky Decomposition Model................................................50
Table 3-6: Path Coefficients of Independent Pathway Model with Confidence
Intervals…………………………………………………………………………………..52
Table 3-7: Genetic, shared and nonshared environmental path coefficients of a Simplex
model with confidence intervals in brackets......................................................................53
Table 3-8: Model fitting results of linear growth model....................................................55
Table 3-9: Genetic and environmental sources of variance from latent growth model with
age and sex as covariates...................................................................................................56
Table 3-10: Model fitting results of sex differences in task persistence ..........................57
viii
Table 3-11: Parameter estimates of genetic, shared and nonshared environmental variance
components heterogeneity (AE) model in all occasions and ACE model for females in
Wave 2...............................................................................................................................58
Table 3-12: Heritability, shared environmental and nonshared environmental estimates of
task persistence and reading related skills.........................................................................60
Table 3-13: Genetic, shared and environmental covariances of task persistence with
reading related skill with confidence intervals in brackets................................................61
Table 3-14: Genetic, shared environmental and nonshared environmental correlations of
task persistence with reading related variables in Wave 1, 2 and 3...................................63
ix
ACKNOWLEDGEMENTS
It is difficult to overstate my gratitude to my Ph.D. advisor Dr. Stephen A.Petrill,
for his guidance, understanding and patience. Throughout my thesis-writing period, he
encouraged me to develop independent thinking and research skills. In that same vein, I
would like to thank my committee members Prof. Gerald E.McClearn,
Prof. George P.Vogler, Prof. Susan McHale and Dr. David J.Vandenbergh for reading
and providing many invaluable suggestions that have helped to improve the contents of
this dissertation.
I am indebted to many individuals in BBH department, who have helped me
either directly or indirectly during my stint at the Penn State. Special thanks are due to
Ms. Elana Pyle, Ms. Carol Brytczuk and Ms. Shannon Seiner for assisting me in
administrative matters.
I am grateful to my colleagues and friends, especially to Brian Saltsman and Sara
Ann Hart, for providing a stimulating and fun environment to learn and grow. Without
them, I could not have completed the graduate studies before long. I can’t thank enough
my good friend Clinton Colaco for all his support, advice and encouragement in both
professional and personal matters.
Last, but not least, I wish to thank my husband, Ramesh Peelamedu and my
daughter, Yazhini Ramesh for their understanding and love. My Mother, Srilakshmi and
my brother, Sarathi receive my deepest gratitude and love for having faith in me. I am
dedicating this work to late Dr. T.J.Cherian, who used to be a guide and philosopher and
still is.
Chapter 1
INTRODUCTION
Although there are considerable individual differences in the way preschool
children approach tasks, it is thought that children who persist at their work are likely to
learn more and perform better in school than children who do not (Karnes, Johnson,
Cohen & Shwedel, 1985). Task persistence is an aspect of self-regulation, cognition, and
behavior (Deater-Deckard, Petrill, Thompson, & DeThorne, 2005). It seems to have
significant influence on child competence, from self-regulation to cognitive performance
(McCartney & Berry, 2005).
Psychological aspects of task persistence
Task persistence, an aspect of self-regulation, includes the related constructs of
attentional orientation, concentration, continuance of difficult tasks, and sustained task
effort (Charak, 2000). Task persistence is conceptually similar to Rothbart’s effortful
control (1989), which is an aspect of temperament. Effortful control is the ability to
perform a subdominant response while ignoring a dominant response (Rothbart & Bates,
1998). This control is achieved by attention regulation (or attentional control) and
behavioral regulation (or inhibitory control). This capacity enables children to improve
their skills by deploying more attention if needed and planning more efficient strategies
for coping, thus regulating their behavior voluntarily (Ruff & Rothbart, 1996). Therefore,
2
effortful control can be viewed as a part of executive attention systems and the self-
regulation aspect of temperament as well. Also, one of the components of effortful
control, executive attention, is functionally related to a broad system of executive
functions (Reuda, Posner, & Rothbart, 2005), which encompass a number of cognitive
processes such as working memory, inhibitory control etc. These are central to self-
regulation and goal directed activities (Blair, Zelazo, & Greenberg, 2005). Deficits in
executive functioning especially in temperamental regulation or effortful control are
reported in children with attention deficit hyperactive disorder (Barkley, 1997) and also
in other behavioral disorders (Kochanska, 1991; Rothbart & Bates, 1998) such as the
externalizing of problems (Valiente et al., 2003).
Psychobiological aspects of Effortful control
Developmental course
Effortful control emerges between 6-12 months of age along with the maturation
of attention mechanisms linked to the anterior attention networks (Rothbart, Derryberry,
& Posner, 1994). Effortful control continues to develop during toddler and preschool
period. At this stage of maturation, attention abilities can be seen as the ability to inhibit
forbidden behaviors (Rothbart & Putnam, 2002). In a recent study (2000), Kochanska,
Murray & Harlan assessed effortful control in children at 22 and 33 months. They
examined all effortful control functions such as delaying, slowing down motor activity,
suppressing initiating activity to a signal, employing effortful attention, and lowering
3
voice. Results of the study suggested that effortful control considerably improved
between 22 and 33 months. Beginning at age two and a half, effortful control continues to
develop throughout the preschool period and later becomes stable (Rothbart & Putnam,
2002).
Gender
Gender differences in effortful control are another interesting feature. In the
above-mentioned Kochanska, Murray & Harlan study (2000), gender differences in
behavioral tasks that test effortful control functions were also examined. Results
suggested gender differences in effortful control, as girls outperformed boys in many
behavioral tasks. Similar results were documented in a meta-analytic review (Else-Quest,
Hyde, Goldsmith, & Van Hulle, 2006). The review has reported gender difference in
temperament. Effortful control showed a significantly larger difference, favoring girls.
The differences noticed in the effortful control behavior were manifested as differences in
their learning approach. These differences in their learning approach explain about two-
thirds of female advantage in literacy learning (Ready, LoGerfo, Burkam, & Lee, 2005).
However, the etiology of gender difference in effortful control is not known.
Neuroscience
Effortful control is related to the activation of the midline frontal brain (Posner &
Raichle, 1994; Gusnard, Akbudak, Sulman, & Raichle, 2002). Brain research has been
4
able to identify critical brain regions whose activity and development directly relates to
the performance and development of effortful control (Bush, Luu & Posner, 2000).
Neuroimaging studies clearly identified the anterior cingulate cortex (ACC) as one of the
main nodes of executive attention networks. In particular, the dorsal ACC is involved in
cognitive conflict tasks (Fan, McCandliss, Sommer, Raz, & Posner, 2002) and the rostral
ACC is involved in affect-related tasks (Pizzagalli, Peccoralo, Davidson, & Cohen,
2006). Although all human beings share similar anatomical attention networks,
differences in the efficiency of networks lead to individual differences in effortful
control. These individual differences arise from complex gene-environment processes.
Molecular Genetics
Quantitative genetics studies have established high genetic influence (h2=.58) on
effortful control (Goldsmith, Buss & Lemery, 1997). Information about types of attention
networks, brain regions involved in attention requiring tasks, and neurotransmitters that
modulate the activity of those areas and high heritability of the trait guided the search for
candidate genes of executive attention and its function (Fan, Wu, Fossella, & Posner,
2001). A Fossella et al. (2002) study in a sample of adults aged 18-50 years old has
shown that variations in executive attention are related to genetic polymorphisms in
candidate genes that influence the dopaminergic neurotransmitter system. Another study
(Reuda, Rothbart, McCandliss, Saccomanno & Posner, 2005) conducted in a sample of 4-
year-old and 6-year old children also confirmed the association of long form of DAT1
gene with better effortful control. In addition, the efficiency of attention networks was
5
examined by comparing a control group with an experimental group. Children in the
experimental group received attention training for 5 days, after which improvement in
performance was clearly evident. The experimental group improved in reaction time in
the solving of conflict tasks, and electrophysiological data. EEG recordings showed a
more mature pattern, similar to adults, when children participated in the same conflict
tasks. This study is evidence for the fact that environmental factors can bring changes in a
trait that appears to be highly genetically influenced.
Taken together, neurobiological findings suggest that effortful control undergoes
developmental changes, such as changes within organisms across age (McCall, 1981)
where there are individual differences in development. However, the etiological factors
underlying such developmental changes are unknown.
Task persistence: developmental quantitative genetics perspective
The main focus of developmental theory is to elucidate the mechanisms by which
person-environment transactions influence individual development (e.g. Baltes & Smith,
2004). Such developmental processes are associated with quantitative and qualitative
changes that lead to differences in the individual’s behavior. There is now a general
consensus in the field of developmental psychology that nature (genetics) as well as
nurture (environment) and interactions between them shape behavioral development
(Plomin, 2004; Partridge, 2005). Quantitative genetics is the study of genetic and
environmental factors that create behavioral differences among individuals (Plomin,
1990). Adoption and twin designs are commonly used methods for studying human
6
behavior, used to assess the extent of genetic and environmental factors influencing
behavior, which is an initial step to understand the etiology of individual differences. The
theory and methods of quantitative genetics can be applied to an interdisciplinary field,
developmental behavioral genetics to address developmental questions such as causes of
stability versus change in a behavior, the extent to which genetic and environmental
factors are common to two or more traits, and the interplay between genes and
environment (Plomin, 2004).
In a recent study of 3.5 year old twins from a population-based British sample,
Petrill & Deater-Deckard (2004) formed a task persistence composite from four variables
measuring task orientation: (1) A number of completed trials of simple-choice reaction
time by a twin in the lab reported as a measure of task orientation; (2) Two tester rated
items measuring attention and persistence of a twin using the Bayley Infant Behavior
record during a home visit; and (3) An observer ratings of the child’s attention and
persistence using the Parent-Child Interaction system of global ratings (Deater-Deckard,
2000) after watching the videotape of mother-child interactions from the home visit.
Exploratory factor analysis of task persistence composite variables yielded a single factor
with high correlations between the variables. The composite score was standardized
before conducting quantitative genetics analyses. The findings of this study demonstrated
modest genetic (h2=.37) and shared environmental influences (c2=.25) on task
persistence. However, genetic and environmental sources as well as the magnitude of
these influences may vary at different ages. Age related changes in task persistence may
occur as a result of many developmental processes. In general, an individual’s task
persistence development trajectory may be associated with normative brain maturation,
7
formal schooling, and aspects of family socialization. Further, since these processes tend
to be unique for each individual, task persistence development is not only associated with
these processes, but also with individual differences. It is therefore important to study
both overall trends in development as well as individual developmental trajectories of
task persistence. Moreover, it is necessary to integrate the contributions of nature and
nurture to study developmental change as well as stability in individual differences in
behavior.
Task persistence: Stability and change
As was mentioned earlier, task persistence is conceptually and functionally
similar to a psychological construct, effortful control. The similarities between task
persistence and effortful control are evident in the following ways: (1) The abilities to
focus, to sustain attention and to regulate behavioral impulses to persist on challenging
tasks, have been studied as indexes of effortful control (Zhou, Hofer, Eisenberg, Reiser,
Spinrad, & Fabes, 2007). Similarly, those indices have been used to measure task
persistence (Petrill & Deater-Deckard, 2004). (2) The ability of conflict regulation in
cognitive tasks is related to effortful control as measured by parent report (Rothbart,
Ellis, Reuda & Posner, 2003). The measurement of task persistence is based on the
behavioral reports by teachers, testers, and observers, which is within the theoretical
perspective of effortful control. (3) Similar to effortful control, task persistence brings
about changes in many domains of functioning including cognition, temperament, and
behavior (McCartney & Berry, 2005). (4) Rothbart’s model shows the developmental
8
changes in effortful control and integrates them with an individual difference approach
(Kochanska, Murray & Harlan, 2000). Developmental changes as well as individual
differences were observed in task persistence, as demonstrated in the Deater-Deckard et
al. (2006) study. (5) Heredity and experience play an important role in effortful control as
well as in task persistence (Borkenau, Riemann, Angleiter, & Spinath, 2001; Petrill &
Deater-Deckard, 2004; Deater-Deckard et al., 2005). Due to the similarities between
effortful control and task persistence, extensive phenotypic research in effortful control
was used as a basis for further behavior genetic studies on task persistence.
Phenotypic studies demonstrate that the substrate for effortful control emerges at
6-12 months of age and develops significantly over the toddler and preschool years
(Rothbart et al, 2003). This trait continues to develop up to age 7-8 and then maintains
stability until adulthood. It is not possible to identify the factors underlying the changes
in development solely on the basis of non-behavioral genetic studies. Because of this,
developmental behavior genetic studies are required. Developmental behavior genetics
considers two types of developmental change: heritability changes and age-to-age genetic
change and continuity (Plomin, 1986). Heritability, a measure of genetic variance, can
change as genetic and environmental systems come into play during development. Age-
to-age genetic correlations refer to the extent to which genetic factors overlap over time.
Genetic change is implicated when the genetic effects at two ages does not covary. The
meaning of stability and change and how those changes are assessed in quantitative
genetics will now be explained.
The biological origin and early appearance of a trait do not imply that a trait will
be stable (Buss & Plomin, 1984). Trait stability is usually indexed by correlations
9
between trait scores across two points in time (rank-order stability), which reflect the
degree to which the relative ordering of individuals on a given trait is maintained.
Maturational or historical processes shared by a population can cause changes in a trait.
Over time, these processes could cause change in the overall mean level of specific traits.
Measurement of mean-level differences over time will indicate whether the sample as a
whole is increasing or decreasing on a trait (Caspi, Roberts & Shiner, 2005). Generally,
stability (same rank order over time) is conceptually independent of change over time
(changes in mean level).
The periodic activation and inactivation of regulatory genes and the
environmental differences in experience are sources of stability as well as change in
development. If the genes that affect a trait during childhood overlap with those genes
that influence the same trait during adulthood, then there will be stability from childhood
and into adulthood. Conversely, if the set of genes influencing a trait at one age differs
from the set of genes affecting the same trait at another age either qualitatively or
quantitatively, then the difference will contribute to the instability of a trait. Similarly,
environmental influences contribute to the stability or instability of a trait over time. The
genetic correlation, which measures the extent of the overlap between genes, and
environmental correlation, which measures the extent of overlap between environments
that affect a trait over time, help to determine the stability of a trait (Plomin & DeFries,
1981). Such assessments are only possible if longitudinal quantitative genetic data are
available.
Deater- Deckard et al. (2006) examined task persistence applying this correlation
method to assess the stability and change in the individual differences of task persistence
10
using the available two wave longitudinal data from the Western Reserve Reading project
(WRRP). Using the twin sample from WRRP, Deater-Deckard et al., (2005) formed a
task persistence construct similar to the construct created in Petrill et al.’s 2004 study.
They used assessments from teachers, testers, and observers on attention and persistence,
which demonstrated not only a developmental shift in task persistence from non-genetic
to genetic variance, but also showed an increase in genetic variance in 4-8 year-old-twins.
In a subsequent study by Deater-Deckard et al. (2006), it was shown that genetic
influences accounted for the stability while nonshared environment, which indicates twin
dissimilarity, accounted for the change observed in task persistence across the two waves
of measurement. Several other quantitative genetic studies also have shown stability in
individual differences in attention and persistence over time (Gagne, Saudino & Cherny,
2003; Goldsmith, Buss & Lemery, 1997). In Price et al. (2005) study of stability of
ADHD symptoms in preschool children with ADHD, genetic factors accounted for about
91% of the stable variance in ADHD symptoms.
Neither traditional mean-level analyses nor stability coefficients have been able to
capture individual patterns of change. However, either recent multilevel modeling or
individual growth curve modeling (Bryk & Raudenbush, 1987) can be used to examine
individual patterns of change over time. Using this approach, Halverson & Deal (2001)
examined individual change in persistence in children aged 4 to 7 years and demonstrated
an increase in persistence in individual children over time. In addition, their study shows
that domains of family context along with changes in other dimensions of temperament
explain a significant portion of individual change in persistence.
11
In summary, quantitative genetic research has shown that stability in task
persistence is due to genetic factors. However, little is known about the continuance of
this stability beyond early elementary school age and the etiological factors underlying
individual growth trajectories of task persistence.
Relationship between task persistence and reading skills
Based on the Vygotsky work (1962), David H. Rose and Nicole Strangman
(2007) identified three essential components of learning underlying the Universal Design
of Learning, which is an innovative approach to education. The three components are
recognition, strategy, and affect, and their respective neural substrates are recognition
networks, strategic networks, and affective networks. Recognition networks are important
for recognizing patterns such as patterns of letters and numbers; these networks play a
key role in academic content areas. The differences in structure and function of these
networks as well as the differences in the training and practice explain individual
differences in recognition. Learning is not only dependent on this component but also on
strategic networks. Strategic networks are responsible for the abilities to ignore irrelevant
stimuli, plan, coordinate, self-monitor, and execute actions. Affective networks process
and manipulate the function of recognition and strategic networks. Although these
networks are anatomically and psychologically distinct, they exert influence on every act
of cognition. For example, the act of reading involves not only decoding skills
(recognition), but also understanding the reading material by self-monitoring (strategy,)
and continuation of the act depends on interest or motivation (affect). One of the goals of

12
this study is to examine the association between recognition (reading) and strategic (task
persistence) pattern and to test the underpinnings of the association.
Reading is a learned skill, which involves the recognition and comprehension of
written text. The emergence of this skill occurs in multiple stages and develops as a
collaborative process of biologically rooted language skills, cognitive ability etc. and
appropriate nourishing social environment. Chall (1983) described the development of
reading ability in six stages: Stage 0 Prereading; Stage 1 Emergent Literacy; Stage 2
Confirmations and fluency; Stage 3 Reading for Learning “The New”; Stage 4 Multiple
View Points; Stage 5 Construction and Reconstruction. In Chall’s model, each stage
builds on skills mastered in the previous stages of literacy. The first four stages were
more relevant for the present study as the study consisted of elementary school age twins.
Early reading acquisition helps children to learn in other academic areas (Fyrsten,
Nurmi, & Lyytinen, 2006). Extensive research has been done on the development of
skills required for reading. Early reading depends on knowledge of alphabetical principle,
which is the ability to associate sounds with letters and use these sounds to form words.
Phonological awareness is a prerequisite skill for the development of alphabetical
principle.
There is a substantial body of evidence indicating that phonological processing,
especially phonological awareness, is one of the best predictors of reading acquisition
(Adams & Bruck, 1995; Stanovich, Cunningham & Cramer, 1984; National Reading
Panel, 2000). Phonological awareness refers to the ability to perceive and manipulate the
sounds of spoken words (Goswami & Bryant, 1990) and is a good predictor of word and
non-word reading, and reading comprehension (Torgesen, Wagner & Rashotte, 1997;
13
Ehri, Nunes, Willows, Schuster, Yaghoub-Zadeh, & Shanahan, 2001). Deficit of
phonological processes impedes the acquisition of word reading skills, which in turn
slows down the development of reading fluency (Torgesen, Wagner & Rashotte, 1994;
Wagner, Torgesen, & Rashotte, 1994; Lyon 1995; Catts, 1996). Overall, phonological
awareness, alphabet knowledge and oral language are the three areas that are important at
the emergent stage of literacy.
The next stage is the confirmation and fluency. At this stage, children decode
words fluently and accurately and integrate the syntactic and semantic information in text
to identify words. These word identification processes serve as a foundation for reading
comprehension, which is the next stage of learning the new. This stage occurs at ages 8 to
14 years, and the focus changes from "learning to read" to "reading to learn.” As word
identification becomes an automatic process, attention and working memory resources
can be diverted for integrating text propositions and constructing meaning, which are the
ultimate purposes of reading.
The reading process demands attention from the individual especially in
beginning readers (Hidi, 1995). In particular, attention may modulate the rate and the
extent of activation of word processing routes such as lexical and non-lexical routes
(Herdman, 1992). Hence, individuals are responsible for regulating their internal
processes and directing their attention to the reading task while ignoring other demands
on their attention. Previous research has shown that attention regulation, commonly
referred to as persistence or task orientation, is linked to academic achievement.
Generally, low task persistence is associated with lower academic performance (Martin,
1989; Bramlett, Scott, & Rowell, 2000).
14
Though it is a behavior related to academic achievement, task persistence
influences the development of cognitive skills. In current models of cognition, there is
considerable overlap between the theoretical constructs of task persistence and general
cognitive ability (Anderson, 2001). Many studies of normally developing infants and
toddlers have shown that task persistence accounts for significant variance in general
cognitive ability (Kelley & Jennings, 2003; Banerjee & Tamis-LeMonda, 2006). It has
been shown that task persistence with its characteristic of ignoring irrelevant stimuli
enhances the development of general cognitive ability (Dempster, 1991). Functional
imaging studies have observed prefrontal lobe activation in children during attention
tasks (Casey et al., 1997). This brain region has been implicated in developmental
disorders such as Attention Deficit Hyperactive disorder (ADHD), and reading
disabilities (Lazar & Frank, 1998).
We know that the correlation between reading and processes associated with
reading acquisition, such as general cognitive ability (Lyon, 1989; Naglieri, 2001) and
task persistence (Lundberg & Gorel, 2006), as well as the correlation between reading
related processes such as phonological awareness, decoding, and word recognition, are
typically high in the range of 0.30-0.80, both in normal and reading-disabled children. To
increase our understanding further, examination at the etiological level reveals whether
genetic or environmental factors influence these cognitive skills and also the
commonalities/uniqueness of these influential factors. Quantitative genetics assess the
effects of genes and environment and also quantify the changes in both the specific and
overlapping effects of these influences, either as consequences of development or
15
variations in genes and environment. In addition, the genetic and environmental
covariance among the traits can also be estimated.
Quantitative genetic research has suggested that genetic influences were
predominant in individual differences in reading (Olson, 2007). For example, Byrne et al.
(2002) study showed predominant additive genetic influences and moderate shared
environmental influences on phonological awareness in preschool children enrolled in
International Longitudinal Twin Study (ILTS) of early reading development. They
showed significant genetic influences on reading at the end of kindergarten. Results of a
follow up study (Byrne et al., 2005) of the same twins when they were at the end of first
grade suggested that a single genetic factor accounted for all the genetic variance of
reading and spelling and there was no influence from shared environment, as the project
included samples from Australia, Scandanavia, and the U.S. Similarly, another
independent study (Harlaar, Spinath, Dale & Plomin, 2005) of twins in the U.K. at the
age of 7 estimated high genetic influences on both group deficits and individual
differences in word and non-word reading within the same sample. The Petrill, Deater-
Deckard, Thompson, Schatschneider, DeThorne, & Vandenbergh (2006) study on the
early development of reading and related skills in an Ohio twin sample, reported both
genetic and environmental influences on early reading skills in twins who were in
kindergarten or first grade during the first assessment and in first or second grade during
the second assessment.
Also, in the assessment of the correlation between reading and general cognitive
ability (Harlaar, Hayiou-Thomas, & Plomin, 2005), genetic influences largely accounted
for the covariation between them. The genetic and shared environmental correlations
16
were also high. With respect to task persistence, the Deater-Deckard et al. (2005) study
has also demonstrated a moderate association between task persistence and cognitive
performance or achievement.
Overall, quantitative genetics research has shown that there is an association
between general cognitive ability and reading related skills as well as between general
cognitive ability and task persistence. However, little is known about whether the genetic
and non-genetic effects that influence task persistence also influence general cognitive
ability and reading skills.
Many studies have examined etiology of reading disabilities (RD) and Attention
Deficit Hyperactivity Disorder (ADHD) in school-age children (e.g. Willcutt et al., 2001;
Rucklidge & Tannock, 2002; Willcutt, Pennington, Chhabildas, Olson, & Hulslander,
2005). Among three different types of ADHD, inattentive, hyperactive/impulsive, and
combined type, (Barkley, 1998), the inattentive type has stronger phenotypic relationship
with reading disability. Nearly 95% of this relationship can be attributed to common
genetic influences (Willcutt et al., 2000). Overall, quantitative genetic studies have
provided strong support for the common genetic etiology hypothesis suggesting that
comorbidity between RD and ADHD in school-age children is due to common genetic
influences (Light, Pennington, Gilger, & DeFries, 1995; Willcutt, Pennignton, & DeFries,
2000b). A genetic linkage analysis study in sibling pairs diagnosed with ADHD, along
with RD in at least one individual of a pair (Willcutt, Pennington, Smith, Cardon, Gayan,
Knopik, Olson, & DeFries, 2002), suggested a quantitative trait locus (QTL) for ADHD
on chromosome 6, which is a well replicated QTL region for RD as well. Further
bivariate linkage analysis in the same sample of individuals having both ADHD and RD
17
suggested that comorbidity might be partly due to pleiotrophic effects of a QTL on
chromosome 6p.
Quantitative genetic research suggests that reading disability is the quantitative
extreme of the same genetic and environmental factors responsible for normal variation
in reading ability (Meaburn, Harlaar, Craig, Schalkwyk, & Plomin, 2007). Similar
distribution can be expected for another quantitative trait, task persistence. Since
quantitative genetic studies have established the links between RD and ADHD, which are
the disorders at the extremes of quantitative distribution, it is possible to find the
relationships in normal variations of reading and task persistence. Little research has been
done in finding the contributions of genetic and environmental factors to the relationship
between reading skills and task persistence along a continuum.
Statement of problem
Past research has shown that several factors influence task persistence in complex
ways, and that the sources of influence at different ages may be quite different. For
example, parental warmth has shown to have influence on task persistence behavior in
young children (Deater-Deckard et al., 2005) whereas self-efficacy beliefs determine task
persistence behavior in adults (Pajares, 1996). From an etiological perspective, different
sets of genes have their maximum influence at different times during the lifespan.
Similarly, particular environments can influence individuals at different times during
their lives. There is therefore a need to investigate the growth and change in task
persistence systematically as the child grows and matures. There are few longitudinal
18
studies that have examined the development of task persistence, and still fewer that have
used quantitative genetic designs to study the etiology of the stability and change within
task persistence. This study addresses this gap by using common genetic factor modeling
and genetic simplex modeling to test the hypothesis of genetic continuity in task
persistence in twins. The sample was from an ongoing longitudinal twin study. Twins
were assessed initially when they were in kindergarten or first grade and were followed at
yearly intervals with cognitive and behavioral assessments. Analyses were done for this
study using data from the available three waves of measurements.
Very limited information about change can be derived from the analysis of
correlation or from covariance matrices. In particular, such analysis cannot provide
information about either individual stability or change. To the best of my knowledge,
none of the quantitative genetic studies were designed to describe the individual growth
trajectories of task persistence. This study assesses individual change using a latent
growth curve modeling.
No genetically informed study has examined the association between task
persistence and basic reading skills in a population-based sample. Many studies have
examined the association of general cognitive ability and reading skills (Harlaar et al.
2005) in a population based sample. Moreover, the association of reading skills with
inattention/impulsivity measures was examined in a sample of preschool children
(Willcutt et al. 2007). A recent study (Zumberge, Baker, & Manis, 2007) of 9- to 10-
year-old twins examined the etiology of variation in reading and its association with
inattention. However, studies of relations between normal variation of reading related
19
skills and normal variation of task persistence behavior using longitudinal data have not
been done.
Objectives of the Study
The primary purpose of this study is to examine stability and change in task
persistence using a longitudinal twin study known as Western Reserve Reading project.
This study also seeks to gain an understanding of the factors that may influence the
association between task persistence and reading related skills. The guiding research
questions are: (1) what are the etiological factors that account for the stability and change
in the development of task persistence? (2) What are the factors underlying the
relationship between task persistence and reading related skills?
The specific objectives and hypotheses of this study are:
Aim 1: To examine the etiology of individual differences in task persistence.
Hypothesis 1: Genetic influences will increase and shared environmental
influences will decrease as the child grows older. In addition, there will be unique
nonshared environmental influences.
Aim 2: To assess the stability and change in task persistence across three waves of
assessments.
Hypothesis 2: Genetic factors will explain the stability and nonshared
environmental influences will account for the change.
Aim 3: To describe and analyze the development of task persistence across three
measurement occasions using an individual growth modeling method.
20
Hypothesis 3: Given the development of task persistence as well as exposure to
structured environment such a school setting, recreation centre etc., occur during early
elementary school, there will be an increase in task persistence across measurement
occasions. Genetic influences are primary in terms of variation in intercept whereas
variation in slope should have a larger environmental component.
Aim 4: To identify the quantitative differences in task persistence due to sex
effects.
Hypothesis 4: As shown in previous research, there will be a sex difference in
task persistence which will manifest as differences in the magnitude of genetic and
environmental influences.
Aim 5: To assess the association between task persistence and reading related
skills.
Hypothesis 5: There will be moderate correlations between task persistence and
reading related skills through both genetic and environmental pathways.
Significance of the study
Task persistence, a behavior related to academic achievement, influences the
development of cognitive skills. A Rothbart, Ellis, Rueda, & Posner (2003) study
provided evidence for the view that maturation of effortful control occurs predominantly
during toddler and preschool years. There is a need to study the etiological factors
influencing the development of task persistence during early childhood. Very few past
studies have looked at task persistence with a longitudinal perspective.
21
This study is significant in that it attempts to examine task persistence as a
dynamic process. Another significance of this study is that it seeks to use a modern
analytical tool, namely, individual growth modeling, to study the development of task
persistence using more than two waves of measurement occasions.
Measurement of heritability provides guidance in searching for candidate genes.
An estimation of environmental effects assesses the extent of influence of specific
environments associated with the development of task persistence. Moreover,
understanding the developmental trajectories of task persistence during early childhood
provides insights into normal as well as developmental pathologies. This would enable
educators, parents, and policymakers to adopt measures or develop interventions tailored
to meet the specific needs of students, thus helping them to enhance their learning skills.
This study examines the association of task persistence with reading related skills.
This helps us to increase our understanding of the complexities of reading development
and reading disorders. Such quantitative genetic studies in addition to molecular genetic
research hold the promise of linking genetic and environmental influences to specific
genes, brain functions, and behaviors in individuals (Olson, 2007). These provide
guidance in the designing of interventions to avoid reading failure.
22
Chapter 2
METHODS
Sample and procedure
The Western Reserve Reading project (WRRP) is an ongoing cohort-sequential
study involving 367 pairs of monozygotic and same sex dizygotic twins, designed to
evaluate the genetic and environmental influences on development of early literacy skills.
Participants were recruited mainly through school nominations. 273 schools in the State
of Ohio participated in recruiting families with twins who have been enrolled in
kindergarten but have not finished first grade. Additional families who fit in the selection
criteria were recruited through birth records, mothers of twin clubs, and media
advertisements. These twins live mainly in the Cleveland, Columbus, and Cincinnati
metropolitan areas, as well as other areas of Ohio and Western Pennsylvania. Most of the
twins live with both parents. Zygosity of the twins was determined by genotyping for
DNA markers (Price, Freeman, Craig, Petrill & Plomin, 2000). Few parents (n=41)
declined consent for DNA collection from their twins. In such cases, zygosity was
determined based on physical similarity ratings of twins by their parents (Goldsmith,
1991). Ninety-two percent of the twins' parents were white; about 24% of them hold a
post-graduate degree, 30% had a bachelor’s degree, 18% had some college education,
and 12% had high school education or less.
As an initial part of the larger study, recruited families received an information
package which included a letter and brochure explaining about the study as well as a
stamped postcard indicating interest in the study. Families who returned their post card
23
were contacted by phone and were given questionnaires in order to collect demographic
information, pre/post natal information about twins, parental attitudes and home
environment. After the completed questionnaires were received from families, trained
examiners scheduled and conducted a home visit. During the home visit, separate
examiners tested each twin individually to avoid rater bias. Home visits were given
mainly to conduct cognitive assessments in both twins and parents. During each home
visit, twins completed a 90- minute battery of cognitive and reading related assessments.
In addition, examiners assessed twin-twin interactions and parent-twin interactions during
structured and unstructured play sessions. Following the first assessment, subsequent
home visits were conducted within a year of previous assessment as part of an ongoing
study. Three reading assessments and one mathematics assessment have been conducted
so far.
The current study is based on twins pairs who have completed Wave 1 (n=120
MZ, 167 DZ), Wave 2 (n=108 MZ, 154 DZ), and Wave 3 (n=84 MZ, 115 DZ)
assessments to date. In Wave 1, the mean age of the twins was M= 6.08 (SD=.69, range
4.3 to 7.9 years) and mean Stanford-Binet was M=100.00 (SD=13.0, range 61-139). In
Wave 2, the mean age of the twins was M=7.2 (SD=.66, range 6.0 to 8.8 years) and the
mean Stanford-Binet was M=101.25 (SD=12.4, range 66-142). In Wave 3, mean age of
the twins was M=8.3 (SD=.73, range 6.9 to 10 years) and mean Stanford-Binet was
M=103.32 (SD=13.5, range 71-154). Approximately 57% of the sample participants were
girls; the remaining 43% were boys.
24
Measures
Task persistence (TP)
Studies have shown that task persistence behavior measured in experimental tasks
was found comparable to tester ratings of persistence during a Bayley examination
(Yarrow, Morgan, Jennings, Harmon, & Gaiter, 1982) and also to teacher ratings
(Jennings, Conners, Sankaranarayan, & Katz, 1982). For the current study, a task
persistence composite was formed from items measuring attention and persistence. Those
items were teachers' and testers' ratings of a child’s behavior observed in the classroom
and during home visits, correspondingly. During the home visit, two 8-minute segments
of interaction between each twin and a parent were videotaped including an unstructured
‘free play’ session using each twin’s favorite toy and a structured session using an Etch-
A-sketch toy and a tilting maze box. Both games required joint effort and attention to the
tasks. Testers completed the Bayley Behavior Record (Bayley, 1969) after the home visit.
Two tester-rated items relevant to persistence (1- consistently lacks persistence; 2-
typically not persistent; one or two instances of persistence; 3- lacks persistence half the
time; 4- typically persistent; lacks persistence in one or two instance; 5- consistently
persistent) and attention/distractibility (1- constantly off task; does not attend; 2- typically
off task; attends in one or two instances; 3- off task half the time; 4- typically attends ;
attention wanders in one or two instances; 5- constantly attends) were used.
A Teacher Report Form (TRF; Achenbach, 1991) was sent to each twin’s teacher
after obtaining the parental consent. The form was then collected through mail. Teachers
reported on a 3-point likert scale (0=not true; 1-somewhat or sometimes true; 2-always
25
true). From the TRF, 3 items that evaluate task persistence (4: fails to finish things; 8:
cannot concentrate or pay attention for long; 78: inattentive, easily distracted) were used
for analysis. The items were reverse coded.
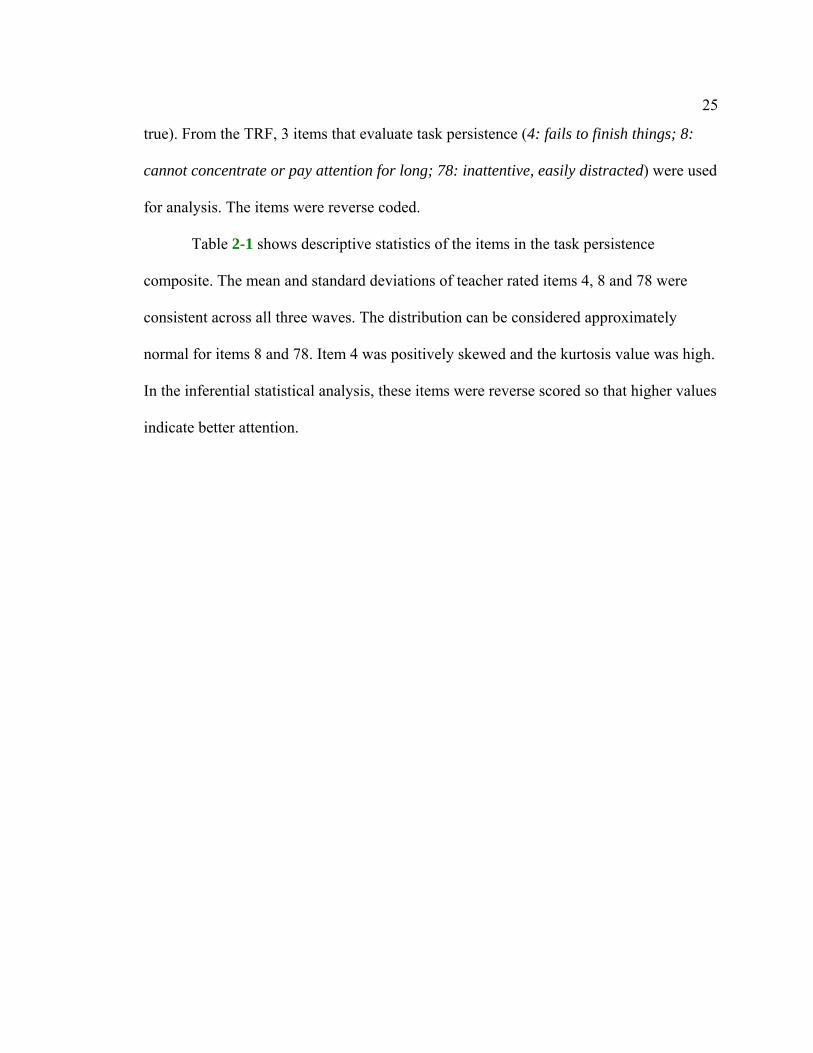
Table 2-1 shows descriptive statistics of the items in the task persistence
composite. The mean and standard deviations of teacher rated items 4, 8 and 78 were
consistent across all three waves. The distribution can be considered approximately
normal for items 8 and 78. Item 4 was positively skewed and the kurtosis value was high.
In the inferential statistical analysis, these items were reverse scored so that higher values
indicate better attention.
26
Tab. 2-1: Descriptive data of items in the task persistence composite
The mean and standard deviations of tester-rated items J & K were similar in
Wave 1 and Wave 2. In Wave 3, the mean value of these items was high and standard
deviation was low, implying a lesser amount of variance. The distributions were slightly
negatively skewed, implying that many observations were higher than the mean value.
The kurtosis values were within normal limits (+/- 1.94) except for in Wave 2, where the
value was slightly high. There were no outliers.
27
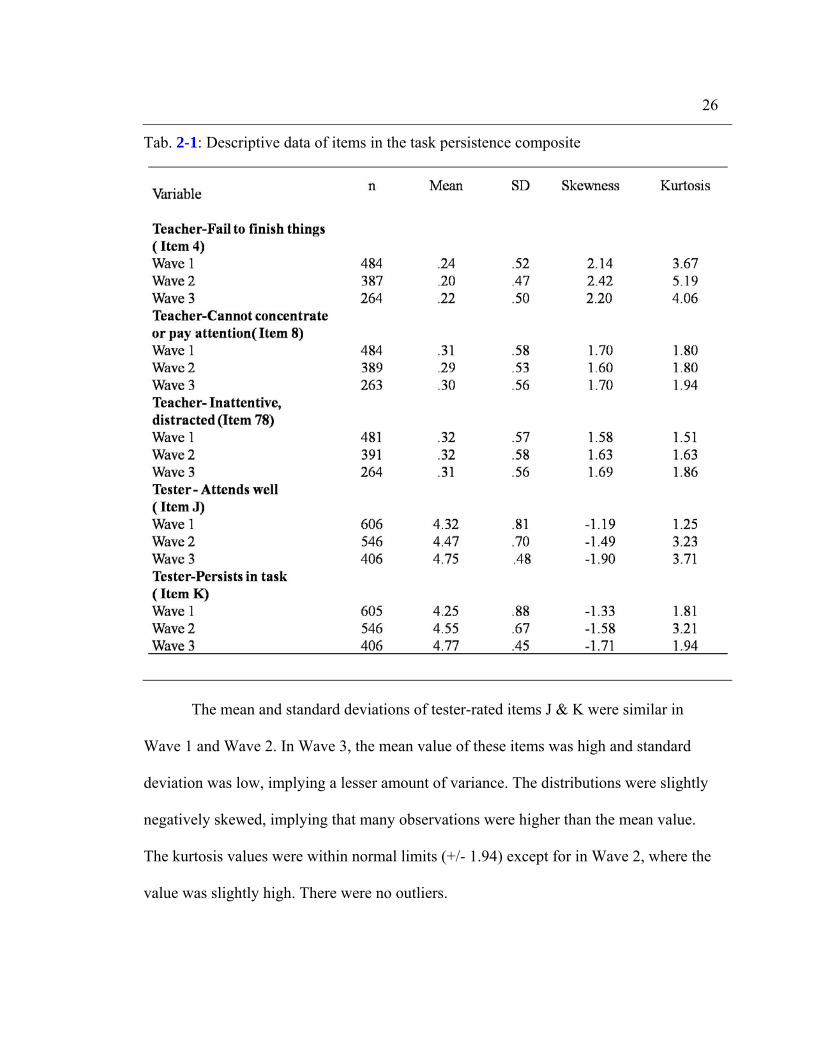
Pearson correlations among teacher and tester rated items were moderate (r >.20)
in all three waves except for in Wave 3, the correlations between tester rated item K and
other teacher rated items were not significant. Since the correlation values were
moderate, factor analyses were done as a next step.
The factor loadings on task persistence in Wave 1 and 2 were both high and
similar (See Table 2-2). In Wave 3, factor loadings on teacher rated items were high and
those of tester rated items were less than .50, which could be due to skewed data.
Skewness causes restriction of variance and affects the item's ability to distinguish
varying levels of characteristics (Tabachnick & Fidell, 1996). Skewness, less variance,
and low standard deviations in Wave 3 could be due to restrictions in the range of item
responses.
Tab. 2-2: Factor loadings (varimax rotation) on items of task persistence factor
Internal consistency of the items of the task persistence composite was also
measured for all three waves of measurement occasions; Cronbach’s value was α >.70
(Wave 1 α =.77, Wave 2 α =.77, Wave 3 α =.72). Since the composite has good internal
28
consistency and the predictive validity is greater when more than one informant method
is used, all five items were retained to form the task persistence composite score.
A single composite score of task persistence (TP) was derived across these
methods and reports. In all the items, higher score represents “better” task persistence.
Each score was converted to a z- score, then averaged and standardized again, so that the
final task composite score was in standard deviation units (Deater-Deckard, Petrill,
Thompson, & DeThorne, 2005). For the present study, all five items for forming task
persistence composite score are available in Wave 1, Wave 2, and Wave 3.
General cognitive ability (IQ)
General cognitive ability (IQ) was assessed using a short form of the Stanford-
Binet Intelligence Scale (Thorndike, Hagen & Sattler, 1986) that included tests of verbal
reasoning (Vocabulary), abstract/ visual reasoning (pattern analysis), quantitative
reasoning, and short-term memory (memory for sentences & memory for digits). These
subtest scores were summed and standardized to form the Composite Summary of Area
Score (SAS). This measure has a mean of 100 and standard deviation of 15.
Reading-related skills
Reading outcomes were assessed using the Woodcock Reading Mastery Test
(WRMT-R; Woodcock, 1987). The subtests that measure Letter Identification (LID),
29
Word Identification (WID), Word Attack (WATT), and Reading Comprehension
(RCOMP) were used to assess skills required for beginning readers. In the LID subtest,
the task is to identify printed upper or lower case letters, whereas in WID, the task is to
read words. These subtests were used to assess letter knowledge and word knowledge,
respectively. The subtest WATT was used to assess phonological decoding skills, in
which children were asked to read nonsense words or words that are used less frequently
in English language, until they reached an error criterion. The subtest passage
comprehension was used to measure RCOMP, in which children were asked to read a
short passage and identify a key word missing from the passage. All subtest scores were
residualized for age and sex using a regression method. In this study, each measure was
used as an independent variable.
Phonological awareness (PA) was measured using the Phonological Awareness
Test (Robertson & Salter, 1997) including six subtests that measure rhyming
(discrimination and production), phoneme isolation (initial), phonemic segmentation
(whole word), and phonemic deletion (syllabic deletion and phoneme deletion). In Wave
1 all six subtests and in Wave 2 & 3, subtests other than rhyming and phonemic isolation
were used. These subtests were summed and this score was residualized for age and sex,
also using a regression procedure (see Petrill et al., 2006a).
Expressive vocabulary was assessed using test scores from the Boston Naming
Test (Kaplan, Goodglass & Weintraub, 1983), which consists of 60 pictures, ordered
from easiest to most difficult items. This test requires children to name the pictured item
and total score was based on the number of correct responses. The raw scores were then
corrected for age and sex by regression procedure.
30
Analytic methods
Twin design
The classical twin design is the most commonly used design in quantitative
genetics. The existence of monozygotic and dizygotic twins provides a natural
experiment for disentangling genetic from environmental factors. The twin method has
two major advantages. First, the degree of difference in genetic relatedness between
monozygotic and dizygotic twins is greater than between any other relatives, as
monozygotic twins (MZ) share 100% of genetic materials and dizygotic twins (DZ) share
50% of genetic materials. Second, both types of twins share the same womb, are born at
the same time and live in the same family (Plomin, 1990).
In quantitative genetic research, an intraclass correlation refers to the extent of
similarity of individuals within pairs. The value ranges from 0, indicating no similarity
and 1.0, indicating perfect resemblance. The essence of the twin method is the
comparison of the correlations for the two types of twins with an assumption of equal
environment. If heredity is important for a trait, then monozygotic twins resemble more
than dizygotic twins. If there is not much difference among monozygotic and dizygotic
twins, then environment is important. Moreover, twin design allows for partitioning the
variation of a trait or covariation between multiple traits into genetic, shared
environmental and nonshared environmental components. Heritability refers to the extent
to which variability in a trait is influenced by genetic variations within a population.
Shared environment refers to environmental influences that contribute to resemblance
among siblings beyond genetic relatedness and nonshared environment refers to
31
environmental influences that are unique to a twin and tend to make the individuals in a
twin pair different from each other.
Heritability is calculated as twice the difference in intraclass correlation between
MZ and DZ twins: h2=2(rmz – rdz). Shared environment is the difference between MZ
intraclass correlation and heritability: c2= rmz – h2, and nonshared environment is one
minus heritability and shared environment: e2=1- h2 + c2. Overall, the intraclass
correlations provide an estimate of genetic and environmental effects, but this method
does not simultaneously estimate these effects nor do they provide inferential tests of
significance.
Quantitative genetic models
Longitudinal genetic models to assess stability and change
The aim of longitudinal analysis is to examine how genetic and environmental
influences contribute to the development of traits over time (Boomsma & Molenaar,
1987; McArdle 1986). Few basic models are used for longitudinal data analyses in
quantitative genetics research: (1) The Cholesky model; (2) Common factor independent
pathway model; (3) Simplex model; and (4) Latent growth curve model.
Multivariate analysis focuses on the covariance within the same measure across
different measurement occasions. Just like the univariate analysis, multivariate genetic
analysis decomposes the phenotypic variance of a trait into genetic and environmental
32
components of covariance between measurement occasions, and also specific genetic and
environmental components of variance for each measurement occasion.
As a first step to multivariate analysis, it is important to establish a saturated
model, so that hypothesis-driven restricted models can be compared against a saturated
model (Neale, Boker, Bergeman, & Maes, 2006). This comparison will provide an index
of fit for a model with genetic and environmental components (Neale, Boker, Bergeman,
& Maes, 2006). The Cholesky model (See Fig. 1) can serve as a saturated model to
compare against restricted models because this model has the same number of parameters
as there are covariances - m (m+1)/2 for m variables and will always fit perfectly (Neale
& McArdle, 2000). This model has a limited use, however, in longitudinal data analysis
because the causation is unidirectional through time (Boomsma, Martin, & Molenaar,
1989).
The common factor model and the simplex model are frequently used statistical
models that test two different developmental mechanisms (Lemery et al, 1999). A
common factor independent-pathway or biometric model (See Fig. 2) predicts that the
same genes and environment have different magnitude of effects on the covariance over
time. This model represents a developmental mechanism which suggests that one stable
factor brings about the behavioral change at each age. In this model, developmental
changes can be assessed from the change in the factor loadings over time (Van
Beijsterveldt, Bartels, Hudziak, & Boomsma, 2003). In a simplex model (See Fig. 3),
genetic and environmental latent variables at a particular time are related to the
immediately preceding variables. This model then suggests that stability of a trait is
maintained by prior experience and influences that are transmitted to subsequent ages and
33
change in a trait may be brought by new influences that enter at each age (Van
Beijsterveldt, Bartels, Hudziak, & Boomsma, 2003).
In addition, the above mentioned developmental models can be distinguished
based on their correlation patterns. The correlation coefficients of the simplex model are
highest between measures taken closer in time. It decreases as the measurement
occasions are spaced further apart. On the contrary, the common factor model assumes no
specific pattern of correlation as the time varies (Van Beijsterveldt, Bartels, Hudziak, &
Boomsma, 2003).
However, the common factor and simplex models cannot address within-
individual differences in change in task persistence over time, as those models cannot
predict mean differences between MZ and DZ twins (Neale & McArdle, 2000). Latent
growth curve models can predict changes in mean, variance, and covariance over time.
Examination of within-individual variability as opposed to covariance models of stability
may provide a different view in understanding the etiology (Reynolds, Finkel, Gatz &
Pedersen, 2002). For instance, genetic influences operating at a particular point in time
may be different from those affecting the rate of change over time (Reynolds, Finkel,
Gatz & Pedersen, 2002).
In the current study, the Cholesky decomposition, the common factor independent
pathway, simplex and latent growth curve models were used to examine the etiological
factors underlying task persistence as well as the changes in those factors that occur as
the time varies.
34
Analysis with reading related skills
A Cholesky model was also used in this study to examine the association between
task persistence and reading related skills. As opposed to the previous analysis, where the
focus is on the covariance between the same measures over time, here the interest is on
the covariance between two different traits: task persistence and reading related skills.
Multivariate genetic analysis decomposes the phenotypic covariance into genetic and
environmental sources of covariance (Plomin et al., 2001).
Statistical models
Cholesky model
The Cholesky decomposition is the most commonly used model in twin design for
doing multivariate analysis. The idea of using the Cholesky model is to describe the
variation within, and the covariation between the observed variables and latent factors.
Factor loadings indicate the relationship between a latent factor and an observed variable
and factor correlations represent the relationships between the hypothesized latent
factors. In the Cholesky model (See Fig. 1), the first variable is assumed to be caused by
a latent factor that also influences other variables. The second variable is assumed to be
caused by a second latent factor that can explain variance in all variables except for the
previous one. This pattern continues until the final variable, which is influenced by a
latent factor that is specific only to that variable. A1, A2, A3 are latent factors
representing genetic effects. These factors are assumed to be uncorrelated within the
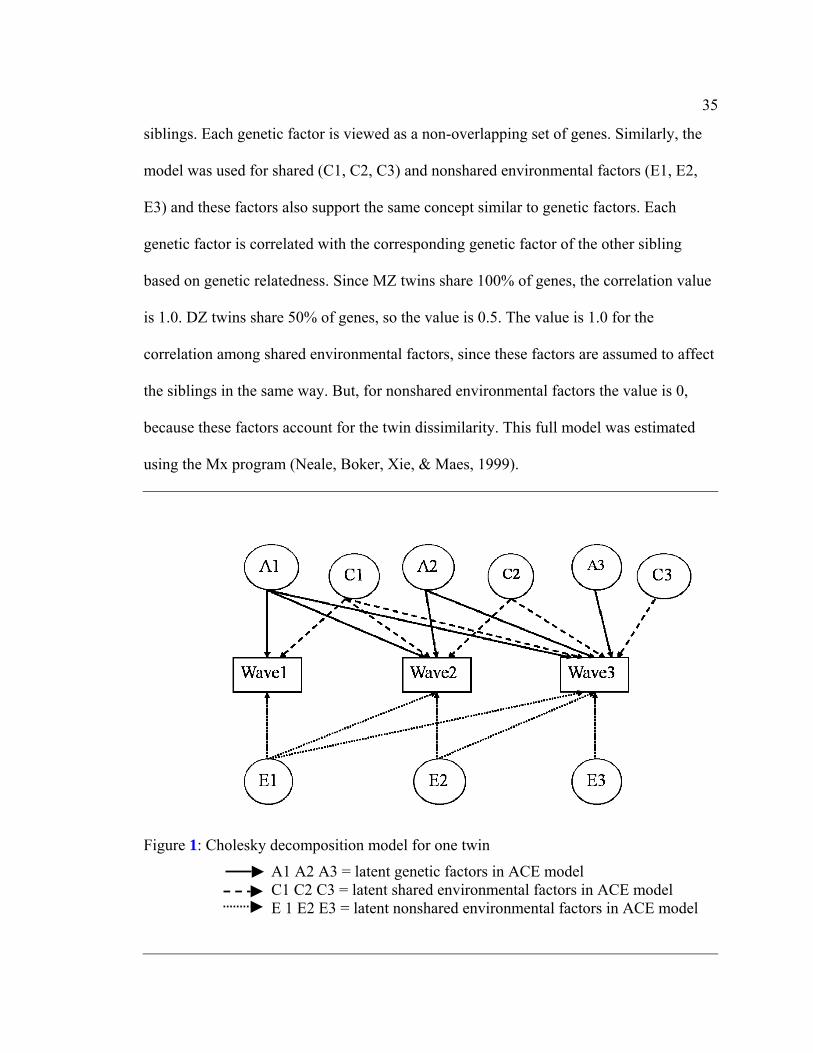
35
siblings. Each genetic factor is viewed as a non-overlapping set of genes. Similarly, the
model was used for shared (C1, C2, C3) and nonshared environmental factors (E1, E2,
E3) and these factors also support the same concept similar to genetic factors. Each
genetic factor is correlated with the corresponding genetic factor of the other sibling
based on genetic relatedness. Since MZ twins share 100% of genes, the correlation value
is 1.0. DZ twins share 50% of genes, so the value is 0.5. The value is 1.0 for the
correlation among shared environmental factors, since these factors are assumed to affect
the siblings in the same way. But, for nonshared environmental factors the value is 0,
because these factors account for the twin dissimilarity. This full model was estimated
using the Mx program (Neale, Boker, Xie, & Maes, 1999).
Figure 1: Cholesky decomposition model for one twin
A1 A2 A3 = latent genetic factors in ACE model C1 C2 C3 = latent shared environmental factors in ACE model E 1 E2 E3 = latent nonshared environmental factors in ACE model
36
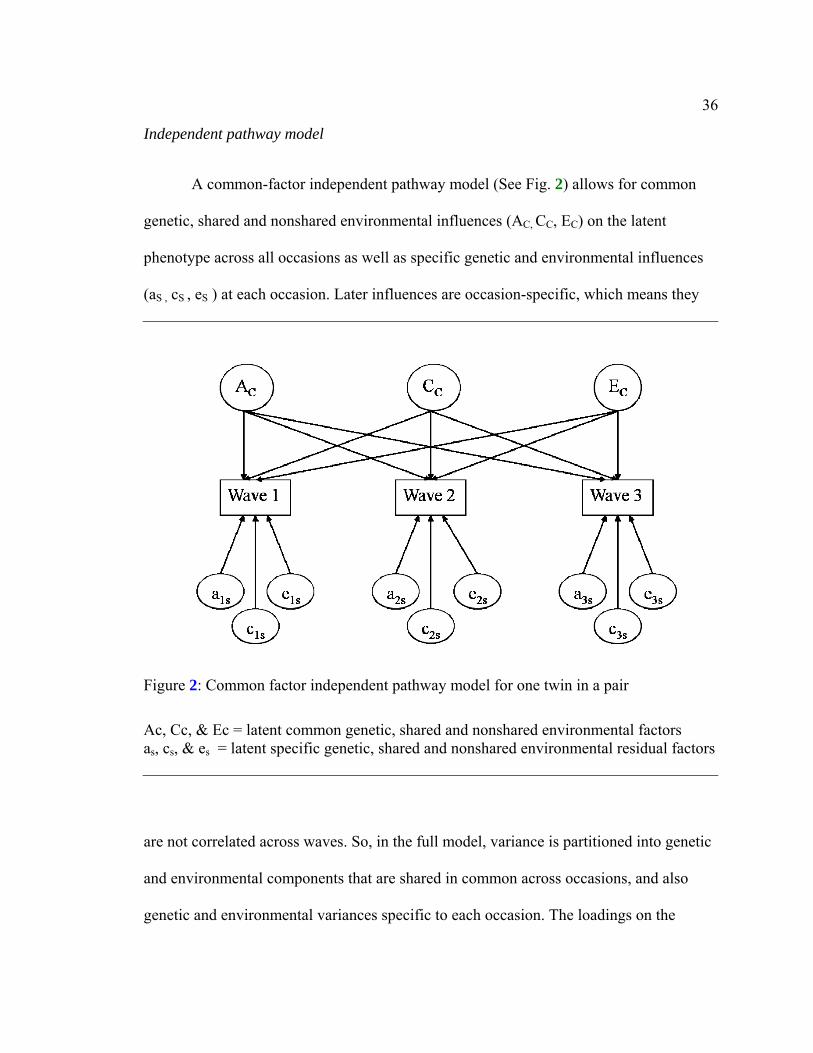
Independent pathway model
A common-factor independent pathway model (See Fig. 2) allows for common
genetic, shared and nonshared environmental influences (AC, CC, EC) on the latent
phenotype across all occasions as well as specific genetic and environmental influences
(aS , cS , eS ) at each occasion. Later influences are occasion-specific, which means they
Figure 2: Common factor independent pathway model for one twin in a pair
Ac, Cc, & Ec = latent common genetic, shared and nonshared environmental factors as, cs, & es = latent specific genetic, shared and nonshared environmental residual factors
are not correlated across waves. So, in the full model, variance is partitioned into genetic
and environmental components that are shared in common across occasions, and also
genetic and environmental variances specific to each occasion. The loadings on the
37
common factors will reveal the degree to which the trait shares genetic and
environmental factors across occasions.
Simplex model
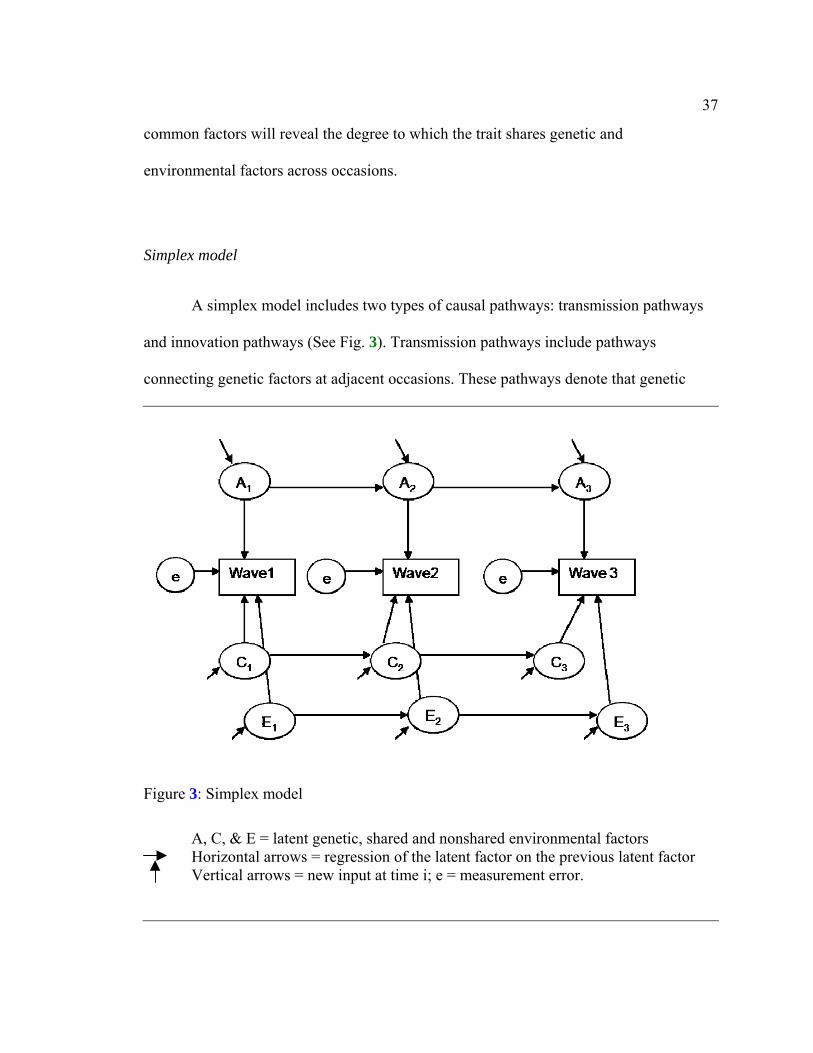
A simplex model includes two types of causal pathways: transmission pathways
and innovation pathways (See Fig. 3). Transmission pathways include pathways
connecting genetic factors at adjacent occasions. These pathways denote that genetic
Figure 3: Simplex model
A, C, & E = latent genetic, shared and nonshared environmental factors
Horizontal arrows = regression of the latent factor on the previous latent factor Vertical arrows = new input at time i; e = measurement error.
38
factors at a particular occasion are influenced by factors operating during previous
occasion(s). Similarly, the model includes transmission pathways that connect
environmental factors. Such relationships between latent factors are termed
autoregressive. In addition, the model includes innovation pathways, which represent
new genetic and environmental influences that operate at each specific occasion. At the
first occasion, the first latent factors cannot be explained by factors associated with an
earlier occasion; therefore this factor itself is regarded as an innovation (Van
Beijsterveldt, Bartels, Hudziak, & Boomsma, 2003). The total variance is the sum of the
occasion-specific innovation effects and the occasion-occasion transmission effects.
Latent growth model
The latent growth curve model is illustrated in Fig. 4. In this model, individual
scores at any time are a linear function of a latent intercept (I), slope (S), and random
error. Two latent factors denoted as I and S represent the average level of task persistence
at the initial status and rate of change or slope respectively. Factor loadings on an
intercept are fixed to 1, and on slope, they are allowed to vary so that they capture the
systematic changes in task persistence over time. The factor means and variances can also
be estimated using this model. To investigate genetic and environmental influences on
intercept and slope, the variance of the intercept and slope can be decomposed into
genetic and environmental components.
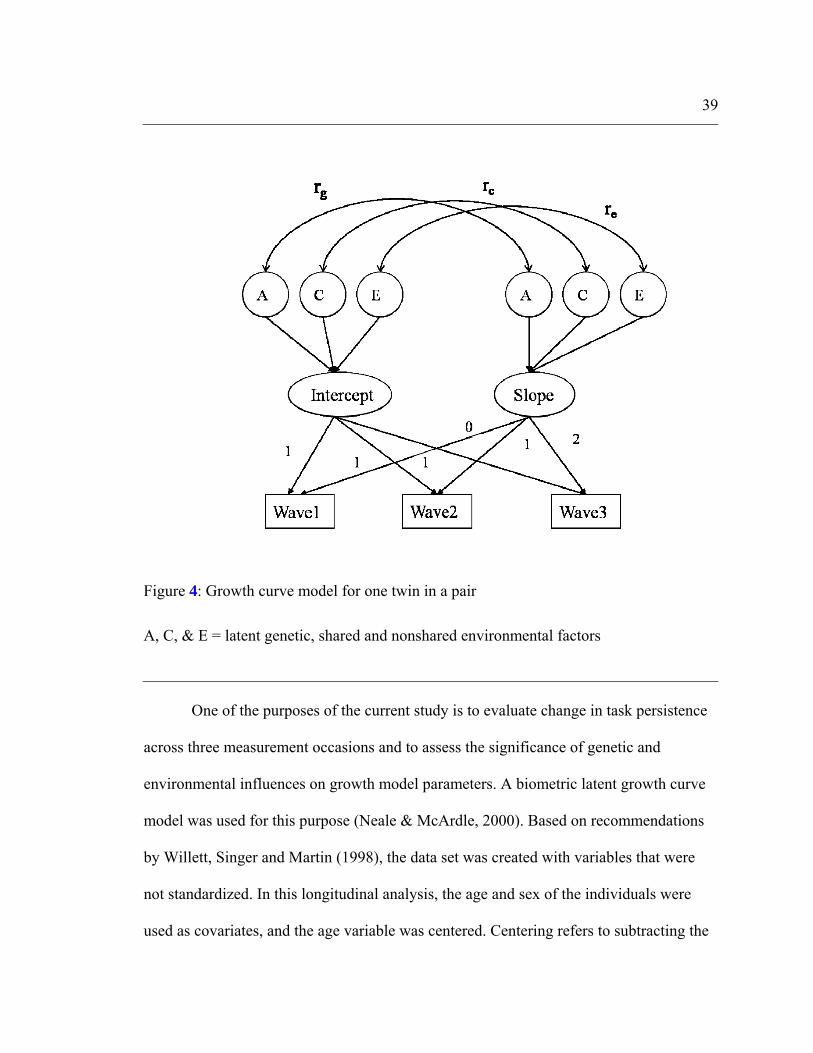
39
Figure 4: Growth curve model for one twin in a pair
A, C, & E = latent genetic, shared and nonshared environmental factors
One of the purposes of the current study is to evaluate change in task persistence
across three measurement occasions and to assess the significance of genetic and
environmental influences on growth model parameters. A biometric latent growth curve
model was used for this purpose (Neale & McArdle, 2000). Based on recommendations
by Willett, Singer and Martin (1998), the data set was created with variables that were
not standardized. In this longitudinal analysis, the age and sex of the individuals were
used as covariates, and the age variable was centered. Centering refers to subtracting the
40
mean age of the sample from the individual observed age so that the transformed value
indicates how much each individual deviates from the mean. This centering was done to
make the interpretation of the intercept more meaningful, as the variable lacks a natural
zero point. In the present case, the mode of the age variable in Wave 1(6.5 years) was
subtracted from the age of each individual, so that the average score of the intercept was
for a 6.5 year-old respondent. The random errors were fixed at the same value in all three
measurement occasions.
Sex difference analyses
Analyses were done to test whether there are differences in task persistence scores
due to sex effects. As a first step, analysis of variance (ANOVA) was used to test the
hypothesis that the means of task persistence scores were equal for boys and girls. SAS
program was used to conduct ANOVA and F statistic was used to assess the significance
of main effect.
Twin correlations by sex and zygosity provide information about the sex
differences in etiology. Quantitative sex difference is implicated when resemblance
within male and female same-sex twin pairs differs as a function of zygosity. Qualitative
sex difference is implicated when the same-sex DZ twin pairs resemble more than the
opposite-sex DZ twin pairs.
Furthermore, to understand more about the etiological patterns, structural
equation models were applied using Mx program. Three models namely saturated model,
heterogeneity and homogeneity models were used to examine sex differences in the
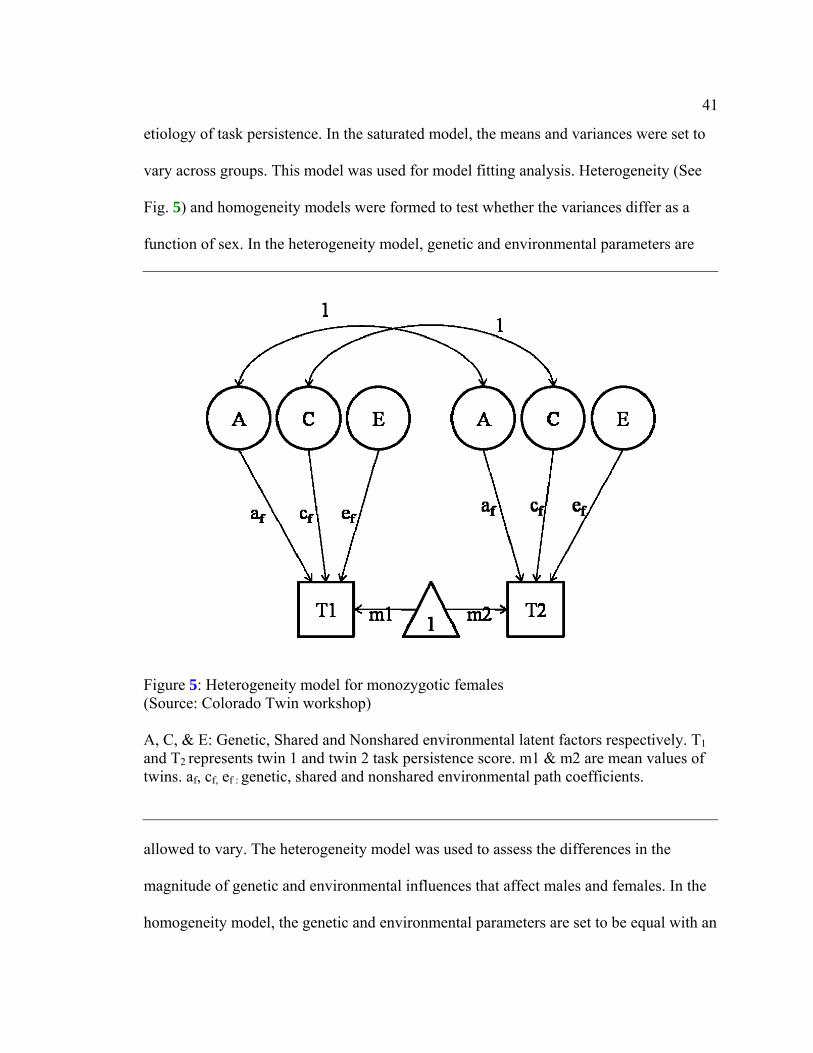
41
etiology of task persistence. In the saturated model, the means and variances were set to
vary across groups. This model was used for model fitting analysis. Heterogeneity (See
Fig. 5) and homogeneity models were formed to test whether the variances differ as a
function of sex. In the heterogeneity model, genetic and environmental parameters are
Figure 5: Heterogeneity model for monozygotic females (Source: Colorado Twin workshop) A, C, & E: Genetic, Shared and Nonshared environmental latent factors respectively. T1 and T2 represents twin 1 and twin 2 task persistence score. m1 & m2 are mean values of twins. af, cf, ef : genetic, shared and nonshared environmental path coefficients.
allowed to vary. The heterogeneity model was used to assess the differences in the
magnitude of genetic and environmental influences that affect males and females. In the
homogeneity model, the genetic and environmental parameters are set to be equal with an
42
assumption that the same genetic and environmental influences affect males and females
to the same extent.
Model fitting
Model fitting analyses were done using the Mx software program (Neale, 1994).
A common factor independent pathway model and a simplex model were both compared
to the Cholesky model, which was used as a saturated model in this study. These models
were compared by chi-square tests. The chi-square statistic was computed by substracting
-2LL for the saturated model from that of reduced models. Akaike information criterion
(AIC) values were also obtained. The model fits the observed data well if the AIC value
is low. Although the common factor and simplex models do not form a nested pair of
models, they were compared in terms of parsimony (lower AIC values) and goodness of
fit because those models represent alternative sets of constraints on the saturated model
(Neale & Cardon, 1992). However, in the present study, our interest is in understanding
the developmental mechanisms.
The same criteria (Chi-square statistic and AIC) were applied to find out the
significance of A, C, and E parameters in models used for finding sex differences in task
persistence. Various sub-models were formed by equating means across zygosity and
within zygosity leaving other parameters free. In addition, sub-models were formed by
dropping parameters of interest to test the significance of A, C, and E parameters. Fit
statistics for the sub-models were compared with those for the saturated model. This
resulted in chi-square and AIC values that were comparable for the different sub-models.
Based on these results, the significance of the parameters was assessed.

43
Apart from model fitting, the significance of the genetic and environmental
parameters was assessed using confidence intervals of point estimates. Confidence
intervals provide an interval of values and the end points of the interval give an estimate
of size of the error associated with the point estimate.
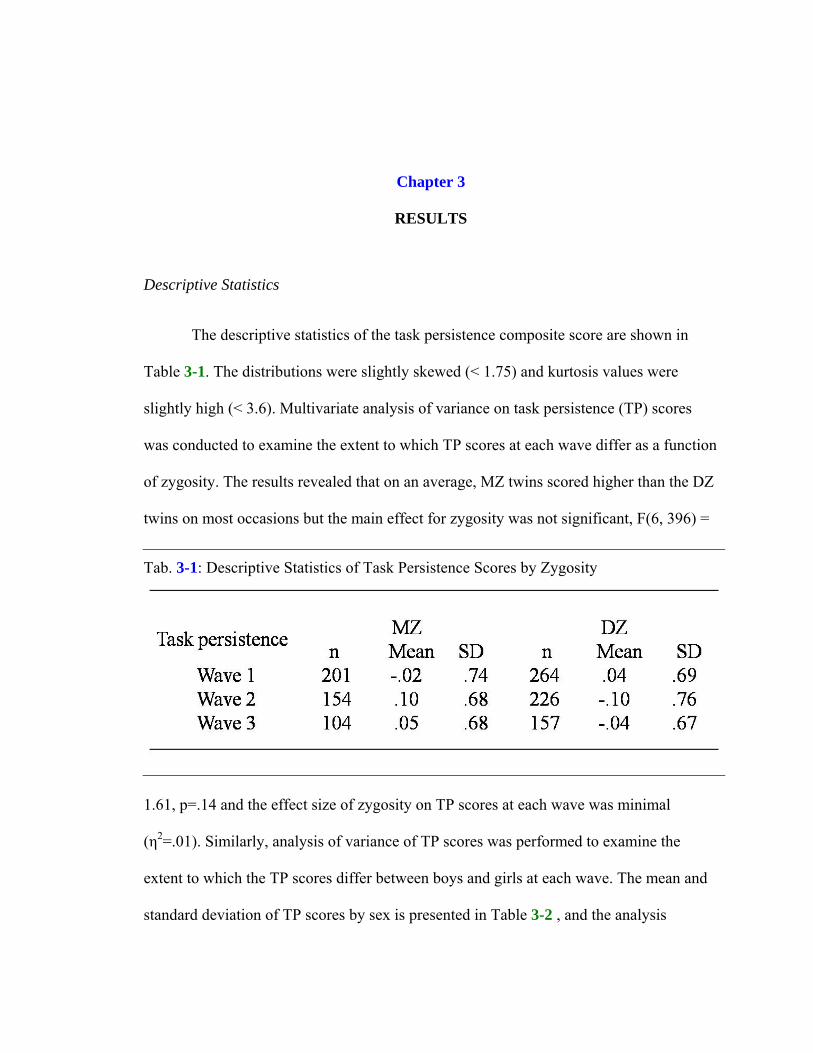
Chapter 3
RESULTS
Descriptive Statistics
The descriptive statistics of the task persistence composite score are shown in
Table 3-1. The distributions were slightly skewed (< 1.75) and kurtosis values were
slightly high (< 3.6). Multivariate analysis of variance on task persistence (TP) scores
was conducted to examine the extent to which TP scores at each wave differ as a function
of zygosity. The results revealed that on an average, MZ twins scored higher than the DZ
twins on most occasions but the main effect for zygosity was not significant, F(6, 396) =
1.61, p=.14 and the effect size of zygosity on TP scores at each wave was minimal
(η2=.01). Similarly, analysis of variance of TP scores was performed to examine the
extent to which the TP scores differ between boys and girls at each wave. The mean and
standard deviation of TP scores by sex is presented in Table 3-2 , and the analysis
Tab. 3-1: Descriptive Statistics of Task Persistence Scores by Zygosity
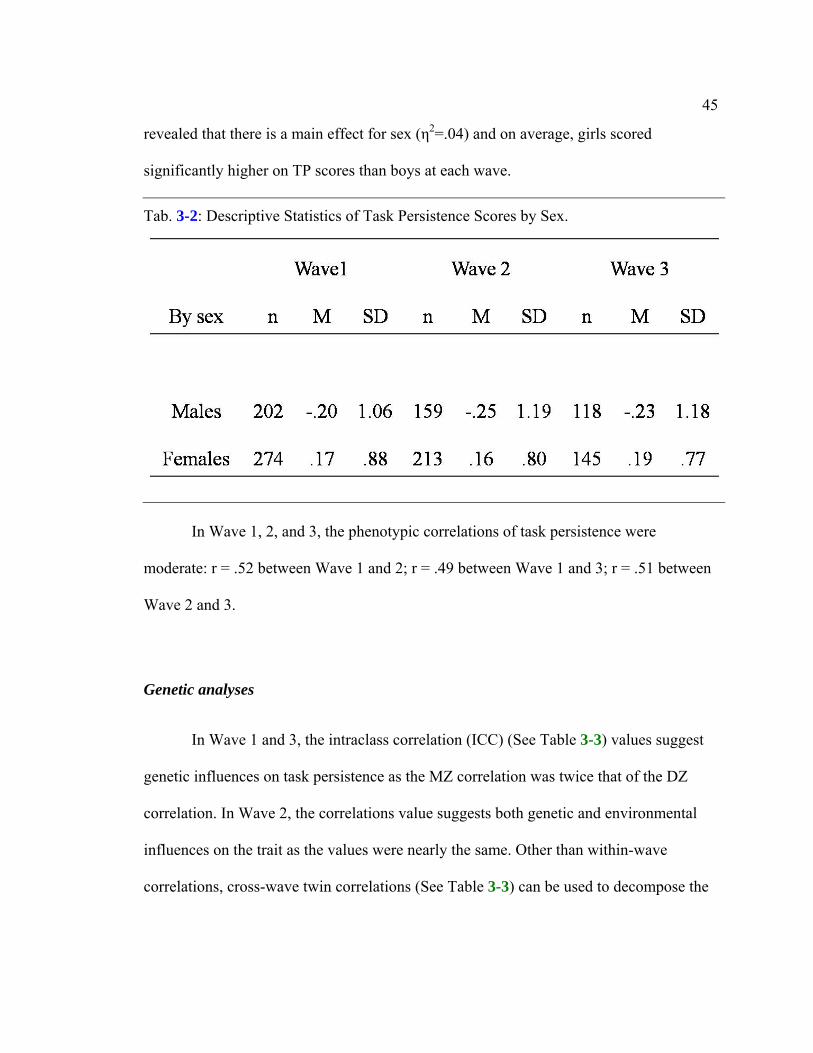
45
revealed that there is a main effect for sex (η2=.04) and on average, girls scored
significantly higher on TP scores than boys at each wave.
Tab. 3-2: Descriptive Statistics of Task Persistence Scores by Sex.
In Wave 1, 2, and 3, the phenotypic correlations of task persistence were
moderate: r = .52 between Wave 1 and 2; r = .49 between Wave 1 and 3; r = .51 between
Wave 2 and 3.
Genetic analyses
In Wave 1 and 3, the intraclass correlation (ICC) (See Table 3-3) values suggest
genetic influences on task persistence as the MZ correlation was twice that of the DZ
correlation. In Wave 2, the correlations value suggests both genetic and environmental
influences on the trait as the values were nearly the same. Other than within-wave
correlations, cross-wave twin correlations (See Table 3-3) can be used to decompose the
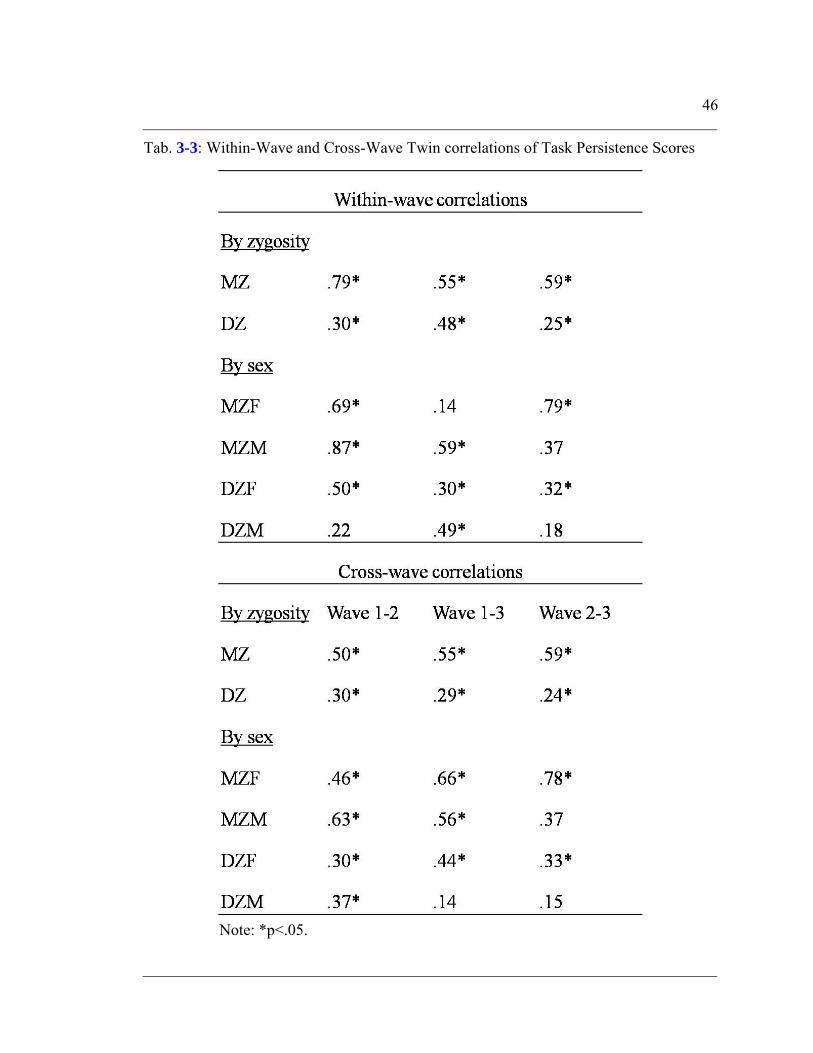
46
Tab. 3-3: Within-Wave and Cross-Wave Twin correlations of Task Persistence Scores
Note: *p<.05.
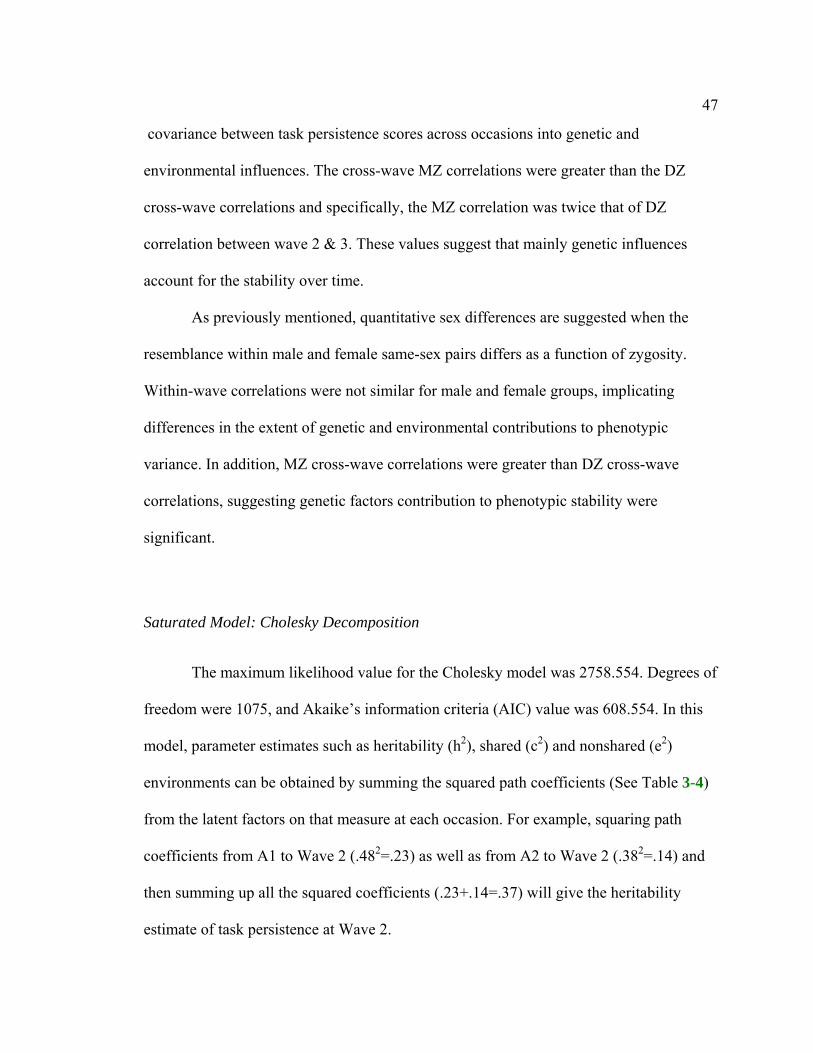
47
covariance between task persistence scores across occasions into genetic and
environmental influences. The cross-wave MZ correlations were greater than the DZ
cross-wave correlations and specifically, the MZ correlation was twice that of DZ
correlation between wave 2 & 3. These values suggest that mainly genetic influences
account for the stability over time.
As previously mentioned, quantitative sex differences are suggested when the
resemblance within male and female same-sex pairs differs as a function of zygosity.
Within-wave correlations were not similar for male and female groups, implicating
differences in the extent of genetic and environmental contributions to phenotypic
variance. In addition, MZ cross-wave correlations were greater than DZ cross-wave
correlations, suggesting genetic factors contribution to phenotypic stability were
significant.
Saturated Model: Cholesky Decomposition
The maximum likelihood value for the Cholesky model was 2758.554. Degrees of
freedom were 1075, and Akaike’s information criteria (AIC) value was 608.554. In this
model, parameter estimates such as heritability (h2), shared (c2) and nonshared (e2)
environments can be obtained by summing the squared path coefficients (See Table 3-4)
from the latent factors on that measure at each occasion. For example, squaring path
coefficients from A1 to Wave 2 (.482=.23) as well as from A2 to Wave 2 (.382=.14) and
then summing up all the squared coefficients (.23+.14=.37) will give the heritability
estimate of task persistence at Wave 2.
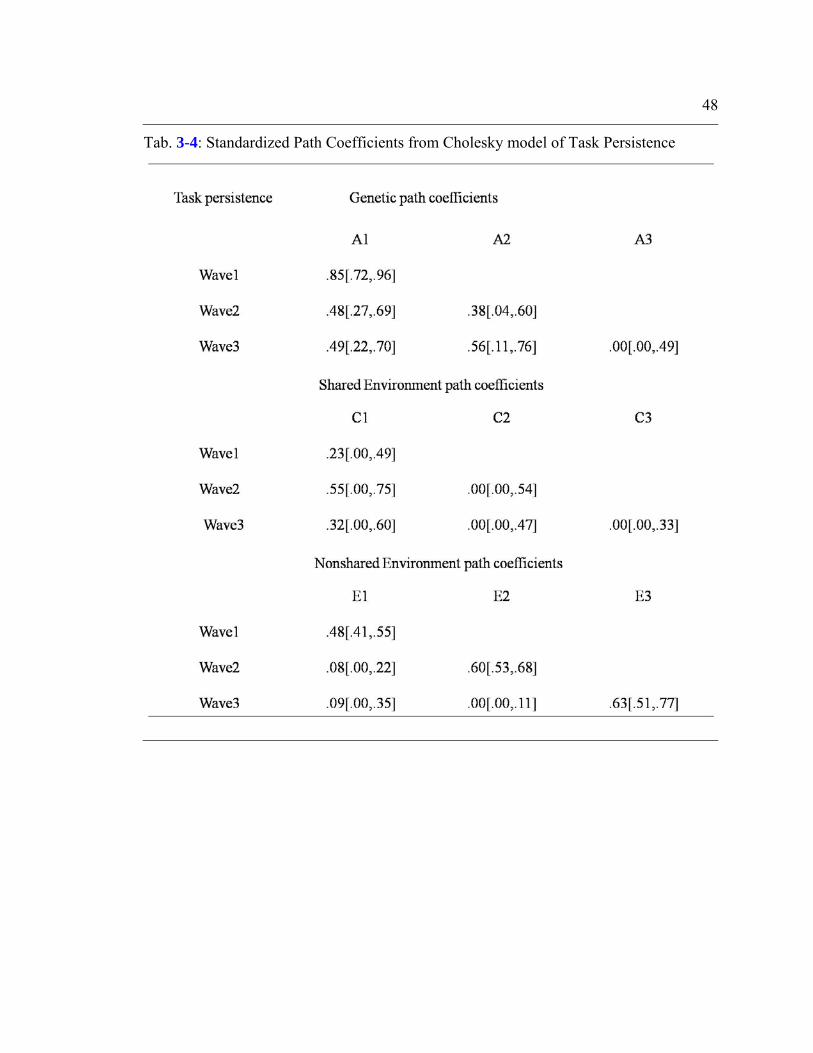
48
Tab. 3-4: Standardized Path Coefficients from Cholesky model of Task Persistence
49
The parameter estimates are presented in Table 3-5. Genetic influences on task
persistence were predominant in Wave 1 and 3, whereas in Wave 2, both genetic and
shared environmental influences were seen. Furthermore, the contributions of the genetic
and environmental factors to the phenotypic correlations between Waves 1, 2 & 3 task
persistence scores can be estimated by summing the products of the path coefficients
from the latent factors that load on a pair of occasions, and then dividing by the
phenotypic correlation between the scores measured at two different occasions. For
example, the sum of the products of path coefficients from genetic factors A1 to Wave 2
and Wave 3 (.48*.49 =.24) and from A2 to Wave 2 and Wave 3 (.38*.56=.21) was .45,
which indicates the genetic contributions to the phenotypic correlation between Wave 2
and 3 task persistence scores. Similarly, shared and nonshared environmental
contributions were calculated; they were .18 and .01, correspondingly. The phenotypic
correlation between two measurement occasions is the sum of all genetic and
environmental contributions. So, the phenotypic correlation between Wave 2 and 3
measures was .64 (.45+.18+.01). The extent of contribution of genetic influences to the
phenotypic correlation calculated by dividing the genetic contribution (.45) by the
phenotypic correlation (.64), indicates that 70% of the phenotypic correlation is mediated
genetically. Similarly, genetic influences contributed about 72% to the phenotypic
correlation of task persistence scores between Wave 1 and 2, and 79% between Wave 1
and 3, respectively. Shared environmental contributions (13 to 28%) were moderate and
nonshared environmental influences contributions (2 to 7%) were minimal.
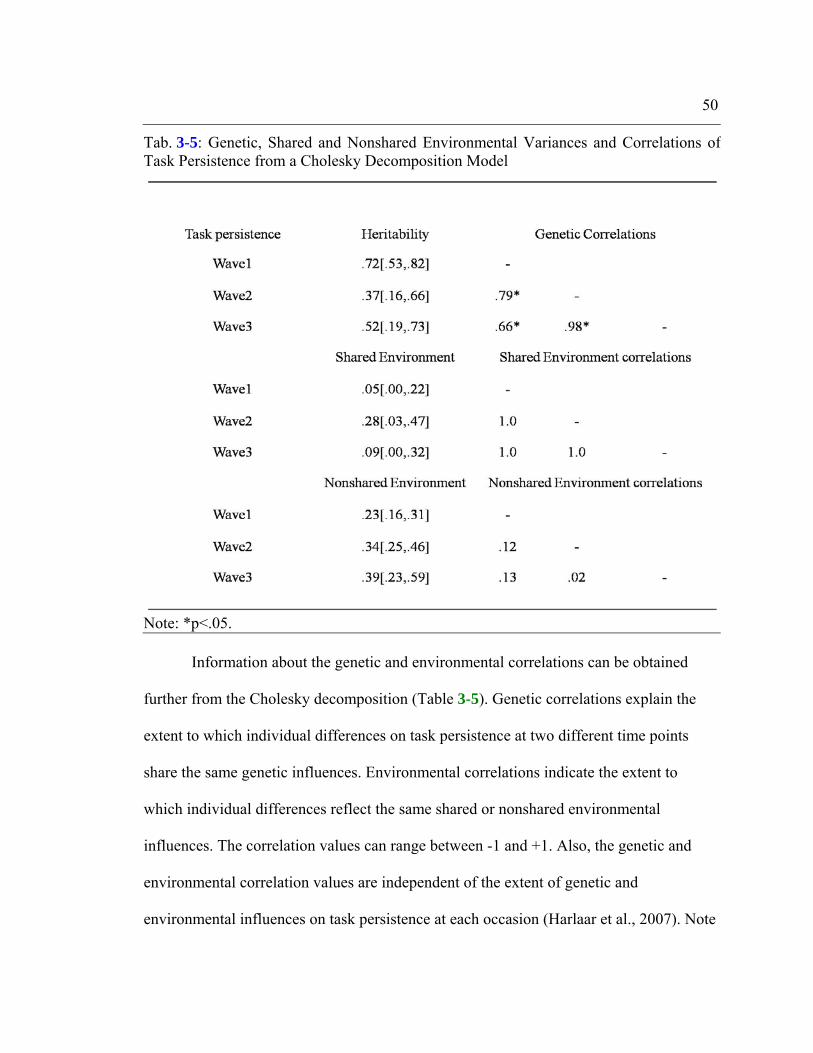
50
Tab. 3-5: Genetic, Shared and Nonshared Environmental Variances and Correlations of Task Persistence from a Cholesky Decomposition Model
Note: *p<.05.
Information about the genetic and environmental correlations can be obtained
further from the Cholesky decomposition (Table 3-5). Genetic correlations explain the
extent to which individual differences on task persistence at two different time points
share the same genetic influences. Environmental correlations indicate the extent to
which individual differences reflect the same shared or nonshared environmental
influences. The correlation values can range between -1 and +1. Also, the genetic and
environmental correlation values are independent of the extent of genetic and
environmental influences on task persistence at each occasion (Harlaar et al., 2007). Note
51
that the genetic overlap among task persistence measures across three waves was high
and significant. Also, the genetic correlations between closer time points were higher
than those that were farther apart. Correlations between shared and nonshared
environmental influences were insignificant.
Longitudinal analyses
To understand the mechanisms underlying the development of task persistence,
the independent pathway and simplex models were employed. The independent pathway
model is shown in Fig. 2. The common nonshared environmental pathway was fixed to
zero to identify the model. The maximum likelihood value for the independent pathway
model was 2773.90, degrees of freedom were 1087, and the AIC value was 599.90. As
explained earlier, this model decomposes the variance and covariance among measures of
task persistence across three waves into common and specific genetic and environmental
effects. For example, .69, a genetic path estimate is a standardized partial regression
coefficient of Wave 1 task persistence, which by squaring will give an estimate of the
genetic variance due to a common factor. Similarly, genetic and environmental variances
due to common and specific effects can be obtained by squaring the path coefficients.
The path coefficients of the model are presented in Table 3-6. Genetic effects
accounted for 73% (.692 + .512) of variance in the Wave 1, 42% (.652 + .00) of the
variance in Wave 2 and 46% (.672 + .142) of the variance in Wave 3. The common
genetic factor accounted for 64% (.47/.74) of the genetic influence on Wave 1 task
persistence and 100% (.42/.42) in Wave 2 and 98% in Wave 3 (.45/.46). Shared
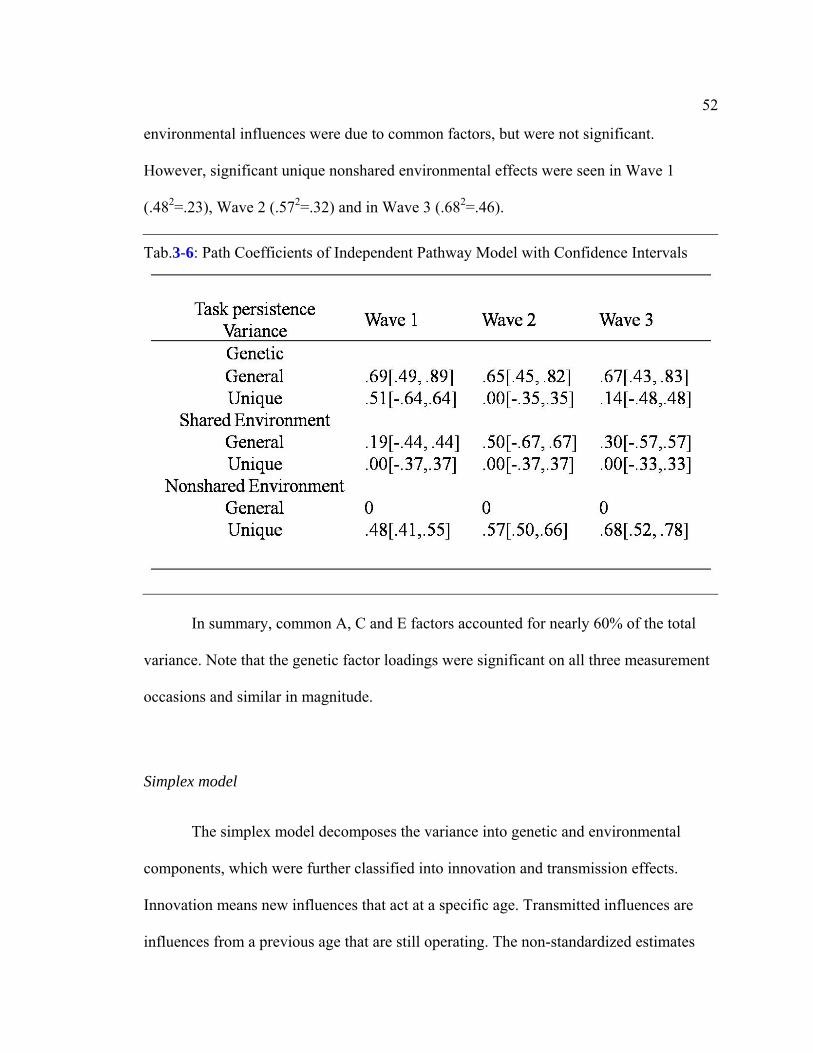
52
environmental influences were due to common factors, but were not significant.
However, significant unique nonshared environmental effects were seen in Wave 1
(.482=.23), Wave 2 (.572=.32) and in Wave 3 (.682=.46).
Tab.3-6: Path Coefficients of Independent Pathway Model with Confidence Intervals
In summary, common A, C and E factors accounted for nearly 60% of the total
variance. Note that the genetic factor loadings were significant on all three measurement
occasions and similar in magnitude.
Simplex model
The simplex model decomposes the variance into genetic and environmental
components, which were further classified into innovation and transmission effects.
Innovation means new influences that act at a specific age. Transmitted influences are
influences from a previous age that are still operating. The non-standardized estimates
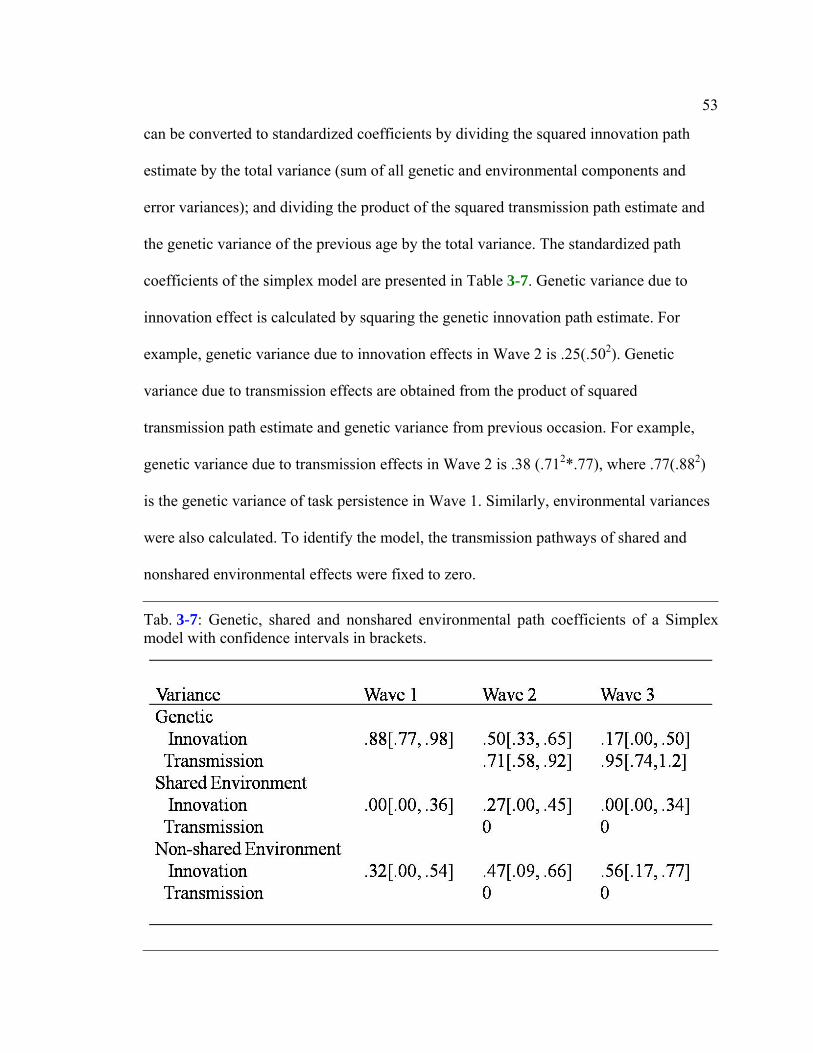
53
can be converted to standardized coefficients by dividing the squared innovation path
estimate by the total variance (sum of all genetic and environmental components and
error variances); and dividing the product of the squared transmission path estimate and
the genetic variance of the previous age by the total variance. The standardized path
coefficients of the simplex model are presented in Table 3-7. Genetic variance due to
innovation effect is calculated by squaring the genetic innovation path estimate. For
example, genetic variance due to innovation effects in Wave 2 is .25(.502). Genetic
variance due to transmission effects are obtained from the product of squared
transmission path estimate and genetic variance from previous occasion. For example,
genetic variance due to transmission effects in Wave 2 is .38 (.712*.77), where .77(.882)
is the genetic variance of task persistence in Wave 1. Similarly, environmental variances
were also calculated. To identify the model, the transmission pathways of shared and
nonshared environmental effects were fixed to zero.
Tab. 3-7: Genetic, shared and nonshared environmental path coefficients of a Simplex model with confidence intervals in brackets.
54
The maximum likelihood value for the full model was 2768.04, degrees of
freedom were 1087, and the AIC value was 594.05. Genetic effects predominated in all
three waves. The proportion of genetic variance contributed by innovation effects
decreased from Wave 1 to Wave 3 from 100% to 5%, whereas contribution from
transmission effects increased from 60% to 95%. Genetic innovation effects and
transmission effects except the innovation effect in Wave 3 were significant. Shared
environmental innovation effects in all three waves were not significant. Innovation
effects contributed to nonshared environmental variance were significant. Error variance
was about 0.12. Overall, the contribution of genetic factors was large, significant and
stable across waves.
Approximately 66% of the phenotypic correlations observed between
measurement occasions can be attributed to genetic factors and 20% can be attributed to
nonshared environmental factors. The extent to which same genes or environmental
factors contribute to the phenotypic correlation was denoted by genetic and
environmental correlations. The correlation values were same as those values obtained
from a Cholesky model. The genetic correlation between Wave 1 and Wave 2 as well as
between Wave 1 and Wave 3 was high (~70 %) and stable, implying that most of the
genes that operated in Wave 1 also act in Wave 2 and Wave 3. Also, the genetic
correlation between Wave 2 and Wave 3 was 99%, reflecting the simplex pattern where
the correlation between the measures will be high when the two time points are closer.
The nonshared environmental correlations were low, indicating that nonshared
environmental effects were mostly age-specific.
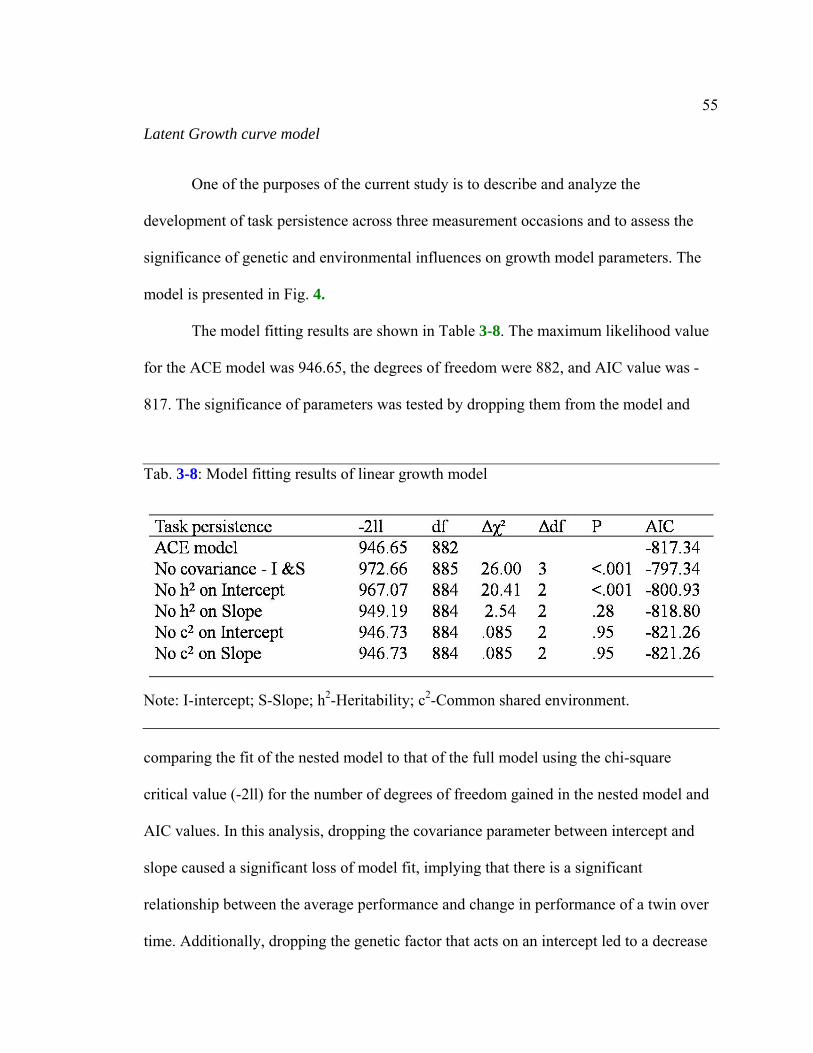
55
Latent Growth curve model
One of the purposes of the current study is to describe and analyze the
development of task persistence across three measurement occasions and to assess the
significance of genetic and environmental influences on growth model parameters. The
model is presented in Fig. 4.
The model fitting results are shown in Table 3-8. The maximum likelihood value
for the ACE model was 946.65, the degrees of freedom were 882, and AIC value was -
817. The significance of parameters was tested by dropping them from the model and
comparing the fit of the nested model to that of the full model using the chi-square
critical value (-2ll) for the number of degrees of freedom gained in the nested model and
AIC values. In this analysis, dropping the covariance parameter between intercept and
slope caused a significant loss of model fit, implying that there is a significant
relationship between the average performance and change in performance of a twin over
time. Additionally, dropping the genetic factor that acts on an intercept led to a decrease
Tab. 3-8: Model fitting results of linear growth model
Note: I-intercept; S-Slope; h2-Heritability; c2-Common shared environment.
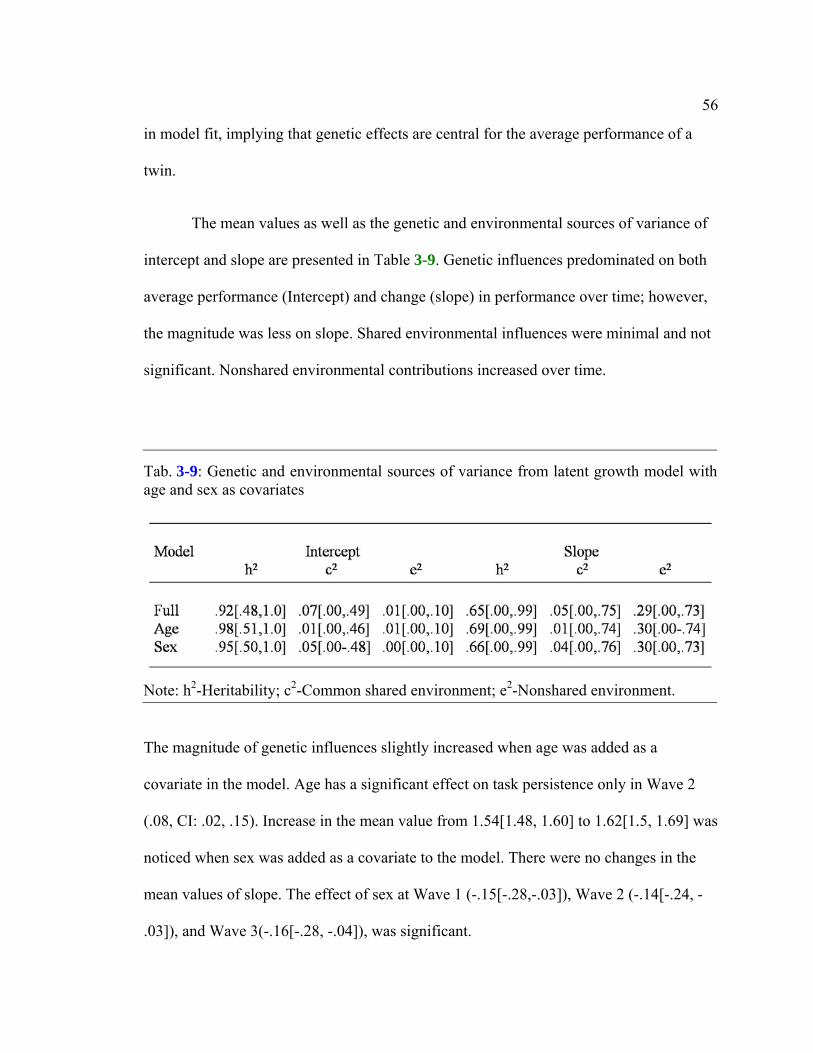
56
in model fit, implying that genetic effects are central for the average performance of a
twin.
The mean values as well as the genetic and environmental sources of variance of
intercept and slope are presented in Table 3-9. Genetic influences predominated on both
average performance (Intercept) and change (slope) in performance over time; however,
the magnitude was less on slope. Shared environmental influences were minimal and not
significant. Nonshared environmental contributions increased over time.
Tab. 3-9: Genetic and environmental sources of variance from latent growth model withage and sex as covariates
Note: h2-Heritability; c2-Common shared environment; e2-Nonshared environment.
The magnitude of genetic influences slightly increased when age was added as a
covariate in the model. Age has a significant effect on task persistence only in Wave 2
(.08, CI: .02, .15). Increase in the mean value from 1.54[1.48, 1.60] to 1.62[1.5, 1.69] was
noticed when sex was added as a covariate to the model. There were no changes in the
mean values of slope. The effect of sex at Wave 1 (-.15[-.28,-.03]), Wave 2 (-.14[-.24, -
.03]), and Wave 3(-.16[-.28, -.04]), was significant.
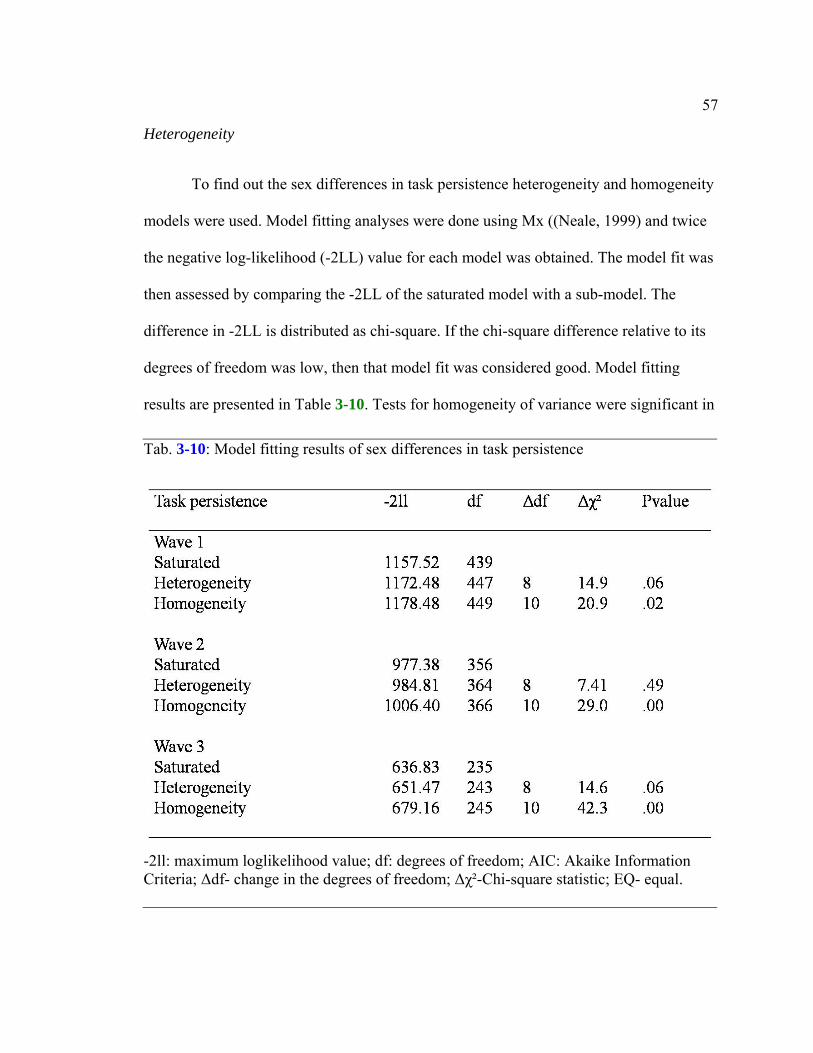
57
Heterogeneity
To find out the sex differences in task persistence heterogeneity and homogeneity
models were used. Model fitting analyses were done using Mx ((Neale, 1999) and twice
the negative log-likelihood (-2LL) value for each model was obtained. The model fit was
then assessed by comparing the -2LL of the saturated model with a sub-model. The
difference in -2LL is distributed as chi-square. If the chi-square difference relative to its
degrees of freedom was low, then that model fit was considered good. Model fitting
results are presented in Table 3-10. Tests for homogeneity of variance were significant in
Tab. 3-10: Model fitting results of sex differences in task persistence
-2ll: maximum loglikelihood value; df: degrees of freedom; AIC: Akaike Information Criteria; Δdf- change in the degrees of freedom; Δχ²-Chi-square statistic; EQ- equal.
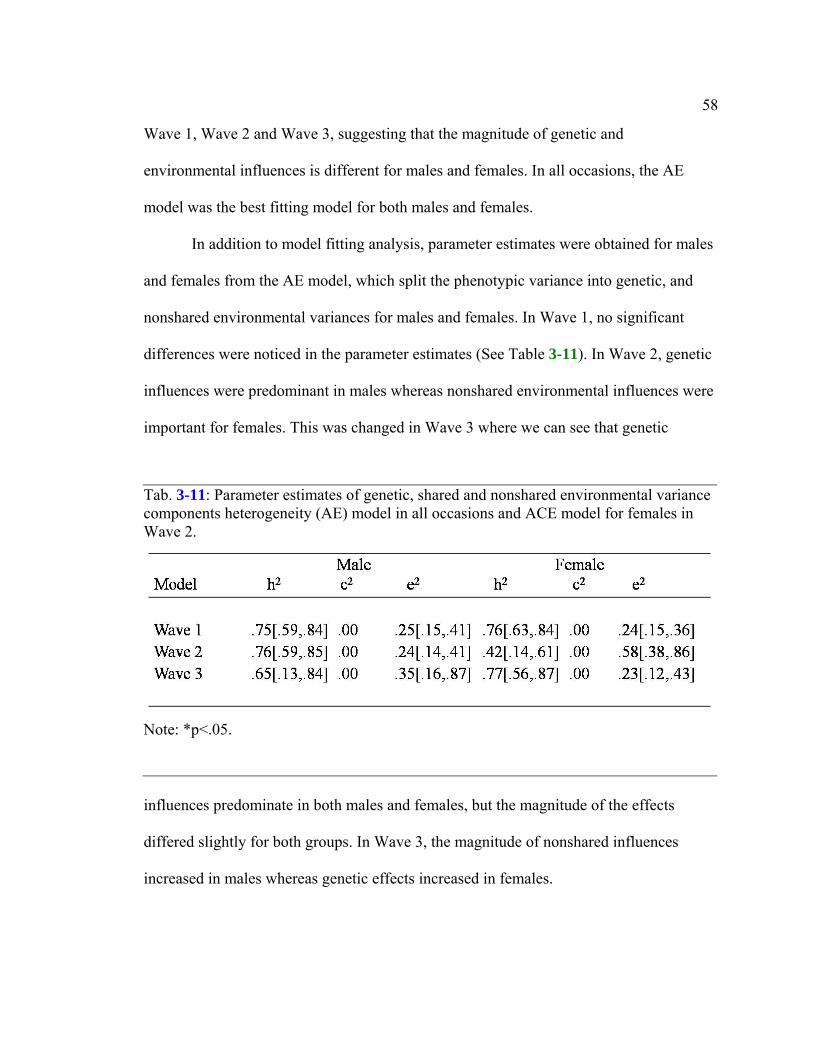
58
Wave 1, Wave 2 and Wave 3, suggesting that the magnitude of genetic and
environmental influences is different for males and females. In all occasions, the AE
model was the best fitting model for both males and females.
In addition to model fitting analysis, parameter estimates were obtained for males
and females from the AE model, which split the phenotypic variance into genetic, and
nonshared environmental variances for males and females. In Wave 1, no significant
differences were noticed in the parameter estimates (See Table 3-11). In Wave 2, genetic
influences were predominant in males whereas nonshared environmental influences were
important for females. This was changed in Wave 3 where we can see that genetic
influences predominate in both males and females, but the magnitude of the effects
differed slightly for both groups. In Wave 3, the magnitude of nonshared influences
increased in males whereas genetic effects increased in females.
Tab. 3-11: Parameter estimates of genetic, shared and nonshared environmental variance components heterogeneity (AE) model in all occasions and ACE model for females in Wave 2.
Note: *p<.05.
59
In summary, the results suggested that there were quantitative differences in the
genetic and environmental effects between males and females. An independent analysis
to test whether the same genes and environmental factors that influence one sex also
affect the opposite sex was not done because the sample has only same sex twins.
Analyses with reading related skills
The Pearson correlation between task persistence and Letter identification, Word
identification, Word attack, Expressive vocabulary, Phonological awareness, General
cognitive ability, and Reading comprehension, on average, was moderate (r range= .12 to
.28).
The Cholesky model can be used to estimate genetic, shared environmental and
nonshared environmental variances and also the correlations underlying the phenotypic
correlation between traits. First, this model was used to estimate heritability (h2), shared
environment (c2), and nonshared environment (e2) for each measure. Heritability and
environmental estimates were obtained by squaring the genetic (a), shared (c) and
nonshared environmental (e) paths, respectively. Estimates of genetic, shared and
nonshared environmental contributions to Task Persistence (TP), General Cognitive
Ability (IQ), Phonological Awareness (PA), Letter Identification (LID), Word
Identification (WID), Word Attack (WATT), Expressive Vocabulary (BNT), and
Reading Comprehension (RCOMP) are presented in Table 3-12. The statistical
significance of each estimated parameter was determined by measuring the confidence
intervals using the Mx program. Second, the contributions of genetic and environmental
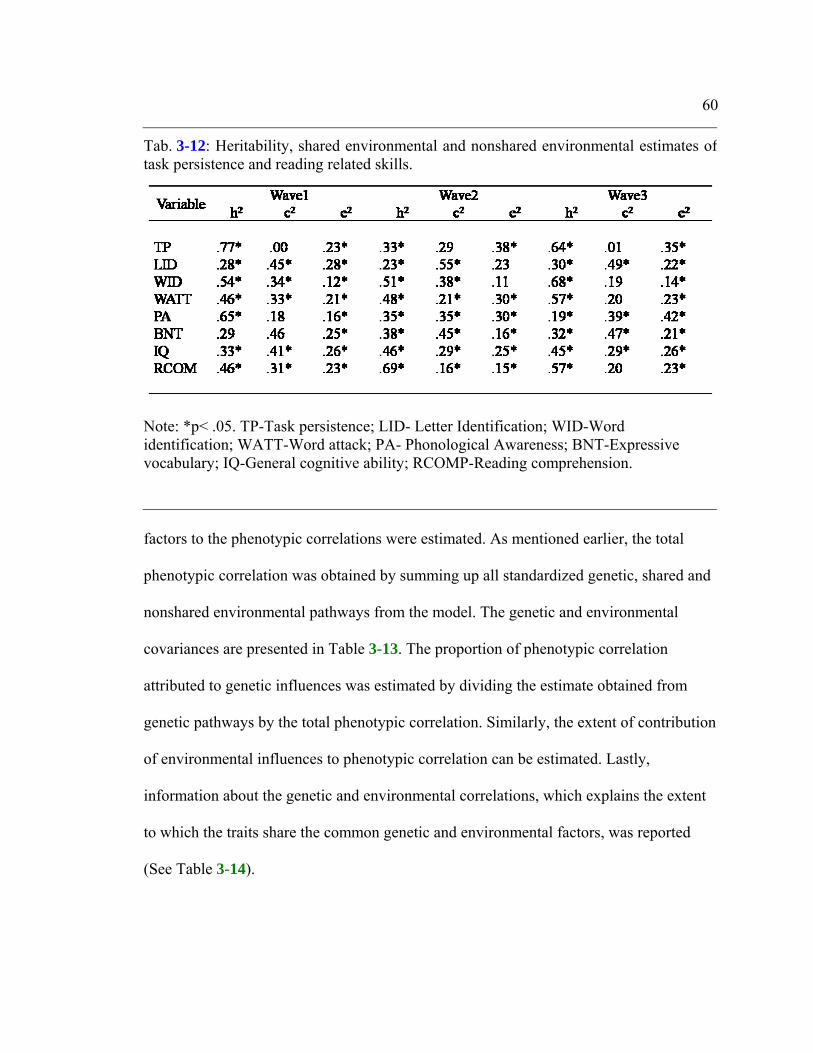
60
Tab. 3-12: Heritability, shared environmental and nonshared environmental estimates oftask persistence and reading related skills.
Note: *p< .05. TP-Task persistence; LID- Letter Identification; WID-Word identification; WATT-Word attack; PA- Phonological Awareness; BNT-Expressive vocabulary; IQ-General cognitive ability; RCOMP-Reading comprehension.
factors to the phenotypic correlations were estimated. As mentioned earlier, the total
phenotypic correlation was obtained by summing up all standardized genetic, shared and
nonshared environmental pathways from the model. The genetic and environmental
covariances are presented in Table 3-13. The proportion of phenotypic correlation
attributed to genetic influences was estimated by dividing the estimate obtained from
genetic pathways by the total phenotypic correlation. Similarly, the extent of contribution
of environmental influences to phenotypic correlation can be estimated. Lastly,
information about the genetic and environmental correlations, which explains the extent
to which the traits share the common genetic and environmental factors, was reported
(See Table 3-14).
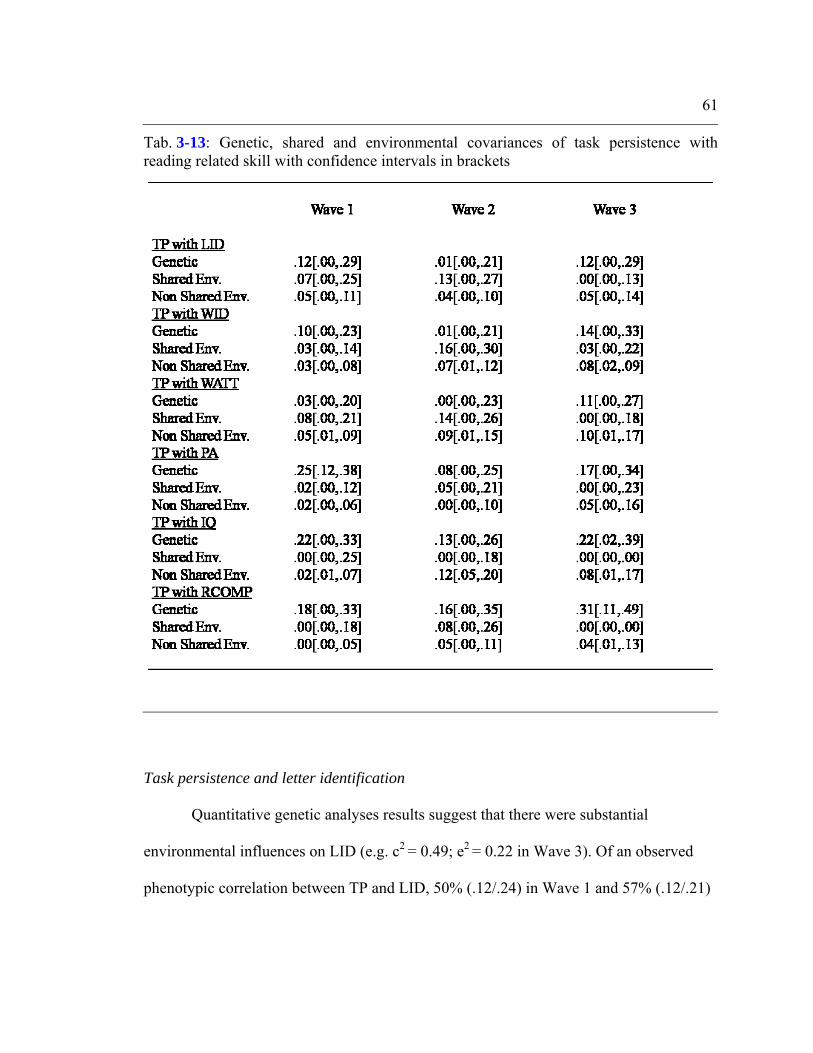
61
Tab. 3-13: Genetic, shared and environmental covariances of task persistence with reading related skill with confidence intervals in brackets
Task persistence and letter identification
Quantitative genetic analyses results suggest that there were substantial
environmental influences on LID (e.g. c2 = 0.49; e2 = 0.22 in Wave 3). Of an observed
phenotypic correlation between TP and LID, 50% (.12/.24) in Wave 1 and 57% (.12/.21)
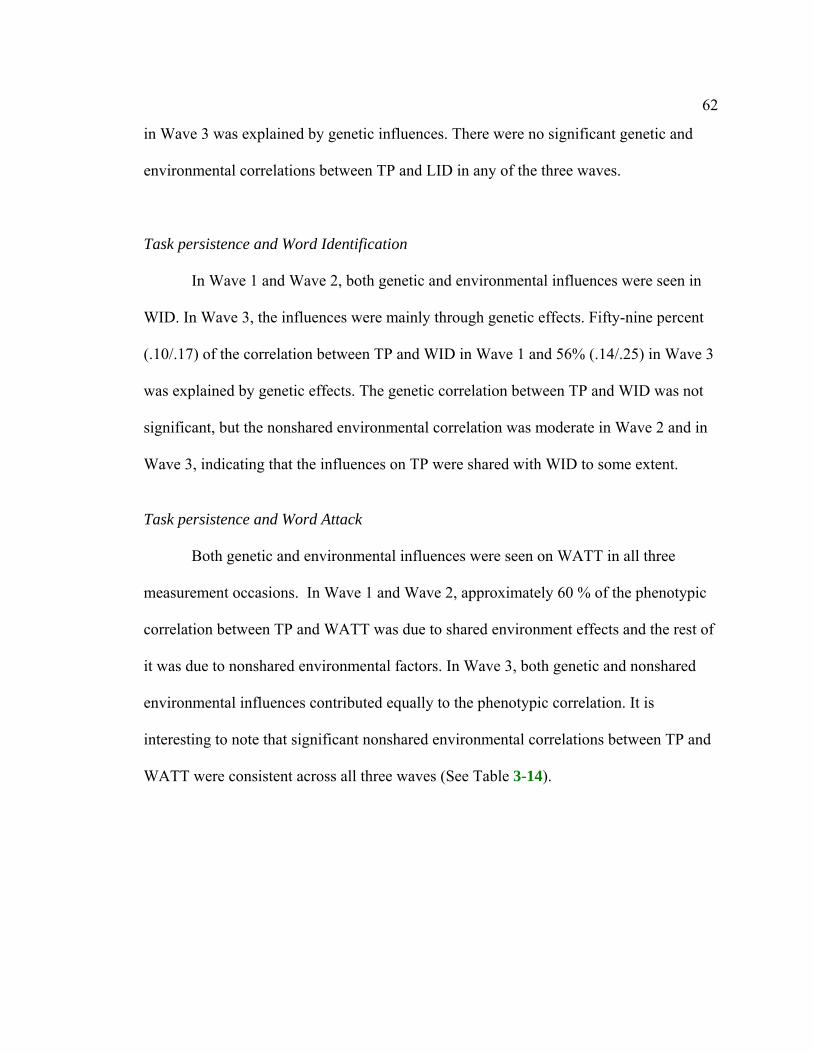
62
in Wave 3 was explained by genetic influences. There were no significant genetic and
environmental correlations between TP and LID in any of the three waves.
Task persistence and Word Identification
In Wave 1 and Wave 2, both genetic and environmental influences were seen in
WID. In Wave 3, the influences were mainly through genetic effects. Fifty-nine percent
(.10/.17) of the correlation between TP and WID in Wave 1 and 56% (.14/.25) in Wave 3
was explained by genetic effects. The genetic correlation between TP and WID was not
significant, but the nonshared environmental correlation was moderate in Wave 2 and in
Wave 3, indicating that the influences on TP were shared with WID to some extent.
Task persistence and Word Attack
Both genetic and environmental influences were seen on WATT in all three
measurement occasions. In Wave 1 and Wave 2, approximately 60 % of the phenotypic
correlation between TP and WATT was due to shared environment effects and the rest of
it was due to nonshared environmental factors. In Wave 3, both genetic and nonshared
environmental influences contributed equally to the phenotypic correlation. It is
interesting to note that significant nonshared environmental correlations between TP and
WATT were consistent across all three waves (See Table 3-14).
63
Tab. 3-14: Genetic, shared environmental and nonshared environmental correlations of task persistence with reading related variables in Wave 1, 2 and 3
Note: *P < .05; rg - genetic correlation; rc- shared environmental correlation; re -nonshared environmental correlation; LID- Letter Identification; WID-Word identification; WATT-Word attack; PA- Phonological Awareness; BNT-Expressive vocabulary; IQ-General cognitive ability; RCOMP-Reading comprehension.
Task persistence and Phonological Awareness
Univariate genetic and nonshared environmental estimates of PA were significant
in all three measurement occasions. Shared environmental influences were seen in Wave
2 and Wave 3. The contribution of genetic effects to phenotypic correlation decreased
from 85% to 50% from Wave 1 to Wave 2, and then increased to 80% in Wave 3. There
was a significant genetic correlation between TP and PA in Wave 1 only. The
environmental correlations between TP and PA were not significant.
Task persistence and Expressive vocabulary
Substantial shared environmental influences on BNT were seen on all three
measurement occasions. There were no significant genetic or environmental correlations
between TP and BNT in all three waves.
64
Task persistence and General cognitive ability
Approximately equal genetic and environmental effects were seen on general
cognitive ability in all three waves. Of an observed phenotypic correlation between TP
and IQ in Wave 1, nearly 90% (.22/.24) was explained by genetic influences, and in other
two occasions, the genetic contribution was still significant. No significant genetic or
environmental correlations were observed between TP and IQ in Wave 1. In Wave 2,
moderate nonshared environmental correlation and in Wave 3, moderate genetic and
nonshared environmental correlations were seen.
Task persistence and Reading comprehension
A substantial amount of genetic influences and moderate shared environmental
influences were seen on RCOMP. Genetic influences explained most (~85%) of the
correlation observed between TP and RCOMP in Wave 1 and Wave 3, while shared
influences contributed moderately (~25%) in Wave 2. It is interesting to note a moderate
(.49) genetic correlation between TP and RCOMP in Wave 3. Environmental correlations
were not significant.
In summary, the major source of variance contributing to the relationship between
task persistence and across all reading related skills in Wave 1 and in Wave 3 was
genetic. In Wave 2, the role of shared environmental influences was evident. Nonshared
environmental influences were significant in all three waves; however, this also includes
measurement error. Regarding the genetic and environmental correlations, significant
nonshared environmental correlations were observed between TP and WID as well as
between TP and WATT in Wave 2 and 3. In Wave 3, there was evidence that the genes
that exert influence on TP also affect higher cognitive skills such as IQ and RCOMP.
Chapter 4
DISCUSSION
Stability and change
The longitudinal quantitative genetic study extended previous research on task
persistence by exploring genetic and non-genetic etiologies of stability and change over
three measurement occasions. In the current study, four models were used to assess the
stability and change in task persistence. The Cholesky model was used as a saturated
model, and variance and covariance values provided information about change and
stability, respectively. In addition, a simplex model and a common factor independent
pathway model were used to distinguish between a transmission process and a common
factor process underlying the genetic and environmental influences on task persistence
throughout the early elementary school years. The simplex model assumes that behavior
at subsequent points in time is causally linked and earlier genetic factors or experience
influence the present behavior. The common factor independent pathway related
continuity of a behavior to stable underlying genetic and/or environmental factors. A
biometric latent growth curve model was applied to assess the change.
The results suggest that the stability of task persistence across three measurement
occasions appears to be due to genetic influences. Additionally, nonshared environmental
influences along with some age-specific genetic influences accounted for the change in
Wave 1. Shared environmental contributions were not significant.
66
In longitudinal studies, information about stability and change can be gained from
three estimates: stability coefficients, heritability, and genetic and environmental
correlations. The stability coefficient is simply the correlation of the same variable
between two points in time. In this study, the stability coefficients of task persistence
across Wave 1, Wave 2, and Wave 3 measurement occasions were .52, .51 and .49,
respectively. These values indicate moderate correlation of task persistence across the
three waves. Also, the coefficients’ values are around .50 (less than a perfect correlation
of 1.0), which indicates that there are individual differences in change. However, change
patterns do not vary randomly across individuals, in which case stability coefficients can
be zero (Hultsch, 1998).
Individual differences focus on specific differences between individuals rather
than the average differences between groups of people. Developmental behavioral
genetics is limited to the study of genetic effects on individual differences in behavior
(Plomin, 1986). Changes in genetic influences occur during development. Genetic
changes can be viewed as changes in the magnitude of genetic variance at each point in
time, as well as changes in the genetic covariance across different points in time. In this
study, genetic effects were predominant in all three waves, but differences in the
magnitude of genetic effects were still seen. In Wave 1, the heritability of task persistence
was .72, which decreased to. 37 in Wave 2 and then increased to .52 in Wave 3. The
decrease in the magnitude of heritability in Wave 2 and Wave 3 was observed as the
environmental effects increased on those two occasions. In Wave 2, shared
environmental effects on task persistence were moderate and significant. Shared
environmental influences, which account for twin similarity beyond genetic effects, were
67
seen. This is perhaps because the twins were either exposed to similar learning
environments, or were exposed to environments, which enforce their self-regulation, such
as structured playground activities, which demand more attention and regulation of their
behavior to achieve goals. It is interesting to note the increase in nonshared
environmental influences on task persistence. Nonshared environmental influences are
relevant environmental influences that are specific to each child (Dunn & Plomin, 1990).
It also includes idiosyncratic experiences such as those resulting from chance (Rowe &
Plomin, 1981). Changes in the magnitude of environmental influences are expected in
normal development, since prevailing environmental conditions influence biological
development. As children age, they tend to seek (gene-environment interactions) and
have different experiences (passive and provocative gene-environment correlations).
Measurement error is also included in this component, however.
The results of this study corroborated previous research on task persistence. For
example, a quantitative longitudinal study conducted by Goldsmith and Gottesman
(1981) in a sample of 350 twin pairs demonstrated that genetic factors play a substantial
role in the variability in task persistence observed in infants and young children. In the
same study, they observed a decrease in the magnitude of genetic influences between 4
and 7 years, which is the age of school entry. The authors explained that the variability in
the magnitude of influences could be due to new experiences in school, which may cause
changes in the influences that affect the trait. A review of quantitative genetics
longitudinal studies (Goldsmith, 1983) also documented the genetic bases for stability in
certain personality dimensions which also include persistence.
68
In addition to change in heritability, the second type of genetic change in
development is age-to-age change and continuity (Plomin, 1990). The changes may not
reflect the molecular mechanisms underlying the genetic changes. For example,
heritability measured at one point in time may be due to genes that are still operating
from a previous point in time, due to new genetic influences, or due to a single genetic
factor. These different operating mechanisms were distinguished based on the simplex
and common factor models. In this study, the simplex model showed that genetic
influences substantially accounted for the stability of task persistence. Additive genetic
transmission factors accounted for 32% of the stability. Changes in task persistence at
each occasion were brought on by innovation factors. In Wave 1, genetic factors were
responsible for the change, whereas nonshared environmental factors played a role in all
three occasions. A similar pattern was observed in a common factor independent pathway
model, where common genetic factors influence task persistence in all three occasions.
Unique nonshared environmental influences were seen in Wave 2 and Wave 3.
Continuity and change are often indexed by correlations of the same variable
scores across two points in time (Caspi, Roberts & Shiner, 2005). The genetic
correlations between closer points in time in Wave 1 and Wave 2, and in Wave 2 and
Wave 3 were .79 and .98, respectively. The genetic correlation between distant time-
points, as between Wave 1 and Wave 3 was .66. This corresponds to a transmission
pattern in which the correlations between scores of same variable measured at closer time
intervals are greater than those measured at distant time intervals.
Overall, genetic change measured as change in the magnitude of heritability and
high correlations across three waves indicated that task persistence is a stable trait.
69
Change in task persistence was due to nonshared environmental influences along with
some genetic influences in the earlier occasion.
Change in mean-level also occurs during development; this refers to changes in
the average trait level of a population (Caspi, Roberts, & Shiner, 2005). In a recent study
by Qhou et al. (2007), three developmental trajectories were identified for persistence.
The majority of children showed a high level of stable persistence from ages 5 to 10
years, and a subgroup of children with low persistence at the beginning showed an
increase along with a change in maturity level. The authors explained that the differences
observed in the stability of persistence in subgroups could be due to individual
differences. Task persistence, being a multifaceted behavior, could both influence and be
influenced by many factors, such as intelligence and parental warmth. (Deater-Deckard et
al., 2005). Differences in the genes as well as the experiences contributing to the
individual differences could affect age-related changes in the population means and
within population differences in their developmental trajectories (Zhou et al., 2007). The
findings of latent growth curve analysis in the present study suggested that genetic
influences affect the mean level of task persistence behavior. In addition, inclusions of
age and sex as covariates in the model revealed that age and sex have significant effects
on task persistence. The addition of age as a covariate in the model decreased the
magnitude of shared environmental effects. Effects of age on task persistence was
significant only in Wave 2, whereas adding sex as a covariate increased the mean value
of the intercept, and significant effects of sex were seen in all three measurement
occasions.
70
In summary, genetic influences were predominant on intercept and slope, but the
effect is more significant on intercept than on slope. The effects of nonshared
environmental influences on slope were not significant. Moreover, age and sex effects
were seen on intercept through genetic influences. The outcomes of the growth curve
analysis required further analyses exploring the effects of sex differences on task
persistence to be done.
Sex differences
From quantitative genetic methods, the etiology of the mean differences between
the sexes cannot be assessed, but contribution of the genetic and environmental effects to
group differences can be estimated (Dolan, Molenaar, & Boomsma, 1992). Tests were
conducted to examine the sex differences in means as well as variances. These tests were
mainly conducted to assess the quantitative difference i.e. differences in the magnitude of
genetic and environmental influences, though the genetic and environmental influences
were assumed to be the same. In the present study, the results suggested that there were
differences in means of task persistence scores between sex groups. In addition, tests for
homogeneity were significant, implying that the magnitude of genetic and environmental
influences on task persistence was different for males and females. Genetic influences
were predominant for both sexes in all three waves except in Wave 2, where nonshared
environmental influences were predominant in females. Though the genetic and
environmental estimates seem to be similar, there may be differences in the phenotypic
71
variance. Sex differences may be due to differences in gene expression (Turner, Cardon,
Hewitt, 1995).
In summary, there are sex differences in task persistence, which are evident from
the differences in means as well as from the differences in the extent of genetic and
environmental influences on task persistence.
Relationship between task persistence and reading related skills
Current theories posit distinct but interrelated influences on learning from
recognition and strategic networks (Rose & Strangman, 2007). To test the correlation,
multivariate genetic analyses were conducted to examine the sources of variance and
covariance between task persistence and reading related skills, such as phonological
awareness, letter identification, word identification, word attack, reading comprehension
and general cognitive ability. Multivariate analyses were conducted for each wave
separately.
Shared environmental influences were dominant on letter identification in all
three waves and genetic and nonshared influences were the second source of influences.
In contrast, genetic influences were predominant on phonological awareness in Wave 1.
The magnitude of influences decreased in later occasions, whereas shared and nonshared
influences increased across waves.
Both genetic and environmental influences were seen on Word Identification
(Word ID) and Non-word Identification (Word Attack) in all three waves. In the Byrne et
al. (2007) study, heritability and environmental estimates of word and non-word reading
72
were compared with the results of Petrill et al. study (2007) using a WRRP sample,
which was used in the present study as well. The comparison revealed some
discrepancies in sample estimates. Differences in the measures as well as the differential
effects of genes on reading accuracy and reading efficiency were accounted as the
reasons for the discrepancies (Byrne et al., 2007). This comparison is applicable only to
Wave 1 of the present study, since quantitative genetic studies of reading skills beyond
second grade are limited.
Almost equal contributions from genetic and environmental influences were
observed on general cognitive ability (IQ) in all three occasions. In reading
comprehension, both genetic and shared environmental influences were seen in the first
occasion. Later on, the magnitude of genetic influences increased and shared
environmental influences decreased.
One of the main purposes of the study was to examine the covariance between
task persistence and reading related skills. The amount of contribution to phenotypic
correlation between task persistence and reading related skills was mostly from genetic
influences, except in the correlation between task persistence and word attack, where
shared environmental influences played a major role. In addition, an estimation of
genetic, shared, and nonshared environmental correlations was done to examine whether
there was evidence of overlapping genetic or environmental influences across task
persistence and reading related skills. There were moderate (.33, .39) nonshared
environmental correlations between task persistence and word identification in Wave 2
and Wave 3. Similarly, moderate (.23-.37) nonshared correlations were observed between
task persistence and word attack; also, there is a crescendo pattern across all three waves.
73
There was a moderate (.35) genetic correlation between task persistence and phonological
awareness only in Wave 1. In subsequent waves, there were moderate to high genetic and
shared environmental correlations, but these were not significant. Though genetic and
nonshared environmental correlations between task persistence and general cognitive
ability were seen in all occasions, the nonshared environment correlation (.39) became
significant only in Wave 2, and the genetic correlation (.37) in Wave 3. There was a high
(.48) genetic correlation between task persistence and reading comprehension in Wave 3.
In summary, the extent of overlap of genes and environmental factors between
task persistence and reading related skills was moderate. If we classify the reading related
skills hierarchically, the relationship between task persistence and lower cognitive skills
such as letter identification, phonological awareness, word attack, and word identification
were fairly small whereas the relationship was moderate between task persistence and
higher cognitive skills, such as reading comprehension and general cognitive ability.
Chapter 5
CONCLUSIONS
Limitations
Apart from general methodological limitations of the twin design (Plomin et al.,
2001), a few limitations of the present study should be noted. The present study is
currently limited to three measurement occasions. The development of components of
task persistence, such as attentional and inhibitory control, continues to show age-related
improvement throughout childhood (Murphy, Eisenberg, Fabes, Shepard, & Guthrie,
1999; Williams, Ponesse, Schachar, Logan, & Tannock, 1999). Moreover, it is possible to
notice age-related changes beyond early childhood. Task persistence is a complex
process, certain components, especially inhibitory control, continues to grow throughout
childhood and adolescence (Murphy et. al, 1999; Williams, 1999). Research on
normative development of effortful control, a construct with structural and functional
overlap with task persistence, identified different patterns of trajectories in children from
5 to 10 years old (Zhou et al., 2007). Since the standard latent growth model, which relies
on the assumption that individual change is similar for all individuals, was used in this
study, different trajectory patterns were not observed. Further longitudinal studies to
detect nonlinear changes, as well as different patterns of change, are needed to elucidate
genetic and environmental contributions to intra-individual change, as well as individual
75
differences in task persistence. These goals could be achieved by using longitudinal data
from more than three occasions, and by using latent growth mixture models.
The sample contains boys and girls in approximately equal proportions.
Therefore, it seems reasonable to set up all models used in the study separately for boys
and girls. In the present study, this was not possible due to lack of power. The
quantitative differences in genetic and environmental effects on boys and girls were
estimated in this study. But, qualitative differences, such as whether the same set or
different sets of genes or environments influencing task persistence in both sexes, were
not tested. To examine the qualitative differences, opposite-sex twin pairs should be
included in the model.
Another caveat is that the measurements were based only on teacher and tester
ratings. Since different teachers reported on twins’ behaviors at different ages, the
chances of introducing bias in their reports were less. Moreover, the validity and
reliability of self-reported measures on task persistence, an aspect of self-regulation, by
early and middle- elementary school aged twins are questionable (Murphy, Eisenberg,
Fabes, Shepard, & Guthrie, 1999). Reports from teachers and testers can be used, at least
in the measurement of task persistence, because the measures of the construct relied on
observable behaviors rather than self-report of internally experienced feelings.
Another limitation of this study is related to generalizability of the results.
Beyond the limitation in generalizing the results of twin studies to singletons, issues in
operational definition of task persistence could pose problems. Studies may vary in their
definition of task persistence or differ in the methods of measuring it. These
discrepancies may cause differences in the estimates of heritability and environmental
76
effects. In addition, since the behavioral measures are mostly based on the observational
reports, perceptions, and standards set by the raters by which are used to judge the
behavior as normal or abnormal. The context in which the behavior occurs could also
affect the ratings (Silberg et al., 1994). This variability in behavioral reports by different
informants may cause discrepancies in the genetic and environmental influence
estimations. However, in this study, consistency of the task persistence behavior was
established across situations and informants.
Another caveat is that this study was limited to estimation of the main effects.
The models used in this study to estimate genetic and environmental effects are based on
the assumption that these influences are independent. This excludes the possibility of
gene-environment interactions and correlations that give specific explanations for finding
individual differences. Generally, the interactions between genetic and nonshared
influences tend to increase the proportion of nonshared influence, and the correlation
between genetic and nonshared influences acts to increase the proportion of genetic
influence (Purcell, 2002). The chances of gene-environment interactions in task
persistence cannot be excluded since the proportion of nonshared environmental
influences on task persistence increased across all three measurement occasions of this
study. It is thus crucial for future studies to assess gene-environment interactions in the
presence of gene-environment correlations and include environmental measures to
enhance the detection of such interactions.
77
Implications
The contributions from genetic and environmental effects to phenotypic variations
can be assessed from cross-sectional studies, but it is not possible to understand the
developmental nature of the trait. Longitudinal studies examine the extent to which
genetic and environmental factors are transmitted from age-to-age, changes in the
influences, or specific influences operating at specific age or a combination thereof. The
clear understanding of the developmental pattern provides guidelines for designing
interventions. In this study, it is clear that task persistence is a stable trait and genetic
factors accounted for the stability, while nonshared influences accounted for the change.
The fact that genes have a powerful influence on task persistence does not mean that the
trait is unchangeable. Identifying the mechanisms through which genes influence
behavior will allow us to design effective interventions. One possible mechanism, by
which genes affecting task persistence behavior could be through the environment of a
child, may be through the structures of environment that was imposed on a child or
through the structures that the child actively selects from the environment. Nonshared
environment may bring out traits that are latent and could thus amplify the effect of genes
(Steen, 1996).
Additional findings of this study are that the moderate level of nonshared
influences with no transmission of effects across ages supports interventions that address
issues pertinent to environmental factors specific to individuals. For example, for
children with low task persistence, instead of encouraging group activity, encouraging the
playing of interactive games on personal computers could motivate them to self-monitor
78
and regulate their attention. Players with attention deficit disorder, when they engaged in
interactive games that detect brain waves, improved in the ability to sustain attention
(Pope & Bogart, 1996). Early interventions that address the changes due to development
could have long-term beneficial impacts.
Importantly, the results showed that task persistence has a modest but significant
genetic correlation with reading related skills, especially letter identification, word
identification, phonological awareness, and reading comprehension, as well as with
general cognitive ability. It suggests that the genes of small effect size, which affect task
persistence, may have influence on reading skills. This finding has implications for
studies searching for common factors between behavior and cognitive skills, as well as
for studies searching for the genes responsible for Attention Deficit Hyperactive disorder
(ADHD) and co-morbid reading disability (RD). The results were more in favor of the
shared common etiology hypothesis (Willcutt et al., 2001) of ADHD and RD. In children
diagnosed as ADHD with RD, Stevenson et al. (2005) noticed that these disorders are
associated with the alpha 2A adrenergic receptor polymorphism with the G allele. Further
molecular genetic studies are warranted to do a systematic search for other
polymorphisms associated with these disorders.
Another implication of this study is the development of intervention strategies for
improving reading ability through its association with task persistence. It is well known
that gene expression can be altered by changes in the microenvironment of corresponding
activated brain regions. Although task persistence, a self-regulatory process, is
biologically based, it is influenced by experience as well as the environment wherein
child is placed (Blair, 2003). If this situation-specific influence on this component of

79
temperament (Teglasi, Cohn, Meshbesher, 2004), is acknowledged, interventions could
be directed at this component to improve reading ability. However, intervention studies
are needed to support the idea of using psychological concepts as a base for education.
Bibliography
Adams, M.J., & Bruck, M. (1995). Resolving the “Great Debate.” American Educator,
19(2), 7-20.
Achenbach, T. (1991). Manual for the child behavior checklist / 4-18 and 1991 profile.
Burlington, VT: University of Vermont Dept. of Psychology.
Anderson, M. (2001). Conceptions of Intelligence. Journal of Child Psychology,
Psychiatry, and Allied Disciplines, 42(3), 287-298.
Baltes, P.B., & Smith, J. (2004). Lifespan psychology: From developmental
contextualism to developmental biocultural co-constructivism. Research in
Human Development, 1(3), 123-143.
Banerjee, P.N., Tamis-Lemonda, C.S. (2007). Infants’ persistence and mothers’ teaching
as predictors of toddlers’ cognitive development. Infant Behavior & Development,
30, 479-491.
Barkley, R.A. (1997). Behavioral inhibition, sustained attention, and executive functions:
Constructing a unifying theory of ADHD. Psychological Bulletin, 121, 65-94.
Barkley, R.A., (1998). Attention-deficit hyperactivity disorder: A handbook for diagnosis
and treatment. New York: Guildford Press.
Bayley, N. (1969). Manual for the Bayley Scales of Infant Development. SanAntonio,
TX: The Psychological Corporation.
Blair, C. (2003). Self-regulation and school readiness. Eric Digest.
81
Blair, C., Zelazo, P.D., & Greenberg, M.T. (2005). The measurement of executive
functions in young children. Developmental Neuropsychology, 28, 561-571.
Boomsma, D.I., Martin, N.G., & Molenaar, P.C.M. (1989). Factor and simplex models
for repeated measures: Application to two psychomotor measures of alcohol
sensitivity in twins. Behavior Genetics, 19, 79-96.
Boomsma, D.I., & Molenaar, P.C.M. (1987). The genetic analysis of repeated measures I:
Simplex models. Behavior Genetics, 17, 111-123.
Borkenau, P., Riemann, R., Angleitner, A., & Spinath, F.M. (2001). Genetic and
environmental influences on observed personality: Evidence from the German
observational study of adult twins. Journal of Personality and Social Psychology,
80, 655-668.
Bramlett, R.K., Scott, P., Rowell, R.K. (2000). A comparison of temperament and social
skills in predicting academic performance in first graders. Special services in the
schools, 16(1-2), 147-158.
Bryk, A.S. & Raudenbush, S.W. (1987). Application of hierarchical linear models to
assessing change. Psychological Bulletin, 101(1), 147-158.
Bush, G., Luu, P. & Posner, M.I. (2000). Cognitive and emotional influences in anterior
cingulate cortex. Trends in Cognitive Neuroscience, 4, 209-249.
Buss, A.H., & Plomin, R. (1984). Temperament: Early developing personality traits.
Hillsdale, NJ: Erlbaum.
Byrne, B., Delaland, C., Fielding-Barnsley, R., Quain, P., Samuelsson, S., Hoien, T.,
Corley, R., DeFries, J.C., Wadsworth, S., Willcutt, E., & Olson, R.K. (2002).
82
Longitudinal twin study of early reading development in three countries:
Preliminary results. Annals of Dyslexia, 52, 49–73.
Byrne, B., Samuelsson, S., Wadsworth, S., Hulslander, J., Corley, R., DeFries, J.C.,
Quain, P., Willcutt, E.G., & Olson, R.K. (2007). Longitudinal twin study of early
literacy development: Preschool through Grade 1. Reading and Writing: An
Interdisciplinary Journal, 20, 77-102.
Byrne, B., Wadsworth, S., Corley, R., Samuelsson, S., Quain, P., DeFries, J.C., Willcutt,
E., & Olson, R.K. (2005). Longitudinal twin study of early literacy development:
Preschool and kindergarten phases. Scientific Studies of Reading, 9, 219-235.
Casey, B.J., Trainor, R.J., Orendi, J.L., Schubert, A.B., Nystrom, L.E., Giedd, J.N.,
Castellanos, F.X., Haxby, J.V., Noll, D.C., Cohen, J.D., Forman, S.D., Dahl, R.E.
& Rapoport, J.L. (1997). A developmental functional MRI study of prefrontal
activation during performance of a go-no go task. Journal of Cognitive
Neuroscience, 9(6), 835-847.
Caspi, A., Roberts, B.W., Shiner, R. (2005). Personality development: stability and
change. Annual Review of Psychology, 56, 453-484.
Catts, H.W. (1996). Defining dyslexia as a developmental language disorder: An
expanded view. Topics in Language Disorders, 16(2), 14-29.
Chall, J.S. (1983). Stages of reading development. New York: McGraw-Hill.
Charak, D.A. (2000). Temperamental task persistence in the metacognitive-motivational
model: Effects on fifth-graders' reading comprehension. Ph.D. dissertation,
University of Georgia, United States-Georgia.
83
Deater-Deckard, K. (2000). Parenting and child behavioral adjustment in early childhood:
A quantitative genetic approach to studying family processes. Child Development,
71, 468-484.
Deater-Deckard, K., Petrill, S. A., Thompson, L.A., & DeThorne, L.S. (2005). A cross-
sectional behavioral genetic analysis of task persistence in the transition to middle
childhood. Developmental Science, 8(3), F21-F26.
Deater-Deckard, K., Petrill, S.A., Thompson, L.A., DeThorne, L.S. (2006). A
longitudinal behavior genetic analysis of task persistence. Developmental Science,
9, 498-504.
Dempster, F.N. (1991). Inhibitory processes: A neglected dimension of intelligence.
Intelligence, 15, 157-173.
Dolan, C.V., Molenaar, P.C.M. and Boomsma, D.I. (1992). Decomposition of
multivariate phenotypic means in multigroup genetic covariance structure
analysis. Behavior Genetics, 22, 319-335.
Dunn, J., & Plomin, R. (1990). Separate lives: Why siblings are so different. New York:
Basic Books.
Ehri, L.C., Nunes, S.R., Willows, D.M., Schuster, B.V., Yaghoub-Zadeh, Z. & Shanahan,
T. (2001). Phonemic awareness instruction helps children learn to read: Evidence
from the National Reading Panel’s meta-analysis. Reading Research Quarterly,
36, 250-287.
Else-Quest, N.M., Hyde, J.S., Goldsmith, H.H., & Van Hulle, C. (2006). Gender
differences in temperament: A meta-analysis. Psychological Bulletin, 132, 33-72.
84
Fan, J., McCandliss, B.D., Sommer, T., Raz, A. & Posner, M.I. (2002). Testing the
efficiency and independence of attentional networks. Journal of Cognitive
Neuroscience, 14, 340-347.
Fan, J., Wu, Y., Fossella, J. & Posner, M.I. (2001). Assessing the heritability of
attentional networks. BioMed Central Neuroscience, 2(14).
Fossella, J., Sommer, T., Fan, J., Wu, Y., Swanson, J.M., Pfaff, D.W., & Posner, M.I.
(2002). Assessing the molecular genetics of attention networks. BMC
Neuroscience, 3(14).
Fyrsten, S., Nurmi, J.E., & Lyytinen, H. (2006). The role of achievement beliefs and
behaviors in spontaneous reading acquisition. Learning and Instruction, 16(6),
569-582.
Gagne, J.R., Saudino, K.J., & Cherny, S.S. (2003). Genetic influences on temperament in
early adolescence. A multimethod perspective In S.A. Petrill, R. Plomin, J.C.
DeFries, & J.K. Hewitt (Eds.), Nature, nurture, and the transition to early
adolescence (pp. 166–184). Oxford University Press, NewYork.
Goldsmith.H.H. (1983). Genetic influences on personality from infancy to adulthood.
Child Development, 54, 2, 331-355.
Goldsmith, H.H. (1991). A zygosity questionnaire for young twins: A research note.
Behavior Genetics, 21(3), 257-269.
Goldsmith, H.H., Buss, K.A., & Lemery, K.S. (1997). Toddler and childhood
temperament: Expanded content, stronger genetic evidence, new evidence for the
importance of environment. Developmental Psychology, 33, 891-905.
85
Goldsmith, H.H., & Gottesman I.I. (1981).Origins of variation in behavioral style: A
longitudinal study of temperament in young twins. Child Development, 52(1), 91-
103.
Goswami, U., & Bryant, P. (1990). Phonological skills and learning to read. Hove, U.K.:
Lawrence Erlbaum Associates.
Gusnard, D.A., Akbudak, E., Sulman, G.L. & Raichle, M. (2001). Medial prefrontal
cortex and self-referential mental activity: Relation to a default mode of brain
function. Proceedings of the National Academy of Sciences, 98, 4259-4264.
Halverson, C., & Deal, E.J. (2001). Temperamental change, parenting and the family
context. pp.61-79. Temperament in Context. Ed. Wachs, T.D., Kohnstamm, G.A.
LEA. Eds.
Harlaar, N., Hayiou-Thomas M.E., Plomin, R. (2005) Reading and general cognitive
ability: A multivariate analysis of 7-year-old twins. Scientific Studies of Reading,
9, 197-218.
Harlaar, N., Spinath, F.M., Dale, P.S., & Plomin, R. (2005). Genetic influences on word
recognition abilities and disabilities. Journal of Child Psychology and Psychiatry,
46, 373-384.
Harlaar, N., Dale, P.S., & Plomin, R. (2007). From learning to read to reading to learn:
Substantial and stable genetic influence. Child Development, 78, 116-131.
Herdman, C.M. (1992). Attentional resource demands of visual word recognition in
naming and lexical decisions. Journal of Experimental Psychology: Human
Perception and Performance, 80(2), 460-470.
86
Hidi, S. (1995). A re-examination of the role of attention in learning from text.
Educational Psychology Review, 7 (4), 323-350.
Hultsch, D.F., Hertzog, C., Dixon, R.A., & Small, B.J. (1998). Memory change in the
aged. New York: Cambridge University Press.
Jennings, K.D., Connors, R.E., Sankaranarayan, P., & Katz, E. (1982). Mastery
motivation in physically handicapped and nonhandicapped preschool children.
Paper presented at the American Academy of Child Psychiatry Meeting,
Washington, DC.
Kaplan, E., Goodglass, H., & Weintraub, S. (1983). The Boston Naming test.
Philadelphia: Lea and Febiger.
Kelley, S.A., & Jennings, K.D. (2003). Putting the pieces together: Maternal depression,
maternal behavior, and toddler helplessness. Infant Mental Health Journal, 24(1),
74-90.
Karnes, M., Johnson, L., Cohen, T., Shwedel, A. (1985). Facilitating school success
among mildly and moderately handicapped children by enhancing task
persistence. Journal of the Division for Early Childhood, 9, 151-161.
Kochanska, G. (1991). Socialization and temperament in the development of guilt and
conscience. Child Development, 62, 1379-1392.
Kochanska,G., Murray,K.L., & Harlan, E.T.(2000). Effortful control in childhood:
Continuity and change, antecedents, and implications for social development.
Developmental Psychology, 36, 220-232.
87
Lazar, J.W., & Frank, Y. (1998). Frontal systems dysfunction in children with attention-
deficit hyperactivity disorder and learning disabilities. Journal of Neuropsychiatry
and Clinical Neurosciences, 10(2), 160-167.
Lemery, K.S., Goldsmith, H.H., Klinnert, M.D., and Mrazek, D.A. (1999).
Developmental models of infant and childhood temperament. Developmental
Psychology, 35, 189-204.
Light, J.G., Pennington, B.F., Gilger, J.W., & DeFries, J.C. (1995). Reading disability
and hyperactivity disorder: Evidence for a common genetic etiology.
Developmental Neuropsychology, 11, 323-335.
Lundberg, I., & Gorel, S. (2006). Reading, Arithmetic, and Task Orientation- How are
they related? Annals of Dyslexia, 56(2), 361-378.
Lyon, G.R. (1989). IQ is irrelevant to the definition of learning disabilities: A position in
search of logic and data. Journal of Learning Disabilities, 22, 504-512.
Lyon, G.R. (1995). Toward a definition of dyslexia. Annals of Dyslexia, 45, 3-27.
Martin, R.P. (1989). Activity level, distractibility, and persistence: Critical characteristics
in early schooling. In G.A. Kohnstamm, J.E. Bates, & M.K. Rothbart (Eds.),
Temperament in childhood (pp. 451-461). New York: Wiley.
McArdle, J.J. (1986). Latent variable growth within behavior genetic models. Behavior
Genetics, 16, 163-200.
McCall, R.B. (1981). Nature-Nurture and the two realms of development: A proposed
integration with respect to mental development. Child Development, 52(1), 1-12.
McCartney, K., & Berry, D. (2005). Gene-environment processes in task persistence.
Trends in Cognitive Sciences, 9 (9), 407- 408.
88
Meaburn, E., Harlaar, N., Craig, I.W., Schalkwyk, L.C, & Plomin, R. (2007). QTL
associations scan of early reading disability and ability using pooled DNA and
100 K SNP microarrays in a sample of 5,760 children. Molecular Psychiatry,
online.
Murphy, B.C., Eisenberg, N., Fabes, R.A., Shepard, S., & Guthrie, I.K. (1999).
Consistency and change in children’s emotionality and regulation: A longitudinal
study. Merrill–Palmer Quarterly, 45, 413-444.
National Reading Panel. (2000). Teaching Children to Read: An Evidence-Based
Assessment of the Scientific Research Literature on Reading and Its Implications
for Reading Instruction. Washington, DC: National Institute of Child Health and
Human Development.
Naglieri, J. (2001). Do ability and reading achievement correlate? Journal of Learning
Disabilities, 34(4), 304-305.
Neale, M.C. (1994). Mx: Statistical modeling (2nd ed.). Richmond, VA: Department of
Psychiatry, Medical college of Virginia.
Neale, M.C., Boker, S.M., Xie, G., & Maes, H.H. (1999). Mx: Statistical Modeling
(Version 5th Ed.). Richmond, VA: Department of Psychiatry.
Neale, M.C., Boker, S.M., Bergeman, C.S., Maes, H.H. (2006). Quantitative methods:
Methodological issues in aging research. Lawrence Erlbaum Associates,
Publishers, Mahwah, New Jersey.
Neale, M.C., & Cardon, L.R. (1992). Methodology for genetic studies of twins and
families. Dordrecht, The Netherlands: Kluwer Academic publishers.
89
Neale, M.C., & McArdle, J.J. (2000). Structured latent growth curves for twin data. Twin
Research, 3, 165-177.
Olson, R.K. (2007). Introduction to the special issue on genes, environment, and reading.
Reading and Writing, 20, 1-11
Pajares, F. (1996). Self-efficacy beliefs in academic settings. Review of Educational
Research, 66(4), 543-578.
Partridge, T. (2005). Are genetically informed designs genetically informative? Comment
on McGue, Elkins, Walden, and Iacono (2005) and quantitative behavioral
genetics. Developmental Psychology, 41(6), 985-988.
Petrill, S.A., & Deater-Deckard, K. (2004). Task orientation, parental warmth and SES
account for a significant proportion of the shared environmental variance in
general cognitive ability in early childhood: Evidence from a twin study.
Developmental Science, 7(1), 25-32.
Petrill, S.A., & Deater-Deckard, K., Thompson, L.A., DeThorne, L.S. & Schatschneider,
C. (2006a). Reading skills in early readers: Genetic and shared environmental
influences. Journal of Learning Disabilities 39(1) 48-55.
Petrill, S.A., Deater-Deckard, K., Thompson, L.A., Schatschneider, C., DeThorne, L.S.,
& Vandenbergh, D.J. (2007). Longitudinal genetic analysis of early reading: The
Western Reserve Reading Project. Reading & Writing: An Interdisciplinary
Journal, 20, 127–146.
Pizzagalli, D.A., Peccoralo, L.A., Davidson, R.J. & Cohen, J.D. (2006). Resting anterior
cingulate activity and abnormal responses to errors in subjects with elevated
90
depressive symptoms: A 128-channel EEG study. Human Brain Mapping, 27,
185-201.
Plomin, R. (1986). Development, genetics, and psychology. Hillsdale, NJ: Erlbaum.
Plomin, R. (1990). Nature and nurture: An Introduction to Human Behavioral Genetics.
Pacific Grove, CA: Brooks/Cole.
Plomin, R. (2004). Genetics and Developmental Psychology. Merrill-Palmer Quarterly,
50(3), 341-352.
Plomin, R., & DeFries, J.C. (1981). Multivariate behavioral genetics and development:
Twin studies. In L.Gedda, P. Parisi, & W.E. Nance (Eds.).
Plomin, R., DeFries, J.C., McClearn, G.E., & McGuffin, P. (2001). Behavioral Genetics.
(4th Edition). New York: Worth Publishers.
Pope, A.T., & Bogart, E.H. (1996). Extended attention span training system: Video game
neurotherapy for attention deficit disorder. Child Study Journal, 26, 39-50.
Posner, M.I., & Raichle, M.E. (1994). Images of Mind. New York: W. H. Freeman.
Price, T.S., Freeman, B., Craig, I.W., Petrill, S.A., Ebersole, L. & Plomin, R. (2000).
Infant zygosity can be assigned by parental report questionnaire data. Twin
Research, 3, 129-133.
Price et al., (2005).Continuity and change in preschool ADHD symptoms: Longitudinal
genetic analysis with contrast effects. Behavior Genetics, 35, 121-135.
Purcell, S. (2002). Variance components models for gene-environment interaction in twin
analysis. Twin Research, 5, 554–571.
91
Ready, D.D., LoGerfo, L.F., Lee,V.E., & Burkam, D.T.(2005). Explaining girls’
advantage in kindergarten literacy learning: Do classroom behaviors make a
difference? Elementary School Journal, 106(1), 21-38.
Reynolds, C.A., Finkel, D., Gatz, M., & Pedersen, N.L. (2002). Sources of influence on
rate of cognitive change over time in Swedish twins: an application of latent
growth models. Experimental Aging Research, 28, 407-433.
Robertson, C., & Salter, W. (1997). The Phonological Awareness Test. East Moline, IL:
LinguiSystems, Inc.
Rothbart, M.K. (1989). Temperament and development. In G.A. Kohnstamm, J.A. Bates,
& M.K. Rothbart (Eds.), Temperament in Childhood (pp.187-247). New York:
Wiley.
Rothbart, M.K., & Bates, J.E. (1998). Temperament. In W. Damon & N. Eisenberg
(Eds.), Handbook of child psychology, Vol.3: Social, emotional, and personality
development (Fifth ed.; pp.105-176). New York: John Wiley & Sons.
Rothbart, M.K., Derryberry, D., and Posner, M.I. (1994). A psychobiological approach to
the development of temperament. In J.E. Bates and T.D.Wachs (Eds.),
Temperament: Individual Differences at the Interface of Biology and Behavior
(pp. 83-116). Washington, DC: American Psychological Association.
Rothbart, M.K., Ellis, L.K., Reuda, M.R., Posner, M.I. (2003). Developing mechanisms
of temperamental effortful control. Journal of Personality, 71(6), 1113-1144.
92
Rothbart, M.K., & Putnam, S. (2002). Temperament and socialization. In L. Pulkinnen &
A. Caspi, (Eds.), Paths to successful development: Personality in the life course
(pp.19-45). Cambridge, UK, New York: Cambridge University Press.
Rose, D.H. & Strangman, N. (2007). Universal Design for Learning: meeting the
challenge of individual learning differences through a neurocognitive perspective.
Universal Access in the Information Society, 5(4), 381-391.
Rowe, D.C., & Plomin, R. (1981). The importance of nonshared (E1) environmental
influences in behavioral development. Developmental Psychology, 17, 517-531.
Rueda, M.R., Posner, M.I., & Rothbart, M.K. (2005). The development of executive
attention: contributions to the emergence of self regulation. Developmental
Neuropsychology, 28, 573-594.
Rueda, M.R., Rothbart, M.K., McCandliss, B.D., Saccomanno, L., & Posner, M.I. (2005).
Training, maturation and genetic influences on the development of executive
attention. Proceedings of the National Academy of Sciences of the USA, 102,
14931–14936.
Ruff, H.A., & Rothbart, M.K. (1996). Attention in early development: Themes and
variations. New York: Oxford University Press.
Rucklidge, J.J., & Tannock, R. (2002). Neuropsychological profiles of adolescents with
ADHD: effects of reading difficulties and gender. Journal of Child Psychology
and Psychiatry, 43(8), 988-1003.
Silberg, J.L., Erickson, M.T., Meyer, J.M., Eaves, L.J., Rutter, M.L., & Hewitt, J.K.
(1994). The application of structural equation modeling to maternal ratings of

93
twins’ behavioral and emotional problems. Journal of Consulting and Clinical
Psychology, 62(3), 510-521.
Stanovich, K.E., Cunningham, A.E., and Cramer, B. (1984). Assessing phonological
awareness in kindergarten children: Issues of task compatibility. Journal of
Experimental Child Psychology, 38, 175-190.
Steen, G.R. (1996). DNA and Destiny: Nature and Nurture in Human Behavior. DaCapro
Press.
Stevenson, J., Asherson, P., Hay, D., Levy, F., Swanson, J., Thapar, A. & Willcutt, E.
(2005) Characterizing the ADHD phenotype for genetic studies. Developmental.
Science., 8, 115-121.
Tabachnick, B.G. & Fidell, L.S. (1996). Using Multivariate Statistics. NY:
HarperCollins.
Teglasi, H., Cohn, A., & Meshbesher, N. (2004). Temperament and Learning Disability,
Learning Disability Quarterly, 27, 9-20.
Thorndike, R.L., Hagen, E.P., & Sattler, J.M. (1986). Stanford-Binet Intelligence Scale:
Guide for administering and scoring the fourth edition. Chicago: Riverside.
Torgesen, J.K., Wagner, R.K., & Rashotte, C.A. (1994). Longitudinal studies of
phonological processing and reading. Journal of Learning Disabilities, 27, 276-
286.
Torgesen, J.K., Wagner, R.K., & Rashotte, C.A. (1997). The prevention and remediation
of severe reading disabilities: Keeping the end in mind. Scientific Studies of
Reading, 1, 217-234.
94
Turner, J.R., Cardon, L., & Hewitt, J.K. (Eds.). (1995). Behavior genetic approaches in
behavioral medicine. Plenum Press, New York.
Valiente, C., Eisenberg, N., Smith, C.L., Reiser, M., Fabes, R.A., Losoya, S. Guthrie,
I.K., Murphy, B.C. (2003). The relation of effortful control and reactive control to
children’s externalizing problems: A longitudinal assessment. Journal of
Personality, 71(6), 1171-1196.
Van Beijisterveldt, C.E.M., Bartels, M., Hudziak, J.J. & Boomsma, D.I. (2003). Causes
of stability of aggression from early childhood to adolescence: A longitudinal
genetic analysis in Dutch twins. Behavior Genetics, 33(5), 591-605.
Vygotsky, L.S., Hanfmann, E., & Vakar, G. (1962). Thought and Language. MIT Press,
Wiley, New York
Wagner, R.K., Torgesen, J.K., & Rashotte, C.A. (1994). The development of reading-
related phonological processing abilities: New evidence of bi-directional causality
from a latent variable longitudinal study. Developmental Psychology, 30, 73-87.
Woodcock, R.W. (1987). Woodcock reading mastery test-revised. Circle Pines, MN:
American Guidance Service.
Willcutt, E.G., Betjemann, R.S., Wadsworth, S.J., Samuelsson, S., Corley, R., DeFries,
J.C., Byrne, B., Pennington, B.F., Olson, R.K. (2007). Preschool twin study of the
relation between attention-deficit/hyperactivity disorder and prereading skills.
Reading and Writing, 20, 103-125.
95
Willcutt, E.G., Pennington, B.F., & DeFries J.C. (2000). Etiology of inattention and
hyperactivity/impulsivity in a community sample of twins with learning
difficulties. Journal of Abnormal Child Psychology, 28, 149-159.
Willcutt, E.G., Pennington, B.F., & DeFries, J.C. (2000b). A twin study of the etiology of
comorbidity between reading disability and attention-deficit/hyperactivity
disorder. American Journal of Medical Genetics (Neuropsychiatric Genetics), 96,
293-301.
Willcutt, E.G., Pennington, B.F., Boada, R., Ogline, J.S., Tunick, R.A., Chhabildas, N.A.,
& Olson, R.K. (2001). A comparison of the cognitive deficits in reading disability
and attention-deficit/hyperactivity disorder. Journal of Abnormal Psychology,
110, 157-172.
Willcutt, E.G., Pennington, B.F., Smith, S.D., Cardon, L.R., Gayán, J., Knopik, V.S.,
Olson, R.K., & DeFries, J.C. (2002). Quantitative trait locus for reading disability
on chromosome 6p is pleiotropic for ADHD. American Journal of Medical
Genetics (Neuropsychiatric Genetics), 260-268.
Willcutt, E.G., Pennington, B.F., Olson, R.K., Chhabildas, N., & Hulslander, J (2005).
Neuropsychological analyses of comorbidity between reading disability and
Attention deficit hyperactivity disorder: In search of the common deficit.
Developmental Neuropsychology, 27(1), 35-78.
Willett, J.B., Singer, J.D., & Martin, N.C. (1998).The design and analysis of longitudinal
Studies of development and psychopathology in context: Statistical models and
methodological recommendations. Development and Psychopathology, 10, 395–
426.
96
Williams, B.R., Ponesse, J.S., Schachar, R.J., Logan, G.D., & Tannock, R. (1999).
Development of inhibitory control across the life span. Developmental
Psychology, 35, 205-213.
Yarrow, L.J., Morgan, G.A., Jennings, K.D., Harmon, R.J., & Gaiter, J.L. (1982). Infants'
persistence at tasks: Relationships to cognitive functioning and early experience.
Infant Behavior and Development, 5, 131-141.
Zhou, Q., Hofer, C., Eisenberg, N., Reiser, M., Spinrad, T.L., & Fabes, R.A. (2007). The
developmental trajectories of attention focusing, attentional and behavioral
persistence, and externalizing problems during school age years. Developmental
Psychology, 43, 369-385.
Zumberge, A., Baker, L.A., Manis, F.R. (2007). Focus on words: A twin study of reading
and attention. Behavior Genetics, 37, 284-293.
VITA
Saradha Ramesh
Office Address: Home Address: Center for Developmental and Health Genetics 800 Bulfinch Drive 101 Amy Gardner House Apt. 314 The Pennsylvania State University Andover, MA 01810 University Park, PA 16802 Phone: (978) 208-8659 Phone: (814) 865-4668 E-mail: [email protected]
Education:
1986-1992 M.B.B.S. Thanjavur Medical College, Thanjavur, India Selected Professional Experiences at The Pennsylvania State University:
2004-2007 Graduate Research Assistant; Center for Developmental and Health Genetics 2007 Course Instructor; BBH 119, Behavior, Health & Disease; Department of Biobehavioral Health; Summer Session #1 2004-2007 Graduate Teaching Assistant; Department of Biobehavioral Health. Honors and Special Awards:
November 2005: Hintz Family Fellowship for Graduate Excellence
Additional Relevant Training:
August 2005 SGDP Summer School Linkage and Association Workshop (London, UK). March 2006 Annual International Workshop on the Methodology of Twin and Family Studies (Boulder, CO).