Embed Size (px)
Citation preview

State Auditor’s Office Performance Audit
July 31, 2013
Developmental Disabilities in Washington: Increasing Access and Equality
Washington State AuditorTroy Kelley
AU
DITOR OF STATE
W
A S H I N G T O NNOV 11, 1889
Report No. 1009938

Table of ContentsExecutive Summary ...................................................................................................3
Introduction and Background ...............................................................................5
Audit Results
Access to services ................................................................................................. 10
Service delivery ..................................................................................................... 14
Funding .................................................................................................................... 23
Quality of services and results for clients .................................................... 27
Recommendations .................................................................................................. 34
Agency Responses .................................................................................................. 35
Appendix A: Initiative 900 .................................................................................... 37
Appendix B: Methodology ................................................................................... 38
Appendix C: Acuity Levels and Residential Settings................................... 43
Appendix D: Acuity Levels and Expenditures ............................................... 44
State Auditor’s Office Contacts ........................................................................... 52
The State Auditor’s Office contracted with BERK and Human Services Research Institute
(HSRI) to conduct this audit.

Executive Summary
3
Washington provides services to help people with developmental disabilities – such as intellectual disability, cerebral palsy, epilepsy, autism, and other neurological disorders – live safe, healthy, and independent lives. The disabilities are life-long and people often have significant impairments that require daily help and support. The Developmental Disabilities Administration provides services such as housing, medical care, personal care, and job training, either directly or by contracting with businesses.
Those who receive services are generally pleased with their results. However, many receive no services at all. Most clients live in places that allow them the same opportunities to participate in community activities as individuals without disabilities. When surveyed, they give good marks to the services they receive. Further, Washington’s Employment First policy has made it a national leader in employment opportunities for people with developmental disabilities.
However, for those who have asked for help but are waiting for services, life is a struggle. Families we spoke to have experienced financial hardships, psychological and emotional stress, and strain on family relationships.
Washington’s challenge is to make more equitable services available to all the eligible people who are asking for them.
• At present, more than 15,000 people who have applied and are eligible receive no services from the state. Those on the waitlist have been waiting an average of 3.5 years. The Administration cannot prioritize those waiting for services because it does not gather the information needed. Beyond the waitlist, an estimated 46,200 people could receive services but have never requested them, whatever their reasons.
• The 20,500 people the state supports may live in the family home or their own apartment, with others in group homes, or in one of the state’s Residential Habilitation Centers (RHCs). Supporting a client at an RHC, however, incurs twice the average cost of the most expensive community-based residential service option, and about ten times the average cost of a client living in their own homes or with family. Even clients with the most complex needs, can be served in the community at a fraction of the cost of RHC care.
• Washington relies on four RHCs to help people who experience crisis, such as the death of a caregiver or a dramatic increase in behavioral challenges. There are virtually no crisis stabilization programs at the community care level near the majority of clients. There is just one community-based crisis stabilization program, in Lakewood, and it serves only children.
12,250 people receive full
services
15,100 peopleare on the
waitlist7,800 people
receive partial services
Of the 35,150 people who have appliedand are eligible for services...
“A system of haves and have-nots is not ok.” – Vancouver parent
“A waiver [for services] is a ‘golden ticket.’” – Spokane client
“People say we are lucky. Services should not be a matter of luck.” – Seattle parent

4
• State Auditor’s Office • Developmental Disabilities Program Evaluation •
4
• The opportunities available for integrated employment depend largely upon where a person lives.
• Employment programs are administered at the county level: some favor placing individuals in integrated employment settings in the community while others offer more segregated employment options for people with disabilities.
Recommendations
To better balance funding inequities and reduce the waitlist for services, we recommend that:
The Legislature set policy that directs the Developmental Disabilities Administration to develop strategies to maximize using cost-effective service options. Strategies may include:
• Reducing the number of Residential Habilitation Centers.
• Expanding crisis stabilization and emergency respite services in the community, relying less on Residential Habilitation Centers for these services.
• Providing resources to build peer support networks in the community to aid clients and their families with such needs as transportation, respite, and day activities.
The Legislature set policy to reduce the number of eligible people awaiting services:
• Set targets for how much to reduce the waitlist by when. We provide three funding scenarios to reduce the waitlist over six years (see page 24 for details).
• Direct the Administration to develop strategies and a budget proposal for prioritizing the people waiting for services by their needs. The proposal should include funding for case resource managers for people on the waitlist and for collecting information on the services people need, the level of support they require, and how urgent their needs are.
To further improve its employment program, the Administration should:
• Provide financial incentives to counties to encourage equal access to integrated, individual employment for clients regardless of where they live in the state.
What’s nextWe conducted this performance audit under the authority of the state’s performance audit law which was enacted in 2005 through the statewide citizen initiative I-900. The law requires the responsible legislative body to hold a public hearing within 30 days of its publication.
Representatives of the State Auditor’s Office will report on this performance audit to the Joint Legislative Audit Review Committee or another legislative committee. Please check the state Legislature’s website (www.leg.wa.gov) for the exact date, time, and location. The public will have the opportunity to comment at this meeting.
RHCs
Supported living
Parentor family
home
$193,042
$102,058
$37,660
Care in RHCscosts
2 timesmore
Care in RHCscosts
5 timesmore
The state’s cost to care for people with the most complex needs varies greatly
Source: WA CARE database, 2012.Inequities in costs are not solely the result of differences in their support needs related to behavior, medical, or activities of daily living. The chart above illustrates the costs for only people with the most complex support needs.
People with the most complex needs

Introduction
5
Washington spends more than $900 million annually to provide services and support for people with developmental disabilities such as intellectual disability, cerebral palsy, epilepsy, autism, and other neurological disorders. The disabilities are life-long, and people often have significant impairments that require daily services. The Developmental Disabilities Services Administration (the Administration) in the Department of Social and Health Services (DSHS) provides services such as job training, medical and personal care, and housing, either directly or by contracting with service providers.
Just over 20,500 individuals with developmental disabilities receive services from the state while an additional 15,100 who meet financial and physical eligibility requirements do not currently receive any services from the state. This is due in part to policy choices the state has made about the services it offers combined with insufficient funding to meet the demand for services.
This audit assessed Washington’s Developmental Disabilities Program, evaluating it against national benchmarks, to answer two key questions:
• Does Washington’s program provide effective services for people with developmental disabilities?
• What steps can Washington take to improve its Developmental Disabilities Program?
Attributes of an effective developmental disabilities system With guidance from subject matter experts in developmental disabilities, the Human Services Research Institute, we developed the following broad expectations for desirable system performance:
We evaluated Washington’s performance against these expectations.
Access to services People with developmental disabilities have access to and receive necessary publicly-funded services with reasonable promptness.
Service delivery and capacity
People with developmental disabilities are served in integrated settings appropriate to their needs and consistent with their preferences.There are an adequate number of qualified providers to serve people within a reasonable distance of their homes.
Funding There are adequate resources and the system promotes economy, efficiency and fairness in delivering services.
Quality of services and results for clients
Clients and families achieve valued results including independence, community integration, competitive employment, social connectedness, and health and wellness. Service systems are held accountable and results are routinely measured.
6
• State Auditor’s Office • Developmental Disabilities Program Evaluation •
6
MethodologyWe evaluated Washington’s program using state and national data, as well as, interviewing clients, family members, and other stakeholders. Much of our analysis relied on the following primary data sources:
• Comprehensive Assessment Reporting Evaluation (CARE) tracks assessments of clients’ behavioral impairments, medical needs, and ability to perform activities of daily living as well as the services the program provides.
• Social Service Payment System (SSPS) tracks payments for services.
• Employment Supports Performance Outcome Information System tracks number of people served, hours of participation, and monthly wages by person.
• University of Minnesota Research and Training Center on Community Living (RTCCL) and Institute on Community Integration/University Center on Excellence in Intellectual and Other Developmental Disabilities provides information by state on numbers served and related expenditures associated with Medicaid funded developmental disability programs.
• National Core Indicators (NCI) provides outcome measures used by 25 states to assess the performance of state developmental disabilities service systems and the experiences of individuals receiving support.
We compared the number of people Washington serves, how it serves them and its expenditures to national data. We matched client assessment results and residential setting information with expenditure data to learn how Washington serves clients with various needs and the costs associated with those services. We reviewed employment support outcome data, including the number of people served, hours of participation, and monthly wages by person and compared results among counties. To understand Washington’s performance from the perspective of those it serves, we compared Washington’s results for National Core Indicator (NCI) outcome measure surveys to other states’ results.
In addition, we reviewed policies, procedures, and other documents, conducted interviews with DSHS staff, legislators, advocates, and individuals at other state agencies, nonprofits, or other organizations that work with individuals with developmental disabilities.
We also held ten small group discussions in Bellingham, Richland, Seattle, Spokane, and Vancouver and heard from individuals with developmental disabilities and family members of individuals with developmental disabilities in separate sessions.
We conducted the audit under the authority of state law (RCW 43.09.470), approved as Initiative 900 by Washington voters in 2005, and in accordance with generally accepted government auditing standards, prescribed by the U.S. Government Accountability Office.
Appendix A describes the provisions of Initiative 900 and how the audit addressed these provisions.
Appendix B provides more detail on our methodology.

7
• State Auditor’s Office • Developmental Disabilities Program Evaluation •
About Washington’s Developmental Disabilities SystemWashington has a complex service system.
Washington offers a broad continuum of care to people with developmental disabilities, with options ranging from large state-run Residential Habilitation Centers (RHCs) to individualized community options where clients receive services in their homes. In 2012 the Administration’s annual budget was more than $900 million and it had 2,845 full time employees. It plays the largest role in providing services, but it also contracts with counties for employment and day services, which include job training and job placement assistance. Exhibit 1 shows Washington’s expenditures by service type, including field services and central office administration for Medicaid-funded expenditures only.
Housing and support options vary greatly.
Washington’s RHCs include Lakeland Village in Medical Lake, Yakima Valley School in Selah, Fircrest School in Shoreline, and Rainier School in Buckley. Clients in RHCs have all housing and meals provided, with access to 24-hour nursing staff, and other specialized staff trained in behavior management and other areas. This makes RHCs an expensive service option. The Medicaid waiver for Home and Community Based Services (HCBS) covers a range of services depending on the individual’s living arrangement and level of need. Waivers pay for community residential services, personal care, respite, supported employment, specialized equipment and supplies, behavior management and consultation, skilled nursing, and individualized therapies, among others. Waivers are a “full service” option for people. However, they are not an entitlement, and waiver slots are limited by available funding.
State Operated Living Alternative Program
1.7%
Personal care28.1%
Central o�ces administration - 0.3%Voluntary placement - 0.01%
Professional services - 0.8%Individual & family services - 0.4%
Employment &day services
7%Field
services4.7%
Othercommunity
services2.8%
Exhibit 1Residential programs and personal care account for the majority of expenditures
Source: Agency Financial Reporting System (AFRS).Notes: *Does not include administration.
Residential programs37.1%
Residential habilitation
centers*17.1%

8
• State Auditor’s Office • Developmental Disabilities Program Evaluation •
Exhibit 2 illustrates the many options for community residential services.
Exhibit 2 A summary of community residential services optionsType of housingAll are regular residences in neighborhood communities
Who lives there?Who pays for the services?
Who owns or leases the home?
What services do clients receive there?Clients Staff
Homes serving more than one unrelated person
Adult family homeLicensed by the state. May be run by a family, single person, or business partners, who may also hire other employees.
2-6 Yes DDA, plus clients’ personal insurance or funds
Provider business
Bedroom, meals, laundry, supervision, varying levels of personal care
Group homeLicensed as an assisted living facility or an adult family home. Group home providers operate the home under contract with DDA.
2+ Sometimes DDA, plus clients’ personal insurance or funds
Provider business
Bedroom, meals, up to 24-hour instruction and support
State Operated Living Alternatives (SOLAs)Home is operated by DDA, licensed by the state, and staffed by state employees.
1-4 No DDA Clients Support as needed, from a few hours a month to 24-hour, one-to-one instruction and support
Own home: Supported Living ServicesDDA contracts with certified private providers to provide a program of instruction and support available to clients living in their own homes.
1-4 No DDA Client or spouse/partner
Support as needed, from a few hours a month to 24-hour, one-to-one instruction and support
Homes serving one person
Companion homeProperty is approved by DDA to assure client well-being but not licensed by the state. Also called adult foster care.
1 Yes DDA reimburses the provider for services.
Provider or other owner
Bedroom, meals, 24-hour instruction, supervision, and support
Own homeFor clients living alone or with a spouse/partner, in a residence they own or lease themselves. Not licensed by the state.
1 No DDA Client or spouse/partner
Support and supervision as needed
Parent/Relative homeClients live with family members. Parents and family members may be licensed service providers.
1+ No Varies, but funding presumes family participation
Family member Support as needed, such as equipment, counseling, training, and Medicaid Personal Care
Source: DDA website and publications.

9
• State Auditor’s Office • Developmental Disabilities Program Evaluation •
If a person cannot gain access to an RHC or receive one of the limited waiver slots, their options include Medicaid Personal Care or state-only funded services such as the Individual and Family Support Program. While Medicaid Personal Care is an entitlement service, it is limited to assistance with activities of daily living and does not include any residential support, employment, respite, or other therapy services. The Individual and Family Support Program provides $2,000 to $6,000 a year to families not receiving other services that they can use as they see fit with approved providers, however these funds are limited.
People gain access to services through a multi-part process.
Potential clients must first establish they are eligible. This requires a diagnosed condition by a licensed professional with evidence that the condition began before age 18, will continue indefinitely, and has a substantial impact on several areas of life function. For children up to age three, evidence of delay is sufficient for eligibility. Routine eligibility determinations occur at ages 4, 10, and 18. A client who has been out of service for more than 90 days must reestablish their eligibility.
The client continues through a multi-part assessment that provides the Administration with information about waiver eligibility and identifies individuals approved for paid services. People age 16 and over who are approved at this point are then assessed for support needs using the Supports Intensity Scale. Clients eligible for services are assigned a Case Resource Manager who conducts the three-module assessment that determines the level of service needed. The first module determines if the person needs the Intermediate Care Facility for Intellectually Disabled level of care, which in Washington is provided primarily by the RHCs. The second module determines service level, and the third establishes an Individual Service Plan.
It is important to note that a determination of developmental disability does not guarantee access to services. The eligible client may receive services through one of the entitlement programs, such as MPC or an RHC. If the client does not receive entitlement services, the client may have to wait until funding is available.

Audit Results
10
The Federal Medicaid Act (42 C.F.R. § 435.930(a)) indicates that states must provide Medicaid services promptly. Court decisions have clearly indicated that responding to service needs with reasonable promptness means that individuals enrolled in Medicaid who have emergency or crisis needs must receive Medicaid-funded services within 90 days. It follows that people who have critical unmet needs should be able to count on receiving services within six to nine months. Without the required services, their needs can rapidly turn into an emergency or crisis situation.
Many eligible people and their families do not receive services from Washington’s Developmental Disabilities Program, effectively creating a system of “haves” and “have-nots.”
States face challenges in serving all of the people with developmental disabilities that ask for services. They generally operate their developmental disabilities programs under fixed capacity limits set year to year by available funding. Washington is no exception.
In our small group discussion, people with developmental disabilities and their families described the system as one of “haves” and “have-nots”. We found that those with services are generally happy with them and described themselves as lucky, while those without services are struggling. Families we spoke to experience financial hardships, psychological and emotional stress, and strain on marital and family relationships.
Washington has a long waitlist for services.
Assuming a prevalence rate of 1.2%, about 81,800 people with developmental disabilities live in Washington. As shown in Exhibit 3, about 20,500 receive services from Washington’s program. Of this 20,500, about 38% (7,800) receive only limited services in the form of Medicaid Personal Care, Individual and Family Support, or other local programs. In a literal gray area, Exhibit 3 shows the 15,100 people who have applied and are eligible, but who do not receive any services paid for by the state.
According to 2012 information from the Administration’s CARE database, about 70% of the people who do not receive services are children. However, agency officials told us that not all those who apply and are eligible for services actually need or want them immediately. Parents may apply on a child’s behalf even though they intend to support and care for that child at home, because current rules require that developmental disability be established before the age of 18. Once eligibility is established, they might not contact the Administration again for services for many years. For this reason, the Administration considers these people to be part of its “no paid services caseload”; in our report, we consider these people to be held on a waitlist for services.
A total of 20,500 peoplereceive state
services...
but about 7,800of them receiveonly partial or limited services.
15,100 peopleare held on
a waitlist
46,200 peoplehave never requestedservices*
Exhibit 3Many people with developmental disabilities do not receive services from the state
Source: CARE 2012, prevalence rate from the Administration.* Note: Estimate based on a prevalence rate of 1.2%.
“A system of haves and have-nots is not ok.” – Vancouver parent
“A waiver [for services] is a ‘golden ticket.’” – Spokane client
“People say we are lucky. Services should not be a matter of luck.” – Seattle parent
Attributes of an effective system: Access to services People with developmental disabilities have access to and receive necessary publicly-funded services with reasonable promptness.
11
• State Auditor’s Office • Developmental Disabilities Program Evaluation •
11
Once a person has applied and established eligibility, it can take some time for services to begin. The average applicant began the process three and a half years ago. Those people who did want services expressed frustration at not knowing when services would be available, but also concern about the significant costs they incur for medical and other care-giving support. Effectively, they continue to be held on the waitlist until a crisis or emergency changes their status.
More than half of people with disabilities, an estimated 46,200, never request services from the state. Some may not be financially eligible, but there are several reasons those who are still may not come forward: some may not need services, some may not know how to apply, and some may believe that the list is too long and they have no chance of receiving services.
Washington serves fewer people compared to other states.
Intermediate Care Facility Services for Individuals with Intellectual Disabilities (ICF/ID) and Medicaid Personal Care services are guaranteed under Medicaid if people meet financial and disability eligibility criteria. However, all other services available under Washington’s Medicaid waiver for Home and Community Based Services (HCBS) depend on additional eligibility criteria and the availability of state funds.
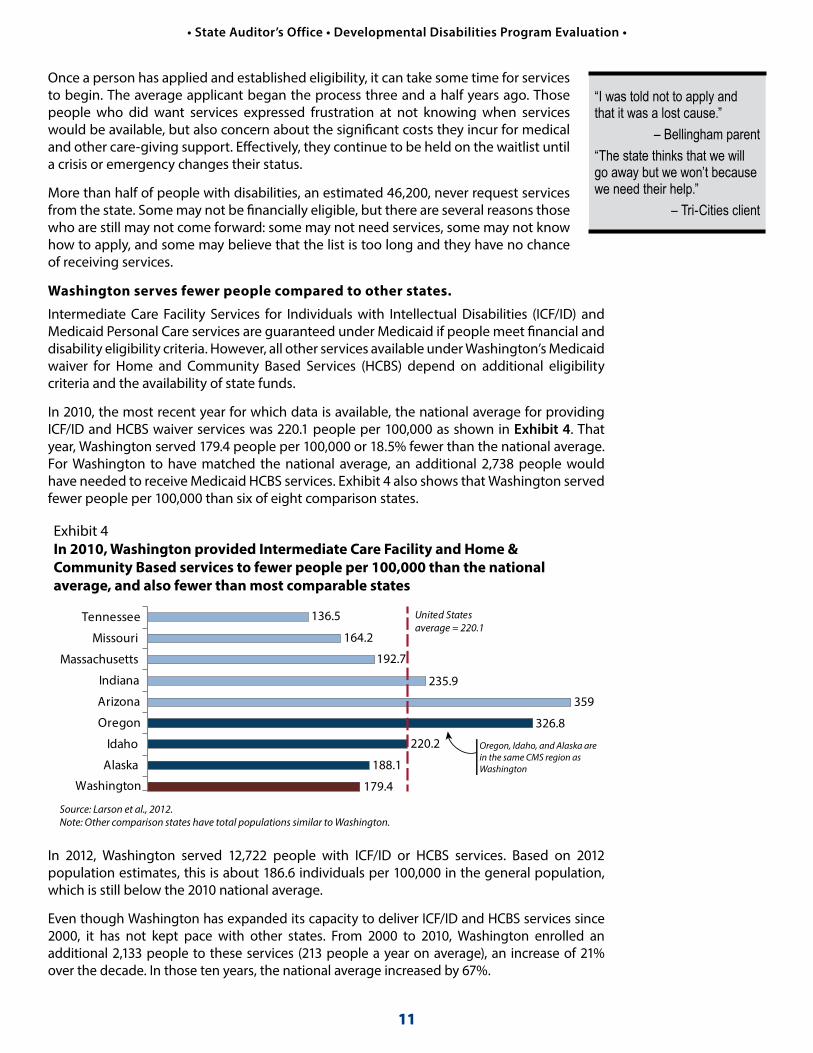
In 2010, the most recent year for which data is available, the national average for providing ICF/ID and HCBS waiver services was 220.1 people per 100,000 as shown in Exhibit 4. That year, Washington served 179.4 people per 100,000 or 18.5% fewer than the national average. For Washington to have matched the national average, an additional 2,738 people would have needed to receive Medicaid HCBS services. Exhibit 4 also shows that Washington served fewer people per 100,000 than six of eight comparison states.
In 2012, Washington served 12,722 people with ICF/ID or HCBS services. Based on 2012 population estimates, this is about 186.6 individuals per 100,000 in the general population, which is still below the 2010 national average.
Even though Washington has expanded its capacity to deliver ICF/ID and HCBS services since 2000, it has not kept pace with other states. From 2000 to 2010, Washington enrolled an additional 2,133 people to these services (213 people a year on average), an increase of 21% over the decade. In those ten years, the national average increased by 67%.
“I was told not to apply and that it was a lost cause.”
– Bellingham parent“The state thinks that we will go away but we won’t because we need their help.”
– Tri-Cities client
Washington
United States average = 220.1
Alaska
Idaho
Oregon
Arizona
Indiana
Massachusetts
Missouri
Tennessee
Exhibit 4In 2010, Washington provided Intermediate Care Facility and Home & Community Based services to fewer people per 100,000 than the national average, and also fewer than most comparable states
Source: Larson et al., 2012.Note: Other comparison states have total populations similar to Washington.
136.5
164.2
192.7
235.9
359
326.8
220.2
188.1
179.4
Oregon, Idaho, and Alaska arein the same CMS region asWashington

12
• State Auditor’s Office • Developmental Disabilities Program Evaluation •
It is important to note that states, including Washington, serve additional people with Medicaid Personal Care services. Our comparison does not take into account people being served with Medicaid Personal Care, so the rate of people receiving any service is higher. Exhibit 4 focuses on those receiving a comprehensive array of services. Medicaid Personal Care services are much less comprehensive than HCBS and Intermediate Care Facility services.
Reducing Washington’s waitlist requires significant investment.
Reducing the waitlist is critical to increasing access to services. As part of the audit, we developed three funding scenarios for reducing or eliminating the list within a six-year time period. It will require an additional $62.7 million to $133.7 million for the state’s share for Medicaid services. These scenarios are discussed on page 24.
Washington could better manage its waitlist.
During stakeholder interviews and small group discussions, participants repeatedly expressed the opinion that access to services is “crisis driven.” Limited resources mean that those on the waitlist are not served while their needs are stable. Not until someone experiences a crisis– crises can range from the death of a caregiver/family member to changes in medical status – are they placed into long-term services. This suggests that the Developmental Disabilities Administration is not able to reduce the waitlist methodically. Both staff and system stakeholders expressed frustration with this state of affairs, which they often attributed to insufficient funding.
There are, however, ways to improve the waitlist to make resource allocations more fair and efficient. Many improvements could be gained by expanding the data gathered during someone’s initial application for services, as shown in Exhibit 5. Gathering information in three areas – the types of services the client needs, how urgent the need for services is, and the level of support required – would enable the Administration to better manage the waitlist.
Exhibit 5 Three kinds of information that could improve waitlist management
Adding this data... Would improve the process in this way.But are there barriers to implementation?
Type of service(s) the client needs (residential, vocational, daily living support, etc.)
The waitlist at present does not show what services the client needs. By collecting this data on new and current waitlisted people, the Administration will be able to predict service demand more accurately.
Client needs are likely to change the longer someone waits for services, so they should be reevaluated or updated every three years, which may take staff time for evaluation and data entry.
Urgency of need By gathering this data upon application for services, the Administration can prioritize clients with the most urgent needs. Typical benchmarks are: critical need (services needed within 90 days), moderate to critical (three to six months), moderate but not critical (six to 12 months), and not critical (more than a year).
While it is new data for the Administration to collect, other states can serve as models, such as Illinois’ Prioritization of Urgency of Need for Services. (Available online at www.dhs.state.il.us/page.aspx?item=47620).
Level of support required based on the Supports Intensity Scale, part of the Support Assessment Module 1
By understanding at the outset how much support a client will need, the Administration can prioritize and allocate support funding based on data.
Evaluating all new applicants using the Supports Intensity Scale will take time and staff resources.
Source: Washington CARE database and SSPS data for FY 2012.

13
• State Auditor’s Office • Developmental Disabilities Program Evaluation •
Gathering the additional assessment information is likely to take more case resource managers. The Administration’s case resource managers have high caseloads, averaging 80 clients over the past five years. For comparison, in Oregon, the state’s budget allocates a caseload ratio of 45-to-1. The responsibilities of Washington’s case resource managers are similar to those of Oregon case managers with the addition of conducting client assessments. Clients and their families repeatedly said in our small group discussions that case resource managers are “overworked.”
One way to meet the need for staff dedicated to assessing the needs of those on the waitlist would be to reinstate case resource managers for waitlist clients. Until 2011, the Administration had case resource managers to serve waitlist clients. Due to funding cuts, the Administration was required to eliminate those case resource managers that served as a point of contact for questions or help if a crisis developed.
Reinstating these case resource managers could have additional benefits. The DD Council has surveyed people on the waitlist since case management services were eliminated, and found that they do not know who to call in case of an emergency or where to direct their questions. They have also noted slow response times on the toll free line that was established due to the elimination of the case resource managers. Of greater concern is the difficulty people have in gaining access to Medicaid Personal Care services. Case resource managers were a key resource, as they identified eligible clients and helped them apply for services. Now, clients may not even know they are eligible, still less how to apply.

14
• State Auditor’s Office • Developmental Disabilities Program Evaluation •
The ‘gold standard’ in the United States today calls for people with developmental disabilities to live in places that offer them the greatest opportunities for interacting with the community at large. In its 1999 landmark Olmstead decision, the United States Supreme Court affirmed that, under Title II of the Americans with Disabilities Act, states are obliged to operate programs for people with disabilities to ensure that they receive services in the most integrated setting appropriate to their needs, so that people are not unnecessarily institutionalized. It further established the expectation that states would transition clients from institutional settings to the community.
Most clients receive services in community settings appropriate to their needs, but Washington maintains segregated institutional housing for some.
As Exhibit 6 shows, when compared with the nation as a whole, Washington emphasizes integrated community living. For example, Washington supports more individuals with developmental disabilities in the family home than the national average (67% versus 56% nationwide), which means it relies on families to serve as an integral part of the support network.
Another 17% of clients in Washington live independently in their own homes or apartments, nearly double the national average of 9%. While the state serves fewer people in group homes (12% in Washington versus 27% for all states), more of them live with six or fewer other people than the national average. Only one percent of Washington’s group homes house more than six people, compared to 5% nationally.
While Washington helps more people live on their own or with their families than the national average, it also houses more people in large institutions than the national average (4% compared to 3% nationally). Washington has the 14th largest institutional population in the country, serving 876 people in its Residential Habilitation Centers, also called RHCs.
Attributes of an effective system: Service delivery People with developmental disabilities are served in integrated settings appropriate to their needs and consistent with their preferences. As a corollary, there are adequate services and resources in their local communities.
Family home67%
HCBSgroup home
12%
Own home/apartment
17%
State-operatedinstitutions
4%
Community ICF/ID0.2%
11% out of 12%live in homes with
1-6 people
Family home56%
HCBSgroup home
27%
Community ICF/ID5%
State-operatedinstitutions
3%
Own home/apartment
9%
22% out of 27%live in homes with
1-6 people
Exhibit 6Compared to the national average, more DDA clients live on their own or with family, but more also live in institutions
Washington
All states
Source: Larson et al., 2012.

15
• State Auditor’s Office • Developmental Disabilities Program Evaluation •
As shown in Exhibit 7, the national average for state-operated institutional setting utilization is 10.1 individuals in institutions per 100,000 of general population. In the comparison year 2010, Washington’s use of state-operated institutions (13.4 people per 100,000 of general population) was 33% higher than the national average. Washington also outpaced both peer population states (such as Arizona, Indiana, Massachusetts, Missouri, and Tennessee) and its neighbors in the western Centers for Medicare and Medicaid Services (CMS) group (which includes Alaska, Idaho, and Oregon). Washington supported 4.2% of its service population in four state-operated institutions.
With the closing of the Francis Haddon Morgan Center in 2011, Washington’s use of institutional settings has decreased slightly, but it is still well above the national average. In 2012, it was 12.9 people per 100,000.
Washington supports people with comparable needs in the community and in RHCs.
A common perception is that RHCs house the people who are most difficult to support, individuals who cannot be adequately supported in the community. We wanted to test this assumption, to see if it was the case that Washington’s institutions serve primarily those with the highest support needs. To do this, we compared the “acuity levels” assigned by the Administration as it evaluates clients entering the service system.
The Administration has developed “acuity scales” that address the level of assistance clients might require related to behavior, medical needs, mobility, employment, activities of daily living, and need for protective supervision. Using assessment tests, case resource managers assign high, medium, low, or none to indicate the level of support a client needs for each factor. We examined three acuity scales for this audit – activities of daily living (ADL), behavior, and medical needs – and compared them to where clients lived.
Exhibit 7In 2010, Washington served more people per 100,000 in institutions than the national average, and also more than all comparable states
Source: Larson et al., 2012.Notes: *Does not include data for the Fernald Center (FY 2010). Other comparison states have total populations similar to Washington.
Washington
Alaska
Idaho
Oregon
Arizona
Indiana
Massachusetts
Missouri
Tennessee 6
10.8
12*
3
1.8
0
0
4
13.4
United States average = 10.1
Oregon, Idaho, and Alaska are in the same CMS region as Washington
How do acuity levels relate to support needs?As an example, a person considered high functioning – perhaps able to work a semi-skilled job and do their shopping but needing help to balance a checkbook – is likely to have generally low acuity levels in employment and activities of daily living. They need less help than someone who might have a medium acuity level in these areas and who needs support to work and go grocery shopping.
16
• State Auditor’s Office • Developmental Disabilities Program Evaluation •
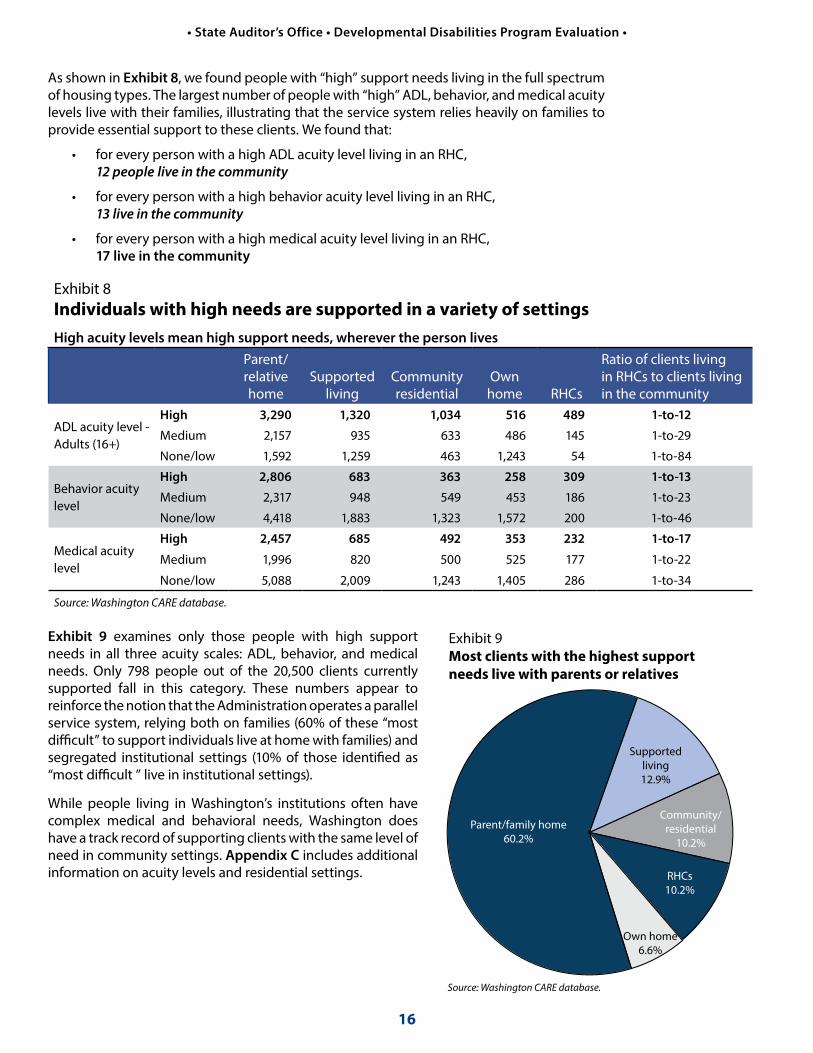
As shown in Exhibit 8, we found people with “high” support needs living in the full spectrum of housing types. The largest number of people with “high” ADL, behavior, and medical acuity levels live with their families, illustrating that the service system relies heavily on families to provide essential support to these clients. We found that:
• for every person with a high ADL acuity level living in an RHC, 12 people live in the community
• for every person with a high behavior acuity level living in an RHC, 13 live in the community
• for every person with a high medical acuity level living in an RHC, 17 live in the community
Exhibit 9 examines only those people with high support needs in all three acuity scales: ADL, behavior, and medical needs. Only 798 people out of the 20,500 clients currently supported fall in this category. These numbers appear to reinforce the notion that the Administration operates a parallel service system, relying both on families (60% of these “most difficult” to support individuals live at home with families) and segregated institutional settings (10% of those identified as “most difficult ” live in institutional settings).
While people living in Washington’s institutions often have complex medical and behavioral needs, Washington does have a track record of supporting clients with the same level of need in community settings. Appendix C includes additional information on acuity levels and residential settings.
Exhibit 9Most clients with the highest support needs live with parents or relatives
Parent/family home60.2%
Supportedliving12.9%
Community/residential
10.2%
Own home6.6%
RHCs10.2%
Source: Washington CARE database.
Exhibit 8 Individuals with high needs are supported in a variety of settingsHigh acuity levels mean high support needs, wherever the person lives
Parent/relative home
Supported living
Community residential
Own home RHCs
Ratio of clients living in RHCs to clients living in the community
ADL acuity level - Adults (16+)
High 3,290 1,320 1,034 516 489 1-to-12
Medium 2,157 935 633 486 145 1-to-29
None/low 1,592 1,259 463 1,243 54 1-to-84
Behavior acuity level
High 2,806 683 363 258 309 1-to-13
Medium 2,317 948 549 453 186 1-to-23
None/low 4,418 1,883 1,323 1,572 200 1-to-46
Medical acuity level
High 2,457 685 492 353 232 1-to-17
Medium 1,996 820 500 525 177 1-to-22
None/low 5,088 2,009 1,243 1,405 286 1-to-34
Source: Washington CARE database.

17
• State Auditor’s Office • Developmental Disabilities Program Evaluation •
Washington relies heavily on its RHCs for services that can be better provided in the community.
Washington’s RHCs currently dedicate a high proportion of institutional staff and facility resources to providing back-up services to people living outside their confines: 18% of resources go to community respite, 7% to evaluation, and 1% to crisis housing. Compared to the nation as a whole, this is very unusual.
As Exhibit 10 shows, nationally only a very small percentage of institutional resources are devoted to services other than those provided within the institution. Only 4% of total institutional services nationally go to community respite, 2% to evaluation, and a negligible percentage of resources to crisis housing.
Washington provided short-term crisis housing to one person per 56.9 residents in 2010, more than all other states but Wyoming, which provided crisis housing to one person per 27.6 residents. Missouri also used long-term care institutions as crisis housing, for one person per 90.2 residents, but no other state housed more than one person in crisis per 100 residents.
Although people in need of crisis stabilization services represent only 1% of people admitted to RHCs, Washington must provide more services in the community if the state is to support developmentally disabled people where they live.
Given the high cost of providing services through RHCs, and the substantial number of individuals living with families or in their own homes in Washington, there should be a comparable infrastructure to support these clients, including a comprehensive array of respite and crisis services in their immediate communities. Though some of these community-based services exist, the state has instead opted to provide much of this support through state institutions — a practice that runs counter to national trends. For Washington to rely less on RHCs, more work must be done by the Administration to build up its capacity to provide crisis stabilization in local communities.
Evaluation7%
Crisis housing
1%
Exhibit 10Washington relies on its institutions for respite services to a much greater degree than the national averagePercentage of short/long-term residents by purpose, 2010
Washington
Long-termcare94%
Respite4%
Evaluation, 2%
Crisis housingnegligible
United States
Source: Larson et al., 2012.
Long-termcare74%
Respite18%

18
• State Auditor’s Office • Developmental Disabilities Program Evaluation •
Legislation passed in 2011 prohibited the admission of anyone under the age of 16 to RHCs and required the Administration to establish community-based crisis stabilization services. The Administration began by addressing service needs for children by opening a program in Lakewood that can serve up to three children at a time. Assuming stays of 180 days or less, the Lakewood Community Crisis Stabilization Program can serve six or more children over the course of a year – a capacity that the Administration told us is aligned with historic demand for these types of services.
The Lakewood program is restricted to youths aged 8 to 21; it provides individualized assessment and specialty treatment, including intensive treatment for behavior change, psychosocial skills, and self-management. The goal is to re-integrate the client into his or her family home or other community–based home. If Washington is to rely less on RHCs, similar services must be made available to adults.
The real gap in crisis care and a perceived gap in respite care has led to a reliance on RHCs for both services.
Respite care serves two purposes: it is a crucial part of a crisis support system, and it offers families regular, periodic relief from care-giving. This temporary service makes it possible for family caregivers to do the things they cannot do while responsible for providing care, such as shop for groceries, go on outings with their spouse or their other children, or even sleep.
In the most recent (2011-2012) survey of families with a developmentally disabled adult living at home, 26 percent responded that they did not have access to quality respite services. Many parents in our small discussion groups throughout the state voiced the same concern. However, there are a number of reasons that families may not have access to the respite services they feel they need.
• They might not be authorized and funded for many respite hours. On average, people living with their families are authorized for 19 respite hours a month.
• The family may actually need other types of services. For example, if a client is only employed for 10 hours a week, requesting additional employment or other community access services might be sufficient to give the primary caregiver more down time. Asking for additional respite time does not address the cause of the issue.
• Some families may use the term “respite” when what they really seek are crisis stabilization services.
As a matter of policy, the Administration has relied on the RHCs to provide both respite and crisis stabilization care. This reflects the gray area between predictable needs for respite care and the demand for respite caused by crises that should be addressed more comprehensively. In its January 2013 report, the Developmental Disability Service System Task Force recommended that all RHCs be open to receiving new clients, with the number of residents capped at 900. Although the cap is higher than the 876 people who currently reside at RHCs, the stated intent of the Task Force was not to increase long-term residents, but to allow more clients to receive respite services at RHCs.
This decision is not without financial ramifications.
When daily living escalates into a crisisCrisis stabilization services are called for when a client experiences a major change that triggers behavioral or other issues which make it impossible for the family to continue supporting him or her at home without additional help. As one example, a child with an autism-spectrum disorder reaches puberty and begins acting out in ways the family hasn’t experienced before. Sometimes, both the client and the family members are at risk of physical harm.
“Respite is never available when you need it.”
– Tri-Cities parent“Emergency respite opportunities are not there.”
– Spokane parent

19
• State Auditor’s Office • Developmental Disabilities Program Evaluation •
Respite services are more expensive when provided by RHCs instead of in the community. The daily rates at RHCs range from $442 to $653 a day; respite care in the community ranges from $245 a day for individual providers to $430 a day for respite agencies. While it may seem preferable to provide respite services in the community rather than at RHCs purely from a cost efficiency perspective, it is important to remember that clients in RHCs often receive other services such as behavioral consultations, evaluations, and medical services. A strict daily cost comparison is not always appropriate.
Generally, there appear to be an adequate number of respite providers in the community, contrary to perceptions we heard voiced in our interviews.
To better understand available capacity for respite care in Washington’s communities, we analyzed the distribution of respite care providers by zip code. Provider zip codes were taken from the Agency Contract Database (ACD) and adjusted to reflect only those providers that received a payment for services during state fiscal year 2012. While zip code is the smallest geographic unit for which data was readily available, it is not a precise measure. Urban zip codes tend to cover a more compact area than do rural codes.
Many providers are individuals who can only serve one client at a time, while the agencies that provide services can vary widely in size and staffing levels. Reliable, current data on agency size was unavailable and not factored into this analysis.
Still, given the locations of current providers and the availability of additional providers, there would appear to be adequate respite service provider capacity. In fiscal year 2012, there were 3,256 respite providers in Washington, including both individual providers and larger respite agencies. They served 3,510 clients, an almost 1-to-1 ratio. They are widely distributed around the state’s population centers, but large areas of rural Washington lack service providers.
The map in Exhibit 11 on the following page shows the number of respite providers by zip code relative to the number of clients receiving services. The zip codes in gray indicate places without any service providers but where individuals needed services. With a few exceptions in eastern Washington, these tend to be adjacent to areas where providers are present. Furthermore, an additional 4,300 providers were registered with DSHS to provide respite services but they are not shown on the map because they were not paid for services in 2012.

20
• State Auditor’s Office • Developmental Disabilities Program Evaluation •
Exhibit 11 Respite providers are located close to clients who need services
Washington could do more to support people with disabilities by developing additional community-based resources.
In many other states, the capacity to provide respite and crisis services has been embedded in communities, often in preparation for the closure of institutions. Maintaining clients with their families and in their own homes requires supports that can deployed quickly if necessary. These supports can be built on existing community infrastructure such as local hospitals, psychiatric facilities, and first responders. In the case of respite services, they must also take into account individual family needs and circumstances.
The Administration could accelerate its current efforts to bolster local crisis support. Local teams could offer a mix of supports, including assessment, positive behavioral support planning, staff or family training, respite services and referral to companion service systems.
Other states are pursuing such options. For example, North Carolina has implemented the North Carolina Systemic, Therapeutic Assessment, Respite & Treatment (NCSTART) Program, which is available to serve adults with a primary intellectual or developmental disability diagnosis and challenging behaviors, often with a co-occurring mental illness. The model provides prevention and intervention services to individuals with complex behavioral needs through crisis response, training, consultation, and respite.
Residential Habilitation Centers
3.00 - 14.00
0.92 - 3.00
0.50 - 0.92
< 0.5
No Providers
Number of Providers per person for people receiving services
Fircrest School
Rainier School
Yakima Valley School
Lakeland Village

21
• State Auditor’s Office • Developmental Disabilities Program Evaluation •
For each person, the goal is to create a support network that is able to respond to crisis needs within the community, and so deter admission to a hospital or institution. This model was first developed in Massachusetts and has also been adopted in Virginia and New Hampshire.
Services available include:
• psychological, behavioral support and crisis consultation
• clinical support assessment and treatment planning
• training for providers, families and other community partners
• on-going consultation to maintain community placement
• collaboration between families, providers, case managers and community partners
• short-term respite
NCSTART is currently funded by about $3.2 million in state dollars, which are distributed to three host Local Management Entities, now Managed Care Organizations. Funds support six crisis/clinical teams and twelve respite beds (four beds per region of the state). Staffing includes a director for each region, a part-time psychologist who serves as the clinical director, a part-time psychiatrist who serves as the medical director, and four qualified professionals. Each respite facility has a respite director and approximately 13 staff.
Peer support networks could offer opportunities for people in the developmental disabilities community to connect.
Another option to build additional support in communities is to encourage local organizations such as peer support networks. These are voluntary associations of people with disabilities, their families, or some combination of the two that unite to address common needs through mutual support and joint action. A staff person is typically required to advise and organize the network, though it should ultimately be shaped by the needs and preferences of its members. Washington could fund development and staffing to foster these local networks and in turn provide greater support to people receiving limited services and their families as well as the thousands of others waiting to receive state services.Peer support networks can be organized by self-advocacy groups, local Arc Chapters, and other family or advocacy-oriented organizations. The panel on the following page discusses several such networks in Massachusetts and Georgia, as well as cooperatives assisted by the Federated Human Service Cooperative that have launched in four other states. Furthermore, the Oregon Office of Developmental Disability Services has worked with the Oregon Council on Developmental Disabilities to develop the Oregon Consortium of Family Networks, an association of networks that support the families of people with disabilities.
Peer support networks rely on three sources of support:
• Disability-oriented public services such as ride-sharing programs sponsored by local transit agencies, which may already be funded through a community services network funded by the Administration or other public agencies.
• Peer support associations link people through a voluntary exchange of assistance such as temporary respite, a car ride, emotional support, or information. Peer support may also be organized more formally through a “time bank” that tracks contributions of time given to others.
• Community assets such as churches, civic or hobby clubs, and recreational centers are key resources as they can collaborate with the network to offer additional community-based services and activities. Local chambers of commerce and community businesses may also prove helpful.

22
• State Auditor’s Office • Developmental Disabilities Program Evaluation •
The Administration might consider establishing these services within its HCBS waivers. In particular, the Administration might seek to establish funding for peer support and peer support network organizing.
Washington could benefit from Legislative direction on its future use of institutions.
Intermediate Care Facilities for Individuals with Intellectual Disabilities (ICF/ID) are an entitlement service to those who are eligible, however states are not required to offer these services in state-run institutions. Washington provides this level of service primarily through Home and Community Based Services (HCBS) waivers, which are designed to allow the provision of ICF/ID services to clients in community settings. However, Washington also provides ICF/ID services to 876 clients in four Residential Habilitation Centers (institutions). Currently, nine states do not have any institutions and offer all ICF/ID level services in the community. Another 12 states serve fewer than 150 people in institutions.
In Washington, there are Legislators, organized groups, families, and individuals who advocate for institutions as critical components of a full continuum of care. Many clients and families are satisfied with the services they receive in RHCs and there are many reasons they do not wish to transition to community-based services, from concerns about the availability and quality of the services offered in the community to a desire to remain in the home they have known for many years.
Through its Roads to Community Living Program, the Administration has been working to transition interested individuals out of the state institutions. The Roads to Community Living Program provides a 75% federal Medicaid match (versus the 50% received for other Medicaid services). While federal funding remains available for this program, the Washington State Legislature could provide policy direction that encourages its use and helps to expedite transitions into the community. This legislative direction at a minimum could take the form of freezing new long term admissions to RHCs, and more aggressive direction would include consolidation of the four RHCs into two or three existing locations.
While the 2012 DD System Task Force was tasked with addressing the issue of consolidating RHCs, it was unable to come to consensus recommendations around any consolidation options. As the Administration continues to build its community support capacity, it could benefit from legislative direction that clearly moves the system in this direction. In the long term, this frees up resources to serve more people on the waitlist.
Peer support networks of various kinds are emerging across the nation.In Massachusetts, the Time Exchange of the North Shore organizes participants within an exchange network where members exchange services with each other. Every hour of service they provide equals one hour that can be spent on another service provided by another member. (http://timeexchangenorthshore.org/). The Exchange is open to the entire community but emphasizes participation of people with disabilities and their families. Likewise, in North Carolina, First in Families established its own Time Bank (http://firstinfamilies.timebanks.org/).The Federated Human Service Cooperative assists local families and individuals to establish “Human Services Cooperatives” (www.federatedhsc.coop). In these cooperatives participants work together to manage the services they receive, acting to recruit, hire and monitor direct support
staff, and act as a purchasing alliance to purchase services, durable equipment or other needed supports. The cooperatives also offer opportunities for members to offer mutual support to one another. Presently, cooperatives have formed in several states including Arizona, Illinois, Tennessee, and California.In Georgia, the Real Communities Initiative, funded by the US Administration on Intellectual and Developmental Disabilities, is designed to connect individuals with developmental disabilities and their organizations to other citizens and their associations to act collectively on community issues (www.gcdd.org/real-communities.html). Individuals with developmental disabilities are given the opportunity and support to make contributions to their communities, and in return these participants are afforded greater opportunity to forge friendships with other residents and receive informal supports as a result.

23
• State Auditor’s Office • Developmental Disabilities Program Evaluation •
People with developmental disabilities may have significant functional impairments which may require daily support. Their disabilities are life-long, but their quality of life can often be improved by appropriate services. These attributes make developmental disabilities services among the most costly long-term services for the state to provide. Without adequate resources, costly services provided to some mean reduced or no services provided to others. It is important that a state promote economy, efficiency, and fairness in delivering services.
Washington does not adequately fund services for people with developmental disabilities and funds are not distributed equitably.
Washington’s funding for developmental disabilities is not adequate.
The Washington Legislature does not provide enough funding to serve all eligible people who have applied for services. As discussed on page 10, Washington has an extensive waitlist of more than 15,000 people. Further, Washington is below the national average in the number of people per 100,000 it serves, ranking 36th in the nation.
For those who do receive services, Washington does not spend as much per person as other states on services that support people in community settings. This is an important indicator because the great majority of Washington’s clients are receiving home and community based services. As illustrated in Exhibit 12, Washington spends less than the national average for Home and Community Based Waiver Services (HCBS), spending $37,018 per person in 2010 compared to $44,396 per person nationally. It amounts to a difference of $7,378 per person, or 16.6% under the national average. All other states in the comparison group – with the exceptions of Idaho and Arizona – spent more per person than Washington.
Our comparison does not take into account people being served with Medicaid Personal Care. Exhibit 12 focuses on people being receiving a comprehensive array of services. Medicaid Personal Care services are much less comprehensive than HCBS.
Washington
Alaska
Idaho
Oregon
Arizona
Indiana
Massachusetts
Missouri
Tennessee $75,776
$50,864
$56,241
$45,301
$26,632
$41,230
$33,827
$75,164
Exhibit 12In 2010, Washington spent less per person on HCBS waivers than the national average, and also less than most comparable states
United States average = $44,396
Source: Larson et al., 2012.
$37,018
Oregon, Idaho, and Alaska are in the same CMS region as Washington
Attributes of an effective system: Funding There are adequate resources and the system promotes economy, efficiency, and fairness in delivering services.

24
• State Auditor’s Office • Developmental Disabilities Program Evaluation •
Washington has spent less on HCBS waivers than the national average year after year, as shown in Exhibit 13. While per person expenditures have grown at a greater pace than the national average, the state’s spending over the last decade is still low.
Reducing the waitlist requires significant investment.
Reducing the waitlist is critical to increasing access to services. As part of the audit, we analyzed three scenarios for reducing or eliminating the waitlist over six years. Exhibit 14 shows the estimated cost for the state’s share for Medicaid services; each scenario is based on the current average cost per person in a community setting. They include a mix of waiver services and Medicaid Personal Care or Individual and Family Support Services. There is insufficient data collected on the people waiting for service to provide more refined projections. (See Appendix B for more information on the data we used for our projections.)
None of these scenarios offer a simple or inexpensive fix to address the already lengthy waitlist. However, failing to address the list in a meaningful and proactive manner will increase the risk that more individuals will enter the care system driven by crisis.
Exhibit 13Washington consistently spends less per person on HCBS support than the national average
$20,462
$33,142
National
$36,706
$38,679
$44,396
$37,018
2000 2002 2004 2006 2008 2010
Source: Larson et al., 2012.
Washington
Exhibit 14 Estimated cost of reducing Washington’s waitlist over six years, 2012-2018
Annual increases Six-year cumulative total
How many more people
Annual cost to Washington
Total additional people
Total cost to Washington
Scenario 1: Bring Washington in line with national average, to serve 220 per 100,000. 792 $14.1 million 4,752 $78.6 million
Scenario 2: Bring Washington in line with “high performing” states that serve 350 people per 100,000. 2,396 $25.7 million 14,375 $154.5 million
Scenario 3: Eliminate waitlist completely to serve 380 people per 100,000. 2,509 $26.1 million 15,054 $156.4 million
Source: Washington CARE database and SSPS data for FY 2012. Note: Estimated costs are for the state’s share of Medicaid services.

25
• State Auditor’s Office • Developmental Disabilities Program Evaluation •
Washington maintains costly residential service options for some clients while spending less on others.
When we examined the costs associated with services as they relate to where the person lives, some interesting patterns emerged. Exhibit 15 shows the average overall amount spent by the state for each client in a given residential setting as well as the total number of people supported in that setting.
The least expensive residential option houses clients in their own homes or with their families: these options cost $15,857 and $16,115 respectively. Housing clients in community residential options costs roughly twice the least expensive setting, at $25,673 per person annually. Residential service costs for those in supported living average $81,514 (about five times more than those living on their own or with family receive).
The highest annual expenditures are for clients living in RHCs, where the average yearly cost of $194,335 per person is twice the average for people in supported living, and ten times more than the support given to those living in their own home or with family.
Do the behavioral, medical, and physical challenges people with developmental disabilities face in daily living justify the differences in costs between residential options? We found that as their difficulties in conducting activities of daily living (ADL) increase, so do the costs of supporting them. Exhibit 16 shows that the costs rise across almost all residential settings as the support levels rise.
As an example, Washington spends $9,676 annually to provide services and supports to a person with no or low ADL support needs who lives in his or her own home. But as ADL support needs increase for those living on their own, so do the dollars allocated to serving them: $18,605 for medium support needs, and as much as $35,772 for those with high ADL support needs. This progression can be seen whether clients live in community residential programs, in supported living, or with family. However, Exhibit 16 also illustrates that RHCs are the sole exception to this progressive increase in costs because each facility charges a set daily rate for all residents, without regard for individual characteristics and acuity levels. See Appendix D for more information on acuity levels as they relate to housing.
Exhibit 15 RHCs are significantly more expensive than other residential services and family homesAverage annual amount the state spends per person and the total number of clients served in each setting
Residential settingAverage annual
expenditureNumber of
people servedOwn home $15,857 2,633Parent/relative home $16,115 10,139Community residential $25,673 2,665Supported living $81,514 3,519RHC $194,335 876Source: CARE, SSPS, FY 2012
Mediumacuity level
Exhibit 16State spending is higher to support clients in RHCs, even when Activities of Daily Living support levels vary
Source: CARE, SSPS, FY 2012.
RHC $193,737
Supported living$87,008
$13,624 Parent/relative home
$18,605 Own home
$23,446 Community residential
Annual per person expenditure in FY 2012
None/Lowacuity level
(least supportneeded)
$194,310
$65,472 Supported living
$8,570 Parent/relative home
$9,676 Own home
$17,754 Community residential
Highacuity level
(most supportneeded)
$193,562Supported living$93,217
$27,252 Parent/relative home
$35,772 Own home$36,922 Community residential
RHC
RHC

26
• State Auditor’s Office • Developmental Disabilities Program Evaluation •
For those clients with the most complex support needs, this disparity in cost also held true. Exhibit 17 addresses only those clients with the most complex support needs, which means they have high acuity scores across all three scales: medical, behavioral and ADL. It illustrates our finding that even clients with high support needs can be cared for at home or in other non-institutional settings at substantially lower costs to the system. Of the 798 people with the most complex needs we found living across all residential settings, more than 700 are supported within the community, and the majority live at home with families.
When we discussed reasons this might be the case with stakeholders, some pointed to additional medical and dental services that are provided at RHCs but not included in HCBS waiver costs. This explanation, however, is flawed. The Administration is required in its HCBS waiver applications submitted to CMS (Section J: Demonstrate Cost Neutrality) to identify the average Medicaid State Plan dollars utilized by both RHC and HCBS waiver participants. For RHC residents, these costs average $1,958 per year, and for waiver participants, these costs average between $3,583 (for the Basic Plus waiver) and $5,390 per year (for the Core waiver) – not nearly enough to compensate for the wide discrepancies between average RHC costs and costs to support those in other living arrangements.
Washington, like many other states, has reduced its reliance on state-run institutions. However, RHCs in Washington still play a key role in the service array. While RHCs may house some people with exceptionally complex medical needs or serious behavioral challenges, such as those committed by the courts or who pose a threat to others, it does not necessarily follow that they should live in RHCs. Washington, again like other states, has demonstrated that people with complex needs can be served within appropriately staffed and funded community HCBS alternatives. As noted previously, several states, including Oregon, do not have any state-operated institutions and so serve people with high levels of support need in the community.
RHCs are not Washington’s only expensive care option, as costs for the Supported Living program demonstrate.
The Supported Living program is also a relatively expensive way to serve clients with similar needs. The Administration helps 3,519 people through Supported Living, with average annual costs of $81,514 per person, many times the cost of the next most expensive care option, as illustrated in Exhibit 16. While addressing the use of RHCs should be the state’s first priority, we believe that the Administration should also examine ways to reduce the high costs of Supported Living services. Doing so can help distribute resources more effectively and equitably.
Some states, Tennessee and Louisiana among them, are using shared support hours to reduce supported living costs. Examples include: sharing staff support for weekend activities, recreational activities or events; sharing supports during morning or evening hours (before and after an individuals’ work or day programs); and shared living with one or two other housemates. In Washington, many supported living clients share supports with housemates, however there may be opportunities to increase these shared supports.
Own home RHCsCommunityresidential
$52,718$40,104
Supportedliving
$102,058
Parent/familyhome
Number of people served
$37,660 $193,042
Exhibit 17798 clients with the most complex support needs live in all residential settings, where they receivevarying levels of state support and care
Source: WA CARE database, FY 2012.
Annual per person expenditure in FY 2012.
0
100
200
300
400
500
Cost per person by housing type

27
• State Auditor’s Office • Developmental Disabilities Program Evaluation •
The delivery of developmental disabilities services should result in valued results for individuals and families. Desirable results include independence, community integration, competitive employment, social connectedness, and good health. Service systems should be held accountable for delivering these results to individuals and be routinely measured against mission-critical performance benchmarks.
Washington routinely measures its program results against performance benchmarks.
Washington follows the leading practice of measuring performance and tracking results for its clients. The Administration uses two primary tools to assess the overall quality of services and determine whether it is meeting its goals.
• National Core Indicator surveys – Washington is one of 25 states that voluntarily participate in the National Core Indicator (NCI) surveys. These standardized surveys allow states to evaluate how their developmental disabilities program results compare to other states and change over time. Washington participates in all four NCI surveys, which include face-to-face interviews with clients and their families or other representatives and mail surveys that collect data on family and guardian perspectives.
• Employment data collection – Washington also implemented a robust monthly data collection process that records a person’s employment acuity level, the number of hours worked, the type of employment services received, wages earned, and hours of support received. As part of the Governor’s Results Washington effort, the Administration tracks and reports the percentage of clients receiving employment services and earning a wage each quarter.
Those receiving services report positive results and high levels of satisfaction.
In Washington, clients who receive services report high satisfaction with their quantity and quality. While most clients and parents who participated in small group discussions told us that the system is confusing, difficult to navigate, and takes a lot of work, those receiving services are extremely grateful that they have them. Some described their situation as “very lucky” when they consider the many people who do not receive services.
Attributes of an effective system: Quality of services and results for clients Clients and families achieve valued results including independence, community integration, competitive employment, social connectedness, and health and wellness. Service systems are held accountable and results are routinely measured.

28
• State Auditor’s Office • Developmental Disabilities Program Evaluation •
More clients in Washington report having choice and control over important aspects of their lives than the national average.
Independence – making one’s own decisions as much as possible – is a key result for program clients everywhere. National Core Indicator (NCI) Consumer data show that more clients in Washington consistently report being able to make major life choices and choices about daily activities than the national average. Exhibit 18 shows that just over half of individuals chose (or had input in choosing) where they live and who they live with. More people reported choosing the staff that help them at work and at home. Clients in Washington were also more likely to report having a say in choosing their case managers.
Social connectedness, another valued result, is also given good marks in Washington. Slightly higher percentages of clients reported having friends who are not staff or family (80% in Washington compared to 73% nationally) and being able to go on dates (94% compared to 86%).
Exhibit 18Consumers of Washington’s developmental disabilitiesservices report they have more control over choices in their lives compared to the national average
Consumer chose the place they live
Consumer chose the people they live with
Consumer chose where they work
Consumer chose who helps them at work
Consumer chose wherethey go during the day
Consumer chooses what to buy with their money
Consumer chose theircase manager
Consumer chose who helps them during the day
53%
45%
56%
40%
87%
85%
86%
64%
89%
63%
79%
60%
92%
89%
74%
58%
Washington
NCI Average
Percent responding YES
Source: National Core Indicators Consumer Survey, 2009-2010. Notes: See Appendix B for statistical signi�cance of variances.
National Core Indicators consumer survey, 2009-2010

29
• State Auditor’s Office • Developmental Disabilities Program Evaluation •
People who receive services in Washington report satisfaction with their quality.
Survey results shown in Exhibit 19 indicate that satisfaction with the quality of supports in Washington is generally in line with NCI averages. Fewer clients in Washington report having met their case managers (86% compared to 93%), however, they are slightly more likely to report that their case manager return calls right away (79% compared to 73%).
Nearly all people surveyed reported that they are treated respectfully by support staff at home (95%) and at work (98%). Most report satisfaction with where they live (89%), although 22% report that they would like to live somewhere else. The difficulty of finding affordable housing came up in the small group discussions where self-advocates noted that difficulty obtaining affordable housing limits their ability to choose their living arrangement.
Only 43% of Washington survey respondents reported participating in a day activity, which is consistent with the state’s Employment First policy, but virtually all who did attend a day program reported a high level of satisfaction with it.
Washington is a national leader in employment services, but we found that the overall hours worked are low, and where clients work and what they do varies by county.
Washington’s Employment First policy states that “supports to pursue and maintain gainful employment in integrated settings in the community shall be the first service option for working age adults.” It is rooted in the idea that by lifting individuals with developmental disabilities out of poverty through gainful employment, they can improve their quality of life and have more choice and control in their daily activities.
People with developmental disabilities receiving state support must first try employment services for at least nine months. If after that time they are not satisfied with employment services, they may choose a day program. This is true for all clients, regardless of how much employment support they may need or how much that support will cost the state.
Exhibit 19Clients in Washington were generally happy with the quality of services they received
Consumer likes theirneighborhood
Percent responding YES
Consumer’s sta� at hometreats them with respect
Consumer has met their case manager/service coordinator
Consumer’s case manager/service coordinator helps them
get what they need
Consumer’s case manager/service coordinator calls them
back right away
Consumer’s sta� at worktreats them with respect
Consumer goes to a dayprogram/daily activity
Consumer is satis�ed withday program/daily activity
Consumer likes where they live
Consumer would like to livesomewhere else
87%
88%
Washington
NCI Average
95%
94%
86%
93%
92%
87%
79%
73%
98%
96%
43%
71%
98%
89%
89%
90%
22%
27%
National Core Indicators consumer survey, 2009-2010
Source: National Core Indicators Consumer Survey, 2009-2010. Notes: See Appendix B for statistical signi�cance of variances.

30
• State Auditor’s Office • Developmental Disabilities Program Evaluation •
Due in large part to the state’s Employment First policy, Washington is a national leader in employment results.
Employment First has made Washington a national leader in employment results, such as participation in integrated employment, job placement, and high wages. As shown in Exhibit 20, Washington provides integrated employment services to more individuals than comparison states. In fact, Washington serves the third highest number of people per 100,000 in general population in these employment services.
However, the hours clients actually work are low. Individual employment is the most integrated option and it pays minimum wage or better. Group supported employment and pre-vocational employment are more segregated and typically pay less than minimum wage.
Analysis of employment data revealed that while job placement rates are high, total hours worked are relatively low. As shown in Exhibit 21, we found that for all employment support levels, people in individual employment work an average of 47 hours a month. Individual employment refers to competitive employment, and is the most integrated option available.
Washington
Alaska
Idaho*
Oregon
Arizona*
Indiana
Massachusetts
Missouri
Tennessee 16%
7%
25%
23%
20%
25%
5%
28%
Exhibit 20In 2010, Washington provided integrated employment to more clientsthan the national average, and also more than comparable states Percent of client population in integrated employment
United States average = 20%
Source: Institute on Community Inclusion, The National Report on Employment Services and Outcomes, 2012.Notes: The Institute on Community Inclusion de�nes integrated employment as “a job in the community where most people do not have disabilities” and includes both group supported employment (such as mobile work crews) and individual employment. Washington’s de�nition of integrated employment includes only competitive, individual employment. * Idaho and Arizona �gures are based on 2009 data, the most recent available.
89%
Oregon, Idaho, and Alaska are in the same CMS region as Washington
By Washington’s de�nition,65% of clients participatedin integrated employment
Exhibit 21 Average paid hours worked per month by type of support in FY 2012
Type of employment support
All employment
support levels
Low employment
support levelsHigh employment
support levels
Individual employment 47 71 17
Group supported employment 54 58 45
Pre-vocational employment 50 71 37
Other activities 36 36 32
Source: WA-DDA Employment Supports Performance Outcome Information System, 2012.
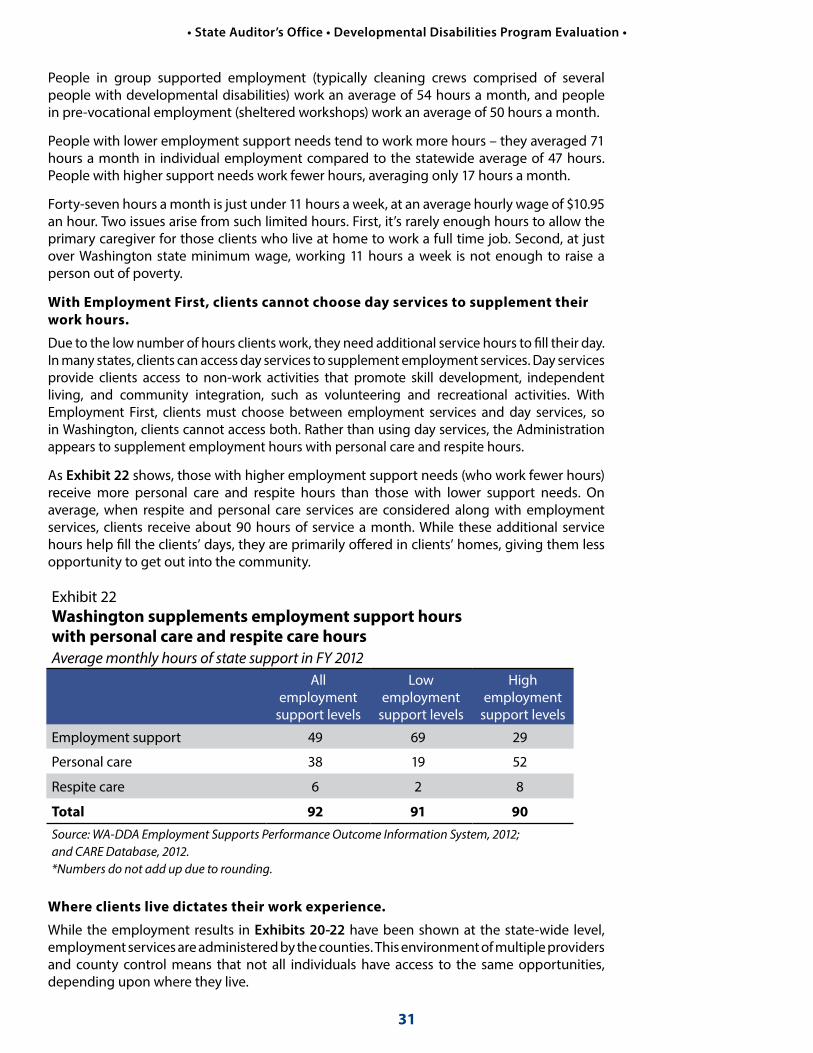
31
• State Auditor’s Office • Developmental Disabilities Program Evaluation •
People in group supported employment (typically cleaning crews comprised of several people with developmental disabilities) work an average of 54 hours a month, and people in pre-vocational employment (sheltered workshops) work an average of 50 hours a month.
People with lower employment support needs tend to work more hours – they averaged 71 hours a month in individual employment compared to the statewide average of 47 hours. People with higher support needs work fewer hours, averaging only 17 hours a month.
Forty-seven hours a month is just under 11 hours a week, at an average hourly wage of $10.95 an hour. Two issues arise from such limited hours. First, it’s rarely enough hours to allow the primary caregiver for those clients who live at home to work a full time job. Second, at just over Washington state minimum wage, working 11 hours a week is not enough to raise a person out of poverty.
With Employment First, clients cannot choose day services to supplement their work hours.
Due to the low number of hours clients work, they need additional service hours to fill their day. In many states, clients can access day services to supplement employment services. Day services provide clients access to non-work activities that promote skill development, independent living, and community integration, such as volunteering and recreational activities. With Employment First, clients must choose between employment services and day services, so in Washington, clients cannot access both. Rather than using day services, the Administration appears to supplement employment hours with personal care and respite hours.
As Exhibit 22 shows, those with higher employment support needs (who work fewer hours) receive more personal care and respite hours than those with lower support needs. On average, when respite and personal care services are considered along with employment services, clients receive about 90 hours of service a month. While these additional service hours help fill the clients’ days, they are primarily offered in clients’ homes, giving them less opportunity to get out into the community.
Where clients live dictates their work experience.
While the employment results in Exhibits 20-22 have been shown at the state-wide level, employment services are administered by the counties. This environment of multiple providers and county control means that not all individuals have access to the same opportunities, depending upon where they live.
Exhibit 22 Washington supplements employment support hours with personal care and respite care hours Average monthly hours of state support in FY 2012
All employment
support levels
Low employment
support levels
High employment
support levels
Employment support 49 69 29
Personal care 38 19 52
Respite care 6 2 8
Total 92 91 90Source: WA-DDA Employment Supports Performance Outcome Information System, 2012; and CARE Database, 2012. *Numbers do not add up due to rounding.

32
• State Auditor’s Office • Developmental Disabilities Program Evaluation •
Exhibit 23 shows the type of employment services individuals receive by county. Some counties, such as Mason and Clark, serve a relatively large number of people in individual employment, while others – including Kittitas, Benton, and Franklin – rely much more heavily on pre-vocational employment and group employment services.
Statewide
Gar�eld (1)
Wahkiakum (2)
Skamania (5)
Mason (77)
Ferry (10)
San Juan (11)
Clark (409)
Grays Harbor (71)
Island (53)
Thurston (403)
Cowlitz (111)
Snohomish (781)
Skagit (167)
Whatcom (286)
Clallam (77)
Stevens (37)
King (1830)
Je�erson (30)
Lincoln (9)
Grant (86)
Okanogan (27)
Chelan (107)
Pend Oreille (17)
Columbia (6)
Pierce (905)
Lewis (92)
Paci�c (24)
Douglas (15)
Yakima (256)
Kitsap (339)
Spokane (734)
Kittitas (95)
Whitman (60)
Adams (13)
Walla Walla (106)
Benton (186)
Franklin (33)
Asotin (42)
Klickitat (3)
Exhibit 23Washington’s counties vary widely in the amount and types of employment o�ered to people with developmental disabilitiesPercent of clients served by employment type in FY 2012(Number of clients in each county)
0% 20% 40% 60% 80% 100%
Statewide, an average of65% of clients are engaged in individual employment
Pre-vocational work is performed in the least integrated setting
Clients in group supported employment have greater opportunities to interact withnon-disabled co-workers
Almost all counties o�er somealternative activities
12 counties place 80% or moreof their clients in individualemployment, the most integratedworkplace environment
Source: WA-DDD Employment Supports Performance Outcome Information System, 2012; and CARE Database, 2012;and BERK, 2013.
Counties o�ering fewer integrated work options
Counties o�ering the most integrated work options
33
• State Auditor’s Office • Developmental Disabilities Program Evaluation •
Clients and their families feel these differences acutely. During our group conversations in Clark County, participants had positive things to say about the employment program. Family members noted the positive effect employment had on their loved ones and attributed the personal growth they witnessed to the employment program. In Benton County, participants expressed frustration with the employment program. Individuals with developmental disabilities did not like being paid less than minimum wage for group employment and did not feel respected on the job.
Indeed, Washington’s Employment First program is not without its critics. Several parents in the Tri-Cities area expressed the opinion that employment is not the right choice for everyone, and advocated for day services. They stated that their children were supported and happy with day programs and that there was real growth. Some clients noted that stable, minimum wage employment is difficult to get, but that the alternatives (group employment or sheltered workshops) are not very fulfilling.
There are a number of reasons why outcomes vary so much by county.
• Local employment markets differ in the way the recession affected them.
• Largely rural counties lack the breadth of employment opportunities and industries available in urban areas.
• Funding varies by county, as they have flexibility in how they distribute funds among mental health and developmental disabilities services. The 15 counties that provide direct employment services may be leveraging these county millage funds to support these programs.
• The state’s contribution to the employment program is based on the number of participants, their employment support needs, and their work history, without further direction on expenditure.
The latter means that counties have little if any incentive to focus on individual employment. Reimbursement rates for employment service providers are based on the client’s employment acuity and prior work history. They are the same whether the provider places and supports a person in competitive employment or places them in a sheltered workshop.
The Administration’s current reimbursement rate structure for employment services does not provide financial incentives for providers to focus on integrated, individual employment versus other more segregated options such as group employment and sheltered workshops. While some counties have made individual employment a priority, others have not. The people we talked to who live in counties that rely more heavily on group employment and sheltered workshops are less happy with the services received.
The Administration should send a stronger signal to counties by adjusting its reimbursement rates to pay more for desired results. Rate adjustments would need to be structured in a budget-neutral manner. They could include decreased rates for sheltered workshops and group employment with potential cost savings directed towards incentive payments for things like placements in individual employment at 20 hours per week or more or incentive payments for placements of high employment support needs individuals. The Administration should consider the timing and rules around any incentive payments to avoid negative effects like placements that are not a good fit for the individual.
“DSHS does not consider Goodwill to be employment because it pays less than minimum wage - but my daughter doesn’t care about the wage. She likes working there.”
– Tri-Cities parent“I work at Goodwill. A lot of people aren’t nuts about working at Goodwill, and I don’t get paid minimum wage.”
– Tri Cities client

34
RecommendationsTo better balance funding inequities and reduce the waitlist for services, we recommend that:
The Legislature set policy that directs the Developmental Disabilities Administration to develop strategies to maximize using cost-effective service options. Strategies may include:
• Reducing the number of Residential Habilitation Centers.
• Expanding crisis stabilization and emergency respite services in the community, relying less on Residential Habilitation Centers for these services.
• Providing resources to build peer support networks in the community to aid clients and their families with such needs as transportation, respite, and day activities.
The Legislature set policy to reduce the number of eligible people awaiting services:
• Set targets for how much to reduce the waitlist by when. We provide three funding scenarios to reduce the waitlist over six years (see page 24 for details).
• Direct the Administration to develop strategies and a budget proposal for prioritizing the people waiting for services by their needs. The proposal should include funding for case resource managers for people on the waitlist and for collecting information on the services people need, the level of support they require, and how urgent their needs are.
To further improve its employment program, the Administration should:
• Provide financial incentives to counties to encourage equal access to integrated, individual employment for clients regardless of where they live in the state.
What’s nextWe conducted this performance audit under the authority of the state’s performance audit law which was enacted in 2005 through the statewide citizen initiative I-900. The law requires the responsible legislative body to hold a public hearing within 30 days of its publication.
Representatives of the State Auditor’s Office will report on this performance audit to the Joint Legislative Audit Review Committee or another legislative committee. Please check the state Legislature’s website (www.leg.wa.gov) for the exact date, time, and location. The public will have the opportunity to comment at this meeting.

35
Agency Responses
35
STATE OF WASHINGTON
July 9, 2013
The Honorable Troy Kelley Washington State Auditor P.O. Box 40021 Olympia, WA 98504-0021
Dear Auditor Kelley:
Thank you for the opportunity to respond to the State Auditor’s Office (SAO) performance audit report on Developmental Disabilities in Washington: Increasing Access and Equality. The Department of Social and Health Services and the Office of Financial Management have reviewed the report and provide our joint response below.
The Department of Social and Health Services, Developmental Disabilities Administration (DDA) thanks the State Auditor’s Office (SAO) for the work contained in this report. The information is accurate in all major respects and is helpful in illustrating the challenging lack of funding. DDA believes that progress has already been made in addressing the SAO recommendation that DDA create an incentivized payment system for employing people with disabilities. In July 2012, DDA implemented new, higher rates to promote individualized employment in non-sheltered workplaces. We fully support the goal of increasing individualized employment, but it must also be recognized that individualized employment is more costly due to the need for more scrutiny and credentialing of employers.
However, the SAO’s recommendation to achieve more individualized employment and increase working hours in a budget-neutral way is not practicable. As DDA continues to move its partners away from sheltered workplaces, work hours tend to decrease as they are focused more on individualized, longer-term career goals. DDA will continue to seek progress in both the quantity and quality of work experience for these clients, but it is important to recognize that this will increase program costs.
Sincerely,
Kevin Quigley, Secretary David Schumacher, DirectorDepartment of Social and Health Services Office of Financial Management
Enclosure
cc: Mary Alice Heuschel, Chief of Staff, Office of the Governor Kelly Wicker, Executive Director for Internal Affairs, Office of the GovernorTed Sturdevant, Director of Legislative Affairs and Policy Office, Office of the GovernorWendy Korthuis-Smith, Director, Results Washington, Office of the Governor Tammy Firkins, Performance Audit Liaison, Results Washington, Office of the GovernorAlan Siegel, External Audit Compliance Manager, Department of Social and Health Services

3636
• State Auditor’s Office • Developmental Disabilities Program Evaluation •
Page 1 of 1
OFFICIAL STATE CABINET AGENCY RESPONSE TO THE PERFORMANCE AUDIT ON DEVELOPMENTAL DISABILITIES IN WASHINGTON: INCREASING ACCESS AND EQUALITY JULY 9, 2013
This coordinated management response to the audit report received June 10, 2013, is provided by the Department of Social and Health Services and the Office of Financial Management.
RECOMMENDATION: To further improve its employment program, the Developmental Disabilities Administration (DDA) should:
• Provide financial incentives to counties to encourage equal access to integrated, individual employment for clients regardless of where they live in the state.
RESPONSE
We agree that financial incentives could further improve the employment program and fully support the goal of increasing individualized employment.
Since the time period covered in this review, we believe that progress has already been made on the SAO recommendation to create an incentive payment system for employing people with disabilities.
It is important to recognize that this is not a cost-neutral proposition. It is less expensive to supportpeople in sheltered workplaces because these are congregated setting and hours are pooled. As wemove in the direction of integrated, individual employment, this will create a budget challenge.
DDA assesses each person’s individual support needs to participate in a variety of activities. Thisassessment also measures the person’s support needed in the areas of behavior, employment, medical care, and caregiver needs. It determines which programs and services the individual is eligible for, and how much service can be authorized. DDA has adjusted the rate structure in thecomputer system (named CARE) used for the assessment so that individuals with higher needs will receive more hours. This means providers will receive additional funds to support individuals with higher needs. The CARE assessment is applied statewide and will encourage employment agencies to develop jobs for clients regardless of where they live in the state. Once a person is employed, the person will earn more money and have more independence. The need for employment supports in many cases will decrease over time.
DDA is committed to seeking progress in both the quantity and quality of work experience for clients seeking integrated, individual employment. DDA will work in partnership with the Legislature to address the needs of individuals seeking integrated employment.
Action Steps and Time Frame
Implement new, higher rates to promote individualized employment in non-sheltered workplaces. Complete. July 2012

37
Appendix A: Initiative 900
37
Initiative 900, approved by Washington voters in 2005 and enacted into state law in 2006, authorized the State Auditor’s Office to conduct independent, comprehensive performance audits of state and local governments.
Specifically, the law directs the Auditor’s Office to “review and analyze the economy, efficiency, and effectiveness of the policies, management, fiscal affairs, and operations of state and local governments, agencies, programs, and accounts.” Performance audits are to be conducted according to U.S. General Accountability Office government auditing standards.
In addition, the law identifies nine elements that are to be considered within the scope of each performance audit. The State Auditor’s Office evaluates the relevance of all nine elements to each audit. The table below indicates which elements are addressed in the audit. Specific issues are discussed in the Results and Recommendations section of this report.
I-900 Element Addressed in the audit
1. Identification of cost savings Yes. The audit identified cost drivers related to residential settings for individuals and suggested policy options for reducing average costs per person.
2. Identification of services that can be reduced or eliminated
No. The audit evaluated quality of services and outcomes. It did not ultimately find services that could be eliminated. Rather it focused on providing access to services for eligible individuals who are not receiving any services.
3. Identification of programs or services that can be transferred to the private sector
No. The focus of the audit was on evaluating how well the Administration is providing services to individuals with developmental disabilities across a range of program areas, not on outsourcing to the private sector.
4. Analysis of gaps or overlaps in programs or services and recommendations to correct gaps or overlaps
Yes. The audit evaluated gaps in programs, particularly in relation to other states and national best practices.
5. Feasibility of pooling information technology systems within the department
No. The audit did not specifically address the pooling of information technology systems within the Administration.
6. Analysis of the roles and functions of the department, and recommendations to change or eliminate departmental roles or functions
No. The audit acknowledged recent and significant administrative cuts and staffing reductions. It did not identify changes to existing roles.
7. Recommendations for statutory or regulatory changes that may be necessary for the department to properly carry out its functions
Yes. The audit identified where legislative guidance or action would be required to implement recommendations.
8. Analysis of departmental performance, data performance measures, and self-assessment systems
Yes. The audit identified a number of key benchmarks and presented analysis of Washington’s performance relative to other states. It also looked at performance within Washington’s own system, particularly with respect to the employment program.
9. Identification of best practices Yes. The audit identified national trends and best practices and evaluated Washington’s performance relative to those.
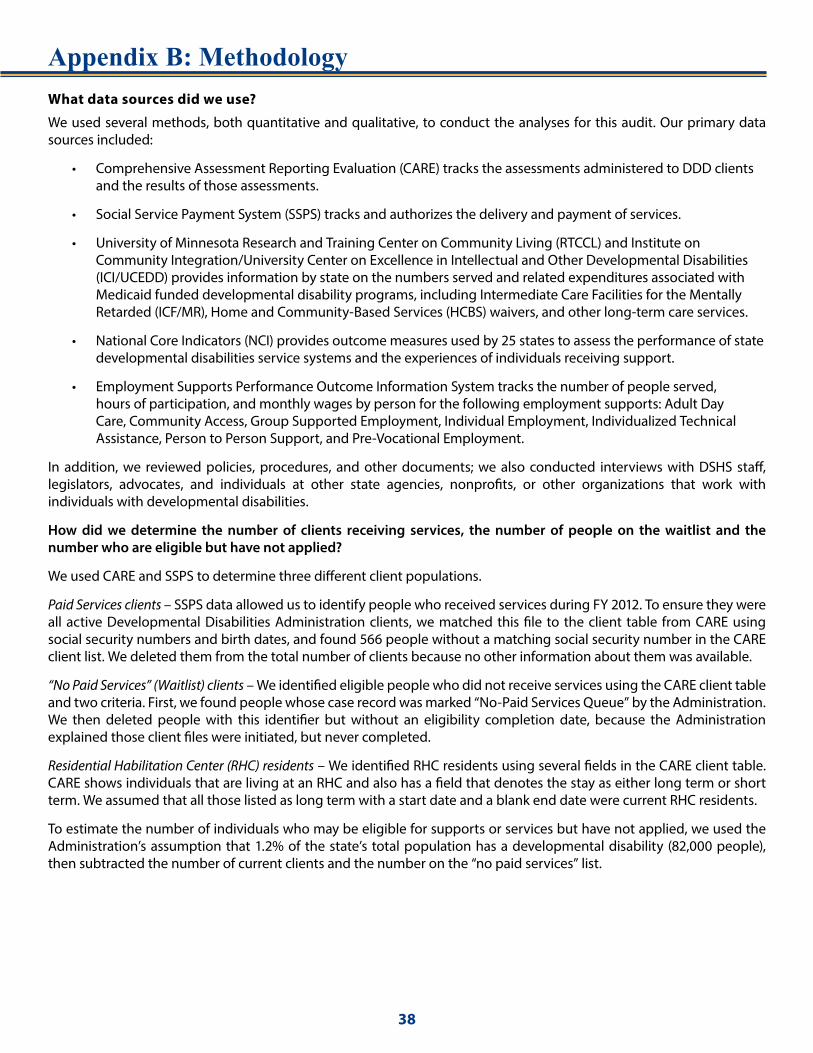
38
Appendix B: MethodologyWhat data sources did we use?
We used several methods, both quantitative and qualitative, to conduct the analyses for this audit. Our primary data sources included:
• Comprehensive Assessment Reporting Evaluation (CARE) tracks the assessments administered to DDD clients and the results of those assessments.
• Social Service Payment System (SSPS) tracks and authorizes the delivery and payment of services.
• University of Minnesota Research and Training Center on Community Living (RTCCL) and Institute on Community Integration/University Center on Excellence in Intellectual and Other Developmental Disabilities (ICI/UCEDD) provides information by state on the numbers served and related expenditures associated with Medicaid funded developmental disability programs, including Intermediate Care Facilities for the Mentally Retarded (ICF/MR), Home and Community-Based Services (HCBS) waivers, and other long-term care services.
• National Core Indicators (NCI) provides outcome measures used by 25 states to assess the performance of state developmental disabilities service systems and the experiences of individuals receiving support.
• Employment Supports Performance Outcome Information System tracks the number of people served, hours of participation, and monthly wages by person for the following employment supports: Adult Day Care, Community Access, Group Supported Employment, Individual Employment, Individualized Technical Assistance, Person to Person Support, and Pre-Vocational Employment.
In addition, we reviewed policies, procedures, and other documents; we also conducted interviews with DSHS staff, legislators, advocates, and individuals at other state agencies, nonprofits, or other organizations that work with individuals with developmental disabilities.
How did we determine the number of clients receiving services, the number of people on the waitlist and the number who are eligible but have not applied?
We used CARE and SSPS to determine three different client populations.
Paid Services clients – SSPS data allowed us to identify people who received services during FY 2012. To ensure they were all active Developmental Disabilities Administration clients, we matched this file to the client table from CARE using social security numbers and birth dates, and found 566 people without a matching social security number in the CARE client list. We deleted them from the total number of clients because no other information about them was available.
“No Paid Services” (Waitlist) clients – We identified eligible people who did not receive services using the CARE client table and two criteria. First, we found people whose case record was marked “No-Paid Services Queue” by the Administration. We then deleted people with this identifier but without an eligibility completion date, because the Administration explained those client files were initiated, but never completed.
Residential Habilitation Center (RHC) residents – We identified RHC residents using several fields in the CARE client table. CARE shows individuals that are living at an RHC and also has a field that denotes the stay as either long term or short term. We assumed that all those listed as long term with a start date and a blank end date were current RHC residents.
To estimate the number of individuals who may be eligible for supports or services but have not applied, we used the Administration’s assumption that 1.2% of the state’s total population has a developmental disability (82,000 people), then subtracted the number of current clients and the number on the “no paid services” list.

39
• State Auditor’s Office • Developmental Disabilities Program Evaluation •
How did we compare access to services and cost of services in Washington to other states?
We developed base trends using data collected by the University of Minnesota’s Research and Training Center on Community Living (RTCCL). Each year, RTCCL researchers conduct an in-depth survey to compile state and nationwide data related to residential and other related services for people with developmental disabilities. All data is collected from and verified by staff at state developmental disabilities departments.
We identified two groups of comparable states. The first group includes Alaska, Idaho, and Oregon, the states that along with Washington make up Centers for Medicaid and Medicare Services (CMS) Region 10. We assumed that the CMS Regional office responsible for oversight and review of the state developmental disabilities programs will apply similar and constant standards to all states within the region. The second group comprises states with general population totals similar to Washington (6.73 million in 2010). We selected states with 2010 populations ranging from 5.9 million to 6.55 million, which include Arizona, Indiana, Massachusetts, Missouri and Tennessee.
The table below shows all of the states included in both groups, as well as general demographic information.
We reviewed data and trends among these states related to:
• Living situations for individuals with developmental disabilities.
• Medicaid financing of services for individuals with intellectual and developmental disabilities.
• Utilization of Medicaid-funded services (including Home and Community-Based Services waivers (HCBS) and Intermediate Care Facilities for the Mentally Retarded (ICF/MR).
Note that term ‘mentally retarded’ is used within Federal Medicaid rules but it is no longer commonly used within the field when referring to individuals with disabilities. Although we refer to the ICF/MR program in this report, we refer to participants as “individuals with intellectual and developmental disabilities (IDD).”
Number of people servedTo calculate the numbers served in Washington and comparison states, we used RTCCL data for individuals receiving Medicaid-financed services through HCBS waivers and ICF/MR. We then calculated the rate per 100,000 of general population to make the data comparable to the national average and comparison states. To do this, we divided the number of individuals with developmental disabilities served by the total state population and then multiplied that result by 100,000.
Costs per personTo calculate the costs per person, we divided the total HCBS and ICF/MR spending for 2010 by the total number of individuals with developmental disabilities served.
Population and demographics for Washington, national, and comparison statesPopulation in millions, income in dollars
Washington U.S. Alaska* Idaho* Oregon* Arizona Indiana Mass. Missouri Tenn.
2010 Population1 6.725 308.75 .714 1.57 3.83 6.39 6.48 6.55 5.99 6.35
2010 Cost of Living Index2
103.6 100.00 133.9 92.1 105.0 104.3 95.0 117.1 92.7 89.1
2009-10 Average household income1
$58,820 $50,022 $60,409 $47,282 $50,216 $46,886 $45,678 $60,843 $47,879 $39,936
Data sources: 1, 2 US Census Bureau; 2 MERIC
* Note: Alaska, Idaho, and Oregon are also in CMS Region 10.

40
• State Auditor’s Office • Developmental Disabilities Program Evaluation •
How did we calculate the costs of reducing Washington’s waitlist?
We analyzed three scenarios to reduce or eliminate Washington’s waitlist for services within six years (see Exhibit 14 on page 24). We based our cost estimates on the current average cost per person in a community setting and included a mix of waiver services and Individual and Family Support Services only. The average annual costs are $13,233 for children and $38,044 for adults. There is insufficient data currently collected on the individuals waiting for services to provide more refined projections.
In each scenario, we allocated a share of children (15 years of age and under) and adults (sixteen and older) to be added to services. Further, over the years, the Human Services Research Institute (HSRI) has seen evidence that demand for service grows at a rate above population growth alone. Because of this, we included a growth in demand of 2% above population growth.
In each projection, service growth starts in 2013 and ends in 2018. The addition of new service recipients assumes that all will be placed in a HCBS waiver slot, and not into any of the ICF/MR programs. Each scenario assumes that the fiscal year 2013 starting point for number of individuals in service will be equal to data provided in CARE and SSPS showing 11,532 waiver recipients (including children and adults).
How did we compare service settings in Washington to the nation?
Residential settings
In order to see how the residential settings of Washington IDD service recipients compared to the nation as a whole, we used the RTCCL data. It allowed us to see the number of people living in the home of family or relatives, their own home or apartment, an RHC, a community ICF/MR, or a group home.
In reviewing the number of individuals living in RHCs, we also calculated the number living in RHCs per 100,000 in general population. To do this we took the number of individuals served in an RHC, divided it by the total state population, and then multiplied that result by 100,000.
Respite and Crisis Stabilization
We also used the RTCCL data to look at how Washington uses its RHCs and found that compared to other states Washington dedicates a high proportion of institutional staff and facility resources to the provision of back-up services to people living in communities. The data includes information on the number of people with short-term stays at institutions for respite, as well as evaluation and crisis housing at state-operated institutions. This information helped us understand whether and to what extent the RHCs are used for services beyond long-term care.
How did we determine where individuals with high needs are supported?
Washington is among several states that use the Supports Intensity Scale (SIS) to assess the level of support a person with developmental disabilities needs. The scale was developed by the American Association on Intellectual and Developmental Disabilities (AAIDD) in 2004. The Administration uses this measure annually to establish a person’s:
• Level-of-care, which is used to establish eligibility for HCBS waivers
• Funding for services
SIS scores are added to every client’s record in the CARE database. By comparing them to the five settings we examined (RHC, community residential, own home, supported living, and parent or relative’s home), we could establish that large numbers of individuals with “high” support are supported across all living situations.

41
• State Auditor’s Office • Developmental Disabilities Program Evaluation •
How did we compare the average costs for each residential service option?
SSPS tracks and authorizes delivery and payment of services. We used one year of data (FY 2012) that included the total annual payments by individual, service type, and provider for all of the Administration’s clients with developmental disabilities. We added up annual payments for all types of services by individual client to calculate a total amount spent per person. We then matched this sum to the CARE database to analyze the average costs by residential setting and acuity levels.
How did we account for the different costs associated with each service setting?
The data available provided us with information on the services provided, the payment amount, and the residential setting. However, there are clearly differences in what goes into the costs that we were unable to disaggregate. To understand the factors that contribute to the differences in costs between settings, we reviewed research published in 2008 Factors Associated with Expenditures for HCBS and ICF/MR Services for Persons with Intellectual and Developmental Disabilities by Lakin et. al.
How did we analyze service provider capacity?
Using the service type variable and the service provider number in the CARE database, we identified a unique list of providers who were paid for respite services. We then matched this provider list to the Agency Contracts Database, which included additional geographic information on providers and allowed us to map the location of providers by zip code. As the Agency Contracts Database includes all registered providers with an active contract, we used SSPS payment data to screen out any providers who had not actually provided a service in fiscal year 2012.
The data allowed us to look at relative numbers of providers by geographic location and service provision. However, we were unable to make a conclusion about true system capacity as we did not have access to information on provider size and staffing levels. Capacity in an area would be different if the provider business was owner-operated compared to firm with a staff of ten.
How did we analyze case manager caseloads?
The Administration sent us information on the average number of full time employees (FTE) and individuals enrolled as clients from fiscal year 2008 to 2012 by active clients and those on the waitlist. To calculate an average caseload, we divided the number of clients by the number of FTEs.
Based on interviews with several case managers, we knew that not all case managers would have 80 clients. For example, case resource managers who work with Community Protection clients are required to meet with them more often and tend to have lower caseloads of around 50 individuals.
How did we compare quality of services and outcomes (including employment) in Washington to other states?
Data presented in the report provides a baseline understanding of Washington’s developmental disabilities service system compared to averages across comparison states. Some of the information comes from the NCI reports, published online at www.nationalcoreindicators.org. All NCI reports are produced by the National Association of State Directors of Developmental Disabilities Services and HSRI. Participation is voluntary, and the number of states administering each survey varies from year to year.

42
• State Auditor’s Office • Developmental Disabilities Program Evaluation •
We looked at four NCI surveys:
• Consumer Survey administered through direct interviews with individuals with intellectual and developmental disabilities. Each participating state interviews a representative sample of individuals receiving services. For some items, if the individual is not able to respond, a person who knows him/her well may respond. The Washington state report (2009-2010) compares results from 606 face-to-face interviews with people with intellectual and developmental disabilities to results from 16 other states.
• Child Family Survey administered by mail each year to families who have a child under the age of 18 living at home and receiving services from the state. The NCI Child Family Survey Final Report, published in July 2012 and used in our report, includes data from seven states including Washington. The Washington sample represents 342 families.
• Adult Family Survey administered by mail each year to families who have an adult family member age 18 or older living at home and receiving services from the state. Ten states, including Washington participated in the Family Survey, published in March 2011. The Washington sample represents 448 families.
• Family Guardian Survey administered by mail each year to families and/or guardians who have an adult family member age 18 or older living outside the family home and receiving services from the state. Six states, including Washington, participated in the Family Guardian Survey published in April 2011. The Washington sample represents 475 families/guardians.
The analysis presented in our report compares Washington to averages across the participating NCI states that administered the survey in the same year. Information displayed in charts presents data comparing Washington’s results for one or more indicators compared to the average across participating states (referred to as the “NCI Average”). The NCI surveys ask a wide range of questions related to health and employment outcomes, living arrangements, access to and quality of services, relationships, and choice.
To complement the NCI data, we also worked with local Associations for Retarted Citizens (ARC) in Bellingham, Seattle, Spokane, Tri-Cities and Vancouver to convene small group discussions of self-advocates and parents of children or adults with developmental disabilities. The purpose of the discussions was to better understand how individuals and families experience the developmental disabilities system. Questions included general observations on the system overall – what’s going well, what is challenging – along with more targeted questions related to case managers, the assessment process, access to and quality of services, and employment.
How did we determined that employment support hours are low?
To look at employment outcomes beyond what was reported in the NCI and from participants at small group discussions, we analyzed data exported from the Administration’s Employment Supports Performance Outcome Information System. The data can be found online at www.statedata.info/washington-ddd.
This database includes information on the number of people served, hours of participation, and monthly wages by person for the following employment supports: Adult Day Care, Community Access, Group Supported Employment, Individual Employment, Individualized Technical Assistance, Person to Person Support, and Pre-Vocational Employment. It also includes information by county and by employment service provider. With this data, we were able to present a point-in-time picture of employment and wages for fiscal year 2012, as well as trend analysis for fiscal years 2008 through 2012.
This data set allowed us to look at average paid hours worked by type of employment support, location, and employment support needs (low or high). We also heard anecdotally from interviewees and small group discussion participants that while Washington has had great success with its Employment First focus, the actual number of hours worked is well below what would be considered full time employment (120-160 per month).
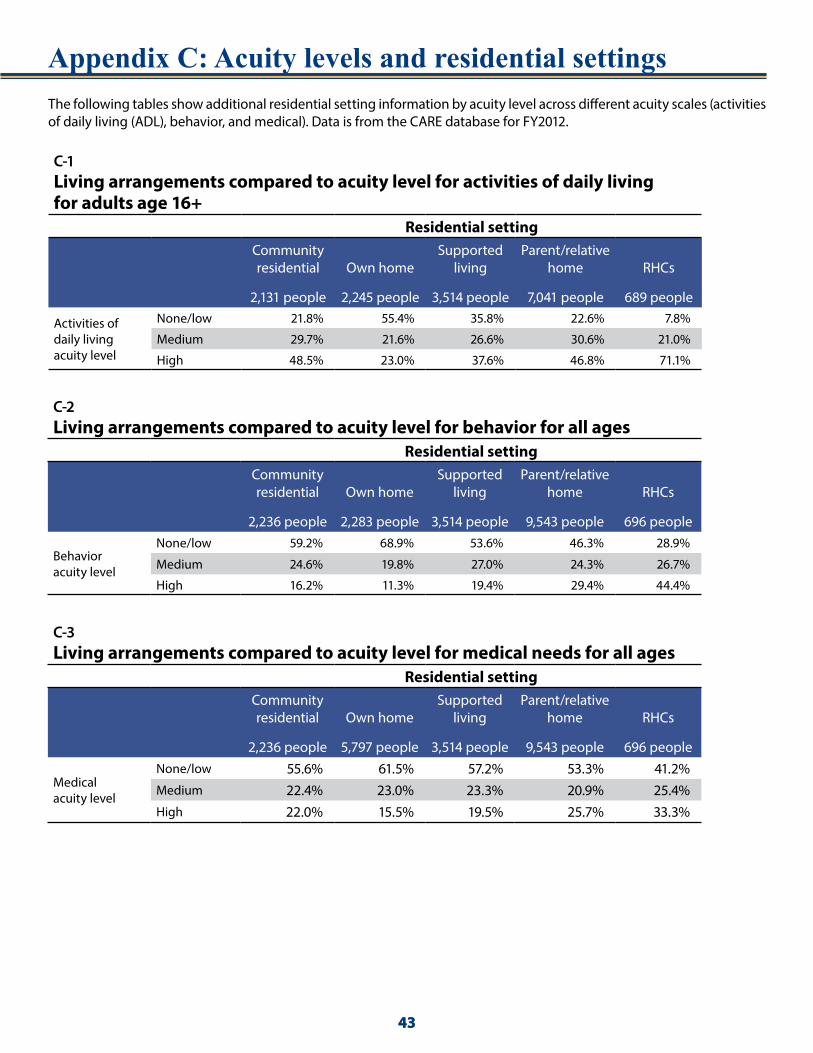
43
Appendix C: Acuity levels and residential settings
43
The following tables show additional residential setting information by acuity level across different acuity scales (activities of daily living (ADL), behavior, and medical). Data is from the CARE database for FY2012.
C-1 Living arrangements compared to acuity level for activities of daily living for adults age 16+
Residential setting Community residential
2,131 people
Own home
2,245 people
Supported living
3,514 people
Parent/relative home
7,041 people
RHCs
689 people
Activities of daily living acuity level
None/low 21.8% 55.4% 35.8% 22.6% 7.8%
Medium 29.7% 21.6% 26.6% 30.6% 21.0%
High 48.5% 23.0% 37.6% 46.8% 71.1%
C-2 Living arrangements compared to acuity level for behavior for all ages
Residential settingCommunity residential
2,236 people
Own home
2,283 people
Supported living
3,514 people
Parent/relative home
9,543 people
RHCs
696 people
Behavior acuity level
None/low 59.2% 68.9% 53.6% 46.3% 28.9%
Medium 24.6% 19.8% 27.0% 24.3% 26.7%
High 16.2% 11.3% 19.4% 29.4% 44.4%
C-3 Living arrangements compared to acuity level for medical needs for all ages
Residential settingCommunity residential
2,236 people
Own home
5,797 people
Supported living
3,514 people
Parent/relative home
9,543 people
RHCs
696 people
Medical acuity level
None/low 55.6% 61.5% 57.2% 53.3% 41.2%Medium 22.4% 23.0% 23.3% 20.9% 25.4%High 22.0% 15.5% 19.5% 25.7% 33.3%

4444
Appendix D: Acuity levels and expenditures
44
The following tables and charts show additional cost and setting information by acuity level across different acuity scales (activities of daily living (ADL), behavior, and medical). Data is from the CARE database for fiscal year 2012.
D-1 Average annual expenditures: Activities of daily living (ADL) acuity by residential setting
Residential setting None/low Medium HighCommunity residential $17,754 $18,606 $36,922 Own home $9,676 $18,605 $35,772 Supported living $65,472 $87,008 $93,217 Parent/relative home $8,570 $13,624 $27,252 RHC $194,310 $193,737 $193,562
D-2 Average annual expenditures: Behavioral acuity by residential setting
Residential setting None/low Medium HighCommunity residential $24,539 $30,976 $45,916 Own home $14,369 $20,802 $31,881 Supported living $71,984 $85,745 $102,483 Parent/relative home $14,742 $16,625 $19,700 RHC $193,427 $193,720 $193,930
D-3 Average annual expenditures: Medical acuity by residential setting
Residential setting None/low Medium HighCommunity residential $25,211 $30,915 $39,315 Own home $13,124 $19,530 $32,704 Supported living $76,141 $84,175 $94,654 Parent/relative home $11,795 $15,996 $27,263 RHC $194,553 $193,702 $192,734

45
• State Auditor’s Office • Developmental Disabilities •
D-4 Average annual expenditures by residential setting
Residential settingMean annual expenditures Number Std. Deviation Minimum Maximum
Community residential $25,673 2,665 $28,278 $8 $256,346Own home $15,857 2,633 $21,996 $35 $231,361Supported living $81,514 3,519 $39,524 $50 $319,796Parent/relative home $16,115 10,139 $15,887 $18 $232,710RHC $194,335 876 $3,863 $190,577 $200,750
D-5 Average annual expenditures: Activities of daily living (ADL) acuity by residential settingADL acuity level (level of support needed) Residential setting
Mean annual expenditures Number
Std. Deviation Minimum Maximum
None/low
Community residential $17,754 463 $20,148 $91 $160,875
Own home $9,676 1,243 $13,280 $35 $202,026
Supported living $65,472 1,259 $44,064 $50 $271,555
Parent/relative home $8,570 1,592 $7,250 $18 $123,860
RHC $194,310 54 $3,374 $190,577 $200,750
Medium
Community residential $23,446 633 $26,510 $16 $207,126
Own home $18,606 486 $19,887 $272 $161,871
Supported living $87,008 935 $34,335 $4,072 $217,128
Parent/relative home $13,624 2,157 $7,751 $40 $135,957
RHC $193,737 145 $3,448 $190,577 $200,750
High
Community residential $36,922 1,034 $28,678 $8 $256,346
Own home $35,772 516 $29,326 $1,715 $231,361
Supported living $93,217 1,320 $32,449 $2,229 $319,796
Parent/relative home $27,252 3,290 $20,205 $50 $232,710
RHC $193,562 489 $3,387 $190,577 $200,750
Total
Community residential $28,750 2,130 $27,620 $8 256,346
Own home $17,607 2,245 $22,167 $35 231,361
Supported living $81,625 3,514 $39,443 $50 319,796
Parent/relative home $18,851 7,039 $16,922 $18 232,710
RHC $193,658 688 $3,400 $190,577 200,750

46
• State Auditor’s Office • Developmental Disabilities •
D-6 Average annual expenditures: Medical acuity level by residential settingMedical acuity level (level of support needed) Residential setting
Mean annual expenditures Number
Std. Deviation Minimum Maximum
None/low
Community residential $25,211 1,243 $27,558 $16 $207,126
Own home $13,124 1,405 $17,148 $35 $202,026
Supported living $76,141 2,009 $40,573 $50 $304,805
Parent/relative home $11,795 5,088 $8,986 $18 $151,673
RHC $194,553 286 $3,884 $190,577 $200,750
Medium
Community residential $30,915 500 $29,611 $16 $196,699
Own home $19,530 525 $22,004 $633 $171,587
Supported living $84,175 820 $37,020 $1,344 $282,619
Parent/relative home $15,996 1,996 $11,259 $22 $123,860
RHC $193,702 177 $3,277 $190,577 $200,750
High
Community residential $39,315 492 $30,374 $8 $256,346
Own home $32,704 353 $32,022 $272 $231,361
Supported living $94,654 685 $35,367 $3,110 $319,796
Parent/relative home $27,263 2,457 $23,385 $50 $232,710
RHC $192,734 232 $2,694 $190,577 $200,750
Total
Community residential $29,592 2,235 $29,202 $8 $256,346
Own home $17,625 2,283 $22,333 $35 231,361
Supported living $81,625 3,514 $39,443 $50 319,796
Parent/relative home $16,658 9,541 $15,875 $18 232,710
RHC $193,729 695 $3,456 $190,577 200,750

47
• State Auditor’s Office • Developmental Disabilities •
D-7 Average annual expenditures: Behavior acuity level by residential settingBehavior acuity level (level of support needed) Residential setting
Mean annual expenditures Number
Std. Deviation Minimum Maximum
None/low
Community residential $25,211 1,243 $27,558 $16 $207,126
Own home $13,124 1,405 $17,148 $35 $202,026
Supported living $76,141 2,009 $40,573 $50 $304,805
Parent/relative home $11,795 5,088 $8,986 $18 $151,673
RHC $194,553 286 $3,884 $190,577 $200,750
Medium
Community residential $30,915 500 $29,611 $16 $196,699
Own home $19,530 525 $22,004 $633 $171,587
Supported living $84,175 820 $37,020 $1,344 $282,619
Parent/relative home $15,996 1,996 $11,259 $22 $123,860
RHC $193,702 177 $3,277 $190,577 $200,750
High
Community residential $39,315 492 $30,374 $8 $256,346
Own home $32,704 353 $32,022 $272 $231,361
Supported living $94,654 685 $35,367 $3,110 $319,796
Parent/relative home $27,263 2,457 $23,385 $50 $232,710
RHC $192,734 232 $2,694 $190,577 $200,750
Total
Community residential $29,592 2,235 $29,202 $8 $256,346
Own home $17,625 2,283 $22,333 $35 231,361
Supported living $81,625 3,514 $39,443 $50 319,796
Parent/relative home $16,658 9,541 $15,875 $18 232,710
RHC $193,729 695 $3,456 $190,577 200,750

48
• State Auditor’s Office • Developmental Disabilities •
D-8 Adults (ages 16 and over) - Medical and ADL acuity level by residential setting
Medical acuity level
ADL acuity level
Community Residential
Own home
Supported living
Parent/Relative
home RHCs Total
None/low
None/Low
Count 380 934 949 1271 34 3568
% within acuity levels 10.7% 26.2% 26.6% 35.6% 1.0% 100%
% within residential setting 17.8% 41.6% 27.0% 18.1% 4.9% 22.8%
Average cost/person $17,639 $9,153 $63,183 $8,048 $194,311 $25,798
Medium
Count 445 292 604 1442 88 2871
% within acuity levels 15.5% 10.2% 21.0% 50.2% 3.1% 100%
% within residential setting 20.9% 13.0% 17.2% 20.5% 12.8% 18.4%
Average cost/person $22,782 $18,065 $86,459 $13,026 $194,131 $36,051
High
Count 378 163 456 1079 160 2235
% within acuity levels 16.9% 7.3% 20.4% 48.3% 7.1% 100%
% within residential setting 17.7% 7.3% 13.0% 15.3% 23.1% 14.3%
Average cost/person $33,045 $27,567 $89,440 $18,962 $194,643 $48,849
Medium
None/low
Count 69 237 234 255 15 810
% within acuity levels 8.5% 29.3% 28.9% 31.5% 1.9% 100%
% within residential setting 3.2% 10.6% 6.7% 3.6% 2.2% 5.2%
Average cost/person $19,410 $10,756 $70,300 $10,538 $194,228 $32,024
Medium
Count 132 138 236 492 42 1040
% within acuity levels 12.7% 13.3% 22.7% 47.3% 4.0% 100%
% within residential setting 6.2% 6.1% 6.7% 7.0% 6.1% 6.7%
Average cost/person $25,431 $19,324 $86,236 $14,443 $193,462 $40,006
High
Count 280 144 350 785 120 1679
% within acuity levels 16.7% 8.6% 20.8% 46.8% 7.1% 100%
% within residential setting 13.1% 6.4% 10.0% 11.1% 17.4% 10.7%
Average cost/person $33,395 $34,309 $92,061 $22,087 $193,721 $51,874
High
None/low
Count 15 72 76 66 5 234
% within acuity levels 6.4% 30.8% 32.5% 28.2% 2.1% 100%
% within residential setting 0.7% 3.2% 2.2% 0.9% 0.7% 1.5%
Average cost/person $13,025 $12,903 $79,188 $11,021 $194,551 $37,790
Medium
Count 56 56 95 223 15 445
% within acuity levels 12.6% 12.6% 21.3% 50.1% 3.4% 100%
% within residential setting 2.6% 2.5% 2.7% 3.2% 2.2% 2.8%
Average cost/person $24,040 $19,656 $92,417 $15,683 $192,193 $39,566
High
Count 376 209 514 1428 210 2737
% within acuity levels 13.7% 7.6% 18.8% 52.2% 7.7% 100%
% within residential setting 17.6% 9.3% 14.6% 20.3% 30.5% 17.5%
Average cost/person $43,445 $43,178 $97,355 $36,346 $192,653 $61,293
Total
Count 2131 2245 3514 7041 689 15619
% within acuity levels 13.6% 14.4% 22.5% 45.1% 4.4% 100%
% within residential setting 100% 100% 100% 100% 100% 100%
Average cost/person $28,750 $17,607 $81,625 $18,851 $193,658 $41,845

49
• State Auditor’s Office • Developmental Disabilities •
D-9 Adults (ages 16 and over) - Behavior and ADL acuity level by residential setting
Behavior acuity level
ADL acuity level
Community Residential
Own home
Supported living
Parent/Relative
home RHCs Total
None/low
None/Low
Count 353 999 756 1191 13 3312
% within acuity levels 10.7% 30.2% 22.8% 36.0% 0.4% 100%
% within residential setting 16.6% 44.5% 21.5% 16.9% 1.9% 21.2%
Average cost/person $15,625 $8,409 $50,727 $7,592 $194,603 $19,275
Medium
Count 397 309 438 1167 34 2345
% within acuity levels 16.9% 13.2% 18.7% 49.8% 1.4% 100%
% within residential setting 18.6% 13.8% 12.5% 16.6% 4.9% 15.0%
Average cost/person $19,778 $16,730 $77,633 $12,128 $194,111 $28,903
High
Count 551 258 689 1376 154 3027
% within acuity levels 18.2% 8.5% 22.8% 45.5% 5.1% 100%
% within residential setting 25.9% 11.5% 19.6% 19.5% 22.2% 19.4%
Average cost/person $33,744 $34,799 $91,718 $26,194 $193,175 $51,656
Medium
None/low
Count 86 192 303 274 13 868
% within acuity levels 9.9% 22.1% 34.9% 31.6% 1.5% 100%
% within residential setting 4.0% 8.6% 8.6% 3.9% 1.9% 5.6%
Average cost/person $18,209 $12,850 $75,803 $10,470 $195,199 $37,336
Medium
Count 163 122 290 560 43 1178
% within acuity levels 13.8% 10.4% 24.6% 47.5% 3.7% 100%
% within residential setting 7.6% 5.4% 8.3% 8.0% 6.3% 7.5%
Average cost/person $27,339 $19,759 $89,273 $14,221 $193,327 $41,624
High
Count 276 127 355 819 130 1707
% within acuity levels 16.2% 7.4% 20.8% 48.0% 7.6% 100%
% within residential setting 13.0% 5.7% 10.1% 11.6% 18.9% 10.9%
Average cost/person $36,236 $35,178 $91,349 $26,230 $193,702 $54,810
High
None/low
Count 25 52 200 127 28 432
% within acuity levels 5.8% 12.0% 46.3% 29.4% 6.5% 100%
% within residential setting 1.2% 2.3% 5.7% 1.8% 4.1% 2.8%
Average cost/person $46,150 $22,294 $105,556 $13,650 $193,762 $70,794
Medium
Count 73 55 207 430 68 833
% within acuity levels 8.8% 6.6% 24.8% 51.6% 8.2% 100%
% within residential setting 3.4% 2.4% 5.9% 6.1% 9.9% 5.3%
Average cost/person $34,701 $26,582 $103,673 $16,905 $193,808 $55,106
High
Count 207 131 276 1097 206 1917
% within acuity levels 10.8% 6.8% 14.4% 57.2% 10.7% 100%
% within residential setting 9.7% 5.8% 7.9% 15.6% 29.9% 12.3%
Average cost/person $46,294 $38,263 $99,363 $29,339 $193,762 $59,530
Total
Count 2131 2245 3514 7041 689 15619
% within acuity levels 13.6% 14.4% 22.5% 45.1% 4.4% 100%
% within residential setting 100% 100% 100% 100% 100% 100%
Average cost/person $28,750 $17,607 $81,625 $18,851 $193,658 $41,846

50
• State Auditor’s Office • Developmental Disabilities •
D-10 Adults with high medical & high ADL acuity levels - or with high behavior acuity levels
ADL acuity level
Community Residential
Own home
Supported living
Parent/Relative
home RHCs Total
Medical acuity level: None/low
Behavior acuity level: High
None/Low
Count 19 38 142 88 15 302
% within acuity levels 6.3% 12.6% 47.0% 29.1% 5.0% 100%
% within residential setting 3.2% 9.6% 13.0% 3.4% 3.5% 5.9%
Average cost/person $43,433 $21,174 $106,883 $12,902 $193,549 $69,026
Medium
Count 49 31 115 262 46 503
% within acuity levels 9.7% 6.2% 22.9% 52.1% 9.1% 100%
% within residential setting 8.2% 7.9% 10.5% 10.1% 10.7% 9.8%
Average cost/person $33,554 $25,404 $108,137 $16,023 $194,342 $55,677
High
Count 61 41 88 336 70 596
% within acuity levels 10.2% 6.9% 14.8% 56.4% 11.7% 100%
% within residential setting 10.2% 10.4% 8.0% 12.9% 16.2% 11.6%
Average cost/person $49,853 $33,517 $100,973 $21,027 $194,527 $57,018
Medical acuity level: Medium
Behavior acuity level: High
None/low
Count 43 31 94
% within acuity levels 45.7% 33.0% 100%
% within residential setting 3.9% 1.2% 1.8%
Average cost/person $62,999 $12,016 $101,146 $15,521 $193,667 $72,116
Medium
Count 20 18 59 116 227
% within acuity levels 8.8% 7.9% 26.0% 51.1% 100%
% within residential setting 3.3% 4.6% 5.4% 4.5% 4.4%
Average cost/person $34,149 $26,562 $92,759 $18,091 $193,035 $50,374
High
Count 65 37 85 281 523
% within acuity levels 12.4% 7.1% 16.3% 53.7% 100%
% within residential setting 10.8% 9.4% 7.8% 10.8% 10.2%
Average cost/person $34,948 $40,884 $94,429 $25,066 $193,847 $56,436
Medical acuity level: High
Behavior acuity level: None/low
High
Count 195 112 289 617 86 1299
% within acuity levels 15.0% 8.6% 22.2% 47.5% 6.6% 100%
% within residential setting 32.5% 28.4% 26.4% 23.7% 20.0% 25.4%
Average cost/person $40,962 $44,236 $95,747 $36,237 $192,395 $61,214
Medical acuity level: High
Behavior acuity level: Medium
High
Count 100 44 122 331 43 640
% within acuity levels 15.6% 6.9% 19.1% 51.7% 6.7% 100%
% within residential setting 16.7% 11.2% 11.2% 12.7% 10.0% 12.5%
Average cost/person $40,778 $44,189 $97,192 $34,643 $192,435 $58,783

51
• State Auditor’s Office • Developmental Disabilities •
D-10 – continued Adults with high medical & high ADL acuity levels - or with high behavior acuity levels
ADL acuity level
Community Residential
Own home
Supported living
Parent/Relative
home RHCs Total
Medical acuity level: High
Behavior acuity level: None/low
None/low
Count 15 36
% within acuity levels 41.7% 100%
% within residential setting 1.4% 0.7%
Average cost/person $13,535 $38,648 $105,640 $14,631 $194,551 $82,180
Medical acuity level: High
Behavior acuity level: Medium
Medium
Count 33 52 103
% within acuity levels 32.0% 50.5% 100%
% within residential setting 3.0% 2.0% 2.0%
Average cost/person $51,519 $32,730 $107,632 $18,700 $192,092 $62,752
Medical acuity level: High
Behavior acuity level: High
High
Count 81 53 103 480 81 798
% within acuity levels 10.2% 6.6% 12.9% 60.2% 10.2% 100%
% within residential setting 13.5% 13.5% 9.4% 18.4% 18.8% 15.6%
Average cost/person $52,718 $40,104 $102,058 $37,660 $193,042 $63,434
Total
Count 600 394 1094 2602 431 5121
% within acuity levels 11.7% 7.7% 21.4% 50.8% 8.4% 100%
% within residential setting 100% 100% 100% 100% 100% 100%
Average cost/person $42,225 $36,884 $100,113 $28,829 $193,364 $60,095

The State Auditor’s Office Mission The State Auditor’s Office independently serves the citizens of Washington by promoting accountability, fiscal integrity and openness in state and local government. Working with these governments and with citizens, we strive to ensure the efficient and effective use of public resources.
Contact Information
State Auditor Troy Kelley(360) [email protected]
David Dean Deputy Director of Performance Audit (360) 725-9735 [email protected]
Shauna Good Lead Performance Auditor (360) 725-9724 [email protected]
Adam Wilson Assistant Director of Performance Audit (360) 725-9726 [email protected]
State Auditor’s Office P.O. Box 40022 Olympia, WA 98504-0022Website: www.sao.wa.gov(360) 902-0370
52