Embed Size (px)
Citation preview
1839
Ecological Applications, 14(6), 2004, pp. 1839–1854q 2004 by the Ecological Society of America
DEVELOPMENTAL PATTERNS AND NUTRITION IMPACT RADIATION USEEFFICIENCY COMPONENTS IN SOUTHERN PINE STANDS
T. A. MARTIN1 AND E. J. JOKELA
School of Forest Resources and Conservation, University of Florida, Gainesville, Florida 32611-0410 USA
Abstract. A number of contemporary forest productivity models use some variationof a growth efficiency («) approach. Typically, these models predict production (above-ground net primary production, ANPP, in units of dry mass biomass per unit of area perunit of time) as the product of two terms: radiation use efficiency («, in units of dry massbiomass per megajoule of photosynthetically active radiation [PAR] intercepted or absorbedby the plant canopy) and the sum of PAR intercepted or absorbed by the canopy (Fpar, inunits of megajoules per unit of radiation area per unit of time). Predicting productivity ina biologically realistic manner requires an understanding of how model components areaffected by natural and anthropogenic environmental factors, as well as other influencessuch as aging or stand development. We measured or calculated all components of the «model (aboveground woody biomass increment, IWB; foliage biomass increment, IFB; above-ground net primary production, ANPP; leaf area index, LAI; Fpar; and aboveground radiationuse efficiency, «A) from ages 4 to 18 yr in loblolly and slash pine stands in north-centralFlorida grown under replicated fertilizer and understory vegetation control treatments thatinduced a large gradient in soil nutrient availability. Treatments impacted all measuredcomponents, which in turn led to strong responses in aboveground radiation use efficiency.Age 6–9 yr «A, averaged across species, ranged from 0.78 g/MJ to 0.83 g/MJ in treatmentsreceiving fertilizer or vegetation control vs. 0.53 g/MJ in untreated plots. Stand develop-mental processes modified these responses, however, with «A declining by over 40% intreated plots from age 6–9 yr to age 15–16 yr. Variation in «A in both species was linkedto development of stand basal area (BA), with a positive, linear relationship between «A
and BA for values of BA , 18 m2/ha and a declining, linear relationship for values of BA. 18 m2/ha. Loblolly pine «A was positively correlated with foliar nitrogen concentration,[N]. These data highlight the dynamic nature of «A and suggest that both stand developmentaland nutritional processes drive changes in ANPP and «A in southern pines.
Key words: aboveground net primary production; basal area; Florida, USA; Pinus elliottii; Pinustaeda; stand development.
INTRODUCTION
The biological complexity of forest growth modelsranges from empirical, statistical descriptions of forestgrowth and yield (e.g., Curtis et al. 1981, Wykoff etal. 1982, Burkhart et al. 1987) to bottom-up modelsincorporating some or all of the known biological pro-cesses responsible for tree growth (e.g., Friend et al.1993, Kimmins et al. 1999, Kirschbaum 1999, Cropper2000). Trade-offs associated with this range of modelsinclude their ease of use for management applications(high for empirical models, low for biologically com-plex ones) and their ability to predict forest growthunder new or unique management or climate scenarios(high for biology-based models, low for empiricalgrowth and yield models).
Somewhere between these extremes lie a number ofcontemporary models that predict forest productivityusing some variation of a growth efficiency («), APAR
Manuscript received 18 August 2003; revised 13 February2004; accepted 18 March 2004. Corresponding Editor: B. J.Bond.
1 E-mail: [email protected]
(absorbed photosynthetically active radiation) or IPAR(intercepted photosynthetically active radiation) ap-proach (e.g., Monteith 1977, Sievanen 1993, Landsbergand Hingston 1996, Battaglia and Sands 1997, Lands-berg and Waring 1997). In its simplest form, the «model can be expressed as
ANPP 5 « F .par (1)
This model has some conceptual appeal because ofits simplicity, since production (aboveground net pri-mary production, ANPP, in units of dry mass biomassper unit of area per unit of time) is described as theproduct of only two terms: radiation use efficiency («,in units of dry mass biomass per megajoule of pho-tosynthetically active radiation intercepted or absorbedby the plant canopy) and the sum of photosyntheticallyactive radiation (PAR) intercepted or absorbed by thecanopy (Fpar, in megajoules per unit of radiation areaper unit of time). At the same time, the approach retainsa degree of process-level sophistication, as both the «and Fpar terms subsume considerable biological com-plexity. The applications of this approach are diverse.For example, « models frequently include modifying

1840 T. A. MARTIN AND E. J. JOKELA Ecological ApplicationsVol. 14, No. 6
PLATE 1. Understory views in loblolly pine plots in (A) the control and (B) fertilizer plus understory vegetation controltreatments. Photo credits: E. Jokela.
terms that reduce « below a theoretical optimum dueto the effects of environmental constraints such as soilfertility, drought, or temperature (Monteith 1977,McMurtrie et al. 1994, Runyon et al. 1994, Prince andGoward 1995). The growth efficiency approach hasbeen used to simulate forest net primary production,aboveground net primary production (ANPP), and evenhourly net carbon exchange (Runyon et al. 1994,Landsberg et al. 1996, Anderson et al. 2000). The «approach is especially powerful when used in con-junction with remotely sensed estimates of leaf areaindex (LAI) and Fpar to predict productivity of eco-systems at the landscape to global scales (Prince andGoward 1995, Gower et al. 1999, Anderson et al. 2000).
In order to parameterize and utilize « models to ac-curately predict forest growth in a biologically realisticmanner, it will be necessary to understand how thecomponents of this model are affected by environment,including both natural and anthropogenic factors, andhow they may change with other factors, such as agingor stand development. In this study, we examinedchanges in «A (the A subscript denoting an efficiencyincorporating only aboveground production); the twocomponents of «A (ANPP and Fpar); and the subcom-ponent parameters that comprise ANPP and Fpar
(aboveground woody biomass increment [IWB], foliagebiomass increment [IFB], and leaf area index [LAI])under treatments inducing a gradient in soil nutrientavailability during 18 yr of stand development in sin-gle-cohort, monospecific stands of loblolly pine (Pinustaeda L.) and slash pine (Pinus elliottii var. elliottii).Previous research at this site has characterized nutrientcycling (Polglase et al. 1992, Grierson et al. 1999),early growth dynamics (Colbert et al. 1990), biomassdistribution, long-term production dynamics, and leafarea efficiency (Jokela and Martin 2000, Martin andJokela 2004), and «A over short time periods (Dalla-Tea and Jokela 1991). However, the current study isthe first at this site or in these species to integrate
variation in ANPP, LAI, Fpar, and «A along a stronggradient in soil nutrient availability, over a long periodof stand development.
The objectives of this study were: (1) to quantifychanges in IWB, IFB, ANPP, LAI, Fpar, and «A underreplicated experimental treatments inducing a largegradient in soil nutrient availability, in a model systemutilizing both loblolly and slash pine, two commer-cially important tree species; (2) to quantify how theresponses in (1) were altered with stand age or standdevelopment; and (3) to determine whether ecosystemvariables such as foliar nitrogen concentration ([N]) orstand basal area or environmental variables such as sitewater balance could explain patterns of variation in «A.Many of the relationships and patterns described herechanged with stand age. We assume from the outsetthat these changes were caused less by stand age, perse, than by alterations in stand structure (e.g., meantree height, stand basal area, stem density, leaf areaindex) that occur as populations of trees grow and de-velop. We follow the silvicultural convention of refer-ring to these age-related alterations in structure as standdevelopment.
MATERIALS AND METHODS
Study site and experimental treatments
The study utilized data from the Intensive Manage-ment Practices Assessment Center experiment nearGainesville, Florida, USA (298309 N, 828209 W; seePlate 1). The study was established in January 1983 asa 2 3 2 3 2 factorial of species (loblolly pine and slashpine), complete and sustained control of competing un-derstory vegetation and annual fertilization with bothmacro- and micronutrients. This resulted in four treat-ments within each species: control (C), fertilizer only(F), understory vegetation control only (V), and fer-tilizer 1 vegetation control (FV). Each treatment–spe-cies combination was replicated three times, for a total

December 2004 1841SOUTHERN PINE RADIATION USE EFFICIENCY
TABLE 1. Summary of fertilizer treatments from the Intensive Management Practices Assessment Center experiment nearGainesville, Florida, USA.
Time periodStand age
(yr)
Mean annual application rate (kg·ha21·yr21)
N P K Ca Mg Mn Fe Cu Zn B S
1983–19931998–2000
0–1015–17
36.0242.6
14.329.0
31.737.7
10.80.0
7.20.0
0.30.4
0.30.8
0.050.13
0.30.3
0.050.13
7.20.0
Cumulativetotal (kg/ha) 1088.0 230.0 430.0 108.0 72.0 4.1 5.4 0.9 4.0 0.90 72.0
of 24 plots. Full establishment details are reported inSwindel et al. (1988). Fertilizer was applied annuallyfor the first 10 yr of the study, then fertilization wassuspended for 5 yr. In 1998 at age 15 yr, an aggressiveN and P refertilization regime was initiated in the Fand FV treatments to determine whether previously ob-served growth decreases in those treatments could beattributed to induced nutrient deficiency (Jokela andMartin 2000). Table 1 shows details of the fertilizerregimes.
Biomass parameters
Biomass harvests at ages 4 and 13 yr were used todevelop equations relating dbh to total abovegroundwoody biomass (i.e., all aboveground biomass exceptfoliage; Jokela and Martin 2000). These equations werecorrected for logarithmic bias (Baskerville 1972) andwere used in combination with periodic inventories toestimate aboveground woody biomass accumulationthrough time. The age 4 yr equations were applied forstand ages 4–6 yr, and the age 13 yr equations wereapplied to subsequent years. Aboveground woody bio-mass increment (IWB) was calculated as a gross incre-ment:
t2
I 5 WB 2 WB 1 M (2)O O OWB t t2 1t1
where WBti is stand woody biomass at time i, and Mt2St1
is the summed woody biomass of trees that died duringthe interval between t1 and t2 (‘‘Approach 2’’ of Clarket al. [2001]). This approach minimizes underestimatesof IWB that can result when large trees die in small plots(Clark et al. 2001). Application of the 13 yr equationsto age 7–13 yr inventory data should not be problem-atic, as the range of tree sizes sampled for equationdevelopment overlapped completely with the inventorydata. There may be some error associated with extrap-olation of the 13 yr equations to inventory data forolder stand ages, but the alternative of utilizing equa-tions for older trees developed on other sites wouldlikely introduce much greater uncertainty. Wood den-sity sampling at this site indicated that ring specificgravity increased from about 0.4 at age 5 yr to a plateauof ;0.5 at age 8 yr (Martin and Jokela 2004), sug-gesting that the timing and application of the biomassequations captured variation in wood density.
Leaf area and light interception
Foliage biomass production (IFB) and leaf area index(LAI) were calculated from litterfall data. Pine litterfallwas collected monthly from age 5 yr to age 18 yr fromsix 0.7-m2 litter traps randomly located within eachplot. The collected litter was sorted into needles andother pine materials (branch, bark, twigs, cones), driedat 708C, and weighed to the nearest 0.1 g. In this report,data analyses and interpretations will consider only theneedlefall component, as needles constituted .90% ofthe annual pine litterfall mass. Monthly canopy bio-mass was calculated from needlefall and logistic mod-els of foliage accretion as described by Kinerson et al.(1974), Dougherty et al. (1995), and Liu et al. (1997).This approach assumes that: (1) foliage accretion be-gins on 1 March and that the accretion curve is notaffected by treatment; and (2) needles formed in a yearare dead and fallen from the tree by 28 February in thesecond year after their formation (i.e., maximum leaflifespan is just under 2 yr). If these assumptions aremet, it follows that total needlefall in a given pheno-logical year (1 March–28 February) represents totalneedle production in the previous year. Dalla-Tea(1990), Gholz et al. (1991), and Liu et al. (1997) presentdata for both loblolly and slash pine that support thevalidity of these assumptions. Needlefall data were cor-rected for senescence-related biomass reductions of 13and 14% for slash and loblolly pine, respectively, andwere converted to hemi-surface leaf area (all-sided leafarea/2) using mean values of specific leaf area for slash(0.0050 m2/g) and loblolly pine (0.0058 m2/g) (Dalla-Tea 1990, Dalla-Tea and Jokela 1991). This approachfolds variation in specific leaf area due to foliage ageand season into a single average. Liu et al. (1997) madethe same simplifying assumption for their litterfall-based estimates of LAI in slash pine stands and foundthat they compared well with independent, gap frac-tion-based estimates. Foliage biomass production wasadded to IWB to obtain aboveground net primary pro-duction (ANPP).
The Beer-Lambert law was used to estimate Fpar foreach year in each plot by combining the monthly can-opy LAI data with the 30-yr mean monthly incomingradiation for north Florida (National Renewable EnergyLaboratory 1992). We utilized empirically derived, sea-son-specific, sun-angle corrected values of the Beer-

1842 T. A. MARTIN AND E. J. JOKELA Ecological ApplicationsVol. 14, No. 6
Lambert extinction coefficient k as reported for thesesame stands by Dalla-Tea and Jokela (1991). We as-sumed that PAR comprises 50% of total incoming ra-diation (Landsberg and Waring 1997, Waring and Run-ning 1998). In addition, we assumed that the Beer-Lambert law is sufficient for estimating radiation in-terception in pine canopies. This assumption can betroublesome in non-closed canopies or in canopies withclumped foliage (Stenberg et al. 1994). Landsberg andGower (1997) argue, however, that these problems withBeer-Lambert estimations of Fpar become less severewhen estimates are averaged over longer time steps(i.e., days, weeks, and seasons). As one test of theseassumptions, we compared our monthly plot-level Fpar
estimates with equivalent estimates derived frommonthly ceptometer measurements made in all plotsover an 11-mo period at age 6 yr (Fpar-c; Dalla-Tea 1990,Dalla-Tea and Jokela 1991). The two estimates werehighly correlated with each other (Fpar [in megajoulesper square meter] 5 26.8 1 0.99 3 Fpar-c, P , 0.0001,R2 5 0.72, n 5 264), suggesting that the method de-scribed here produces reasonable Fpar and LAI esti-mates.
Aboveground radiation use efficiency («A) was cal-culated by dividing ANPP by Fpar during the time pe-riod. All parameters were calculated over the followingtime intervals: ages 4–6, 6–9, 9–11, 11–13, 13–15, and15–16 yr. In addition, IWB was calculated for ages 16–18 yr.
Transpiration and water balance
To examine the influence of site water balance onradiation use efficiency, a transpiration model was con-structed to simulate changes in annual site water bal-ance (precipitation 2 transpiration) with treatment overthe course of the experiment. The model simulatedhourly stomatal conductance by adjusting the maxi-mum midday measured stomatal conductance in thesespecies (110 mmol·m22·s21 all-sided leaf area basis, 220mmol·m22·s21 hemi-surface area basis; T. A. Martin,unpublished data) downward based on the radiationlevel for that day and then varied stomatal conductancelinearly upward from zero at the hour before sunrisetoward the maximum at noon and then linearly down-ward to zero at the hour after sunset in the afternoon.Hourly leaf-level transpiration was calculated from va-por pressure deficit (VPD) and stomatal conductanceusing the Penman-Monteith equation (Monteith 1965),assuming that boundary layer conductance was muchlarger than stomatal conductance (Ewers and Oren2000). Leaf-level transpiration was then scaled to theplot level using monthly values of leaf area index, as-suming that at hemi-surface LAI above 2.5, additionalleaf area becomes increasingly shaded and thereforehas a lower stomatal conductance and transpiration rate(Iritz and Lindroth 1996, Phillips and Oren 2001). Be-cause information on understory vegetation was verylimited (Neary et al. 1990a), we assumed that under-
story LAI in the C and F treatments were at a steadystate level of 0.75 and 1.0, respectively. Hourly tran-spiration was then summed by year and subtracted fromannual precipitation to produce a simple water balanceestimate for each plot. We did not attempt to modelsoil water balance explicitly, as the hydrology of flat-woods spodosols in this region is quite complex (Abra-hamson and Hartnett 1990).
Hourly meteorological data to drive the model werenot available for the entire length of the experiment,so we used daily maximum and minimum air temper-ature and precipitation measurements from the Gaines-ville airport, located ;8 km from our site, and simu-lated hourly VPD (Landsberg 1986) and daily radiation(Weiss and Hays 2004) from the measured data. Com-parisons of one year of simulated hourly VPD withmeasurements from a nearby meteorological station(Gholz and Clark 2002) showed that the simulated datamatched the timing, patterns, and peaks of the mea-sured data quite well. To assess the model, we com-pared simulations with four months of sap flow tran-spiration measurements made on one FV plot in eachspecies at the site (Martin 2000). Model predictions ofcumulative stand transpiration were within 10% ofmeasured values for both species.
Foliar N concentration
At ages 6, 7, and 14 yr, foliage was collected fromthe upper crown of four trees per plot, composited,dried, and ground. The foliage was then analyzed for[N] using either a semi-micro-Kjeldahl method (Wildeet al. 1979) or an elemental analyzer (NCS 2500, CEElantech, Lakewood, New Jersey, USA). Foliar [N]was expressed as percentage of N on a dry mass basis.Foliage was sampled in August or September, corre-sponding to the period of peak LAI and minimum foliar[N] (T. A. Martin and E. J. Jokela, unpublished data).
Statistical analysis
The statistical significance of main effects (species[S], fertilizer [F], and understory vegetation control[V]) and interactions was analyzed separately for eachtime period using mixed model analysis of variance(ANOVA) for a split-plot factorial experiment. Blockand the interaction of block with species were treatedas random effects, and all others were treated as fixed.For all tests, an effect was judged statistically signif-icant when P , 0.05. When the three-way interactionterm (S 3 F 3 V) was significant, the differences be-tween means of individual treatment–species combi-nations were compared using pairwise t tests, with Pvalues adjusted using the Tukey-Kramer method tocontrol the family confidence coefficient (Neter et al.1990). To test for changes in treatment effects overtime, each species was analyzed separately using a re-peated measures ANOVA (Littell et al. 1998). Al-though the full experiment could have been analyzedand presented as a repeated measures analysis, the num-

December 2004 1843SOUTHERN PINE RADIATION USE EFFICIENCY
FIG. 1. Changes in (A, B) aboveground woody biomass production, (C, D) foliage biomass production, and (E, F)aboveground net primary production with stand age for loblolly and slash pine stands receiving control (C), fertilizer (F),understory vegetation control (V), and combination (FV) treatments. Each symbol is the mean of three replicate plots.Significance of ANOVA main effects and interactions for the full experiment (species [S] 3 fertilizer [F] 3 vegetation control[V]) for each time period are indicated by letters on the loblolly pine graph. For time periods when the three-way interaction(S 3 F 3 V) was significant, ellipses enclose treatments within a species that are not significantly different from each other(P . 0.05). Open symbols indicate a significant difference between species for that particular treatment and time period.The first arrrow along each x-axis indicates the time at which fertilization was stopped; the second arrow indicates the timeat which fertilization was resumed. The study utilized data from the Intensive Management Practices Assessment Centerexperiment near Gainesville, Florida, USA.

1844 T. A. MARTIN AND E. J. JOKELA Ecological ApplicationsVol. 14, No. 6
ber of terms was intractable (15 main effect and in-teraction terms, hundreds of potential pairwise com-parisons), so the single time point analyses were uti-lized for treatment- and species-related inferences, andthe repeated measures analyses were used only for in-ferences involving time. In subsequent discussions, ref-erences to changes in magnitudes of variables over timeindicate a significant (P , 0.05) time main effect ortime 3 treatment interaction. All analyses of variancewere performed with the SAS mixed procedure (SASInstitute 1992). Linear regression analysis was per-formed with the SAS GLM procedure (SAS Institute1992).
RESULTS
Aboveground radiation use efficiency and ANPPsubsume a number of ecological parameters, all ofwhich are likely to vary independently in response toenvironmental and plant physiological conditions. Be-cause we were interested in better understanding themechanisms driving changes in «A and ANPP, we ex-amined variation in the three terms of Eq. 1 (ANPP,«A, and Fpar), as well as the components that are usedto calculate these three terms (IWB, IFB, and LAI).
Aboveground woody biomass increment
Aboveground woody biomass increment was signif-icantly impacted by silvicultural treatment, with strongadditional variation associated with stand development(Fig. 1A, B). Within any particular treatment, loblollypine and slash pine tended to have similar IWB. At age4–6 yr, IWB in the FV treatment was higher than in allother treatments, at 10.2 Mg·ha21·yr21, vs. 6.4, 5.8, and2.1 Mg·ha21·yr21 in the F, V, and C treatments, respec-tively, averaged across species.
Aboveground woody biomass production in thetreated plots (F, V, and FV treatments) peaked at age6–9 yr for both species, with IWB in treated plots asmuch as three times greater than in the controls. In thefollowing two time periods (ages 9–11 and 11–13 yr),IWB declined sharply for both species. By age 11–13yr, IWB for F, V, and FV was the same across speciesand exceeded the controls by ;55%, compared to.200% difference at age 6–9 yr. In the year after re-fertilization at age 15, a significant F main effect wasmanifested. Plots receiving refertilization showed amean increase in IWB of 51% over plots not receivingfertilizer. The significant F effect continued through age18, although production in all plots declined duringthat time period, and IWB in plots receiving refertili-zation exceeded nonfertilized plots by only ;30%.
Foliage biomass production
Foliage biomass production (IFB) was also affectedby silvicultural treatments and to some extent by standdevelopment. As was the case for IWB, IFB within atreatment tended not to differ between species (Fig.1C, D). At age 4–6 yr, F and V treatments caused mean
increases in IFB of 1.96 Mg·ha21·yr21 (45%) and 1.51Mg·ha21·yr21 (33%), respectively. Foliage biomass pro-duction peaked at age 9–11 yr for treated plots in bothspecies and declined (loblolly pine) or remained rela-tively constant at around 5.5 Mg·ha21·yr21 (slash pine)through age 13–15 yr. By age 13–15 yr, the differentialeffects of F and V treatments had declined, and therewas no difference in IFB among treated plots or betweenspecies for those treatments (mean 5.9 Mg·ha21·yr21).After refertilization at age 15 yr, loblolly pine IFB inthe F and FV treatments increased by 19.3% over theprevious time period, in contrast to slash pine, whichshowed no response of IFB to the refertilization.
Aboveground net primary production
Trends in ANPP with silvicultural treatment andstand development (Fig. 1E, F) reflected the combinedeffects of its component variables, IWB and IFB. Withfew exceptions, species ANPP within any particulartreatment did not differ. At age 4–6 yr, the greaterfertilizer response of loblolly pine (7.88 Mg·ha21·yr21)vs. slash pine (5.29 Mg·ha21·yr21) led to a significantS 3 F interaction. As with IWB and IFB, ANPP peakedin all treated plots at age 6–9 yr (mean of treated plotsacross species 5 21.3 Mg·ha21·yr21) and declined toage 13–15 yr. At age 13–15 yr there was again a sig-nificant S 3 F interaction; fertilized loblolly pine plotsmaintained a higher ANPP than nonfertilized plots(12.4 vs. 10.0 Mg·ha21·yr21, respectively), while ANPPof slash pine fertilized and nonfertilized treatmentswere not different (11.5 Mg·ha21·yr21). The refertili-zation treatment at age 15 yr resulted in a significantacross-species F response at age 16 yr, with ANPP infertilized plots averaging 15.2 Mg·ha21·yr21 vs. 9.8Mg·ha21·yr21 in nonfertilized plots.
Leaf area index
The responses of hemi-surface leaf area index to fer-tility manipulations were large and differed consis-tently by species, with loblolly pine producing higherLAI in situations in which fertilizer was applied (Fig.2A, B). This result is in contrast to the patterns of IFB,which did not differ greatly by species (Fig. 1C, D).This contrast is attributable to specific leaf area: lob-lolly pine has higher specific leaf area than slash pine,which results in greater leaf area production per unitleaf biomass produced. The S 3 F interaction was sig-nificant for LAI at ages 4–6 and 6–9 yr, showing thatthe increase in LAI with fertilizer was greater for lob-lolly pine than for slash pine in these two time periods.For example, at age 4–6 yr, fertilizer increased LAI inloblolly pine by 1.9 m2/m2 (129%) over plots not re-ceiving fertilizer, compared to 1.3 m2/m2 (97%) forslash pine. LAI in loblolly pine F and FV plots peakedat ;5 m2/m2 at age 9–11 yr and declined over the nexttwo time periods. Slash pine, in contrast, reached anapparent ‘‘steady state’’ in LAI of ;3.8 m2/m2 in F, V,and FV treatments at age 6–9 yr, which persisted

December 2004 1845SOUTHERN PINE RADIATION USE EFFICIENCY
FIG. 2. Changes in (A, B) leaf area index, (C, D) annual intercepted photosynthetically active radiation (PAR), and (E,F) aboveground radiation use efficiency with stand age for loblolly and slash pine stands receiving control (C), fertilizer (F),understory vegetation control (V), and combination (FV) treatments. Each symbol is the mean of three replicate plots.Significance of ANOVA main effects and interactions for the full experiment (species [S] 3 fertilizer [F] 3 vegetation control[V]) for each time period are indicated by letters on the loblolly pine graph. For time periods when the three-way interaction(S 3 F 3 V) was significant, ellipses enclose treatments within a species that are not significantly different from each other(P . 0.05). Open symbols indicate a significant difference between species for that particular treatment and time period.The first arrrow along each x-axis indicates the time at which fertilization was stopped; the second arrow indicates the timeat which fertilization was resumed.
through age 16 yr. LAI for both loblolly and slash pineC treatments remained significantly lower than all otherplots through the duration of the experiment. Loblollypine LAI in plots receiving fertilizer (F and FV treat-ments) was significantly higher than in any slash pine
plots for ages 9–11 and 11–13 yr. By age 13–15 yr,LAI of fertilized loblolly pine plots had declined to thepoint that LAI of loblolly pine FV, F, and V and slashpine FV and V were not significantly different fromeach other (mean 5 4.3 m2/m2). There were marked

1846 T. A. MARTIN AND E. J. JOKELA Ecological ApplicationsVol. 14, No. 6
FIG. 3. Relationship between aboveground radiation useefficiency and simulated annual site water balance in loblollyand slash pine stands receiving control (C), fertilizer (F),understory vegetation control (V), and combination (FV)treatments. PAR is photosynthetically active radiation. Theline shows a linear regression through the data («A 5 0.63 20.000367 3 (precipitation 2 transpiration), R2 5 0.18, P ,0.0001).
differences in species responses to refertilization at age15 yr. Loblolly pine LAI responded rapidly, with re-fertilized plots showing significant positive responsesto fertilizer, in contrast to slash pine LAI, which didnot respond to refertilization.
Intercepted photosynthetically active radiation
Both fertilizer and vegetation control treatments in-creased annual Fpar above C treatments for the durationof the experiment (Fig. 2C, D). Intercepted PAR in alltreatments increased for the first two measurement pe-riods, but reached a plateau at age 6–9 yr; this plateauwas between 2.4 and 2.7 GJ·m22·yr21 in treated plots,while Fpar in the control treatments leveled off at asignificantly lower level between 1.8 and 2.0GJ·m22·yr21 There were consistent differences in spe-cies responses to fertilizer, with significant species byfertilizer interactions at ages 6–9, 11–13, and 15–16yr. For all three time periods, this interaction was theresult of slash pine having the same Fpar as loblollypine in plots not receiving fertilizer, but loblolly pinehaving significantly greater radiation interception intreatments with added fertilizer. In other words, lob-lolly pine tended to have about twice the increase inFpar in response to fertilizer than did slash pine.
Aboveground radiation use efficiency
As was the case with its component parameters, «A
responded both to experimental treatments and standdevelopment. At age 4–6 yr, «A was highest in the FVtreatment for both species, at approximately 0.61 gbiomass/MJ intercepted PAR (Fig. 2E, F). For loblollypine, this value was significantly higher than the otherthree treatments, which averaged 0.40 g/MJ. Similarly,slash pine C, F, and V treatments were not significantlydifferent from one another at 0.53 g/MJ. By age 6–9yr, «A had peaked in treated plots of both loblolly andslash pine. Aboveground radiation use efficiency ofloblolly pine F, V, and FV treatments averaged 0.83g/MJ, a 77% increase over «A in the C treatment (0.47g/MJ). In slash pine, «A of the FV treatment (0.95g/MJ) exceeded that of the F and V treatments by 22%(0.78 g/MJ) and the C treatment by 61% (0.59 g/MJ).Over the next three time periods (9–11, 11–13, and 13–15 yr), «A continued to decline in the F, V, and FVtreatments. At ages 11–13 and 13–15, the F 3 V in-teraction was highly significant (P 5 0.0093 and0.0012, respectively), as plots receiving both fertilizerand vegetation control (FV) tended to have lower «A
than did plots receiving only F or only V. Immediatelyafter the resumption of refertilization treatments at age15 yr, «A showed a highly significant F response (P 50.0002), which was consistent across species; plots re-ceiving fertilizer had an «A of 0.57 g/MJ (averagedacross species), compared to 0.42 g/MJ in the V andC treatments (Fig. 2E, F). For both species, there wasno significant change in «A over time in the C treatment.
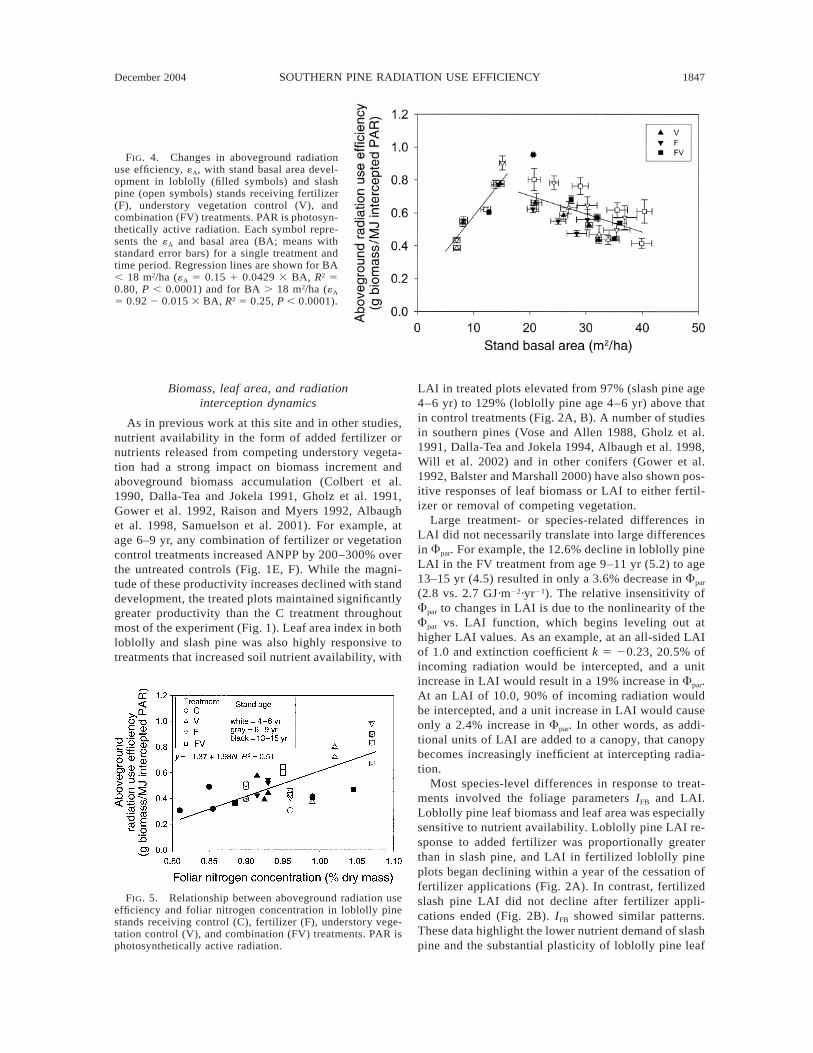
Aboveground radiation use efficiency was negativelycorrelated with an index of site water balance, precip-itation 2 transpiration («A 5 0.63 2 0.000367 3 [pre-cipitation 2 transpiration], R2 5 0.18, P , 0.0001, Fig.3). The relationship between «A and stand basal areafor plots receiving the F, V, or FV treatment was twophased, with a positive, linear relationship for valuesof BA , 18 m2/ha («A 5 0.15 1 0.0429 3 BA, R2 50.80, P , 0.0001) and a declining, linear relationshipfor values of BA . 18 m2/ha («A 5 0.92 2 0.015 3BA, R2 5 0.25, P , 0.0001; Fig. 4). Loblolly pine «A
for ages 4–6, 6–9, and 13–15 yr was significantly cor-related with foliar [N] («A 5 21.37 1 1.98 3 [N], R2
5 0.51, P , 0.0001; Fig. 5). There was not a significantrelationship between «A and foliar [N] for slash pine.
DISCUSSION
This study examined long-term patterns of radiationuse efficiency and its components in two even-agedforest model systems: loblolly pine, one of the beststudied and most commercially important tree speciesin North America, and slash pine, a much less thor-oughly studied southern pine with a range containedentirely within that of loblolly pine. The availabilityof long-term inventory and litterfall measurements inthis replicated, multi-treatment experiment provided aunique and powerful opportunity to explore the mech-anisms underlying changes in productivity and radia-tion use efficiency associated with nutrient availabilityand stand development. We found that gradients in soilnutrient availability, as induced by fertilizer additionsand control of understory vegetation, impacted all thecomponents of Eq. 1. However, stand developmentalprocesses modified these responses, resulting in largevariation in productivity and «A that was dependent onboth soil nutrient availability and stand basal area.
December 2004 1847SOUTHERN PINE RADIATION USE EFFICIENCY
FIG. 4. Changes in aboveground radiationuse efficiency, «A, with stand basal area devel-opment in loblolly (filled symbols) and slashpine (open symbols) stands receiving fertilizer(F), understory vegetation control (V), andcombination (FV) treatments. PAR is photosyn-thetically active radiation. Each symbol repre-sents the «A and basal area (BA; means withstandard error bars) for a single treatment andtime period. Regression lines are shown for BA, 18 m2/ha («A 5 0.15 1 0.0429 3 BA, R2 50.80, P , 0.0001) and for BA . 18 m2/ha («A
5 0.92 2 0.015 3 BA, R2 5 0.25, P , 0.0001).
FIG. 5. Relationship between aboveground radiation useefficiency and foliar nitrogen concentration in loblolly pinestands receiving control (C), fertilizer (F), understory vege-tation control (V), and combination (FV) treatments. PAR isphotosynthetically active radiation.
Biomass, leaf area, and radiationinterception dynamics
As in previous work at this site and in other studies,nutrient availability in the form of added fertilizer ornutrients released from competing understory vegeta-tion had a strong impact on biomass increment andaboveground biomass accumulation (Colbert et al.1990, Dalla-Tea and Jokela 1991, Gholz et al. 1991,Gower et al. 1992, Raison and Myers 1992, Albaughet al. 1998, Samuelson et al. 2001). For example, atage 6–9 yr, any combination of fertilizer or vegetationcontrol treatments increased ANPP by 200–300% overthe untreated controls (Fig. 1E, F). While the magni-tude of these productivity increases declined with standdevelopment, the treated plots maintained significantlygreater productivity than the C treatment throughoutmost of the experiment (Fig. 1). Leaf area index in bothloblolly and slash pine was also highly responsive totreatments that increased soil nutrient availability, with
LAI in treated plots elevated from 97% (slash pine age4–6 yr) to 129% (loblolly pine age 4–6 yr) above thatin control treatments (Fig. 2A, B). A number of studiesin southern pines (Vose and Allen 1988, Gholz et al.1991, Dalla-Tea and Jokela 1994, Albaugh et al. 1998,Will et al. 2002) and in other conifers (Gower et al.1992, Balster and Marshall 2000) have also shown pos-itive responses of leaf biomass or LAI to either fertil-izer or removal of competing vegetation.
Large treatment- or species-related differences inLAI did not necessarily translate into large differencesin Fpar. For example, the 12.6% decline in loblolly pineLAI in the FV treatment from age 9–11 yr (5.2) to age13–15 yr (4.5) resulted in only a 3.6% decrease in Fpar
(2.8 vs. 2.7 GJ·m22·yr21). The relative insensitivity ofFpar to changes in LAI is due to the nonlinearity of theFpar vs. LAI function, which begins leveling out athigher LAI values. As an example, at an all-sided LAIof 1.0 and extinction coefficient k 5 20.23, 20.5% ofincoming radiation would be intercepted, and a unitincrease in LAI would result in a 19% increase in Fpar.At an LAI of 10.0, 90% of incoming radiation wouldbe intercepted, and a unit increase in LAI would causeonly a 2.4% increase in Fpar. In other words, as addi-tional units of LAI are added to a canopy, that canopybecomes increasingly inefficient at intercepting radia-tion.
Most species-level differences in response to treat-ments involved the foliage parameters IFB and LAI.Loblolly pine leaf biomass and leaf area was especiallysensitive to nutrient availability. Loblolly pine LAI re-sponse to added fertilizer was proportionally greaterthan in slash pine, and LAI in fertilized loblolly pineplots began declining within a year of the cessation offertilizer applications (Fig. 2A). In contrast, fertilizedslash pine LAI did not decline after fertilizer appli-cations ended (Fig. 2B). IFB showed similar patterns.These data highlight the lower nutrient demand of slashpine and the substantial plasticity of loblolly pine leaf

1848 T. A. MARTIN AND E. J. JOKELA Ecological ApplicationsVol. 14, No. 6
area in response to changes in nutrient availability. Thefew other studies that have compared the productionecology of these two species have shown similar pat-terns. Colbert et al. (1990) observed that loblolly pineaccumulated greater biomass when soil nutrient avail-ability was high, while slash pine accumulated greaterbiomass when soil nutrient availability was low, asunder control treatment conditions. On a site in south-eastern Georgia, USA, Barron-Gafford et al. (2003)showed that when soil nutrient availability was in-creased with fertilizer and understory competition con-trol treatments, loblolly pine accumulated both higherN and P concentrations and higher N and P contentsin most biomass components compared to slash pine.
Treatment effects on radiation use efficiency
Aboveground radiation use efficiency in this studyvaried from 0.40 to almost 1.00 g/MJ across a rangeof cultural treatments and stages of stand development(Fig. 2E, F). This degree of variation in «A for twospecies at one location is almost as large as the reportedvariation in «A across temperate evergreen forests inNorth America, Australia, and New Zealand (0.18–1.48g/MJ; Runyon et al. 1994, McCrady and Jokela 1998,Gower et al. 1999). However, the peak «A values ob-served in this study were considerably lower than thosemeasured by McCrady and Jokela (1998) for 4-yr-oldloblolly pine stands in South Carolina, USA (1.33–1.44g/MJ). It is likely that the high stem density (11 800stems/ha), early stage in stand development, high qual-ity genetic stock, and fertile soils contributed to thevery high levels of «A and ANPP observed in theMcCrady and Jokela (1998) study.
Radiation use efficiency increased in response totreatments that elevated soil nutrient availability. Treat-ment-induced changes in «A were largest at age 6–9 yr,with plots receiving fertilizer or understory competi-tion control showing a 77% (loblolly pine) and 61%(slash pine) increase over the untreated controls (Fig.2E, F). An earlier study in 21-yr-old slash pine showedincreases in «A from 0.46 g/MJ in a control treatmentto 0.80 g/MJ in plots receiving fertilizer (Gholz et al.1991). A limited number of studies have shown in-creases in «A in response to fertilizer in other coniferspecies (Wang et al. 1991, Raison and Myers 1992,Balster and Marshall 2000), and Sinclair and Horie(1989) showed increases in « in several crop speciesin response to fertilizer application. Few other studieshave documented responses of « to changes in soilnutrient availability, although several have documentedchanges in southern pine leaf area efficiency (the ratioof production to LAI). For example, Albaugh et al.(1998) found that loblolly pine NPP:LAI increased by91% over control with addition of fertilizer and by120% when treated with fertilizer and irrigation. Incontrast, Samuelson et al. (2001) saw no change inIwB:LAI in fertilized and irrigated loblolly pine. Willet al. (2002) showed that fertilizer addition increased
the ratio of stem biomass growth:LAI in 7-yr-old lob-lolly pine stands, but decreased the ratio in 13-yr-oldstands. DeLucia et al. (2002) documented increasedloblolly pine « in response to elevated atmospheric CO2
concentration.Throughout stand development, «A of both species
responded similarly to treatments, i.e., there were nosignificant species 3 treatment interactions detected(Fig. 2E, F). Burkes et al. (2003) similarly found thatstemwood growth efficiency (expressed as stem bio-mass growth/leaf biomass) of loblolly and slash pinedid not differ. McCrady and Jokela (1998) found sig-nificant variation in «A among individual loblolly pinefamilies, suggesting that in some situations, within-species genetic variation in «A may be important.
Site water balance effects
Studies in other conifer forests have shown that «may be reduced by drought, cold temperatures, or otherenvironmental stresses (McMurtrie et al. 1994, Runyonet al. 1994). Over the course of the current study, pre-cipitation regimes ranged from very dry to very wet(e.g., 871 mm in 2000, 1480 mm in 1997, study periodmean 5 1203 mm). When we plotted «A against a standwater balance index obtained by subtracting annualmodeled plot-level transpiration from annual precipi-tation, there was a weak negative relationship betweenthe two variables (Fig. 3; R2 5 0.18). While this anal-ysis does not definitively test the dependence of «A onsoil water availability, it does suggest that any negativeeffects of drought were probably overwhelmed by theimpact of stand developmental and nutritional factors(see subsequent discussions).
Previous field and modeling studies have suggestedthat soil drought is not a strong determinant of pro-ductivity for pine forests on flatwoods soils (Neary etal. 1990b, McMurtrie et al. 1994, Teskey et al. 1994).To a large extent, this is probably because these flat,somewhat poorly to poorly drained sites maintain awater table within reach of tree roots for much of theyear, even as the surface soil dries (Abrahamson andHartnett 1990). Several modeling and irrigation studieson loblolly pine across a range of sites have also sug-gested that nutrient availability is a stronger determi-nant of productivity than soil water availability (Nearyet al. 1990b, Albaugh et al. 1998, Sampson and Allen1999, Samuelson et al. 2001).
The analysis in Fig. 3 implies that «A declines as sitewater balance increases, which is somewhat counter-intuitive. One explanation could be that on the poorlydrained soils of this site, higher water balance valuesmight be associated with prolonged root zone inun-dation, leading to plant stress and reduced «A. Thishypothesis has some grounding in the experience ofpractitioners: avoidance of root system inundation isone of the primary motivations for the widespread sil-vicultural practice in this region of planting tree seed-

December 2004 1849SOUTHERN PINE RADIATION USE EFFICIENCY
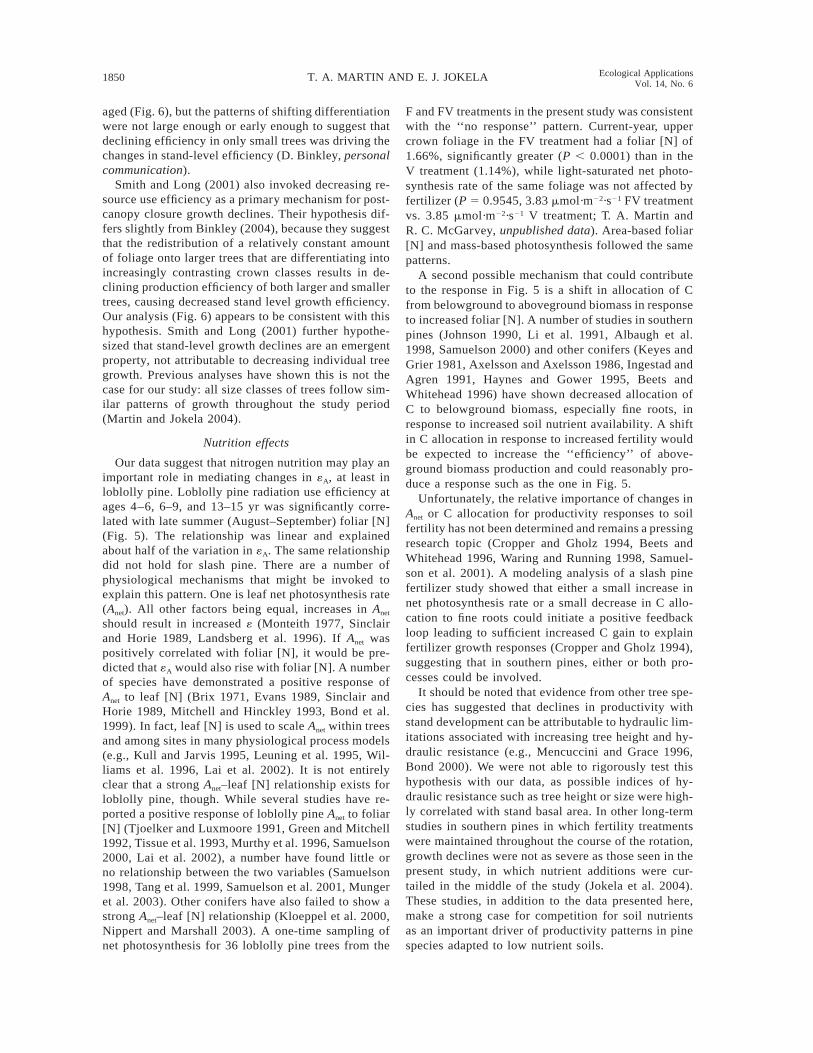
FIG. 6. Distribution of age 6–18 yr stand-level woodybiomass production across different size classes of trees inloblolly and slash pine stands under control (C) and fertilizer1 understory vegetation control (FV) treatments. The x-axiswas generated by ranking all trees from smallest to largestwoody biomass for each time period, then grouping the listinto five categories, each holding 20% of the stand’s woodybiomass. Points falling on the dotted line represent woodybiomass production that is proportional to woody biomass.
lings on raised beds (Kaufman et al. 1977, Wheeler etal. 2002).
Effects of stand development
As the stands in the current study aged, «A declinedrapidly in the treated plots, with the most intensivetreatment (FV) showing the largest decline (Fig. 2E,F). Aboveground radiation use efficiency remained re-sponsive to fertilizer, however, increasing significantlyafter the refertilization treatment at age 15 yr (Fig. 2E,F). While changes in « with stand development havebeen anticipated in the literature (Russell et al. 1989,Landsberg et al. 1996, McCrady and Jokela 1998), fewstudies have documented such variation in a forest treespecies. Saldarriaga and Luxmoore (1991) showed thatAmazonian rainforest «A declined from ;0.32 g/MJ inyoung stands in a chronosequence to nearly 0.00 g/MJin 70-yr-old stands. Will et al. (2002) examined stem-wood growth efficiency (expressed as stemwood bio-mass growth:leaf biomass) in 5-, 10- and 12-yr-old lob-lolly pine stands. They found that plot-level stemwoodgrowth efficiency was linearly and negatively relatedto mean tree height and suggested that age- or tree-size-related increases in maintenance respiration costsor partitioning of biomass to belowground componentsmay have contributed to declining efficiency. In thecurrent study, stand basal area appeared to be a goodindex of the effect of stand development on «A in treatedplots (Fig. 4). This relationship showed a linear rise in«A at lower BA levels to a peak at ;15 m2/ha and alinear decline in «A with BA above that point. Thisrelationship did not hold for the control stands, where«A was relatively insensitive to BA throughout thestudy (data not shown). The decline in «A was largelycaused by decreasing IWB (Fig. 1A, B). Variations inIFB (Fig. 1C, D) and Fpar (Fig. 2C, D) during this timeperiod were not large enough to greatly influence «A.
It has long been observed that IWB and ANPP declineat higher BA levels in even-aged forests (see reviewsby Gower et al. [1996] and Ryan et al. [1997]), andthis information has been incorporated into guidelinesfor density management. For example, published stock-ing guides specify minimum basal area levels thatshould be maintained in order to obtain ‘‘full site oc-cupancy’’ by trees. Stocking guides also stipulate max-imum basal area levels above which competition-in-duced reductions in stand productivity and self-thin-ning will occur. Stocking guides for loblolly pine (Deanand Baldwin 1993) and slash pine (Dean and Jokela1992) indicate minimum basal area levels of ;10.0 m2/ha and maximum basal area levels of 23.0 m2/ha forthe stand conditions examined in the current study.These values correspond to the range of BA around theinflection point of the relationship shown in Fig. 4. Theimplication of this relationship is that the declines ingrowth associated with aging of even-aged southernpine stands (Fig. 1E, F) are driven by large reductions
in stand-level radiation use efficiency with increasingstand basal area.
Binkley et al. (2002) and Binkley (2004) similarlyhypothesize that the decline in growth following can-opy closure in even-aged forests is associated with de-creasing stand-level resource use efficiency. More spe-cifically, they suggest that after canopy closure tree sizedifferentiation results in dominance of site resourcesby larger trees and declining resource use efficiency ofsmaller trees, leading to an overall decline in stand-level resource use efficiency. Binkley (2004) tested thishypothesis in mixed species stands in Oregon, USA,by determining the proportional distribution of stand-level growth across different size classes of trees. At74 yr, the age coinciding with declining stand-levelgrowth, the largest 20% of trees contributed 39% ofstand-level growth, compared to the smallest fifth oftrees, which accounted for only 9% of stand-levelgrowth. In the present experiment, growth differenti-ation or dominance (as defined by Binkley [2004])around the time of stand-level growth declines was lessextreme (Fig. 6). At the time of the largest IWB declinesin the treated plots (ages 9–11 yr and 11–13 yr, Fig.1A, B), there was only a slight shift in growth towardslarger trees, with the largest 20% of the FV standsproducing about 22% (loblolly pine) or 28% (slashpine) of the stands’ IWB and the smallest fifth producing17% and 13% of stand IWB in loblolly and slash pine,respectively. Differentiation increased as the stands
1850 T. A. MARTIN AND E. J. JOKELA Ecological ApplicationsVol. 14, No. 6
aged (Fig. 6), but the patterns of shifting differentiationwere not large enough or early enough to suggest thatdeclining efficiency in only small trees was driving thechanges in stand-level efficiency (D. Binkley, personalcommunication).
Smith and Long (2001) also invoked decreasing re-source use efficiency as a primary mechanism for post-canopy closure growth declines. Their hypothesis dif-fers slightly from Binkley (2004), because they suggestthat the redistribution of a relatively constant amountof foliage onto larger trees that are differentiating intoincreasingly contrasting crown classes results in de-clining production efficiency of both larger and smallertrees, causing decreased stand level growth efficiency.Our analysis (Fig. 6) appears to be consistent with thishypothesis. Smith and Long (2001) further hypothe-sized that stand-level growth declines are an emergentproperty, not attributable to decreasing individual treegrowth. Previous analyses have shown this is not thecase for our study: all size classes of trees follow sim-ilar patterns of growth throughout the study period(Martin and Jokela 2004).
Nutrition effects
Our data suggest that nitrogen nutrition may play animportant role in mediating changes in «A, at least inloblolly pine. Loblolly pine radiation use efficiency atages 4–6, 6–9, and 13–15 yr was significantly corre-lated with late summer (August–September) foliar [N](Fig. 5). The relationship was linear and explainedabout half of the variation in «A. The same relationshipdid not hold for slash pine. There are a number ofphysiological mechanisms that might be invoked toexplain this pattern. One is leaf net photosynthesis rate(Anet). All other factors being equal, increases in Anet
should result in increased « (Monteith 1977, Sinclairand Horie 1989, Landsberg et al. 1996). If Anet waspositively correlated with foliar [N], it would be pre-dicted that «A would also rise with foliar [N]. A numberof species have demonstrated a positive response ofAnet to leaf [N] (Brix 1971, Evans 1989, Sinclair andHorie 1989, Mitchell and Hinckley 1993, Bond et al.1999). In fact, leaf [N] is used to scale Anet within treesand among sites in many physiological process models(e.g., Kull and Jarvis 1995, Leuning et al. 1995, Wil-liams et al. 1996, Lai et al. 2002). It is not entirelyclear that a strong Anet–leaf [N] relationship exists forloblolly pine, though. While several studies have re-ported a positive response of loblolly pine Anet to foliar[N] (Tjoelker and Luxmoore 1991, Green and Mitchell1992, Tissue et al. 1993, Murthy et al. 1996, Samuelson2000, Lai et al. 2002), a number have found little orno relationship between the two variables (Samuelson1998, Tang et al. 1999, Samuelson et al. 2001, Mungeret al. 2003). Other conifers have also failed to show astrong Anet–leaf [N] relationship (Kloeppel et al. 2000,Nippert and Marshall 2003). A one-time sampling ofnet photosynthesis for 36 loblolly pine trees from the
F and FV treatments in the present study was consistentwith the ‘‘no response’’ pattern. Current-year, uppercrown foliage in the FV treatment had a foliar [N] of1.66%, significantly greater (P , 0.0001) than in theV treatment (1.14%), while light-saturated net photo-synthesis rate of the same foliage was not affected byfertilizer (P 5 0.9545, 3.83 mmol·m22·s21 FV treatmentvs. 3.85 mmol·m22·s21 V treatment; T. A. Martin andR. C. McGarvey, unpublished data). Area-based foliar[N] and mass-based photosynthesis followed the samepatterns.
A second possible mechanism that could contributeto the response in Fig. 5 is a shift in allocation of Cfrom belowground to aboveground biomass in responseto increased foliar [N]. A number of studies in southernpines (Johnson 1990, Li et al. 1991, Albaugh et al.1998, Samuelson 2000) and other conifers (Keyes andGrier 1981, Axelsson and Axelsson 1986, Ingestad andAgren 1991, Haynes and Gower 1995, Beets andWhitehead 1996) have shown decreased allocation ofC to belowground biomass, especially fine roots, inresponse to increased soil nutrient availability. A shiftin C allocation in response to increased fertility wouldbe expected to increase the ‘‘efficiency’’ of above-ground biomass production and could reasonably pro-duce a response such as the one in Fig. 5.
Unfortunately, the relative importance of changes inAnet or C allocation for productivity responses to soilfertility has not been determined and remains a pressingresearch topic (Cropper and Gholz 1994, Beets andWhitehead 1996, Waring and Running 1998, Samuel-son et al. 2001). A modeling analysis of a slash pinefertilizer study showed that either a small increase innet photosynthesis rate or a small decrease in C allo-cation to fine roots could initiate a positive feedbackloop leading to sufficient increased C gain to explainfertilizer growth responses (Cropper and Gholz 1994),suggesting that in southern pines, either or both pro-cesses could be involved.
It should be noted that evidence from other tree spe-cies has suggested that declines in productivity withstand development can be attributable to hydraulic lim-itations associated with increasing tree height and hy-draulic resistance (e.g., Mencuccini and Grace 1996,Bond 2000). We were not able to rigorously test thishypothesis with our data, as possible indices of hy-draulic resistance such as tree height or size were high-ly correlated with stand basal area. In other long-termstudies in southern pines in which fertility treatmentswere maintained throughout the course of the rotation,growth declines were not as severe as those seen in thepresent study, in which nutrient additions were cur-tailed in the middle of the study (Jokela et al. 2004).These studies, in addition to the data presented here,make a strong case for competition for soil nutrientsas an important driver of productivity patterns in pinespecies adapted to low nutrient soils.

December 2004 1851SOUTHERN PINE RADIATION USE EFFICIENCY
Future research needs
This study has highlighted the dynamic nature of «A
in southern pine forests. The results show that bothstand developmental and nutritional processes are as-sociated with changes in ANPP and «A (Figs. 1E, F,2E, F, 4, and 5). Our data suggest that in southern pine,increasing intraspecific competition occurring with ris-ing stand BA results in lowered stand-level resourceuse efficiency. The biological mechanisms responsiblefor these changes in efficiency remain obscure. Pre-vious researchers have identified shortcomings in ourunderstanding of post-canopy-closure growth declinesin even-aged forests (Gower et al. 1996, Ryan et al.1997, Jokela and Martin 2000), and a number of av-enues for further research are being pursued, includingage- or size-related changes in plant hydraulics andcarbon dynamics (Mencuccini and Grace 1996, Ryanand Yoder 1997, Hunt et al. 1999, Bond 2000). It isapparent, however, that nutrient uptake and utilizationresearch should take high priority in southern pines(Jokela and Martin 2000, Ducey and Allen 2001,Landsberg et al. 2001). Landsberg (2003) pointed outthat our lack of understanding of nutrient uptake andutilization mechanisms remains one of the primary bar-riers to development of robust process-based modelsfor forests in general. Clearly, if we are to use someform of efficiency model (Eq. 1) to predict forestgrowth over long periods of time and in diverse man-agement and soil environments, we must better under-stand the factors controlling variation in «A, especiallyin relation to stand development and soil nutrient sup-ply.
ACKNOWLEDGMENTS
The Forest Biology Research Cooperative at the Universityof Florida funded this research. Rayonier provided access tothe study site. Wendell Cropper helped with the modelinganalyses, and Dan Binkley provided valuable discussions.The comments of John Marshall, Barbara Bond, and an anon-ymous reviewer are appreciated. We thank S. Brooker, R. J.English, A. J. Kegley, D. R. Nolletti, J. E. Smith, D. S. Wil-son, and W. Wood for technical field assistance. This is Flor-ida Agricultural Experiment Station Journal Series PaperNumber R-10024.
LITERATURE CITED
Abrahamson, W. G., and D. C. Hartnett. 1990. Pine flatwoodsand dry prairies. Pages 103–149 in R. L. Myers and J. J.Ewel, editors. Ecosystems of Florida. University of CentralFlorida Press, Orlando, Florida, USA.
Albaugh, T. J., H. L. Allen, P. M. Dougherty, L. W. Kress,and J. S. King. 1998. Leaf area and above- and below-ground growth responses of loblolly pine to nutrient andwater additions. Forest Science 44:317–328.
Anderson, M. C., J. M. Norman, T. P. Meyers, and G. R. Diak.2000. An analytical model for estimating canopy transpi-ration and carbon assimilation fluxes based on canopy light-use efficiency. Agricultural and Forest Meteorology 101:265–289.
Axelsson, E., and B. Axelsson. 1986. Changes in carbonallocation patterns in spruce and pine trees following ir-rigation and fertilization. Tree Physiology 2:189–204.
Balster, N. J., and J. D. Marshall. 2000. Eight-year responsesof light interception, effective leaf area index, and stem-wood production in fertilized stands of interior Douglas-fir (Pseudotsuga menziesii var. glauca). Canadian Journalof Forest Research 30:733–743.
Barron-Gafford, G. A., R. E. Will, E. C. Burkes, B. Shiver,and R. O. Teskey. 2003. Nutrient concentrations and con-tents, and their relation to stem growth, of intensively man-aged Pinus taeda and Pinus elliottii stands of differentplanting densities. Forest Science 49:291–300.
Baskerville, G. L. 1972. Use of logarithmic regression in theestimation of plant biomass. Canadian Journal of ForestResearch 2:49–53.
Battaglia, M., and P. Sands. 1997. Modelling site productivityof Eucalyptus globulus in response to climatic and site fac-tors. Australian Journal of Plant Physiology 24:831–850.
Beets, P. N., and D. Whitehead. 1996. Carbon partitioningin Pinus radiata stands in relation to foliage nitrogen status.Tree Physiology 16:131–138.
Binkley, D. 2004. A hypothesis about the interaction of treedominance and stand production through stand develop-ment. Forest Ecology and Management 190:265–271.
Binkley, D., J. L. Stape, M. G. Ryan, H. R. Barnard, and J.H. Fownes. 2002. Age-related decline in forest ecosystemgrowth: an individual-tree, stand-structure hypothesis. Eco-systems 5:58–67.
Bond, B. J. 2000. Age-related changes in photosynthesis ofwoody plants. Trends in Plant Science 5:349–353.
Bond, B. J., B. T. Farnsworth, R. A. Coulombe, and W. E.Winner. 1999. Foliage physiology and biochemistry in re-sponse to light gradients in conifers with varying shadetolerance. Oecologia 120:183–192.
Brix, H. 1971. Effects of nitrogen fertilization on photosyn-thesis and respiration in Douglas-fir. Forest Science 17:407–414.
Burkes, E. C., R. E. Will, G. A. Barron-Gafford, R. O. Teskey,and B. Shiver. 2003. Biomass partitioning and growth ef-ficiency of intensively managed Pinus taeda and Pinus el-liottii stands of different planting densities. Forest Science49:224–234.
Burkhart, H. E., K. D. Farrar, R. L. Amateis, and R. F. Daniels.1987. Simulation of individual tree growth and stand de-velopment in loblolly pine plantations on cutover, site-pre-pared areas. Publication FWS-1-87. Virginia Polytechnicand State University, Department of Forestry, Blacksburg,Virginia, USA.
Clark, D. A., S. Brown, D. W. Kicklighter, J. Q. Chambers,J. R. Thomlinson, and J. Ni. 2001. Measuring net primaryproduction in forests: concepts and field methods. Ecolog-ical Applications 11:356–370.
Colbert, S. R., E. J. Jokela, and D. G. Neary. 1990. Effectsof annual fertilization and sustained weed control on drymatter partitioning, leaf area, and growth efficiency of ju-venile loblolly and slash pine. Forest Science 36:995–1014.
Cropper, W. P., Jr. 2000. SPM2: a simulation model for slashpine (Pinus elliottii) forests. Forest Ecology and Manage-ment 126:201–212.
Cropper, W. P., Jr., and H. L. Gholz. 1994. Evaluating po-tential response mechanisms of a forest stand to fertilizationand night temperature: a case study using Pinus elliottii.Ecological Bulletins 43:154–160.
Curtis, R. O., G. W. Clendenen, and D. J. Demars. 1981. Anew stand simulator for coast Douglas-fir: DFSIM user’sguide. USDA Forest Service General Technical ReportPNW-128. Pacific Northwest Forest and Range ExperimentStation, Portland, Oregon, USA.
Dalla-Tea, F. 1990. Canopy development, litterfall and nu-trient turnover in young southern pine plantations as af-fected by fertilization and weed control. Thesis. Universityof Florida, Gainesville, Florida, USA.

1852 T. A. MARTIN AND E. J. JOKELA Ecological ApplicationsVol. 14, No. 6
Dalla-Tea, F., and E. J. Jokela. 1991. Needlefall, canopy lightinterception, and productivity of young intensively man-aged slash and loblolly pine stands. Forest Science 37:1298–1313.
Dalla-Tea, F., and E. J. Jokela. 1994. Needlefall returns andresorption rates of nutrients in young intensively managedslash and loblolly pine stands. Forest Science 40:650–662.
Dean, T. J., and V. C. Baldwin. 1993. Using a density-man-agement diagram to develop thinning schedules for loblollypine plantations. USDA Forest Service Research PaperNumber SO-275. USDA Forest Service Southern ForestExperiment Station, Asheville, North Carolina, USA.
Dean, T. J., and E. J. Jokela. 1992. A density-managementdiagram for slash pine plantations in the lower coastal plain.Southern Journal of Applied Forestry 16:178–185.
DeLucia, E. H., K. George, and J. G. Hamilton. 2002. Ra-diation-use efficiency of a forest exposed to elevated con-centrations of atmospheric carbon dioxide. Tree Physiology22:1003–1010.
Dougherty, P. M., T. C. Hennessey, S. J. Zarnoch, P. T. Sten-berg, R. T. Holeman, and R. F. Wittwer. 1995. Effects ofstand development and weather on monthly leaf biomassdynamics of a loblolly pine (Pinus taeda L.) stand. ForestEcology and Management 72:213–227.
Ducey, M. J., and H. L. Allen. 2001. Nutrient supply andfertilization efficiency in midrotation loblolly pine plan-tations: a modeling analysis. Forest Science 47:96–102.
Evans, J. R. 1989. Photosynthesis and nitrogen relationshipsin leaves of C3 plants. Oecologia 78:9–19.
Ewers, B. E., and R. Oren. 2000. Analyses of assumptionsand errors in the calculation of stomatal conductance fromsap flux measurements. Tree Physiology 20:579–589.
Friend, A. D., H. H. Shugart, and S. W. Running. 1993. Aphysiology-based model of forest dynamics. Ecology 74:792–797.
Gholz, H. L., and K. L. Clark. 2002. Energy exchange acrossa chronosequence of slash pine forests in Florida. Agri-cultural and Forest Meteorology 112:87–102.
Gholz, H. L., S. A. Vogel, W. P. Cropper, Jr., K. McKelvey,K. C. Ewel, R. O. Teskey, and P. J. Curran. 1991. Dynamicsof canopy structure and light interception in Pinus elliottiistands, north Florida. Ecological Monographs 61:33–51.
Gower, S. T., C. J. Kucharik, and J. M. Norman. 1999. Directand indirect estimation of leaf area index, fAPAR, and netprimary production of terrestrial ecosystems. Remote Sens-ing of Environment 70:29–51.
Gower, S. T., R. E. McMurtrie, and D. Murty. 1996. Above-ground net primary production decline with stand age: po-tential causes. Trends in Ecology and Evolution 11:378–382.
Gower, S. T., K. A. Vogt, and C. C. Grier. 1992. Carbondynamics of Rocky Mountain Douglas-fir: influence of wa-ter and nutrient availability. Ecological Monographs 62:43–65.
Green, T. H., and R. J. Mitchell. 1992. Effects of nitrogenon the response of loblolly pine to water stress. I. Photo-synthesis and stomatal conductance. New Phytologist 122:627–633.
Grierson, P. F., N. B. Comerford, and E. J. Jokela. 1999.Phosphorus mineralization and microbial biomass in a Flor-ida Spodosol: effects of water potential, temperature andfertilizer application. Biology and Fertility of Soils 28:244–252.
Haynes, B. E., and S. T. Gower. 1995. Belowground carbonallocation in unfertilized and fertilized red pine plantationsin northern Wisconsin. Tree Physiology 15:317–325.
Hunt, E. R., Jr., M. B. Lavigne, and S. E. Franklin. 1999.Factors controlling the decline of net primary productionwith stand age for balsam fir in Newfoundland assessed
using an ecosystem simulation model. Ecological Model-ling 122:151–164.
Ingestad, T., and G. I. Agren. 1991. The influence of plantnutrition on biomass allocation. Ecological Applications 1:168–174.
Iritz, Z., and A. Lindroth. 1996. Energy partitioning in re-lation to leaf area development of short-rotation willowcoppice. Agricultural and Forest Meteorology 81:119–130.
Johnson, J. D. 1990. Dry-matter partitioning in loblolly andslash pine: effects of fertilization and irrigation. ForestEcology and Management 30:147–157.
Jokela, E. J., P. M. Dougherty, and T. A. Martin. 2004. Pro-duction dynamics of intensively managed loblolly pinestands in the southern United States: a synthesis of sevenlong-term experiments. Forest Ecology and Management192:117–130.
Jokela, E. J., and T. A. Martin. 2000. Effects of ontogenyand soil nutrient supply on production, allocation and leafarea efficiency in loblolly and slash pine stands. CanadianJournal of Forest Research 30:1511–1524.
Kaufman, C. M., W. L. Pritchett, and R. E. Choate. 1977.Growth of slash pine (Pinus elliottii var. elliottii) on drainedflatwoods. University of Florida Agricultural ExperimentStations Bulletin 792. Institute of Food and AgriculturalSciences, Gainesville, Florida, USA.
Keyes, M. R., and C. C. Grier. 1981. Above- and below-ground net production in 40-year-old Douglas-fir stands onlow and high productivity sites. Canadian Journal of ForestResearch 11:599–605.
Kimmins, J. P., D. Mailly, and B. Seely. 1999. Modellingforest ecosystem net primary production: the hybrid sim-ulation approach used in FORECAST. Ecological Model-ling 122:195–224.
Kinerson, R. S., K. O. Higginbotham, and R. C. Chapman.1974. The dynamics of foliage distribution within a forestcanopy. Journal of Applied Ecology 11:347–353.
Kirschbaum, M. U. F. 1999. CenW, a forest growth modelwith linked carbon, energy, nutrient and water cycles. Eco-logical Modelling 118:17–59.
Kloeppel, B. D., S. T. Gower, J. G. Vogel, and P. B. Reich.2000. Leaf-level resource use for evergreen and deciduousconifers along a resource availability gradient. FunctionalEcology 14:281–292.
Kull, O., and P. G. Jarvis. 1995. The role of nitrogen in asimple scheme to scale up photosynthesis from leaf to can-opy. Plant, Cell and Environment 18:1174–1182.
Lai, C. T., G. Katul, J. Butnor, M. Siqueira, D. Ellsworth, C.Maier, K. Johnsen, S. McKeand, and R. Oren. 2002. Mod-elling the limits on the response of net carbon exchange tofertilization in a south-eastern pine forest. Plant, Cell andEnvironment 25:1095–1119.
Landsberg, J. J. 1986. Physiological ecology of forest pro-duction. Academic Press, London, UK.
Landsberg, J. J. 2003. Modelling forest ecosystems: state ofthe art, challenges, and future directions. Canadian Journalof Forest Research 33:385–397.
Landsberg, J. J., and S. T. Gower. 1997. Applications ofphysiological ecology to forest management. AcademicPress, San Diego, California, USA.
Landsberg, J. J., and F. J. Hingston. 1996. Evaluating a simpleradiation/dry matter conversion model using data from Eu-calyptus globulus plantations in Western Australia. TreePhysiology 16:801–808.
Landsberg, J. J., K. H. Johnsen, T. J. Albaugh, H. L. Allen,and S. E. McKeand. 2001. Applying 3-PG, a simple pro-cess-based model designed to produce practical results, todata from loblolly pine experiments. Forest Science 47:43–51.
Landsberg, J. J., S. D. Prince, P. G. Jarvis, R. E. McMurtrie,R. J. Luxmoore, and B. E. Medlyn. 1996. Energy conver-

December 2004 1853SOUTHERN PINE RADIATION USE EFFICIENCY
sion and use in forests: an analysis of forest production interms of radiation utilisation efficiency («). Pages 273–298in H. L. Gholz, K. Nakane, and H. Shimoda, editors. Theuse of remote sensing in the modeling of forest productiv-ity. Kluwer Academic, Dordrecht, The Netherlands.
Landsberg, J. J., and R. H. Waring. 1997. A generalisedmodel of forest productivity using simplified concepts ofradiation-use efficiency, carbon balance and partitioning.Forest Ecology and Management 95:209–228.
Leuning, R., F. M. Kelliher, D. G. G. De Pury, and E.-D.Schulze. 1995. Leaf nitrogen, photosynthesis, conductanceand transpiration: scaling from leaves to canopies. Plant,Cell and Environment 18:1183–1200.
Li, B., H. L. Allen, and S. E. McKeand. 1991. Nitrogen andfamily effects on biomass allocation in loblolly pine seed-lings. Forest Science 37:271–283.
Littell, R. C., P. R. Henry, and C. B. Ammerman. 1998. Sta-tistical analysis of repeated measures data using SAS pro-cedures. Journal of Animal Science 76:1216–1231.
Liu, S., H. Riekerk, and H. L. Gholz. 1997. Leaf litterfall,leaf area index, and radiation transmittance in cypress wet-lands and slash pine plantations in north-central Florida.Wetlands Ecology and Management 4:257–271.
Martin, T. A. 2000. Winter season sap flow and stand tran-spiration in an intensively-managed loblolly and slash pineplantation. Journal of Sustainable Forestry 10:155–163.
Martin, T. A., and E. J. Jokela. 2004. Stand development andproduction dynamics of loblolly pine under a range of cul-tural treatments in north-central Florida USA. Forest Ecol-ogy and Management 192:39–58.
McCrady, R. L., and E. J. Jokela. 1998. Canopy dynamics,light interception and radiation use efficiency of selectedloblolly pine families. Forest Science 44:64–72.
McMurtrie, R. E., H. L. Gholz, S. Linder, and S. T. Gower.1994. Climatic factors controlling the productivity of pinestands: a model-based analysis. Ecological Bulletins 43:173–188.
Mencuccini, M., and J. Grace. 1996. Developmental patternsof above-ground hydraulic conductance in a Scots pine(Pinus sylvestris L.) age sequence. Plant, Cell and Envi-ronment 19:939–948.
Mitchell, A. K., and T. M. Hinckley. 1993. Effects of foliarnitrogen concentration on photosynthesis and water use ef-ficiency in Douglas-fir. Tree Physiology 12:403–410.
Monteith, J. L. 1965. Evaporation and environment. Sym-posium of the Society for Experimental Biology 19:205–234.
Monteith, J. L. 1977. Climate and efficiency of crop pro-duction in Britain. Philosophical Transactions of the RoyalSociety of London, Series B 281:277–294.
Munger, G. T., R. E. Will, and B. E. Borders. 2003. Effectsof competition control and annual nitrogen fertilization ongas exchange of different-aged Pinus taeda. Canadian Jour-nal of Forest Research 33:1076–1083.
Murthy, R., P. M. Dougherty, S. J. Zarnoch, and H. L. Allen.1996. Effects of carbon dioxide, fertilization, and irrigationon photosynthetic capacity of loblolly pine trees. TreePhysiology 16:537–546.
National Renewable Energy Laboratory. 1992. User’s man-ual: national solar radiation data base (1961–1990). Version1.0. National Climatic Data Center, Asheville, North Car-olina, USA.
Neary, D. G., E. J. Jokela, N. B. Comerford, S. R. Colbert,and T. E. Cooksey. 1990a. Understanding competition forsoil nutrients—the key to site productivity on southeasterncoastal plain spodosols. Pages 432–450 in S. P. Gessel, D.S. Lacate, G. F. Weetman, and R. F. Powers, editors. Sev-enth North American Forest Soils Conference. Faculty ofForestry, University of British Columbia, Vancouver, Brit-ish Columbia, Canada.
Neary, D. G., D. L. Rockwood, N. B. Comerford, B. F. Swin-del, and T. E. Cooksey. 1990b. Importance of weed control,fertilization, irrigation and genetics in slash and loblollypine early growth on poorly drained spodosols. Forest Ecol-ogy and Management 30:271–281.
Neter, J., W. Wasserman, and M. H. Kutner. 1990. Appliedlinear statistical models. Third edition. Irwin, Homewood,Illinois, USA.
Nippert, J. B., and J. D. Marshall. 2003. Sources of variationin ecophysiological parameters in Douglas-fir and grand fircanopies. Tree Physiology 23:591–601.
Phillips, N., and R. Oren. 2001. Intra- and inter-annual var-iation in transpiration of a pine forest. Ecological Appli-cations 11:385–396.
Polglase, P. J., E. J. Jokela, and N. B. Comerford. 1992.Nitrogen and phosphorus release from decomposing nee-dles of southern pine plantations. Soil Science Society ofAmerica Journal 56:914–920.
Prince, S. D., and S. N. Goward. 1995. Global primary pro-duction: a remote sensing approach. Journal of Biogeog-raphy 22:815–835.
Raison, R. J., and B. J. Myers. 1992. The Biology of ForestGrowth experiment: linking water and nitrogen availabilityto the growth of Pinus radiata. Forest Ecology and Man-agement 52:279–308.
Runyon, J., R. H. Waring, S. N. Goward, and J. M. Welles.1994. Environmental limits on net primary production andlight-use efficiency across the Oregon transect. EcologicalApplications 4:226–237.
Russell, G., P. G. Jarvis, and J. L. Monteith. 1989. Absorptionof radiation by canopies and stand growth. Pages 21–39 inG. Russell, B. Marshall, and P. G. Jarvis, editors. Plantcanopies: their growth, form and function. Society for Ex-perimental Biology, Cambridge University Press, Cam-bridge, UK.
Ryan, M. G., D. Binkley, and J. H. Fownes. 1997. Age-related decline in forest productivity: pattern and process.Advances in Ecological Research 27:213–262.
Ryan, M. G., and B. J. Yoder. 1997. Hydraulic limits to treeheight and tree growth. BioScience 47:235–242.
Saldarriaga, J. G., and R. J. Luxmoore. 1991. Solar energyconversion efficiencies during succession of a tropical rainforest in Amazonia. Journal of Tropical Ecology 7:233–242.
Sampson, D. A., and H. L. Allen. 1999. Regional influencesof soil available water-holding capacity and climate, andleaf area index on simulated loblolly pine productivity.Forest Ecology and Management 124:1–12.
Samuelson, L. J. 1998. Influence of intensive culture on leafnet photosynthesis and growth of sweetgum and loblollypine seedlings. Forest Science 44:308–316.
Samuelson, L. J. 2000. Effects of nitrogen on leaf physiologyand growth of different families of loblolly and slash pine.New Forests 19:95–107.
Samuelson, L. J., T. Stokes, T. E. Cooksey, and P. McLemore,III. 2001. Production efficiency of loblolly pine and sweet-gum in response to four years of intensive management.Tree Physiology 21:369–376.
SAS Institute. 1992. SAS technical report P-229. SAS/STATsoftware: changes and enhancements. Release 6.07. SASInstitute, Cary, North Carolina, USA.
Sievanen, R. 1993. A process-based model for the dimen-sional growth of even-aged stands. Scandinavian Journalof Forest Research 8:28–48.
Sinclair, T. R., and T. Horie. 1989. Leaf nitrogen, photosyn-thesis, and crop radiation use efficiency: a review. CropScience 29:90–98.
Smith, F. W., and J. N. Long. 2001. Age-related decline inforest growth: an emergent property. Forest Ecology andManagement 141:175–181.
1854 T. A. MARTIN AND E. J. JOKELA Ecological ApplicationsVol. 14, No. 6
Stenberg, P., T. Kuuluvainen, S. Kellomaki, J. C. Grace, E.J. Jokela, and H. L. Gholz. 1994. Crown structure, lightinterception and productivity of pine trees and stands. Eco-logical Bulletins 43:20–34.
Swindel, B. F., D. G. Neary, N. B. Comerford, D. L. Rockwood,and G. M. Blakeslee. 1988. Fertilization and competitioncontrol accelerate early southern pine growth on flatwoods.Southern Journal of Applied Forestry 12:116–121.
Tang, Z., J. L. Chambers, S. Guddanti, and J. P. Barnett. 1999.Thinning, fertilization, and crown position interact to con-trol physiological responses of loblolly pine. Tree Physi-ology 19:87–94.
Teskey, R. O., H. L. Gholz, and W. P. Cropper, Jr. 1994.Influence of climate and fertilization on net photosynthesisof mature slash pine. Tree Physiology 14:1215–1227.
Tissue, D. T., R. B. Thomas, and B. R. Strain. 1993. Long-term effects of elevated CO2 and nutrients on photosyn-thesis and rubisco in loblolly pine seedlings. Plant, Celland Environment 16:859–865.
Tjoelker, M. G., and R. J. Luxmoore. 1991. Soil nitrogenand chronic ozone stress influence physiology, growth andnutrient status of Pinus taeda L. and Liriodendron tulipiferaL. seedlings. New Phytologist 119:69–82.
Vose, J. M., and H. L. Allen. 1988. Leaf area, stemwoodgrowth, and nutrition relationships in loblolly pine. ForestScience 34:547–563.
Wang, Y. P., P. G. Jarvis, and C. M. A. Taylor. 1991. PARabsorption and its relation to aboveground dry matter pro-duction of Sitka spruce. Journal of Applied Ecology 28:547–560.
Waring, R. H., and S. W. Running. 1998. Forest ecosystems:analysis at multiple scales. Academic Press, San Diego,California, USA.
Weiss, A., and C. J. Hays. 2004. Simulation of daily solar ir-radiance. Agricultural and Forest Meteorology 123:187–199.
Wheeler, M., R. E. Will, D. Markewitz, M. Jacobson, and A.Shirley. 2002. Early loblolly pine stand response to tillageon the Piedmont and Upper Coastal Plain of Georgia; mor-tality, stand uniformity, and second and third year growth.Southern Journal of Applied Forestry 26:181–189.
Wilde, S. A., R. B. Corey, J. G. Iyer, and G. K. Voigt. 1979.Soil and plant analysis for tree culture. Fifth edition. Oxfordand IBH Publishing, New Delhi, India.
Will, R. E., G. T. Munger, Y. J. Zhang, and B. E. Borders.2002. Effects of annual fertilization and complete compe-tition control on current annual increment, foliar develop-ment, and growth efficiency of different aged Pinus taedastands. Canadian Journal of Forest Research 32:1728–1740.
Williams, M., E. B. Rastetter, D. N. Fernandes, M. L. Gould-en, S. C. Wofsy, G. R. Shaver, J. M. Mellillo, J. W. Munger,S.-M. Fan, and K. J. Nadelhoffer. 1996. Modelling the soil–plant–atmosphere continuum in a Quercus–Acer stand atHarvard Forest: the regulation of stomatal conductance bylight, nitrogen and soil/plant hydraulic properties. Plant,Cell and Environment 19:911–927.
Wykoff, W. R., N. L. Crookston, and A. R. Sage. 1982. User’sguide to the Stand Prognosis Model. USDA Forest ServiceGeneral Technical Report INT-133. Intermountain Forestand Range Experiment Station, Ogden, Utah, USA.