Embed Size (px)
Citation preview

327
Developments in Combustion Control for Waste Incineration Plants
Developments in Combustion Control for Waste Incineration Plants
Jens Sohnemann and Walter Schäfers
1. Introduction .......................................................................................................327
2. Objective ............................................................................................................328
3. Starting situation ...............................................................................................328
4. Further development of the control concept .................................................329
4.1. Development of a fire position detection system ..........................................330
4.2. Fuzzy control .....................................................................................................332
4.3. Control system with image processing and fuzzy controller ......................332
5. Further developments ......................................................................................333
5.1. Measurement technologies ..............................................................................333
5.2. Conventional combustion control system ....................................................334
6. The current combustion control system of Fisia Babcock Environment ........................................................................335
7. Results from recently commissioned plants .................................................338
8. Outlook ..............................................................................................................339
8.1. Avoiding mechanical overload conditions ....................................................339
8.2. Strategies for reliable calculation and evaluation of the calorific value .........................................................................................340
9. Summary ............................................................................................................340
10. Literature ............................................................................................................341
1. IntroductionCombustion control in waste incineration applications has been the subject of intensive discussion and numerous publications over the past two decades. This can be explained by the heterogeneous material stream to be burned which not only fluctuates in its composi-tion, moisture content and inert fraction but also varies greatly from season to season and

Jens Sohnemann, Walter Schäfers
328
region to region. As these fluctuations in the waste quality are stochastically distributed they do not lend themselves to statistical prediction nor can they be adequately determined by measurements during process operation. In this respect, control of the waste combustion process for a constant heat output continues to pose a challenge.
2. ObjectiveIn contrast with conventional fuels like coal, oil or gas whose physical and chemical pro-perties are well known, combustion control in waste incineration plants relies on the mea-surement of suitable process variables downstream of the actual process to be controlled, i.e. reverse control via the output parameters. Using the few controlled variables measured at the boiler outlet (steam rate, oxygen concentration) and, possibly, information about the local fire position on the combustion grate as controller inputs, it is therefore the objective of the combustion control system to organize a large number of manipulated variables for air flow and combustion grate control in such a way as to obtain the desired result.
This paper is divided into two parts. The first part deals with the major developments over the past 20 years; the second part presents the current combustion control system used by Fisia Babcock. The control performance and special system functions will be presented.
3. Starting situationThe combustion control concepts prevailing at the beginning of the 1990s are illustrated in Figures 1 and 2. As can be seen from Figure 1, the heat output and the resultant live steam production rate are controlled via the redistribution of the combustion air flow over the primary and secondary air sides [1]. The waste feed rate was controlled as a function of the O2 concentration and had to be manually varied to suit changing calorific values of the waste input stream. A typical diagram of this control concept is illustrated in Figure 2. The setpoint for the steam production rate determines the basic settings for air flow (left) and combustion grate control (right). In case of a deviation between the actual steam rate and the setpoint value, the control system directly varies the primary and secondary air rates while the response for the waste feed rate and the fuel transport on the combustion grate occurs with a time lag and stepwise. Deviations from the preset O2 setpoint mainly have
Figure 1: Conventional Combustion Control, 1993
Primary Air (P)
Secondary Air (S)
Correction of LHV by transport capacity
Feeder/ grate velocity
Control of thermal capacity
Total air control
O2- control
Control action
PID PID
PID
PID
M
M
+ –
+ –
+ –
++
+
KO2
mStSP < mStAV mStSP
> mStAV
mp
mS
O2 high
O2 low
mWaste
. . . .
.mp
.
. mS
.(mp + mS = const.) . .
.
mWaste
._>
_>
St = Steam SP = Set point AV = Actual value

329
Developments in Combustion Control for Waste Incineration Plants
an influence on the waste feeder. The combustion air rate and distribution are only varied if there are indications of an air shortage. In such a case, the secondary air rate is tempora-rily increased in order to comply with the minimum oxygen content of 6 % prescribed by statutory regulations in the 1990s.The control concept here described will only work satisfactorily if the control room opera-tor observes the local position of the fire on the combustion grate via a video camera and corrects variations from the desired position by corresponding manual interventions, i.e. by re-adjusting the calorific value to change the transport speed or by changing the underfire air distribution over the individual grate zones. Accordingly, the goal of fully automated combustion control was not yet feasible with this concept.In order to achieve fully automated control of the combustion process, further investigation activities aimed at the use of novel sensors and control technologies were intensified. These activities of Fisia Babcock and its predecessors (Steinmüller, Bab cock und Noell) will be presented below.
4. Further development of the control conceptThe combustion control concept was further developed by Steinmüller using a two-pronged approach:
• developmentofafirepositiondetectionsystem
• useofafuzzylogiccontroller
Figure 2: Control Diagram of a Conventional Combustion Control System, 1995
F life steam boiler outlet load
set point
F primary air, total feeder grate
air grate
O2-value actual
O2 set point
F secondary air

Jens Sohnemann, Walter Schäfers
330
4.1. Development of a fire position detection system
Infrared thermographyIn order to detect the position of the main fire on the combustion grate and thus obtain an additional important controlled variable, tests were performed using an infrared camera installed on the boiler roof (see Figure 3). To ensure a good image quality of the tempe-rature distribution in the fuel bed, major thermal radiations from gaseous combustion components such as CO2 and H2O were suppressed by suitable filters and/or by selective limitation of the IR wavelength window. To this end, the selection of a wavelength region of 3.7 – 4.0 µm proved to be effective.
Figure 3: Test Setup – IR Camera Installed on Boiler Roof
Figure 4 illustrates a sequence of IR images recorded at intervals of 20 s with the waste flow from top to bottom. These image sequences were then used as a basis to determine the temperatures in grate zones 2, 3 and 4 shown in the bottom part of the illustration, and the local position of the main fire. Another parameter determined in this connection was the length of the fire which was, however, not used for the development of the control system.
A factor crucial to the effectiveness of this measurement technology is the processing of the image signal. For this reason, quality criteria were established for image processing so as to eliminate temporary random interferences caused by soot and dust clouds, for instance which show up as temporary events on the IR image. By averaging over several IR images and additional determination of the moving average, the temporal progress of the local fire position was determined in a second step [2].
Use of a video camera
Tests aimed at replacing the IR camera with a video camera system were already carried out early on in the development project. Video cameras have a simple mechanical configura-tion and are relatively inexpensive, thus ensuring high availability and offering significant savings in spare parts costs.
As the visible and infrared spectral bands are located directly adjacent to one another, the fire positions can be readily identified via a video camera. Except for some modifications to account for the changed technology, the evaluation procedures originally developed for the IR camera could be retained for evaluating the video camera signal. Comparative tests with the two camera types operating in parallel confirmed a good correlation of the results.

331
Developments in Combustion Control for Waste Incineration Plants
Figure 5 illustrates the test setup selected for the evaluation of the video signal. The tests were carried out at a plant equipped with a two-track grate. Waste transport on the com-bustion grate was from top to bottom. The demarcation line between the two grate tracks is highlighted in green. The two grate tracks are evaluated one after the other. For evaluation, the main fire locations are marked by a line and the areas located within the confines of this line are used to determine the position of the main fire. The calculated position of the main fire is in each case highlighted by a red cross. The position of the main fire can then be shifted in longitudinal grate direction by redistributing the primary air either separately for each grate track or, after averaging over the longitudinal coordinates, for the entire combustion grate.
Figure 4: IR-Temperature Measurement and Evaluation
Figure 5: Evaluation of Video Image
1,000
800
600
400
200
0
IR-Temperature°C
10
8
6
4
2
0
-2
Time curves of values minutes
0 20 40 60 80 100 120 140 160 180 200
Fire position,Fire length
Temp. grate 2 Temp. grate 3 Temp. grate 4 Fire position Fire length

Jens Sohnemann, Walter Schäfers
332
In the right-hand image in Figure 5, false colours have been allocated to the colour and brightness data transmitted by the video signal. In this way, the contrast can be significantly enhanced. It was also found that main fire positions derived from the individual images correlate well with the visual impression.
4.2. Fuzzy controlControl room operators frequently command many years of experience in plant control. To be able to exploit this individual operating experience for the control of a waste inci-neration plant, a control system based on fuzzy logic was developed [3]. The advantage of this control concept is that it also allows the use of imprecise terms such as rather high temperature without this information having to be restricted to an exactly defined numerical value. In this way, operating experience can be translated into a set of rules that has to be adapted, complemented or modified to suit the operating conditions of the specific plant.
The fuzzy logic system can be combined with conventional control systems to provide a hybrid overall control system where the individual control units operate either according to fuzzy logic or conventional control algorithms. The control logic of the fuzzy controller is based on simple rules so that options for optimization are easy to figure out.
4.3. Control system with image processing and fuzzy controllerOnce their operability had been demonstrated, the individual systems were interconnected for test purposes as shown in Figure 6 [4, 5]. Initially, the IR camera was retained for fire position monitoring, the camera signal being evaluated by the image processing system. In a next step, the fire position information was transmitted to the fuzzy controller.
Amplifier
Coolingwater
AirIR-Camera
IR-Data line
Glass fibre cable
Receiver
Printer
PC for combustioncontrol logic (Fuzzy)
PC for picturegeneration
Cameracontrol unit
DCS plant
Figure 6: IR-Thermography and Fuzzy Controller
The fuzzy controller configured as a hybrid system was accommodated in a separate PC. Here, the information about the various controlled variables such as steam rate, O2 concentration,

333
Developments in Combustion Control for Waste Incineration Plants
local fire position etc. was evaluated by the newly developed control concept and the cor-responding correction signals for the manipulated variables returned to the DCS. Following a successful testing phase, the system was fine-tuned and the IR camera replaced with a video camera. The concept of using one PC each for the image processing software and the fuzzy logic controller was retained. As before, the conventional combustion control system was integrated in the main control system (DCS). Change-over to the new control system installed on the two separate PCs was possible at all times.This control concept was first implemented on a commercial scale at the MVR plant in Hamburg in February 1999 (see Figure 7). The various PCs for the 2 incineration lines were accommodated in a room next to the control room and thus directly accessible. The PCs on the right and left display the plant screens together with the controlled and manipulated variables of relevance to the fuzzy logic control. The PCs in the centre analyze the video images for the position of the main fire.
Altogether, the system has been installed in the following plants:
• MVRHamburg DE 1999• Odense DK 2001• Halmstad SE 2003• Aarhus DK 2005• Glostrup DK 2005• Jönköping SE 2006• Neapel IT 2008
5. Further developments
5.1. Measurement technologiesVarious measurement technologies have been tested and installed to improve certain control aspects or to provide an additional signal for combustion control.
Acoustic temperature measurement
Acoustic methods have been used by us since 1995 to measure the temperature distribution in a horizontal plane of the first boiler pass. This measurement method can be employed
Figue 7:
Fuzzy Controller and Image Processing System at MVR, Hamburg

Jens Sohnemann, Walter Schäfers
334
in conjunction with the ceiling temperature to optimize reducing agent injection for the SNCR process. The method operates reliably and has so far been implemented in more than 5 plants.
Radiation pyrometerInfrared radiation pyrometers lend themselves particularly well to gas temperature mea-surement in the furnace and the first radiation pass. Not only do pyrometers have a signi-ficantly faster response time than conventional temperature sensors but, when installing several instruments, they also allow the measurement of the temperature distribution in horizontal planes. Due to their significantly faster response time, pyrometers are excellently suited for combustion control.
Detection of fire position by a camera installed at the combustion grate endEvery waste incineration plant is equipped with a video camera installed at the combustion grate end in order to allow the control room operator to observe the combustion conditions. Hence, it was only a logical step to send the video camera signal to the image processing system for evaluation and use it for detecting the fire position, especially in the area of the grate end. Figure 8 illustrates a digitalized video image with a measurement grid for par-allel visual detection of the fire position. Digital evaluation delivers a 4 – 20 mA signal for incorporation into combustion control. A drawback of this concept is the location of the camera in the immediate vicinity of the slag shaft. Dust and water vapour plumes evolving as the hot slag drops into the water bath of the slag extractor frequently obstruct the vision, resulting in a sometimes poor signal quality.
Figure 8:
Fire Position Detection via Ca-meraatGrateEnd
5.2. Conventional combustion control system In parallel with the development of the advanced combustion control system using fire position detection and a fuzzy logic controller, the conventional combustion control sys-tem was further developed as it can be more flexibly adapted to the specific requirements by the users.The starting point for the further development was the control diagram shown in Figure 2. In a first step, additional controllers and timers were installed to be able to better capture the temporal behaviour of the combustion process on the grate. In addition, the following parameters and functions were investigated for potential exploitation.

335
Developments in Combustion Control for Waste Incineration Plants
• Δpabovegratezone1(&2)andfuelbed To avoid insufficient coverage of the grate due to too low a waste feed rate; a function
that can be well exploited
• Drumpressure Pressure in the steam drum as an early indicator of changes in the steam rate; does not
function reliably.
• Ratioofforwardtobackwardtraveltimeofthemovablegratebarsintheindividualgrate zones.
The range of values investigated for this ratio did not reveal any influence that could be put to effective use.
• Brake on overriding an upper steam limit value Influencing the air and grate parts of the combustion control system; an effective func-
tion when optimally adjusted.
• Incorporationofthelocalfirepositionintothecontrolconcept The determination of the fire position from the signal of the video camera installed eit-
her on the boiler roof or at the end of the combustion grate has already been described above. The signal for the fire position was integrated into the control system and helped secure a consistently good burnout.
The individual functions here presented could be activated or deactivated on the combus-tion controller as needed. Further switches installed allowed additional correction signals derived from steam rate and O2 setpoint deviations with different temporal behaviour to be integrated with air flow and combustion grate control. With all these additional functions, the controller configuration had become highly complex and intricate. For this reason, it was decided in mid-2010 to fundamentally revise and restructure the combustion control concept.
6. The current combustion control system of Fisia Babcock EnvironmentWhile combustion control objectives have hardly changed over the years, the requirements for control performance, for instance, have become more demanding. The three key objec-tives of combustion control are once again listed below: • Maintainingtheloadsetpointvalue,i.e.auniformsteamproductionrate• Maintainingtheprescribedfluegasoxygenconcentrationattheboileroutlet• Maintainingtheoptimumfirepositionorsizeofthefireonthecombustiongratein
order to ensure optimum burnout (solid and gas-side burnout) and avoid operating conditions that would unduly stress the equipment.
In addition, the combustion control system should prevent extreme situations whenever possible in order to minimize manual interventions by the control room operator.To meet these objectives, the following control structure is employed (Figure 9):• Deviationsfromthesetpointforthesteammassflowcausetheprimaryairratetobe
changed.• Deviationsfromthesetpointforthefluegasoxygenconcentrationattheboileroutlet
cause the secondary air rate to be changed.• Deviationsfromthedesiredfirepositionandfireloadonthecombustiongratecause
the waste feed rate and the grate speed to be changed.

Jens Sohnemann, Walter Schäfers
336
Figure 9: Structure of Combustion Control System
This control structure is described in greater detail below.
Control of live steam mass flow
The steam production rate is controlled via the primary air rate. This is a fast-response control loop. An increase of the primary air rate will result in an increased live steam rate within seconds and without any time lag.
Control of oxygen concentration at boiler outlet
The flue gas oxygen concentration is brought back to the setpoint by varying the secondary air rate. In order to obtain a higher O2 concentration, the secondary air feed rate has to be raised. Here as well, we are dealing with a fast-response control loop with dynamics similar to those of the steam control loop described above.
Control of fire position and fire load on the combustion grate
The fire position and the fire load on the grate are controlled by varying the fuel feed rate and grate speed. If the fire is too short or too small, the fuel feed rate to the grate has to be increased. Too long a fire or too high a fire load by contrast has an adverse effect on the burnout so that the fuel throughput has to be reduced.
As described in the first part of this paper, optical fire detection methods using a roof-mounted camera with the associated image processing software makes this control concept expensive. For this reason, the combustion control system here presented uses a surrogate value based on the following philosophy.
When the fire is too short (Figure 10), a certain amount of the primary air will not contribute to the combustion process but pass upwards into the radiation pass through that part of the grate on which there is momentarily no fire. As this unused part of the primary air makes a contribution to maintaining the flue gas oxygen concentration at the boiler outlet, the

337
Developments in Combustion Control for Waste Incineration Plants
secondary air rate is decreased proportionately. Whether the primary air not involved in the combustion process is concentrated in the rear grate zones – which is indicative of too short a fire – or whether holes opening the passage for the primary air have formed in the fuel bed - which suggests an insufficient depth of the fuel bed – is of no relevance in this connection. This sequence of events can be detected via the primary air-to-total combustion air ratio. In the example here presented, this ratio would become greater and the combustion control system would respond by increasing the fuel feed rate and the grate speed.
Figure 10: Combustion control system response in the case of a short fire
At the other extreme, i.e. if the fire is very long, the primary air will be completely consumed by the combustion process (Figure 11) so that the oxygen concentration at the boiler outlet has to be maintained solely via the secondary air. For this purpose, the secondary air rate is increased, resulting in a decrease in the primary air-to-total combustion air ratio. This, in turn, will cause the waste feed rate and the grate speed to be reduced.
Figure 11: Combustion control system response in the case of a long fire
Secondary Air
Primary Air
Waste O2
Slag
Waste Secondary Air
Slag
Primary Air
O2
Jens Sohnemann, Walter Schäfers
338
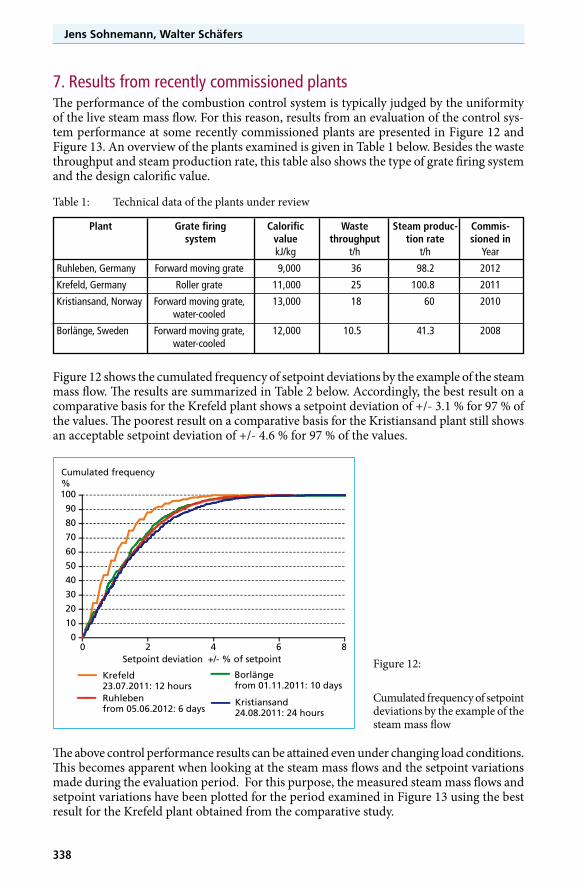
7. Results from recently commissioned plants The performance of the combustion control system is typically judged by the uniformity of the live steam mass flow. For this reason, results from an evaluation of the control sys-tem performance at some recently commissioned plants are presented in Figure 12 and Figure 13. An overview of the plants examined is given in Table 1 below. Besides the waste throughput and steam production rate, this table also shows the type of grate firing system and the design calorific value.
Table 1: Technical data of the plants under review
Plant Grate firing Calorific Waste Steam produc- Commis- system value throughput tion rate sioned in kJ/kg t/h t/h Year
Ruhleben, Germany Forward moving grate 9,000 36 98.2 2012
Krefeld, Germany Roller grate 11,000 25 100.8 2011
Kristiansand, Norway Forward moving grate, 13,000 18 60 2010 water-cooled
Borlänge, Sweden Forward moving grate, 12,000 10.5 41.3 2008 water-cooled
Figure 12 shows the cumulated frequency of setpoint deviations by the example of the steam mass flow. The results are summarized in Table 2 below. Accordingly, the best result on a comparativebasisfortheKrefeldplantshowsasetpointdeviationof+/-3.1 %for97%ofthevalues.ThepoorestresultonacomparativebasisfortheKristiansandplantstillshowsanacceptablesetpointdeviationof+/-4.6 %for97%ofthevalues.
Cumulated frequency%100
90
80
70
60
50
40
30
20
10
00 2 4 6 8
Setpoint deviation +/- % of setpoint
Krefeld23.07.2011: 12 hours
Borlängefrom 01.11.2011: 10 days
Ruhlebenfrom 05.06.2012: 6 days
Kristiansand24.08.2011: 24 hours
Figure 12:
Cumulated frequency of setpoint deviations by the example of the steam mass flow
The above control performance results can be attained even under changing load conditions. This becomes apparent when looking at the steam mass flows and the setpoint variations made during the evaluation period. For this purpose, the measured steam mass flows and setpoint variations have been plotted for the period examined in Figure 13 using the best resultfortheKrefeldplantobtainedfromthecomparativestudy.

339
Developments in Combustion Control for Waste Incineration Plants
8. Outlook
8.1. Avoiding mechanical overload conditionsGiven the requirement formaximumprocess automation andminimummanpowerrequirements, it would seem useful to provide the combustion control system with a function that ensures that the operating point is always within the permissible region. A typical operating case is illustrated in Figure 14. Starting from any operating point on the
Table 2: Evaluation of the steam mass flow setpoint deviation
Plant Unit Evaluation period Setpoint deviation of steam mass flow for 97 % and 100 % of the values
97 % of values 100 % of values
Ruhleben, Germany % 6 days +/- 4.0 +/- 6.1
Krefeld, Germany % 12 hours +/- 3.1 +/- 5.1
Kristiansand, Norway % 24 hours +/- 4.6 +/- 7.4
Borlänge, Sweden % 10 days +/- 4.1 +/- 7.3
Figure 13:
Profile of the live steam rate and thesetpointvariations(Krefeld)
Figure 14:
Automatic setpoint re-adjust-ment in the combustion diagram
Life steam ratet/h100
95
90
85
80
75
70
65
60
55
50
actual value Setpoint
3:30 5:54 8:18 10:42 13:06 15:30
Time (23. July 2011)
Fuel heat inputMW
Fuel throughput t/h
Mechanicaloverload
Part LoadP1 P2
P3P4
P5
P6
P7P8
P9P10
P11

Jens Sohnemann, Walter Schäfers
340
boundary line between P1 und P2 (100 % thermal load), the heating value is progressively deteriorating. Unless the setpoint value for the steam mass flow is readjusted, the operating point will move to the mechanical overload region marked by the red arrow in Figure 14.
For an effective modification of the combustion control system, a function that detects the boundaries of the combustion diagram must therefore be provided. In the example here selected, this function calculated the amount by which the operating point leaves the operating zone towards the right into the mechanical overload region. The setpoint for the steam production rate is then reduced accordingly. Assuming that the heating value remains constant during this operating phase, this intervention will eventually result in an operating point in the part load range on the line between P2 and P9 as shown by the green arrow.
8.2. Strategies for reliable calculation and evaluation of the calorific value Having reliable and current information on the calorific value would benefit any combus-tion control system. Typically, the calorific value is calculated by determining the fuel heat input via a heat balance around the boiler envelope and dividing it by the fuel mass flow. A disadvantage of this method is that the fuel mass flow is formed by the signal of the grab loads charged and does not temporally coincide with the current fuel heat input as it neglects the retention time in the waste feed shaft.For this reason, there are various approaches to alternative concepts. One such approach is to form a volumetric flow rate from the travel speed of the fuel feed ram and its face area. Multiplying this flow rate by the fuel density in the feed shaft, one obtains a fuel mass flow that can be used for determining the calorific value. Drawbacks of this approach are the uncertainty associated with the assumed waste density in the feed shaft as well as the still considerable time lag between the feeding of the waste and its participation in the combustion process.Another approach proposed in various publications is an inverse combustion calculation. The basic idea is to conclude from the flue gas composition to the mole fractions of the main fuel components C, H and O on a dry, ash-free basis [6]. Assuming a carbon-to-hydrogen ratio of usually approx. 2:3, the calorific value can then be determined. This method offers the advantage that the calorific value so determined exactly characterizes the material momentarily participating in the combustion process. The method has been refined by experimental studies of combustible waste fractions to provide a broader data basis for the carbon-to-hydrogen ratio. Moreover, the influence of the sulphur, nitrogen and chlorine mole fractions in the fuel is being examined [7, 8]. As practical experience with this method is hardly available so far, it is difficult to tell to what extent the performance of combustion control can be improved by processing a calorific value determined by an inverse combustion calculation. Further studies should therefore be aimed at tests using the calorific value determined by inverse combustion calculation in order to • respondtodifferencesintheignitionbehaviourbyvaryingthegratespeedandprimary
air supply • varyingtheprimaryairtemperature• varyingtheprimaryair-to-totalcombustionairratio.
9. SummaryThis paper covers two decades in the development history of combustion control concepts and its results. Many a concept that proved to be promising at first sight failed to produce the desired outcome. In order to strike a balance between measuring technology and signal

341
Developments in Combustion Control for Waste Incineration Plants
reliability and control system complexity while at the same time ensuring customer accep-tance and the desired uniform steam production rate, compromises inevitably have to be made. Experience has shown that a sound and simple control concept can yield excellent results and gain customer acceptance.
Further improvement potential can be tapped when pursuing the request for a higher level of automation through automated load readjustment, for instance. Furthermore, the online calculation of the calorific value requires further optimization. An alternative approach proposed to this effect is the inverse combustion calculation method that has been known since 2000. However, results allowing a conclusion to the validity of this approach in ope-rating practice are hardly available so far.
10. Literature[1] Schumacher, W.; Schäfers, W.: Regelung der Feuerleistung bei Müllverbrennungsanla gen. Ent-
sorgungs-Praxis 06/91
[2] Walter,M.; Kremer, H.; Schäfers,W.; Limper, K.: Bestimmung und Auswertung der Tem-peraturverteilung von Verbrennungsgut auf dem Verbrennungsrost von Müllverbren-nungsanlagen.VGBKraftwerkstechnik76(1996),Heft1
[3] vonAltrock,C.;Krause,B.;Limper,K.;Schäfers,W.:RegelungeinerMüllverbrennungsanlagemit Fuzzy-Logic. 3. Aachener Fuzzy-Symposium, Frankfurt, 10./11.05.1993
[4] Schäfers,W.;Limper,K.:FortschrittlicheFeuerleistungsregelungdurchEinbeziehungderFuzzy-LogikundderIR-Thermografie.In:Thomé-Kozmiensky,K.J.(Hrsg):Reaktorenzurthermi-schen Abfallbehandlung. Berlin: EF-Verlag, 1993
[5] Schäfers, W.; Limper, K.: Fortschritte bei der Feuerleistungsregelung für Hausmüllver-brennungsanlagen. WAR: 38. Darmstädter Seminar – Abfalltechnik –, Modellbildung und intel-ligenteSteuerungssystemeinderUmwelttechnik, TH Darmstadt, 24.02.1994
[6] Dohmann,J.;Starke,C.:ErmittlungderFeuerleistungvonMüllverbrennungsanlagen.MüllundAbfall 9, 00
[7] Seeger, H; Urban, A.: Online-Heizwertbestimmung in einer Müllverbrennungsanlage. 10. Fach-tagung Thermische Abfallbehandlung, Dresden 2005
[8] Zwahr,H.:KontinuierlichesMonitoringderEnergieflüsse ineinerMüllverbrennungsanlage,VDI München, 2002