Embed Size (px)
Citation preview
Deviations from Covered Interest Parity During the Credit Crisis
Spencer Jones1
The Leonard N. Stern School of Business Glucksman Institute for Research in Securities Markets
Faculty Advisor: Richard Levich April 1, 2009
1 The assistance, advice and education provided by Short Term Interest Rates, Global Foreign Exchange, Bank of America is gratefully acknowledged. The time contributed by Miro Vucetic, James Babbister and Janis Drics is very much appreciated.
I. INTRODUCTION
Covered Interest Parity is ubiquitous as an equilibrium condition in the foreign exchange
market and one of the fundamental examples of market efficiency in international capital
markets. Historical testing of the relationship frequently supports the notion, with consideration
given to transactions costs, that arbitrage opportunities across G10 currencies are rarely
encountered and exist only for very brief periods. The credit crisis beginning in 2007 has
caused significant disruption to money markets, and has resulted in significant volatility within
foreign exchange markets. Recent research papers have suggested that turbulence within the
money markets is prone to spill over into the foreign exchange markets, resulting in anomalies
within the foreign exchange swap market. This paper revisits the classic analysis of Covered
Interest Parity across four G10 currency pairs for various forward maturities, to document and
better understand how deviations from parity have evolved and reacted to events throughout the
ongoing currency crisis.
II. COVERED INTEREST PARITY THEORY AND ARBITRAGE
Covered Interest Parity (CIP) is the theory that positive returns cannot be earned by
borrowing the home or base currency to invest the commensurate amount in a foreign currency
on a covered basis. Most commonly this parity condition is expressed as;
(1+ rb ) = (1+ rt )FS
(1)
where rb is the interest rate in the base currency and rt a foreign currency interest rate, S is the
spot nominal exchange rate, and F is the forward exchange rate for a maturity (t) equal to that of
` 2

the borrowing / investment.2 In general, S could represent a forward rate for a future date (t0)
with the two interest rates spanning the period t0 through t.
To measure CIP deviations more precisely, we must also take into account transaction
costs, in their most obvious form being captured by the bid-ask spread on quotes.
(1+ rb
A ) ≈ (1+ ) r b ) = (1+ rtB ) F B
SA (2)
Here the superscript A denotes the ask price on the rate, and superscript B the bid price.
) r b is the synthetic USD borrowing rate, constructed from the three elements on the right equation
for Covered Interest Parity to hold perfectly. In normal markets, and rbA
) r b will be
approximately equal, within a narrow range given by transaction costs.
For clarity of the calculations undertaken, day count conventions on interest rates3 need
to be observed.
(1+ (rb
A ×daysb
daycountb
) ≈ (1+ () r b ×daysb
daycountb
) = (1+ (rtB ×
dayst
daycountt
) ×F B
SA (3)
To accurately measure any deviations from covered interest parity and any “basis” created from
arbitrage opportunities, quoted forward, spot and non-US currency interest rate were used to
create an implied USD interest rate that would result in no deviation.
Where:
) r b = ((1+ (rtB ×
dayst
daycountt
) ×F B
SA ) −1) × (daycountb
daysb
) (4)
basis = rbA − ) r b (5)
2 It should be noted at this point that in analyzing USD relationships, market convention dictates that USD is not always the base currency in the pairs used. GBP and EUR are the base currency in their relationship with USD, with the quote being in dollars per single British Pound or Euro. For JPY and CAD, USD is the base currency. The formulas shown are for illustration, and adapted in the study. 3 US and Canadian convention is Actual/360; UK and Japanese convention is Actual/365; Euro convention is 30/360
` 3
In simple terms, any difference between the observed US interest rate and the rate
implied through the forward calculation would result in extra-ordinary returns, or an arbitrage
opportunity. If the basis is negative, the arbitrage should be made by borrowing in the base
currency and investing in the foreign currency. If positive, borrowing in the foreign currency
and investing in the base currency yields the return.
The methodology employed in this paper tests for ) r b in two methods; based on non-USD
LIBOR rates (in maturities of 3, 6 and 12 months) and a second implied by IMM interest rate
futures contracts.
III. DATA DESCRIPTION
Data for the analysis were provided by Bloomberg. Though previous studies have
highlighted the significance of contemporaneous data (Taylor, 1989), it is often difficult to locate
data on interest rates, spot foreign exchange rates and forward points at many time horizons that
are time synchronous. We used Bloomberg Composite Data for all key variables, making
allowances for possible time discrepancies among the various series.4
Forward exchange rates for maturities 3, 6, and 12 months were quoted in points, as per
market convention. These are quoted in “pips” to be added / subtracted from the spot rate.
These are adjusted to 1/10000 for all currencies except for JPY, where the adjustment is 1/100.
Bloomberg began recording forward points in the interbank market to coincide with
Chicago Mercantile Exchange International Money Market (IMM) dates in November 2003,
creating a complete data set for all variables required from January 2004 onward. The decision
to explore arbitrage opportunities using IMM interest rate futures, in addition to traditional
4 Allowances for the timing discrepancy between the New York composite (4.30pm EST) and the 11.00 GMT LIBOR setting are made in the measurement of CIP holding prior to the crisis. The consistency of the data through the time period is considered more valuable and illustrative, as per Baba, Packer, and Nagano (2008).
` 4

money market interest rates, was encouraged by evidence of significant stress in the U.S.
domestic money markets (Taylor & Williams, 2009) during the crisis period. It has been
generally noted that throughout the crisis period with upward pressure and increased spreads in
the cash market that Eurodollar futures have experienced less volatility and been a more reliable
indication of market interest rates. Liquidity has remained strong in Eurodollar futures through
the shorter dated contracts required in this analysis, whereas the validity of 12-month LIBOR
quotes in the later time period is subject to question.
IV. PRELIMINARY DATA ANALYSIS
Before analyzing the CIP results, it will be valuable to inspect the general behavior of
spot and foreign rates over the sample period. Earlier studies have observed that departures from
CIP increase during turbulent periods in the foreign exchange market (Frenkel & Levich, 1977;
Taylor 1989). In those studies, the authors focused their attention on periods where the foreign
exchange régime was under transformation. While the primary stress facing CIP in the present
case was derived from the money markets, a review of the volatility of the 90-day forward
relative to the spot rate may be instructive.
` 5
Ratio 90-day Forward to Spot for USD Foreign Exchange Rates
99
99.5
100
100.5
101
EUR
GBP
CAD
JPY
98.51/1/04 1/1/05 1/1/06 1/1/07 1/1/08 1/1/09
Chart 1 (above) shows that the 90-day forward premium was significantly less volatile in
the years prior to the first signs of the credit crisis in the summer 2007. Given that all of the
currencies in the study have operated under a floating exchange rate regime since 1973, the
relative absence of intervention and well functioning markets explains the gentle trends observed
prior to the crisis. However, it is clear that the time series contains a major event beginning in
September 2008, subsequent to which the forward premiums become highly volatile. This
coincides with the collapse of Lehman Brothers and AIG. The data clearly exhibit periods that
can be considered Tranquil (2004-August 2008) and Turbulent (September 2008 – date).
IV. COUNTERPARTY RISK AND DEVIATIONS FROM CIP
Recent studies on CIP have analyzed fairly short data samples on periods ending in 2007
(Baba, Packer, Nagano, 2008) or tested the CIP relationship using only LIBOR interest rates
(Genberg, Hui, Wong, Chung, 2009). Both studies conclude that the deviations from CIP are
primarily the result of counterparty risk in money market transactions, creating a perceived
opportunity for extended periods of CIP arbitrage opportunities.
To examine these findings more closely, we test Covered Interest Parity using two
different interest rate pairs:. Using spot rates, CIP was tested using market LIBOR rates and also
using forward starting transactions using interest rate futures on Eurodollars and equivalent.
Given that interest rate futures are settled through a highly capitalized clearing house, it follows
that there should be a reduced level of counterparty risk in this approach at the expense of
increased transaction costs. A test using an interpolated rate derived from short term cash and
` 6

LIBOR rates and longer futures was also performed, with results consistent with the above tests
and very similar to the LIBOR results. More detail on this method can be found in Appendix A.
Five major currency pairs were tested using these approaches. Those currencies include
the three most actively traded currency pairs (EURUSD, GBPUSD, and USDJPY), the North
American G10 pair USDCAD, and also the cross between EURGBP. Testing CIP on a highly
liquid, non-dollar based G10 pairing allows us to observe if deviations are more likely currency
or counterparty derived. First, we will review the 2004-2009 relationship for the most liquid
currency pair, EURUSD, shown in Chart 2 (below).
Relationships in all currency pairs displayed strong evidence in support of CIP over the
period from 2004 until around August 2007, as can be seen in Chart 2. Deviations are
consistently within the ±6bp range that can be attributed to brokerage fees (Clinton, 1988).
EURUSD Swap - % Deviation of Implied LIBOR from actual
1
1.1
1.2
1.3
1.4
1.5
1.6
1.7
1/1/04 1/3/05 1/4/06 1/5/07 1/8/08 1/8/09
Spot
FX
-3.00%
-2.50%
-2.00%
-1.50%
-1.00%
-0.50%
0.00%
0.50%
EURUSD Spot 3M 6M 12M(a) (b)
` 7
Where deviations are larger, it is possible that this is a result from the fact that the data are not
fully time synchronized.
Both larger and more volatile deviations from CIP, begin at about the same point as the
credit markets disruptions first began to occur. The collapse of British bank Northern Rock in
September, followed by the crash in world equity markets from their peaks later in the year
relates closely with divergences from CIP in all currencies examined (Charts for other currency
pairs analyzed are found in Appendix B). The next spike, (a), is observed is 17 March 2008, the
first day of trading after the announcement that Bear, Stearns & Co was to be acquired by JP
Morgan, and the largest spike in the deviation is in late September 2008, (b), during the collapse
of Lehman Brothers and AIG. The deviation at its peak shows that the foreign exchange forward
implied USD Libor rates, ) r b , are 126-226bp higher than those observed in the market.
To understand the scale of the distortion observed, let us consider the position of an
arbitrageur on 30 September. Assuming that USD funds were available, the arbitrager would
attempt to borrow $1m dollars at 12-month USD LIBOR and enter into a foreign exchange swap
to EUR to invest the funds for an identical term in Euro Libor. On completion of the swap and
repayment of the loan, the arbitrageur will be left with approximately $12,600 (126bp) profit.
Conversely, the calculation performed to create the synthetic USD rate shows that the market for
obtaining USD funds from EUR implies a cost of funds in USD 126bp higher than the cost
quoted in the market.
As the more interesting elements of the deviations from Covered Interest Parity are
observable from March 2008 onward, the relationships for the three major liquid currency pairs
(EURUSD, GBPUSD, USDJPY) will be analyzed with Charts 3-5 shown below.
` 8
GBPUSD - Implied US Libor vs Actual
1.20
1.40
1.60
1.80
2.00
2.20
1/1/08 5/6/08 9/9/08 1/13/09-3.000%
-2.500%
-2.000%
-1.500%
-1.000%
-0.500%
0.000%
0.500%
1.000%
GBPUSD 3M 6M 12M
EURUSD - Implied US Libor vs
1.00
1.10
1.20
1.30
1.40
1.50
1.60
1.70
1/1/08 5/6/08 9/9/08 1/13/09-3.00%
-2.50%
-2.00%
-1.50%
-1.00%
-0.50%
0.00%
0.50%
1.00%
EURUSD 3M 6M 12M
USDJPY - Implied US Libor vs Act
80.00
85.00
90.00
95.00
100.00
105.00
110.00
115.00
120.00
125.00
130.00
1/1/08 5/6/08 9/9/08 1/13/09-3.00%
-2.50%
-2.00%
-1.50%
-1.00%
-0.50%
0.00%
0.50%
1.00%
USDJPY 3M 6M 12M
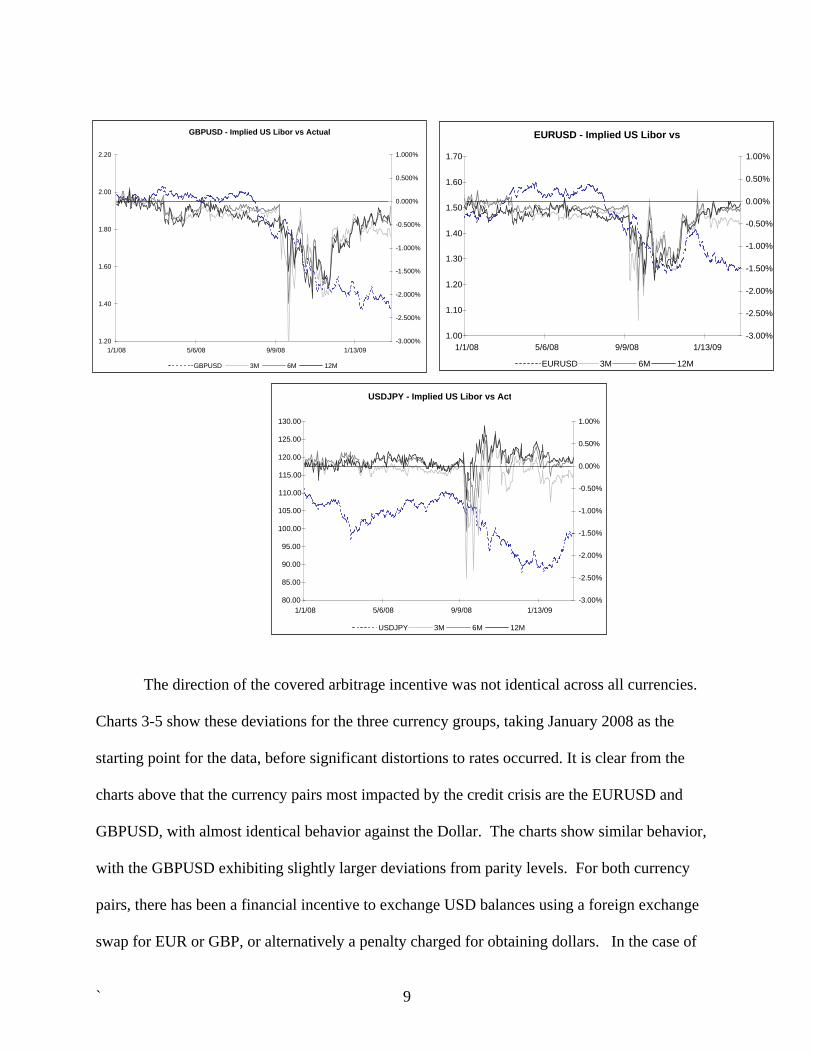
The direction of the covered arbitrage incentive was not identical across all currencies.
Charts 3-5 show these deviations for the three currency groups, taking January 2008 as the
starting point for the data, before significant distortions to rates occurred. It is clear from the
charts above that the currency pairs most impacted by the credit crisis are the EURUSD and
GBPUSD, with almost identical behavior against the Dollar. The charts show similar behavior,
with the GBPUSD exhibiting slightly larger deviations from parity levels. For both currency
pairs, there has been a financial incentive to exchange USD balances using a foreign exchange
swap for EUR or GBP, or alternatively a penalty charged for obtaining dollars. In the case of
` 9
JPY, after an initial swing in the same direction as the other currencies, a reverse transaction has
become the profitable covered arbitrage, moving money from JPY to USD under an FX swap.
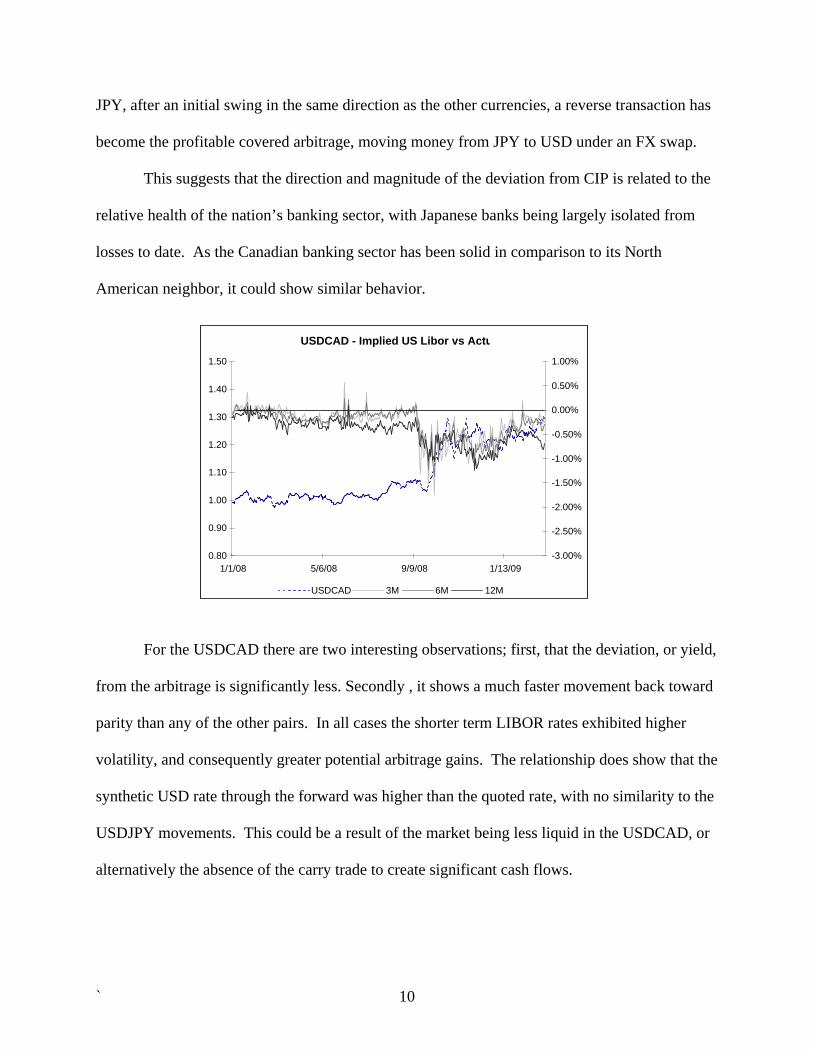
This suggests that the direction and magnitude of the deviation from CIP is related to the
relative health of the nation’s banking sector, with Japanese banks being largely isolated from
losses to date. As the Canadian banking sector has been solid in comparison to its North
American neighbor, it could show similar behavior.
USDCAD - Implied US Libor vs Actu
0.80
0.90
1.00
1.10
1.20
1.30
1.40
1.50
1/1/08 5/6/08 9/9/08 1/13/09-3.00%
-2.50%
-2.00%
-1.50%
-1.00%
-0.50%
0.00%
0.50%
1.00%
USDCAD 3M 6M 12M
For the USDCAD there are two interesting observations; first, that the deviation, or yield,
from the arbitrage is significantly less. Secondly , it shows a much faster movement back toward
parity than any of the other pairs. In all cases the shorter term LIBOR rates exhibited higher
volatility, and consequently greater potential arbitrage gains. The relationship does show that the
synthetic USD rate through the forward was higher than the quoted rate, with no similarity to the
USDJPY movements. This could be a result of the market being less liquid in the USDCAD, or
alternatively the absence of the carry trade to create significant cash flows.
` 10
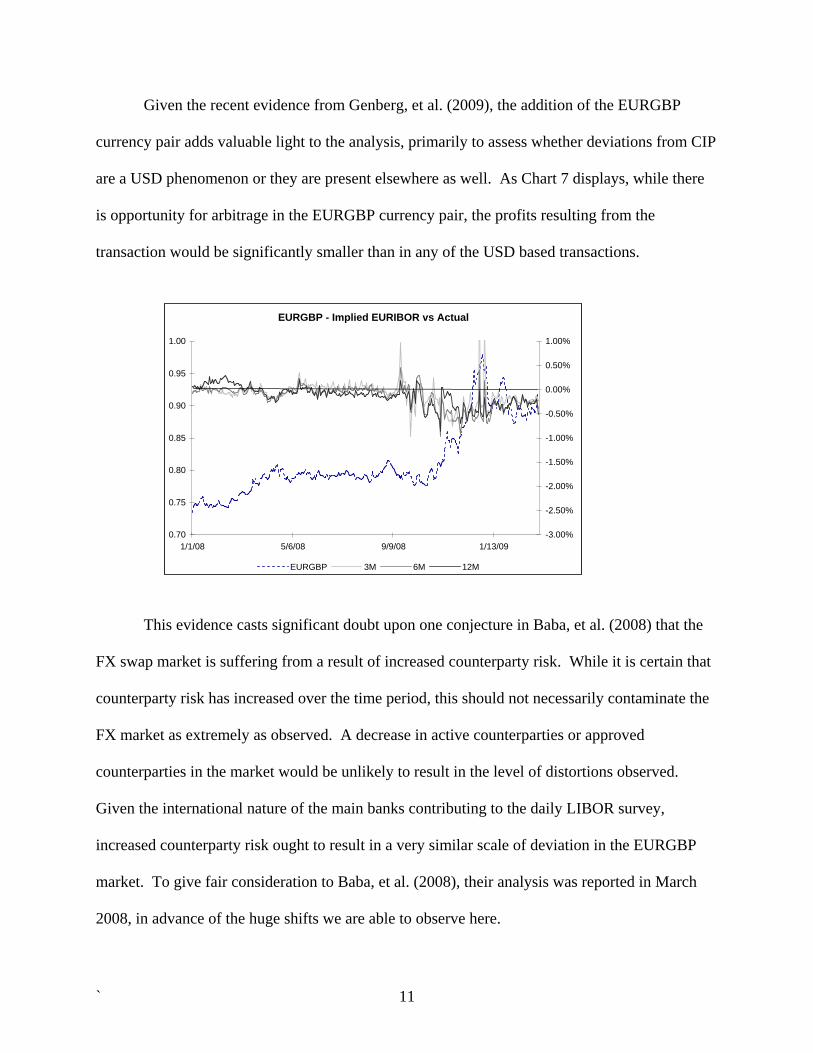
Given the recent evidence from Genberg, et al. (2009), the addition of the EURGBP
currency pair adds valuable light to the analysis, primarily to assess whether deviations from CIP
are a USD phenomenon or they are present elsewhere as well. As Chart 7 displays, while there
is opportunity for arbitrage in the EURGBP currency pair, the profits resulting from the
transaction would be significantly smaller than in any of the USD based transactions.
EURGBP - Implied EURIBOR vs Actual
0.70
0.75
0.80
0.85
0.90
0.95
1.00
1/1/08 5/6/08 9/9/08 1/13/09-3.00%
-2.50%
-2.00%
-1.50%
-1.00%
-0.50%
0.00%
0.50%
1.00%
EURGBP 3M 6M 12M
This evidence casts significant doubt upon one conjecture in Baba, et al. (2008) that the
FX swap market is suffering from a result of increased counterparty risk. While it is certain that
counterparty risk has increased over the time period, this should not necessarily contaminate the
FX market as extremely as observed. A decrease in active counterparties or approved
counterparties in the market would be unlikely to result in the level of distortions observed.
Given the international nature of the main banks contributing to the daily LIBOR survey,
increased counterparty risk ought to result in a very similar scale of deviation in the EURGBP
market. To give fair consideration to Baba, et al. (2008), their analysis was reported in March
2008, in advance of the huge shifts we are able to observe here.
` 11

Baba, et al.’s (2008) alternative interpretation, that the CIP deviations are a result of high
volumes of international currencies moving in to USD to meet liabilities, is much more plausible.
The recent note from Genberg, et al. (2009) reaches a similar conclusion. As banks struggled to
fund their USD commitments, they engaged in moving non-USD reserves through the spot
exchange market to USD with a subsequent depreciation in foreign currency against the dollar.
With the majority of financial institutions facing the same difficulty, it is easy to envision that
many market participants were attempting to make the same transaction, depressing foreign
currency prices further and creating the arbitrage opportunity.
V. THE MINIMUM RISK COVERED ARBITRAGE
While the level of CIP deviations illustrated above seem large enough to induce arbitrage,
questions could still be raised as to whether the data are contemporaneous enough for a clean
arbitrage transaction to take place5. Volatility in intra-day interest rates and futures rates has
been high, such that the time gap (10.5 hours) between the 11am LIBOR fixing and the 4:30 pm
New York exchange rate data used in our calculations could permit a swing in interest rates of
10bp or more.
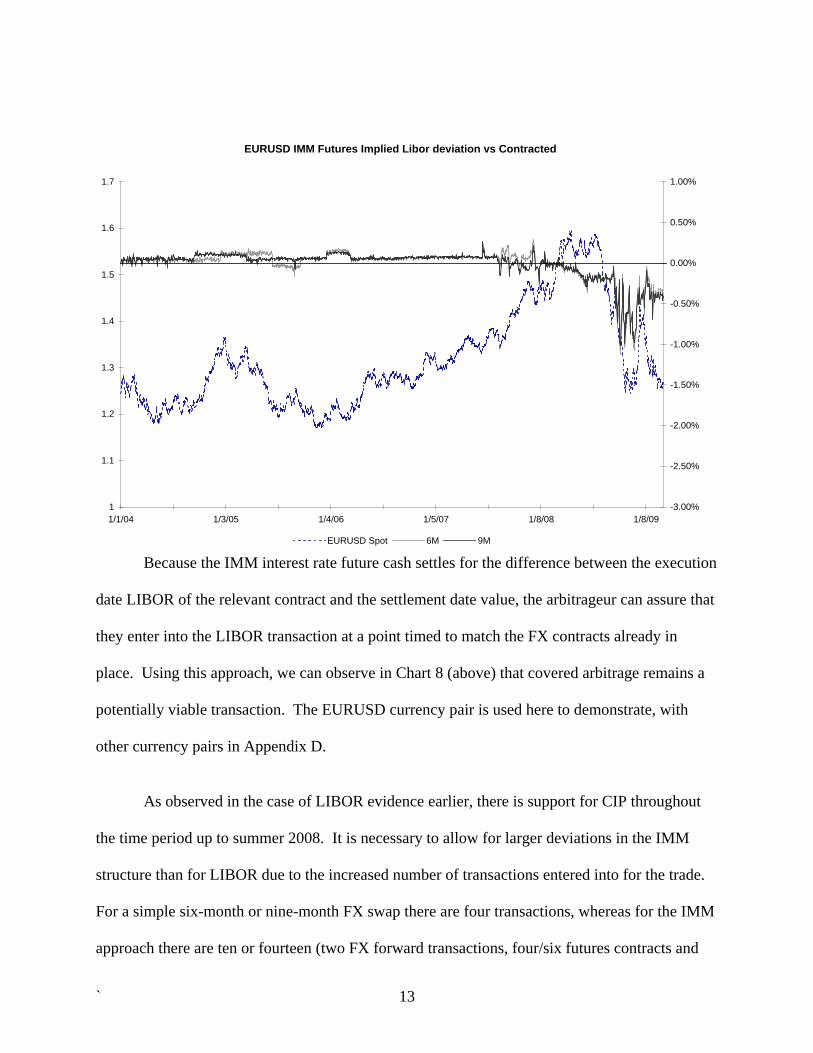
By observing arbitrage opportunities using interest rate futures, we are able to eliminate
any risk that the timing of trades would be responsible for the disparities. Bloomberg provides
historic screen quotes for forward points to IMM dates, taken from a composite of market
participants at a similar time to the IMM futures data they provide. Using this data, it is possible
to create a synthetic test for parity, using a forward starting FX swap. The revised formula (3),
(4) and (5) used for this test is shown in Appendix C.
5 Akram, Rime, Sarno (2008) observes tick level data on three major currencies at tick-level frequency, and does observe arbitrage opportunities that exist long enough for exploitation, though the data set is from 2004
` 12
EURUSD IMM Futures Implied Libor deviation vs Contracted
1
1.1
1.2
1.3
1.4
1.5
1.6
1.7
1/1/04 1/3/05 1/4/06 1/5/07 1/8/08 1/8/09-3.00%
-2.50%
-2.00%
-1.50%
-1.00%
-0.50%
0.00%
0.50%
1.00%
EURUSD Spot 6M 9M
Because the IMM interest rate future cash settles for the difference between the execution
date LIBOR of the relevant contract and the settlement date value, the arbitrageur can assure that
they enter into the LIBOR transaction at a point timed to match the FX contracts already in
place. Using this approach, we can observe in Chart 8 (above) that covered arbitrage remains a
potentially viable transaction. The EURUSD currency pair is used here to demonstrate, with
other currency pairs in Appendix D.
As observed in the case of LIBOR evidence earlier, there is support for CIP throughout
the time period up to summer 2008. It is necessary to allow for larger deviations in the IMM
structure than for LIBOR due to the increased number of transactions entered into for the trade.
For a simple six-month or nine-month FX swap there are four transactions, whereas for the IMM
approach there are ten or fourteen (two FX forward transactions, four/six futures contracts and
` 13
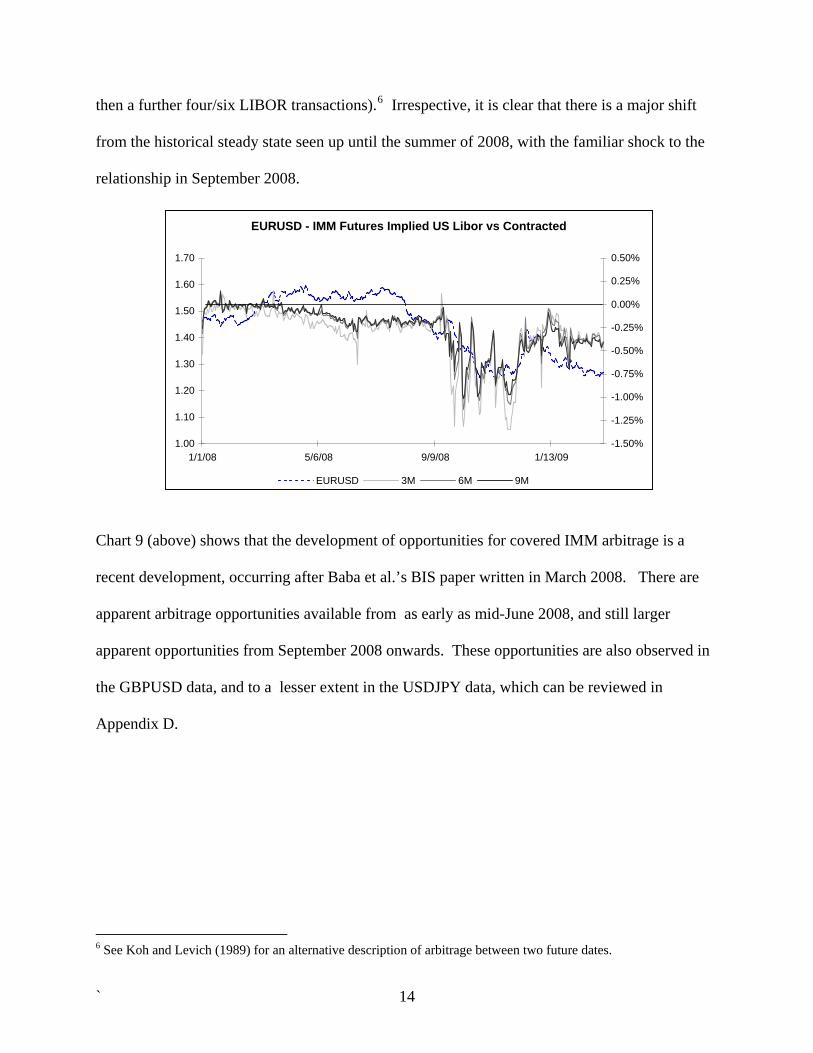
then a further four/six LIBOR transactions).6 Irrespective, it is clear that there is a major shift
from the historical steady state seen up until the summer of 2008, with the familiar shock to the
relationship in September 2008.
EURUSD - IMM Futures Implied US Libor vs Contracted
1.00
1.10
1.20
1.30
1.40
1.50
1.60
1.70
1/1/08 5/6/08 9/9/08 1/13/09-1.50%
-1.25%
-1.00%
-0.75%
-0.50%
-0.25%
0.00%
0.25%
0.50%
EURUSD 3M 6M 9M
Chart 9 (above) shows that the development of opportunities for covered IMM arbitrage is a
recent development, occurring after Baba et al.’s BIS paper written in March 2008. There are
apparent arbitrage opportunities available from as early as mid-June 2008, and still larger
apparent opportunities from September 2008 onwards. These opportunities are also observed in
the GBPUSD data, and to a lesser extent in the USDJPY data, which can be reviewed in
Appendix D.
6 See Koh and Levich (1989) for an alternative description of arbitrage between two future dates.
` 14
Question marks may surround the possibility of executing the transaction created in the
data. First, obtaining forward quotes based on IMM dates may not find a liquid market in FX
swaps, though as futures themselves serve as a hedging tool sufficient liquidity may exist.
Counter to this point, however, is the observation that these arbitrage opportunities remain on
dates very close to the IMM date, with high proximity to a generic 3-month trade. There is the
further issue of the mark-to-market convention on IMM futures contracts, which brings volatility
to the cash requirement to enter and maintain the trade and, as a result, impacts the expected
arbitrage return. Outside of these concerns, the existence of a similar potential arbitrage
opportunity is not experienced at any point in historical data currently available from Bloomberg.
A final problem with the actual efficiency of the futures based arbitrage relates to the
fixed denominations required in futures contracts ($1,000,000 per Eurodollar future). This
feature implies that the assumed ability to hedge all investments with futures, including
compounding, is not practical in active trading. Even with these limitations, it is likely that some
of the 50bp arbitrage could be captured through the trade.
VI. THE FUTURE OF RECONVERGENCE TO COVERED INTEREST PARITY
With evidence that deviations from Covered Interest Parity were commonplace across
USD related currency pairs, the question arises as to how the relationship will re-establish itself.
Given the current focus on bank de-leveraging and with counterparty risk remaining a significant
concern, it seems likely that arbitrage will rely on methods that employ minimum cash outlays
and minimal risk exposure.
Observed behavior at present is mixed and, from the findings in this paper, slightly
counterintuitive. Given that as of March 2009 liquidity in long-dated unsecured markets is still
` 15

considered tight, it would be expected that arbitrage opportunities would appear more prevalent
with a longer-dated LIBOR transaction. However, the data suggest that following the divergence
from parity, CIP has shown more progress in reestablishing itself with LIBOR rates than with
futures based rates.
USD Interest Rate - FX Forward Implied Rate
-2.00%
-1.50%
-1.00%
-0.50%
0.00%
0.50%
1/1/08 4/1/08 7/1/08 10/1/08 1/1/09
9M_IMM 12M Bootstrap 12M Libor
The deviations from CIP we observe in the foreign exchange market clearly reflect a
spill-over of discrepancies between exchange traded interest rate futures and bank-specific
LIBOR rates. The difference between the two rates appears to have stabilized over recent
months, and could represent a form of term counterparty risk (with IMM Futures only exposing
the investor to risk in 3 month periods at a time). Once more, the difference between covered
arbitrage with IMM futures and LIBOR is such that the potential return is higher from a lower
risk transaction. Given that to exploit the arbitrage opportunity we borrow in USD, the inflated
` 16

cost of money in the US, partly related to counterparty risk being priced in to the rate, has
reduced the return from the covered arbitrage.
VI. CONCLUSION
Academic studies examining Covered Interest Parity have generally shown that, during
tranquil currency regimes and given data of a contemporaneous nature, Covered Interest Parity
tends to hold within a narrow bound consistent with transaction costs. However, during periods
containing significant turbulence, there is evidence of larger deviations where arbitrage appears
possible for a short period of time.
This examination of data shows that since September 2008 breaches of Covered Interest
Parity have been commonplace. Extended periods of arbitrage opportunities have been
observed, with multiple methods of execution available to exploit the returns. The source of the
deviations are closely tied to events in the U.S. banking and money markets, with the widening
of arbitrage gains closely related to major financial events that raised bank counterparty risks and
drained liquidity from the short-term money market.
In further analysis, it would be valuable examine the viability of executing the arbitrage
transactions outlined in this paper. Observed prices in the financial markets since September
2008 have been variable in both scale and in the ability for trades to be executed at rates
observed on screen. Though it is clear that we measured covered arbitrage opportunities in the
FX markets, the actual returns to be made from these trades remain uncertain.
` 17

BIBLIOGRAPHY
Akram, Q. F.; Rime, D. and Sarno, L. 2008. “Arbitrage in the foreign Exchange Market:
Turning on the Microscope.” Journal of International Economics, 76, pp237-253. Baba, N.; Packer, F. and Nagano, T. 2008. “The spillover of money market turbulence to FX
swap and cross currency markets.” BIS Quarterly Review, March 2008 pp73-86. Clinton, K. 1988. “Covered Interest Arbitrage and Market Turbulence.” The Journal of Political
Economy 96:2, pp. 358-370. Frenkel, J. A. and Levich, R. M. 1977. “Transaction Costs and Interest Arbitrage: Tranquil
versus Turbulent Periods.” The Journal of Political Economy 85:6, pp. 1209-1226. Genberg, H.; Hui, C.; Wong, H. and Chung, T. 2009. “The Link between FX Swaps and
Currency Strength during the Credit Crisis of 2007-2008.” Hong Kong Monetary Authority Research Note.
Koh, A. and Levich, R. M. 1989. “Synthetic Eurocurrency Interest Rate Futures Contracts:
Theory and Evidence.” NBER Working Paper Series No.3055 Taylor, J. B. and Williams J. C. 2008. “A Black Swan in the Money Market.” Federal Reserve
Bank of San Francisco Working Paper 2008-04. Taylor, M. P. 1989. “Covered Interest Arbitrage and Market Turbulence.” The Economic
Journal 99:396, pp. 376-391.
` 18
APPENDIX A – THE BOOTSTRAPPED YIELD CURVE
The bootstrapped yield curve approach was originally included in the analysis to try to
remove any significant counterparty risk being added for long-dated LIBOR contracts. The
bootstrapped yield curve was constructed out to a minimum of one full year, as required to
duplicate the LIBOR rates used in case 1.
The curve was constructed using the minimum possible number of cash rates (the number
required to bridge to the first IMM futures contract), using the first four IMM contracts to derive
all other prices. The rates used were:
• Overnight (to interpolate when the first contract was within one week)
• 1, 2, 3 weeks
• 1 and 3 month LIBOR
• The first four IMM interest rate futures contracts
To calculate the 3, 6 or 12 month rate on any date there were typically two interpolations
required, each of which was calculated using a linear spline. The interpolations were for the
following two points:
• To calculate the “cash” rate required up to where the investor would be able to
transfer into the interest rate obtained from the first interest rate. This rate was
interpolated from the two closest cash rates available
• An interpolation to obtain a fair rate for a standard 6 or 12 month contract
required the interpolation to create a fair rate between the IMM dates. In the case
of a 3 month interpolated rate, this would be between the cash rate obtained, and
the maturity date of the 3 month trade from the first IMM date.
The work from this calculation served more to confirm that the behavior observed from
LIBOR rates was less a result of any concerns on term-related counterparty risk, as the
divergences observed are almost identical.
` 19
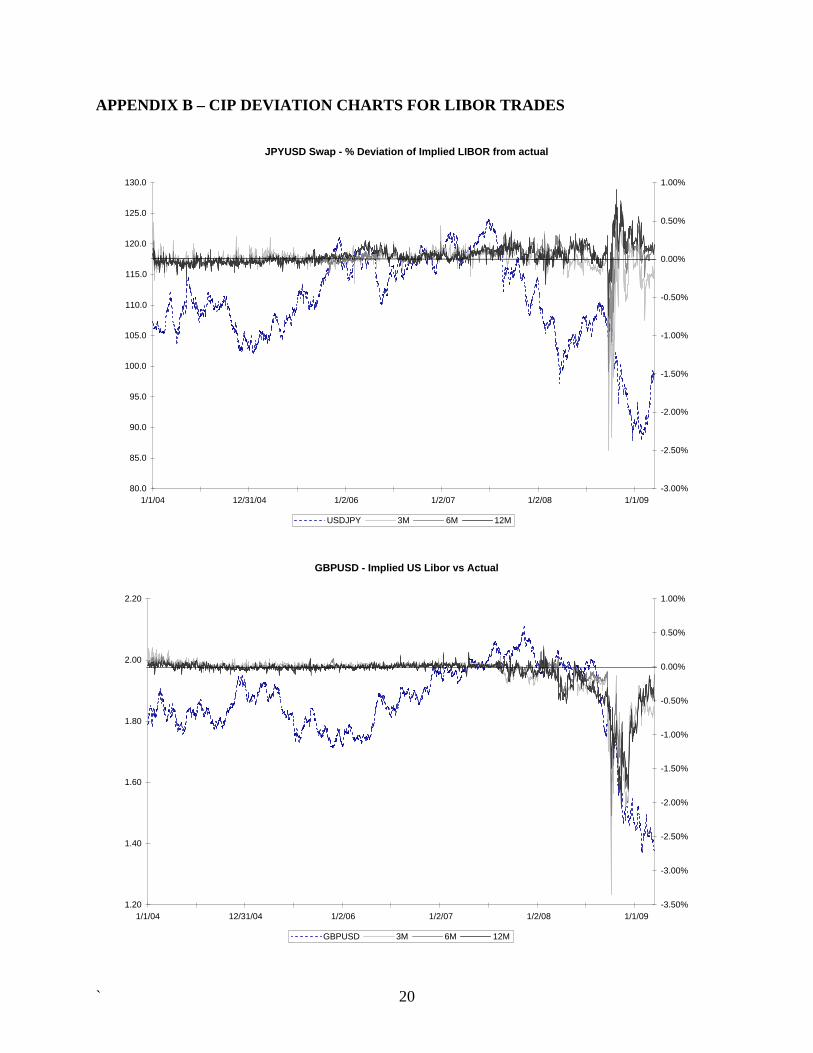
APPENDIX B – CIP DEVIATION CHARTS FOR LIBOR TRADES
JPYUSD Swap - % Deviation of Implied LIBOR from actual
80.0
85.0
90.0
95.0
100.0
105.0
110.0
115.0
120.0
125.0
130.0
1/1/04 12/31/04 1/2/06 1/2/07 1/2/08 1/1/09-3.00%
-2.50%
-2.00%
-1.50%
-1.00%
-0.50%
0.00%
0.50%
1.00%
USDJPY 3M 6M 12M
GBPUSD - Implied US Libor vs Actual
1.20
1.40
1.60
1.80
2.00
2.20
1/1/04 12/31/04 1/2/06 1/2/07 1/2/08 1/1/09-3.50%
-3.00%
-2.50%
-2.00%
-1.50%
-1.00%
-0.50%
0.00%
0.50%
1.00%
GBPUSD 3M 6M 12M
` 20

USDCAD Swap - % Deviation FX Implied LIBOR from Actual
0.80
0.90
1.00
1.10
1.20
1.30
1.40
1.50
1/1/04 12/31/04 1/2/06 1/2/07 1/2/08 1/1/09
Exch
ange
Rat
e
-2.00%
-1.50%
-1.00%
-0.50%
0.00%
0.50%
1.00%Deviation
USDCAD Spot 3M 6M 12M
` 21
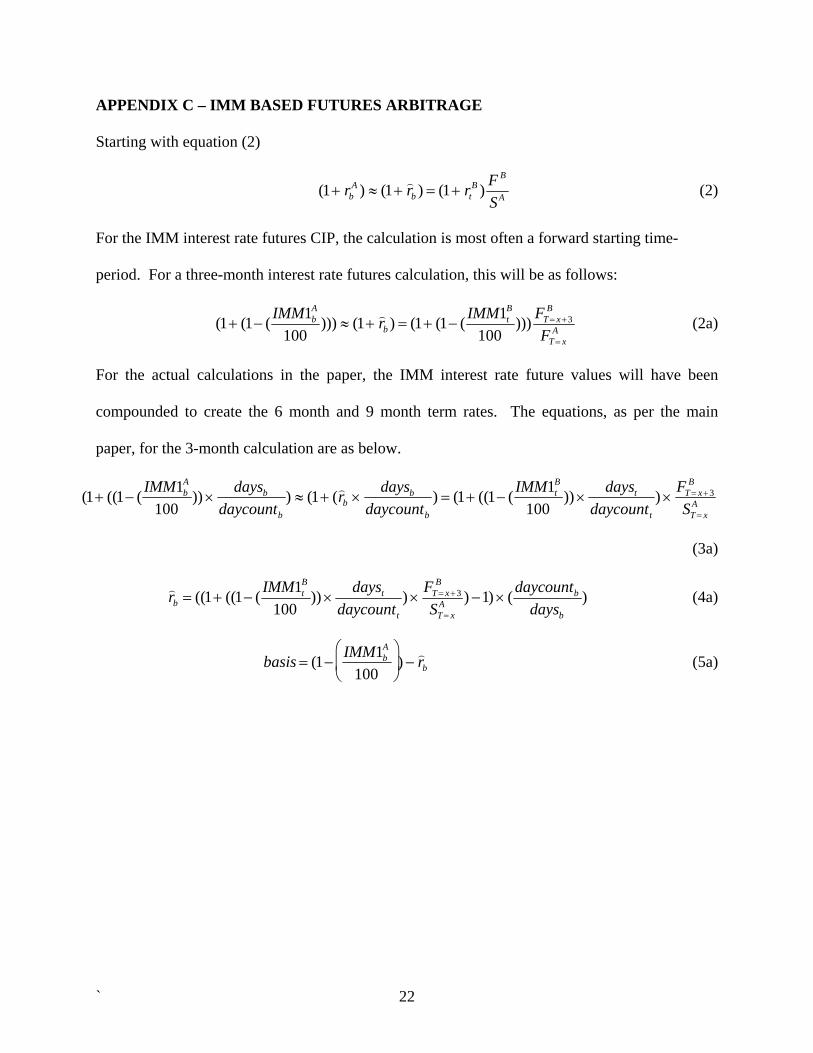
APPENDIX C – IMM BASED FUTURES ARBITRAGE
Starting with equation (2)
(1+ rb
A ) ≈ (1+ ) r b ) = (1+ rtB ) F B
SA (2)
For the IMM interest rate futures CIP, the calculation is most often a forward starting time-
period. For a three-month interest rate futures calculation, this will be as follows:
(1+ (1− ( IMM1b
A
100))) ≈ (1+ ) r b ) = (1+ (1− ( IMM1t
B
100))) FT = x +3
B
FT = xA (2a)
For the actual calculations in the paper, the IMM interest rate future values will have been
compounded to create the 6 month and 9 month term rates. The equations, as per the main
paper, for the 3-month calculation are as below.
(1+ ((1− ( IMM1b
A
100)) ×
daysb
daycountb
) ≈ (1+ () r b ×daysb
daycountb
) = (1+ ((1− ( IMM1tB
100)) ×
dayst
daycountt
) ×FT = x +3
B
ST = xA
(3a)
) r b = ((1+ ((1− ( IMM1tB
100)) ×
dayst
daycountt
) ×FT = x +3
B
ST = xA ) −1) × ( daycountb
daysb
) (4a)
basis = (1−
IMM1bA
100⎛
⎝ ⎜
⎞
⎠ ⎟ ) − ) r b (5a)
` 22

APPENDIX D – CIP DEVIATION FOR IMM BASED FUTURES TRADES
JPYUSD - IMM based Implied LIBOR vs Market Deviation
80.0
85.0
90.0
95.0
100.0
105.0
110.0
115.0
120.0
125.0
130.0
1/1/04 12/31/04 1/2/06 1/2/07 1/2/08 1/1/09-3.00%
-2.50%
-2.00%
-1.50%
-1.00%
-0.50%
0.00%
0.50%
1.00%
USDJPY 6M 9M
GBPUSD - IMM Date Implied US Libor vs Futures
1.20
1.40
1.60
1.80
2.00
2.20
1/1/04 12/31/04 1/2/06 1/2/07 1/2/08 1/1/09-3.50%
-3.00%
-2.50%
-2.00%
-1.50%
-1.00%
-0.50%
0.00%
0.50%
1.00%
GBPUSD 6M 9M
` 23
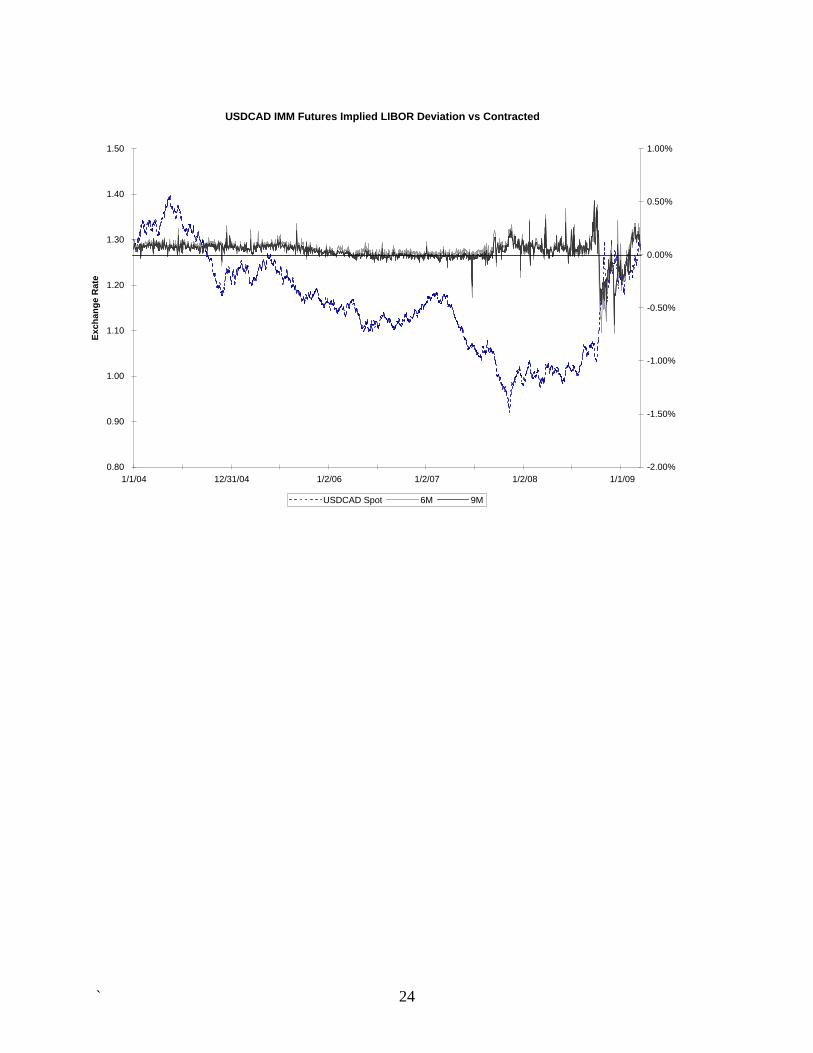
USDCAD IMM Futures Implied LIBOR Deviation vs Contracted
0.80
0.90
1.00
1.10
1.20
1.30
1.40
1.50
1/1/04 12/31/04 1/2/06 1/2/07 1/2/08 1/1/09
Exch
ange
Rat
e
-2.00%
-1.50%
-1.00%
-0.50%
0.00%
0.50%
1.00%
USDCAD Spot 6M 9M
` 24