Embed Size (px)
Citation preview
Claremont CollegesScholarship @ Claremont
KGI Theses and Dissertations KGI Student Scholarship
5-18-2013
Device Engineering for Infectious DiseaseDiagnosis using Isothermal DNA Amplificationand Lateral Flow DetectionKristina RoskosKeck Graduate Institute
This Open Access Dissertation is brought to you for free and open access by the KGI Student Scholarship at Scholarship @ Claremont. It has beenaccepted for inclusion in KGI Theses and Dissertations by an authorized administrator of Scholarship @ Claremont. For more information, pleasecontact [email protected].
Recommended CitationRoskos, Kristina, "Device Engineering for Infectious Disease Diagnosis using Isothermal DNA Amplification and Lateral FlowDetection" (2013). KGI Theses and Dissertations. Paper 2.http://scholarship.claremont.edu/kgi__theses/2
DOI: 10.5642/kgitd/2
Device Engineering for Infectious Disease Diagnosis using Isothermal
DNA Amplification and Lateral Flow Detection
BY
Kristina Roskos
Copyright by Kristina Roskos 2013
All Rights Reserved
We, the undersigned, certify that we have read this dissertation of Kristina Roskos and
approve it as adequate in scope and quality for the degree of Doctor of Philosophy.
Dissertation Committee:
Dr. Angelika Niemz
Professor, Chair
Dr. Jim Sterling
Member
Dr. Jim Osborne
Member
Dr. Robert Matson
Member
Dr. Animesh Ray
PhD Program Director
Device Engineering for Infectious Disease Diagnosis using Isothermal
DNA Amplification and Lateral Flow Detection
BY
Kristina Roskos
A Dissertation submitted to the Faculty of Keck Graduate Institute of
Applied Life Sciences in partial fulfillment of the requirements for the
degree of Doctor of Philosophy in Applied Life Sciences
Claremont, California
2013
Approved by:
_________________________________
Angelika Niemz Ph.D.
Arnold and Mabel Beckman Professor and Director of Research
Keck Graduate Institute, Doctoral Thesis Advisor
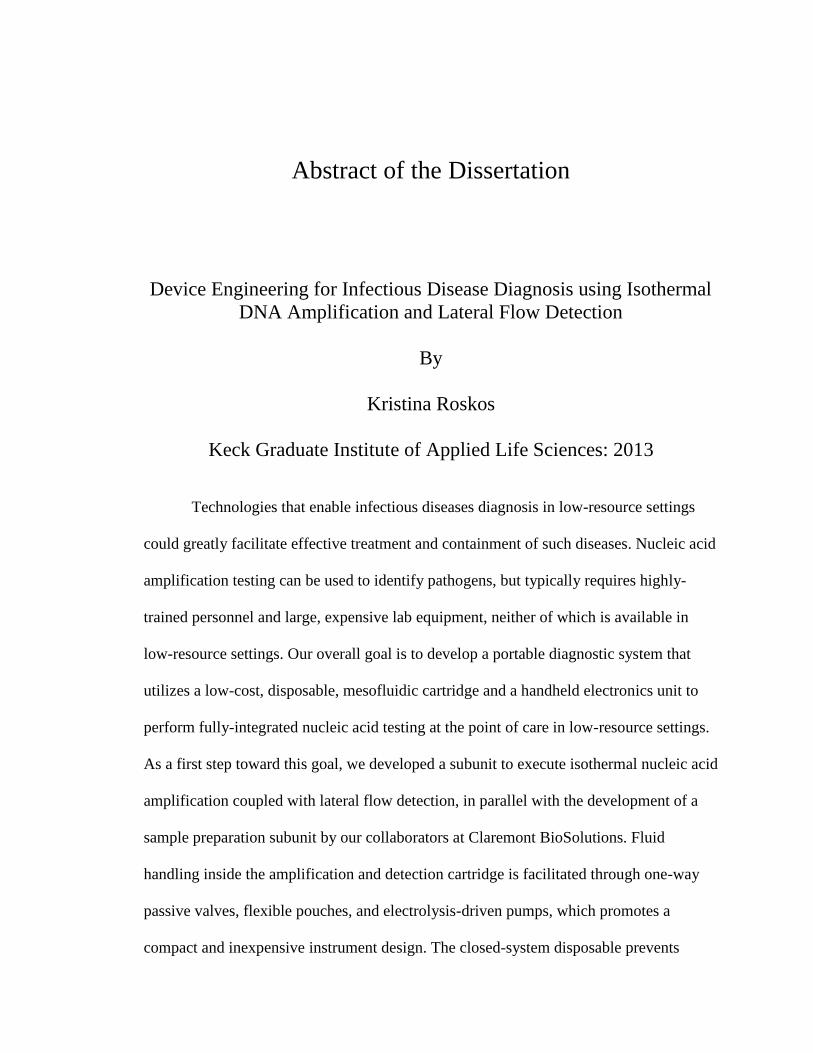
Abstract of the Dissertation
Device Engineering for Infectious Disease Diagnosis using Isothermal
DNA Amplification and Lateral Flow Detection
By
Kristina Roskos
Keck Graduate Institute of Applied Life Sciences: 2013
Technologies that enable infectious diseases diagnosis in low-resource settings
could greatly facilitate effective treatment and containment of such diseases. Nucleic acid
amplification testing can be used to identify pathogens, but typically requires highly-
trained personnel and large, expensive lab equipment, neither of which is available in
low-resource settings. Our overall goal is to develop a portable diagnostic system that
utilizes a low-cost, disposable, mesofluidic cartridge and a handheld electronics unit to
perform fully-integrated nucleic acid testing at the point of care in low-resource settings.
As a first step toward this goal, we developed a subunit to execute isothermal nucleic acid
amplification coupled with lateral flow detection, in parallel with the development of a
sample preparation subunit by our collaborators at Claremont BioSolutions. Fluid
handling inside the amplification and detection cartridge is facilitated through one-way
passive valves, flexible pouches, and electrolysis-driven pumps, which promotes a
compact and inexpensive instrument design. The closed-system disposable prevents

workspace amplicon contamination. The cartridge design is based on standard, scalable
manufacturing techniques, such as injection molding. Using an initial prototype system,
we demonstrated detection of purified Mycobacterium tuberculosis genomic DNA. We
then developed a refined amplification and detection cartridge in conjunction with an
improved portable instrument, which automates pumping, heating, and timing, using a
design format compatible with eventual integration with the sample preparation subunit.
This refined cartridge incorporates a novel, inexpensive, stand-alone, passive valve,
smaller, integrated pump components, a more complex injection molded polycarbonate
cartridge core piece, and enhanced lateral flow chambers to improve visual detection. The
independent valve component can be tailored for a variety of fluidic systems. We
demonstrated appropriate fluidic and thermal control, and successful isothermal nucleic
acid amplification within this refined amplification and detection subunit. We have
developed a separate fluidic module for master-mix reagent storage and reconstitution
that is designed to act as the interface between the amplification and detection subunit
and the upstream sample preparation subunit. We envision that the merger of these two
subunits into a fully-integrated cartridge will enable user-friendly, automated sample-in
to answer-out diagnosis of infectious diseases in primary care settings of low-resource
countries with high disease burden.

Dedication
I thank my parents, Patricia and Henry Roskos, for their unwavering support in all of my
endeavors.

vii
ACKNOWLEDGMENTS
First and foremost, I thank the engineers and scientists who I work with regularly: Anna
Hickerson, Hsiang-Wei Lu, Tanya Ferguson, Supriya Kadam, and Angelika Niemz. I also
thank all of the current Niemz Lab members: Eric Houghton, Ono Bacani, and Ilya
Tostorukov. I thank all of the former Niemz Lab members and undergraduate/high school
summer researchers: Yvonne Klaue, Deepali Shinde, Thomas Carey, Kimberly Chen,
Winnie Ding, Stephanie Tan, Peter Vandeventer, Jifeng Qian, Jose Salazar and Barbara
Erwin. I thank our collaborators at Claremont BioSolutions (Tanya Ferguson, Robert
Doebler, Keith Harrington and Ryan Talbot), as well as our other external collaborators
at Seattle Biomedical Research Institute, Program for Appropriate Technology in Health
(PATH), and Seattle King County. I thank my parents, Patricia and Henry Roskos, as
well as my sister and brother-in-law, Melissa Roskos and Johann Joseph, for their moral
support. I also thank Reid Snowden, Hadi Mirmalek-Sani, and Ryan McComb for their
support, for proof-reading chapters of my thesis, and for helping me practice my thesis
defense presentation. I thank Lindsay Janssen, Academic Coordinator, and Animesh Ray,
Director of the PhD Program, for academic support and ensuring all of my program
milestones were completed. I thank the members of my PhD committee: Angelika Niemz,
Robert Matson, Jim Osborne and Jim Sterling. Finally, I thank the NIH-NIAID for
providing funding through grants R01AI076247 and R01AI090831.
viii
TABLE OF CONTENTS
Acknowledgments ......................................................................................................................................... vii
Table of Contents ......................................................................................................................................... viii
Table of Abbreviations ................................................................................................................................... ix
Table of Figures .............................................................................................................................................. x
Chapter 1: Introduction and Thesis Scope ...................................................................................................... 1
Chapter 2: Initial Prototype for Amplification and Detection Subunit .......................................................... 11
Chapter 3: Novel Miniature Passive Valve .................................................................................................... 35
Chapter 4: Refined Prototype for Amplification and Detection Subunit ....................................................... 47
Chapter 5: Reagent Storage and Reconstitution ........................................................................................... 68
Appendix ....................................................................................................................................................... 89
References ................................................................................................................................................... 112
ix
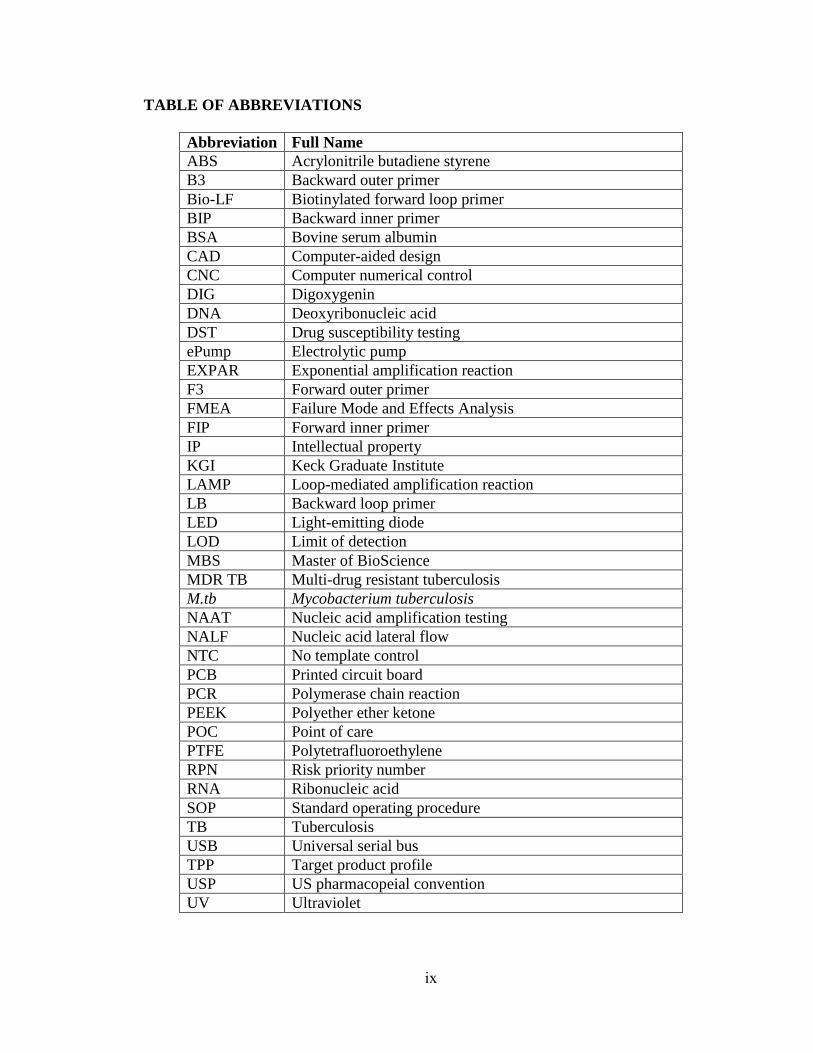
TABLE OF ABBREVIATIONS
Abbreviation Full Name
ABS Acrylonitrile butadiene styrene
B3 Backward outer primer
Bio-LF Biotinylated forward loop primer
BIP Backward inner primer
BSA Bovine serum albumin
CAD Computer-aided design
CNC Computer numerical control
DIG Digoxygenin
DNA Deoxyribonucleic acid
DST Drug susceptibility testing
ePump Electrolytic pump
EXPAR Exponential amplification reaction
F3 Forward outer primer
FMEA Failure Mode and Effects Analysis
FIP Forward inner primer
IP Intellectual property
KGI Keck Graduate Institute
LAMP Loop-mediated amplification reaction
LB Backward loop primer
LED Light-emitting diode
LOD Limit of detection
MBS Master of BioScience
MDR TB Multi-drug resistant tuberculosis
M.tb Mycobacterium tuberculosis
NAAT Nucleic acid amplification testing
NALF Nucleic acid lateral flow
NTC No template control
PCB Printed circuit board
PCR Polymerase chain reaction
PEEK Polyether ether ketone
POC Point of care
PTFE Polytetrafluoroethylene
RPN Risk priority number
RNA Ribonucleic acid
SOP Standard operating procedure
TB Tuberculosis
USB Universal serial bus
TPP Target product profile
USP US pharmacopeial convention
UV Ultraviolet
x
TABLE OF FIGURES
Figure 1: Schematic drawing illustrating system operating principle during process
execution. Sample is loaded and pushed through a miniaturized bead blender
(“Omnivalve”), lysing mycobacteria and eluting DNA into downstream chambers where
it reconstitutes lyophilized amplification master-mix materials. The master-mix is then
heated, allowing isothermal amplification to occur, and the fluid is then pumped onto
lateral flow strips where amplified product can be visually detected by the user.
Figure 2: Conceptual drawing of system components. (a) Cartridge viewed from the top,
showing the access ports to the reaction and pump pouches on the underside of the
cartridge (indicated in gray outline), and the position of lateral flow strips in anti-parallel
orientation. (b) Cartridge viewed from the bottom, showing the reaction pouches with
overlaid pump pouches. (c) and (d) Side view of the cartridge on the heater (not to scale),
illustrating the operating principle. (c) Master-mix is injected through the septum inlet
into the reaction pouch, and targeted DNA sequences are isothermally amplified on top of
the temperature-controlled heater surface. (d) Applying current to the electrolytic pump
pushes fluid into the pump pouch. The pump pouch expands, thereby compressing the
reaction pouch up against the dome-shaped recess in the cartridge, which forces fluid out
of the reaction pouch through the one-way check valve and into the lateral flow strip
pouch.
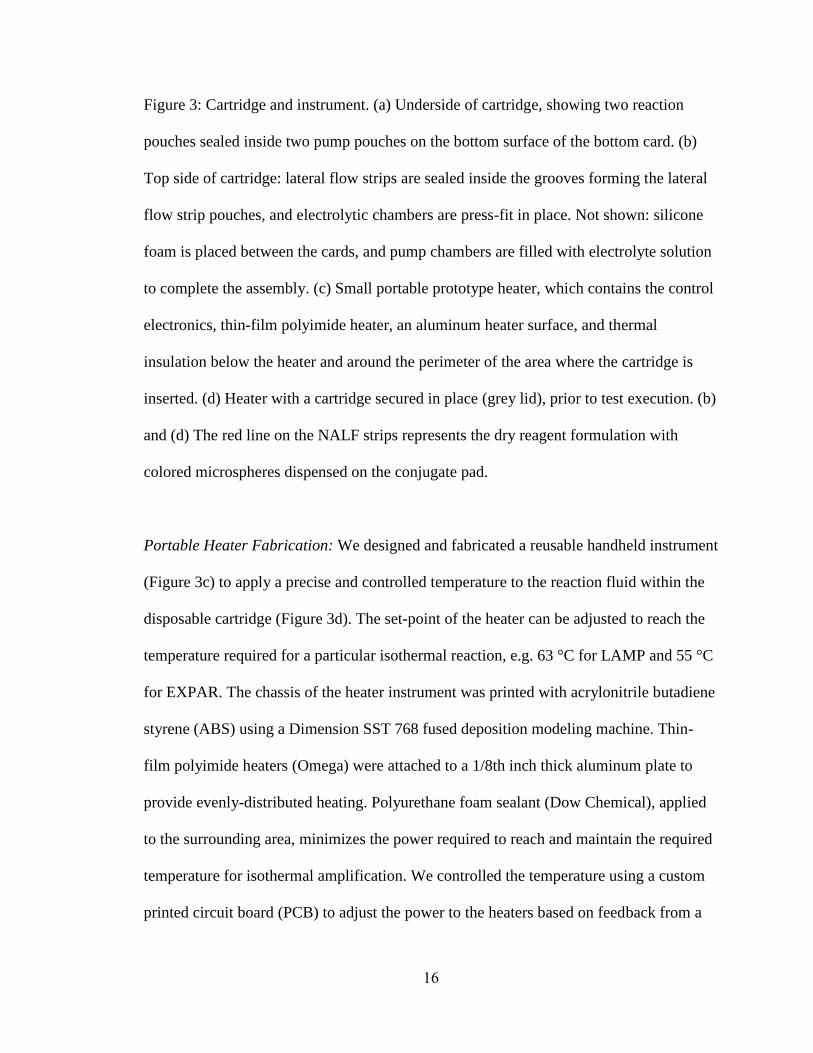
Figure 3: Cartridge and instrument. (a) Underside of cartridge, showing two reaction
pouches sealed inside two pump pouches on the bottom surface of the bottom card. (b)
Top side of cartridge: lateral flow strips are sealed inside the grooves forming the lateral
flow strip pouches, and electrolytic chambers are press-fit in place. Not shown: silicone
xi
foam is placed between the cards, and pump chambers are filled with electrolyte solution
to complete the assembly. (c) Small portable prototype heater, which contains the control
electronics, thin-film polyimide heater, an aluminum heater surface, and thermal
insulation below the heater and around the perimeter of the area where the cartridge is
inserted. (d) Heater with a cartridge secured in place (grey lid), prior to test execution. (b)
and (d) The red line on the NALF strips represents the dry reagent formulation with
colored microspheres dispensed on the conjugate pad.
Figure 4: Conceptual depictions of EXPAR reactions and coupling the amplification
products with NALF. (a) First-stage EXPAR, where Trigger X primes and is extended
along a template provided in the EXPAR master-mix. (b) Second-stage EXPAR
illustrating Trigger X converting to a reporter oligonucleotide (Reporter Y). (c) NALF
coupled to second-stage EXPAR, where the Reporter Y oligonucleotide binds DNA-
functionalized microspheres and DNA hybridized on the nitrocellulose at the test line,
resulting in a visible test line. This binding is dependent on the presence of Reporter Y,
so the test line will only be present in positive samples. Additional DNA functionalized
on the microspheres will bind DNA hybridized on the nitrocellulose at the control line,
resulting in a visible line. The binding at the control line is independent of the presence of
Reporter Y, and, therefore, acts as an indicator of proper lateral flow function.
Figure 5: (a) Measured temperature of the fluid inside the reaction pouch of a cartridge
attached to the heater as a function of time. Filling the pump pouch with liquid improves
the thermal transfer from the heater to the reaction fluid, which reaches a stable
temperature of 62±0.1 °C within approximately ten minutes. Thermal paste applied
between the heater surface and pump pouch provides no further improvements. (b) and (c)
xii
Thermal simulations (COMSOL Multiphysics) of the cartridge on top of the heater,
showing horizontal cross-sections within the center of the reaction fluid layer of the
cartridge. (b) Uniform heating to the desired temperature (63 °C) is observed using a
model with ideal thermal contact between cartridge and heater, with no air gap. (c)
Introducing a 150 µm thick thermally-resistive layer between cartridge and heater leads
to a lower temperature and less uniform heating within the reaction pouch. The cross-
hatches in the middle of the pump pouches indicate the dimensions of the circular
reaction pouches. An air bubble was intentionally introduced into the outlet port of the
reaction chamber to simulate air trapped in the reaction pouches after fluid is inserted.
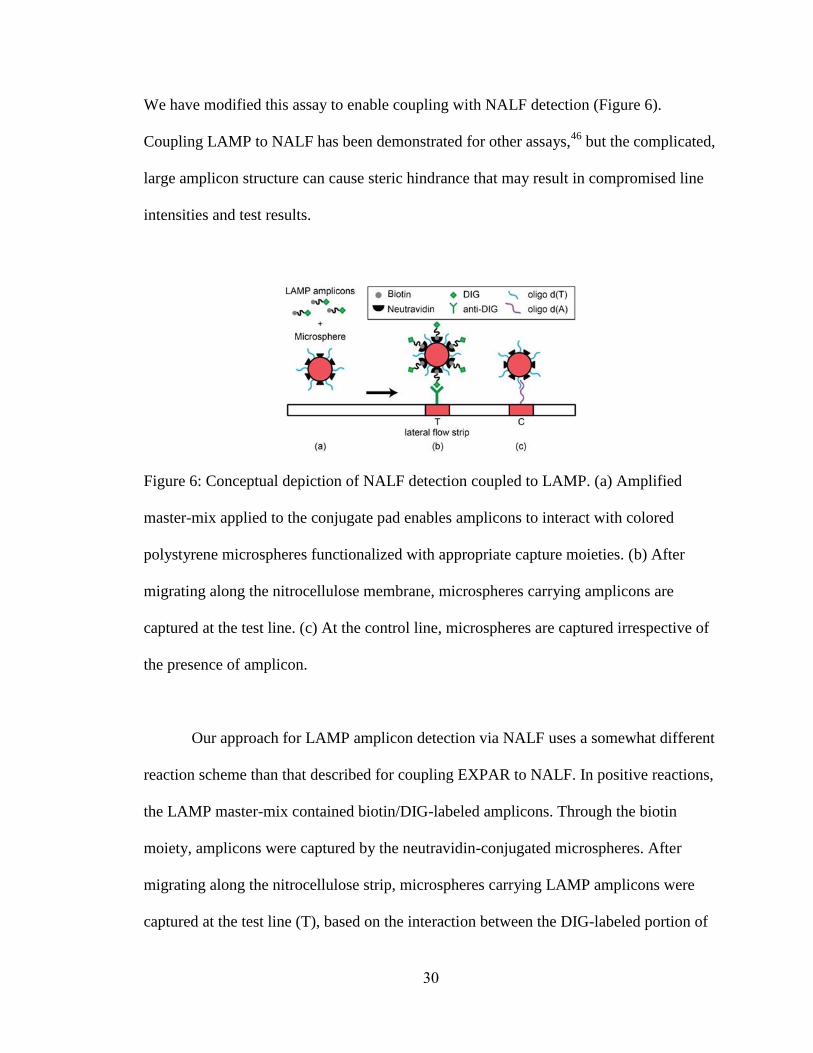
Figure 6: Conceptual depiction of NALF detection coupled to LAMP. (a) Amplified
master-mix applied to the conjugate pad enables amplicons to interact with colored
polystyrene microspheres functionalized with appropriate capture moieties. (b) After
migrating along the nitrocellulose membrane, microspheres carrying amplicons are
captured at the test line. (c) At the control line, microspheres are captured irrespective of
the presence of amplicon.
Figure 7: Amplification results. (a) LAMP based detection of M.tb genomic DNA
performed in the cartridge on the instrument: NALF strips of two representative
cartridges, after 10 minutes of isothermal amplification, followed by 10 min for lateral
flow detection. (b) LAMP master-mix amplified in the cartridge on the heater, analyzed
via gel electrophoresis (Lanes 1 and 2), compared to amplification performed in reaction
tubes on a standard heat block (Lanes 3 and 4). Lane 5: DNA molecular weight markers.
For (a) and (b), positive (+) reactions show LAMP product starting from 3000 copies of
M.tb DNA, and negative (-) reactions show no product since no M.tb DNA was added to
xiii
the reaction. (c) EXPAR based detection of M.tb genomic DNA performed in the
cartridge on the instrument: NALF strips of two representative cartridges, after 60
minutes of isothermal amplification, followed by 10 min for lateral flow detection.
Positive (+) reactions contained 6x10⁵ copies M.tb DNA, and negative (-) reactions
contained no M.tb DNA.
Figure 8: Valve design components: (a) inner rigid core with one end capped and one
side port; (b) rigid core with elastomeric sleeve covering side port; (c) encapsulated valve
for in-line use.
Figure 9: Different embodiments of the sleeve valve. (a) Stainless steel core tubing with
silicone tubing sleeve. (b) PEEK core tubing with cast silicone sleeves, with varying
sleeve inner diameters, as indicated in the figure.
Figure 10: Cracking and sustained open pressure for different valve embodiments. (a)
Pressure as a function of time for an example steel valve, indicating (i) cracking pressure
and (ii) sustained open pressure; (b) Cracking pressure for the two stainless steel valve
sets; (c) Cracking pressure for PEEK valve sets 1-5, as a function of silicone sleeve inner
diameter
Figure 11: Nucleic acid amplification reactions with (solid lines) and without (dashed
lines) autoclaved valve materials incubated in the reaction buffer prior to running the
amplification reaction. The valve materials do not inhibit the reaction. A small piece of
each valve material, either autoclaved or in its original form, was incubated in LAMP
reaction buffer for 60 minutes at 63 °C, with agitation. We then used this buffer solution
in setting up LAMP reactions that were subsequently amplified in the presence and
absence of the targeted genomic DNA by incubation at 63 °C, with real time fluorescence
xiv
monitoring using an Opticon2 real-time PCR instrument (Bio-rad, Hercules, CA). Blue:
LAMP positive reactions containing 3000 copies of target genomic DNA per reaction.
Red: LAMP negative control reactions, which did not contain target DNA.
Figure 12: (a) Design concept of the fluidic system of the cartridge. (b) CAD design of
the cartridge components including: (i) cartridge core, (ii) spacer ring, (iii) reaction insert,
and (iv) bottom casing. (c) Injection molded pieces of the cartridge components.
Figure 13: Steps of cartridge insertion into the designed instrument including (a) insert
cartridge datum into locator slots in the instrument housing at an angle and (b) lower the
cartridge into the slot and release the spring loaded clip to secure the cartridge.
Figure 14: Fluidic control of reaction pouch filling. Fluid was pumped into the reaction
pouch at 3 µL/sec for 91 sec, and then the pump was turned off (grey area). The inlet
pressure was measured upstream of the inlet valve, in-line with the fluid pumping into the
reaction pouch. The pump pouch pressure was measured as a surrogate to indicate the
pressure inside the reaction pouch. (a) Inlet pressure increases, then drops, which
indicates inlet valve cracking. (b) Inlet and pump pouch pressures build as fluid fills the
reaction pouch. The outlet valve does not allow fluid to flow out of the reaction chamber.
The small pressure peak presumably indicates dead air trapped in the reaction pouch
exiting the chamber through the outlet valve. (c) Maximum peak pressure indicates outlet
cracking pressure and the point at which fluid begins flowing out of the reaction chamber.
(d) Inlet pumping was stopped, allowing fluid to exit the reaction chamber and pressure
inside the reaction pouch to equilibrate.
Figure 15: Pressure measurement in the upstream channel during injection of 150 µL
reaction buffer from the sample inlet port into the reaction insert. (a) The barrier vents the
xv
dead air ahead of the fluid until the fluid fills the upstream channel. No air is injected into
the reaction pouch. (b) The venting barrier closes as liquid fills the area underneath the
barrier. Pressure builds in the upstream fluidic channel until the inlet valve opens. (c) The
fluid is pumped into the reaction pouch through the inlet valve. The channel pressurizes
due to the pressure exerted by the filled and closed pump pouch. (d) After approximately
100 µL liquid is injected into the reaction pouch, the gas behind the injected volume is
vented through the venting barrier and the remainder of the volume is trapped in the
vented portion. No air is injected into the reaction pouch.
Figure 16: Lateral flow strip chamber testbed. (a) Empty lateral flow strip chambers,
showing embedded hydrophobic barriers (blue). (b) Lateral flow strip chambers with
lateral flow strips sealed by polycarbonate film. The red line on the conjugate pads is the
lateral flow conjugate that has been dispensed and dried onto the conjugate pad.
Figure 17: Temperature of the fluid inside the reaction pouch of a cartridge attached to
the heater as a function of time. The fluid reaches a stable temperature within
approximately ten minutes.
Figure 18: Demonstration of fluidic process in cartridge on instrument. (a) Cartridge
attached to instrument, with reaction buffer (colored blue) injected into storage chamber.
(b) Instrument LEDs indicate function of heater (red LED) and ePumps (blue LEDs). (c)
Lateral flow detection of reaction buffer spiked with synthetic DNA product pumped out
of the reaction pouch onto the lateral flow strips in the cartridge.
Figure 19: Detection of M.tb genomic DNA through 60 minutes of isothermal LAMP in
the cartridge on the instrument, verified via gel electrophoresis of amplified master-mix
removed from the cartridge after the reaction. Amplified product from both reaction
xvi
pouches (lanes 3 and 4) generated a similar pattern as the positive control reactions
performed in tubes on a standard heater (lanes 5 and 6), indicating that desired
amplification had occurred in the cartridge. All positive reactions contained 3000 copies
M.tb genomic DNA. No products were generated in negative control reactions (lanes 7
and 8) that did not contain M.tb DNA. Lane 1 contained 1 kb molecular weight ladder
and lane 2 was empty.
Figure 20: Lyophilized pellet storage and reconstitution chamber as originally designed.
(a) Reconstitution of pellet (red arrow) in blue colored water. (b) Depiction of
reconstitution, illustrating the pellet wicking the initial fluid front to the bottom of conical
chamber and pumping further downstream, while introducing an air bubble in the fluid
stream separating the initial fluid front (ii) from the remaining fluid (i).
Figure 21: Original system overview diagram. Red area highlights the fluidics interface
between sample preparation and amplification and detection, which needs to store
stabilized master-mix reagents until they can be reconstituted by purified sample
preparation eluate and pumped into the reaction pouch chamber. The initial design
incorporated lyophilization to stabilize the master-mix reagents.
Figure 22: Fluidic system overview. (a) Top view: purified sample enters the chamber,
first absorbing into the lyophilized master-mix material matrix, and then filling the
chamber completely. (b) Side view: after a short incubation period to allow the reagents
to diffuse, the reconstituted reaction master-mix is pumped through the outlet.
Figure 23: Investigation of different reconstitution chamber geometries. For each case,
showing (i) empty chamber, (ii) partially filled chamber, and (iii) chamber after as much
fluid could be emptied as possible. (a) Ellipse without any structures. (b) Ellipse with
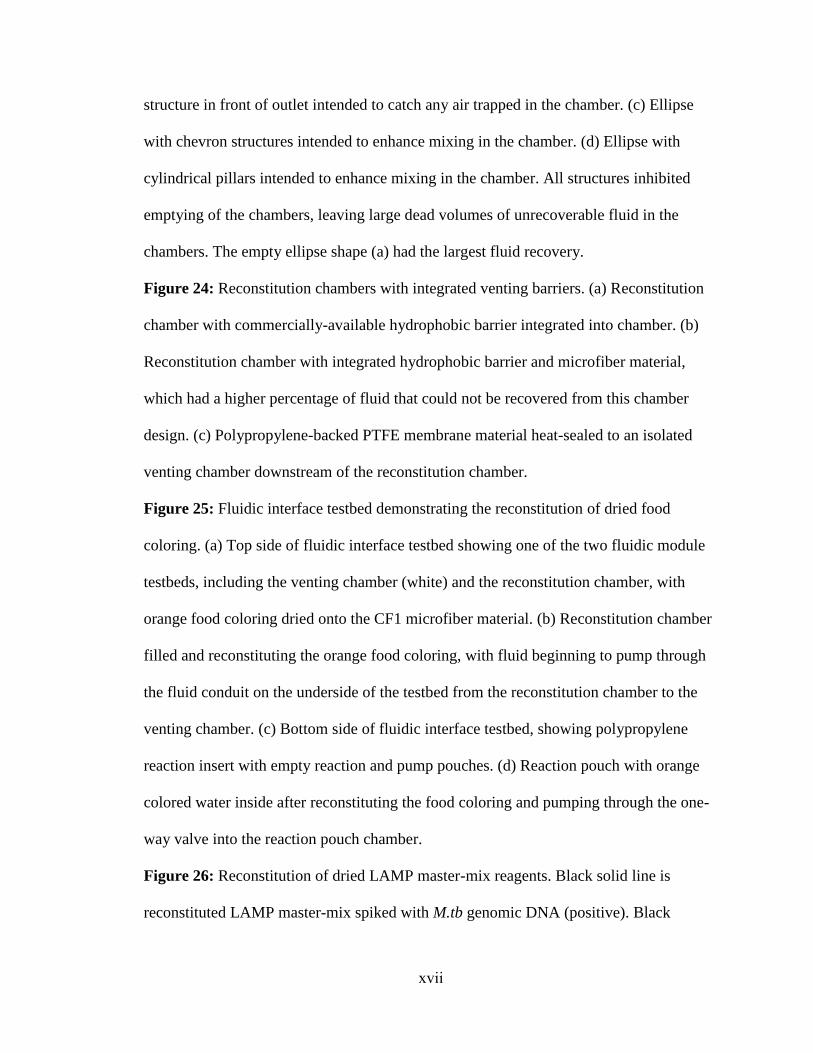
xvii
structure in front of outlet intended to catch any air trapped in the chamber. (c) Ellipse
with chevron structures intended to enhance mixing in the chamber. (d) Ellipse with
cylindrical pillars intended to enhance mixing in the chamber. All structures inhibited
emptying of the chambers, leaving large dead volumes of unrecoverable fluid in the
chambers. The empty ellipse shape (a) had the largest fluid recovery.
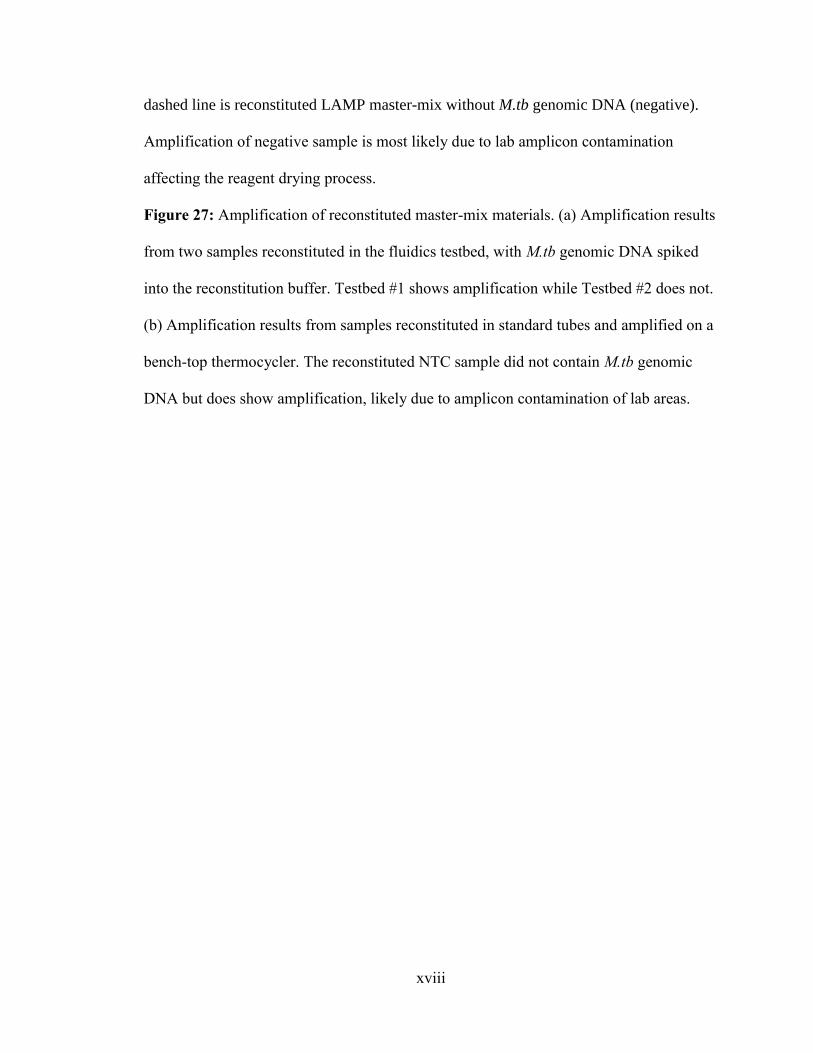
Figure 24: Reconstitution chambers with integrated venting barriers. (a) Reconstitution
chamber with commercially-available hydrophobic barrier integrated into chamber. (b)
Reconstitution chamber with integrated hydrophobic barrier and microfiber material,
which had a higher percentage of fluid that could not be recovered from this chamber
design. (c) Polypropylene-backed PTFE membrane material heat-sealed to an isolated
venting chamber downstream of the reconstitution chamber.
Figure 25: Fluidic interface testbed demonstrating the reconstitution of dried food
coloring. (a) Top side of fluidic interface testbed showing one of the two fluidic module
testbeds, including the venting chamber (white) and the reconstitution chamber, with
orange food coloring dried onto the CF1 microfiber material. (b) Reconstitution chamber
filled and reconstituting the orange food coloring, with fluid beginning to pump through
the fluid conduit on the underside of the testbed from the reconstitution chamber to the
venting chamber. (c) Bottom side of fluidic interface testbed, showing polypropylene
reaction insert with empty reaction and pump pouches. (d) Reaction pouch with orange
colored water inside after reconstituting the food coloring and pumping through the one-
way valve into the reaction pouch chamber.
Figure 26: Reconstitution of dried LAMP master-mix reagents. Black solid line is
reconstituted LAMP master-mix spiked with M.tb genomic DNA (positive). Black
xviii
dashed line is reconstituted LAMP master-mix without M.tb genomic DNA (negative).
Amplification of negative sample is most likely due to lab amplicon contamination
affecting the reagent drying process.
Figure 27: Amplification of reconstituted master-mix materials. (a) Amplification results
from two samples reconstituted in the fluidics testbed, with M.tb genomic DNA spiked
into the reconstitution buffer. Testbed #1 shows amplification while Testbed #2 does not.
(b) Amplification results from samples reconstituted in standard tubes and amplified on a
bench-top thermocycler. The reconstituted NTC sample did not contain M.tb genomic
DNA but does show amplification, likely due to amplicon contamination of lab areas.
1
CHAPTER 1: INTRODUCTION AND THESIS SCOPE
Nucleic acid amplification testing (NAAT) can be used to diagnose infectious diseases by
identifying the pathogen’s genetic material.1,2
NAAT is typically performed in
centralized laboratories by highly-trained personnel on large, complex, expensive
equipment, which is not ideal for applications that require a rapid answer to facilitate
treatment and improve patient outcomes.3-5
In developing countries, the diagnosis of
endemic infectious diseases using NAAT in central laboratories is further hampered by
lack of suitable facilities and trained personnel, and additional logistical challenges.6-8
Point of Care Technologies
Technologies that enable point-of-care (POC) diagnosis of active tuberculosis (TB) could
greatly benefit the treatment and containment of the disease,9 which in 2011 caused 8.7
million incident cases, resulting in 1.4 million deaths,10
primarily in high TB-burden
regions of Asia, Eastern Europe, and Sub-Saharan Africa. Rapidly identifying individuals
with active infectious TB in the field is of critical importance to curb transmission and
reduce morbidity and mortality.11,12
Smear microscopy is commonly used to diagnose
active pulmonary TB, but requires multiple sputum samples, tedious processing, and
often has low sensitivity.6 Culture methods, the current gold standard for sensitive TB
diagnosis and drug susceptibility testing (DST),12
typically deliver results in 2-8 weeks,
involve significant biohazard concerns, and, therefore, require expensive biosafety level 3
laboratory infrastructure and trained personnel. By contrast, NAAT enables sensitive and
specific TB diagnosis and genotypic drug resistance testing, producing accurate results in
less than 1 day,13,14
not accounting for the time required for sample transfer to a central
laboratory, and result dissemination to the care provider. POC NAAT eliminates these
2
often substantial delays, enables testing and treatment initiation in the same visit, and can
significantly improve access of TB patients to proper diagnostic methods.
The GeneXpert (Cepheid, Sunnyvale, CA) exemplifies the move of NAAT
towards the point of care.14
This fully-automated and integrated bench-top system can
perform sample preparation, nucleic acid amplification via polymerase chain reaction
(PCR), and multi-channel real-time fluorescence detection in less than 2 hours.15-17
The
World Health Organization (WHO) has endorsed the GeneXpert MTB-Rif test to identify
multi-drug resistant tuberculosis (MDR TB). However, the size, cost, and maintenance
requirements of the GeneXpert instrument may impede broad-scale implementation in
resource-limited, high-burden countries.18
Other PCR-based fully- or partially-integrated
NAAT systems for infectious disease diagnosis are in development or on the market,19-22
but are relatively expensive systems due to the complexity associated with thermocycling
and real-time fluorescence detection. Isothermal NAAT requires a single reaction
temperature, and, therefore, utilizes simplified instrumentation compared to real-time
PCR. In recent years, significant progress has been made in automating isothermal
amplification methods within a miniaturized format.23-26
Several isothermal NAAT
assays and systems have entered the US market for infectious disease diagnosis in
moderate complexity clinical laboratories,27-29
with varying levels of process integration,
system complexity, and ease of use.
Several groups have developed sample-in to answer-out lab-on-a-chip systems for
nucleic acid testing.24-26,30-33
Microfluidic systems for PCR amplification with real-time
fluorescence detection34,35
have been commercialized as part of the Biomark™ (Fluidigm,
San Francisco, CA) and BD MAX™ (Becton Dickinson, Franklin Lakes, NJ) systems,
3
which both comprise large bench-top instruments, with sample preparation performed
off-chip using standard methods. Microfluidic PCR systems such as the Biomark™ have
significant potential for high-end applications. However, to enable fully-automated
sample-to-answer nucleic acid testing at the point of care using microfluidic PCR,
challenges have to be overcome related to overall complexity and cost of both the chip
and required instrumentation. NAAT for infectious diseases further requires large sample
input volumes to reach the required limit of detection (LOD). In the case of tuberculosis,
typical sputum sample input volumes range from 100 µL13,36
to several mL.14
Microfluidic systems require a much smaller sample input volume, while mesofluidic
systems are ideal for processing samples in this volume range. In addition, real-time PCR
requires thermocycling plus fluorescence optics for detection, which is difficult to
implement in a compact, low-cost, and robust instrument for use in low-resource settings.
Isothermal NAAT requires a single reaction temperature, and, therefore, utilizes
simplified instrumentation, compared to PCR. One such method, the loop-mediated
amplification (LAMP) reaction, uses four to six primers that recognize multiple
sequences in the target DNA.37
The reaction generates concatenated DNA products with
high molecular weight and extensive secondary structure. A LAMP assay targeting the
gyrB gene in Mycobacterium tuberculosis (M.tb) genomic DNA,38
coupled to visual
endpoint detection based on pyrophosphate precipitation, has been applied to TB
diagnosis in low-resource settings.39,40
However, the method is performed manually in
multiple steps that require additional instruments; the turbidimetric fluorescence-based
readout requires a UV light source for excitation, and this detection method may give an
ambiguous result at low target copy numbers.
4
Nucleic Acid Lateral Flow
Lateral flow devices, as exemplified by pregnancy tests, are well-established for POC
diagnostics, can be manufactured inexpensively in large quantities, rely on passive
fluidics, and provide a clear visual readout with no additional instruments required.
Nucleic Acid Lateral Flow (NALF) has been coupled to PCR41
and to many isothermal
methods.42-46
NALF involves either antibody-dependent or antibody-independent
configurations for endpoint detection of a reaction, with the sensitivity contingent upon
upstream amplification. Antibody-dependent NALF has been used to detect LAMP
products46-49
by incorporating antigenic labels or haptens into the amplicon. NALF
detection is then performed using an antibody specific to the label. Antibody-independent
NALF uses direct hybridization of unlabeled target amplicons to colored oligonucleotide-
functionalized micro-particles and immobilized oligonucleotides on the test strip
membrane.41,50
Lateral flow devices are well-established for POC diagnostics, can be
manufactured inexpensively in large quantities, rely on passive fluidics, and provide a
clear visual readout with no additional instruments required. NAAT systems for
infectious disease diagnosis commercialized by BioHelix29
and USTAR42
use a NALF
cassette to analyze the amplified master-mix. This NALF cassette completely contains
the amplified master-mix to avoid amplicon carry-over contamination, which is a major
challenge in NAAT. However, in these systems, NALF detection is performed as a
separate manual step, after isothermal amplification has been executed on a standard heat
block.
5
Cartridge Fluidics
To integrate isothermal DNA amplification with NALF detection in one device requires a
system that can heat the master-mix at a fixed temperature for a pre-determined time, and
then pump the amplified master-mix onto the lateral flow strip. While isothermal heating
can be readily accommodated in a compact, inexpensive instrument, fluid handling on
disposable chips or inside cartridges typically requires bulky and complex positive
displacement pumping systems. For example, the Cepheid GeneXpert16
uses a
mechanically actuated piston with a rotating valve. Other systems, including the CARD
(Chemistry and Reagent Device, Rheonix, Ithaca, NY), the LIAT (lab in a tube, IQuum,
Marlborough, MA), the Razor and Film Array systems (Idaho Technologies, Salt Lake
City, Utah), and the Portrait analyzer (Great Basin Scientific, Salt Lake City, Utah),
utilize pneumatic or mechanical actuation for pumping.21,22,28,51,52
Alternatively,
electrolysis provides an inexpensive mechanism to pump fluids by using hydrogen and
oxygen gases generated by water electrolysis to exert pressure on a downstream fluid.53
Electrolytic pumping has been used for automated NAAT inside microfluidic devices as
developed by Motorola54
and Combimatrix.55,56
System Overview
The overall goal of this project is to develop a fully-integrated NAAT device to diagnose
infectious diseases, such as TB, at the point of care in low-resource settings. The
envisioned device will be a handheld, closed system that is inexpensive and easy to use.
Ultimately, this device will combine sample preparation, isothermal DNA amplification
and lateral flow detection into a single sample-in to answer-out platform. This scheme

6
comprises a disposable cartridge that mates with a reusable handheld electronic device.
This disposable cartridge will contain all necessary reagents, and will not require
refrigeration, including during shipping and storage. The handheld electronics device will
be low-power to enable eventual battery operation, making the entire system field-
deployable. To be appropriate for low-resource settings, the cost of goods and
manufacturing of our system needs to be very low, ideally less than $10 per cartridge and
less than $100 for the handheld device. The total assay time, including sample
preparation, will be approximately 60-90 minutes. In addition, we are designing the
system to be modular so that multiple cartridges can be run simultaneously by adjusting
the handheld electronics device to accommodate more than one cartridge.
Figure 1: Schematic drawing illustrating system operating principle during process
execution. Sample is loaded and pushed through a miniaturized bead blender
(“Omnivalve”), lysing mycobacteria and eluting DNA into downstream chambers where
it reconstitutes lyophilized amplification master-mix materials. The master-mix is then
heated, allowing isothermal amplification to occur, and the fluid is then pumped onto
lateral flow strips where amplified product can be visually detected by the user.
7
The overall system concept is illustrated in Figure 1. The patient sputum sample
will be collected in a separate apparatus that will contain disinfecting and liquefying
reagents. This sample collection device will then be attached directly to the inlet port of
the cartridge. The sample will be pushed through a proprietary miniature bead blender
which has been enclosed inside an active valve (Omnivalve, Claremont BioSolutions,
Upland, CA). While the sample is being pushed through the valve to waste, the blender
motor agitates the beads inside the blender chamber at ~30,000 RPM, which facilitates
effective mechanical lysis of the mycobacteria.57
Furthermore, the eluted DNA in the
sample is captured on the beads inside the blender. The active valve is then turned to
connect the blender chamber with the wash buffer reservoir. An electrolytic pump then
pushes wash buffer through the blender and into waste to remove contaminants, but
retaining the DNA bound to the beads inside the blender. After the wash buffer reservoir
has emptied, an additional 1 mL of air is passed through the blender chamber, in order to
fully expel the wash buffer from the blender chamber. Initial studies have shown that this
protocol reduces the amount of wash buffer propogated downstream into the reaction
master-mix, which is desirable. Following the wash step, the active valve is then turned
again, to connect the blender chamber to the elution buffer reservoir. Another electrolytic
pump is utilized to fill the blender chamber with elution buffer, and then the valve is
turned again to connect to the downstream fluidic pathways. The blender is then turned
on again, eluting the DNA off the bead matrix and into the buffer solution inside the
blender chamber. Since the valve already positioned to connect the blender chamber to
the downstream cartridge fluidics, a third electrolytic pump is activated to force the
elution fluid out of the blender chamber and into two downstream chambers where it
8
reconstitutes lyophilized amplification reaction reagents. After reconstitution, the third
electrolytic pump is activated again to push the reconstituted reaction master-mix through
one-way passive valves into the amplification reaction chambers, where the reaction
mixture is heated and isothermal DNA amplification can occur. During this process, the
upstream active valve is turned to the completely closed position, to separate the
upstream sample preparation fluidics from the downstream amplification and detection
areas. After amplification, two new electrolytic pumps (one for each reaction chamber)
push the amplified master-mix through one-way passive valves onto lateral flow strips,
where amplified product can be visually detected by the user as colored lines on the
lateral flow strips. The entire process from sample preparation through amplification and
detection in the cartridge is anticipated to be completed in approximately 60-90 minutes.
During the design and development of this integrated cartridge, we decided to
initially divide the fully integrated system into two subsystems: one sample preparation
module and one amplification and detection module.
Thesis Scope
The focus of this thesis is the development of the amplification and detection module,
which can execute isothermal amplification coupled to lateral flow detection with
required reagents stored on-board, as well as automated and integrated pumping, heating,
and timing mechanisms. In Chapter 2, we describe the development of an early prototype
for a disposable, pouch-based cartridge to automate amplification and detection, in
conjunction with a compact, inexpensive heater that contains low power electronics. In
Chapter 3, we describe a novel disposable, miniature check valve design that is suitable
for large-scale manufacturing. In Chapter 4, we describe a refined amplification and
9
detection cartridge with integrated electrolytic pumps and check valves (as described in
Chapter 3), plus an improved handheld unit that automates heating, timing and pumping
for amplification and detection process execution. In Chapter 5, we discuss the fluid
interface that will integrate the amplification and detection module with the sample
preparation module into one fully-integrated cartridge, and the development of the on-
board lyophilized master-mix reagent storage and reconstitution.
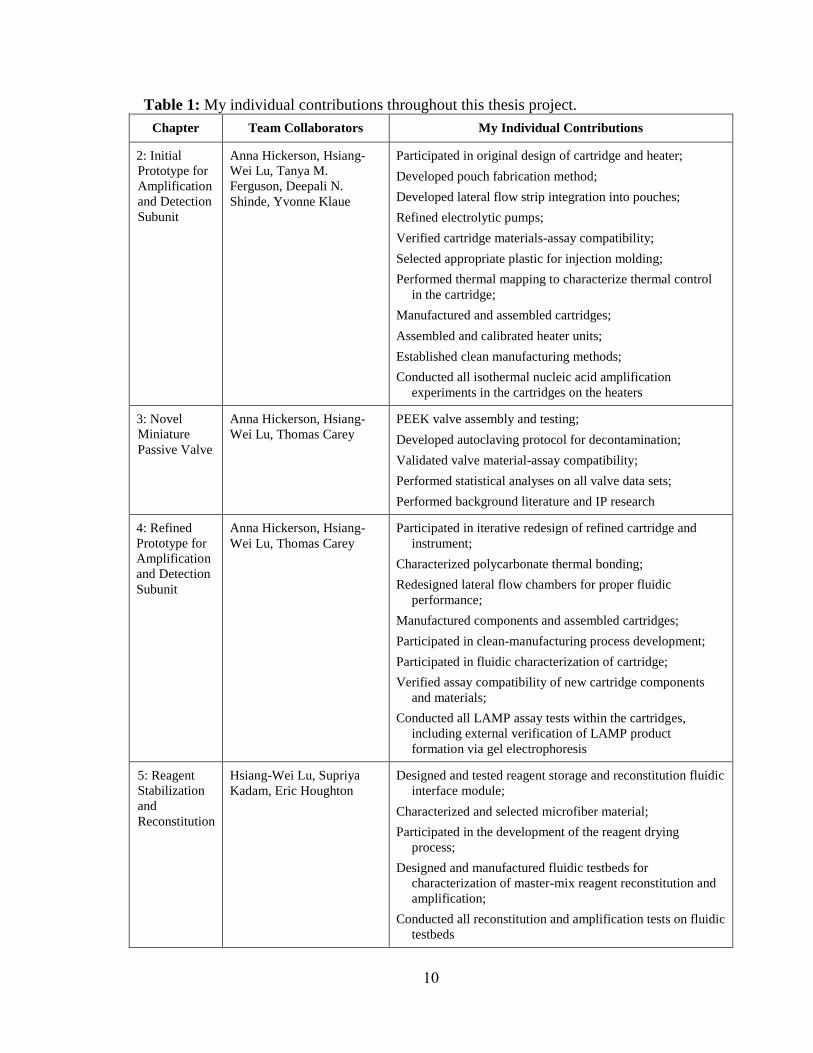
This work involves a collaborative effort, including KGI engineers (Drs. Anna
Hickerson and Hsiang-Wei Lu), KGI scientists (Drs. Supriya Kadam, Eric Houghton,
Deepali Shinde, and Yvonne Klaue), and summer undergraduate or high school research
students (Thomas Carey, Kimberly Chen, Winnie Ding and Stephanie Tan), as well as
input from Claremont BioSolutions engineers (Dr. Robert Doebler, Ryan Talbot and
Keith Harrington) and scientist (Tanya Ferguson, also from KGI). My contribution to the
work presented in each chapter is highlighted below (Table 1). An organization chart is
included in Appendix B.
10
Table 1: My individual contributions throughout this thesis project.
Chapter Team Collaborators My Individual Contributions
2: Initial
Prototype for
Amplification
and Detection
Subunit
Anna Hickerson, Hsiang-
Wei Lu, Tanya M.
Ferguson, Deepali N.
Shinde, Yvonne Klaue
Participated in original design of cartridge and heater;
Developed pouch fabrication method;
Developed lateral flow strip integration into pouches;
Refined electrolytic pumps;
Verified cartridge materials-assay compatibility;
Selected appropriate plastic for injection molding;
Performed thermal mapping to characterize thermal control
in the cartridge;
Manufactured and assembled cartridges;
Assembled and calibrated heater units;
Established clean manufacturing methods;
Conducted all isothermal nucleic acid amplification
experiments in the cartridges on the heaters
3: Novel
Miniature
Passive Valve
Anna Hickerson, Hsiang-
Wei Lu, Thomas Carey
PEEK valve assembly and testing;
Developed autoclaving protocol for decontamination;
Validated valve material-assay compatibility;
Performed statistical analyses on all valve data sets;
Performed background literature and IP research
4: Refined
Prototype for
Amplification
and Detection
Subunit
Anna Hickerson, Hsiang-
Wei Lu, Thomas Carey
Participated in iterative redesign of refined cartridge and
instrument;
Characterized polycarbonate thermal bonding;
Redesigned lateral flow chambers for proper fluidic
performance;
Manufactured components and assembled cartridges;
Participated in clean-manufacturing process development;
Participated in fluidic characterization of cartridge;
Verified assay compatibility of new cartridge components
and materials;
Conducted all LAMP assay tests within the cartridges,
including external verification of LAMP product
formation via gel electrophoresis
5: Reagent
Stabilization
and
Reconstitution
Hsiang-Wei Lu, Supriya
Kadam, Eric Houghton
Designed and tested reagent storage and reconstitution fluidic
interface module;
Characterized and selected microfiber material;
Participated in the development of the reagent drying
process;
Designed and manufactured fluidic testbeds for
characterization of master-mix reagent reconstitution and
amplification;
Conducted all reconstitution and amplification tests on fluidic
testbeds
11
CHAPTER 2: INITIAL PROTOTYPE FOR AMPLIFICATION AND
DETECTION SUBUNIT
Introduction
The key functional components of the amplificiation and detection subunit include a
double pouch system with an inner reaction pouch enclosed by a pump pouch, which is
part of the pumping mechanism to move fluid out of the reaction pouch. The reaction
pouch requires an inlet to introduce master-mix into the pouch, and an outlet that
interfaces the lateral flow strip for detection. The pump pouch is connected to an
electrolytic pump. The system is heated to a controlled and constant temperature for the
duration of the isothermal amplification reaction. While designing and demonstrating
functionality of these key components, we developed an intial disposable cartridge
prototype, in conjunction with a handheld heater prototype. We have demonstrated as
proof of principle the amplification and detection of Mycobacterium tuberculosis (M.tb)
genomic DNA in the cartridge, using either Loop Mediated Amplification (LAMP) or the
Exponential Amplification Reaction (EXPAR), both coupled to Nucleic Acid Lateral
Flow (NALF) detection.
Experimental
System Design and Operating Concept: Our system design, illustrated in Figure 2, allows
two samples to be tested simultaneously. The disposable cartridge contains on its top side
two lateral flow strips in anti-parallel orientation, two septum inlets through which
master-mix is injected, and two attachment ports for electrolytic pumps (Figure 2a). Two
reaction pouches are attached to the bottom side of the cartridge (Figure 2b), accessible
through septum inlets and outlets containing passive, one-way check valves that lead to
12
the lateral flow strips. The bottom side of the cartridge also contains two pump pouches
sealed on top of the reaction pouches, which are connected to the electrolysis chamber
ports. The electrolysis chambers and the pump pouches are filled with electrolyte solution.
During process execution, an empty cartridge is attached to the handheld, non-
disposable heating and electronics unit, where the cartridge is pre-heated to the reaction
temperature. After the cartridge has reached the appropriate operating temperature,
reaction master-mix is injected from the top (Figure 2c), through the septum inlet port,
into the reaction pouch, which initiates isothermal DNA amplification. Once the reaction
is completed, current is applied to the electrodes (Figure 2d) and the pump pouch is
pressurized with gas produced via electrolysis. The pressurized pump pouch pushes the
fluid within the reaction pouch up through the outlet port and onto the lateral flow strip.
The reaction mixture migrates along the strip through passive capillary action, wicking
across test and control areas of the strip where colored microspheres can bind, producing
a visual readout. The lateral flow strips are also sealed in pouches, ensuring that all fluids
remain sealed within the disposable cartridge, eliminating carry-over contamination of
amplicons.
13
Figure 2: Conceptual drawing of system components. (a) Cartridge viewed from the top,
showing the access ports to the reaction and pump pouches on the underside of the
cartridge (indicated in gray outline), and the position of lateral flow strips in anti-parallel
orientation. (b) Cartridge viewed from the bottom, showing the reaction pouches with
overlaid pump pouches. (c) and (d) Side view of the cartridge on the heater (not to scale),
illustrating the operating principle. (c) Master-mix is injected through the septum inlet
into the reaction pouch, and targeted DNA sequences are isothermally amplified on top of
14
the temperature-controlled heater surface. (d) Applying current to the electrolytic pump
pushes fluid into the pump pouch. The pump pouch expands, thereby compressing the
reaction pouch up against the dome-shaped recess in the cartridge, which forces fluid out
of the reaction pouch through the one-way check valve and into the lateral flow strip
pouch.
Cartridge Fabrication: The cartridge uses low-cost components and manufacturing
techniques to meet the cost constraints of POC testing performed in low-resource settings.
The main cartridge components are manufactured using injection molding and thermal
bonding, both of which are inexpensive and scalable techniques.
The body of the cartridge consists of two polypropylene cards, which were
injection molded in-house from USP Class VI polypropylene pellets (Pro-fax SR256M,
PolyOne, Inc., Rancho Cucamonga, CA) using a G-100T injection molding press from
Morgan Industries (Long Beach, CA). The cards include hollow protrusions in matching
locations, which can be joined to form fluid conduits that allow fluid to pass from the
bottom surface of the bottom card to the top surface of the top card. One-way passive
ball-and-spring valves (CCPI2510014S, the Lee Company, Westbrook, CT) were pressed
into the hollow protrusions of the bottom card, leading from the reaction pouches to the
lateral flow strip pouches (Figure 2a, check valve outlet). To create a silicone inlet
septum, short pieces of silicone cord (McMaster-Carr, Santa Fe Springs, CA) were
inserted into the hollow protrusions on the top card, serving as inlets into the reaction
pouches (Figure 2a, septum inlet). Next, 0.005 inch thick flexible polypropylene film
(Qosina, Edgewood, NY) was heat-sealed onto the bottom card to create two reaction
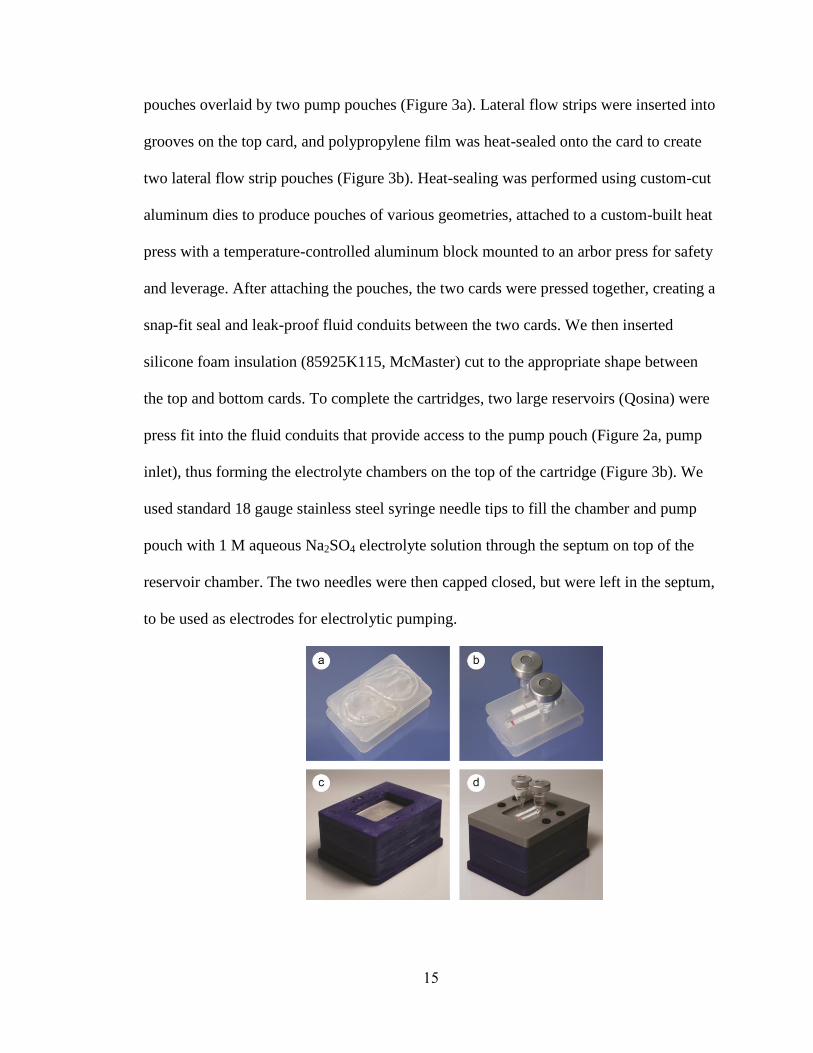
15
pouches overlaid by two pump pouches (Figure 3a). Lateral flow strips were inserted into
grooves on the top card, and polypropylene film was heat-sealed onto the card to create
two lateral flow strip pouches (Figure 3b). Heat-sealing was performed using custom-cut
aluminum dies to produce pouches of various geometries, attached to a custom-built heat
press with a temperature-controlled aluminum block mounted to an arbor press for safety
and leverage. After attaching the pouches, the two cards were pressed together, creating a
snap-fit seal and leak-proof fluid conduits between the two cards. We then inserted
silicone foam insulation (85925K115, McMaster) cut to the appropriate shape between
the top and bottom cards. To complete the cartridges, two large reservoirs (Qosina) were
press fit into the fluid conduits that provide access to the pump pouch (Figure 2a, pump
inlet), thus forming the electrolyte chambers on the top of the cartridge (Figure 3b). We
used standard 18 gauge stainless steel syringe needle tips to fill the chamber and pump
pouch with 1 M aqueous Na2SO4 electrolyte solution through the septum on top of the
reservoir chamber. The two needles were then capped closed, but were left in the septum,
to be used as electrodes for electrolytic pumping.
16
Figure 3: Cartridge and instrument. (a) Underside of cartridge, showing two reaction
pouches sealed inside two pump pouches on the bottom surface of the bottom card. (b)
Top side of cartridge: lateral flow strips are sealed inside the grooves forming the lateral
flow strip pouches, and electrolytic chambers are press-fit in place. Not shown: silicone
foam is placed between the cards, and pump chambers are filled with electrolyte solution
to complete the assembly. (c) Small portable prototype heater, which contains the control
electronics, thin-film polyimide heater, an aluminum heater surface, and thermal
insulation below the heater and around the perimeter of the area where the cartridge is
inserted. (d) Heater with a cartridge secured in place (grey lid), prior to test execution. (b)
and (d) The red line on the NALF strips represents the dry reagent formulation with
colored microspheres dispensed on the conjugate pad.
Portable Heater Fabrication: We designed and fabricated a reusable handheld instrument
(Figure 3c) to apply a precise and controlled temperature to the reaction fluid within the
disposable cartridge (Figure 3d). The set-point of the heater can be adjusted to reach the
temperature required for a particular isothermal reaction, e.g. 63 °C for LAMP and 55 °C
for EXPAR. The chassis of the heater instrument was printed with acrylonitrile butadiene
styrene (ABS) using a Dimension SST 768 fused deposition modeling machine. Thin-
film polyimide heaters (Omega) were attached to a 1/8th inch thick aluminum plate to
provide evenly-distributed heating. Polyurethane foam sealant (Dow Chemical), applied
to the surrounding area, minimizes the power required to reach and maintain the required
temperature for isothermal amplification. We controlled the temperature using a custom
printed circuit board (PCB) to adjust the power to the heaters based on feedback from a
17
thermistor embedded near the center of the top surface of the aluminum plate. The
instrument was powered by a 15 V wall transformer, using ~ 8 W during the initial ~ 3
minutes heating ramp, and ~ 0.5 W to maintain the temperature.
Thermal Control Testing and Modeling: Precise temperature control is essential for this
system, as the amplification reaction kinetics are related to assay fluid temperature. We
measured the temperature of the heater surface as a function of time using a DirecTemp
(Redfish Sensors, Meridian, ID) universal serial bus (USB) thermistor-based sensor probe.
To directly measure the temperature of the fluid in the reaction pouches as a function of
time, we inserted a thermocouple (5TC-TT-K-36-36, Omega, Stamford, CT) into the inlet
of a reaction chamber filled with water while the cartridge was attached to the heater. We
measured the cartridges under three different conditions: with empty pump pouches (no
electrolyte solution), with pump pouches filled with electrolyte solution, and with pump
pouches filled with electrolyte and a thin layer of thermal paste (OmegaTherm “201”,
Omega, Stamford, CT) applied to the underside of the cartridge on the outside of the
pump pouches.
We modeled the three-dimensional temperature profile within the system as a
function of three factors: the overall system design, the choice of materials, and the
thermal contact between cartridge and heater. Thermal simulations were performed using
COMSOL Multiphysics (Burlington, MA), based on the three-dimensional cartridge and
instrument geometry imported from Solidworks (Glendora, CA). The model treats the
thin-film heater as a two-dimensional heat source on the bottom of the aluminum heater
plate, with a specified output power. The heat conducts through the interior of the
18
cartridge and dissipates to the room-temperature environment by convection to still air
through the top surface of the cartridge, or through insulating material on the sides of the
cartridge. Convection through still air is imposed using a natural convection boundary
with a Dirichlet heat flux based on: NV = (5 W) / (m2 K). We modeled the non-ideal
thermal contact between the cartridge and the heating surface by incorporating a
thermally resistive layer.
Isothermal Amplification Reactions: For this proof of principle study, we implemented
two isothermal DNA amplification reactions in the device to detect M.tb genomic DNA,
coupled with NALF visual endpoint detection: an established and clinically validated
LAMP reaction, and an in-house developed EXPAR reaction.
For isothermal LAMP targeting the M.tb gyrB genomic region, we modified
primer sequences (Table 2Table ) and reaction conditions from Iwamoto et al.38
to work
in our system with lateral flow detection of amplified products. The 100 µL LAMP
master-mix contained 20 mM Tris-HCl, pH 7.9, 15 mM ammonium sulfate, 30 mM
potassium chloride, 0.005% Triton X-100, 2 mM magnesium chloride, 2 mM magnesium
sulfate, 400 µM each dNTP (Fermentas, Glen Burnie, Maryland), 1 M betaine, 200
µg/mL bovine serum albumin, 2.4 µM Forward Inner Primer (FIP), 1.6 µM Backward
Inner Primer (BIP, DIG-labeled), 0.2 µM of each outer primer (F3 and B3), 0.4 µM
biotinylated Forward Loop Primer (bio-LF), 0.8 µM Backward Loop Primer (LB), and 20
U of Bst DNA Polymerase large fragment (New England BioLabs, Ipswich, MA). Each
reaction further contained 10 ng human genomic DNA (Promega, Madison, WI) as
general background. Positive reactions contained 3000 copies of M.tb H37Ra genomic
19
DNA (ATCC, Manassas, VA) as the template, which was omitted in the No Template
Control (NTC) negative reactions. To characterize the assay performance, LAMP
reactions were amplified on a thermocycler set to 63 °C for the same time period as was
used for amplification in the cartridges. Amplified LAMP master-mix was then analyzed
using gel electrophoresis on a 2 % eGel (Invitrogen, Life Technologies, Carlsbad, CA).
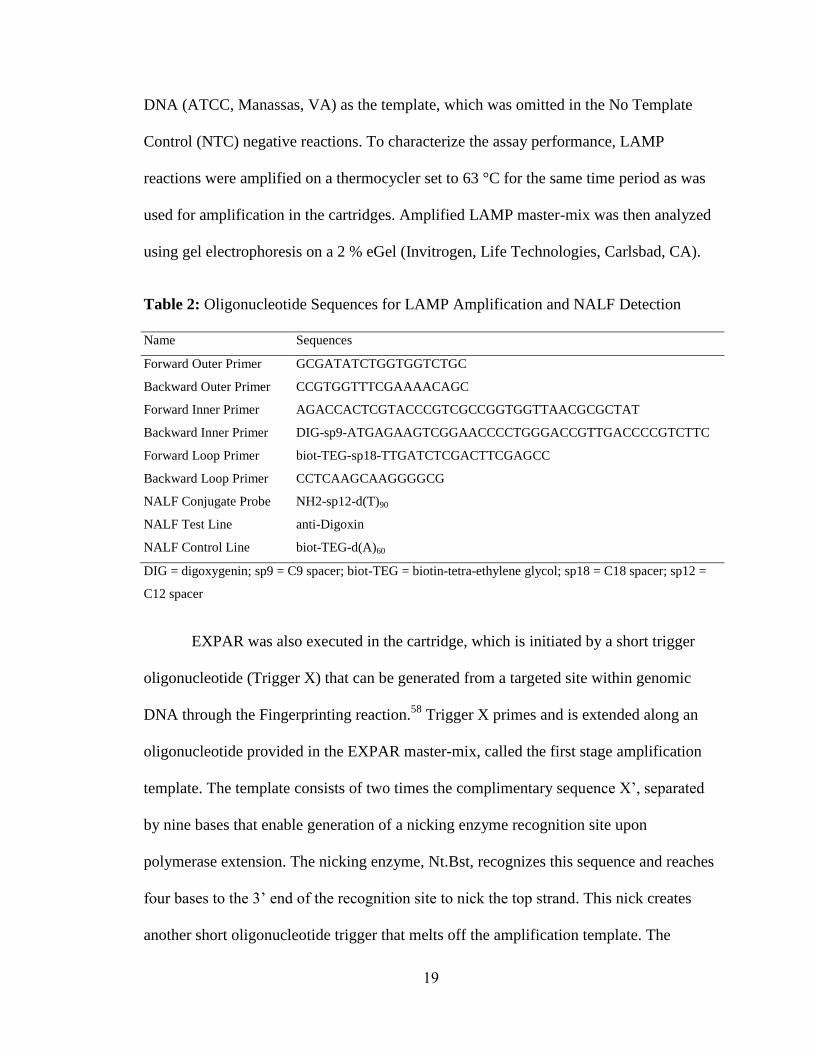
Table 2: Oligonucleotide Sequences for LAMP Amplification and NALF Detection
Name Sequences
Forward Outer Primer
Backward Outer Primer
Forward Inner Primer
Backward Inner Primer
Forward Loop Primer
Backward Loop Primer
NALF Conjugate Probe
NALF Test Line
NALF Control Line
GCGATATCTGGTGGTCTGC
CCGTGGTTTCGAAAACAGC
AGACCACTCGTACCCGTCGCCGGTGGTTAACGCGCTAT
DIG-sp9-ATGAGAAGTCGGAACCCCTGGGACCGTTGACCCCGTCTTC
biot-TEG-sp18-TTGATCTCGACTTCGAGCC
CCTCAAGCAAGGGGCG
NH2-sp12-d(T)90
anti-Digoxin
biot-TEG-d(A)60
DIG = digoxygenin; sp9 = C9 spacer; biot-TEG = biotin-tetra-ethylene glycol; sp18 = C18 spacer; sp12 =
C12 spacer
EXPAR was also executed in the cartridge, which is initiated by a short trigger
oligonucleotide (Trigger X) that can be generated from a targeted site within genomic
DNA through the Fingerprinting reaction.58
Trigger X primes and is extended along an
oligonucleotide provided in the EXPAR master-mix, called the first stage amplification
template. The template consists of two times the complimentary sequence X’, separated
by nine bases that enable generation of a nicking enzyme recognition site upon
polymerase extension. The nicking enzyme, Nt.Bst, recognizes this sequence and reaches
four bases to the 3’ end of the recognition site to nick the top strand. This nick creates
another short oligonucleotide trigger that melts off the amplification template. The
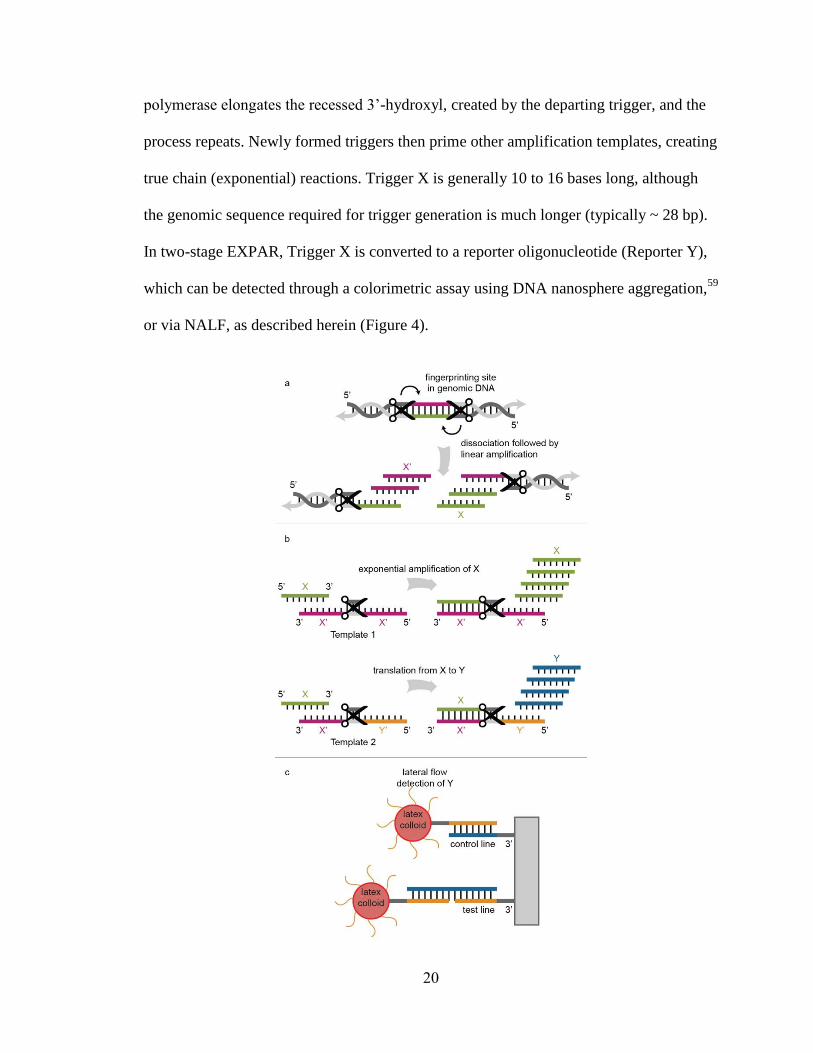
20
polymerase elongates the recessed 3’-hydroxyl, created by the departing trigger, and the
process repeats. Newly formed triggers then prime other amplification templates, creating
true chain (exponential) reactions. Trigger X is generally 10 to 16 bases long, although
the genomic sequence required for trigger generation is much longer (typically ~ 28 bp).
In two-stage EXPAR, Trigger X is converted to a reporter oligonucleotide (Reporter Y),
which can be detected through a colorimetric assay using DNA nanosphere aggregation,59
or via NALF, as described herein (Figure 4).
21
Figure 4: Conceptual depictions of EXPAR reactions and coupling the amplification
products with NALF. (a) First-stage EXPAR, where Trigger X primes and is extended
along a template provided in the EXPAR master-mix. (b) Second-stage EXPAR
illustrating Trigger X converting to a reporter oligonucleotide (Reporter Y). (c) NALF
coupled to second-stage EXPAR, where the Reporter Y oligonucleotide binds DNA-
functionalized microspheres and DNA hybridized on the nitrocellulose at the test line,
resulting in a visible test line. This binding is dependent on the presence of Reporter Y,
so the test line will only be present in positive samples. Additional DNA functionalized
on the microspheres will bind DNA hybridized on the nitrocellulose at the control line,
resulting in a visible line. The binding at the control line is independent of the presence of
Reporter Y, and, therefore, acts as an indicator of proper lateral flow function.
EXPAR was carried out in a reaction mixture containing 0.3 units/µL Nt Bst
nicking enzyme (New England Biolabs, Ipswich, MA), 0.03 units/µL Bst polymerase
(NEB), 0.24 mM dNTPs (Fermentas, Glen Burnie, Maryland), 1.6 mg/mL bovine serum
albumen (New England Biolabs), 3 mM magnesium chloride (Sigma-Aldrich, St. Louis,
MO), 1x SYBR Green I (Invitrogen), 20mM Tris pH 7.9, 15mM ammonium sulfate,
30mM potassium chloride, 0.005% Triton X-100, 1.6 mg/mL BSA, 25 nM first stage
EXPAR template, and 50 nM second stage EXPAR template. Positive reactions
contained 6x10⁵ copies of M.tb H37Ra genomic DNA, but not in the no trigger control
(NTC) negative reactions. Template and trigger sequences are shown in Table 3. Each
reaction further contained 10 ng human genomic DNA (Promega, Madison, WI) per
reaction as general background. In parallel with experiments performed on the cartridges,
22
positive and negative control reactions (75 μL volume) were amplified in a Bio-Rad
(Hercules, CA) MJ Opticon II real-time thermocycler set to a constant temperature of
55 °C, and the fluorescence intensity was monitored in 10 second intervals using
excitation at 488 nm over a period of up to 2 hours to verify reaction kinetics.
NALF Test Strip Fabrication: LAMP-NALF test strips were fabricated in-house, using
the probe and control oligonucleotides shown in Table 2, synthesized by Eurofins MWG
Operon (Huntsville, AL). Oligo d(T)90 and neutravidin were conjugated respectively to
red-dyed carboxylate modified polystyrene microspheres (0.4 µm; Thermo Fisher
Scientific) using 1-Ethyl-3-[3-dimethylaminopropyl] carbodiimide hydrochloride (EDC)
as the cross-linker. Following the conjugation process, the microspheres were re-
suspended and stored in 50 mM Sodium Borate, pH 8.4, at a final microsphere
concentration of 1%. The anti-Digoxin antibody (MyBioSource, San Diego, CA) was
diluted to 1 mg/ml in 10 mM Tris, pH 7.4, plus 5% ethanol and the biotinylated control
line d(A)60 oligonucleotide was coupled to neutravidin at room temperature. Both were
then dispensed as even and reproducible lines onto a nitrocellulose membrane (Sartorius,
Goettingen, Germany) using a lateral flow reagent dispenser (ALFRD 07.711.01,
Claremont BioSolutions, Upland, CA). After dispensing the capture antibody and the
control line oligonucleotide probe, the nitrocellulose was dried at room temperature for at
least 30 minutes, and was subsequently stored in a sealed, desiccated, moisture-barrier
pouch.
EXPAR-NALF test strips were also fabricated in-house, using the probe, test, and
control oligonucleotides shown in Table 3, obtained from Operon Biotechnologies
23
(Huntsville, AL). Red-dyed carboxylate-modified polystyrene microspheres
(ThermoFisher Scientific) were covalently coupled to the amine modified probe
oligonucleotide, using Ethyl-N′-(3-dimethylaminopropyl) carbodiimide hydrochloride
(EDAC, Sigma, St. Louis, MO) under conditions adapted from Spiro et al.60
Following
the conjugation process, the microspheres were re-suspended and stored in 50mM
Sodium Borate, pH 8.4 at a final microsphere concentration of 1%. The biotinylated test
and control oligonucleotides were coupled to Neutravidin at room temperature and then
dispensed as even and reproducible lines onto a nitrocellulose membrane (Sartorius,
Goettingen, Germany) using an in-house manufactured reagent dispenser. Following
dispensing, the nitrocellulose was allowed to dry at room temperature for at least 30
minutes, and was subsequently stored in a sealed desiccated moisture barrier pouch.
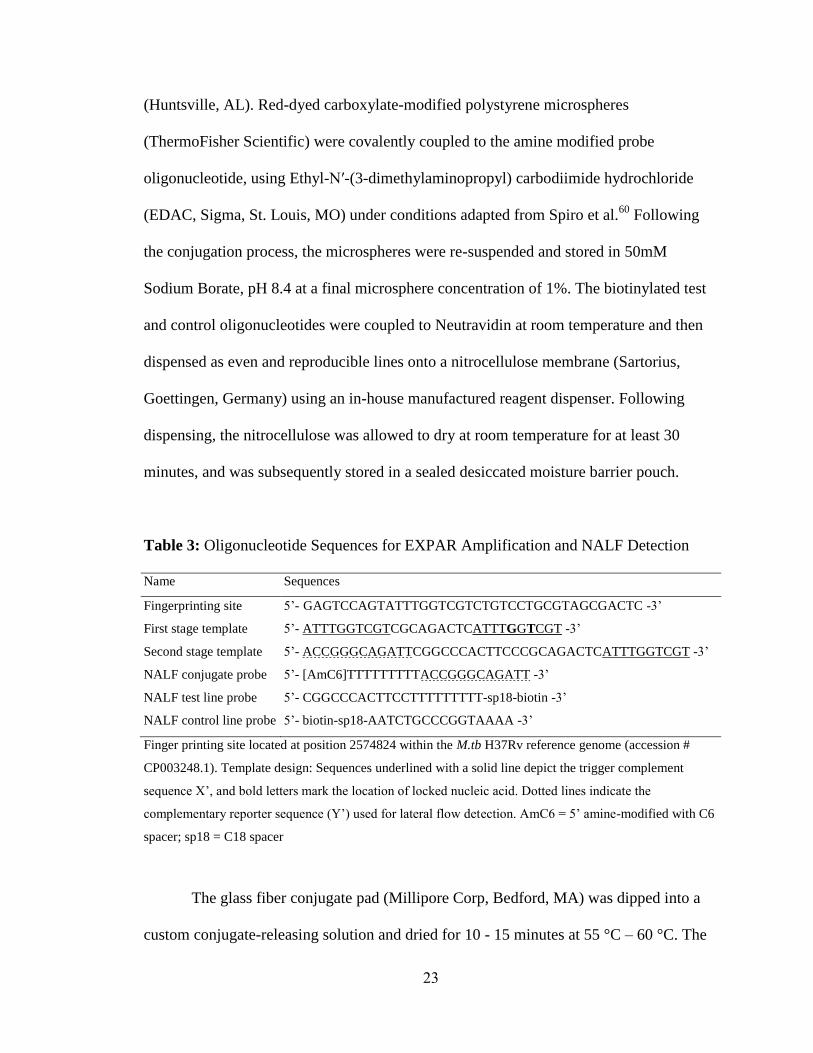
Table 3: Oligonucleotide Sequences for EXPAR Amplification and NALF Detection
Name Sequences
Fingerprinting site
First stage template
Second stage template
NALF conjugate probe
NALF test line probe
NALF control line probe
5’- GAGTCCAGTATTTGGTCGTCTGTCCTGCGTAGCGACTC -3’
5’- ATTTGGTCGTCGCAGACTCATTTGGTCGT -3’
5’- ACCGGGCAGATTCGGCCCACTTCCCGCAGACTCATTTGGTCGT -3’
5’- [AmC6]TTTTTTTTTACCGGGCAGATT -3’
5’- CGGCCCACTTCCTTTTTTTTT-sp18-biotin -3’
5’- biotin-sp18-AATCTGCCCGGTAAAA -3’
Finger printing site located at position 2574824 within the M.tb H37Rv reference genome (accession #
CP003248.1). Template design: Sequences underlined with a solid line depict the trigger complement
sequence X’, and bold letters mark the location of locked nucleic acid. Dotted lines indicate the
complementary reporter sequence (Y’) used for lateral flow detection. AmC6 = 5’ amine-modified with C6
spacer; sp18 = C18 spacer
The glass fiber conjugate pad (Millipore Corp, Bedford, MA) was dipped into a
custom conjugate-releasing solution and dried for 10 - 15 minutes at 55 °C – 60 °C. The
24
conjugated polystyrene microspheres were then dispensed as a line onto the conjugate
pad using the reagent dispenser set to a flow rate of 7 µl/cm. The conjugate pad was dried
for 5 minutes at 55 °C – 60 °C, and then stored in a sealed, desiccated, moisture-barrier
pouch.
To prepare test strips, we mounted the dispensed nitrocellulose membrane to an
adhesive plastic backing (G & L Precision Die Cutting, San Jose, CA). The treated glass
fiber conjugate pad and a cellulose fiber absorbent pad (Millipore Corp.) were
respectively attached to the bottom (sample) and the top portions of the adhesive backing,
each with a 1 - 2 mm overlap with the nitrocellulose membrane. The resulting sheet was
cut into 4 mm x 50 mm individual test strips for assembly into the cartridge.
Amplification and Detection in the Cartridge: For amplification and detection in the
cartridge, we pre-heated the empty cartridge on the heater for 10 minutes. In LAMP
cartridges, LAMP master-mix solutions for the positive and NTC reactions (100 µl each)
were then injected into the reaction pouches, and amplified on the heater for 10 minutes.
In EXPAR cartridges, EXPAR master-mix solutions for the positive and NTC reactions
(75 µl each) were then injected into the reaction pouches, and amplified on the heater for
60 minutes. For all cartridges, electrolytic pumping was initiated after heating to push the
amplified master-mixes out of the reaction pouches and into the lateral flow pouches,
where the samples migrated along the NALF strips. The results were visually interpreted
by reading the test and control lines 10 minutes after pumping was initiated.
25
Results and Discussion
Fluidic Control: This cartridge utilizes electrolytic pumping and therefore does not
require external pistons or actuators, as opposed to other clinical diagnostic systems using
flexible pouches.21,22,28
Similar to previous reports,53
we have observed a roughly linear
relationship between applied current and flow rate for electrolytic pumping. To ensure
that the lateral flow strips perform properly, we determined that amplified master-mix
needs to be pumped from the reaction chamber into the lateral flow strip chamber at a
flow rate of approximately 100 µL/min, which was obtained by applying 50 mA of
current.
One-way valves are necessary to prevent the fluid within the reaction chamber
from leaking prematurely into the lateral flow detection chamber. Injecting 75-100 µL
liquid into the reaction chamber results in < 2 PSI fluid pressure, which is less than the
cracking pressure of the valves (~ 2 PSI) used in the current design. Therefore, fluid is
retained in the reaction pouch until electrolytic pumping forces the fluid through the
valve and onto the lateral flow strip.
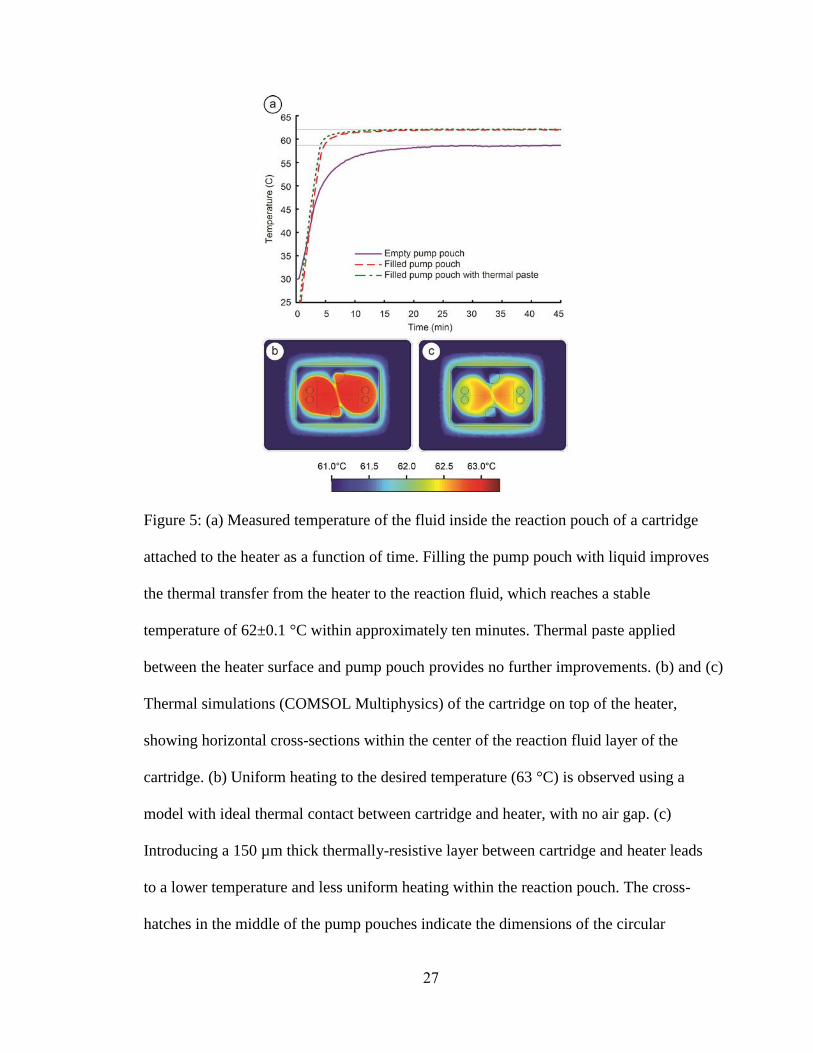
Instrument Design and Thermal Control: Maintaining an appropriate and uniform
temperature throughout the reaction pouch during the amplification period is essential for
assay performance. With a cartridge inserted into the device, the heater surface requires
approximately three minutes to heat from room temperature to 63 °C, and maintains this
constant temperature to within ±0.1 °C for as long as the heater is turned on. Comparable
temperature stability is obtained at other temperatures, e.g. 55 °C required for EXPAR.
26
Air trapped between the fluid inside the reaction pouch and heater surface significantly
lowers the thermal conductivity across this interface, and can contribute to non-uniform
fluid heating within the reaction pouch. This concern can be mitigated by filling the
pump pouch with fluid. The slightly inflated pump pouch presses up against the heater
surface, which compensates for imperfections on the cartridge bottom surface that
prevent the cartridge from sitting completely flat on the heater. Additionally, the fluid in
the pump pouch effectively conducts heat to the reaction pouch. We measured the
temperature of liquid in the reaction pouch using a thermocouple inserted through the
inlet septum. If the pump pouch is empty, then the fluid temperature in the reaction pouch
deviates significantly from the temperature measured directly on the heater surface
underneath the cartridge (Figure 5a). Filling the pump pouch improves the thermal
transfer efficiency between heater surface and cartridge, resulting in temperature
equilibration after ~ 10 minutes, and a final temperature closer to the desired set-point.
Thermal paste applied between the heater surface and pump pouch provides no further
improvements.
27
Figure 5: (a) Measured temperature of the fluid inside the reaction pouch of a cartridge
attached to the heater as a function of time. Filling the pump pouch with liquid improves
the thermal transfer from the heater to the reaction fluid, which reaches a stable
temperature of 62±0.1 °C within approximately ten minutes. Thermal paste applied
between the heater surface and pump pouch provides no further improvements. (b) and (c)
Thermal simulations (COMSOL Multiphysics) of the cartridge on top of the heater,
showing horizontal cross-sections within the center of the reaction fluid layer of the
cartridge. (b) Uniform heating to the desired temperature (63 °C) is observed using a
model with ideal thermal contact between cartridge and heater, with no air gap. (c)
Introducing a 150 µm thick thermally-resistive layer between cartridge and heater leads
to a lower temperature and less uniform heating within the reaction pouch. The cross-
hatches in the middle of the pump pouches indicate the dimensions of the circular
28
reaction pouches. An air bubble was intentionally introduced into the outlet port of the
reaction chamber to simulate air trapped in the reaction pouches after fluid is inserted.
Using our mathematical model, we found that the temperature within the reaction
pouches deviated from 63 °C by less than 0.5 °C throughout the reaction chamber if the
cartridge makes ideal contact with the heater surface (Figure 5b). To understand the
effects of non-ideal thermal contact, we modeled the system with a 150 µm thick
thermally-resistive air layer between the pump pouches and the heater surface (Figure 5c).
This resistive layer significantly reduced the heat transfer between the heater and
cartridge, decreasing the maximum temperature in the reaction pouches by 1 °C, and
leading to more significant temperature variation throughout the reaction pouch.
Isothermal Amplification Methods: We designed out system to work with any isothermal
amplification method coupled to lateral flow, to detect genetic material of any disease.
For preliminary studies, we have decided to run two amplification methods targeting M.tb
genomic DNA: LAMP and EXPAR. These reactions have distinct advantages and
disadvantages in terms of integration into the cartridges. For example, in previous work
we optimized coupling EXPAR amplification to NALF detection.61
Therefore, for
EXPAR implementation in the cartridges, we needed to design EXPAR templates for
detection of M.tb genomic DNA, and demonstrate target amplification with NALF
detection. On the other hand, a LAMP assay was previously clinically-validated in
another lab for the detection of M.tb.38
Consequently, for LAMP implementation in the
cartridges, we needed to develop a method for coupling LAMP to NALF, as described
29
below. By using two different amplification methods coupled to lateral flow detection,
we are able to demonstrate proof of concept for the cartridge and handheld heater system
as a platform technology which could be modified for other applications.
Lateral Flow Detection on Cartridge: The cartridge was designed to run two samples per
cartridge. This dual-processing design could increase throughput by allowing for multiple
simultaneous tests, or could allow for duplicate testing on one cartridge from the same
original sample.
Additionally, the lateral flow strips were positioned in anti-parallel orientation on
the top surface of the cartridge. This design was developed as a way to best use the
footprint of the cartridge top surface while also utilizing the existing inlet and outlet fluid
conduits between the top and bottom cartridge pieces. The lateral flow strips were
modified to be shorter (~ 4 cm) than standard lateral flow strips (~ 5 cm), to facilitate
installation on the cartridges. By orienting the strips anti-parallel, we were able to fix the
lateral flow strip pouches over outlet fluid conduit, to connect directly with the reaction
pouch chamber, but without covering the matching inlet fluid conduit to the other
reaction pouch chamber on the opposite end of the cartridge.
Isothermal Amplification Coupled to NALF Detection: To establish proof of principle
that isothermal amplification coupled to lateral flow detection can be executed in the
cartridge on the heater device, we chose two isothermal amplification reactions that
detect M.tb genomic DNA as the target. The first reaction is an established, clinically-
validated LAMP assay that has been used for TB diagnosis in low resource settings.38,39
30
We have modified this assay to enable coupling with NALF detection (Figure 6).
Coupling LAMP to NALF has been demonstrated for other assays,46
but the complicated,
large amplicon structure can cause steric hindrance that may result in compromised line
intensities and test results.
Figure 6: Conceptual depiction of NALF detection coupled to LAMP. (a) Amplified
master-mix applied to the conjugate pad enables amplicons to interact with colored
polystyrene microspheres functionalized with appropriate capture moieties. (b) After
migrating along the nitrocellulose membrane, microspheres carrying amplicons are
captured at the test line. (c) At the control line, microspheres are captured irrespective of
the presence of amplicon.
Our approach for LAMP amplicon detection via NALF uses a somewhat different
reaction scheme than that described for coupling EXPAR to NALF. In positive reactions,
the LAMP master-mix contained biotin/DIG-labeled amplicons. Through the biotin
moiety, amplicons were captured by the neutravidin-conjugated microspheres. After
migrating along the nitrocellulose strip, microspheres carrying LAMP amplicons were
captured at the test line (T), based on the interaction between the DIG-labeled portion of
31
the LAMP product and the immobilized anti-DIG antibody (Figure 6b). At the control
line (C), the oligo-d(A) immobilized on the nitrocellulose membrane hybridized to the
oligo-d(T) conjugated to the microspheres (Figure 6c). This control line confirms proper
performance of the lateral flow strip, and should appear in positive and negative reactions
as hybridization is independent of the presence of LAMP amplicons. In contrast, the test
line should only appear in positive reactions. In addition, many NALF reactions require
an extra liquid running buffer, which introduces another reagent and complicates the
device design. In our LAMP-NALF scheme, amplified master-mix can be applied
directly to the conjugate pad of the NALF strip, where it reconstituted a dry reagent
mixture containing colored microspheres. No other liquid reagents are required other than
the amplified master-mix.
The second assay used herein is EXPAR, which amplifies short trigger
oligonucleotides at 55 °C using polymerase and nicking enzyme activities.58
In prior
work, we have demonstrated that the trigger oligonucleotide amplified in EXPAR can be
generated from a targeted genomic DNA sequence that contains adjacent nicking enzyme
recognition sites through the Fingerprinting reaction,61
and have implemented EXPAR in
a two-stage reaction format to generate a reporter oligonucleotide that can be detected via
a nanosphere based colorimetric readout.59
We detected M.tb genomic DNA through a
Fingerprinting two-stage EXPAR assay with NALF-based readout. Two-stage EXPAR
generates large amounts of single-stranded reporter oligonucleotide Y that can form a
sandwich complex with complementary probe oligonucleotides conjugated to
microspheres and to the test line of a NALF strip (Figure 4c). Therefore, the test line
becomes visible in positive reactions. The probe oligonucleotide immobilized at the
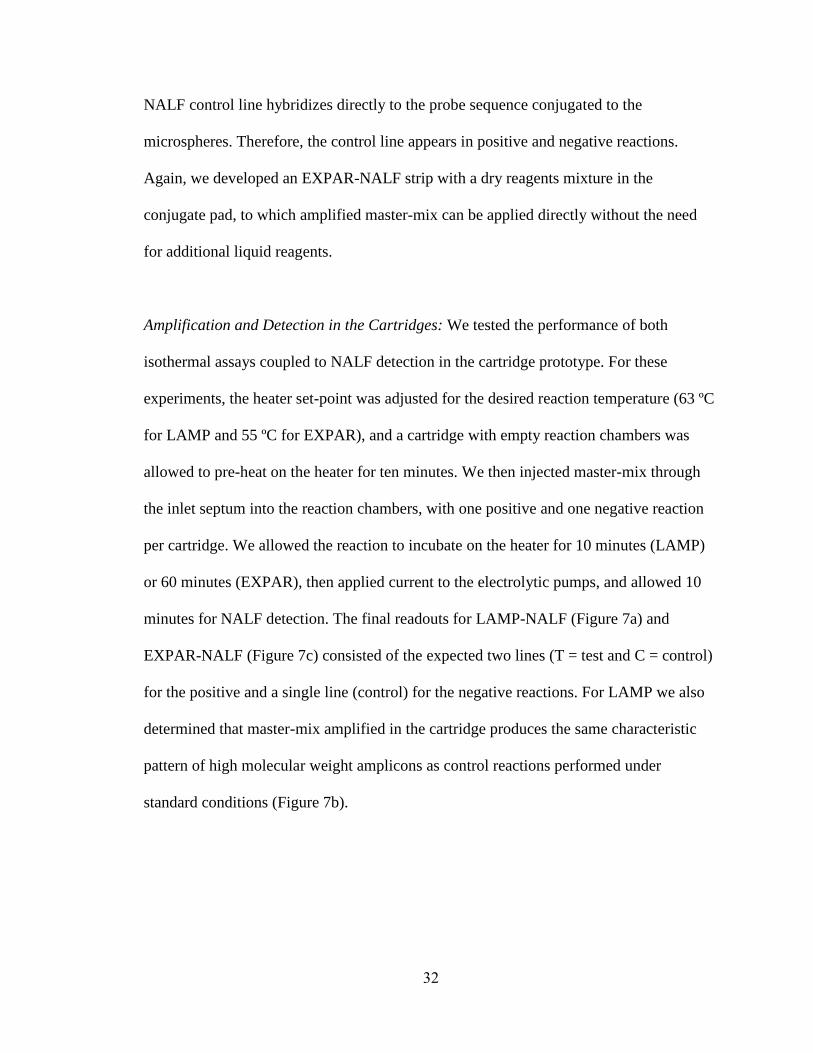
32
NALF control line hybridizes directly to the probe sequence conjugated to the
microspheres. Therefore, the control line appears in positive and negative reactions.
Again, we developed an EXPAR-NALF strip with a dry reagents mixture in the
conjugate pad, to which amplified master-mix can be applied directly without the need
for additional liquid reagents.
Amplification and Detection in the Cartridges: We tested the performance of both
isothermal assays coupled to NALF detection in the cartridge prototype. For these
experiments, the heater set-point was adjusted for the desired reaction temperature (63 ºC
for LAMP and 55 ºC for EXPAR), and a cartridge with empty reaction chambers was
allowed to pre-heat on the heater for ten minutes. We then injected master-mix through
the inlet septum into the reaction chambers, with one positive and one negative reaction
per cartridge. We allowed the reaction to incubate on the heater for 10 minutes (LAMP)
or 60 minutes (EXPAR), then applied current to the electrolytic pumps, and allowed 10
minutes for NALF detection. The final readouts for LAMP-NALF (Figure 7a) and
EXPAR-NALF (Figure 7c) consisted of the expected two lines (T = test and C = control)
for the positive and a single line (control) for the negative reactions. For LAMP we also
determined that master-mix amplified in the cartridge produces the same characteristic
pattern of high molecular weight amplicons as control reactions performed under
standard conditions (Figure 7b).
33
Figure 7: Amplification results. (a) LAMP based detection of M.tb genomic DNA
performed in the cartridge on the instrument: NALF strips of two representative
cartridges, after 10 minutes of isothermal amplification, followed by 10 min for lateral
flow detection. (b) LAMP master-mix amplified in the cartridge on the heater, analyzed
via gel electrophoresis (Lanes 1 and 2), compared to amplification performed in reaction
tubes on a standard heat block (Lanes 3 and 4). Lane 5: DNA molecular weight markers.
For (a) and (b), positive (+) reactions show LAMP product starting from 3000 copies of
M.tb DNA, and negative (-) reactions show no product since no M.tb DNA was added to
the reaction. (c) EXPAR based detection of M.tb genomic DNA performed in the
cartridge on the instrument: NALF strips of two representative cartridges, after 60
minutes of isothermal amplification, followed by 10 min for lateral flow detection.
Positive (+) reactions contained 6x10⁵ copies M.tb DNA, and negative (-) reactions
contained no M.tb DNA.
For LAMP, positive reactions contained 3000 copies of M.tb genomic DNA,
while for EXPAR, positive reactions contained 6x10⁵ copies of M.tb genomic DNA.
Relatively high concentrations of target genomic DNA were chosen as a means of
establishing proof of principle for the cartridge prototype. The goal of the study reported
34
herein was not to test the limit of detection for the assays. In both cases, negative
reactions contained no M.tb genomic DNA, but all reactions included 10 ng human
genomic DNA, which is present as background in clinical samples. The assays are not
cross-reactive with human genomic DNA. LAMP produced results after 10 minutes of
isothermal amplification, likely due to the relatively high starting copy number.38
The
EXPAR assay, which still needs to be optimized, required longer amplification under the
current reaction conditions.
Conclusions
Using the system and assay reported herein, we have demonstrated detection of
purified M.tb genomic DNA through isothermal LAMP and EXPAR reactions coupled
with NALF in a fully-enclosed combined format. Through this early prototype, we
obtained suitable thermal control, and have established proof of principle for the novel
fluid handling approach using two-layer pouches combined with one-way valves and
electrolytic pumping. This system is capable of executing different isothermal
amplification reactions coupled with NALF detection, such as the LAMP and EXPAR
assays described herein.
This system was developed as a step towards the goal of enabling point-of-care
infectious disease diagnosis in low-resource settings. We are refining the design of this
amplification and detection subunit62
(Chapter 4) to incorporate miniaturized and
integrated electrolytic pumps and novel passive valves63
(Chapter 3), and to enable
automated pumping, heating, and timing.
35
CHAPTER 3: NOVEL MINIATURE PASSIVE VALVE
Introduction
Valves are an essential component for the control and manipulation of fluids. Many
passive and active valve designs exist, each with their own advantages and limitations.64-
68 The small passive valves presented in this paper offer a combination of attributes not
readily met by commercially available stand-alone passive valves, such as ball-and-
spring, duckbill, and umbrella valves. These attributes include small dead volume,
selectable non-zero cracking pressure, and the ability to be mass manufactured at low
cost. Valves used in medical diagnostics and devices also have to be compatible with
certain biomaterials, such as enzymes and other reagents used in clinical diagnostic
applications.68-70
Our disposable cartridges for point-of-care nucleic acid testing require
passive check valves with the attributes mentioned above.62
None of the currently
available commercial options were able to meet all our desired criteria. For example, the
Lee Company (Westbrook, CT) produces a ball-and-spring valve that meets all the
physical requirements but is cost prohibitive. The remaining valve options all had
recommended installation configurations that created a dead volume too large for a
typical diagnostic assay, among other challenges.
Specialized valves made using microfabrication techniques,67,71-76
such as
photolithography, can be very small and often have negligible dead volumes. However,
these techniques require the valve to be, at least in part, fabricated in the same way and at
the same time as the system with which it is integrated. This limits the design options
greatly. Furthermore, linking macro and micro volumes in microfabricated designs is a
significant challenge, one that is essential for diagnostic systems that require large initial
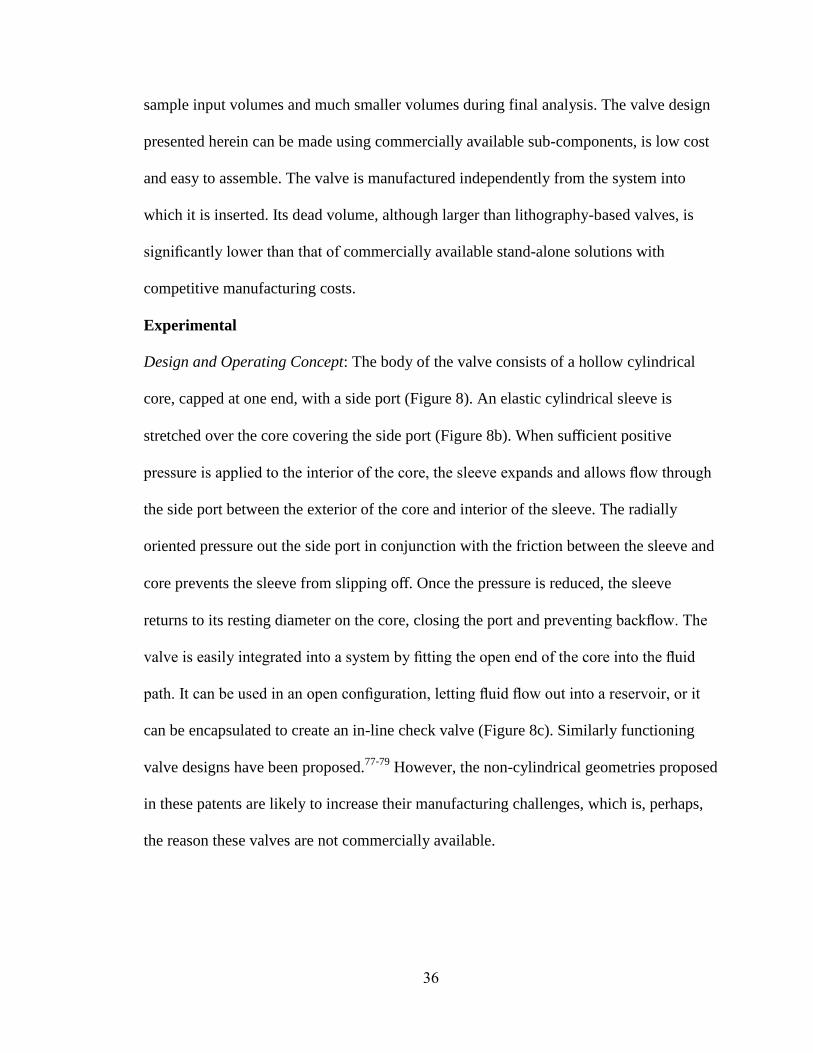
36
sample input volumes and much smaller volumes during final analysis. The valve design
presented herein can be made using commercially available sub-components, is low cost
and easy to assemble. The valve is manufactured independently from the system into
which it is inserted. Its dead volume, although larger than lithography-based valves, is
significantly lower than that of commercially available stand-alone solutions with
competitive manufacturing costs.
Experimental
Design and Operating Concept: The body of the valve consists of a hollow cylindrical
core, capped at one end, with a side port (Figure 8). An elastic cylindrical sleeve is
stretched over the core covering the side port (Figure 8b). When sufficient positive
pressure is applied to the interior of the core, the sleeve expands and allows flow through
the side port between the exterior of the core and interior of the sleeve. The radially
oriented pressure out the side port in conjunction with the friction between the sleeve and
core prevents the sleeve from slipping off. Once the pressure is reduced, the sleeve
returns to its resting diameter on the core, closing the port and preventing backflow. The
valve is easily integrated into a system by fitting the open end of the core into the fluid
path. It can be used in an open configuration, letting fluid flow out into a reservoir, or it
can be encapsulated to create an in-line check valve (Figure 8c). Similarly functioning
valve designs have been proposed.77-79
However, the non-cylindrical geometries proposed
in these patents are likely to increase their manufacturing challenges, which is, perhaps,
the reason these valves are not commercially available.
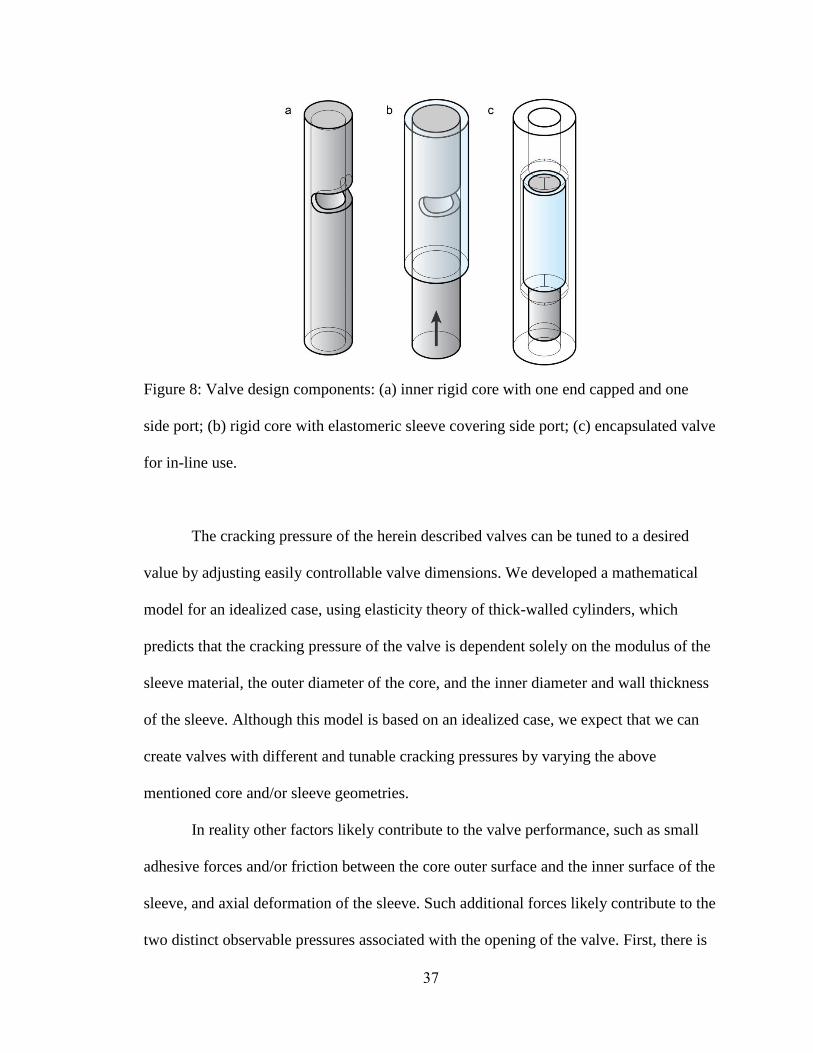
37
Figure 8: Valve design components: (a) inner rigid core with one end capped and one
side port; (b) rigid core with elastomeric sleeve covering side port; (c) encapsulated valve
for in-line use.
The cracking pressure of the herein described valves can be tuned to a desired
value by adjusting easily controllable valve dimensions. We developed a mathematical
model for an idealized case, using elasticity theory of thick-walled cylinders, which
predicts that the cracking pressure of the valve is dependent solely on the modulus of the
sleeve material, the outer diameter of the core, and the inner diameter and wall thickness
of the sleeve. Although this model is based on an idealized case, we expect that we can
create valves with different and tunable cracking pressures by varying the above
mentioned core and/or sleeve geometries.
In reality other factors likely contribute to the valve performance, such as small
adhesive forces and/or friction between the core outer surface and the inner surface of the
sleeve, and axial deformation of the sleeve. Such additional forces likely contribute to the
two distinct observable pressures associated with the opening of the valve. First, there is
38
an initial pressure spike indicating the true cracking pressure, where the pressure inside
the valve core is large enough to stretch the sleeve open, releasing the dead-air trapped
inside the valve core. We refer to this initial spike as the valve cracking pressure. After
this initial pressure spike, there is a lower pressure associated with maintaining the valve
in the open position. We refer to this pressure as the sustained open pressure.
Valve Fabrication: According to our model, the valve cracking pressure depends
predominantly on the diameters of the core and sleeve, which are made from rigid and
elastic tubing readily available with precise diameters at low costs. The tolerances on
other features, such as the geometry of the side port, length of the sleeve, or position of
the sleeve, depend mainly on additional considerations such as valve seating and method
of insertion into the final device. The tolerances for these other parameters are larger than
the needed tolerances for core OD, sleeve ID, and sleeve wall thickness, which simplifies
valve manufacturing and assembly, since these other features of the valve are
substantially more expensive to manufacture to the same precision.
Two different embodiments of the valve were assembled and tested (Figure 9).
The first valve consisted of a core that was fabricated from stainless steel hypodermic
tubing (Small Parts, Inc), sliced into short sections using a cutting wheel on a rotary tool.
We then cut a notch on the side into each core tubing segment to create the side port, and
sealed one end of each segment with UV curing glue (KOA 300, Kemxert Co.) or with
melted polycarbonate. The valve sleeve was made from silicone tubing (VWR
International, LLC), which was pushed over the core, covering the side port. A puff of air
was injected into the valve to inflate the sleeve tubing above the cracking pressure. This
39
relieved any axial deformation that may have occurred while placing the sleeve on the
core. Excess silicone was cut away with scissors. We fabricated two sets of test valves
using this method, with alternate dimensions for the core and sleeve (Table 4).
The second valve embodiment consisted of a core fabricated from PEEK tubing (Zeus
Inc.), sliced into short segments using a razor blade. We then cut a notch into the side,
and sealed one end of the core by melting the PEEK material. The valve sleeve was made
by casting silicone (R 1328, Silpak Inc.) into short cylinders with varying inner diameters
and wall thicknesses. These sleeves were then pushed over the PEEK core, covering the
side port. As for the previous design, a puff of air was injected into the valve to relieve
any axial deformation of the sleeve. We fabricated several sets of test valves with
constant core dimensions and sleeve wall thickness, but with varying sleeve inner
diameters (Table 4, Figure 9).
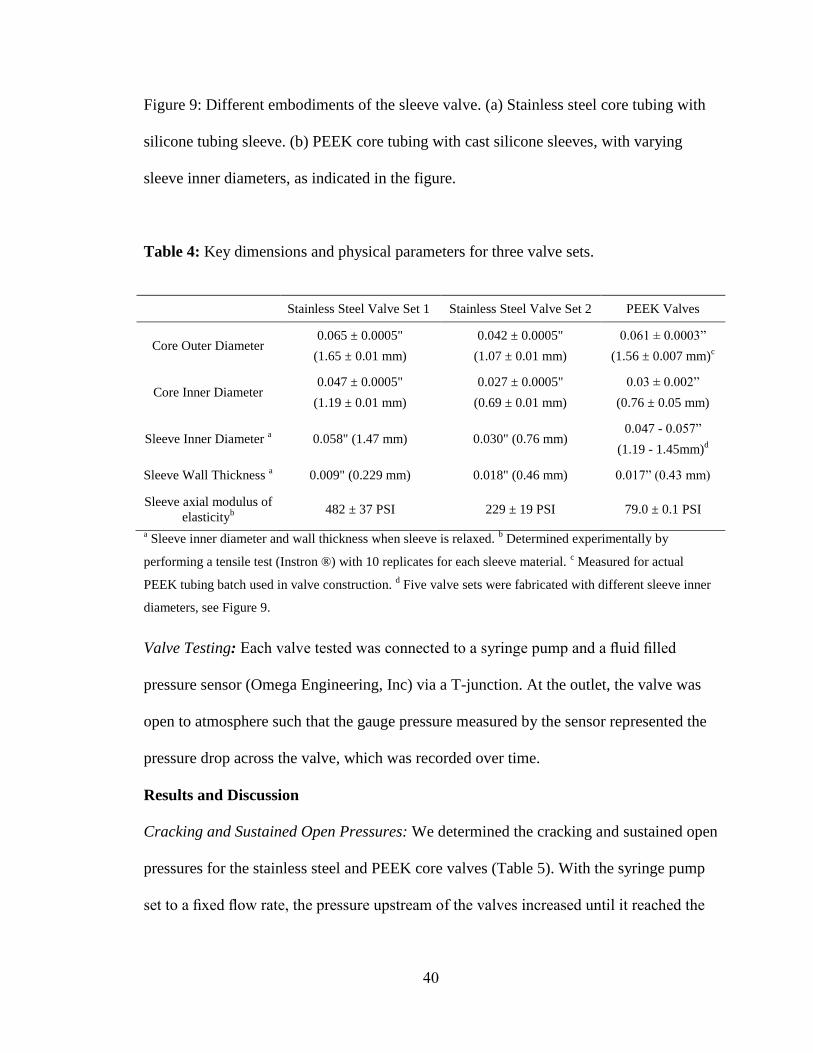
40
Figure 9: Different embodiments of the sleeve valve. (a) Stainless steel core tubing with
silicone tubing sleeve. (b) PEEK core tubing with cast silicone sleeves, with varying
sleeve inner diameters, as indicated in the figure.
Table 4: Key dimensions and physical parameters for three valve sets.
Stainless Steel Valve Set 1 Stainless Steel Valve Set 2 PEEK Valves
Core Outer Diameter 0.065 ± 0.0005"
(1.65 ± 0.01 mm)
0.042 ± 0.0005"
(1.07 ± 0.01 mm)
0.061 ± 0.0003”
(1.56 ± 0.007 mm)c
Core Inner Diameter 0.047 ± 0.0005"
(1.19 ± 0.01 mm)
0.027 ± 0.0005"
(0.69 ± 0.01 mm)
0.03 ± 0.002”
(0.76 ± 0.05 mm)
Sleeve Inner Diameter a 0.058" (1.47 mm) 0.030" (0.76 mm)
0.047 - 0.057”
(1.19 - 1.45mm)d
Sleeve Wall Thickness a 0.009" (0.229 mm) 0.018" (0.46 mm) 0.017” (0.43 mm)
Sleeve axial modulus of
elasticityb
482 ± 37 PSI 229 ± 19 PSI 79.0 ± 0.1 PSI
a Sleeve inner diameter and wall thickness when sleeve is relaxed.
b Determined experimentally by
performing a tensile test (Instron ®) with 10 replicates for each sleeve material. c Measured for actual
PEEK tubing batch used in valve construction. d Five valve sets were fabricated with different sleeve inner
diameters, see Figure 9.
Valve Testing: Each valve tested was connected to a syringe pump and a fluid filled
pressure sensor (Omega Engineering, Inc) via a T-junction. At the outlet, the valve was
open to atmosphere such that the gauge pressure measured by the sensor represented the
pressure drop across the valve, which was recorded over time.
Results and Discussion
Cracking and Sustained Open Pressures: We determined the cracking and sustained open
pressures for the stainless steel and PEEK core valves (Table 5). With the syringe pump
set to a fixed flow rate, the pressure upstream of the valves increased until it reached the
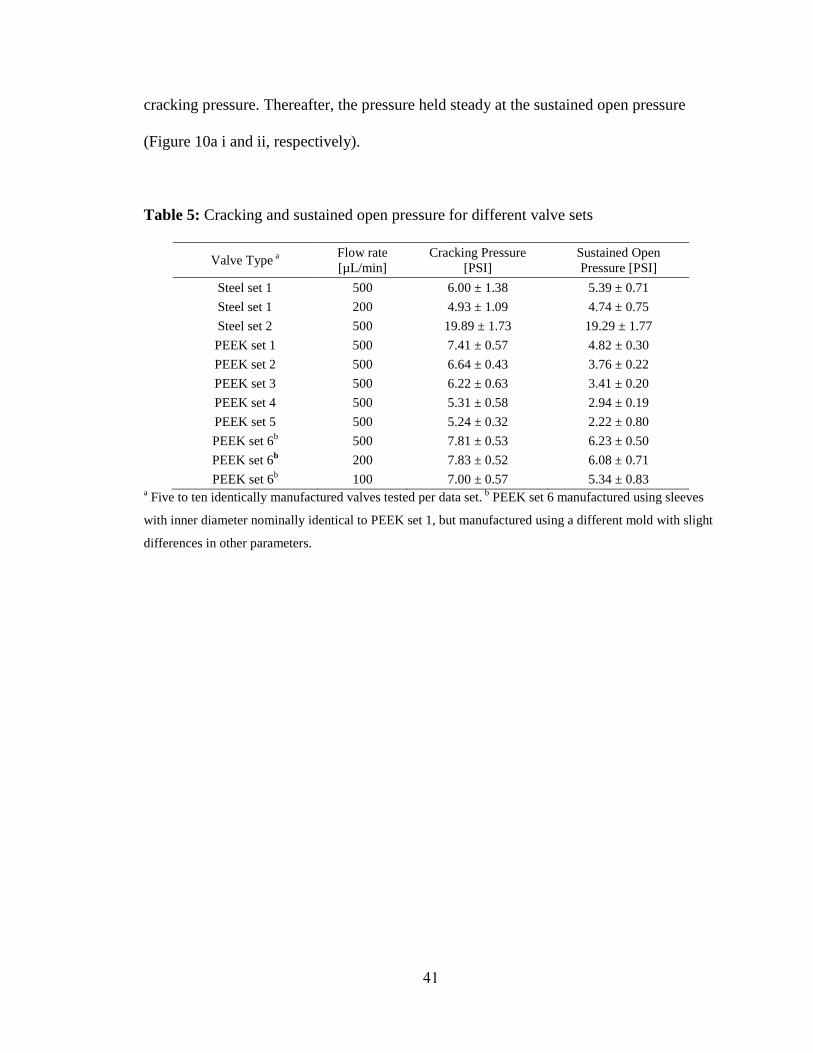
41
cracking pressure. Thereafter, the pressure held steady at the sustained open pressure
(Figure 10a i and ii, respectively).
Table 5: Cracking and sustained open pressure for different valve sets
Valve Type a
Flow rate
[µL/min]
Cracking Pressure
[PSI]
Sustained Open
Pressure [PSI]
Steel set 1 500 6.00 ± 1.38 5.39 ± 0.71
Steel set 1 200 4.93 ± 1.09 4.74 ± 0.75
Steel set 2 500 19.89 ± 1.73 19.29 ± 1.77
PEEK set 1 500 7.41 ± 0.57 4.82 ± 0.30
PEEK set 2 500 6.64 ± 0.43 3.76 ± 0.22
PEEK set 3 500 6.22 ± 0.63 3.41 ± 0.20
PEEK set 4 500 5.31 ± 0.58 2.94 ± 0.19
PEEK set 5 500 5.24 ± 0.32 2.22 ± 0.80
PEEK set 6b 500 7.81 ± 0.53 6.23 ± 0.50
PEEK set 6b 200 7.83 ± 0.52 6.08 ± 0.71
PEEK set 6b 100 7.00 ± 0.57 5.34 ± 0.83
a Five to ten identically manufactured valves tested per data set.
b PEEK set 6 manufactured using sleeves
with inner diameter nominally identical to PEEK set 1, but manufactured using a different mold with slight
differences in other parameters.
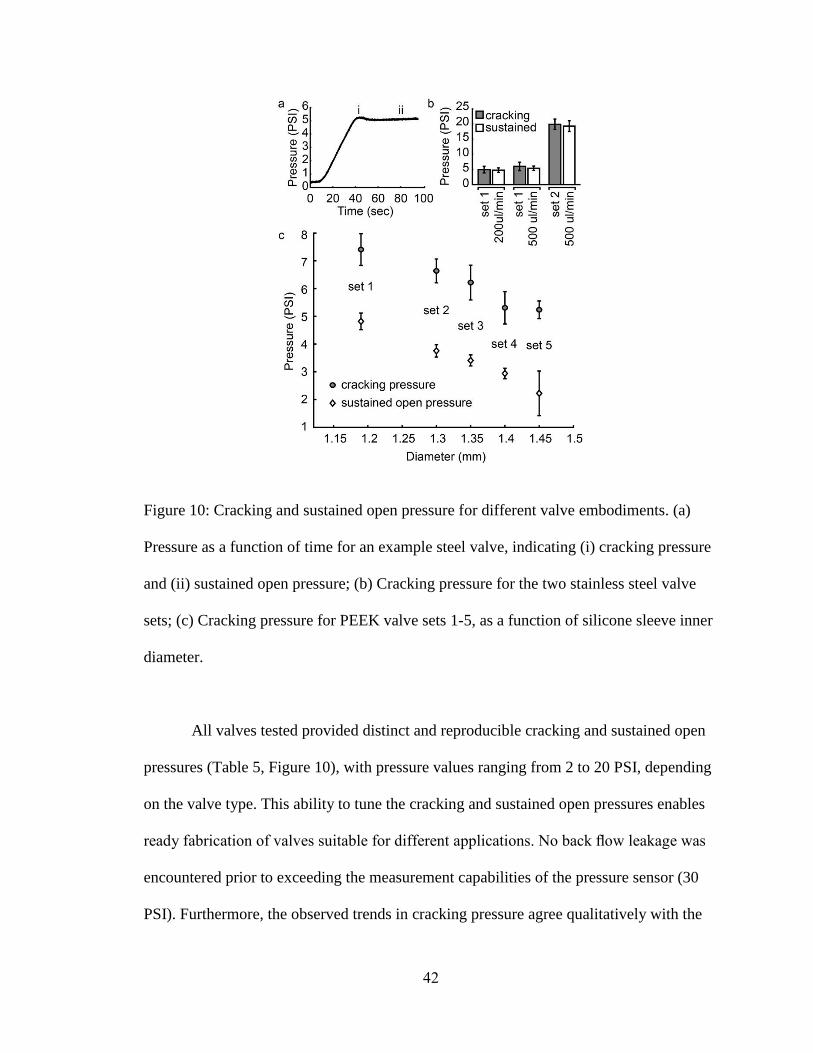
42
Figure 10: Cracking and sustained open pressure for different valve embodiments. (a)
Pressure as a function of time for an example steel valve, indicating (i) cracking pressure
and (ii) sustained open pressure; (b) Cracking pressure for the two stainless steel valve
sets; (c) Cracking pressure for PEEK valve sets 1-5, as a function of silicone sleeve inner
diameter.
All valves tested provided distinct and reproducible cracking and sustained open
pressures (Table 5, Figure 10), with pressure values ranging from 2 to 20 PSI, depending
on the valve type. This ability to tune the cracking and sustained open pressures enables
ready fabrication of valves suitable for different applications. No back flow leakage was
encountered prior to exceeding the measurement capabilities of the pressure sensor (30
PSI). Furthermore, the observed trends in cracking pressure agree qualitatively with the
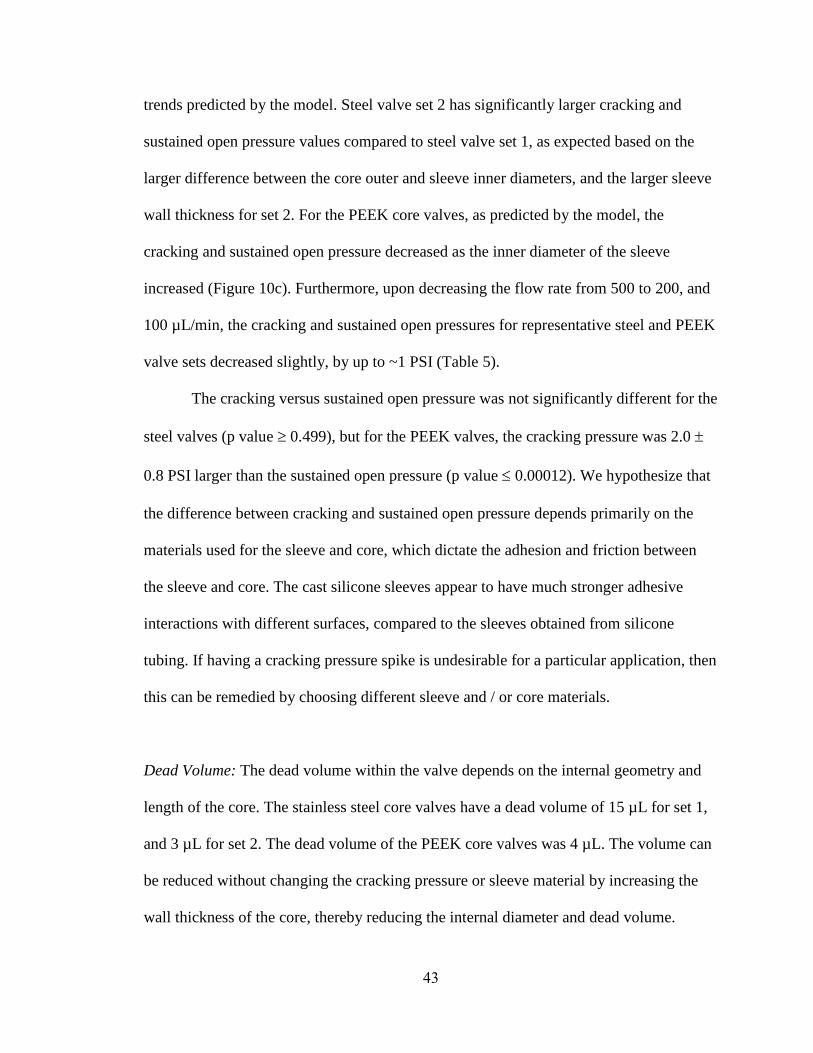
43
trends predicted by the model. Steel valve set 2 has significantly larger cracking and
sustained open pressure values compared to steel valve set 1, as expected based on the
larger difference between the core outer and sleeve inner diameters, and the larger sleeve
wall thickness for set 2. For the PEEK core valves, as predicted by the model, the
cracking and sustained open pressure decreased as the inner diameter of the sleeve
increased (Figure 10c). Furthermore, upon decreasing the flow rate from 500 to 200, and
100 µL/min, the cracking and sustained open pressures for representative steel and PEEK
valve sets decreased slightly, by up to ~1 PSI (Table 5).
The cracking versus sustained open pressure was not significantly different for the
steel valves (p value 0.499), but for the PEEK valves, the cracking pressure was 2.0
0.8 PSI larger than the sustained open pressure (p value 0.00012). We hypothesize that
the difference between cracking and sustained open pressure depends primarily on the
materials used for the sleeve and core, which dictate the adhesion and friction between
the sleeve and core. The cast silicone sleeves appear to have much stronger adhesive
interactions with different surfaces, compared to the sleeves obtained from silicone
tubing. If having a cracking pressure spike is undesirable for a particular application, then
this can be remedied by choosing different sleeve and / or core materials.
Dead Volume: The dead volume within the valve depends on the internal geometry and
length of the core. The stainless steel core valves have a dead volume of 15 µL for set 1,
and 3 µL for set 2. The dead volume of the PEEK core valves was 4 µL. The volume can
be reduced without changing the cracking pressure or sleeve material by increasing the
wall thickness of the core, thereby reducing the internal diameter and dead volume.
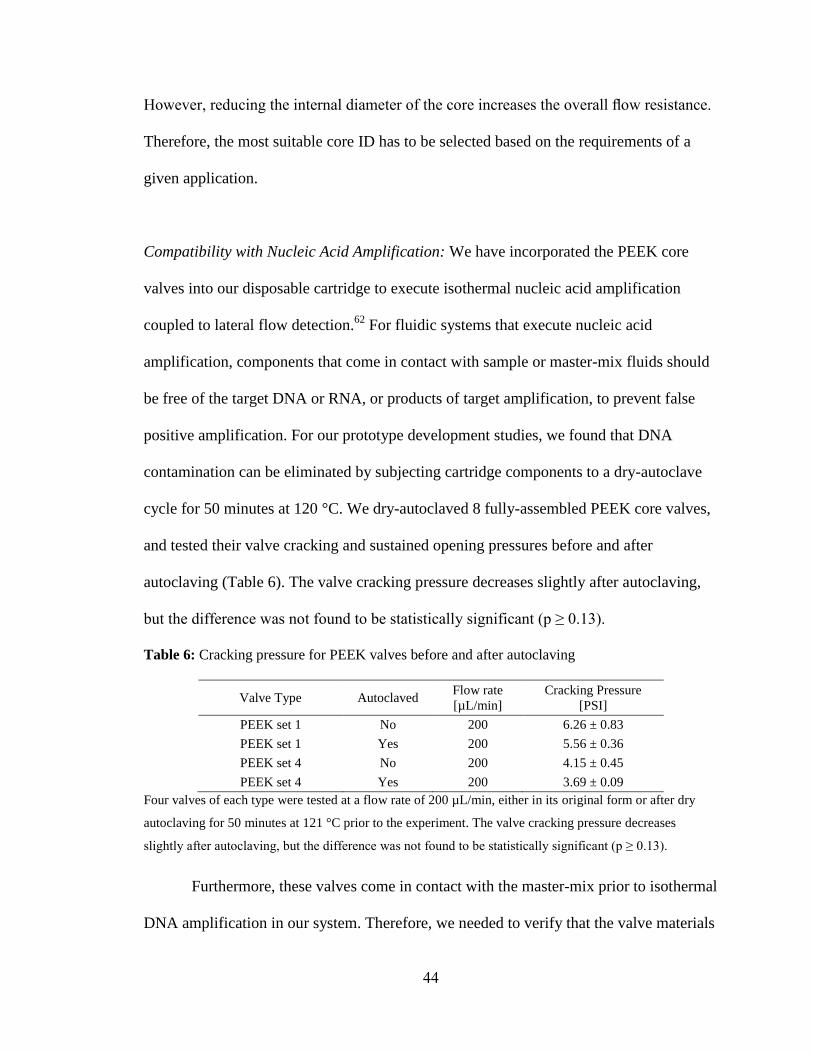
44
However, reducing the internal diameter of the core increases the overall flow resistance.
Therefore, the most suitable core ID has to be selected based on the requirements of a
given application.
Compatibility with Nucleic Acid Amplification: We have incorporated the PEEK core
valves into our disposable cartridge to execute isothermal nucleic acid amplification
coupled to lateral flow detection.62
For fluidic systems that execute nucleic acid
amplification, components that come in contact with sample or master-mix fluids should
be free of the target DNA or RNA, or products of target amplification, to prevent false
positive amplification. For our prototype development studies, we found that DNA
contamination can be eliminated by subjecting cartridge components to a dry-autoclave
cycle for 50 minutes at 120 °C. We dry-autoclaved 8 fully-assembled PEEK core valves,
and tested their valve cracking and sustained opening pressures before and after
autoclaving (Table 6). The valve cracking pressure decreases slightly after autoclaving,
but the difference was not found to be statistically significant (p ≥ 0.13).
Table 6: Cracking pressure for PEEK valves before and after autoclaving
Valve Type Autoclaved Flow rate
[µL/min]
Cracking Pressure
[PSI]
PEEK set 1 No 200 6.26 ± 0.83
PEEK set 1 Yes 200 5.56 ± 0.36
PEEK set 4 No 200 4.15 ± 0.45
PEEK set 4 Yes 200 3.69 ± 0.09
Four valves of each type were tested at a flow rate of 200 µL/min, either in its original form or after dry
autoclaving for 50 minutes at 121 °C prior to the experiment. The valve cracking pressure decreases
slightly after autoclaving, but the difference was not found to be statistically significant (p ≥ 0.13).
Furthermore, these valves come in contact with the master-mix prior to isothermal
DNA amplification in our system. Therefore, we needed to verify that the valve materials
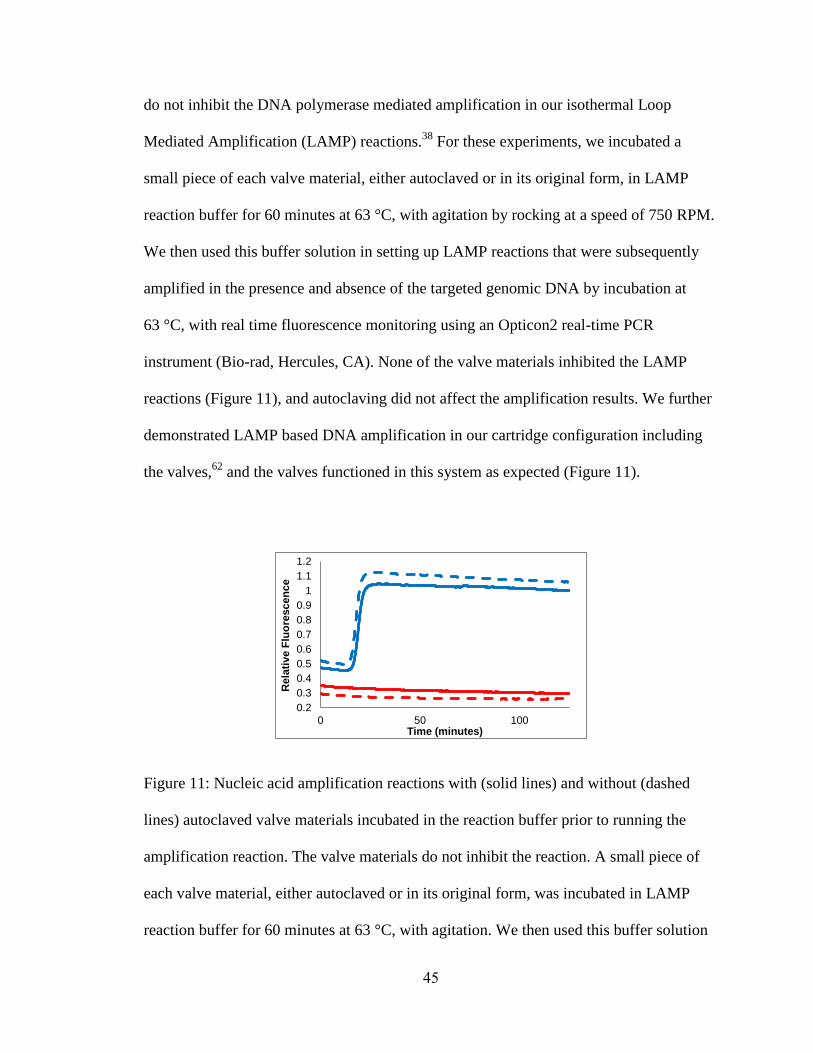
45
do not inhibit the DNA polymerase mediated amplification in our isothermal Loop
Mediated Amplification (LAMP) reactions.38
For these experiments, we incubated a
small piece of each valve material, either autoclaved or in its original form, in LAMP
reaction buffer for 60 minutes at 63 °C, with agitation by rocking at a speed of 750 RPM.
We then used this buffer solution in setting up LAMP reactions that were subsequently
amplified in the presence and absence of the targeted genomic DNA by incubation at
63 °C, with real time fluorescence monitoring using an Opticon2 real-time PCR
instrument (Bio-rad, Hercules, CA). None of the valve materials inhibited the LAMP
reactions (Figure 11), and autoclaving did not affect the amplification results. We further
demonstrated LAMP based DNA amplification in our cartridge configuration including
the valves,62
and the valves functioned in this system as expected (Figure 11).
Figure 11: Nucleic acid amplification reactions with (solid lines) and without (dashed
lines) autoclaved valve materials incubated in the reaction buffer prior to running the
amplification reaction. The valve materials do not inhibit the reaction. A small piece of
each valve material, either autoclaved or in its original form, was incubated in LAMP
reaction buffer for 60 minutes at 63 °C, with agitation. We then used this buffer solution
0.2
0.3
0.4
0.5
0.6
0.7
0.8
0.9
1
1.1
1.2
0 50 100
Rela
tive F
luo
rescen
ce
Time (minutes)
46
in setting up LAMP reactions that were subsequently amplified in the presence and
absence of the targeted genomic DNA by incubation at 63 °C, with real time fluorescence
monitoring using an Opticon2 real-time PCR instrument (Bio-rad, Hercules, CA). Blue:
LAMP positive reactions containing 3000 copies of target genomic DNA per reaction.
Red: LAMP negative control reactions, which did not contain target DNA.
Conclusions
We demonstrated a stand-alone, miniature check valve design with selectable and
reproducible cracking and sustained open pressures. The axial flow alignment of the
valve lends itself to be press-fit, or similarly inserted into a flow path. The valves can be
fabricated in a simple and reproducible manner from readily available, low-cost materials.
The current prototype production process involves manual cutting, sealing, and notching
of the rigid core, which alternatively can be accomplished through industry-standard deep
draw production methods. Likewise, we used casting to generate elastomeric sleeves of
varying inner diameters, but for mass production, the sleeves can be more readily
obtained in large volume by injection molding, or by cutting silicone tubing of the
appropriate inner diameter and wall thickness into shorter pieces. Therefore, the
production of these valves can be scaled up to large-volumes using traditional
manufacturing techniques. The valves can be manufactured from non-reactive materials
that are compatible with challenging applications such as automation of biological
assays.62
47
CHAPTER 4: REFINED PROTOTYPE FOR AMPLIFICATION AND
DETECTION SUBUNIT
Introduction
The work presented herein builds upon an earlier prototype of the amplification and
detection unit80
(Chapter 2), comprised of a disposable cartridge containing flexible
pouches, passive valves63
(Chapter 3), and electrolysis-driven pumps, in conjunction with
a small heater. Using this refined subunit, we have demonstrated successful execution of
an established and clinically-validated isothermal LAMP reaction targeting
Mycobacterium tuberculosis (M.tb) DNA,38
which we have coupled to NALF detection.
Experimental
The refined disposable cartridge can execute two isothermal nucleic acid amplification
reactions coupled to lateral flow detection in parallel. This enables identification of
multiple targets, or amplification of the target (M.tb) in one reaction and an unrelated
amplification control in another reaction, which is useful for reactions that cannot be
readily multiplexed, such as LAMP.
The operating principle is illustrated in Figure 12a. A sample of purified genomic
DNA is injected through a septum into the sample input port. The sample is directed into
a chamber containing liquid or lyophilized master-mix reagents using a syringe pump to
simulate an upstream integrated electrolytic pump (ePump). Next, the master-mix is
pumped through a channel with a hydrophobic barrier that vents the dead air that
originally filled the fluid channels, and into the reaction insert. This reaction insert
consists of two reaction pouches with inlet and outlet ports containing one-way passive
check valves. Each reaction pouch is enclosed by a pump pouch connected to an ePump.
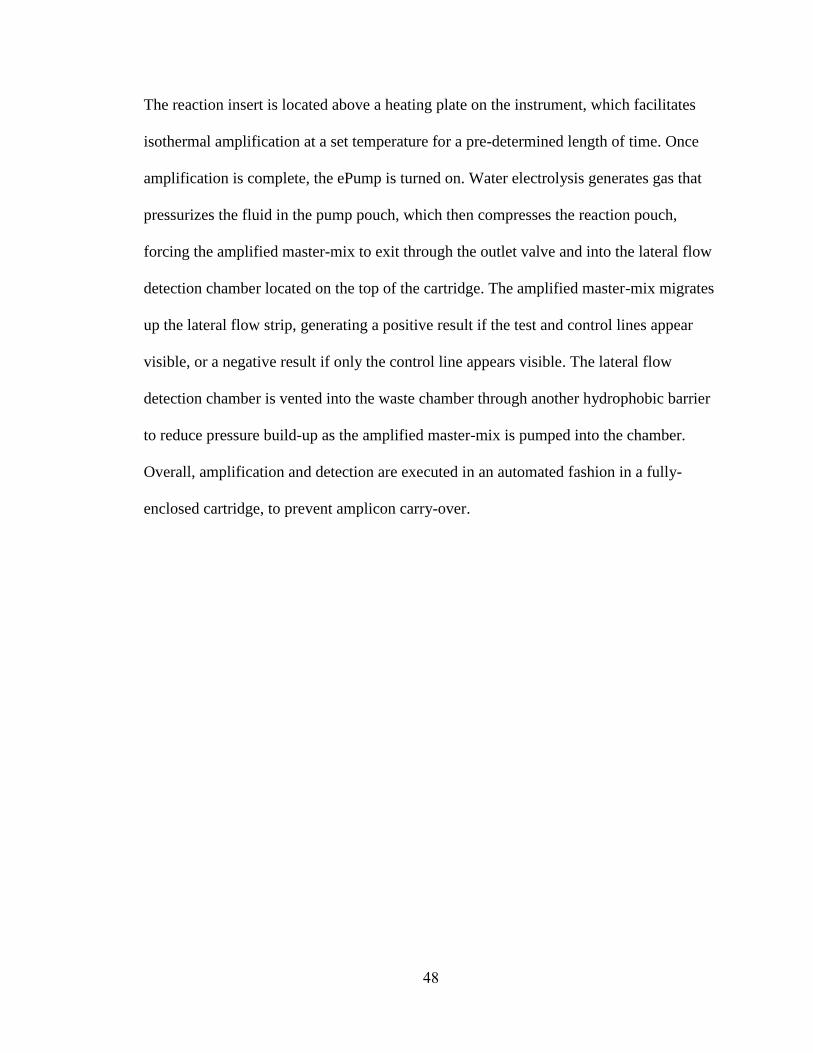
48
The reaction insert is located above a heating plate on the instrument, which facilitates
isothermal amplification at a set temperature for a pre-determined length of time. Once
amplification is complete, the ePump is turned on. Water electrolysis generates gas that
pressurizes the fluid in the pump pouch, which then compresses the reaction pouch,
forcing the amplified master-mix to exit through the outlet valve and into the lateral flow
detection chamber located on the top of the cartridge. The amplified master-mix migrates
up the lateral flow strip, generating a positive result if the test and control lines appear
visible, or a negative result if only the control line appears visible. The lateral flow
detection chamber is vented into the waste chamber through another hydrophobic barrier
to reduce pressure build-up as the amplified master-mix is pumped into the chamber.
Overall, amplification and detection are executed in an automated fashion in a fully-
enclosed cartridge, to prevent amplicon carry-over.
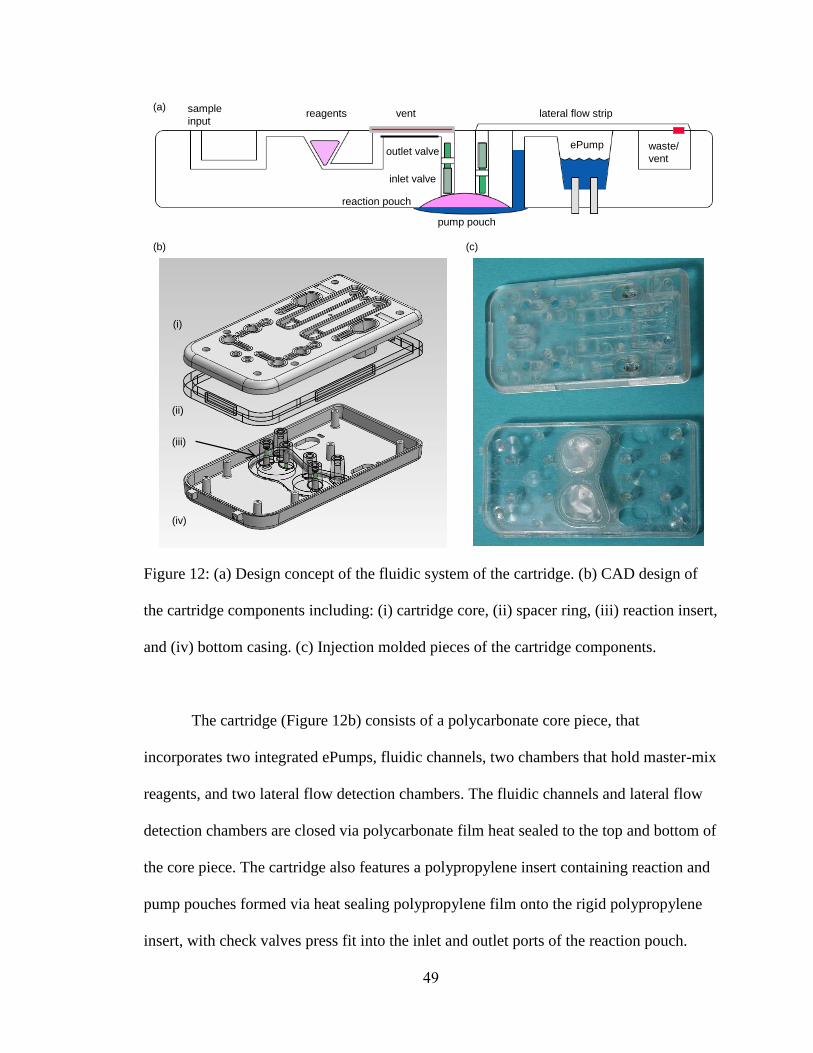
49
Figure 12: (a) Design concept of the fluidic system of the cartridge. (b) CAD design of
the cartridge components including: (i) cartridge core, (ii) spacer ring, (iii) reaction insert,
and (iv) bottom casing. (c) Injection molded pieces of the cartridge components.
The cartridge (Figure 12b) consists of a polycarbonate core piece, that
incorporates two integrated ePumps, fluidic channels, two chambers that hold master-mix
reagents, and two lateral flow detection chambers. The fluidic channels and lateral flow
detection chambers are closed via polycarbonate film heat sealed to the top and bottom of
the core piece. The cartridge also features a polypropylene insert containing reaction and
pump pouches formed via heat sealing polypropylene film onto the rigid polypropylene
insert, with check valves press fit into the inlet and outlet ports of the reaction pouch.
(a)
(b) (c)
sample
inputreagents
reaction pouch
ePump
lateral flow strip
pump pouch
vent
(i)
(ii)
(iii)
(iv)
waste/
vent
inlet valve
outlet valve
50
Dead air is removed from the reaction pouches during assembly, and the pump pouches
are filled with silicone oil that facilitates hydraulic pumping through a connection with
the ePumps, and enhances heat transfer between the heater surface of the instrument and
the enclosed reaction chamber. The assembled reaction insert is press fit onto the
polycarbonate core, which is then attached to another polycarbonate bottom casing. To
protect the insert-molded electrodes from mechanical shock, the electrode pins are
recessed within the cartridge by the addition of an acrylic spacer ring that runs along the
entire seam between the polycarbonate core and bottom casing pieces. The bottom casing
contains access windows to the reaction pouch insert and ePump electrodes, and presses
the reaction insert against the core, providing appropriate fluidic seals at the connection
points. During assembly, the internal volume of the cartridge is filled with silicone foam
to reduce the heat lost from the reaction insert during isothermal amplification.
To demonstrate feasibility of scalable production of the proposed cartridge design,
the polycarbonate cartridge core and bottom casing, as well as the polypropylene reaction
insert components, were injection molded (Figure 12c). Currently, a maximum of 24
polycarbonate or 100 polypropylene components can be produced in one workday. By
improving the mold design and moving the process to an industrial machine with steel
molds, we estimate that ≥1000 polycarbonate components and a much larger number of
polypropylene inserts could be produced per day on each dedicated machine.
Handheld Instrument: Complementing the refined disposable cartridge, we also refined
the prototype instrument to facilitate heating, pumping, and timing. The instrument
secures the cartridge in a recessed slot on its top surface. Datum location and spring clip
51
mechanisms ensure proper mating of the electrical contacts and the heating surface of the
instrument to the ePump connectors and the reaction insert on the cartridge (Figure 13).
The on-board microprocessor can be readily programmed to obtain the required assay
timing, heater temperature, and current provided to the ePumps, which means that
different types of isothermal amplification assays can be readily accommodated. This
refined prototype system operates from a plug-in DC power source, but the low-power
electronics can be readily operated from an integrated battery pack. The instrument
contains three LEDs, of which one indicates appropriate heater temperature and two
indicate proper ePump connections, plus a start button to trigger assay execution.
Figure 13: Steps of cartridge insertion into the designed instrument including (a) insert
cartridge datum into locator slots in the instrument housing at an angle and (b) lower the
cartridge into the slot and release the spring loaded clip to secure the cartridge.
Results and Discussion
Reaction Insert Design: The initial design intent for this refined cartridge was to
transition all of the polypropylene components and films to polycarbonate, as
(a) (b)
52
polycarbonate is more robust and more commonly used for consumer products.However,
preliminary studies showed that the double-layered reaction and pump pouch set-up used
from the previous polypropylene cartridges could not be duplicated using polycarbonate
film heat-sealed to a rigid polycarbonate body. The polycarbonate film is brittle and does
not stretch, eliminating the flexible nature of the double-pouch system, which is
necessary for the simple fluid handling and pumping mechanisms used for this cartridge.
Therefore, the cartridge design was modified to retain the double-layered polypropylene
reaction and pump pouch scheme as an independent component that is inserted into the
polycarbonate cartridge body.
Valving and Fluid Handling within the Reaction Insert: The reaction insert within the
cartridge needs to receive and contain the master-mix during the amplification process,
then enable pumping of amplified master-mix onto the lateral flow strips. Fluid handling
within the reaction insert (Figure 12a) is facilitated via a mechanism similar to a
diaphragm pump, with a reaction pouch enclosed by a pump pouch, and including
passive check valves at the inlet and outlet to the reaction pouch. An inlet valve of lower
opening pressure prevents back flow leakage of the reagents. An outlet valve with higher
opening pressure ensures proper fluid containment during the reagent injection into the
reaction pouch and the isothermal amplification period. These check valves have to be
low-cost and mass-producible, with predictable nominal opening pressures and low dead
volume. Commercially-available valves do not meet these requirements. Therefore, we
developed a novel, custom valve design63
(Chapter 3) to implement the fluidic control.
The assembled valves were press fit into the reaction inserts.
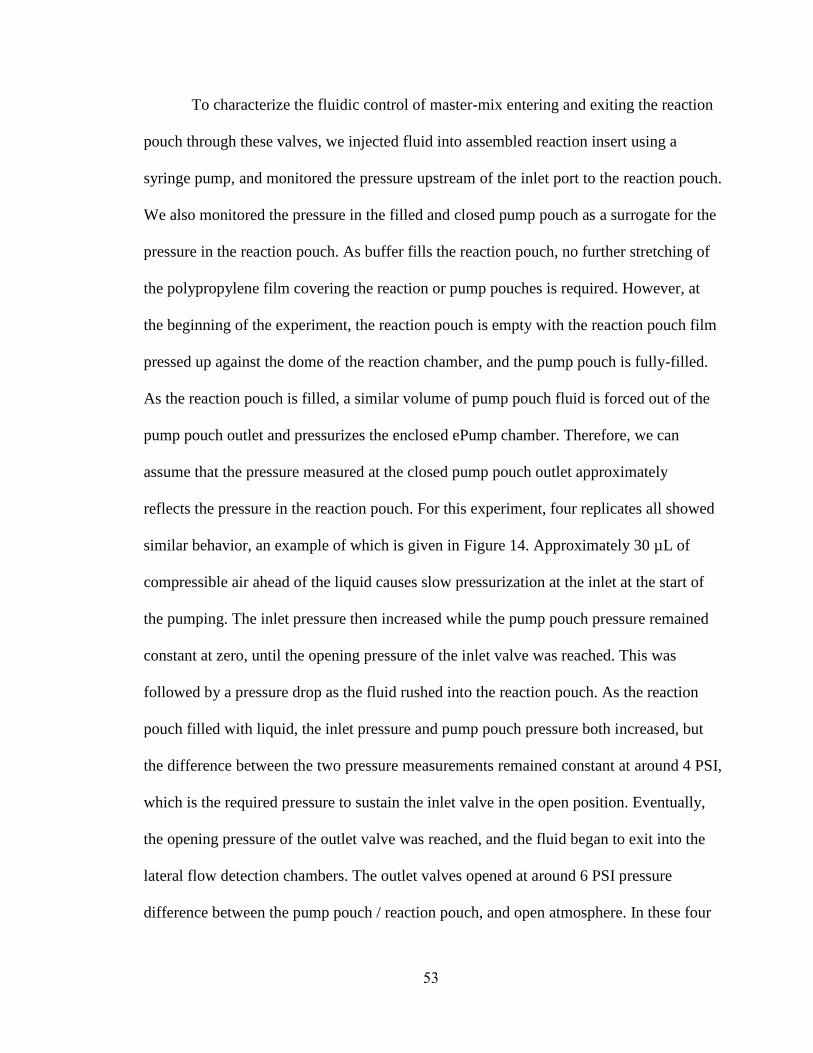
53
To characterize the fluidic control of master-mix entering and exiting the reaction
pouch through these valves, we injected fluid into assembled reaction insert using a
syringe pump, and monitored the pressure upstream of the inlet port to the reaction pouch.
We also monitored the pressure in the filled and closed pump pouch as a surrogate for the
pressure in the reaction pouch. As buffer fills the reaction pouch, no further stretching of
the polypropylene film covering the reaction or pump pouches is required. However, at
the beginning of the experiment, the reaction pouch is empty with the reaction pouch film
pressed up against the dome of the reaction chamber, and the pump pouch is fully-filled.
As the reaction pouch is filled, a similar volume of pump pouch fluid is forced out of the
pump pouch outlet and pressurizes the enclosed ePump chamber. Therefore, we can
assume that the pressure measured at the closed pump pouch outlet approximately
reflects the pressure in the reaction pouch. For this experiment, four replicates all showed
similar behavior, an example of which is given in Figure 14. Approximately 30 µL of
compressible air ahead of the liquid causes slow pressurization at the inlet at the start of
the pumping. The inlet pressure then increased while the pump pouch pressure remained
constant at zero, until the opening pressure of the inlet valve was reached. This was
followed by a pressure drop as the fluid rushed into the reaction pouch. As the reaction
pouch filled with liquid, the inlet pressure and pump pouch pressure both increased, but
the difference between the two pressure measurements remained constant at around 4 PSI,
which is the required pressure to sustain the inlet valve in the open position. Eventually,
the opening pressure of the outlet valve was reached, and the fluid began to exit into the
lateral flow detection chambers. The outlet valves opened at around 6 PSI pressure
difference between the pump pouch / reaction pouch, and open atmosphere. In these four
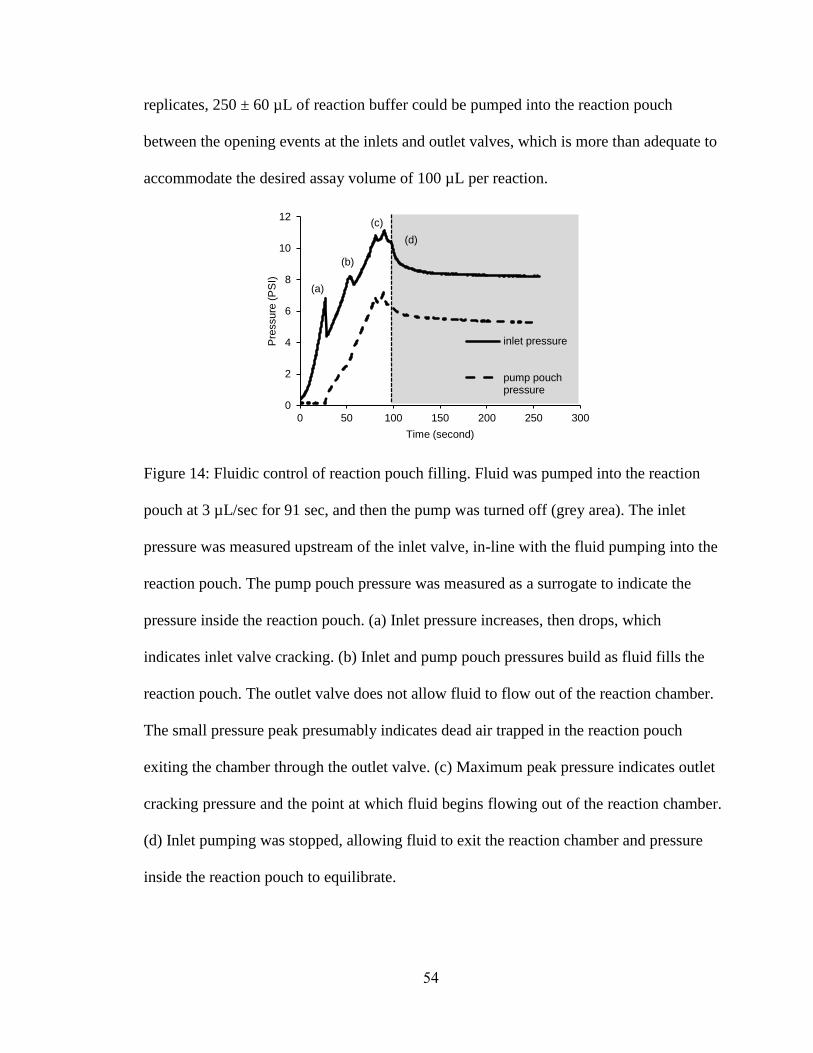
54
replicates, 250 ± 60 µL of reaction buffer could be pumped into the reaction pouch
between the opening events at the inlets and outlet valves, which is more than adequate to
accommodate the desired assay volume of 100 µL per reaction.
Figure 14: Fluidic control of reaction pouch filling. Fluid was pumped into the reaction
pouch at 3 µL/sec for 91 sec, and then the pump was turned off (grey area). The inlet
pressure was measured upstream of the inlet valve, in-line with the fluid pumping into the
reaction pouch. The pump pouch pressure was measured as a surrogate to indicate the
pressure inside the reaction pouch. (a) Inlet pressure increases, then drops, which
indicates inlet valve cracking. (b) Inlet and pump pouch pressures build as fluid fills the
reaction pouch. The outlet valve does not allow fluid to flow out of the reaction chamber.
The small pressure peak presumably indicates dead air trapped in the reaction pouch
exiting the chamber through the outlet valve. (c) Maximum peak pressure indicates outlet
cracking pressure and the point at which fluid begins flowing out of the reaction chamber.
(d) Inlet pumping was stopped, allowing fluid to exit the reaction chamber and pressure
inside the reaction pouch to equilibrate.
0
2
4
6
8
10
12
0 50 100 150 200 250 300
Pre
ssure
(P
SI)
Time (second)
inlet pressure
pump pouchpressure
(a)
(b)
(c)
(d)
55
Hydrophobic Barriers and Venting: Proper venting of dead air stuck in the channels
upstream of the reaction pouch is crucial to achieve reproducible amplification, as large
gas bubbles introduced into the reaction pouch may interfere with heat transfer and
temperature equilibration throughout the master-mix volume in the reaction pouch. We
selected a PTFE porous membrane with 0.2 µm pores on polypropylene mesh backing as
venting material. This membrane was heat sealed on top of the polycarbonate channels
immediately upstream of the reaction pouch to be used as a hydrophobic barrier to vent
the trapped air.
We characterized the performance of the hydrophobic barrier by injecting 150 µL
reaction buffer fluid using a syringe pump into the cartridge sample input port and then
into the reaction insert, while measuring the pressure in the upstream fluid channel
(Figure 15).
Figure 15: Pressure measurement in the upstream channel during injection of 150 µL
reaction buffer from the sample inlet port into the reaction insert. (a) The barrier vents the
dead air ahead of the fluid until the fluid fills the upstream channel. No air is injected into
the reaction pouch. (b) The venting barrier closes as liquid fills the area underneath the
barrier. Pressure builds in the upstream fluidic channel until the inlet valve opens. (c) The
0
1
2
3
4
5
6
7
8
9
10
0 50 100 150 200 250
Pre
ssure
(P
SI)
Time (second)
(a) (b) (c) (d)
56
fluid is pumped into the reaction pouch through the inlet valve. The channel pressurizes
due to the pressure exerted by the filled and closed pump pouch. (d) After approximately
100 µL liquid is injected into the reaction pouch, the gas behind the injected volume is
vented through the venting barrier and the remainder of the volume is trapped in the
vented portion. No air is injected into the reaction pouch.
This hydrophobic barrier vented the gas in the channels as fluid was pushed from
the sample inlet port towards the reaction insert without pressure buildup (Figure 15a),
but became impermeable once the liquid reagents reached the inlet valve of the reaction
insert. At that point, the pressure increased until the inlet valve cracking pressure was
reached (Figure 15b). Liquid reagents then entered each reaction pouch and, during this
process, the pressure further increased because pressure was exerted onto the closed and
filled pump pouch. However, the venting barrier did not allow fluid to leak out of the
cartridge during the entire 10 PSI fluid pressure build-up encountered in this process
(Figure 15c). Once approximately 100 uL of the liquid reagents was injected into each
reaction pouch, the barrier released the pressurized gas present in the channel upstream of
the injected volume, effectively stopping the pumping action (Figure 15d), leaving
approximately 50 uL of reagents in the venting portion of the upstream channel. A thin
layer of fluid wetted the porous membrane and, therefore, a small pressure in the venting
channel was required to open the porous membrane. However, the decrease in the
upstream pressure was sufficient to close the inlet valve and prevent further pumping of
air into the reaction pouch.
57
Lateral Flow Detection Chambers: For our cartridge design, it is particularly important
that the lateral flow strip chambers be completely sealed, since the master-mix will have
been amplified prior to being pumped into the chamber. For this refined amplification
and detection cartridge, the lateral flow chambers needed to be integrated into the core
polycarbonate body, requiring the chamber to be sealed with polycarbonate film.
Previous investigations indicated that lateral flow strip performance can be negatively
affected if pressure builds inside the lateral flow strip chamber as master-mix is pumped
in and the air inside the chamber compresses. The polypropylene film used in the
previous cartridge version (Chapter 2) could stretch to accommodate the increase in
volume when the amplified master-mix was pumped into the lateral flow strip pouches,
which is not ideal but proved to be sufficient for initial testing. To mitigate this problem,
and since the polycarbonate film is less flexible than polypropylene film, we included
commercially-available hydrophobic barriers (Qosina) to vent air out of the new lateral
flow chambers, reducing any possible pressure build-up.
Additionally, the lateral flow strips in the previous amplification and detection
cartridge design were approximately 1 cm shorter than standard sized strips (typically ~ 5
cm), and had to be run in anti-parallel orientation to fit within the footprint of the top of
the cartridge. For this refined amplification and detection subunit, the lateral flow
chambers were re-designed to fit two full-length strips in parallel orientation. We
investigated the fluid flow and lateral flow strip performance within chambers of several
sizes, with varying additional features (Figure 16). One of these additional features was a
reagent pool area located above the fluid conduit connecting the reaction chamber with
the lateral flow strip chamber. We manufactured lateral flow strips wtih sample pads that
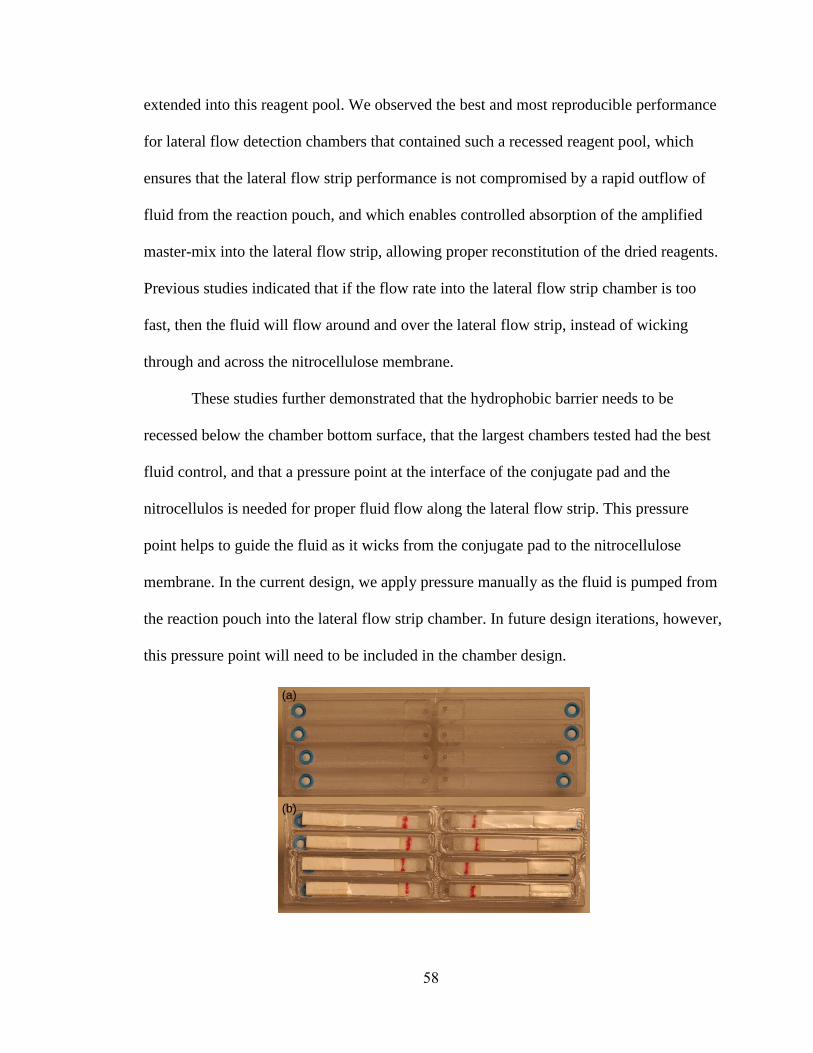
58
extended into this reagent pool. We observed the best and most reproducible performance
for lateral flow detection chambers that contained such a recessed reagent pool, which
ensures that the lateral flow strip performance is not compromised by a rapid outflow of
fluid from the reaction pouch, and which enables controlled absorption of the amplified
master-mix into the lateral flow strip, allowing proper reconstitution of the dried reagents.
Previous studies indicated that if the flow rate into the lateral flow strip chamber is too
fast, then the fluid will flow around and over the lateral flow strip, instead of wicking
through and across the nitrocellulose membrane.
These studies further demonstrated that the hydrophobic barrier needs to be
recessed below the chamber bottom surface, that the largest chambers tested had the best
fluid control, and that a pressure point at the interface of the conjugate pad and the
nitrocellulos is needed for proper fluid flow along the lateral flow strip. This pressure
point helps to guide the fluid as it wicks from the conjugate pad to the nitrocellulose
membrane. In the current design, we apply pressure manually as the fluid is pumped from
the reaction pouch into the lateral flow strip chamber. In future design iterations, however,
this pressure point will need to be included in the chamber design.
(a)
(b)
59
Figure 16: Lateral flow strip chamber testbed. (a) Empty lateral flow strip chambers,
showing embedded hydrophobic barriers (blue). (b) Lateral flow strip chambers with
lateral flow strips sealed by polycarbonate film. The red line on the conjugate pads is the
lateral flow conjugate that has been dispensed and dried onto the conjugate pad.
Electrolytic Pumping: After the amplification reaction is completed, the integrated
ePumps are used to push the amplified master-mix from the reaction pouch into the
lateral flow detection chambers. The ePump chambers are filled with electrolyte solution,
and are connected via a closed channel to the pump pouch port of the reaction insert. By
applying a constant current to the electrodes in the ePump chambers, hydrogen and
oxygen gas is generated though water electrolysis. This gas then pressurizes the silicone
oil which fills the pump pouches. Since the pump pouches are supported from below by
the instrument surface, the pressure is transferred to the reaction pouch through the
flexible membrane separating both pouches. Once the outlet valve is opened, the
membrane pushes the amplified product from the reaction pouch to the lateral flow
detection chamber, at a flow rate dependent on the characteristics of the outlet valve and
the pressure built up in the reaction pouch, which in turn is dictated by the rate of gas
generated by the ePump. If the ePumps generate too much pressure, then the reaction
pouch contents will be pushed too rapidly onto the lateral flow strips, exceeding the
capacity of the lateral flow strip sample pad to absorb the liquid and properly reconstitute
the reagents on the conjugate pad, which may negatively impact the detection readout.
Our prototype instrument electronics contain controllable current sources to power the
ePumps, and are capable of generating a constant current with a resolution of 2.7 mA up
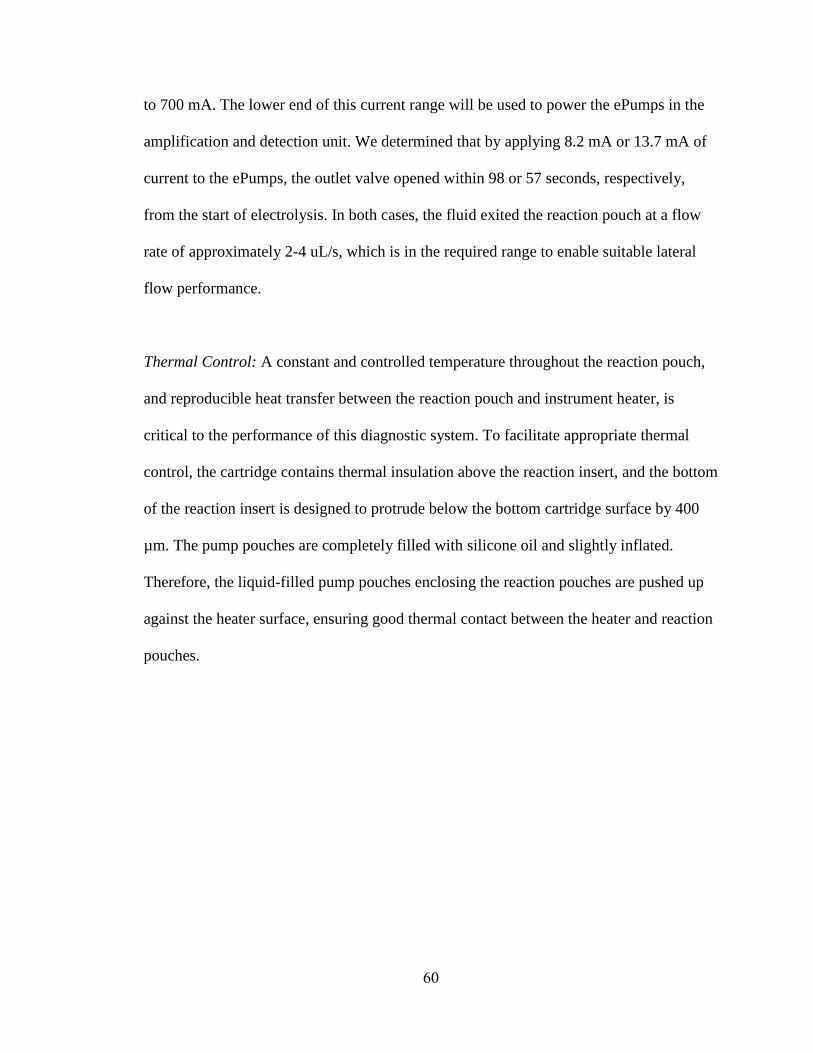
60
to 700 mA. The lower end of this current range will be used to power the ePumps in the
amplification and detection unit. We determined that by applying 8.2 mA or 13.7 mA of
current to the ePumps, the outlet valve opened within 98 or 57 seconds, respectively,
from the start of electrolysis. In both cases, the fluid exited the reaction pouch at a flow
rate of approximately 2-4 uL/s, which is in the required range to enable suitable lateral
flow performance.
Thermal Control: A constant and controlled temperature throughout the reaction pouch,
and reproducible heat transfer between the reaction pouch and instrument heater, is
critical to the performance of this diagnostic system. To facilitate appropriate thermal
control, the cartridge contains thermal insulation above the reaction insert, and the bottom
of the reaction insert is designed to protrude below the bottom cartridge surface by 400
µm. The pump pouches are completely filled with silicone oil and slightly inflated.
Therefore, the liquid-filled pump pouches enclosing the reaction pouches are pushed up
against the heater surface, ensuring good thermal contact between the heater and reaction
pouches.
61
Figure 17: Temperature of the fluid inside the reaction pouch of a cartridge attached to
the heater as a function of time. The fluid reaches a stable temperature within
approximately ten minutes.
The combination of these strategies enables efficient heating of the reaction buffer
within both reaction pouches to the targeted temperature within approximately 10
minutes (Figure 17). The temperature is maintained at steady-state over the duration of
the isothermal amplification period. We implemented an established LAMP reaction
which requires a constant temperature of 63 °C in our cartridge. However, the thermal
set-point of the heater incorporated in our instrument can be readily adjusted to the
desired temperature required for different types of isothermal amplification reactions.
Entire Process and Assay Execution: The process consists of the following steps: an
empty cartridge is attached to the instrument, which is then powered on. At that point, the
heater LED blinks red to indicate system initialization, and the system performs an
ePump check: if proper connections between the instrument and ePumps are established,
20
25
30
35
40
45
50
55
60
65
70
00:00 07:12 14:24 21:36 28:48T
em
pera
ture
(C
)
Time (mm:ss)
Pouch 1
Pouch 2

62
then the two blue ePump LEDs blink three times. The heater LED then turns solid red
while the heater warms up to the programmed temperature. The heater LED turns solid
green once the final heater temperature has been reached. At that point, the sample is
manually injected into the reaction pouch. The master-mix remains in the reaction pouch
chambers to incubate at the set temperature for the desired reaction time, at which point
the heater is turned off and the reaction ePumps are turned on. Once suitable pressure is
acheived within the pump pouches, the fluid in the reaction pouches will be forced
through the outlet valves and into the lateral flow strip detection chambers.
Figure 18: Demonstration of fluidic process in cartridge on instrument. (a) Cartridge
attached to instrument, with reaction buffer (colored blue) injected into storage chamber.
(b) Instrument LEDs indicate function of heater (red LED) and ePumps (blue LEDs). (c)
Lateral flow detection of reaction buffer spiked with synthetic DNA product pumped out
of the reaction pouch onto the lateral flow strips in the cartridge.
To demonstrate fluid handling in the cartridge, we injected 150 uL dye-colored
reaction buffer into each of the two sealed conical storage chambers (Figure 18a). We
then manually triggered the instrument to start the amplification reaction cycle, and
pumped the liquid reagents into the reaction pouch by pushing air at a rate of 3 uL/sec
(a) (b) (c)
63
into the two sample inlet ports using a syringe pump. After suitable pressure had been
reached to open the inlet valve, the reaction buffer moved downstream into each reaction
pouch of the reaction insert. As the buffer entered the reaction insert, the pumping air
advanced down the channel until it exited through the venting barrier. The release of
upstream pressure closed the inlet valves. The injection process was completed in 2
minutes. This experiment omitted the heating and incubation steps to save time and, after
the sample was injected, the instrument was triggered to apply 13.7mA of current to the
ePumps for 2 minutes, indicated by the ePump LEDs turning solid blue (Figure 18b).
Within approximately 1 minute, sufficient pressure was reached in the pump pouches to
open the outlet valves, and the contents of the reaction pouches were pushed into the
lateral flow detection chambers in less than one minute. We also executed the process
using uncolored reaction buffer spiked with a synthetic amplification product that can be
detected on the lateral flow strip to verify that the cartridge enables a suitable visual
readout (Figure 18c).
We then conducted an initial proof of principle experiment to demonstrate that a
LAMP reaction can be executed successfully in the cartridge. This reaction is based on a
published method to detect the gyrB gene within M.tb genomic DNA,38
which we have
modified to enable coupling to NALF80
(Chapter 2). To verify proper amplicon formation,
our first experiment utilized gel electrophoresis rather than lateral flow detection. As
described above, we turned on the instrument and attached an empty cartridge to the
handheld unit, allowing at least 10 minutes for the heater and cartridge to reach
appropriate reaction temperature. We then injected LAMP master-mix with 3000 copies
of M.tb genomic DNA per reaction into the reaction pouches and allowed the reaction to
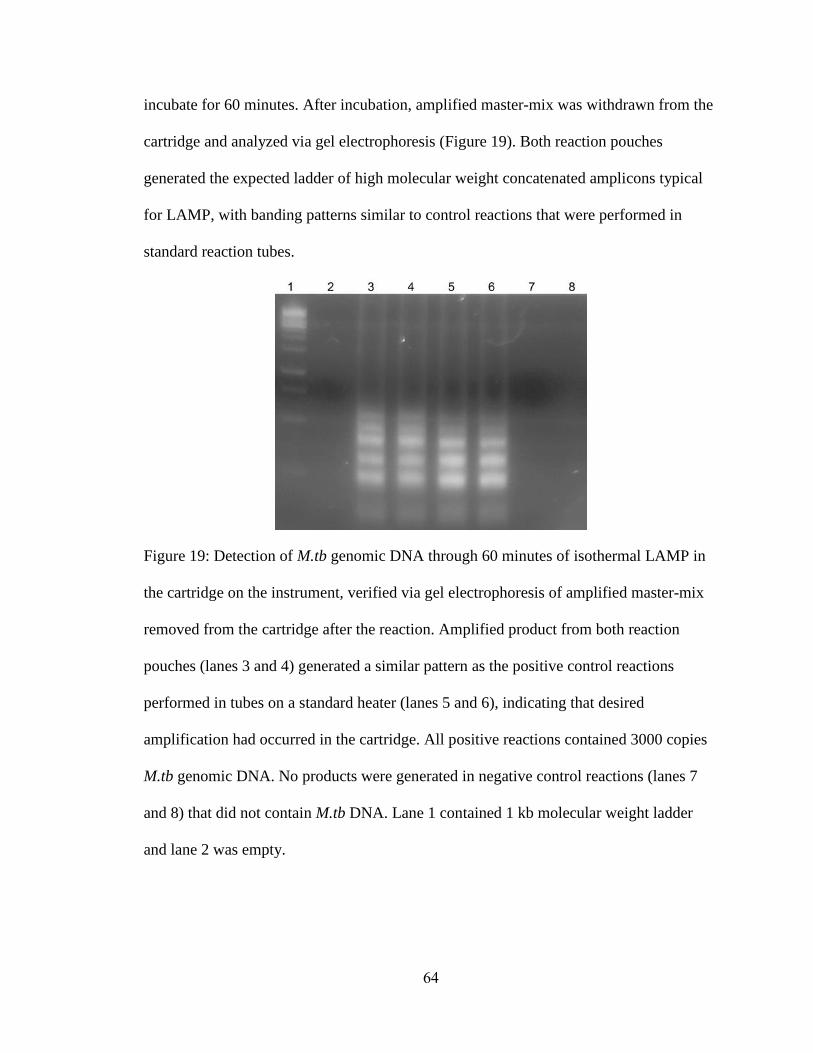
64
incubate for 60 minutes. After incubation, amplified master-mix was withdrawn from the
cartridge and analyzed via gel electrophoresis (Figure 19). Both reaction pouches
generated the expected ladder of high molecular weight concatenated amplicons typical
for LAMP, with banding patterns similar to control reactions that were performed in
standard reaction tubes.
Figure 19: Detection of M.tb genomic DNA through 60 minutes of isothermal LAMP in
the cartridge on the instrument, verified via gel electrophoresis of amplified master-mix
removed from the cartridge after the reaction. Amplified product from both reaction
pouches (lanes 3 and 4) generated a similar pattern as the positive control reactions
performed in tubes on a standard heater (lanes 5 and 6), indicating that desired
amplification had occurred in the cartridge. All positive reactions contained 3000 copies
M.tb genomic DNA. No products were generated in negative control reactions (lanes 7
and 8) that did not contain M.tb DNA. Lane 1 contained 1 kb molecular weight ladder
and lane 2 was empty.
65
We have modified the lateral flow configuration from the previously reported
configuration 80
(Chapter 2) to rely on hapten-only interactions on both the test and
controls lines. In this new configuration, neutravidin and rabbit anti-sheep antibody are
immobilized onto the nitrocellulose for the test and control lines, respectively. A
polyclonal digoxygenin antibody (anti-DIG) from sheep is conjugated to colored
microspheres and will bind to the DIG-labeled BIP primer if the amplicon product is
present in the sample. Additionally, the neutravidin that is immobilized on the
nitrocellulose strip will bind to the biotinylated FIP primer if the amplicon product is
present, resulting in a visual line in the test area. The rabbit anti-sheep antibody present at
the control area binds the anti-Dig conjugate and will be present regardless of the
presence of LAMP amplicon.
Initial studies using LAMP master-mix with 3000 copies of M.tb genomic DNA
in positive samples have demonstrated proper automated fluid handling from sample
insertion through lateral flow detection on board the cartridge. However, these initial
positives samples did not show amplification on the lateral flow strips. We have
identified possible causes for the lack of amplification. First, all prior studies were
conducted with cartridges that had been manufactured in dirty lab conditions. While we
were able to demonstrate amplification, there was a risk that these cartridges had been
contaminated during manufacturing. We have since transitioned all cartridge
manufacturing processes into clean lab conditions (Appendix G). Under these new
conditions, the thermal bonding for all fluid conduits on the cartridge is performed in a
laminar flow hood. When running the initial amplification and detection assays in these
clean cartridges, we noticed the pump pouches showed leakages. It is possible that the air
66
blowing over the heated arbor press in the laminar flow hood is preventing the arbor
press from reaching the necessary temperature to provide sufficient thermal bonding. In
addition, this arbor press may not consistently have even contact across the heated die
and the cartridge surfaces, yielding one edge of the thermal bond ineffective. We are
currently investigating strategies to mitigate this issue.
Moreover, the previous studies demonstrating amplification in the cartridges were
performed by bypassing the upstream fluidic channels and chambers leading into the
reaction pouch. For these studies, the LAMP master-mix was injected directly into the
reaction pouches. For the current studies, the master-mix is now injected through the
sample port, exposing the reaction mixture to a higher amount of plastic surface area in
the upstream channels and chambers. We had demonstrated polycarbonate assay
compatibility in earlier studies, but noted that these cartridges had been exposed to UV
radiation while the insert-molded electrodes in the polycarbonate core were secured in
place with UV glue. We then tested the irradiated polycarbonate for possible inhibition,
but none was observed.
Finally, in our work with the initial cartridge prototype (Chapter 2), we observed
that the cartridges required higher concentrations of BSA in the master-mix as compared
to standard reaction tubes (Appendix F). We hypothesize that this increase in BSA
concentration is necessary to mitigate non-specific adsorption of enzyme to the plastic
surfaces in the cartridges. Therefore, with the increase in plastic surface area from the
upstream fluidic channels and chambers in this refined cartridge prototype, we will
investigate increasing the BSA concentration in the master-mix to possibly passivate
these surfaces.
67
Conclusions
We refined the amplification and detection prototype cartridge and instrument to perform
the necessary fluidic and thermal control operations for automated isothermal nucleic
acid amplification coupled to visual lateral flow detection. The system utilizes
economical and scalable manufacturing techniques as a step toward point-of-care
infectious disease diagnosis in low-resource settings. Additionally, we developed and
implemented in this cartridge low cost fluidic components such as passive valves,
electrolytic pumps, and hydrophobic vents. We have characterized and verified
appropriate performance of the key fluid handling and thermal control components, have
demonstrated that the system can execute the entire process sequence, and, in a
preliminary experiment, have demonstrated the detection of 3000 copies of purified M.tb
genomic DNA via isothermal LAMP amplification using this disposable cartridge and
instrument. We have transferred the cartridge manufacturing to a clean environment to
mitigate contamination risk, and have manufactured 10 cartridges in this environment.
Preliminary tests have revealed technical issues with these cartridges, which we are
currently addressing. We anticipate these issues will be resolved soon, rendering the
refined amplification and detection subunit fully-functional.
68
CHAPTER 5: REAGENT STORAGE AND RECONSTITUTION
Introduction
Point of care diagnostics intended for low-resource settings must be suitably designed for
the targeted use environment. For example, many health care facilities in low-resource
countries lack un-interrupted access to electricity, making reagent refrigeration
impossible. Moreover, distribution to remote health care facilities cannot rely on cold-
chain transportation, since this infrastructure is nonexistent in the majority of these
settings. Therefore, reagents need to be incorporated in the device in a stabilized form to
withstand prolonged exposure to ambient and above ambient temperatures. Additionally,
health care workers at these facilities have minimal training, and lack the required tools
to precisely measure and combine reagents. Therefore, reagents need to be aliquoted and
stored on-board the disposable cartridges.
Different reagent stabilization approaches for nucleic acid testing systems have
been reported. In settings where refrigeration is available, master-mix reagents can be
stored in reagent packs or pre-measured on-board cassettes in reservoirs or pouches.33,81
Lyophilization of master-mix reagents for recombinase polymerase amplification (RPA),
82 and LAMP,
82,83 plus commercially-available PCR beads (Illustra “PuRe Taq Ready-
To-Go PCR beads,” GE Healthcare, Piscataway, NJ),84
have been demonstrated as a
viable stabilization method. In most cases, excipients are added to the reagents to aid in
preservation, such as trehalose, a protein-stabilizer. Additionally, to ensure proper
consistency of the lyophilized material, a bulking agent, such as dextran, is often added.
However, lyophilization of master-mix reagents cannot be performed on regular
laboratory lyophilizers used to prepare purified peptides and proteins for storage. Master-
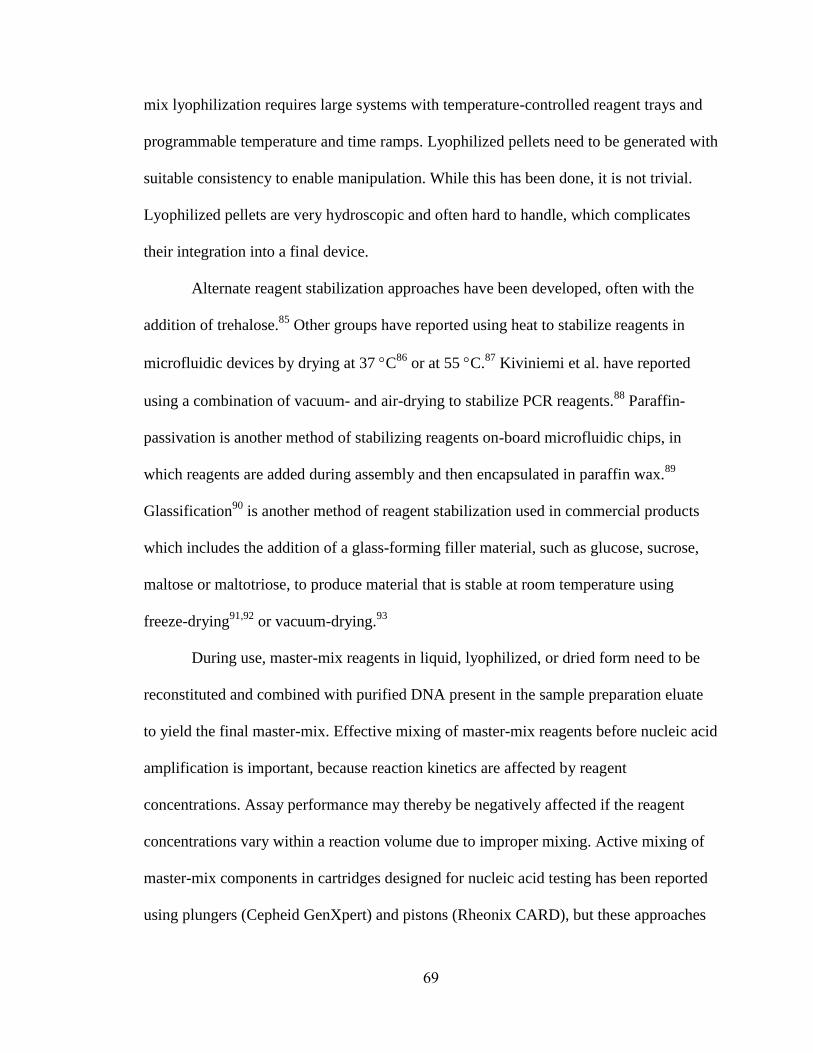
69
mix lyophilization requires large systems with temperature-controlled reagent trays and
programmable temperature and time ramps. Lyophilized pellets need to be generated with
suitable consistency to enable manipulation. While this has been done, it is not trivial.
Lyophilized pellets are very hydroscopic and often hard to handle, which complicates
their integration into a final device.
Alternate reagent stabilization approaches have been developed, often with the
addition of trehalose.85
Other groups have reported using heat to stabilize reagents in
microfluidic devices by drying at 37 C86
or at 55 C.87
Kiviniemi et al. have reported
using a combination of vacuum- and air-drying to stabilize PCR reagents.88
Paraffin-
passivation is another method of stabilizing reagents on-board microfluidic chips, in
which reagents are added during assembly and then encapsulated in paraffin wax.89
Glassification90
is another method of reagent stabilization used in commercial products
which includes the addition of a glass-forming filler material, such as glucose, sucrose,
maltose or maltotriose, to produce material that is stable at room temperature using
freeze-drying91,92
or vacuum-drying.93
During use, master-mix reagents in liquid, lyophilized, or dried form need to be
reconstituted and combined with purified DNA present in the sample preparation eluate
to yield the final master-mix. Effective mixing of master-mix reagents before nucleic acid
amplification is important, because reaction kinetics are affected by reagent
concentrations. Assay performance may thereby be negatively affected if the reagent
concentrations vary within a reaction volume due to improper mixing. Active mixing of
master-mix components in cartridges designed for nucleic acid testing has been reported
using plungers (Cepheid GenXpert) and pistons (Rheonix CARD), but these approaches
70
require additional hardware, thereby increasing the system cost and complexity. Passive
mixing by diffusion is a viable option if the diffusion length is held to a minimum and the
reaction volume can be contained in a single chamber for a set period of time to allow for
diffusive mixing to reach the final equilibrium.
The refined amplification and detection cartridge described in Chapter 4 was
designed to hold a lyophilized master-mix pellet in a conical chamber (Figure 20). We
generated lyophilized LAMP reagent pellets suitable for integration into this chamber in
collaboration with, and using the state-of-the-art lyophilization equipment at, the Program
for Appropriate Technology in Health (PATH, Seattle, WA). These pellets produced
promising amplification results when reconstituted and amplified in standard PCR tubes.
However, on the cartridge, we found that the reconstitution process did not enable
uniform and effective mixing. The cartridge design assumes that the eluate from the
sample preparation module is pumped into the conical chamber, where it re-hydrates the
master-mix pellet. After incubating the liquid in this chamber for a suitable time to ensure
uniform passive mixing, the final reaction mixture would be pumped into the reaction
pouch. In reality, the initial fluid front entering the conical chamber was quickly wicked
into the pellet, drawing a small volume out of the upstream fluid channel and introducing
an air bubble into the fluid path (Figure 20b). This air bubble prevented the reaction fluid
from mixing as one continuous volume. Subsequent pumping to move the liquid out of
the conical chamber led to the initial fluid front containing highly concentrated
reconstituted reagents exiting first (Figure 20(ii)), followed by an air bubble, and a
second volume with much lower reagent concentration (Figure 20b(i)). Although the air
bubble can be removed through the hydrophobic barrier, the liquid entering the reaction
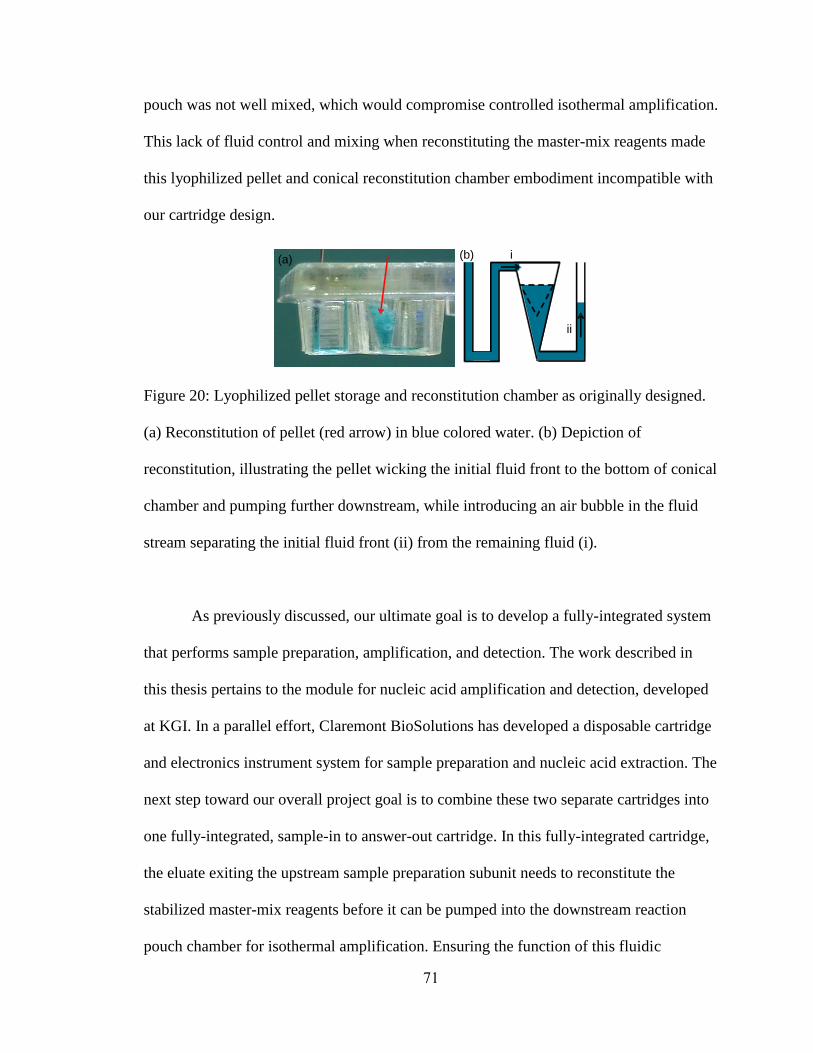
71
pouch was not well mixed, which would compromise controlled isothermal amplification.
This lack of fluid control and mixing when reconstituting the master-mix reagents made
this lyophilized pellet and conical reconstitution chamber embodiment incompatible with
our cartridge design.
Figure 20: Lyophilized pellet storage and reconstitution chamber as originally designed.
(a) Reconstitution of pellet (red arrow) in blue colored water. (b) Depiction of
reconstitution, illustrating the pellet wicking the initial fluid front to the bottom of conical
chamber and pumping further downstream, while introducing an air bubble in the fluid
stream separating the initial fluid front (ii) from the remaining fluid (i).
As previously discussed, our ultimate goal is to develop a fully-integrated system
that performs sample preparation, amplification, and detection. The work described in
this thesis pertains to the module for nucleic acid amplification and detection, developed
at KGI. In a parallel effort, Claremont BioSolutions has developed a disposable cartridge
and electronics instrument system for sample preparation and nucleic acid extraction. The
next step toward our overall project goal is to combine these two separate cartridges into
one fully-integrated, sample-in to answer-out cartridge. In this fully-integrated cartridge,
the eluate exiting the upstream sample preparation subunit needs to reconstitute the
stabilized master-mix reagents before it can be pumped into the downstream reaction
pouch chamber for isothermal amplification. Ensuring the function of this fluidic
(a) (b) i
ii
72
interface between the sample preparation and amplification and detection modules is
critical for the overall project effort. Therefore, we decided to develop and demonstrate
suitable performance of a reagent storage and reconstitution method within a separate
fluidic module, designed to act as the interface between the sample preparation module,
and the amplification and detection module (Figure 21).
Figure 21: Original system overview diagram. Red area highlights the fluidics interface
between sample preparation and amplification and detection, which needs to store
stabilized master-mix reagents until they can be reconstituted by purified sample
preparation eluate and pumped into the reaction pouch chamber. The initial design
incorporated lyophilization to stabilize the master-mix reagents.
System Overview
The goal for the fluidic interface module is two-fold: (1) to provide a mechanism for
storing dry master-mix reagents in a stabilized form, and (2) to provide a mechanism by
which master-mix reagents can be reconstituted with purified sample preparation eluate,
resulting in a homogeneous master-mix which then can be pumped downstream into the
reaction pouch.
The fluidic interface module design is based on a novel reagent stabilization
approach, utilizing master-mix reagents lyophilized onto a microfiber material. This
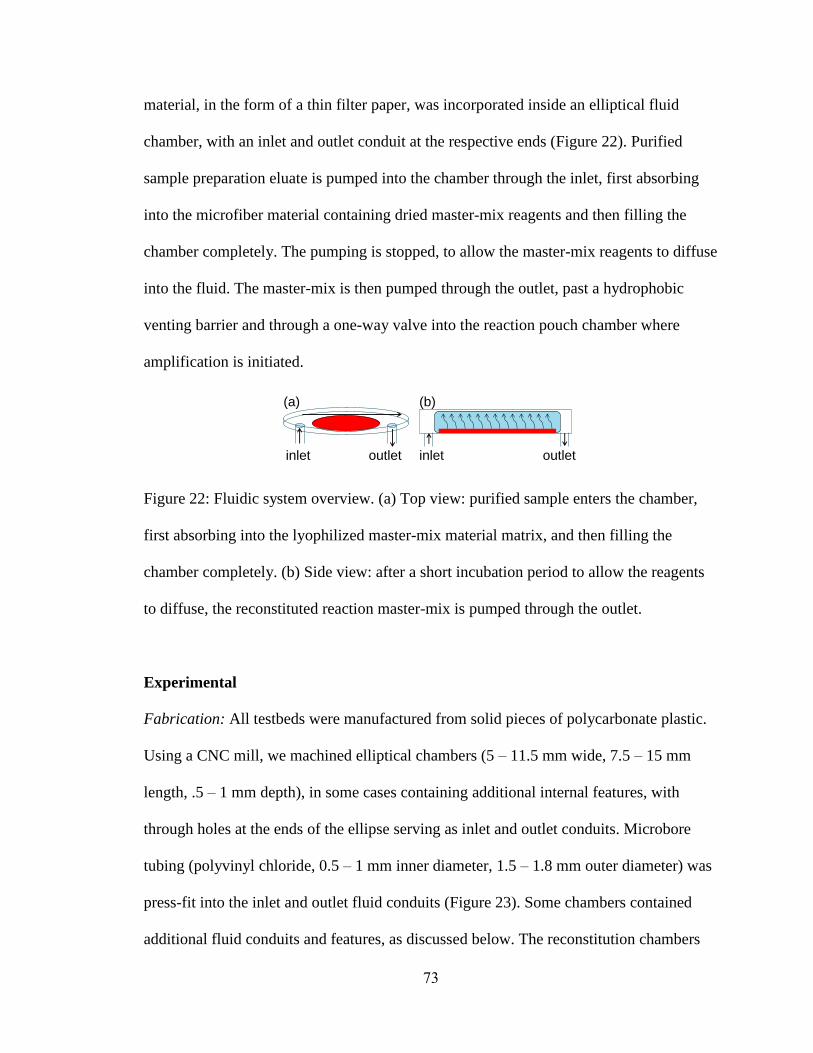
73
material, in the form of a thin filter paper, was incorporated inside an elliptical fluid
chamber, with an inlet and outlet conduit at the respective ends (Figure 22). Purified
sample preparation eluate is pumped into the chamber through the inlet, first absorbing
into the microfiber material containing dried master-mix reagents and then filling the
chamber completely. The pumping is stopped, to allow the master-mix reagents to diffuse
into the fluid. The master-mix is then pumped through the outlet, past a hydrophobic
venting barrier and through a one-way valve into the reaction pouch chamber where
amplification is initiated.
Figure 22: Fluidic system overview. (a) Top view: purified sample enters the chamber,
first absorbing into the lyophilized master-mix material matrix, and then filling the
chamber completely. (b) Side view: after a short incubation period to allow the reagents
to diffuse, the reconstituted reaction master-mix is pumped through the outlet.
Experimental
Fabrication: All testbeds were manufactured from solid pieces of polycarbonate plastic.
Using a CNC mill, we machined elliptical chambers (5 – 11.5 mm wide, 7.5 – 15 mm
length, .5 – 1 mm depth), in some cases containing additional internal features, with
through holes at the ends of the ellipse serving as inlet and outlet conduits. Microbore
tubing (polyvinyl chloride, 0.5 – 1 mm inner diameter, 1.5 – 1.8 mm outer diameter) was
press-fit into the inlet and outlet fluid conduits (Figure 23). Some chambers contained
additional fluid conduits and features, as discussed below. The reconstitution chambers
inlet outlet
(a)
inlet outlet
(b)
74
and all additional fluid conduits on all testbed embodiments were sealed closed using
PCR film.
We integrated a refined venting chamber into this fluidics interface module to
expel any dead air trapped in the fluid channels prior to introducing the master-mix into
the reaction chamber. Early testbed embodiments (Figure 24) utilized commercially-
available hydrophobic barriers (Qosina), while the final refined version incorporated
custom venting barriers manufactured from a polypropylene-backed PTFE filter
membrane, previously described in Chapter 4. When using custom venting barriers, the
filter membrane was heat-sealed onto the polycarbonate testbed using the heated arbor
press. For the refined design (Figure 25), the outlet of the reconstitution chamber is
connected to the inlet of the venting chamber via a fluid channel on the underside of the
testbed. The outlet of the venting chamber is connected to the polypropylene reaction
insert through a boss that protrudes from the underside of the testbed.
Fluidics Testing of Microfiber Materials: We tested several possible microfiber materials
as a matrix onto which the master-mix reagents can be dried (Table 7). Using the testbed
embodiment shown in Figure 23(a), a piece of microfiber material cut into the
appropriate elliptical shape was placed in each chamber, which was then sealed closed
using PCR film. We determined the volume of unrecoverable fluid inside the chamber
containing the microfiber material in the following manner: a liquid plug of ~ 150 µL
was injected using a syringe into the inlet tubing upstream of the reaction chamber. The
specific volume of fluid was determined by measuring the length of the fluid plug in the
inlet tubing, and then calculating the total volume using the inner diameter of the tubing.
75
The liquid plug was then manually pushed into the reconstitution chamber, where it was
incubated for ~ 1 min. The fluid was then manually pushed out of the chamber and into
the outlet tubing, at a flow rate of approximately 100 µL / min. The amount of fluid
recovered from the reaction chamber was determined again by measuring the length of
the fluid plug in the outlet tubing, and then calculating the volume based on the inner
diameter of the tubing.
Table 7: Key dimensions and physical parameters for support materials.
Product Name Material Typical Thickness
(µm)
Water Absorption
(mg/cm2)
CF1a
100% cotton linter,
light, thin grade 175 ± 26
16
GF/Ab Unbound glass microfiber 271 98
CF3a
100% cotton linter,
medium weight 335 ± 49
31
Fusion 5 a
Proprietary FUSION material,
single-layer matrix 350 ± 40
40
a GE Healthcare.
b Whatman, a division of GE Healthcare.
Stabilizing Master-Mix Reagents: The reagent stabilization studies presented herein
focused on developing a dry master-mix formulation for the LAMP M.tb assay discussed
in Chapters 2 and 4. Elliptical pieces of microfiber material were pre-treated by dipping
them into a solution containing 2 % trehalose and 0.4 mg/mL BSA. The pieces were then
placed inside standard 1.5 mL tubes, and were allowed to dry overnight at ambient
temperature.
Next, ~ 30 µL of master-mix reagents (5X concentrated) were then pipetted onto
the pretreated pads inside the 1.5 mL tubes. The tubes were then placed inside a Savant
76
Speed Vac Concentrator, which was attached to a Labconco Freeze Dry System/Freezone
4.5. During the drying process, the rotor of the Speed Vac containing the samples was
spun at 1300-1600 RPM, while the Labconco lyophilizer was pulling a vacuum of ~ 0.1
torr, with the cooling coil inside the lyophilizer set to - 40 C.
The 5X concentrated master-mix solution contained 2 % trehalose and other
standard reaction buffer components (Tris, KCl, (NH4)2SO4). For initial studies, only one
of the more sensitive master-mix reagents (primer oligonucleotides, dNTPs and Bst
polymerase) was added to the concentrated master-mix at a time. For reconstitution, the
remaining LAMP master-mix reagents that were not included in the drying process were
combined into a 150 µL volume. The microfiber pieces containing the dried reagents
were incubated in this reconstitution volume in a 1.5 mL tube, to enable the dried master-
mix reagents to be released from the microfiber matrix. After incubating, the fluid was
withdrawn from the tube and transferred to standard PCR tubes, followed by isothermal
amplification on a Bio-Rad OpticonII real-time fluorescence PCR thermocycler, set to a
constant temperature of 63 C.
Results and Discussion
Reconstitution Chamber Design: The reconstitution chamber shape was designed to
enable uniform filling of the chamber with incoming liquid, and to maximize fluid
recovery out of the chamber after the master-mix reagents have reconstituted. There are
two main mechanisms that prevent fluid from being recovered from the reconstitution
chamber when air is pumped into the chamber: (1) fluid can be left behind in “free space”
once the air has navigated a path from the inlet to the outlet of the chamber, and (2) fluid
can be retained inside the microfiber material matrix.
77
We selected an eliptical chamber shape approximately 11 mm wide, 15 mm long,
and 1 mm deep, which provided a sufficiently large internal volume, and enabled
reasonably uniform fluid filling and emptying due to the absence of sharp features. Based
on related discussions with microfluidics experts, we investigated internal features for the
reconstitution chamber, such as pillars and chevrons, to facilitate fluid mixing and to trap
any air bubbles formed in the chamber (Figure 23). However, initial studies determined
that sharp edges and/or topographical features inside the chamber lead to non-uniform
chamber filling as well as the introduction of air bubbles and large dead volumes that
could not be recovered when the fluid was pumped out of the chamber. Therefore, all
future experiments were performed without additional structures within the chamber.
78
Figure 23: Investigation of different reconstitution chamber geometries. For each case,
showing (i) empty chamber, (ii) partially filled chamber, and (iii) chamber after as much
fluid could be emptied as possible. (a) Ellipse without any structures. (b) Ellipse with
structure in front of outlet intended to catch any air trapped in the chamber. (c) Ellipse
with chevron structures intended to enhance mixing in the chamber. (d) Ellipse with
cylindrical pillars intended to enhance mixing in the chamber. All structures inhibited
(a)
(b)
(c)
(d)
(i) (ii) (iii)
79
emptying of the chambers, leaving large dead volumes of unrecoverable fluid in the
chambers. The empty ellipse shape (a) had the largest fluid recovery.
We observed that, even for the chambers without internal features, when
emptying the chambers with an air chase, the amount of fluid left behind was
irreproducible. As soon as the air pushed into the chamber behind the liquid found a path
to the outlet, all remaining fluid in the chamber was unrecoverable. We hypothesize that
this behavior is related to the properties of the chamber geometry and the inclusion of the
cotton microfiber material into the reconstitution chamber. The Hele-Shaw cell is a well-
characterized model investigating viscous fluid confined between closely spaced parallel
sheets of glass. Experiments have shown that instability develops at the interface between
fluids of different densities, resulting in round-ended “fingers” of less dense fluid
penetrating the more dense fluid.94-96
If we assume that the reconstitution chamber can be
modeled as a Hele-Shaw cell, this would explain the “fingering” seen in the empty
chamber experiments where the air finds a path from the inlet to the outlet, leaving
unrecoverable fluid in the chamber. Additionally, Hele-Shaw would suggest that there
will always be unrecoverable fluid in the empty chamber.
However, introducing the cotton microfiber pad into the reconstitution chamber
disrupts this system in such a way that the “finger” mechanism is no longer the driving
force. Experiments have shown that, as the surface-tension affects become more
important, the “finger” widens to fill the channel.97
Focusing on the reconstitution
chamber shown here, the cotton pad is more hydrophilic than the polycarbonate in the
empty chamber case. Therefore, with the inclusion of the cotton pad, the surface tension
80
between the water above and the water inside the cotton pad becomes significant,
resulting in the incoming air “finger” widening to expel all the water in the space above
the cotton pad.
Volume Requirements: In our cartridge design (Chapters 2 and 4), a minimum of 75 –
100 µL of amplified master-mix needs to be pushed out of the reaction chamber and onto
the lateral flow strips to ensure optimal performance, since we do not employ a separate
lateral flow strip running buffer. This volume serves as the minimum required amount of
fluid that needs to be recovered from the reaction pouch chambers. Accounting for
additional dead volumes in the valves and fluid conduits leading into and out of the
reaction chamber range (~ 10 uL), and the dead volume underneath the hydrophobic
venting barrier ( ~ 25 uL in the refined design), we can estimate approximately 50 µL of
reaction fluid lost in the fluid conduits downstream from the reconstitution chamber.
Therefore, we need to recover ~ 150 µL of reconstituted master-mix from the
reconstitution chamber to ensure proper performance of downstream processes.
The original fully-integrated cartridge design entailed splitting the purified sample
preparation eluate into two reaction chambers. Assuming no fluid losses in the
reconsititution chamber, this would require at least 300 µL of sample preparation eluate.
Initial studies have indicated that the sample preparation module comfortably can yield ~
200 µL eluate, but 300 µL would be very difficult to obtain reproducibly. It further is
unrealistic to assume no fluid losses in the reconstitution chamber. For this and other
reasons related to overall size, cost, and complexity, we recently decided to simplify the
fully-integrated cartridge system to contain only one reaction chamber. Therefore, if 150
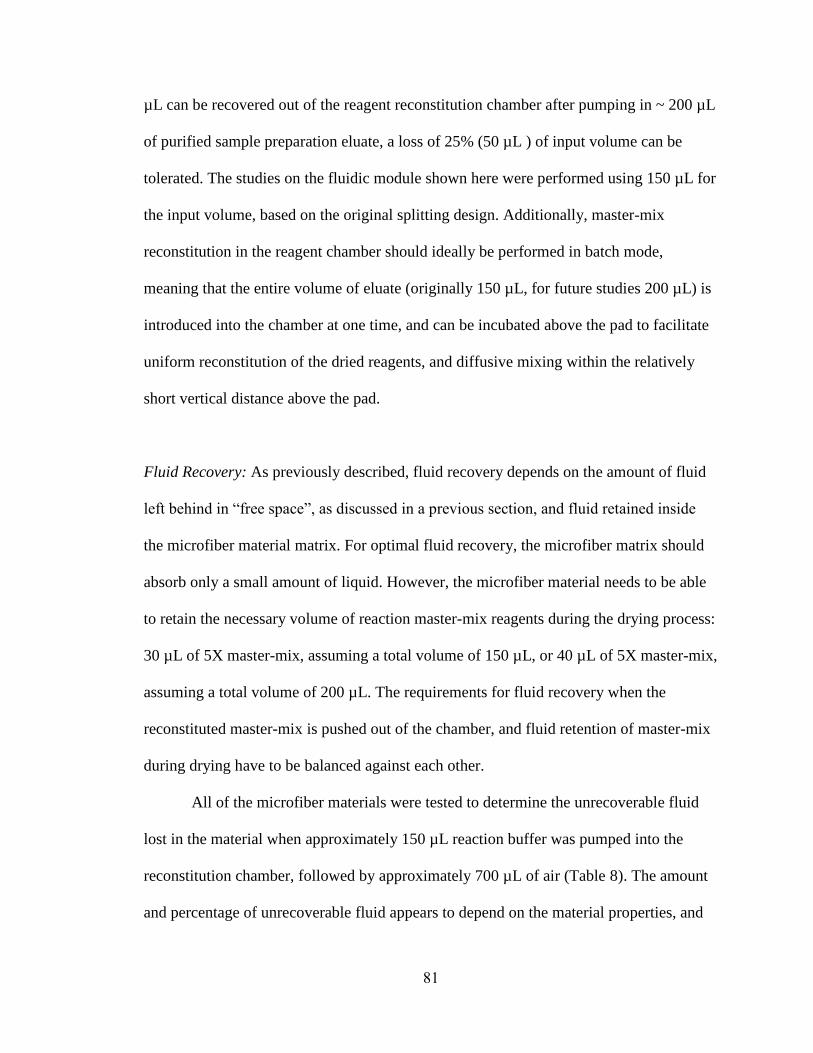
81
µL can be recovered out of the reagent reconstitution chamber after pumping in ~ 200 µL
of purified sample preparation eluate, a loss of 25% (50 µL ) of input volume can be
tolerated. The studies on the fluidic module shown here were performed using 150 µL for
the input volume, based on the original splitting design. Additionally, master-mix
reconstitution in the reagent chamber should ideally be performed in batch mode,
meaning that the entire volume of eluate (originally 150 µL, for future studies 200 µL) is
introduced into the chamber at one time, and can be incubated above the pad to facilitate
uniform reconstitution of the dried reagents, and diffusive mixing within the relatively
short vertical distance above the pad.
Fluid Recovery: As previously described, fluid recovery depends on the amount of fluid
left behind in “free space”, as discussed in a previous section, and fluid retained inside
the microfiber material matrix. For optimal fluid recovery, the microfiber matrix should
absorb only a small amount of liquid. However, the microfiber material needs to be able
to retain the necessary volume of reaction master-mix reagents during the drying process:
30 µL of 5X master-mix, assuming a total volume of 150 µL, or 40 µL of 5X master-mix,
assuming a total volume of 200 µL. The requirements for fluid recovery when the
reconstituted master-mix is pushed out of the chamber, and fluid retention of master-mix
during drying have to be balanced against each other.
All of the microfiber materials were tested to determine the unrecoverable fluid
lost in the material when approximately 150 µL reaction buffer was pumped into the
reconstitution chamber, followed by approximately 700 µL of air (Table 8). The amount
and percentage of unrecoverable fluid appears to depend on the material properties, and
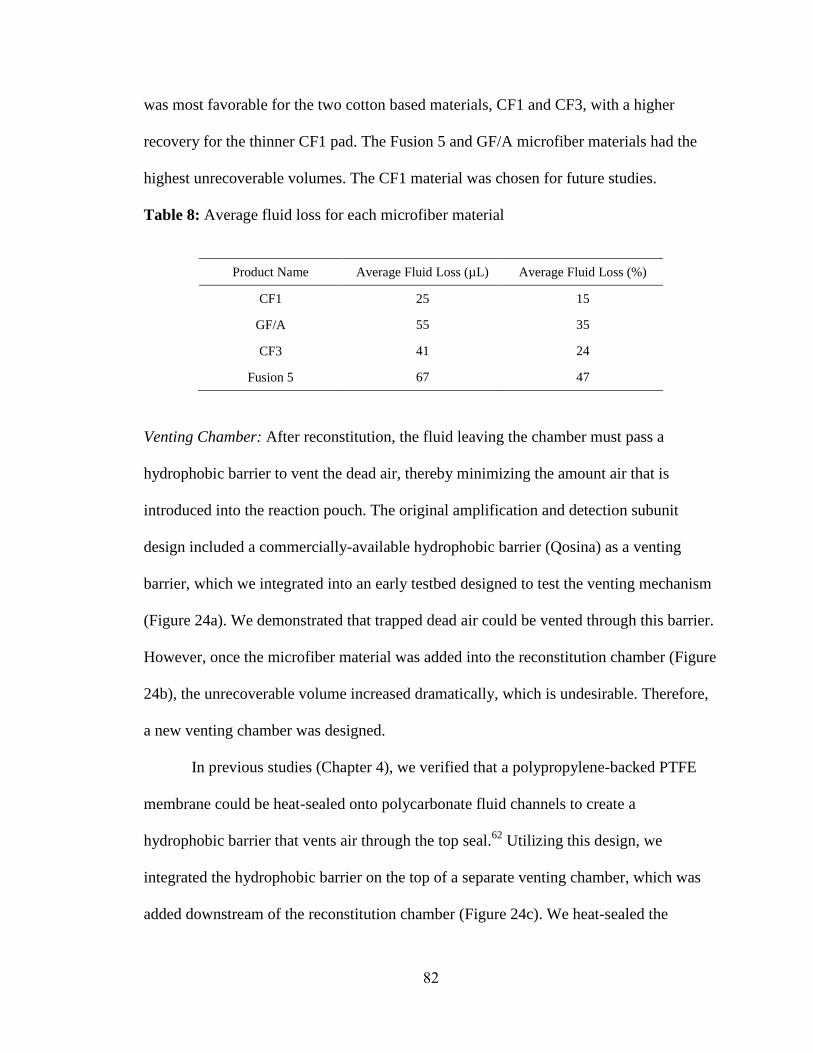
82
was most favorable for the two cotton based materials, CF1 and CF3, with a higher
recovery for the thinner CF1 pad. The Fusion 5 and GF/A microfiber materials had the
highest unrecoverable volumes. The CF1 material was chosen for future studies.
Table 8: Average fluid loss for each microfiber material
Product Name Average Fluid Loss (µL) Average Fluid Loss (%)
CF1 25 15
GF/A 55 35
CF3 41 24
Fusion 5 67 47
Venting Chamber: After reconstitution, the fluid leaving the chamber must pass a
hydrophobic barrier to vent the dead air, thereby minimizing the amount air that is
introduced into the reaction pouch. The original amplification and detection subunit
design included a commercially-available hydrophobic barrier (Qosina) as a venting
barrier, which we integrated into an early testbed designed to test the venting mechanism
(Figure 24a). We demonstrated that trapped dead air could be vented through this barrier.
However, once the microfiber material was added into the reconstitution chamber (Figure
24b), the unrecoverable volume increased dramatically, which is undesirable. Therefore,
a new venting chamber was designed.
In previous studies (Chapter 4), we verified that a polypropylene-backed PTFE
membrane could be heat-sealed onto polycarbonate fluid channels to create a
hydrophobic barrier that vents air through the top seal.62
Utilizing this design, we
integrated the hydrophobic barrier on the top of a separate venting chamber, which was
added downstream of the reconstitution chamber (Figure 24c). We heat-sealed the
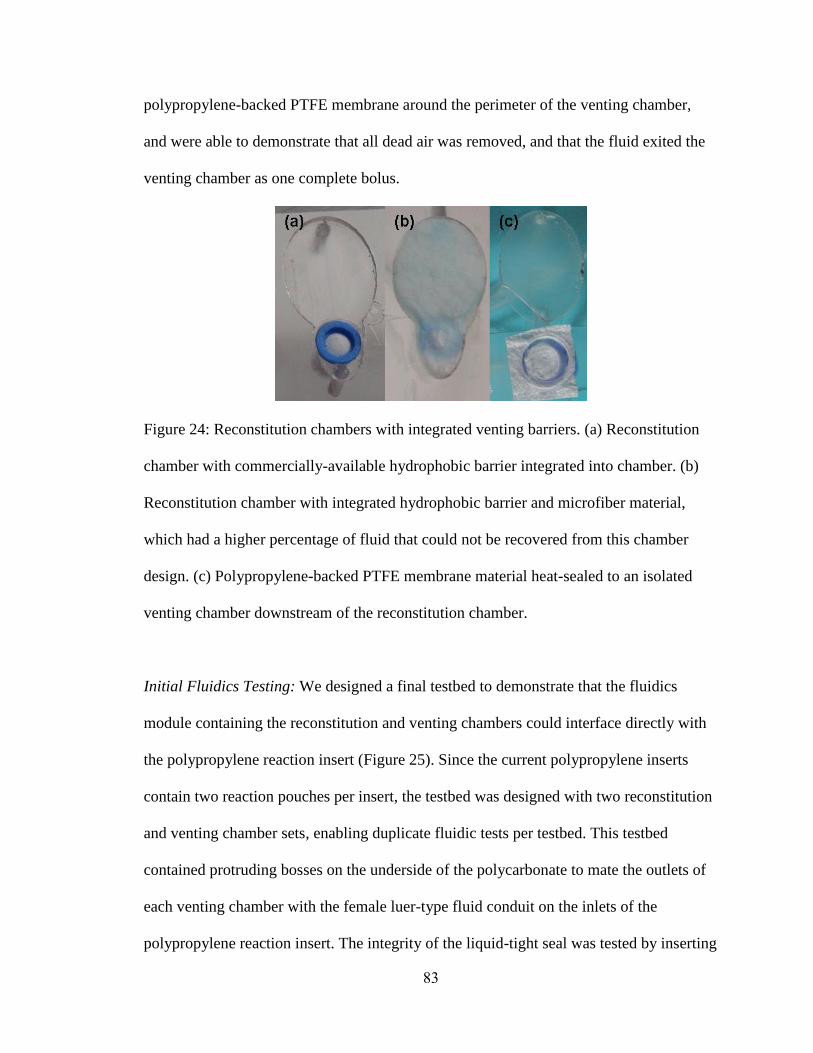
83
polypropylene-backed PTFE membrane around the perimeter of the venting chamber,
and were able to demonstrate that all dead air was removed, and that the fluid exited the
venting chamber as one complete bolus.
Figure 24: Reconstitution chambers with integrated venting barriers. (a) Reconstitution
chamber with commercially-available hydrophobic barrier integrated into chamber. (b)
Reconstitution chamber with integrated hydrophobic barrier and microfiber material,
which had a higher percentage of fluid that could not be recovered from this chamber
design. (c) Polypropylene-backed PTFE membrane material heat-sealed to an isolated
venting chamber downstream of the reconstitution chamber.
Initial Fluidics Testing: We designed a final testbed to demonstrate that the fluidics
module containing the reconstitution and venting chambers could interface directly with
the polypropylene reaction insert (Figure 25). Since the current polypropylene inserts
contain two reaction pouches per insert, the testbed was designed with two reconstitution
and venting chamber sets, enabling duplicate fluidic tests per testbed. This testbed
contained protruding bosses on the underside of the polycarbonate to mate the outlets of
each venting chamber with the female luer-type fluid conduit on the inlets of the
polypropylene reaction insert. The integrity of the liquid-tight seal was tested by inserting
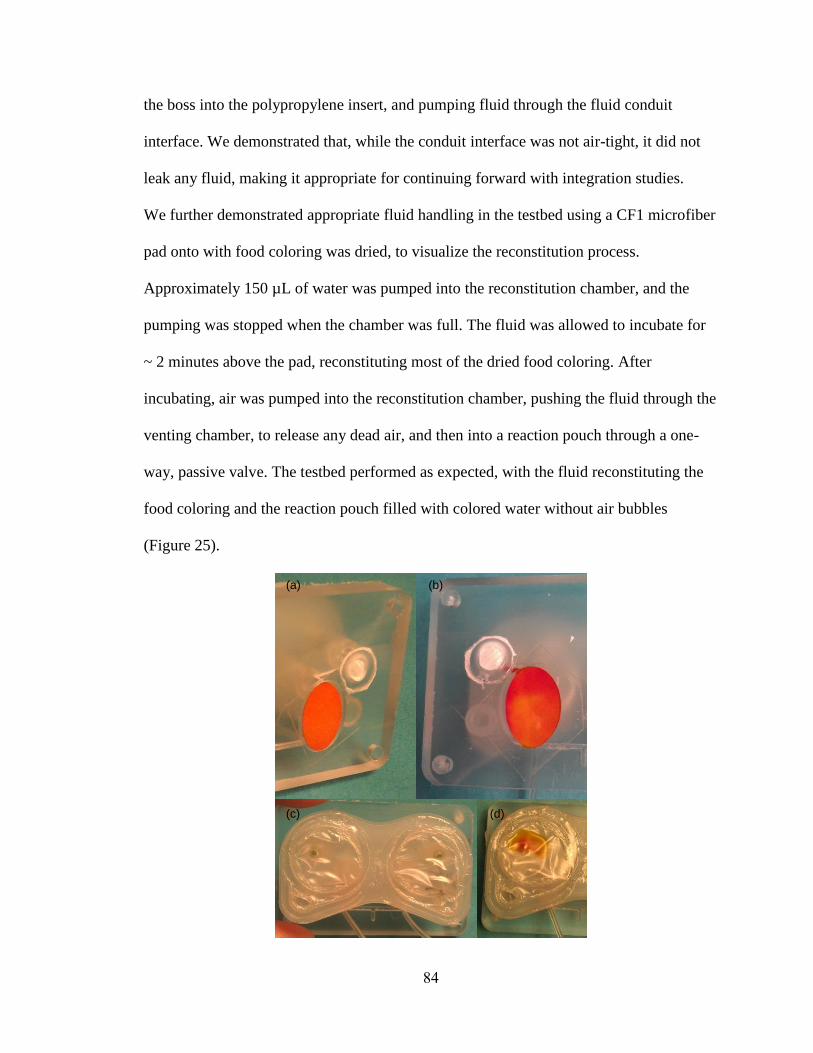
84
the boss into the polypropylene insert, and pumping fluid through the fluid conduit
interface. We demonstrated that, while the conduit interface was not air-tight, it did not
leak any fluid, making it appropriate for continuing forward with integration studies.
We further demonstrated appropriate fluid handling in the testbed using a CF1 microfiber
pad onto with food coloring was dried, to visualize the reconstitution process.
Approximately 150 µL of water was pumped into the reconstitution chamber, and the
pumping was stopped when the chamber was full. The fluid was allowed to incubate for
~ 2 minutes above the pad, reconstituting most of the dried food coloring. After
incubating, air was pumped into the reconstitution chamber, pushing the fluid through the
venting chamber, to release any dead air, and then into a reaction pouch through a one-
way, passive valve. The testbed performed as expected, with the fluid reconstituting the
food coloring and the reaction pouch filled with colored water without air bubbles
(Figure 25).
(a) (b)
(c) (d)
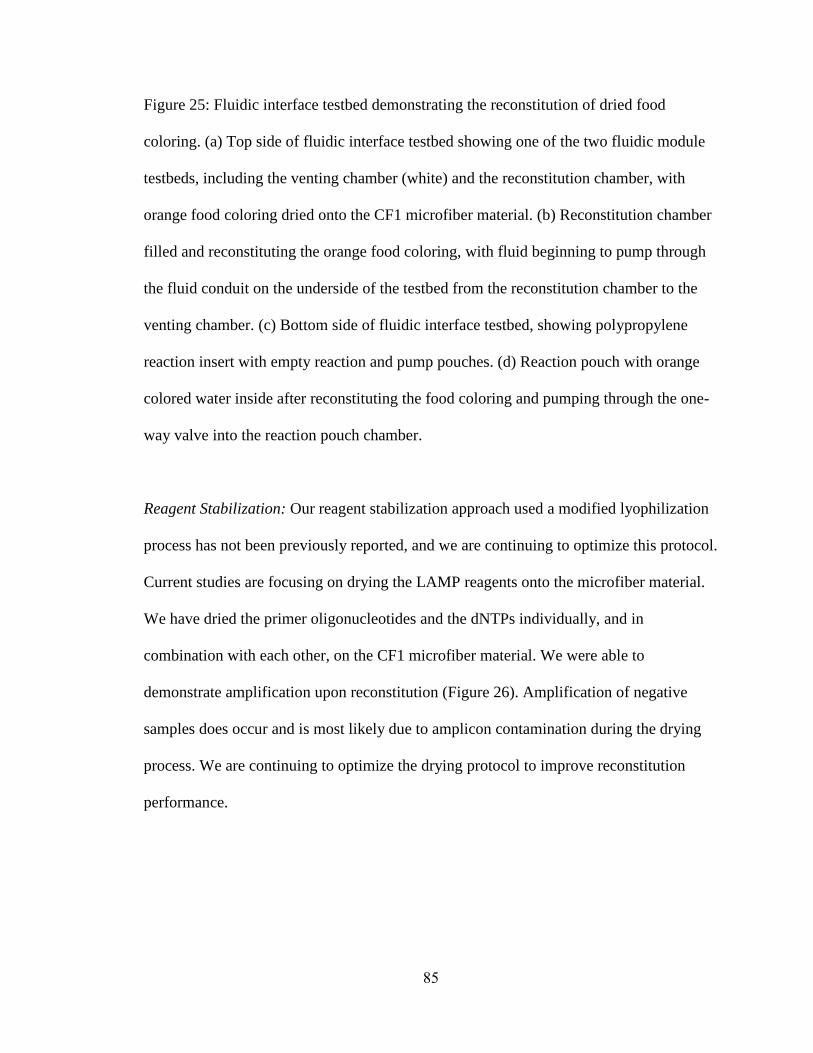
85
Figure 25: Fluidic interface testbed demonstrating the reconstitution of dried food
coloring. (a) Top side of fluidic interface testbed showing one of the two fluidic module
testbeds, including the venting chamber (white) and the reconstitution chamber, with
orange food coloring dried onto the CF1 microfiber material. (b) Reconstitution chamber
filled and reconstituting the orange food coloring, with fluid beginning to pump through
the fluid conduit on the underside of the testbed from the reconstitution chamber to the
venting chamber. (c) Bottom side of fluidic interface testbed, showing polypropylene
reaction insert with empty reaction and pump pouches. (d) Reaction pouch with orange
colored water inside after reconstituting the food coloring and pumping through the one-
way valve into the reaction pouch chamber.
Reagent Stabilization: Our reagent stabilization approach used a modified lyophilization
process has not been previously reported, and we are continuing to optimize this protocol.
Current studies are focusing on drying the LAMP reagents onto the microfiber material.
We have dried the primer oligonucleotides and the dNTPs individually, and in
combination with each other, on the CF1 microfiber material. We were able to
demonstrate amplification upon reconstitution (Figure 26). Amplification of negative
samples does occur and is most likely due to amplicon contamination during the drying
process. We are continuing to optimize the drying protocol to improve reconstitution
performance.
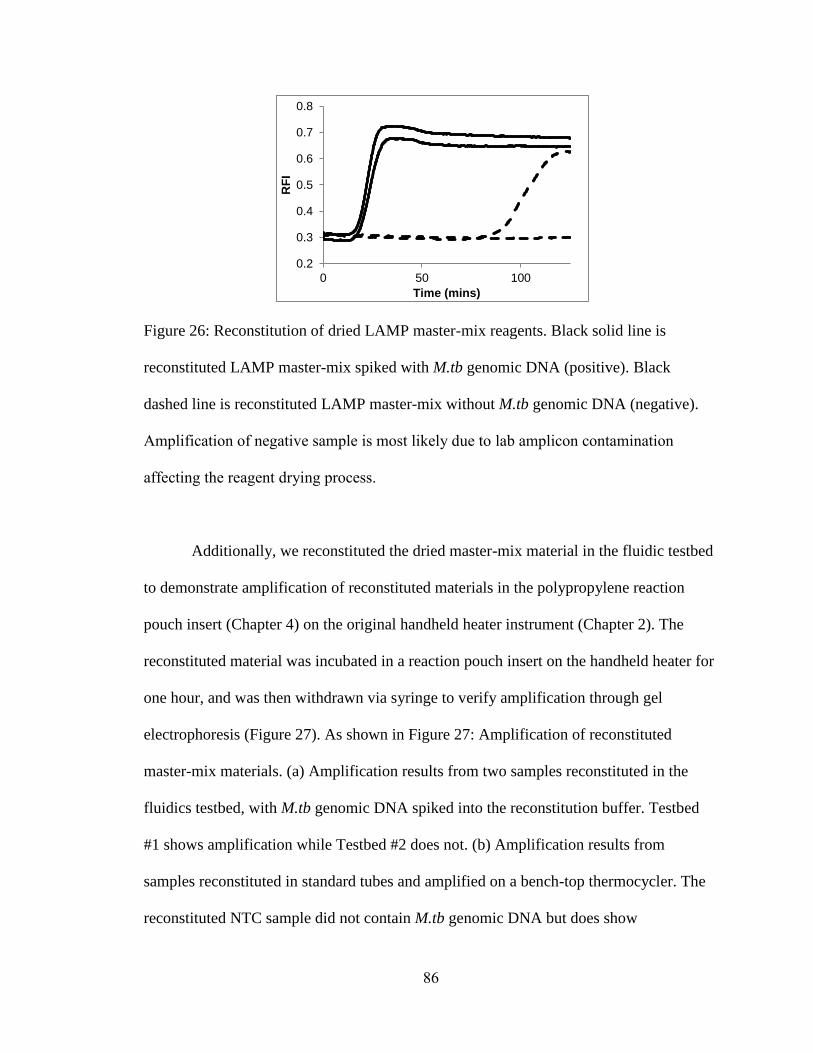
86
Figure 26: Reconstitution of dried LAMP master-mix reagents. Black solid line is
reconstituted LAMP master-mix spiked with M.tb genomic DNA (positive). Black
dashed line is reconstituted LAMP master-mix without M.tb genomic DNA (negative).
Amplification of negative sample is most likely due to lab amplicon contamination
affecting the reagent drying process.
Additionally, we reconstituted the dried master-mix material in the fluidic testbed
to demonstrate amplification of reconstituted materials in the polypropylene reaction
pouch insert (Chapter 4) on the original handheld heater instrument (Chapter 2). The
reconstituted material was incubated in a reaction pouch insert on the handheld heater for
one hour, and was then withdrawn via syringe to verify amplification through gel
electrophoresis (Figure 27). As shown in Figure 27: Amplification of reconstituted
master-mix materials. (a) Amplification results from two samples reconstituted in the
fluidics testbed, with M.tb genomic DNA spiked into the reconstitution buffer. Testbed
#1 shows amplification while Testbed #2 does not. (b) Amplification results from
samples reconstituted in standard tubes and amplified on a bench-top thermocycler. The
reconstituted NTC sample did not contain M.tb genomic DNA but does show
0.2
0.3
0.4
0.5
0.6
0.7
0.8
0 50 100R
FI
Time (mins)
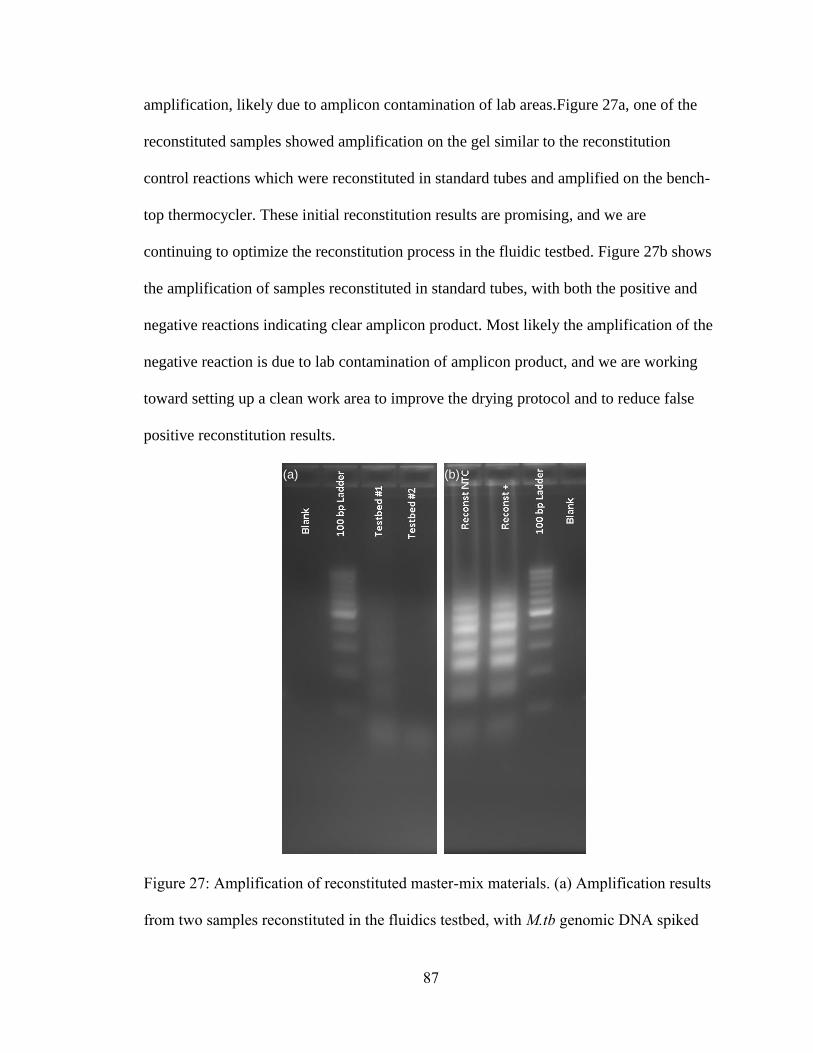
87
amplification, likely due to amplicon contamination of lab areas.Figure 27a, one of the
reconstituted samples showed amplification on the gel similar to the reconstitution
control reactions which were reconstituted in standard tubes and amplified on the bench-
top thermocycler. These initial reconstitution results are promising, and we are
continuing to optimize the reconstitution process in the fluidic testbed. Figure 27b shows
the amplification of samples reconstituted in standard tubes, with both the positive and
negative reactions indicating clear amplicon product. Most likely the amplification of the
negative reaction is due to lab contamination of amplicon product, and we are working
toward setting up a clean work area to improve the drying protocol and to reduce false
positive reconstitution results.
Figure 27: Amplification of reconstituted master-mix materials. (a) Amplification results
from two samples reconstituted in the fluidics testbed, with M.tb genomic DNA spiked
(a) (b)
88
into the reconstitution buffer. Testbed #1 shows amplification while Testbed #2 does not.
(b) Amplification results from samples reconstituted in standard tubes and amplified on a
bench-top thermocycler. The reconstituted NTC sample did not contain M.tb genomic
DNA but does show amplification, likely due to amplicon contamination of lab areas.
Conclusions
We developed a novel reagent storage and reconstitution module to serve as the interface
between the sample preparation subunit and the amplification and detection subunit in
our fully-integrated disposable cartridge. This module will replace the original conical
reconstitution chamber design from our previous amplification and detection cartridge
(Chapter 4).
We have designed the new reconstitution chamber to be a shallow ellipse shape,
to maximize passive reagent mixing by diffusion. This chamber was designed to interface
directly the polypropylene reaction insert, and we were able to demonstrate successful
fluid handling in this module. We have demonstrated the ability to dry LAMP master-mix
reagents onto microfiber material, and the initial amplification results of samples
reconstituted in the fluidic testbed are promising. We are continuing to optimize the
drying process, to improve reconstitution amplification kinetics and to reduce false
positive amplification of negative samples. Our goal is to demonstrate reconstitution of
the dried master-mix material by the sample preparation eluate, followed by amplification
and detection in the fully-integrated cartridge.
89
APPENDIX
APPENDIX A: MANUSCRIPT SUBMISSIONS
At the time of submission of this thesis, most of the content of Chapter 2 was submitted
as a manuscript to the journal PLOS One. KGI has also filed a patent application covering
the design of this cartridge (System and Method for Efficient Nucleic Acid Testing, US
patent application number 13/860,453 filed April 10, 2013).98
The work presented in Chapter 3 was submitted as a manuscript to the journal
Sensors and Actuators, A. Keck Graduate Institute has filed a provisional patent
application covering the design of this valve (Check Valve, US provisional patent
application number 61/621,989 filed April 9, 2012).99
The work presented in Chapter 4 was published as a paper in the SPIE Conference
Proceedings.62
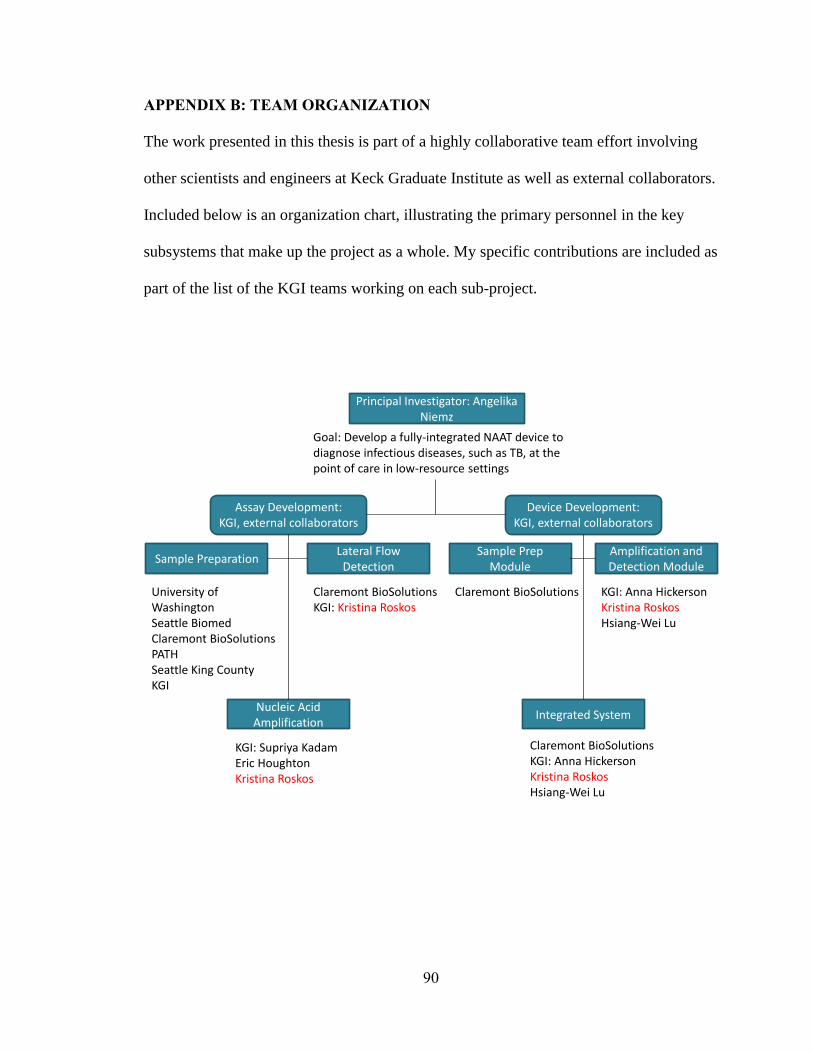
90
APPENDIX B: TEAM ORGANIZATION
The work presented in this thesis is part of a highly collaborative team effort involving
other scientists and engineers at Keck Graduate Institute as well as external collaborators.
Included below is an organization chart, illustrating the primary personnel in the key
subsystems that make up the project as a whole. My specific contributions are included as
part of the list of the KGI teams working on each sub-project.
Principal Investigator: Angelika Niemz
Goal: Develop a fully-integrated NAAT device to diagnose infectious diseases, such as TB, at the point of care in low-resource settings
Assay Development:KGI, external collaborators
Device Development:KGI, external collaborators
Sample Preparation
Nucleic Acid Amplification
Lateral Flow Detection
Sample Prep Module
Amplification and Detection Module
Integrated System
University of WashingtonSeattle BiomedClaremont BioSolutionsPATHSeattle King CountyKGI
Claremont BioSolutionsKGI: Kristina Roskos
KGI: Supriya Kadam Eric Houghton Kristina Roskos
Claremont BioSolutions KGI: Anna HickersonKristina RoskosHsiang-Wei Lu
Claremont BioSolutionsKGI: Anna HickersonKristina RoskosHsiang-Wei Lu
91
APPENDIX C: PRODUCT REQUIREMENT MATRIX
At the beginning of this project, the team developed extensive product requirements with
maximum and minimum acceptance criteria. After the project had begun, the conference
entitled Diagnostics Innovation in China: Bring Chinese TB and HIV Molecular
Diagnostics to Market (Shanghai, September 25-26, 2012) distributed a target product
profile (TPP), detailing the expectations for TB diagnostics in development. A group of
Master of BioScience (MBS) students, along with conversations with our lab team,
compared our team’s product requirements document with that of the TPP, resulting in
the product requirement matrix as included on the next page. Furthermore, they added
columns to demonstrate how these requirements are being met by our current, simple
system, how they will be met with our future, expanded system, and defined the
benchmark for performance.
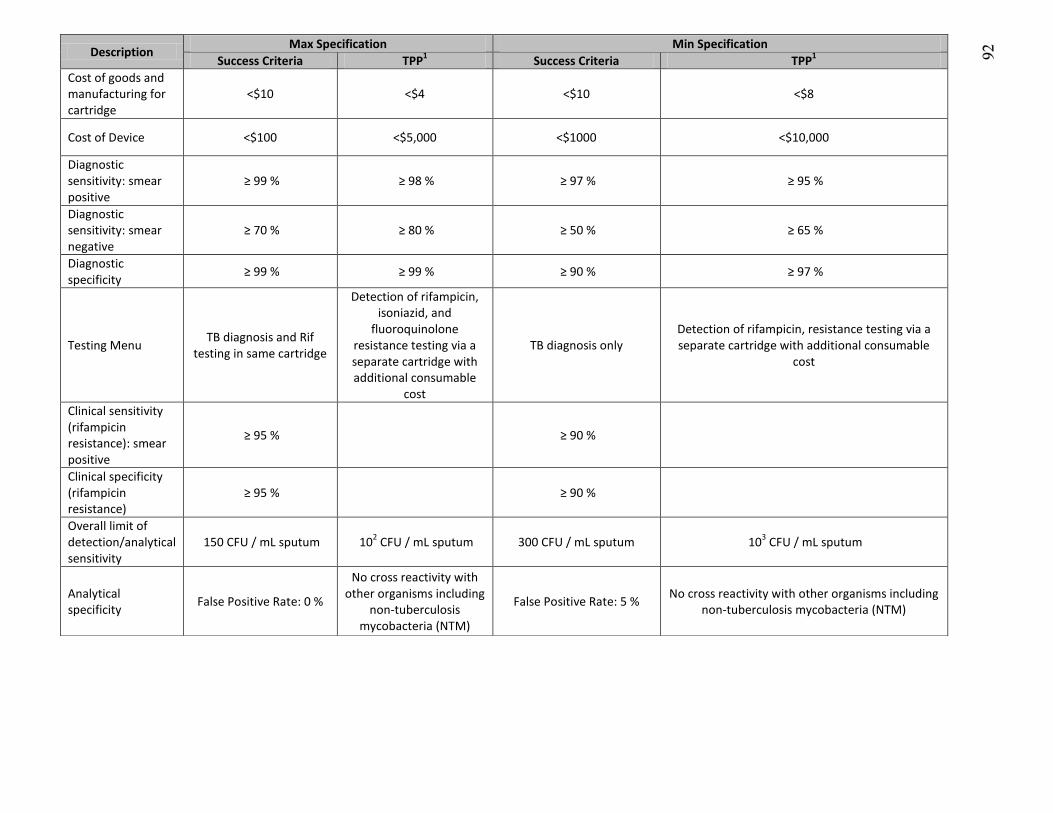
Description Max Specification Min Specification
Success Criteria TPP1 Success Criteria TPP
1
Cost of goods and manufacturing for cartridge
<$10 <$4 <$10 <$8
Cost of Device <$100 <$5,000 <$1000 <$10,000
Diagnostic sensitivity: smear positive
≥ 99 % ≥ 98 % ≥ 97 % ≥ 95 %
Diagnostic sensitivity: smear negative
≥ 70 % ≥ 80 % ≥ 50 % ≥ 65 %
Diagnostic specificity
≥ 99 % ≥ 99 % ≥ 90 % ≥ 97 %
Testing Menu TB diagnosis and Rif
testing in same cartridge
Detection of rifampicin, isoniazid, and
fluoroquinolone resistance testing via a separate cartridge with additional consumable
cost
TB diagnosis only Detection of rifampicin, resistance testing via a separate cartridge with additional consumable
cost
Clinical sensitivity (rifampicin resistance): smear positive
≥ 95 % ≥ 90 %
Clinical specificity (rifampicin resistance)
≥ 95 % ≥ 90 %
Overall limit of detection/analytical sensitivity
150 CFU / mL sputum 102 CFU / mL sputum 300 CFU / mL sputum 10
3 CFU / mL sputum
Analytical specificity
False Positive Rate: 0 %
No cross reactivity with other organisms including
non-tuberculosis mycobacteria (NTM)
False Positive Rate: 5 % No cross reactivity with other organisms including
non-tuberculosis mycobacteria (NTM)
92
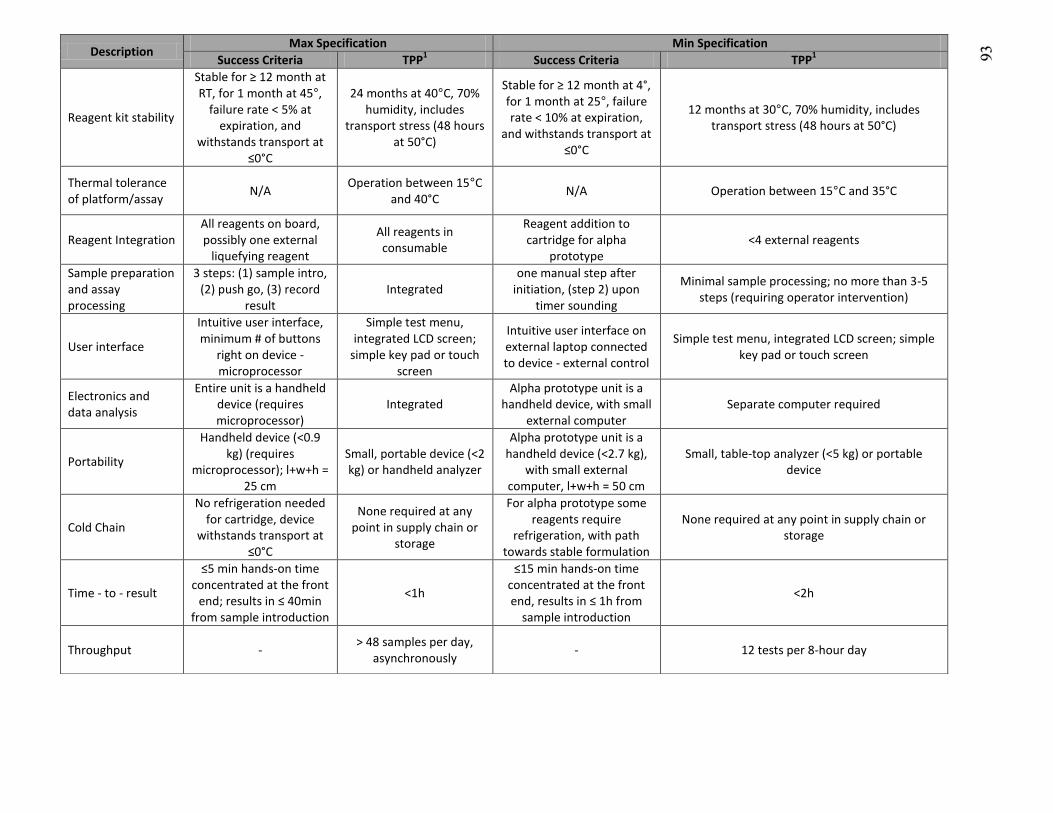
Description Max Specification Min Specification
Success Criteria TPP1 Success Criteria TPP
1
Reagent kit stability
Stable for ≥ 12 month at RT, for 1 month at 45°,
failure rate < 5% at expiration, and
withstands transport at ≤0°C
24 months at 40°C, 70% humidity, includes
transport stress (48 hours at 50°C)
Stable for ≥ 12 month at 4°, for 1 month at 25°, failure rate < 10% at expiration,
and withstands transport at ≤0°C
12 months at 30°C, 70% humidity, includes transport stress (48 hours at 50°C)
Thermal tolerance of platform/assay
N/A Operation between 15°C
and 40°C N/A Operation between 15°C and 35°C
Reagent Integration All reagents on board, possibly one external
liquefying reagent
All reagents in consumable
Reagent addition to cartridge for alpha
prototype <4 external reagents
Sample preparation and assay processing
3 steps: (1) sample intro, (2) push go, (3) record
result Integrated
one manual step after initiation, (step 2) upon
timer sounding
Minimal sample processing; no more than 3-5 steps (requiring operator intervention)
User interface
Intuitive user interface, minimum # of buttons
right on device - microprocessor
Simple test menu, integrated LCD screen;
simple key pad or touch screen
Intuitive user interface on external laptop connected to device - external control
Simple test menu, integrated LCD screen; simple key pad or touch screen
Electronics and data analysis
Entire unit is a handheld device (requires microprocessor)
Integrated Alpha prototype unit is a
handheld device, with small external computer
Separate computer required
Portability
Handheld device (<0.9 kg) (requires
microprocessor); l+w+h = 25 cm
Small, portable device (<2 kg) or handheld analyzer
Alpha prototype unit is a handheld device (<2.7 kg),
with small external computer, l+w+h = 50 cm
Small, table-top analyzer (<5 kg) or portable device
Cold Chain
No refrigeration needed for cartridge, device
withstands transport at ≤0°C
None required at any point in supply chain or
storage
For alpha prototype some reagents require
refrigeration, with path towards stable formulation
None required at any point in supply chain or storage
Time - to - result
≤5 min hands-on time concentrated at the front
end; results in ≤ 40min from sample introduction
<1h
≤15 min hands-on time concentrated at the front end, results in ≤ 1h from
sample introduction
<2h
Throughput - > 48 samples per day,
asynchronously - 12 tests per 8-hour day
93
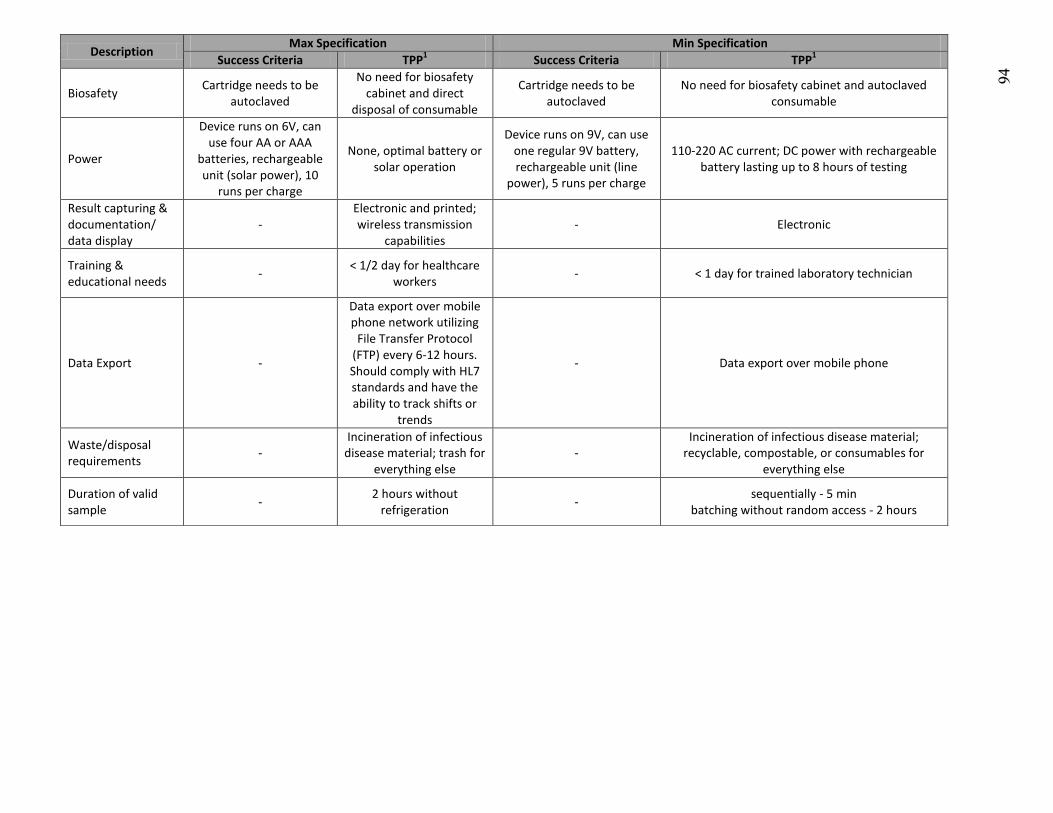
Description Max Specification Min Specification
Success Criteria TPP1 Success Criteria TPP
1
Biosafety Cartridge needs to be
autoclaved
No need for biosafety cabinet and direct
disposal of consumable
Cartridge needs to be autoclaved
No need for biosafety cabinet and autoclaved consumable
Power
Device runs on 6V, can use four AA or AAA
batteries, rechargeable unit (solar power), 10
runs per charge
None, optimal battery or solar operation
Device runs on 9V, can use one regular 9V battery, rechargeable unit (line
power), 5 runs per charge
110-220 AC current; DC power with rechargeable battery lasting up to 8 hours of testing
Result capturing & documentation/ data display
- Electronic and printed; wireless transmission
capabilities - Electronic
Training & educational needs
- < 1/2 day for healthcare
workers - < 1 day for trained laboratory technician
Data Export -
Data export over mobile phone network utilizing
File Transfer Protocol (FTP) every 6-12 hours. Should comply with HL7 standards and have the ability to track shifts or
trends
- Data export over mobile phone
Waste/disposal requirements
- Incineration of infectious
disease material; trash for everything else
- Incineration of infectious disease material;
recyclable, compostable, or consumables for everything else
Duration of valid sample
- 2 hours without
refrigeration -
sequentially - 5 min batching without random access - 2 hours
94
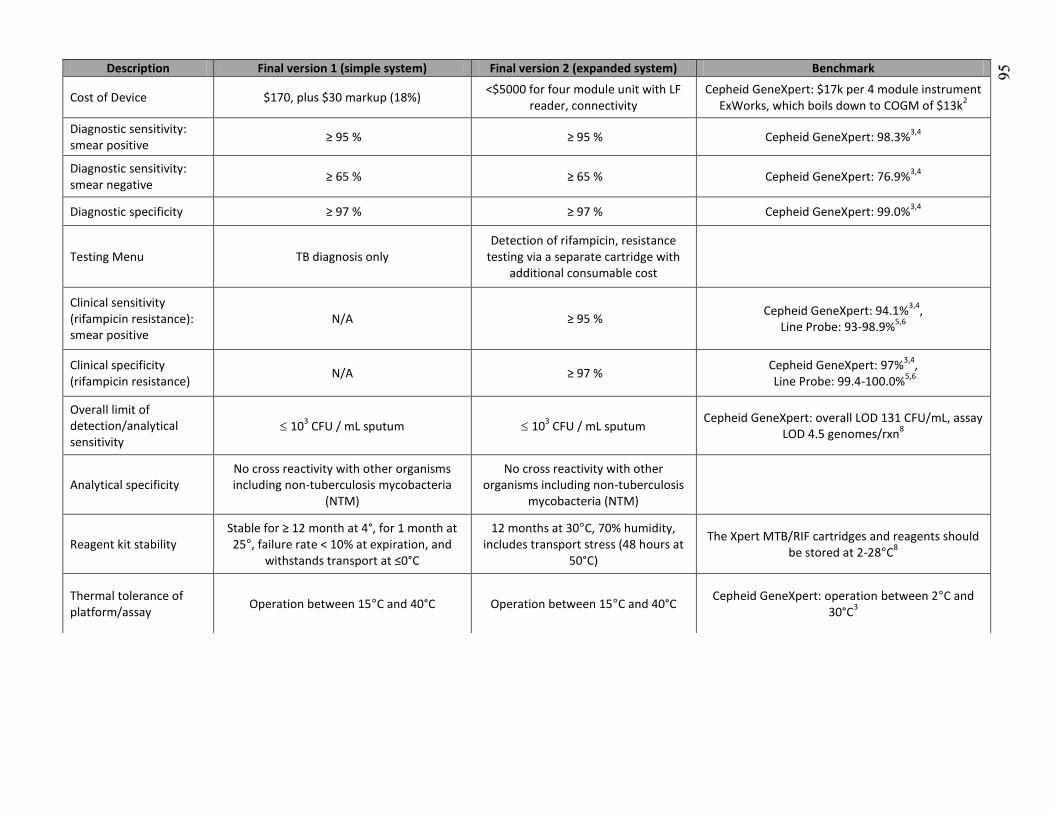
Description Final version 1 (simple system) Final version 2 (expanded system) Benchmark
Cost of Device $170, plus $30 markup (18%) <$5000 for four module unit with LF
reader, connectivity Cepheid GeneXpert: $17k per 4 module instrument
ExWorks, which boils down to COGM of $13k2
Diagnostic sensitivity: smear positive
≥ 95 % ≥ 95 % Cepheid GeneXpert: 98.3%3,4
Diagnostic sensitivity: smear negative
≥ 65 % ≥ 65 % Cepheid GeneXpert: 76.9%3,4
Diagnostic specificity ≥ 97 % ≥ 97 % Cepheid GeneXpert: 99.0%3,4
Testing Menu TB diagnosis only Detection of rifampicin, resistance
testing via a separate cartridge with additional consumable cost
Clinical sensitivity (rifampicin resistance): smear positive
N/A ≥ 95 % Cepheid GeneXpert: 94.1%
3,4,
Line Probe: 93-98.9%5,6
Clinical specificity (rifampicin resistance)
N/A ≥ 97 % Cepheid GeneXpert: 97%
3,4,
Line Probe: 99.4-100.0%5,6
Overall limit of detection/analytical sensitivity
103 CFU / mL sputum 10
3 CFU / mL sputum
Cepheid GeneXpert: overall LOD 131 CFU/mL, assay LOD 4.5 genomes/rxn
8
Analytical specificity No cross reactivity with other organisms including non-tuberculosis mycobacteria
(NTM)
No cross reactivity with other organisms including non-tuberculosis
mycobacteria (NTM)
Reagent kit stability Stable for ≥ 12 month at 4°, for 1 month at 25°, failure rate < 10% at expiration, and
withstands transport at ≤0°C
12 months at 30°C, 70% humidity, includes transport stress (48 hours at
50°C)
The Xpert MTB/RIF cartridges and reagents should be stored at 2-28°C
8
Thermal tolerance of platform/assay
Operation between 15°C and 40°C Operation between 15°C and 40°C Cepheid GeneXpert: operation between 2°C and
30°C3
95
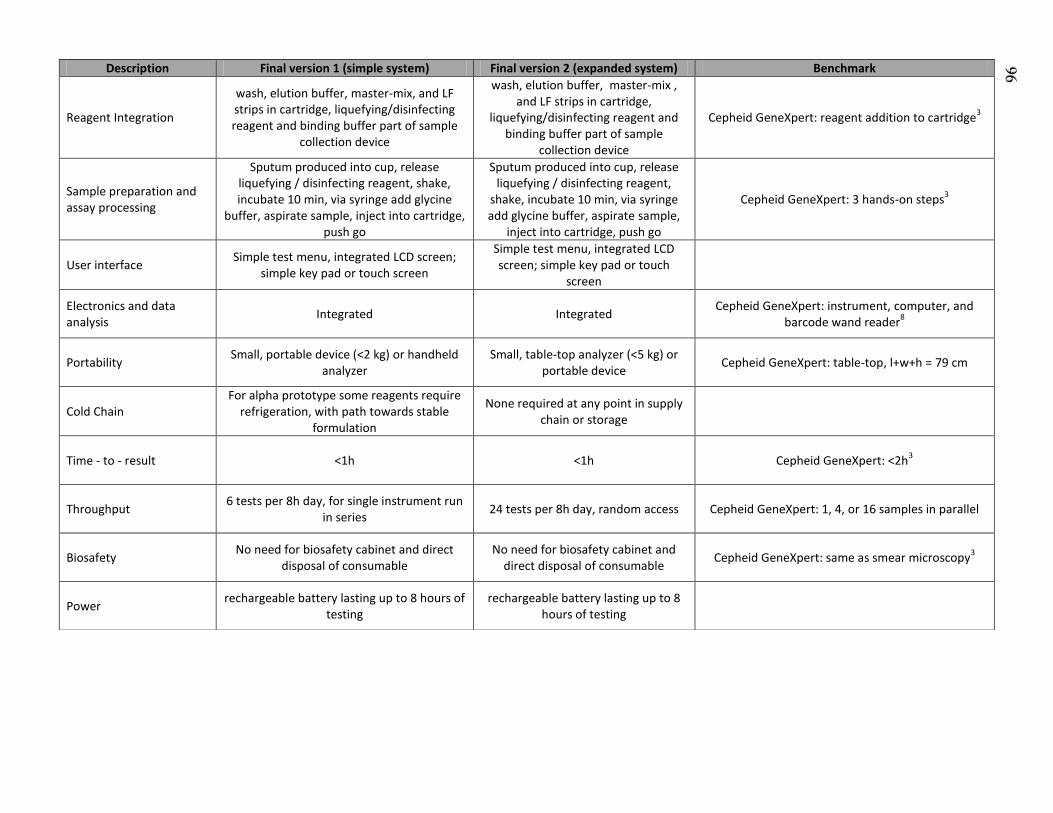
Description Final version 1 (simple system) Final version 2 (expanded system) Benchmark
Reagent Integration
wash, elution buffer, master-mix, and LF strips in cartridge, liquefying/disinfecting reagent and binding buffer part of sample
collection device
wash, elution buffer, master-mix , and LF strips in cartridge,
liquefying/disinfecting reagent and binding buffer part of sample
collection device
Cepheid GeneXpert: reagent addition to cartridge3
Sample preparation and assay processing
Sputum produced into cup, release liquefying / disinfecting reagent, shake, incubate 10 min, via syringe add glycine
buffer, aspirate sample, inject into cartridge, push go
Sputum produced into cup, release liquefying / disinfecting reagent,
shake, incubate 10 min, via syringe add glycine buffer, aspirate sample,
inject into cartridge, push go
Cepheid GeneXpert: 3 hands-on steps3
User interface Simple test menu, integrated LCD screen;
simple key pad or touch screen
Simple test menu, integrated LCD screen; simple key pad or touch
screen
Electronics and data analysis
Integrated Integrated Cepheid GeneXpert: instrument, computer, and
barcode wand reader8
Portability Small, portable device (<2 kg) or handheld
analyzer Small, table-top analyzer (<5 kg) or
portable device Cepheid GeneXpert: table-top, l+w+h = 79 cm
Cold Chain For alpha prototype some reagents require
refrigeration, with path towards stable formulation
None required at any point in supply chain or storage
Time - to - result <1h <1h Cepheid GeneXpert: <2h3
Throughput 6 tests per 8h day, for single instrument run
in series 24 tests per 8h day, random access Cepheid GeneXpert: 1, 4, or 16 samples in parallel
Biosafety No need for biosafety cabinet and direct
disposal of consumable No need for biosafety cabinet and
direct disposal of consumable Cepheid GeneXpert: same as smear microscopy
3
Power rechargeable battery lasting up to 8 hours of
testing rechargeable battery lasting up to 8
hours of testing
96
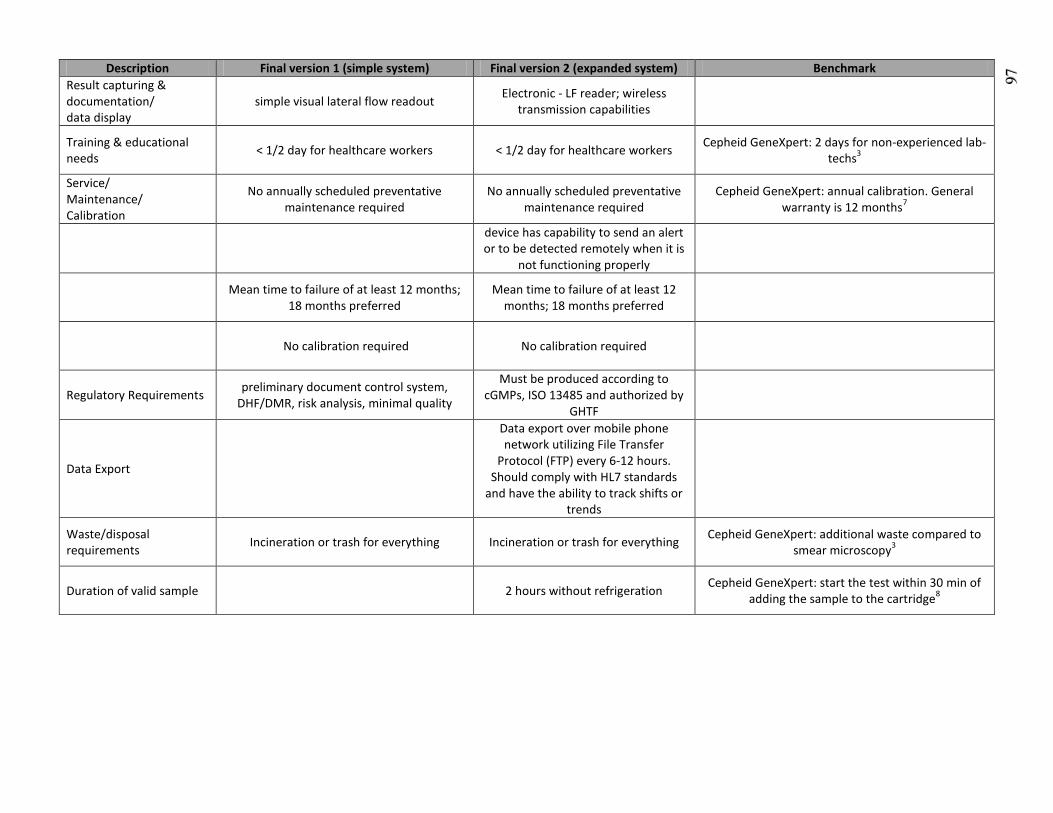
Description Final version 1 (simple system) Final version 2 (expanded system) Benchmark
Result capturing & documentation/ data display
simple visual lateral flow readout Electronic - LF reader; wireless
transmission capabilities
Training & educational needs
< 1/2 day for healthcare workers < 1/2 day for healthcare workers Cepheid GeneXpert: 2 days for non-experienced lab-
techs3
Service/ Maintenance/ Calibration
No annually scheduled preventative maintenance required
No annually scheduled preventative maintenance required
Cepheid GeneXpert: annual calibration. General warranty is 12 months
7
device has capability to send an alert or to be detected remotely when it is
not functioning properly
Mean time to failure of at least 12 months;
18 months preferred Mean time to failure of at least 12
months; 18 months preferred
No calibration required No calibration required
Regulatory Requirements preliminary document control system,
DHF/DMR, risk analysis, minimal quality
Must be produced according to cGMPs, ISO 13485 and authorized by
GHTF
Data Export
Data export over mobile phone network utilizing File Transfer
Protocol (FTP) every 6-12 hours. Should comply with HL7 standards
and have the ability to track shifts or trends
Waste/disposal requirements
Incineration or trash for everything Incineration or trash for everything Cepheid GeneXpert: additional waste compared to
smear microscopy3
Duration of valid sample 2 hours without refrigeration Cepheid GeneXpert: start the test within 30 min of
adding the sample to the cartridge8
97

1“TPP for Optimal and Minimal Product Characteristics for proposed tuberculosis diagnostic.” Diagnostics Innovation in China: Bring
Chinese TB and HIV Molecular Diagnostics to Market. Shanghai, September 25-26, 2012 2Cepheid Cares. 2012. Cepheid. November 11, 2012. www.cepheidcares.com/tb/cepheid-vision.html#pricing
3Boehme, Catharina. “Value chain in action: Xpert MTB/RIF.” FIND. Montreal. July 9, 2012
4Boehme, Catharina et al. Rapid Molecular Detection of Tuberculosis and Rifampin Resistance. NEJM 2010, 363, 1005
5Huyen, Mai NT et al. Validation of the GenoType MTBDRplus assay for diagnosis of multidrug resistant tuberculosis in South
Vietnam. BMC Infectious Diseases 2010, 10, 149 6Barnard, Marinus et al. Rapid Molecular Screening for Multidrug-Resistant Tuberculosis in a High-Volume Public Health Laboratory
in South Africa. Am. J.Res.Crit.Care 2008, 177, 787 7Helb, Danica et al. Rapid Detection of Mycobacterium tuberculosis and Rifampin Resistance by Use of On-Demand, Near-Patient
Technology. J.Clin Microbiol. 2010, 48, 22 8“Xpert® MTB/RIF: Two-hour detection of MTB and resistance to rifampicin.” Cepheid product brochure. 300-7810 Rev. A. April
2009
98
99
APPENDIX D: CARTRIDGE MANUFACTURING STANDARD OPERATING
PROCEDURE
To ensure quality and reproducibility of cartridge assembly, I compiled the following
standard operating procedure (SOP). This SOP is considered to be a working document,
stored in the shared lab resource folder with all team members having access. The SOP is
included in its entirety below. The Niemz Lab is developing SOPs for all components and
processes to assure quality.
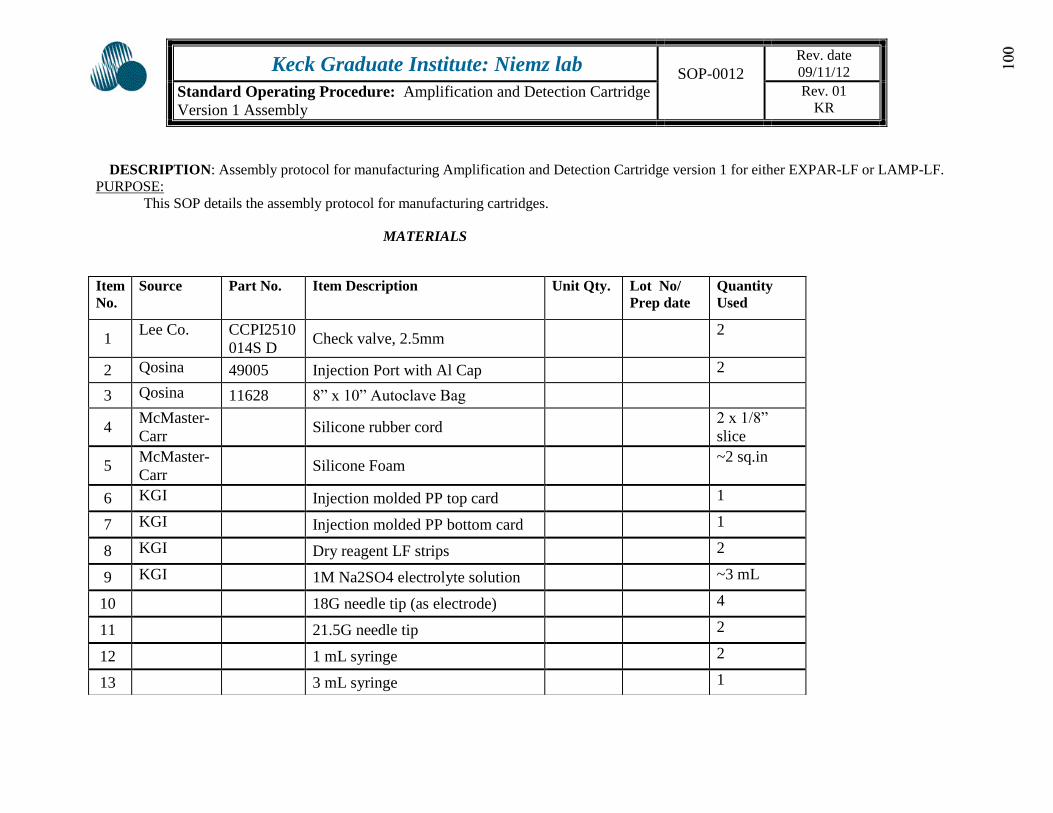
DESCRIPTION: Assembly protocol for manufacturing Amplification and Detection Cartridge version 1 for either EXPAR-LF or LAMP-LF.
PURPOSE:
This SOP details the assembly protocol for manufacturing cartridges.
MATERIALS
Keck Graduate Institute: Niemz lab SOP-0012
Rev. date
09/11/12
Standard Operating Procedure: Amplification and Detection Cartridge
Version 1 Assembly
Rev. 01
KR
Item
No.
Source Part No. Item Description Unit Qty.
Lot No/
Prep date
Quantity
Used
1 Lee Co. CCPI2510
014S D
Check valve, 2.5mm 2
2 Qosina 49005 Injection Port with Al Cap 2
3 Qosina 11628 8” x 10” Autoclave Bag
4 McMaster-
Carr Silicone rubber cord
2 x 1/8”
slice
5 McMaster-
Carr Silicone Foam
~2 sq.in
6 KGI Injection molded PP top card 1
7 KGI Injection molded PP bottom card 1
8 KGI Dry reagent LF strips 2
9 KGI 1M Na2SO4 electrolyte solution ~3 mL
10 18G needle tip (as electrode) 4
11 21.5G needle tip 2
12 1 mL syringe 2
13 3 mL syringe 1
100
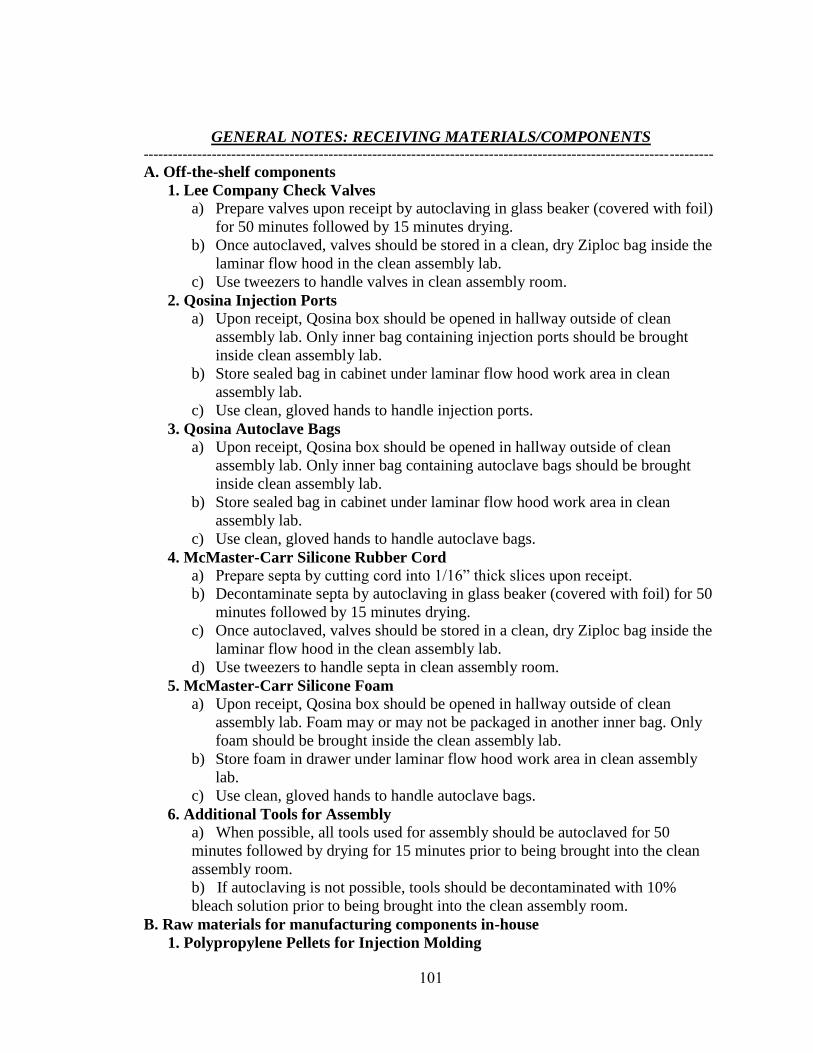
101
GENERAL NOTES: RECEIVING MATERIALS/COMPONENTS ---------------------------------------------------------------------------------------------------------------------
A. Off-the-shelf components
1. Lee Company Check Valves
a) Prepare valves upon receipt by autoclaving in glass beaker (covered with foil)
for 50 minutes followed by 15 minutes drying.
b) Once autoclaved, valves should be stored in a clean, dry Ziploc bag inside the
laminar flow hood in the clean assembly lab.
c) Use tweezers to handle valves in clean assembly room.
2. Qosina Injection Ports
a) Upon receipt, Qosina box should be opened in hallway outside of clean
assembly lab. Only inner bag containing injection ports should be brought
inside clean assembly lab.
b) Store sealed bag in cabinet under laminar flow hood work area in clean
assembly lab.
c) Use clean, gloved hands to handle injection ports.
3. Qosina Autoclave Bags
a) Upon receipt, Qosina box should be opened in hallway outside of clean
assembly lab. Only inner bag containing autoclave bags should be brought
inside clean assembly lab.
b) Store sealed bag in cabinet under laminar flow hood work area in clean
assembly lab.
c) Use clean, gloved hands to handle autoclave bags.
4. McMaster-Carr Silicone Rubber Cord
a) Prepare septa by cutting cord into 1/16” thick slices upon receipt.
b) Decontaminate septa by autoclaving in glass beaker (covered with foil) for 50
minutes followed by 15 minutes drying.
c) Once autoclaved, valves should be stored in a clean, dry Ziploc bag inside the
laminar flow hood in the clean assembly lab.
d) Use tweezers to handle septa in clean assembly room.
5. McMaster-Carr Silicone Foam
a) Upon receipt, Qosina box should be opened in hallway outside of clean
assembly lab. Foam may or may not be packaged in another inner bag. Only
foam should be brought inside the clean assembly lab.
b) Store foam in drawer under laminar flow hood work area in clean assembly
lab.
c) Use clean, gloved hands to handle autoclave bags.
6. Additional Tools for Assembly
a) When possible, all tools used for assembly should be autoclaved for 50
minutes followed by drying for 15 minutes prior to being brought into the clean
assembly room.
b) If autoclaving is not possible, tools should be decontaminated with 10%
bleach solution prior to being brought into the clean assembly room.
B. Raw materials for manufacturing components in-house
1. Polypropylene Pellets for Injection Molding
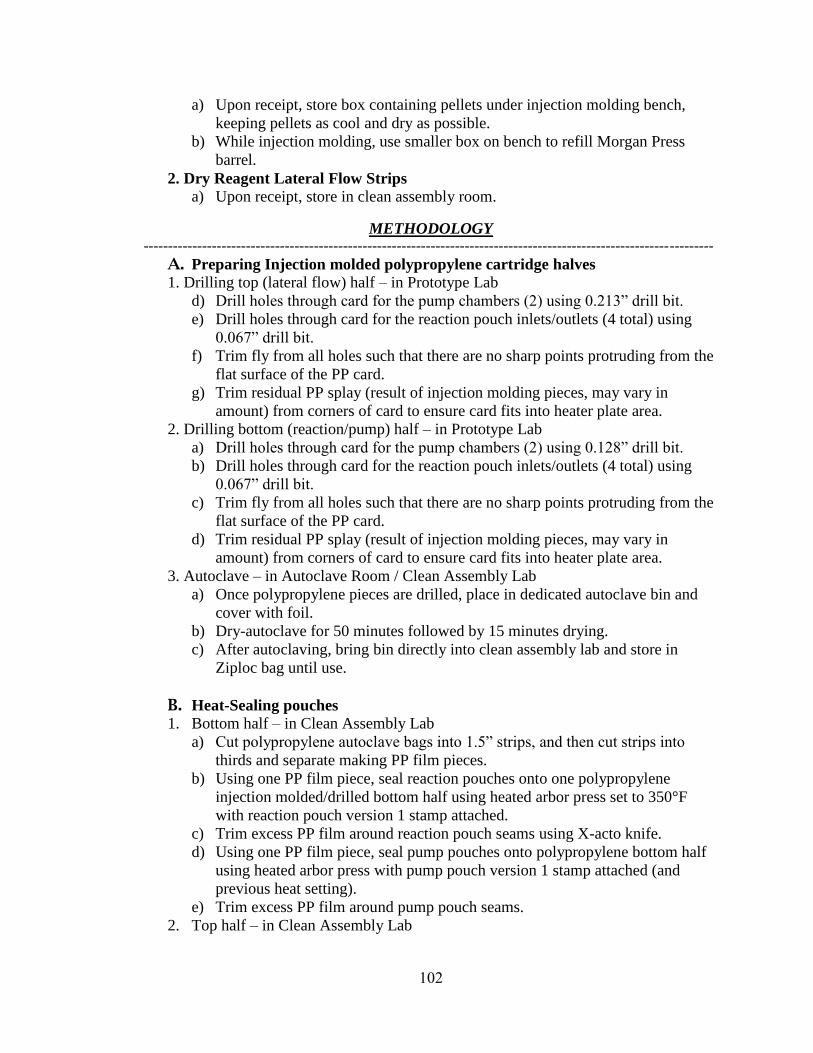
102
a) Upon receipt, store box containing pellets under injection molding bench,
keeping pellets as cool and dry as possible.
b) While injection molding, use smaller box on bench to refill Morgan Press
barrel.
2. Dry Reagent Lateral Flow Strips
a) Upon receipt, store in clean assembly room.
METHODOLOGY ---------------------------------------------------------------------------------------------------------------------
A. Preparing Injection molded polypropylene cartridge halves
1. Drilling top (lateral flow) half – in Prototype Lab
d) Drill holes through card for the pump chambers (2) using 0.213” drill bit.
e) Drill holes through card for the reaction pouch inlets/outlets (4 total) using
0.067” drill bit.
f) Trim fly from all holes such that there are no sharp points protruding from the
flat surface of the PP card.
g) Trim residual PP splay (result of injection molding pieces, may vary in
amount) from corners of card to ensure card fits into heater plate area.
2. Drilling bottom (reaction/pump) half – in Prototype Lab
a) Drill holes through card for the pump chambers (2) using 0.128” drill bit.
b) Drill holes through card for the reaction pouch inlets/outlets (4 total) using
0.067” drill bit.
c) Trim fly from all holes such that there are no sharp points protruding from the
flat surface of the PP card.
d) Trim residual PP splay (result of injection molding pieces, may vary in
amount) from corners of card to ensure card fits into heater plate area.
3. Autoclave – in Autoclave Room / Clean Assembly Lab
a) Once polypropylene pieces are drilled, place in dedicated autoclave bin and
cover with foil.
b) Dry-autoclave for 50 minutes followed by 15 minutes drying.
c) After autoclaving, bring bin directly into clean assembly lab and store in
Ziploc bag until use.
B. Heat-Sealing pouches
1. Bottom half – in Clean Assembly Lab
a) Cut polypropylene autoclave bags into 1.5” strips, and then cut strips into
thirds and separate making PP film pieces.
b) Using one PP film piece, seal reaction pouches onto one polypropylene
injection molded/drilled bottom half using heated arbor press set to 350°F
with reaction pouch version 1 stamp attached.
c) Trim excess PP film around reaction pouch seams using X-acto knife.
d) Using one PP film piece, seal pump pouches onto polypropylene bottom half
using heated arbor press with pump pouch version 1 stamp attached (and
previous heat setting).
e) Trim excess PP film around pump pouch seams.
2. Top half – in Clean Assembly Lab
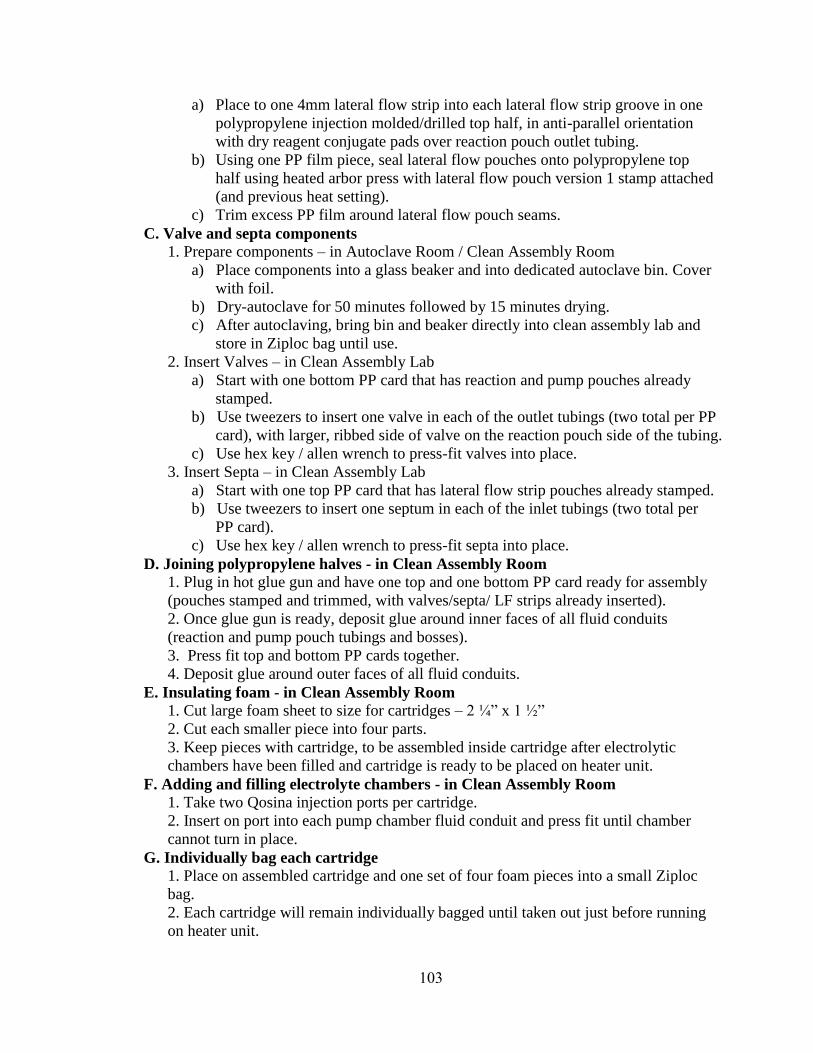
103
a) Place to one 4mm lateral flow strip into each lateral flow strip groove in one
polypropylene injection molded/drilled top half, in anti-parallel orientation
with dry reagent conjugate pads over reaction pouch outlet tubing.
b) Using one PP film piece, seal lateral flow pouches onto polypropylene top
half using heated arbor press with lateral flow pouch version 1 stamp attached
(and previous heat setting).
c) Trim excess PP film around lateral flow pouch seams.
C. Valve and septa components
1. Prepare components – in Autoclave Room / Clean Assembly Room
a) Place components into a glass beaker and into dedicated autoclave bin. Cover
with foil.
b) Dry-autoclave for 50 minutes followed by 15 minutes drying.
c) After autoclaving, bring bin and beaker directly into clean assembly lab and
store in Ziploc bag until use.
2. Insert Valves – in Clean Assembly Lab
a) Start with one bottom PP card that has reaction and pump pouches already
stamped.
b) Use tweezers to insert one valve in each of the outlet tubings (two total per PP
card), with larger, ribbed side of valve on the reaction pouch side of the tubing.
c) Use hex key / allen wrench to press-fit valves into place.
3. Insert Septa – in Clean Assembly Lab
a) Start with one top PP card that has lateral flow strip pouches already stamped.
b) Use tweezers to insert one septum in each of the inlet tubings (two total per
PP card).
c) Use hex key / allen wrench to press-fit septa into place.
D. Joining polypropylene halves - in Clean Assembly Room
1. Plug in hot glue gun and have one top and one bottom PP card ready for assembly
(pouches stamped and trimmed, with valves/septa/ LF strips already inserted).
2. Once glue gun is ready, deposit glue around inner faces of all fluid conduits
(reaction and pump pouch tubings and bosses).
3. Press fit top and bottom PP cards together.
4. Deposit glue around outer faces of all fluid conduits.
E. Insulating foam - in Clean Assembly Room
1. Cut large foam sheet to size for cartridges – 2 ¼” x 1 ½”
2. Cut each smaller piece into four parts.
3. Keep pieces with cartridge, to be assembled inside cartridge after electrolytic
chambers have been filled and cartridge is ready to be placed on heater unit.
F. Adding and filling electrolyte chambers - in Clean Assembly Room
1. Take two Qosina injection ports per cartridge.
2. Insert on port into each pump chamber fluid conduit and press fit until chamber
cannot turn in place.
G. Individually bag each cartridge
1. Place on assembled cartridge and one set of four foam pieces into a small Ziploc
bag.
2. Each cartridge will remain individually bagged until taken out just before running
on heater unit.
104
APPENDIX E: FAILURE MODE AND EFFECTS ANALYSIS
A group of MBS students, along with conversations with our lab team, prepared a Failure
Mode and Effects Analysis (FMEA) to consider how individual sub-components of this
overall project can fail. For each failure mode, the severity (S), occurrence (O), and
detection level (D) were assessed, along with controls that are currently being
implemented to mitigate risk. Lastly, a risk priority number (RPN) was assigned to
indicate failure modes, and ultimately system sub-components, which carry the highest
risk.
I participated in the FMEA analysis related to the cartridges, including
amplification and detection cartridge components, reagent storage and the amplification
and detection assays as performed on the cartridge. The FMEA document is included
below in its entirety.
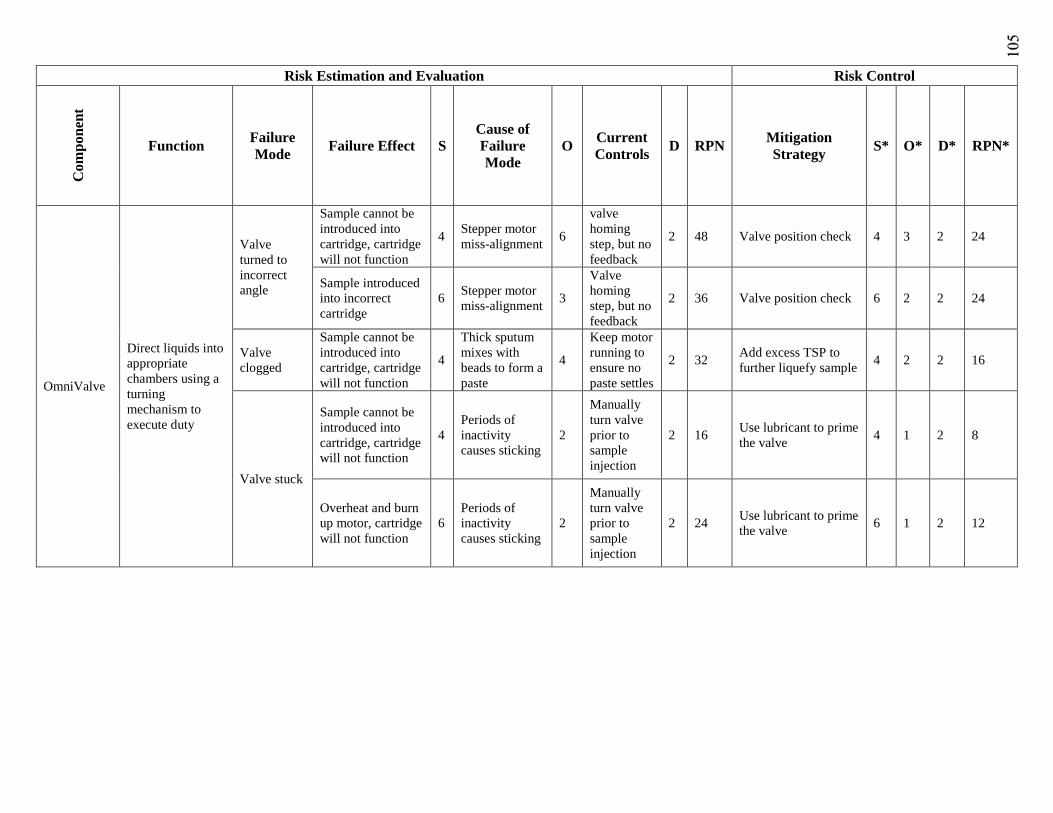
Risk Estimation and Evaluation Risk Control C
om
pon
ent
Function Failure
Mode Failure Effect S
Cause of
Failure
Mode
O Current
Controls D RPN
Mitigation
Strategy S* O* D* RPN*
OmniValve
Direct liquids into
appropriate
chambers using a
turning
mechanism to
execute duty
Valve
turned to
incorrect
angle
Sample cannot be
introduced into
cartridge, cartridge
will not function
4 Stepper motor
miss-alignment 6
valve
homing
step, but no
feedback
2 48 Valve position check 4 3 2 24
Sample introduced
into incorrect
cartridge
6 Stepper motor
miss-alignment 3
Valve
homing
step, but no
feedback
2 36 Valve position check 6 2 2 24
Valve
clogged
Sample cannot be
introduced into
cartridge, cartridge
will not function
4
Thick sputum
mixes with
beads to form a
paste
4
Keep motor
running to
ensure no
paste settles
2 32 Add excess TSP to
further liquefy sample 4 2 2 16
Valve stuck
Sample cannot be
introduced into
cartridge, cartridge
will not function
4
Periods of
inactivity
causes sticking
2
Manually
turn valve
prior to
sample
injection
2 16 Use lubricant to prime
the valve 4 1 2 8
Overheat and burn
up motor, cartridge
will not function
6
Periods of
inactivity
causes sticking
2
Manually
turn valve
prior to
sample
injection
2 24 Use lubricant to prime
the valve 6 1 2 12
105
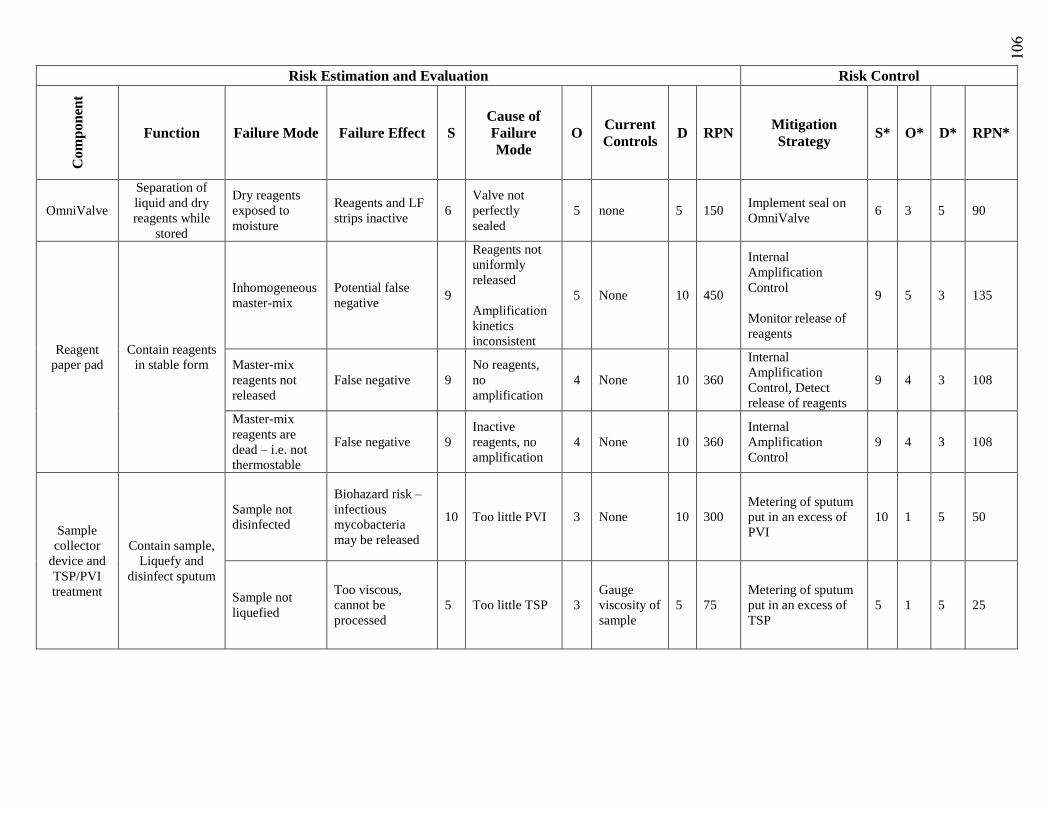
Risk Estimation and Evaluation Risk Control C
om
po
nen
t
Function Failure Mode Failure Effect S
Cause of
Failure
Mode
O Current
Controls D RPN
Mitigation
Strategy S* O* D* RPN*
OmniValve
Separation of
liquid and dry
reagents while
stored
Dry reagents
exposed to
moisture
Reagents and LF
strips inactive 6
Valve not
perfectly
sealed
5 none 5 150 Implement seal on
OmniValve 6 3 5 90
Reagent
paper pad
Contain reagents
in stable form
Inhomogeneous
master-mix
Potential false
negative 9
Reagents not
uniformly
released
Amplification
kinetics
inconsistent
5 None 10 450
Internal
Amplification
Control
Monitor release of
reagents
9 5 3 135
Master-mix
reagents not
released
False negative 9
No reagents,
no
amplification
4 None 10 360
Internal
Amplification
Control, Detect
release of reagents
9 4 3 108
Master-mix
reagents are
dead – i.e. not
thermostable
False negative 9
Inactive
reagents, no
amplification
4 None 10 360
Internal
Amplification
Control
9 4 3 108
Sample
collector
device and
TSP/PVI
treatment
Contain sample,
Liquefy and
disinfect sputum
Sample not
disinfected
Biohazard risk –
infectious
mycobacteria
may be released
10 Too little PVI 3 None 10 300
Metering of sputum
put in an excess of
PVI
10 1 5 50
Sample not
liquefied
Too viscous,
cannot be
processed
5 Too little TSP 3
Gauge
viscosity of
sample
5 75
Metering of sputum
put in an excess of
TSP
5 1 5 25
106
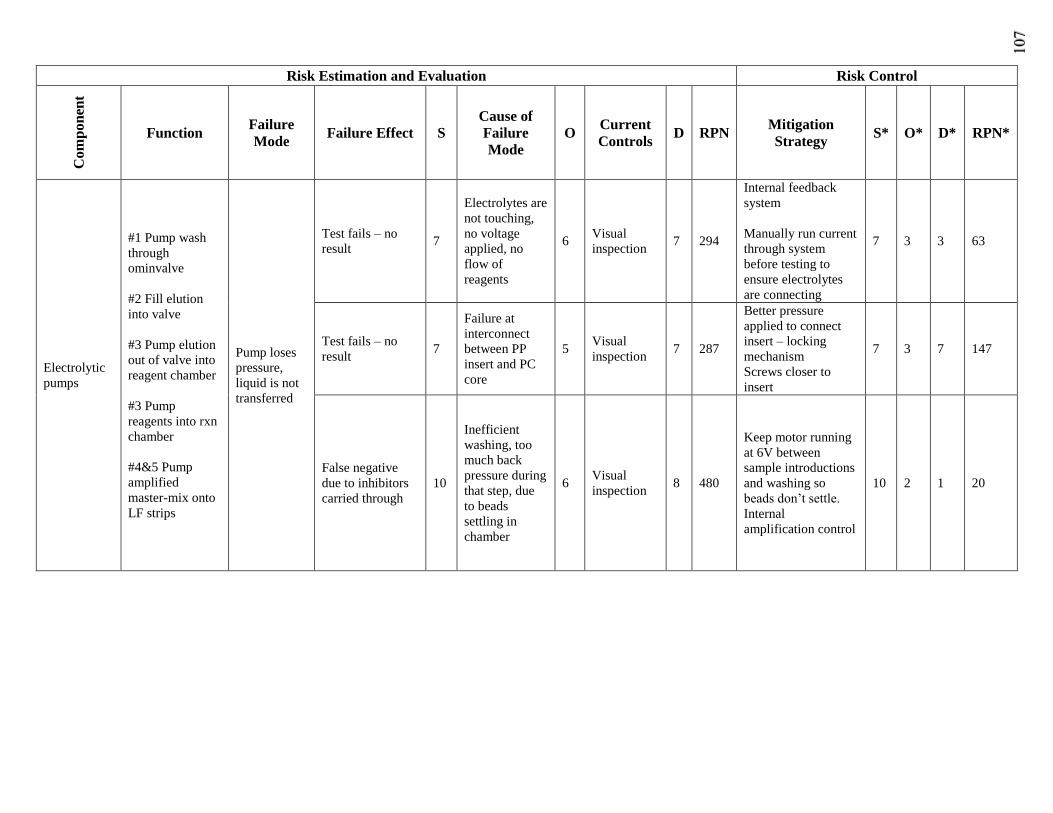
Risk Estimation and Evaluation Risk Control C
om
po
nen
t
Function Failure
Mode Failure Effect S
Cause of
Failure
Mode
O Current
Controls D RPN
Mitigation
Strategy S* O* D* RPN*
Electrolytic
pumps
#1 Pump wash
through
ominvalve
#2 Fill elution
into valve
#3 Pump elution
out of valve into
reagent chamber
#3 Pump
reagents into rxn
chamber
#4&5 Pump
amplified
master-mix onto
LF strips
Pump loses
pressure,
liquid is not
transferred
Test fails – no
result 7
Electrolytes are
not touching,
no voltage
applied, no
flow of
reagents
6 Visual
inspection 7 294
Internal feedback
system
Manually run current
through system
before testing to
ensure electrolytes
are connecting
7 3 3 63
Test fails – no
result 7
Failure at
interconnect
between PP
insert and PC
core
5 Visual
inspection 7 287
Better pressure
applied to connect
insert – locking
mechanism
Screws closer to
insert
7 3 7 147
False negative
due to inhibitors
carried through
10
Inefficient
washing, too
much back
pressure during
that step, due
to beads
settling in
chamber
6 Visual
inspection 8 480
Keep motor running
at 6V between
sample introductions
and washing so
beads don’t settle.
Internal
amplification control
10 2 1 20
107
108
APPENDIX F: ROOT CAUSE FAILURE ANALYSIS
The work presented in this thesis utilized root cause failure analysis to identify causes of
unexpected results, categorized as “failures” because something did not perform as
expected. The details of all of the experimental set ups and root cause failure analysis are
not included in this thesis.
One example where I employed root cause failure analysis is when my initial
amplification and detection experiments performed in pouches on the initial cartridge
prototype yielded unusually high false negative results, even after very long incubation
periods on the heater unit (> 60 minutes). Previous experiments demonstrated EXPAR
amplification in pouches on the heater unit, with fluid withdrawn from the pouches to
verify amplification via external lateral flow. However, once the amplification pouches
and lateral flow detection chambers were integrated into the initial cartridge prototype,
the reactions were not amplifying.
The original hypothesis was that the reaction failures were due to improper
thermal control of the handheld heater unit or heat conductivity from the heater plate into
the reaction fluid was not sufficient. Thermal testing confirmed the heater surface was
reaching appropriate assay temperature; therefore, improper heater temperature control
was eliminated as a possible source of failure. Cartridges were also run in a temperature-
controlled water bath, with the same false negative results after > 60 minutes of
incubation, indicating that improper temperature conductivity into the reaction fluid
inside the reaction pouches was also not causing the false negative results. All of the
cartridge and pouch materials were tested for assay compatibility without any issues,
109
signifying that there were no inhibitors leeching from these materials were that could be
the source of the false negative results.
During discussion of these false negative results, Hsiang-Wei explained how, in
his previous work involving microfluidic PCR chips, his team added BSA into the PCR
master-mix reagents to pacify the chip surfaces and prevent enzymes from adhering to
the fluid channels. A concentration of 1.6mg/mL BSA was chosen based on unrelated
DOE studies performed by previous lab member Jose Salazar demonstrating the assay
performance was unaffected by the inclusion of BSA. Immediately after incorporating
BSA into the cartridge reactions, amplification was restored, with detection of product
after 30 minutes of incubation on the heater unit. Therefore, it was concluded that BSA
needed to be included into the reaction master-mix in order to pacify the plastic surface
area. The inclusion of BSA has become a requirement for all isothermal assays performed
on the cartridges, based on this root cause failure analysis.
110
APPENDIX G: TRANSFER TO CLEAN MANUFACTURING
One major concern for developing a nucleic acid amplification diagnostic is the risk of
amplicon carry-over contamination. Since the target sequence is exponentially amplified,
any breach in containment can leak amplicon product into the environment, leading to
false positive results in subsequent tests. Therefore, it is imperative that manufacturing
processes are performed under clean environmental conditions without any amplicon
contamination in order to ensure proper test results.
While developing the initial amplification and detection prototype subunit, we
identified contamination in our manufacturing areas despite our best efforts at amplicon
containment. Swab test results indicated that the fluid conduits between the top and
bottom cards of the initial cartridge prototype leaked amplicon product. Also, all
cartridge components showed amplicon contamination prior to assembly into cartridges,
indicating that the manufacturing areas and processes were contaminated.
Consequently, we needed to move cartridge assembly and manufacturing
processes into a clean environment. I spear-headed the transition to clean manufacturing,
with input from Dr. Angelika Niemz and Barbara Erwin. This entailed first identifying
and securing lab space that had not yet been exposed to amplicon product. It was also
important that this space have a locking door, so that we could control access to this area.
After cleaning the new lab space, I then secured a laminar flow hood to be used
for final cartridge manufacturing and assembly steps. This hood continually blows
filtered air and maintains a clean environment inside the workspace. Once the hood was
installed, the tools for all cartridge manufacturing processes needed to be replicated
inside the hood. This required creating a second heated arbor press set-up for thermal
111
bonding, including all pouch dies, and each component was thoroughly cleaned with
bleach solution prior to bringing it into the clean lab.
Furthermore, all cartridge materials needed to be ordered to replace the materials
we had been using in the contaminated lab areas. For the components that were directly
assembled into the cartridges, such as plastic films and silicone foam, these items were
carefully handled upon receipt and were directly moved into the clean room for storage to
eliminate any possible amplicon exposure from contaminated lab areas. For components
that required assembly and manipulation or testing prior to assembly into the cartridges,
such as valves and septa, I developed a decontamination process. In previous studies, we
demonstrated that dry-autoclaving effectively eliminates contamination. Therefore, all of
these subassembly components were first manufactured and tested, then autoclaved and
then brought directly into the clean lab for assembly into the cartridges.
After all of the components were replaced or decontaminated and all of the
process tools were brought into the clean environment, I refined the manufacturing
protocol for this environment. Once the process was optimized, I was able to manufacture
clean initial cartridge prototypes and I demonstrated that these cartridges were not
contaminated with amplicon product. In total, the transition to clean manufacturing
required approximately one year until the first clean cartridges were fully-assembled and
tested.
We have additionally transitioned the manufacturing of the refined cartridge
prototype into this clean environment. As mentioned in Chapter 4, we are still optimizing
this process. Our next step will be to design the manufacturing processes for the fully-
integrated cartridges in this clean lab.
112
REFERENCES
1. Ince, J.; McNally, A. Development of rapid, automated diagnostics for infectious
disease: advances and challenges. Expert Review of Medical Devices 2009, 6 (6),
641-651.
2. Kaltenboeck, B.; Wang, C. M. Advances in real-time PCR: Application to clinical
laboratory diagnostics. Adv. Clin. Chem. 2005, 40, 219-259.
3. de Tejada, B. M.; Stan, C. M.; Boulvain, M.; Renzi, G.; Francois, P.; Irion, O.;
Schrenzel, J. Development of a Rapid PCR Assay for Screening of Maternal
Colonization by Group B Streptococcus and Neonatal Invasive Escherichia coli
during Labor. Gynecol. Obstet. Invest. 2010, 70 (4), 250-255.
4. Wolk, D. M.; Marx, J. L.; Dominguez, L.; Driscoll, D.; Schifman, R. B. Comparison
of MRSASelect Agar, CHROMagar Methicillin-Resistant Staphylococcus aureus
(MRSA) Medium, and Xpert MRSA PCR for Detection of MRSA in Nares:
Diagnostic Accuracy for Surveillance Samples with Various Bacterial Densities. J.
Clin. Microbiol. 2009, 47 (12), 3933-3936.
5. Brenwald, N. P.; Baker, N.; Oppenheim, B. Feasibility study of a real-time PCR test
for methicillin-resistant Staphylococcus aureus in a point of care setting. J. Hosp.
Infect. 2010, 74 (3), 245-249.
6. Yager, P.; Domingo, G. J.; Gerdes, J. Point-of-care diagnostics for global health.
Annual Review of Biomedical Engineering 2008, 10, 107-144.
7. Puren, A.; Gerlach, J. L.; Weigl, B. H.; Kelso, D. M.; Domingo, G. J. Laboratory
Operations, Specimen Processing, and Handling for Viral Load Testing and
Surveillance. J. Infect. Dis. 2010, 201, S27-S36.
8. Stevens, W. S.; Marshall, T. M. Challenges in Implementing HIV Load Testing in
South Africa. J. Infect. Dis. 2010, 201, S78-S84.
9. Maartens, G.; Wilkinson, R. J. Tuberculosis. Lancet 2007, 370 (9604), 2030-2043.
10. World Health Organization Global Tuberculosis Report; 12.
11. McNerney, R.; Daley, P. Towards a point-of-care test for active tuberculosis:
obstacles and opportunities. Nature Reviews Microbiology 2011, 9 (3), 204-213.
12. Perkins, M. D.; Cunningham, J. Facing the crisis: Improving the diagnosis of
tuberculosis in the HIV era. J. Infect. Dis. 2007, 196, S15-S27.
13. Balasingham, S. V.; Davidsen, T.; Szpinda, I.; Frye, S. A.; Tonjuin, T. Molecular
Diagnostics in Tuberculosis Basis and Implications for Therapy. Molecular Diagnosis
& Therapy 2009, 13 (3), 137-151.
14. Boehme, C. C.; Nabeta, P.; Hillemann, D.; Nicol, M. P.; Shenai, S.; Krapp, F.; Allen,
J.; Tahirli, R.; Blakemore, R.; Rustomjee, R.; Milovic, A.; Jones, M.; O'Brien, S. M.;
Persing, D. H.; Ruesch-Gerdes, S.; Gotuzzo, E.; Rodrigues, C.; Alland, D.; Perkins,
M. D. Rapid Molecular Detection of Tuberculosis and Rifampin Resistance. N. Engl.
J. Med. 2010, 363 (11), 1005-1015.
15. Blakemore, R.; Story, E.; Helb, D.; Kop, J.; Banada, P.; Owens, M. R.; Chakravorty,
S.; Jones, M.; Alland, D. Evaluation of the Analytical Performance of the Xpert
MTB/RIF Assay. J. Clin. Microbiol. 2010, 48 (7), 2495-2501.
16. Raja, S.; Ching, J.; Xi, L. Q.; Hughes, S. J.; Chang, R.; Wong, W.; McMillan, W.;
Gooding, W. E.; McCarty, K. S.; Chestney, M.; Luketich, J. D.; Godfrey, T. E.
113
Technology for automated, rapid, and quantitative PCR or reverse transcription-PCR
clinical testing. Clin. Chem. 2005, 51 (5), 882-890.
17. Helb, D.; Jones, M.; Story, E.; Boehme, C.; Wallace, E.; Ho, K.; Kop, J.; Owens, M.
R.; Rodgers, R.; Banada, P.; Safi, H.; Blakemore, R.; Lan, N. T. N.; Jones-Lopez, E.
C.; Levi, M.; Burday, M.; Ayakaka, I.; Mugerwa, R. D.; McMillan, B.; Winn-Deen,
E.; Christel, L.; Dailey, P.; Perkins, M. D.; Persing, D. H.; Alland, D. Rapid
Detection of Mycobacterium tuberculosis and Rifampin Resistance by Use of On-
Demand, Near-Patient Technology. J. Clin. Microbiol. 2010, 48 (1), 229-237.
18. Mwaba, P.; McNerney, R.; Grobusch, M. P.; O'Grady, J.; Bates, M.; Kapata, N.;
Maeurer, M.; Zumla, A. Achieving STOP TB Partnership goals: perspectives on
development of new diagnostics, drugs and vaccines for tuberculosis. Tropical
Medicine & International Health 2011, 16 (7), 819-827.
19. Niemz, A.; Boyle, D. S. Nucleic acid testing for tuberculosis at the point-of-care in
high burden countries. Expert Rev. Mol. Diagn. 2012, 687-701.
20. Niemz, A.; Ferguson, T. M.; Boyle, D. S. Point-of-care nucleic acid testing for
infectious diseases. Trends Biotechnol. 2011, 29 (5), 240-250.
21. Poritz, M. A.; Blaschke, A. J.; Byington, C. L.; Meyers, L.; Nilsson, K.; Jones, D. E.;
Thatcher, S. A.; Robbins, T.; Lingenfelter, B.; Amiott, E.; Herbener, A.; Daly, J.;
Dobrowolski, S. F.; David, H. F. T.; Ririe, K. M. FilmArray, an Automated Nested
Multiplex PCR System for Multi-Pathogen Detection: Development and Application
to Respiratory Tract Infection. Plos One 2011, 6 (10).
22. Tanriverdi, S.; Chen, L. J.; Chen, S. Q. A Rapid and Automated Sample-to-Result
HIV Load Test for Near-Patient Application. J. Infect. Dis. 2010, 201, S52-S58.
23. Asiello, P. J.; Baeumner, A. J. Miniaturized isothermal nucleic acid amplification, a
review. Lab on A Chip 2011, 11 (8), 1420-1430.
24. Mahalanabis, M.; Do, J.; ALMuayad, H.; Zhang, J. Y.; Klapperich, C. M. An
integrated disposable device for DNA extraction and helicase dependent
amplification. Biomed. Microdevices. 2010, 12 (2), 353-359.
25. Wang, C. H.; Lien, K. Y.; Wu, J. J.; Lee, G. B. A magnetic bead-based assay for the
rapid detection of methicillin-resistant Staphylococcus aureus by using a microfluidic
system with integrated loop-mediated isothermal amplification. Lab Chip. 2011, 11
(8), 1521-1531.
26. Wu, Q.; Jin, W.; Zhou, C.; Han, S.; Yang, W.; Zhu, Q.; Jin, Q.; Mu, Y. Integrated
glass microdevice for nucleic acid purification, loop-mediated isothermal
amplification, and online detection. Anal. Chem. 2011, 83 (9), 3336-3342.
27. Boyanton, B. L.; Sural, P.; Loomis, C. R.; Pesta, C.; Gonzalez-Krellwitz, L.;
Robinson-Dunn, B.; Riska, P. Loop-Mediated Isothermal Amplification Compared to
Real-Time PCR and Enzyme Immunoassay for Toxigenic Clostridium difficile
Detection. J. Clin. Microbiol. 2012, 50 (3), 640-645.
28. Hicke, B.; Pasko, C.; Groves, B.; Ager, E.; Corpuz, M.; Frech, G.; Munns, D.; Smith,
W.; Warcup, A.; Denys, G.; Ledeboer, N. A.; Lindsey, W.; Owen, C.; Rea, L.;
Jenison, R. Automated Detection of Toxigenic Clostridium difficile in Clinical
Samples: Isothermal tcdB Amplification Coupled to Array-Based Detection. J. Clin.
Microbiol. 2012, 50 (8), 2681-2687.
29. Kim, H. J.; Tong, Y. H.; Tang, W.; Quimson, L.; Cope, V. A.; Pan, X. J.; Motre, A.;
Kong, R.; Hong, J. A.; Kohn, D.; Miller, N. S.; Poulter, M. D.; Kong, H. M.; Tang, Y.
114
W.; Yen-Lieberman, B. A rapid and simple isothermal nucleic acid amplification test
for detection of herpes simplex virus types 1 and 2. J. Clin. Virol. 2011, 50 (1), 26-30.
30. Burns, M. A.; Johnson, B. N.; Brahmasandra, S. N.; Handique, K.; Webster, J. R.;
Krishnan, M.; Sammarco, T. S.; Man, P. M.; Jones, D.; Heldsinger, D.; Mastrangelo,
C. H.; Burke, D. T. An integrated nanoliter DNA analysis device. Science 1998, 282
(5388), 484-487.
31. Easley, C. J.; Karlinsey, J. M.; Bienvenue, J. M.; Legendre, L. A.; Roper, M. G.;
Feldman, S. H.; Hughes, M. A.; Hewlett, E. L.; Merkel, T. J.; Ferrance, J. P.; Landers,
J. P. A fully integrated microfluidic genetic analysis system with sample-in-answer-
out capability. Proc. Natl. Acad. Sci. U. S. A. 2006, 103 (51), 19272-19277.
32. Yobas, L.; Ji, H. M.; Hui, W. C.; Chen, Y.; Lim, T. M.; Heng, C. K.; Kwong, D. L.
Nucleic acid extraction, amplification, and detection on Si-based microfluidic
platforms. Ieee Journal of Solid-State Circuits 2007, 42 (8), 1803-1813.
33. Chen, D. F.; Mauk, M.; Qiu, X. B.; Liu, C. C.; Kim, J. T.; Ramprasad, S.; Ongagna,
S.; Abrams, W. R.; Malamud, D.; Corstjens, P. L. A. M.; Bau, H. H. An integrated,
self-contained microfluidic cassette for isolation, amplification, and detection of
nucleic acids. Biomedical Microdevices 2010, 12 (4), 705-719.
34. Burns, M. A.; Johnson, B. N.; Brahmasandra, S. N.; Handique, K.; Webster, J. R.;
Krishnan, M.; Sammarco, T. S.; Man, P. M.; Jones, D.; Heldsinger, D.; Mastrangelo,
C. H.; Burke, D. T. An integrated nanoliter DNA analysis device. Science 1998, 282
(5388), 484-487.
35. Marcus, J. S.; Anderson, W. F.; Quake, S. R. Parallel picoliter RT-PCR assays using
microfluidics. Anal. Chem. 2006, 78 (3), 956-958.
36. Scarparo, C.; Piccoli, P.; Rigon, A.; Ruggiero, G.; Scagnelli, M.; Piersimoni, C.
Comparison of enhanced Mycobacterium tuberculosis amplified direct test with
COBAS AMPLICOR Mycobacterium tuberculosis assay for direct detection of
Mycobacterium tuberculosis complex in respiratory and extrapulmonary specimens. J.
Clin. Microbiol. 2000, 38 (4), 1559-1562.
37. Mori, Y.; Notomi, T. Loop-mediated isothermal amplification (LAMP): a rapid,
accurate, and cost-effective diagnostic method for infectious diseases. Journal of
Infection and Chemotherapy 2009, 15 (2), 62-69.
38. Iwamoto, T.; Sonobe, T.; Hayashi, K. Loop-mediated isothermal amplification for
direct detection of Mycobacterium tuberculosis complex, M-avium, and M-
intracellulare in sputum samples. J. Clin. Microbiol. 2003, 41 (6), 2616-2622.
39. Boehme, C. C.; Nabeta, P.; Henostroza, G.; Raqib, R.; Rahim, Z.; Gerhardt, M.;
Sanga, E.; Hoelscher, M.; Notomi, T.; Hase, T.; Perkins, M. D. Operational feasibility
of using loop-mediated isothermal amplification for diagnosis of pulmonary
tuberculosis in microscopy centers of developing countries. J. Clin. Microbiol. 2007,
45 (6), 1936-1940.
40. Mitarai, S.; Okumura, M.; Toyota, E.; Yoshiyama, T.; Aono, A.; Sejimo, A.; Azuma,
Y.; Sugahara, K.; Nagasawa, T.; Nagayama, N.; Yamane, A.; Yano, R.; Kokuto, H.;
Morimoto, K.; Ueyama, M.; Kubota, M.; Yi, R.; Ogata, H.; Kudoh, S.; Mori, T.
Evaluation of a simple loop-mediated isothermal amplification test kit for the
diagnosis of tuberculosis. Int. J Tuberc. Lung Dis. 2011, 15 (9), 1211-1217.
115
41. Dineva, M. A.; Candotti, D.; Fletcher-Brown, F.; Allain, J. P.; Lee, H. Simultaneous
visual detection of multiple viral amplicons by dipstick assay. J. Clin. Microbiol.
2005, 43 (8), 4015-4021.
42. Fang, R. D.; Li, X.; Hu, L.; You, Q. M.; Li, J.; Wu, J.; Xu, P.; Zhong, H. Y.; Luo, Y.;
Mei, J.; Gao, Q. Cross-Priming Amplification for Rapid Detection of Mycobacterium
tuberculosis in Sputum Specimens. J. Clin. Microbiol. 2009, 47 (3), 845-847.
43. Goldmeyer, J.; Li, H.; McCormac, M.; Cook, S.; Stratton, C.; Lemieux, B.; Kong, H.;
Tang, W.; Tang, Y. W. Identification of Staphylococcus aureus and determination of
methicillin resistance directly from positive blood cultures by isothermal
amplification and a disposable detection device. J. Clin. Microbiol. 2008, 46 (4),
1534-1536.
44. Mugasa, C. M.; Laurent, T.; Schoone, G. J.; Kager, P. A.; Lubega, G. W.; Schallig, H.
D. F. H. Nucleic Acid Sequence-Based Amplification with Oligochromatography for
Detection of Trypanosoma brucei in Clinical Samples. J. Clin. Microbiol. 2009, 47
(3), 630-635.
45. Piepenburg, O.; Williams, C. H.; Stemple, D. L.; Armes, N. A. DNA detection using
recombination proteins. Plos Biology 2006, 4 (7), 1115-1121.
46. Puthawibool, T.; Senapin, S.; Kiatpathomchai, W.; Flegel, T. W. Detection of shrimp
infectious myonecrosis virus by reverse transcription loop-mediated isothermal
amplification combined with a lateral flow dipstick. J. Virol. Methods 2009, 156 (1-2),
27-31.
47. Nimitphak, T.; Meemetta, W.; Arunrut, N.; Senapin, S.; Kiatpathomchai, W. Rapid
and sensitive detection of Penaeus monodon nucleopolyhedrovirus (PemoNPV) by
loop-mediated isothermal amplification combined with a lateral-flow dipstick. Mol.
Cell. Probes 2010, 24 (1), 1-5.
48. Prompamorn, P.; Sithigorngul, P.; Rukpratanporn, S.; Longyant, S.; Sridulyakul, P.;
Chaivisuthangkura, P. The development of loop-mediated isothermal amplification
combined with lateral flow dipstick for detection of Vibrio parahaemolyticus. Lett.
Appl. Microbiol. 2011, 52 (4), 344-351.
49. Jaroenrama, W.; Kiatpathomchai, W.; Flegel, T. W. Rapid and sensitive detection of
white spot syndrome virus by loop-mediated isothermal amplification combined with
a lateral flow dipstick. Mol. Cell. Probes 2009, 23 (2), 65-70.
50. Lee, H. H.; Dineva, M. A.; Chua, Y. L.; Ritchie, A. V.; Ushiro-Lumb, I.; Wisniewski,
C. A. Simple Amplification-Based Assay: A Nucleic Acid Based Point-of-Care
Platform for HIV-1 Testing. J. Infect. Dis. 2010, 201, S65-S72.
51. Rand, K. H.; Rampersaud, H.; Houck, H. J. Comparison of Two Multiplex Methods
for Detection of Respiratory Viruses: FilmArray RP and xTAG RVP. J. Clin.
Microbiol. 2011, 49 (7), 2449-2453.
52. Zhou, P.; Young, L.; Chen, Z. Y. Weak solvent based chip lamination and
characterization of on-chip valve and pump. Biomedical Microdevices 2010, 12 (5),
821-832.
53. Böhm, S.; Olthuis, W.; Bergveld, P. An Integrated Micromachined Electrochemical
Pump and Dosing System. Biomedical Microdevices 1999, 1 (2), 121-130.
54. Liu, R. H.; Yang, J. N.; Lenigk, R.; Bonanno, J.; Grodzinski, P. Self-contained, fully
integrated biochip for sample preparation, polymerase chain reaction amplification,
and DNA microarray detection. Anal. Chem. 2004, 76 (7), 1824-1831.
116
55. Liu, R. H.; Nguyen, T.; Schwarzkopf, K.; Fuji, H. S.; Petrova, A.; Siuda, T.; Peyvan,
K.; Bizak, M.; Danley, D.; McShea, A. Fully integrated miniature device for
automated gene expression DNA microarray processing. Anal. Chem. 2006, 78 (6),
1980-1986.
56. Liu, R. H.; Lodes, M. J.; Nguyen, T.; Siuda, T.; Slota, M.; Fuji, H. S.; McShea, A.
Validation of a fully integrated microfluidic array device for influenza A subtype
identification and sequencing. Anal. Chem. 2006, 78 (12), 4184-4193.
57. Vandeventer, P. E.; Weigel, K. M.; Salazar, J.; Erwin, B.; Irvine, B.; Doebler, R.;
Nadim, A.; Cangelosi, G. A.; Niemz, A. Mechanical Disruption of Lysis-Resistant
Bacterial Cells by Use of a Miniature, Low-Power, Disposable Device. J. Clin.
Microbiol. 2011, 49 (7), 2533-2539.
58. Van Ness, J.; Van Ness, L. K.; Galas, D. J. Isothermal reactions for the amplification
of oligonucleotides. Proc. Natl. Acad. Sci. U. S. A. 2003, 100 (8), 4504-4509.
59. Tan, E.; Wong, J.; Nguyen, D.; Zhang, Y.; Erwin, B.; Van Ness, L. K.; Baker, S. M.;
Galas, D. J.; Niemz, A. Isothermal DNA amplification coupled with DNA
nanosphere-based colorimetric detection. Anal. Chem. 2005, 77 (24), 7984-7992.
60. Spiro, A.; Lowe, M.; Brown, D. A bead-based method for multiplexed identification
and quantitation of DNA sequences using flow cytometry. Appl. Environ. Microbiol.
2000, 66 (10), 4258-4265.
61. Tan, E.; Erwin, B.; Dames, S.; Voelkerding, K.; Niemz, A. Isothermal DNA
amplification with gold nanosphere-based visual colorimetric readout for herpes
simplex 2 virus detection. Clin. Chem. 2007, 53 (11), 2017-2020.
62. Lu, H. W.; Roskos, K.; Hickerson, A. I.; Carey, T.; Niemz, A. System for Portable
Nucleic Acid Testing in Low Resource Settings. SPIE: Bellingham, Washington,
2013.
63. Hickerson, A. I.; Lu, H. W.; Roskos, K.; Carey, T.; Niemz, A. Disposable Miniature
Check Valve Design Suitable For Scalable Manufacturing. 2011; p under review.
64. Beebe, D. J.; Mensing, G. A.; Walker, G. M. Physics and applications of
microfluidics in biology. Annual Review of Biomedical Engineering 2002, 4, 261-286.
65. Oh, K. W.; Rong, R.; Ahn, C. H. Miniaturization of pinch-type valves and pumps for
practical micro total analysis system integration. Journal of Micromechanics and
Microengineering 2005, 15 (12), 2449-2455.
66. Oh, K. W.; Ahn, C. H. A review of microvalves. Journal of Micromechanics and
Microengineering 2006, 16 (5), R13-R39.
67. Yang, X.; Grosjean, C.; Tai, Y. C. Design, fabrication, and testing of micromachined
silicone rubber membrane valves. Journal of Microelectromechanical Systems 1999,
8 (4), 393-402.
68. Yuen, P. K.; Kricka, L. J.; Wilding, P. Semi-disposable microvalves for use with
microfabricated devices or microchips. Journal of Micromechanics and
Microengineering 2000, 10 (3), 401-409.
69. Chin, C. D.; Linder, V.; Sia, S. K. Commercialization of microfluidic point-of-care
diagnostic devices. Lab on A Chip 2012, 12 (12), 2118-2134.
70. Gervais, L.; de Rooij, N.; Delamarche, E. Microfluidic Chips for Point-of-Care
Immunodiagnostics. Advanced Materials 2011, 23 (24), H151-H176.
117
71. Hasselbrink, E. F.; Shepodd, T. J.; Rehm, J. E. High-pressure microfluidic control in
lab-on-a-chip devices using mobile polymer monoliths. Anal. Chem. 2002, 74 (19),
4913-4918.
72. Koch, M.; Evans, A. G. R.; Brunnschweiler, A. Characterization of micromachined
cantilever valves. Journal of Micromechanics and Microengineering 1997, 7 (3),
221-223.
73. Nguyen, N. T.; Truong, T. Q.; Wong, K. K.; Ho, S. S.; Low, C. L. N. Micro check
valves for integration into polymeric microfluidic devices. Journal of
Micromechanics and Microengineering 2004, 14 (1), 69-75.
74. Oosterbroek, R. E.; Berenschot, J. W.; Schlautmann, S.; Krijnen, G. J. M.;
Lammerink, T. S. J.; Elwenspoek, M. C.; van den Berg, A. Designing, simulation and
realization of in-plane operating micro valves, using new etching techniques. Journal
of Micromechanics and Microengineering 1999, 9 (2), 194-198.
75. Snakenborg, D.; Klank, H.; Kutter, J. P. Polymer microvalve with pre-stressed
membranes for tunable flow-pressure characteristics. Microfluidics and Nanofluidics
2011, 10 (2), 381-388.
76. Wang, J.; Chen, Z. Y.; Mauk, M.; Hong, K. S.; Li, M. Y.; Yang, S.; Bau, H. H. Self-
actuated, thermo-responsive hydrogel valves for lab on a chip. Biomedical
Microdevices 2005, 7 (4), 313-322.
77. Brandes, R. V. Annular One-Way Valve. US 7,243,682 B2, Jul 17, 2007.
78. Epstein, A. B. One-Way Valve. US 5,660,205, Aug 26, 1997.
79. Floh, R.; Spindler, R. In-Line Check Valve. US 6,848,471 B2, Feb 1, 2005.
80. Roskos, K.; Hickerson, A. I.; Lu, H. W.; Ferguson, T. M.; Shinde, D. N.; Klaue, Y.;
Niemz, A. Simple System for Isothermal DNA Amplification Coupled to Lateral
Flow Detection. 2013; p under review.
81. Qiu, X. B.; Chen, D. F.; Liu, C. C.; Mauk, M. G.; Kientz, T.; Bau, H. H. A portable,
integrated analyzer for microfluidic - based molecular analysis. Biomedical
Microdevices 2011, 13 (5), 809-817.
82. Lutz, S.; Weber, P.; Focke, M.; Faltin, B.; Hoffmann, J.; Muller, C.; Mark, D.; Roth,
G.; Munday, P.; Armes, N.; Piepenburg, O.; Zengerle, R.; von Stetten, F.
Microfluidic lab-on-a-foil for nucleic acid analysis based on isothermal recombinase
polymerase amplification (RPA). Lab on A Chip 2010, 10 (7), 887-893.
83. Deng, X.; Pack, T. D. Stable Reagents and Kits Useful in Loop-Mediated Isothermal
Amplification (LAMP). US 2008/0182313 A1, Jul 31, 2008.
84. Qiu, X. B.; Mauk, M. G.; Chen, D. F.; Liu, C. C.; Bau, H. H. A large volume,
portable, real-time PCR reactor. Lab on A Chip 2010, 10 (22), 3170-3177.
85. Buitink, J.; van den Dries, I. J.; Hoekstra, F. A.; Alberda, M.; Hemminga, M. A. High
critical temperature above T-g may contribute to the stability of biological systems.
Biophys. J. 2000, 79 (2), 1119-1128.
86. Weigl, B. H.; Gerdes, J.; Tarr, P.; Yager, P.; Dillman, L.; Peck, R.; Ramachandran, S.;
Lemba, M.; Nabavi, M.; Battrell, F.; Hoekstra, D.; Klein, E. J.; Denno, D. M. Fully
integrated multiplexed lab-on-a-card assay for enteric pathogens. 2006; p 611202.
87. Garcia, E.; Kirkham, J. R.; Hatch, A. V.; Hawkins, K. R.; Yager, P. Controlled
microfluidic reconstitution of functional protein from an anhydrous storage depot.
Lab on A Chip 2004, 4 (1), 78-82.
118
88. Kiviniemi, M.; Ilonen, J.; Lovgren, T. A homogeneous HLA-B*27 genotyping assay
using dried reagent mixtures. Dis. Markers 2009, 27 (2), 85-91.
89. Kim, J.; Byun, D.; Mauk, M. G.; Bau, H. H. A disposable, self-contained PCR chip.
Lab on A Chip 2009, 9 (4), 606-612.
90. Ponaka, R.; Farchaus, J. W.; Pierce, M. D. Preparation of Glassified Biological
Reagents. US 2009/0325263 A1, Dec 31, 2009.
91. Treml, S. B.; Dall, C. J.; Draveling, C. A.; Jolly, J. F.; Ramanujam, R. P. Biological
Reagent Spheres. US 5,593,824, Jan 14, 1997.
92. Franks, F.; Hatley, R. H. M. Storage of Materials. US 5,098,893, Mar 24, 1992.
93. Walker, D. W.; DiFrancesco, R. A.; Heaster, J. A.; Jolly, J. F.; Lively, C. R.; Treml, S.
B. Room Temperature Stable Reagent Semi-Spheres. US 5,565,318, Oct 15, 1996.
94. Bensimon, D.; Kadanoff, L. P.; Liang, S. D.; Shraiman, B. I.; Tang, C. Viscous Flows
in 2 Dimensions. Reviews of Modern Physics 1986, 58 (4), 977-999.
95. Casademunt, J.; Magdaleno, F. X. Dynamics and selection of fingering patterns.
Recent developments in the Saffman-Taylor problem. Physics Reports-Review
Section of Physics Letters 2000, 337 (1-2), 1-35.
96. Hele-Shaw, H. S. The flow of water. Nature 1898, 58 (1489), 34-36.
97. Mclean, J. W.; Saffman, P. G. The Effect of Surface-Tension on the Shape of Fingers
in A Hele Shaw Cell. Journal of Fluid Mechanics 1981, 102 (JAN), 455-469.
98. Niemz, A.; Hickerson, A. I.; Roskos, K.; Lu, H. W. System and Method for Efficient
Nucleic Acid Testing. Apr 10, 2013. US Patent Application 13860453.
99. Hickerson, A. I. Check Valve. Apr 9, 2012. US Patent Application 61/621,989.