Embed Size (px)
Citation preview

Lecture 12
Color ManagementDevice independent Color RepresentationICC ProfilesGamut Mapping

Digital CameraScanner Mobile Phone
Graphic Arts Workflow
Image retouching Page Layout
DFE
Proofer Digital Printers Press

Color Management
Images look different on each device.

Images look different on each device.
Printer ImageOriginal Image Scanner Image

Color Management
Variations are due to:• Spectral distribution of the device components(phosphors, filters, sensors)’
• Viewing conditions(dark/light, indoor/outdoors, illumination spectra)
• media (projected/reflected light or print).
Solution:Define a transform to map colors from colorspace of one device (source) to color spaceof another device (destination).

Device Differences
Difference in Spatial Resolutions
Printers 300-1200 dpi 1-4 intensity bits
CRT Pitch 0.27 µ, 72 ppi,
TV 480 lines (analog)
LCD 100 ppi, 8 intensity bits
Camera 2 Megapixel, 10 intensity bits
Scanner 600 dpi, 12 intensity bits

Device Differences
Difference in Contrast and Brightness Range
Genoacolor

Device Differences
Difference in White Point
QImaging Kodak Nikon

Device DifferencesDifference in Gamut
Monitor Gamut Printer Gamut

Device Differences
Difference in Gamut
MonitorFilm

Device DifferencesDifference in Gamut
ScannerScanner
MonitorMonitor
printerprinter

Gamut Mismatch
0 0.2 0.4 0.6 0.80
0.2
0.4
0.6
0.8
x
y
printerdisplay
How does one print this color?
This color never needed?

Gamut Mismatch
How does one print this color?
0 0.2 0.4 0.6 0.80
0.2
0.4
0.6
0.8
x
y
printerdisplay
How does one display this color?

Gamut Mismatch
The problem is twofold:
1) Differences in device representation
2) Differences in Gamut Size and Shape

Gamut Mapping
In order to transfer color information between a source device and a destination device, one must define a mapping between the source Gamut to destination the destination Gamut.
This mapping is called Gamut Mapping.
Printer GamutMonitor Gamut

Gamut Mapping - Example
Gamut Mapping maps RGB = (12, 120, 25) on Monitor A to RGB = (22, 255, 31) on monitor B.
This mapping actually maps XYZ representation of RGB = (12, 120, 25) of Monitor A to the most “similar” XYZ representation reproducible by Monitor B.
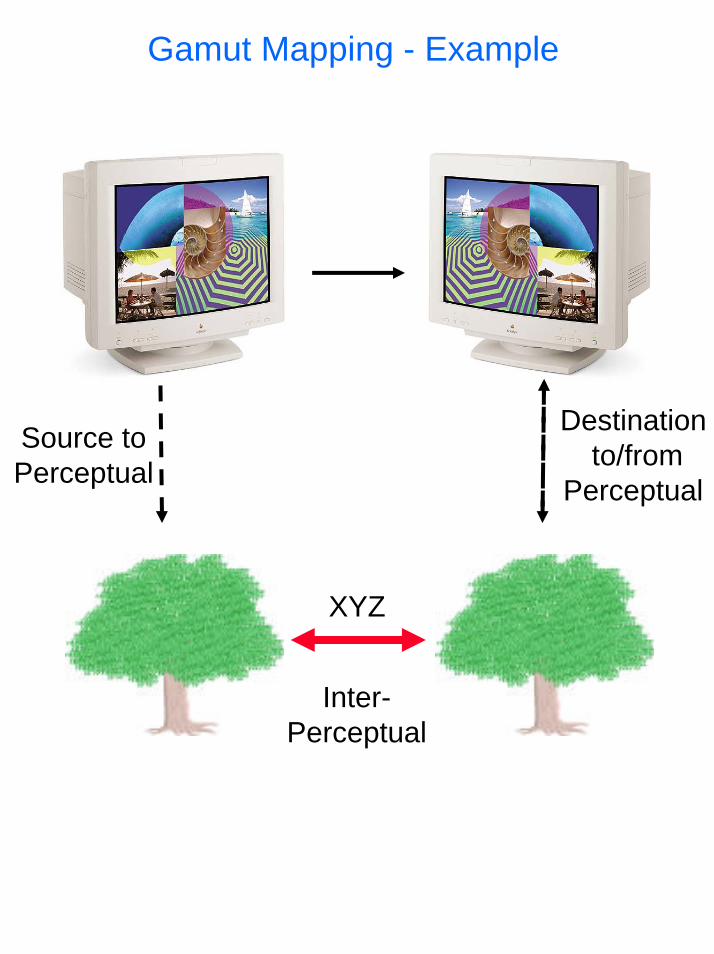
Gamut Mapping - Example
Destinationto/from
Perceptual
Source toPerceptual
XYZ
Inter-Perceptual

Gamut Mapping
brightness
most accurate (hue)
most accurate(brightness)
Hue angle error:
Hue angleWhite
display max saturated green = 540nm
printer max saturated green = 510nm
Source GamutDest Gamut

Gamut MappingMacDonald & Morovic (1995)
Laihanen (1987)

Gamut Mapping
Marcu & Abe (1996)
Ito & Katoh (1995)
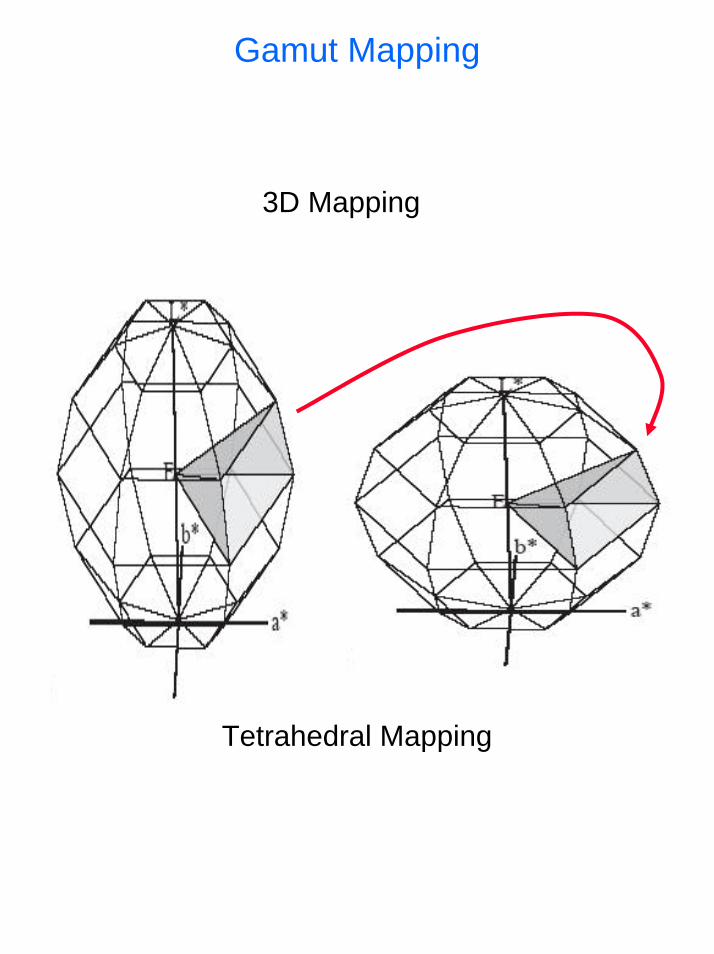
Gamut Mapping
3D Mapping
Tetrahedral Mapping

Gamut Mapping
Assume mapping with no Hue angle error:
Where do these colors map to?
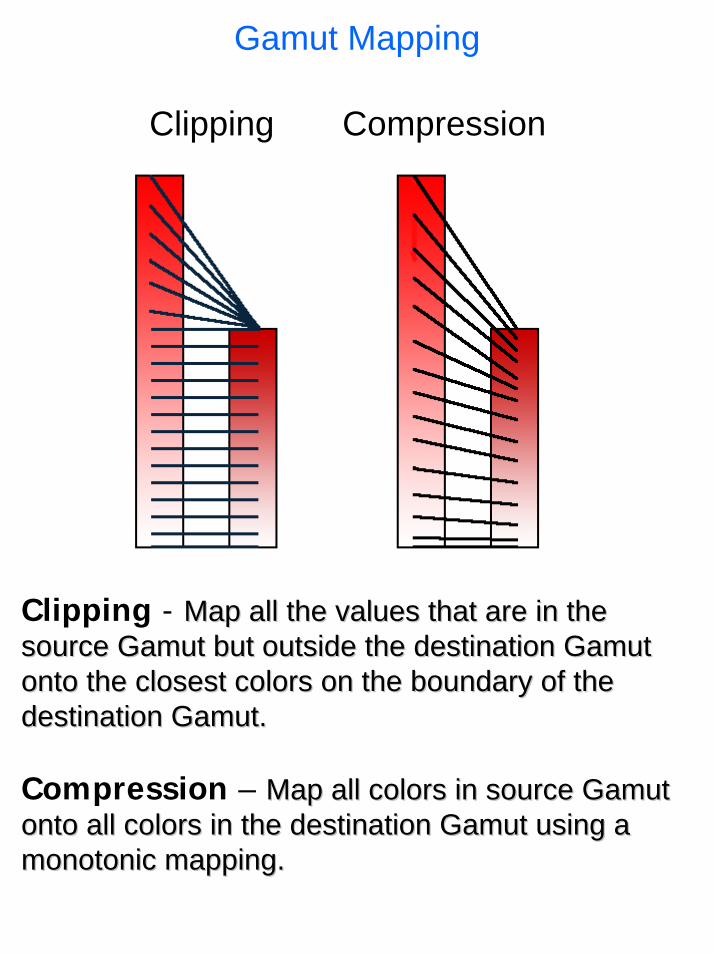
2 Basic Approaches:Clipping Compression
Gamut Mapping
Clipping Compression
Clipping - Map all the values that are in the Map all the values that are in the source Gamut but outside the destination Gamut source Gamut but outside the destination Gamut onto the closest colors on the boundary of the onto the closest colors on the boundary of the destination Gamut. destination Gamut.
Compression – Map all colors in source Gamut Map all colors in source Gamut onto all colors in the destination Gamut using a onto all colors in the destination Gamut using a monotonic mapping. monotonic mapping.

Gamut mapping - Side EffectsMapping Red Hue only
Original
Clipping Compression

Gamut mapping - Side Effects
Original
Clipping Compression
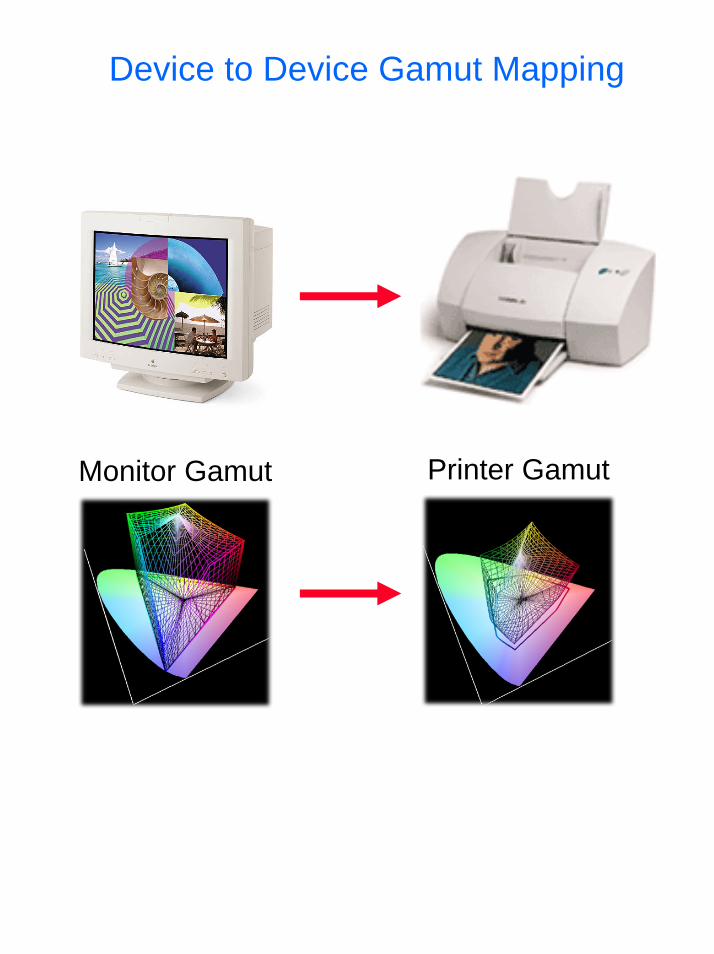
Device to Device Gamut Mapping
Printer GamutMonitor Gamut

Device Independent
0.80.40.0
0.5
0.9
y
0.0
StandardColorSpace

ICC Profiles
ICC = International Color ConsortiumEstablished in 1993 by 8 vendors, now over 70 members.
Goal: to define and create representations for inter-device color communication. Called ICC Profile.
Adobe Systems Incorporated Agfa-Gevaert N.V.Apple Computer, Inc.Eastman Kodak CompanyFOGRA-Institute Microsoft CorporationSilicon Graphics Inc.Sun Microsystems, Inc. Taligent, Inc.
http://www.color.org/

Profiling and Calibration
Profile Connection Space (PCS) –CIEXYZ or CIELAB.
http://www.rlg.org/visguides/visguide3.html

Profiling and Calibration
Independent Color space (Lab)Independent Color space (Lab)
Lab Lab Lab Lab
Scanner ICCProfile
Scanner ICCProfile
Monitor ICCProfile
Monitor ICCProfile
DigCam ICCProfile
DigCam ICCProfile
Printer ICCProfile
Printer ICCProfile
rgb rgb rgb cmyk
Monitor Printerscannar Digital Camera
Profile Connection Space (PCS) –Independent Color Space
CIEXYZ or CIELAB.
http://www.rlg.org/visguides/visguide3.html
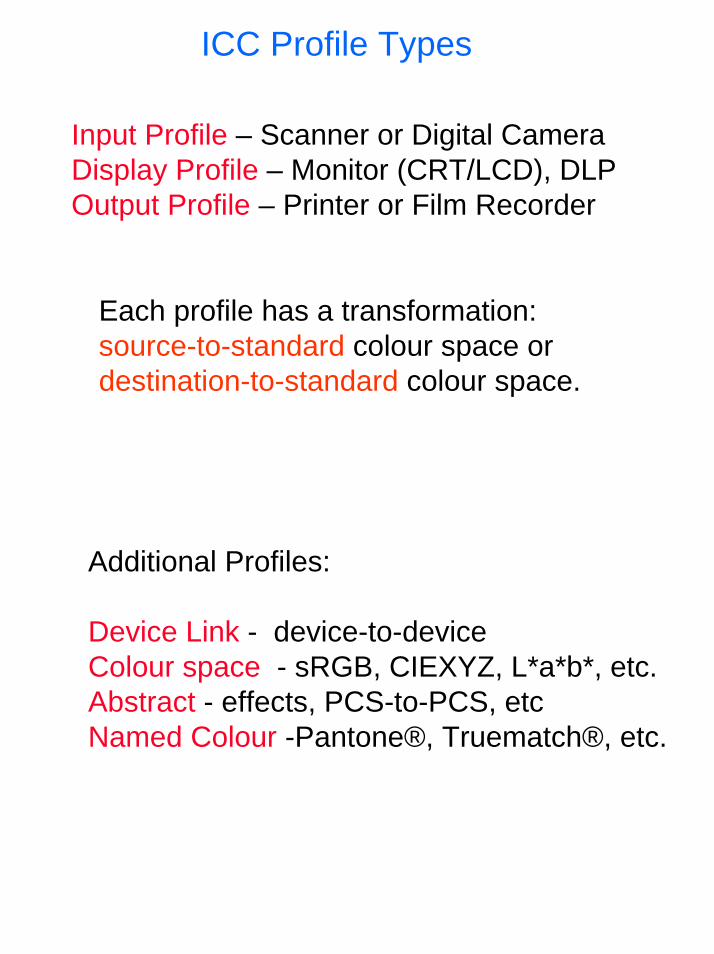
ICC Profile Types
Input Profile – Scanner or Digital CameraDisplay Profile – Monitor (CRT/LCD), DLPOutput Profile – Printer or Film Recorder
Each profile has a transformation: source-to-standard colour space or destination-to-standard colour space.
Additional Profiles:
Device Link - device-to-deviceColour space - sRGB, CIEXYZ, L*a*b*, etc.Abstract - effects, PCS-to-PCS, etcNamed Colour -Pantone®, Truematch®, etc.
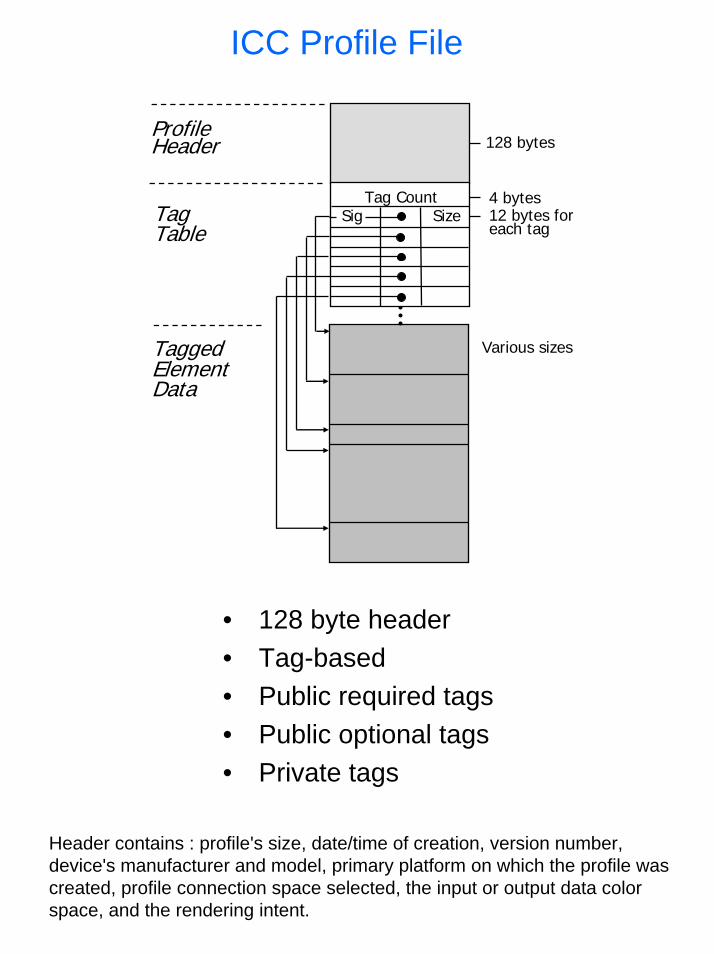
ICC Profile File
ProfileHeader 128 bytes
TaggedElementData
Various sizes
TagTable
4 bytes12 bytes foreach tag
Tag CountSig Size
• 128 byte header• Tag-based• Public required tags• Public optional tags• Private tags
Header contains : profile's size, date/time of creation, version number, device's manufacturer and model, primary platform on which the profile was created, profile connection space selected, the input or output data color space, and the rendering intent.

StandardColorSpace
StandardColorSpace
Scanner Profile
Monitor Profile
Monitor Profile
Printer Profile
ICC Based Work Flow
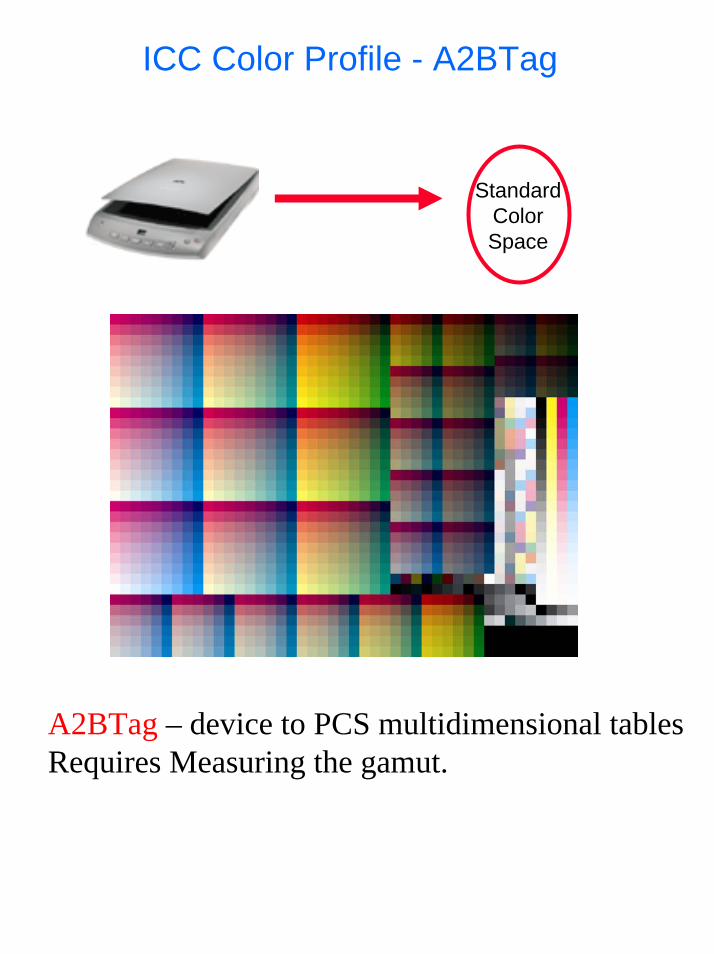
ICC Color Profile - A2BTag
StandardColorSpace
A2BTag – device to PCS multidimensional tablesRequires Measuring the gamut.

Scanner Profiling
Kodak's IT8.7/2calibrated color test target
ScannedValue
PatchXYZ
Profile

Scanner ProfilingBuild a LUT or Matrix conversion from scanned values to XYZ.
Example: XYZ Scanned Value
(100,120,95)(1,1,1)
(125,70,80)
(1.25,0.5,0.75)
(0.5, 0.75,1)
(55,100,95)
0 0.2 0.4 0.6 0.80
0.2
0.4
0.6
0.8

ICC Color Profile - A2BTag
Build interpolation RGB LAB
RGB
LAB

Pinv ( )1 1.25 0.51 0.5 0.751 0.75 1
100 125 55120 70 10095 80 95
Scanner ProfilingBuild a LUT or Matrix conversion from scanned values to XYZ.
Example:
(1,1,1)(100,120,95)
(125,70,80)
(1.25,0.5,0.75)
(0.5, 0.75,1)
(55,100,95)
XYZ Scanned Value
1 1.25 0.51 0.5 0.751 0.75 1
M100 125 55120 70 10095 80 95
= *
M = *
(100,100,100) M100 100100
*0.970.751.01
=
XYZ
Scanned Value

ICC Color Profile - B2ATag
B2ATag - PCS to device multidimensional tables.For every point in the full LAB (PCS) space assign an RGB (device) value.
Out of Gamut colors – the colors that the device can not reproduce.
Rendering intents.Requires Mapping

Printer Profiling
Swatches for printer profiling
PatchXYZ
PrintedXYZ
Profile

Printer Profiling
Build a LUT or Matrix conversion from XYZ to printed values.
SO, if want to print certain XYZ on output,must use conversion Matrix or LUT to mapdesired XYZ to the XYZ to be sent to the printerso that desired XYZ comes out.

XYZ input XYZ output
100 125 55120 70 10095 80 95
20 25 35190 100 100100 70 95
P1 = P2 =
P1 = M * P2
M = P1 * pinv(P2)
Given p, a desired XYZ output, the profilermaps p to new input value to the printer:
M * p = input_p
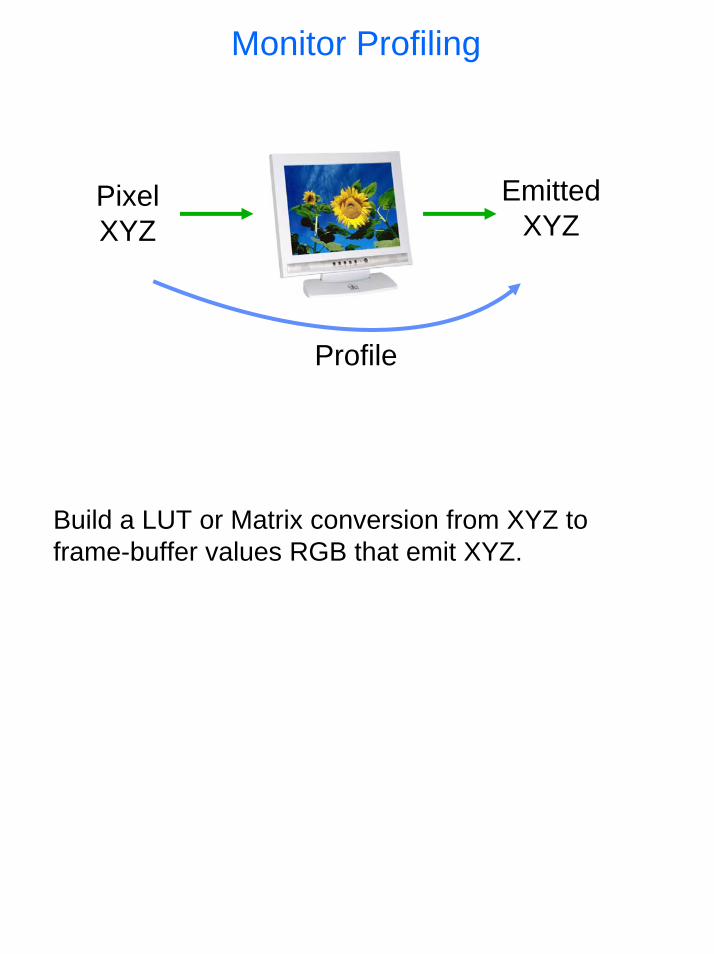
Monitor Profiling
PixelXYZ
EmittedXYZ
Profile
Build a LUT or Matrix conversion from XYZ to frame-buffer values RGB that emit XYZ.

Monitor Profiling
RGBFrame Buffer
MeasuredXYZ
Use Color Ramps
RG
B
SO, if want to display certain XYZ on monitor,must use conversion Matrix or LUT to mapdesired XYZ to the frame buffer RGB so thatdesired XYZ comes out.

Monitor Profiling
Simple profiling uses test swatches and comparisonis visual.
Accurate profiling requires colorimetric measurementsof display set to various frame buffer values.

ICC Rendering IntentsDifferent Gamut Mapping algorithms for dealingwith out-of-gamut colors.
Absolute Colorimetric (Match/Preserve Identical Colors)Colors in-gamut will look the same even if destinationwhite is not the same (e.g. tinted paper). Preserves white pointi.e. compensates for color adaptation. Not reversible.
Relative Colorimetric (Proof / Preserve Identical Colorand White Point)Maps color in-gamut but clips out-of-gamut colors toclosest color in destination gamut. Does not preservewhite point in destination. Not reversible.
Perceptual, (Picture / Maintain Full Gamut)Scales full source gamut into destination gamut.Affects all colors but gradients are smooth (no plugging-up).Is reversible.
Saturation (Graphic/Preserve Saturation)Maps the saturated primary colors in the source to saturated primary colors in the destination, neglecting differences in hue, saturation, or lightness. Not reversible. For graphic images.

Rendering Intents - Absolute Colorimetric
Absolute colorimetric: 1. Reproduces in-gamut colors exactly.
2. Clips out-of gamut colors to the nearest
reproducible hue sacrificing saturation and
possibly lightness.
3. Mostly use for proofing ( source > destination)
Clipping

Rendering Intents - Absolute Colorimetric

Rendering Intents - Absolute Colorimetric
Problems 1 :
Our eyes are much better in evaluating color relationships then they are evaluating absolute colors. In Absolute Colorimetric rendering, the relationship between the in-gamut and out-gamut colors is affected. (Clipping)
Original Clipping

Rendering Intents - Absolute Colorimetric
Problem 2 :
Our eyes adapt to different “colors” of white –chromatic adaptation. Our eyes judge colors in relation to white.
This RI maintains the source white exactly. If destination Device has a different white point then a color cast will be seen in the output.
Example: When printing there is often a visible paper-white border. Since white areas in an image will almost always have some color tint, an absolute colorimetric print will have a color cast because our eyes adapt to the paper-white surround and not the image white.

Rendering Intents - Absolute Colorimetric
Devicewhite point

Rendering Intents - Absolute Colorimetric

Printer small gamut - abs
Full spectrumRendering Intents - Absolute Colorimetric
1) Discontinuities (blue) 2) Gray scale shift

Rendering Intents - Relative Colorimetric
Relative Colorimetric: Translate the white of the source to the white
of the output and shift all colors accordingly.
Reproduces in-gamut colors exactly.
Clips out-of gamut colors to the nearest
reproducible hue.

Gamut Mapping
Devicewhite point
Relative Colorimetric

Printer small gamut - relative
Full spectrumRendering Intents - Relative Colorimetric
1) Loss of details 2) Poor color balance.

Rendering Intents - Perceptual
Perceptual: 1. Compresses the full LAB Color space into
the
Destination gamut.
2. Maintains (more or less) the overall
relationship between colors.
Compression

Printer small gamut - Perceptual
Full spectrumRendering Intents - Perceptual
1) Maintains details 2) Loss of Saturation

Rendering Intents - Saturation
Saturation:1. Preserves the saturation as much as possible.
Sacrifices the hue and lightness.
2. Generally: pleasing colors, saturated colors,
but poor color balance.
Hue

Printer small gamut - Saturation
Full spectrumRendering Intents - Saturation
1) Loss of details 2) Poor color balance.

Rendering Intents - Comparison
RGB Original
CMYK - Perceptual
CMYK - Saturated
CMYK – RelativeColorimetric
CMYK – AbsoluteColorimetric

Gamut Mapping - Can we do Better ?
Device Dependent
Device Independent
StandardColorSpace
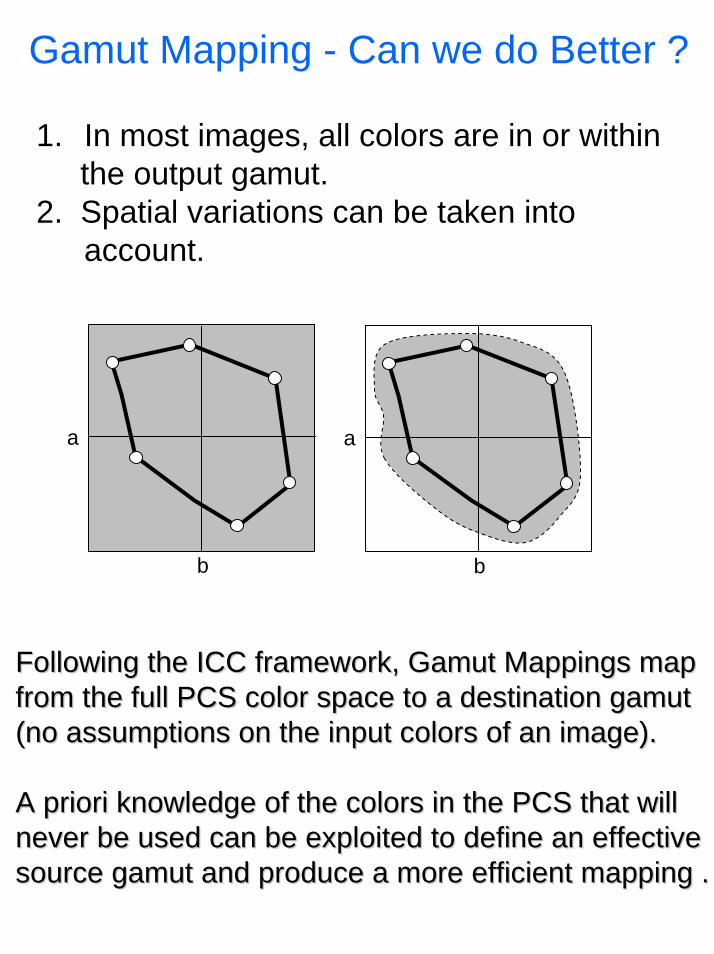
Gamut Mapping - Can we do Better ?
1. In most images, all colors are in or withinthe output gamut.
2. Spatial variations can be taken into account.
a a
b b
Following the ICC framework, Gamut Mappings map Following the ICC framework, Gamut Mappings map from the full PCS color space to a destination gamutfrom the full PCS color space to a destination gamut(no assumptions on the input colors of an image).(no assumptions on the input colors of an image).
A priori knowledge of the colors in the PCS that willA priori knowledge of the colors in the PCS that willnever be used can be exploited to define an effectivenever be used can be exploited to define an effectivesource gamut and produce a more efficient mapping .source gamut and produce a more efficient mapping .

Image Independent vs Image DependentGamut Mapping
Two possibilities for Gamut Mapping betweenTwo possibilities for Gamut Mapping betweentwo two GamutsGamuts: :
1. The mapping is a function of the input and1. The mapping is a function of the input andoutput device output device GamutsGamuts alone, i.e. mapping is alone, i.e. mapping is independent of the colors in the input image.independent of the colors in the input image.
2. The mapping is a function of the colors within2. The mapping is a function of the colors withinthe input image and the output device Gamut, the input image and the output device Gamut, i.e. mapping is image dependent.i.e. mapping is image dependent.
Image Independent - time efficient but poorer rendered image quality.
Image Dependent - better rendered image qualitybut time consuming.

Originals
Lightness attenuating GM
Saturation attenuating GM

Compromise : Image Guided Gamut Mapping
Rather than calculating the Gamut Mapping Tables on the fly for each image (image dependent), a set of possible Gamut Mappings are allowed.
Rather than computing the exact input image Gamut, only a few, easy to compute image characteristics are determined.
During the rendering process, the selected imagecharacteristics are used to determine the Gamut Mapping from the possible set, which bestsuites the input image.
(A. Golan & H.Hel-Or 2007)

Input Image Data Perceptual Color Space Output Image Data
Input Device Profile Output Device Profile
rgb lab lab rgb
ICC profile
Independent Color spaceICC profile
Color Management Module (CMM):
Current Workflow

Input Image Data Perceptual Color Space Output Image Data
Input Device Profile Chosen GM from Output Device Profile
Characteristic Extractor
Decision tool GM1 GM2 GM3
GM4 GM5 GM6
Output Device Profile
and
Image Guided Gamut Mapping Workflow

• Basic statistical measuresBasic statistical measures::–– Mean value.Mean value.–– Standard deviation.Standard deviation.–– Minimum Value.Minimum Value.–– Maximum Value.Maximum Value.–– The 25The 25--percentile.percentile.–– The 50The 50--percentile.percentile.–– The 75The 75--percentile.percentile.
•• Image contentImage content ::–– Shadow Strength .Shadow Strength .–– Highlight Strength.Highlight Strength.–– Global contrast.Global contrast.
•• Local SpatialLocal Spatial::–– Local Contrast strength.Local Contrast strength.
•• GeneralGeneral::–– Destination device Out of Gamut Pixels Ratio.Destination device Out of Gamut Pixels Ratio.
Image Characteristics
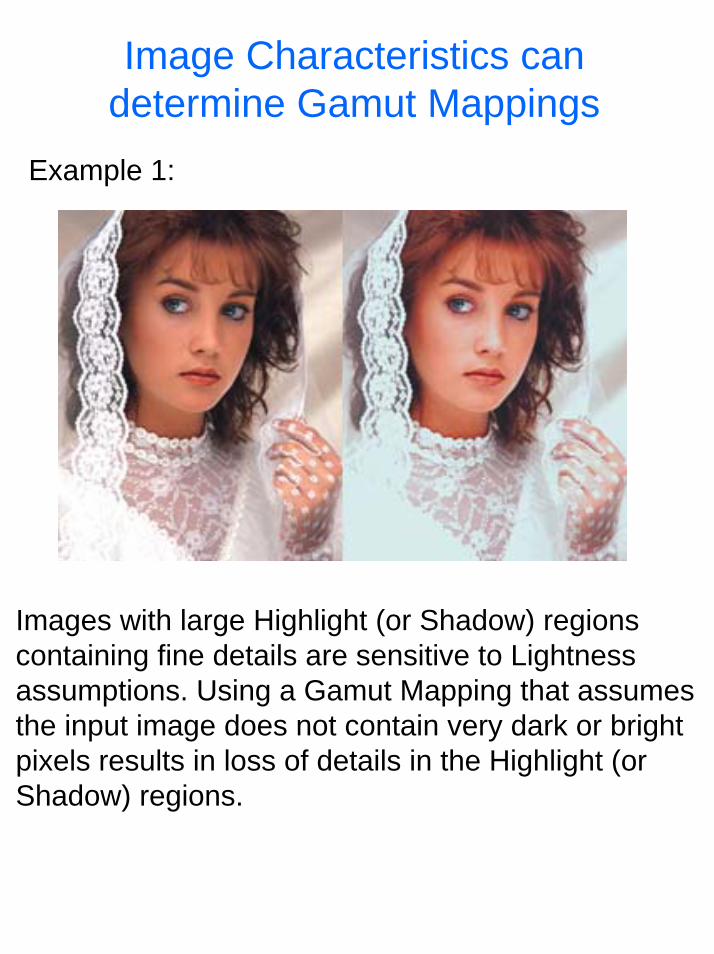
Image Characteristics can determine Gamut Mappings
Example 1:
Images with large Highlight (or Shadow) regions containing fine details are sensitive to Lightness assumptions. Using a Gamut Mapping that assumes the input image does not contain very dark or bright pixels results in loss of details in the Highlight (or Shadow) regions.
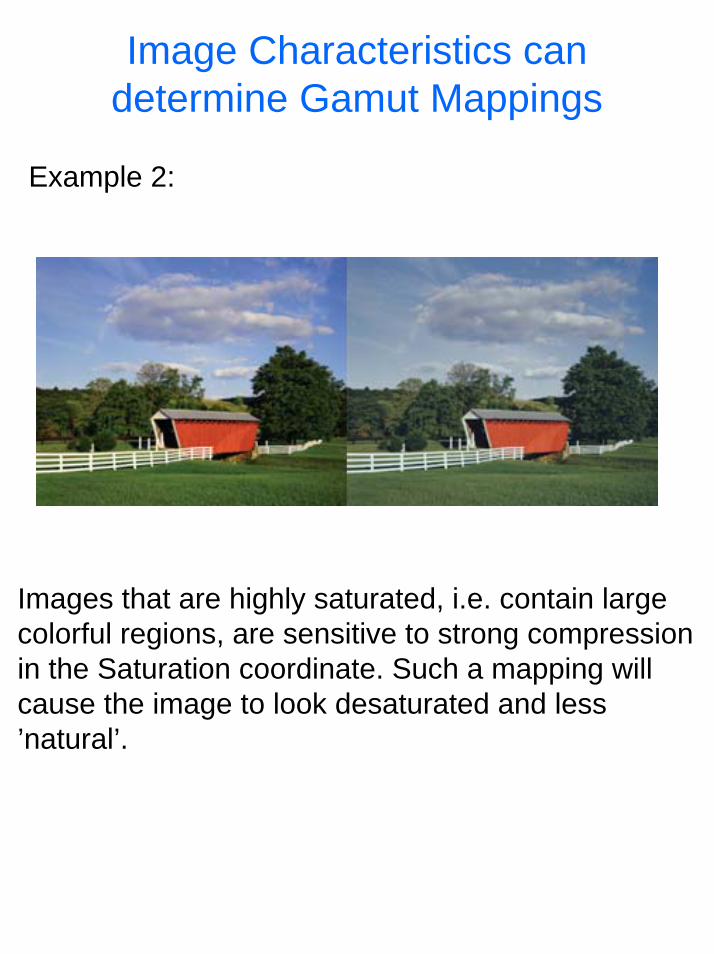
Image Characteristics can determine Gamut Mappings
Example 2:
Images that are highly saturated, i.e. contain large colorful regions, are sensitive to strong compression in the Saturation coordinate. Such a mapping will cause the image to look desaturated and less ’natural’.

Ranking of the informativeness ofimage characteristics.
Saturation Compressing Lightness Compressing
1 Medium High Saturation. Highlights of Luminance.
2 Mean of Saturation. Medium High Luminance.
3 Out of Gamut Pixels Ratio Medium Luminance.
4 Highlights of Luminance. Standard deviation of Luminance.
5 Medium High Luminance. Shadows of Luminance.
6 Contrast using Highlights and Shadows Mean of Luminance.
7 Medium Luminance. Medium Low Saturation.
8 Medium Low Saturation. Maximum saturation.
9 Maximum luminance. Medium Saturation.
10 Medium Saturation. Maximum luminance.
11 Minimum saturation. Standard deviation of Saturation.
12 Global contrast in image Mean of Saturation.
13 Maximum saturation. Minimum saturation.
14 Standard deviation of Luminance. Global contrast in image
15 Minimum luminance. Contrast using Highlights and Shadows
16 Standard deviation of Saturation. Minimum luminance.
17 Shadows of Luminance. Out of Gamut Pixels Ratio -
18 Medium Low Luminance Medium High Saturation.
19 Mean of Luminance. Local contrast in the image
20 Local contrast in the image Medium Low Luminance.

Bad Gamut Mapping.