Embed Size (px)
Citation preview

7/28/2019 DG Contribution to network security_R2.pdf
http://slidepdf.com/reader/full/dg-contribution-to-network-securityr2pdf 1/79
SECURITY CONTRIBUTION FROM
DISTRIBUTED GENERATION
(Extension part II)
K/EL/00287/REP
URN 02/1288
Contractor
UMIST/PPA
Prepared by
Ron Allan
Goran Strbac
Keith Jarrett
The work described in this report was carried
out under contract as part of the DTI Newand Renewable Energy Programme, which is
managed by Future Energy Solutions. Theviews and judgements expressed in thisreport are those of the contractor and do not
necessarily reflect those of the DTI or FutureEnergy Solutions.
First Published 2003© Crown Copyright 2003

7/28/2019 DG Contribution to network security_R2.pdf
http://slidepdf.com/reader/full/dg-contribution-to-network-securityr2pdf 2/79
ETSU/FES Project K/EL/00287 Extension – Final Report
________________________________________
Page 2 of 79
ETSU/FES Project K/EL/00287 Extension
______________________________
SECURITY CONTRIBUTION FROM
DISTRIBUTED GENERATION
Final Report
______________________________
Ron AllanGoran Strbac
Keith Jarrett
UMIST/PPA
11 December 2002

7/28/2019 DG Contribution to network security_R2.pdf
http://slidepdf.com/reader/full/dg-contribution-to-network-securityr2pdf 3/79
ETSU/FES Project K/EL/00287 Extension – Final Report
________________________________________
Page 3 of 79
CONTENTS
Preface – Terms of referenceI Project Extension
II Project deliverables
III Constraints and scope of the projectIV Status of final reportV Presentation of reportVI Acknowledgements
Executive summary
1. Background and principles1.1. DTI objectives of project
1.2. Principles
1.3. Historical perspective1.3.1. Existing planning standards – principles used1.3.2. Formulation of ER P2/5
1.3.2.1.1. Availability and shift patterns
1.3.2.1.2. Load shapes1.3.2.1.3. Persistence of generation
1.3.2.1.4. Reliability studies1.3.2.1.5. Remote connection1.3.2.1.6. The 11kV connection
1.3.2.1.7. Maintenance regimes1.3.2.1.8. Materiality
1.3.2.1.9. Modern distributed generation
2. Principles and details of the methodology2.1. Basic concept of P2/5 security standard
2.1.1. Principle of group demand
2.1.2. Recommended levels of security2.1.3. Contribution of generation to network capacity2.1.4. Capability of a network to meet demand
2.2. Types and parameters of generation to be considered2.2.1. Historical (pre-privatisation) generation
2.2.2. Present (post-privatisation) generation2.2.3. Characteristics of generating plant2.2.4. Parameters of plant and systems
2.2.5. Approaches to be developed2.3. Generating plant with non-intermittent energy sources
2.3.1. Generation model2.3.2. Load model2.3.3. Evaluation of EENS of generation
2.3.4. Evaluation of EENS due to effective circuit capacity2.3.5. Availability of effective circuit – what should it be?
2.3.6. Evaluating effective generation contribution
2.3.7. Evaluating security2.3.8. Consideration of materiality

7/28/2019 DG Contribution to network security_R2.pdf
http://slidepdf.com/reader/full/dg-contribution-to-network-securityr2pdf 4/79
ETSU/FES Project K/EL/00287 Extension – Final Report
________________________________________
Page 4 of 79
2.3.9. Concluding comments2.4. Generating plant with intermittent energy sources
2.4.1. Impact of intermittency2.4.2. Modelling intermittency
2.4.3. Modelling approaches
2.4.4. Application to wind and CHP plant2.4.5. Assessment comparing generation with equivalent circuit
2.4.5.1. Assessment approach2.4.5.2. Evaluating generation contribution to security
2.4.6. Concluding comments2.5. Effect of remote generation and common coupling
2.5.1. Modelling concept
2.5.2. Generating plant with non-intermittent sources2.5.3. Generating plant with intermittent sources
2.6. Contribution by multiple generation sites2.7. Contribution by generation not available for 24hr
2.7.1. Introduction2.7.2. Modelling approach
2.7.2.1. Approach used in P2/5
2.7.2.2. General principles2.7.2.3. Generation is flexible2.7.2.4. Generation not flexible but spans peak demand
2.7.2.5. Generation not flexible but does not span peak demand
3. Data availability and plant characteristics3.1. Introduction
3.1.1. Group demand data3.1.2. Distribution plant reliability and operational data3.1.2.1. Reliability statistics
3.1.2.2. Operational statistics3.1.3. Generation export data
3.1.3.1. Historic profiles
3.1.3.2.Forecast profiles3.2. Specific plant types
3.2.1. Conventional generation3.2.2. CHP3.2.3. Land- fill gas fuelled generation
3.2.3.1. Samples obtained – data accessibility3.2.3.2. Review of sample profiles
3.2.3.3. Indications from the review3.2.4. Wind powered generation
3.2.4.1. Samples obtained – data accessibility
3.2.4.2. Review of sample profiles3.2.4.3. Indication from the review
3.2.5. Micro-generation3.2.6. Conclusions on data access and quality
4. Numerical studies and illustrative examples
4.1. Contribution of non-intermittent generation

7/28/2019 DG Contribution to network security_R2.pdf
http://slidepdf.com/reader/full/dg-contribution-to-network-securityr2pdf 5/79
ETSU/FES Project K/EL/00287 Extension – Final Report
________________________________________
Page 5 of 79
4.1.1. Application of methodology algorithm4.1.2. Re-establishing Table 2 of P2/5
4.1.3. Effect of materiality4.1.4. Effect of availability and number of units
4.1.5. Effect of shape of LDC
4.1.6. Application example4.2. Contribution of intermittent generation
4.2.1. Application of methodology algorithm4.2.2. Effect of persistence level
4.2.3. Effect of seasonal variations4.2.4. Sensitivity studies
4.3. Concluding comments
5. Implementation issues5.1. Introduction5.2. Data availability
5.2.1. Group demand estimates5.2.2. Distribution system performance and other data5.2.3. Techniques for profile analysis
5.2.4. Generation profiles - typicality5.3. Derivation of Tm
5.4. Approach to determine the effective generation capacity5.5. Format of specifying generation contribution in updated P2/5
5.5.1. Introduction
5.5.2. Tabular approach5.5.3. Graphs and figures approach
5.5.4. Spread-sheet approach5.5.5. Different types of generation in one demand group5.6. Future activities
6. Conclusions and recommendations 6.1. Objectives6.2. Proposed methodology6.3. Constraints an d restrictions
6.4. Implementation

7/28/2019 DG Contribution to network security_R2.pdf
http://slidepdf.com/reader/full/dg-contribution-to-network-securityr2pdf 6/79
ETSU/FES Project K/EL/00287 Extension – Final Report
________________________________________
Page 6 of 79
PREFACE
Terms of Reference
I. Project Extension
This report describes studies that are an extension to ETSU Project K/EL/00287.These previous studies are described in a separate report, “Network Security
Standards with Increasing Levels of Embedded Generation”, written by R.N.Allanand G.Strbac of UMIST and dated 10 August 2002. The previous report consideredthe aspect in more detail as its scope and objectives were much more wide-ranging.
This previous Report is referred to in this report as the “Main Final Report”.
II. Project Deliverables
The main objective of this extension was to develop a methodology to assess thesecurity contribution from modern distributed generation in order to update Table 2 of Engineering Recommendation P2/5. The agreed deliverables of this project were a
report specifying the following:-§ background, issues and objectives
§ data requirements of the proposed methodology
§ principles and details of the proposed methodology
§ examples illustrating the approach and methodology
§ conclusions and recommendations for updating Table 2
III. Constraints and Scope of the Project
The constraints were set by Workstream 3 of the DTI/Ofgem Distributed GenerationCo-ordinating Group and its Technical Steering Group, and reflected its objectives
and timescales. Consequently, the constraints consisted of:-§ the methodology should permit simple and straightforward extensions to Table 2
§ the approach should be consistent with the concepts and analysis underpinning theexisting P2/5
§ the results should be implementable in the short term
IV. Status of Final Report and Material
This report is the Final Report of this project extension and therefore all the content,including concepts and ideas, results, discussions and conclusions are the definitive
findings of our studies.
V. Presentation of Report
This report was commissioned by FES and it is to this organisation that the report has
been officially submitted. However Workstream 3 of the DTI/Ofgem DistributedGeneration Co-ordinating Group and its Technical Steering Group has overseen the
activity. Therefore the report has also been submitted to this Workstream, and it is
understood that it will provide a major input to the subsequent output of thisWorkstream.

7/28/2019 DG Contribution to network security_R2.pdf
http://slidepdf.com/reader/full/dg-contribution-to-network-securityr2pdf 7/79
ETSU/FES Project K/EL/00287 Extension – Final Report
________________________________________
Page 7 of 79
VI. Acknowledgements
The authors are grateful to Mr Pedja Djapic for his contributions in analysing thenumerical examples presented in this report.

7/28/2019 DG Contribution to network security_R2.pdf
http://slidepdf.com/reader/full/dg-contribution-to-network-securityr2pdf 8/79
ETSU/FES Project K/EL/00287 Extension – Final Report
________________________________________
Page 8 of 79
Executive Summary
Objectives
This project was conducted in order to develop a methodology that could beused to assess the contribution of distributed generation to security of supply. The
present standard P2/5 for assessing this security was written in the 1970s and clearlydoes not reflect present-day generating units nor their mode of operation. Therefore
the specification was to develop an appropriate methodology that would reflect theattributes of present-day generation but constrained in two very specific respects.
Firstly the approach had to be simple, easy to implement and achievable in the shortterm. Secondly the approach had to be consistent with that used to develop thegeneration contributions specified in the present P2/5.
Proposed Methodology
The proposed methodology determines the capacity of a perfect circuit which,when substituted for the distributed generation, gives the same level of expected
energy not supplied (EENS). This capacity is the effective contribution of thegeneration system. This approach is identical in concept with that used in developing
the present P2/5, a conclusion confirmed by the results given in the Report, whichreproduce the 67% value specified in Table 2 of P2/5.
The methodology however permits a more extensive set of plant and system
attributes to be considered and reflects modern types of generating units andoperational modes including conventional, CHP and renewable energy units.
Specifically the methodology permits the following attributes to be assessed:-§ unit attributes: number of units, capacity of units, technology of units
§ system attributes: peak load, load profile, multiple generation sites,
remote location of generation sites, units not available for 24hr in a day
§ availability attributes: technical availability which relates to whether the plant is in a working state, i.e. it must not have failed: energy availability
which relates to whether energy is available to drive the units: commercialavailability which relates to whether it is commercially available
§ materiality attributes: the methodology is applicable to all generationsites irrespective of number of units and their capacity, whereas the presentP2/5 has special considerations for one and two units particularly if these
have relatively large capacities.
Constraints and Restrictions
The project was subject to several specified constraints. The most significant,
relating to the input of how to develop the methodology, was the need to be consistentwith the existing P2/5. This restricted the methodology to comparing the generation
with the effective capacity of a perfect circuit and to use EENS as the reliabilitycriterion. There are alternative approaches and alternative reliability measures against

7/28/2019 DG Contribution to network security_R2.pdf
http://slidepdf.com/reader/full/dg-contribution-to-network-securityr2pdf 9/79
ETSU/FES Project K/EL/00287 Extension – Final Report
________________________________________
Page 9 of 79
which the generation could be compared. These aspects are discussed in a companionReport1 written by two of the present authors.
In addition there are several aspects relating to constraints, restrictions andapplications associated with the output of the methodology, including the following.
The values given by the methodology are similar in concept to the 67% value
quoted in P2/5. This value is essentially an average value representing the average behaviour of the generating system. In deciding whether a system complies with P2/5,
this value is treated in a deterministic sense, i.e. effective capacities are summated andcompared with the requirements specified in P2/5. There is therefore an implicit
assumption that this level of capacity is available at all times of need. It must berecognised that the actual contribution can be greater or less than this assessed leveland therefore P2/5 itself can not, and does not, ensure that a capability is deliverable
at the time of need. It can also be recognised that this variability is generally greater with generating units than circuits, and greater with a small number of units than a
large number of units. For this reason, one school of thought suggests that sites with asmall number of units should be treated differently. However it must be recognised
that the approach underpinning the methodology treats all units irrespective of number and size in an absolutely objective manner. This is completely consistent withthe concepts of P2/5, and permits the actual effective contribution to be calculated,
unlike the present P2/5 which specifies a single value of 67% contribution for all unitsizes and numbers. Consequently to vary the values given by the methodology would
be to impose a subjective judgement, which is outside of the scope and specification
of this present project.The methodology does not evaluate directly a level of risk as would be
experienced by customers. Instead it establishes a proxy to this by evaluating acapability level which is perceived to be sufficient to minimise the duration of interruptions if they occur. Indeed this is the principle and philosophy of the present
P2/5. It should be noted that the inherent risk is unaffected by the methodology.Therefore, given that EENS is the criterion for assessing the contribution of
generation to network security, the inherent risk to loss of supply will be no greater than that assessed by the present P2/5. It is probably worth noting however that, if sections of the system, including generation and/or other transfer capacity, are ignored
in determining whether the system is P2/5 compliant, then the actual capability of thesystem would be greater and in excess of P2/5 requirements, and the inherent risk
would be lower. This is a consequence of the assessment procedure, not themethodology.
In any practical situation, the protection and stability of the generation would
need to be taken into account. This is outside the scope and specification of this project, and is also outside the explicit scope of P2/5. However, even if the generation
is tripped following a fault, the developed methodology is still applicable for quantifying the security contribution made by that distributed generation. This maynot be available instantaneously because of the time to restore the generation but
could still be a contributing factor after a short period of time, such as 1min, 15min,3hr etc. This is again consistent with the current P2/5, which permits generation to be
considered in this way.
1“Network Security Standards with Increasing Levels of Embedded Generation”. ETSU Project K/EL/00287.
Final Report by R.N.Allan and G.Strbac, UMIST, 10 August 2002.

7/28/2019 DG Contribution to network security_R2.pdf
http://slidepdf.com/reader/full/dg-contribution-to-network-securityr2pdf 10/79
ETSU/FES Project K/EL/00287 Extension – Final Report
________________________________________
Page 10 of 79
Implementation
There are three main ways of implementing the methodology. The first optionis a look-up table in the form of the current Table 2 of P2/5. This would retain the
simplistic and practical merits of this approach, but it is likely to be slightly more
complex and extensive in its application than the present table. The second option is based on families of graphs and/or figures. Here a larger range of system design
parameters can be factored into the graphs to reduce the implicit approximations of the tabular approach. The third option is a computerised approach based on a spread-
sheet environment. Each situation is then the subject of an individual assessment, butusing a standardised approach to ensure equity of treatment whilst recognising manylocal or site-specific parameters. It is only this approach that can accurately assess all
specific attributes pertaining to specific situations including the ability to assessdifferent generation technologies on the same site and multiple generation sites
feeding the same load group.

7/28/2019 DG Contribution to network security_R2.pdf
http://slidepdf.com/reader/full/dg-contribution-to-network-securityr2pdf 11/79
ETSU/FES Project K/EL/00287 Extension – Final Report
________________________________________
Page 11 of 79
1. Background and Principles
1.1. DTI Objectives of Project
As part of its wide brief on the impact of distributed and modern forms of generation, the DTI has established a workstream focussed on short-term network
solutions, one of which relates to the immediate problem of how best to assess thecontribution to network security from distributed generation. 2 Further work onlonger-term reviews of this issue is also in hand.
It was decided that this shorter-term work assessment should proceed in two phases –
a) the development of a methodology in sufficient detail such that it can be usedto form the basis of a functional specification for a subsequent phase of work
b) the implementation of this methodology, i.e. collating and processing therequired data, presenting the results of the analysis in the form indicated bythis piece of work and producing a guidance note to be attached to the supply
industry’s current planning standard, Engineering Recommendation P2/5 (ER P2/5).
This present document describes the work done to further item (a) above. TheTerms of Reference were agreed in July 2002 and UMIST was contracted to submit
the final report by 1 December 2002.
1.2. Principles
It was agreed that a methodology should be able to be used so that theassessments of underlying risk to security of supplies with modern distributedgeneration could be demonstrated to be the same as that implicit within ER P2/5.
When developing the methodology, due consideration was to be given to thefollowing issues -
a) the concepts of availability, persistence, reliability, and materiality of generation plant as understood during the development of P2/53. For wind generation,consideration should be given to the size of the geographic footprint in relation to
the Classes of Demand Group; b) the composition and interdependence of generation plant;
c) the treatment of single and multiple generation units in a demand group;d) generation plant connection arrangements together with the associated network
configuration and topology including the balance between the security provided
by the network (toge ther with grid connected generation) and by distributedgeneration;
e) the degree of alignment between the demand profile and generation export profile
2In order to implement the recommendations of the DTI/Ofgem report, a Distributed Generation Co-ordinating
Group together with a supporting Technical Steering Group (TSG) was established. A number of work streams
are being pursued, WS3, is focussed on short-term network solutions.
3These terms have been reviewed and revised in this document to reflect more modern terminology
7/28/2019 DG Contribution to network security_R2.pdf
http://slidepdf.com/reader/full/dg-contribution-to-network-securityr2pdf 12/79
ETSU/FES Project K/EL/00287 Extension – Final Report
________________________________________
Page 12 of 79
f) the requirements for the steady state and dynamic stability of generationconnected to the network.
Additionally the approach of ER P2/5 should be maintained if possible, which
meant that ideally -
i) the effective generation contribution would be sought in terms of the effect of
passive distribution circuit capacity offering similar benefits to the generatio n.Clearly this is a simplification, in that the frequency and duration of outages
for circuits is different from that of generation plant. It also indicated that risk would primarily be assessed in terms of the Expected Energy Not Supplied(EENS). Given that EENS is the criterion for assessing the contribution of
generation to network security, the inherent risk to loss of supply will be nogreater than that in P2/5
ii) should account for modern plant characteristics, in particular, wind power andother intermittent forms of generation;
iii) the resulting analyses should be convertible to easily used algorithms.
1.3. Historical Perspective
ER P2/5, published in 1978, is a standard describing the criteria by whichnetworks are designed to provide security of electricity supplies, afforded by
distribution network operators (DNOs). It documents how to account for the securityfrom local generation connected to networks at that time. It is probabilistic in
derivation, but is normally applied in a prescriptive sense where tables are used to
determine the required security for any particular demand group (Table 1 of P2/5) andto establish the contribution from generation plant (Table 2 of P2/5).
In order to make a meaningful contribution to network security, generationneeds to offer a certain degree of availability, reliability, persistence and materiality
etc.ER P2/5 was conceived against a background of the plant being located in
power stations comprising multiple sets, centrally managed by an organisation with
strong links with the distribution system operators, and connected to the utilitysystems at 33kV and higher voltages.
Whilst not explicitly excluded, no special consideration was given to single setarrangements. Certainly no consideration was given to single set production fromlandfill gas, municipal waste production, CHP plant, small CCGT generation, or other
types of generation embedded within LV distribution systems.Modern plant offers a diverse spectrum of characteristics. The challenge is to
establish and agree the key characteristics of modern distributed generation (DG) suchthat they can be incorporated in a security assessment methodology and hence intoDNO planning standards.
Between, say, 1960 and 1990, the economics of electricity generationencouraged the development of large power stations exporting bulk electricity at very
high voltages. The large plant was also in the control of the CEGB 4 that also hadresponsibility for the transmission function.
4 Central Electricity Generating Board

7/28/2019 DG Contribution to network security_R2.pdf
http://slidepdf.com/reader/full/dg-contribution-to-network-securityr2pdf 13/79
ETSU/FES Project K/EL/00287 Extension – Final Report
________________________________________
Page 13 of 79
Thus the UK evolved a system with a backbone of a relatively limited number of large, reliable, generating stations that could be directed to generate and deliver
power when required; plant that could operate for long periods without interruptionwhilst connected to high voltage networks; and which used reliable transmission and
distribution systems.
1.3.1. Existing Planning Standards – Principles Used
ER P2/5 incorporates some recognition of the contributions provided by
generation to local security. However the standard was constructed to accommodatethe vestiges of smaller CEGB plant. These consisted mainly of stations of less than,say, 200MW capacity generally connected at 132kV or 33kV, rather than modern
plant and its disposition at lower voltages (often of less than 10MW capacity andconnected at 11kV). The result of this is that it is now unclear how to recognise the
contribution to network security from modern DG, and how to maintain the
underlying network security levels laid down in ER P2/5. In ER P2/5, generation inthe context of local security is considered in terms of its ability to support local
demands in times of shortages of capacity within the distribution and transmissionsystem. Generation is much less reliable than (passive) distribution plant. Its role was
conceived of as one of supporting systems in times of risk, for example by reducingthe risks associated with peak demands – thus avoiding investment in distributioncircuits.
The key attributes of generation plant that forms part of a distribution network are:
• Availability – when needed, there must be a high expectation that plant will beable to respond and supply demand.
• Persistence – the plant will be able to run for as long as it is needed.
• Reliability - the plant will not fail frequently when it is being operated.
• Materiality – the plant capacity should not over-dominate the capability of thecore distribution system.
The generating plant considered by ER P2/5 had the followingcharacteristics:–
• Availability - virtually all system plant under the CEGB’s control was steam
driven, much of it fossil-fuelled. Fuel sourcing was largely determined by theUK’s national fuel stocking policy – there were few constraints on plant operationcaused by fuel management. Plant and transmission system maintenance
scheduling were in the hands of the same organisation (the CEGB). No renewablegeneration (e.g. wind or tidal power) was included in the plant portfolio, and thus
plant of this nature was not considered. In this context, the predictability of theoperating regime was important. Shift and load factors would be relatively
predictable and the uncertainties of the current market-driven dispatch regime did
not exist. An important economic constraint that was recognised was that lowmerit plant was still assumed to be operated within the national merit order, and
hence its operating hours were broadly assumed to be dictated by the national load
requirements. Thus low merit plant was constrained to operate during national peak load time, which would not necessarily coincide with the local demand

7/28/2019 DG Contribution to network security_R2.pdf
http://slidepdf.com/reader/full/dg-contribution-to-network-securityr2pdf 14/79
ETSU/FES Project K/EL/00287 Extension – Final Report
________________________________________
Page 14 of 79
profile, although there was a practical mechanism for negotiating such out of merit operation.
• Persistence- plant was technically able to generate for long periods when needed. The timing of generation was dictated by centralised management systems and
could be called on to provide system support when judged necessary. The plant
had been designed to robust technical standards that allowed continuous operationunder a wide range of system conditions and incidents.
• Reliability- typical power stations comprised several generating sets such that theoutput of at least a significant part of the station could be relied upon.
• Materiality - plant output was often not dominant within the 132kV demandgroups that they supplemented, and most small plant was operating to two-shift or
one-shift regimes (or less). Stations containing sets smaller than 20MW wereunusual and there was no significant amount of generating plant connected at
11kV or lower voltages.
1.3.2. Formulation of ER P2/5
The process of formulating ER P2/5 took into account the key characteristics
of plant. The practical constraints on availability were seen to be shift pattern and itsinteraction with load shape: reliability and persistence were taken to be relativelyassured as a result of the technical and organisational arrangements that existed.
1.3.2.1. Availability and Shift Patterns
The availability modelling used in the construction of ER P2/5 assumed asimplified model, with full generating capacity for each generating set being in place
for 86% of the time.The shift patterns assumed were those that typified plant in the early 1970s
and were assumed to continue for the future of ER P2/5. The load factors andcorrelation with the daily load shape were taken on the advice of the CEGB – two-shift plant was indicated as servicing the daytime and evening demand and one shift
plant servicing mainly the evening peak.It was taken that security contributions were not normally to be expected
outside the expected shift periods, despite the (then) credible opportunity of out of merit operation if needed to support load.
1.3.2.2. Load Shapes
At the time ER P2/5 was developed, there was a wide range of variation indemand shapes. National load shapes were used in most of the original studies, andwhere these deviated from the reasonable norm, then it was accepted that ER P2/5’s
guidance should be treated with circumspection because of their influence on plantshift patterns.

7/28/2019 DG Contribution to network security_R2.pdf
http://slidepdf.com/reader/full/dg-contribution-to-network-securityr2pdf 15/79
ETSU/FES Project K/EL/00287 Extension – Final Report
________________________________________
Page 15 of 79
1.3.2.3. Persistence of Generation
The load shapes indicate the scale of persistence that plant needed, and showthe sub-periods for which generation is needed to support demand for the whole
period after transmission system failures.
It was an implicit assumption of the modelling that generating plant wouldnormally be able to run for as long as needed without fuel restraints.
1.3.2.4. Reliability Studies
The ER P2/5 guidance was checked during its development by carrying outreliability and cost benefit studies for a number of typical system arrangements.
Where the support of only one or two generators of larger size existed, it was
found that there would have been a higher than acceptable risk of loss of supply, andthe results indicated that situations with large single sets, and possibly large two-set
arrangements should be the subject of special studies.The recommendations given in ER P2/5 were guided by results of two sets of
studies carried out on a sample of circuit topologies. In the first set of studies, a group
demand was assumed to be supplied by two or three transformer feeders backed up byvarying amounts of generation, typically connected at 33kV and 132kV. These were
then compared with the second set of studies where the generation was replaced by acircuit which had its capacity adjusted so that the overall performance of the network was similar to that of the first. By this means it was possible to determine the extra
circuit capacity required to replace a given number and size of generator sets, in order to provide the same level of security to the group.
1.3.2.5. Remote Connection
In the modelling studies of ER P2/5’s local generation, it was assumed that
generation was directly connected to conventionally “firm” busbars.Remote connection was not modelled, given the adoption of a simplifying
assumption - that the effect of short(ish) connections from such stations would nothave any material effect on their effective availability of the connected generation5,although there is a conditionality to recognise – that the line failure might coincide
with other transmission system failures, thus critically reducing the availability of local generations at the time when it is needed. Thus, to a degree, “remote
connection” was covered by the normal standards, the extra insecurity contributed by
the system not being considered to be of major importance.
1.3.2.6. The 11kV Connection
At the higher voltages, generation is injected at a major system “node” – often
132 or 33kV – and is therefore able to support the whole group demand without loadflow restriction. The connection of single or multiple set plants at 11kV was anarrangement that was not a realistic prospect when ER P2/5 was conceived.
5 . For example, a short connection of each set of say 5 km of 33kV overhead line would, at worse, introduce an extra average forced
unavailability 0.04% and compared with the 14% assumed for the generation set. Comparable underground circuit figures would be anadditional unavailability of 0.4%.

7/28/2019 DG Contribution to network security_R2.pdf
http://slidepdf.com/reader/full/dg-contribution-to-network-securityr2pdf 16/79
ETSU/FES Project K/EL/00287 Extension – Final Report
________________________________________
Page 16 of 79
The unreliability of many 11kV connections is higher than that of 33kVconnections, and thus, in probability terms, the generation will be less available to the
system because of the connection unreliability.
1.3.2.7. Maintenance Regimes
ER P2/5 considered the traditional maintenance season as the summertime -
seven months in which lines would be maintained for about two weeks each, andgeneration for 1-2 months. The frequency and duration of forced outages was
modelled to reflect the effect of summer and winter weather (lightning incidence and bad storm incidences being different in these seasons).
1.3.2.8. Materiality
Table 2 of ER P2/5 only applies within specified bounds on circuit andgenerator size 6, broadly saying that the generation needs to be small in comparisonwith circuit size to allow the Table 2 rules to apply, and that situations where there are
only one or two large generators in the group present particular security assessment problems. ER P2/5 does not preclude such arrangements, but advises reliability
studies of these situations. The standard also recognises that several types of plant canmake a coincident and additive contribution7, although sometimes constrained by theshift pattern and load shape.
These limits to the application of Table 2 reflected considerations of theacceptability of long duration capacity outages at winter periods and the rapid
increases in expected kWh lost that could arise with greater dependence on generationfor relatively large demand groups. This, in part, is why there should be a lower dependence on their contribution of larger sets. Thus the limits of Section 3.6 of P2/5
are material to containing security risk.Reliability studies showed that the ratio of the effective output to the
maximum output of the generation was not constant but varied mainly as a function of the ratio of the generator unit size to the transmission circuit rating, and confirmedthat a few large generators make a less effective contribution to local security than the
same capacity made up of a larger number of smaller sets. The general trend of thisanalysis showed that the scaling factor of 2/3 in Table 2 (of P2/5) would give
reasonable results for most of the arrangements likely to be assessed under ER P2/5.
1.3.2.9.Modern Distributed Generation
Modern embedded plant may exhibit some characteristics that are better andsome that are worse than the assumptions made during the development of ER P2/5.
6 Extract from P2/5, Section 3.6. The contribution of generation specified in Table 2 is based on the assumptions that a) the cyclic rating of the largest transmission or distribution circuit is greater than two thirds of the total cent our capacity of the two largest units AND b) the
cyclic rating of the two largest transmission or distribution circuits is greater than the two thirds of the total sent our capacity of the threelargest generating units AND c) the load pattern in the group is similar to the national load pattern. 7 See Table A.1 of ACE 51, page 17

7/28/2019 DG Contribution to network security_R2.pdf
http://slidepdf.com/reader/full/dg-contribution-to-network-securityr2pdf 17/79
ETSU/FES Project K/EL/00287 Extension – Final Report
________________________________________
Page 17 of 79
a) Predictable Generation
It may be reasonable to consider that plant such as landfill gas generation,
process- linked CHP and waste to energy plants can be grouped into a category of plant that will exhibit -
• better reliability and a persistence of output driven by economic necessity than
the plant studied for ER P2/5. The likelihood that this modern plant will beconnected by single circuit at lower voltages needs further consideration;
• possibly better availability of a given output level
• a predictable operating regime, irrespective of any formal contract with DNOs.
Therefore the characteristics of these modern plants may not be radically
different from those studied under ER P2/5. It is possible that the modelling andoperating assumptions applied then will still apply.
b) Unpredictable Generation
In contrast, some forms of plant - wind, wave, and photovoltaic – may exhibitgreater variability of availability, persistence and reliability than the plant that was
modelled during the development of ER P2/5. Wind power, as an example, may notexhibit the essential persistence of significant generation at times of system risk. Inaddition some of this plant may in the future exist in large numbers but small unit
sizes.For this type of unpredictable generation a revised application process for ER
P2/5 that simply changes the underlying availability figures etc., but implicitly retainsthe established modelling logic, would not result in the same level of security. The
generation characteristics of some forms of plant within this group will need to beinvestigated, and clearly there are issues to be resolved.

7/28/2019 DG Contribution to network security_R2.pdf
http://slidepdf.com/reader/full/dg-contribution-to-network-securityr2pdf 18/79
ETSU/FES Project K/EL/00287 Extension – Final Report
________________________________________
Page 18 of 79
2. Principles and Details of the Methodology
2.1. Basic Concept of P2/5 Security Standard
2.1.1. Principle of Group Demand
The purpose of Security Standard P2/5 is to provide acceptable levels of
security in a transmission or distribution system following specified circuit outages. Itdoes this by considering specific supply points or load groups and aggregating all theloads supplied by that group, both at the same voltage level and lower voltage levels.
This principle is illustrated in Figure 1. The aggregated load is known as the groupdemand of that supply point or load group.
Figure 1 – Principle of group demand
P2/5 does not consider nor represent the network structures associated with a particular load group. Firstly, it does not consider the network fed by the load group,
only the aggregated demand within it. Secondly, it does not consider the incomingnetwork, only whether there is one or more incoming feeders and whether, if a secondone exists, it is a normally closed circuit or a normally open circuit with means of
manual or automatic switching. Thirdly, if a source of generation exists, which couldsupply some (or all) of the interrupted demand, this is assumed to be closely coupled
to the load group and any connecting network is neglected. These arrangements areshown typically in Figure 2, in which GD represents the group demand 8.
It follows from this description that P2/5 compares supply capabilities with the
demand imposed on various load groups in the system. It is essential that the shortterm modification to P2/5 must retain this assumption. In so doing, this will not
impose any change to the principles and philosophy of P2/5.One possible concern relates to any distributed generation in the system. In the
1970s when P2/5 was developed, local generation was usually closely coupled to the
main load centre of the system, and therefore neglecting the network was an
8This aspect of Group demand is defined specifically in P2/5
aggregated demand of
all load points suppliedin the load group, bothat the same voltagelevel and all lower
voltage levels
supply point
or
load group
incoming feeders

7/28/2019 DG Contribution to network security_R2.pdf
http://slidepdf.com/reader/full/dg-contribution-to-network-securityr2pdf 19/79
ETSU/FES Project K/EL/00287 Extension – Final Report
________________________________________
Page 19 of 79
acceptable assumption. In the 2000s however, much of the embedded generation isdistributed around the network and may be quite some distance from the centres of the
load groups. If necessary, this network can be included in an approximate, butsufficiently acceptable, manner.
(a) (b) (c) (d)
Figure 2 – Illustrative network structures
2.1.2. Recommended Levels of Security
The normal levels of security are set out in Table 1 of P2/5, which indicates
the maximum time periods within which specified demand levels should be restored.These requirements are divided into six Classes of Supply, each of which is associatedwith a different range of group demands. These Classes of Supply vary from Class A
covering group demands less than 1 MW up to Class F covering group demandsgreater than 1500 MW. It is understood that, in the short term update of P2/5, these
Classes, the associated group demands and the times in which demands should berecovered will not be reviewed and therefore Table 1 and all associated data is to beretained. Consequently, this Table and the values in it are not considered in this
report. The previous Report9 submitted as part of the FES project considers this aspectin much more detail since its scope and objectives were much more wide-ranging.
This previous Report is referred to in this report as the “Main Final Report”.
2.1.3. Contribution of Generation to Network Capacity
It is an accepted fact that a single generating unit is less reliable than a single
transmission or distribution line or transformer. Therefore it is unrealistic to assumethat a generating unit with a given capacity is equivalent to that of a circuit with thesame capacity. Consequently P2/5 refers to the “effective contribution of generation”
or simply “effective generation”. These effective contributions are specified in Table2 of P2/5.
P2/5 itself does not describe how these effective contributions were evaluatedin the 1970s. However more information is given in the accompanying applicationreport, ACE Report 5110, although even this is limited in its explanation.
The most significant part of ACE Report 51 appears to be Appendix A3headed “Comparison of Generation and Transmission/Distribution Firm Capacity”,
and it is worthy to quote the relevant paragraphs. These are:-
9“Network Security Standards with Increasing Levels of Embedded Generation”. ETSU Project K/EL/00287.
Final Report by R.N.Allan and G.Strbac, UMIST, 10 August 2002.10ACE Report No.51, “Report on the Application of Engineering Recommendation P2/5, Security of Supply”.
The Electricity Council, May 1979. (now the Electricity Association)
G
GD GD GD GD

7/28/2019 DG Contribution to network security_R2.pdf
http://slidepdf.com/reader/full/dg-contribution-to-network-securityr2pdf 20/79
ETSU/FES Project K/EL/00287 Extension – Final Report
________________________________________
Page 20 of 79
‘The “effective generation” contribution was estimated by determining thetransmission circuit capacities which, when substituted for the generating plant in
various generation/transmission systems, would result in the same reliability of supply from each of these systems. This substituted capacity was considered as the
“effective generation” contribution; the ratio of effective output to maximum output
was determined in each case. For the various combinations of generators and transmission circuits examined, the ratio of effective output to maximum output of
generators was not constant, but varied mainly as a function of the ratio of generator unit size to the transmission circuit capacity. Thus, where the set size was about one
quarter of the circuit size the ratio ranged between 0.8 and 0.9; with set sizes of onehalf the circuit size the ratio ranged between 0.7 and 0.8, and with set sizes equal tothe circuit size the ratio ranged between 0.4 and 0.5. It should be noted that
throughout these studies a winter-time average availability of generation of 86% wasassumed.
Based on an examination of networks with local generation, it was decided that for the purpose of developing Table 2 of P2/5 a factor of two-thirds for the ratio
of effective output to maximum output could be adopted.’
It follows from this description that generation was compared with a circuit in
such a way that both could provide the same level of reliability. It can be assumed thatthe reliability criterion used was expected energy not supplied (EENS), as illustratedin Figure 3.
It should be noted that EENS is not the only reliability index that could beused. Alternatives include other severity indices such as expected load lost (ELL), and
likelihood indices such as frequency, CIs or CMLs. Further discussion of this aspectis provided in the Main Final Report. However, to be consistent with the existingP2/5, it was agreed by all concerned with this project, the authors and the Workstream
3 members, that EENS would be retained as the criterion.
Figure 3 – Comparison of generation with circuit capacity
It also follows from the above description that the outcome of the ACE 51assessment was that the apparent average value of two-thirds, i.e. 67%, could be
assumed to represent the contribution made by virtually all embedded generators, andis the value that is included in Table 2 of P2/5. However it is evident that this value is,
at best, only the average of many situations and conditions. Although convenient inthe 1970s and prior to privatisation, it is not realistic to assume all forms of generationunder all conditions comply with the 67% value. In order to be transparent and to be
equitable to all players, it is essential that the value used should be relevant to the
condition being considered. Consequently the value should reflect the type of unit,number of units, availability of units, technology, and location, if it can be shown that
G
GD GDsame EENS

7/28/2019 DG Contribution to network security_R2.pdf
http://slidepdf.com/reader/full/dg-contribution-to-network-securityr2pdf 21/79
ETSU/FES Project K/EL/00287 Extension – Final Report
________________________________________
Page 21 of 79
the ratio is affected by such parameters. This has been confirmed by the extensivedetailed discussion and assessment of effective generation provided in the Main Final
Report 11.It is important to observe that inherent risk to loss of supply, measured by
EENS, will not increase by considering distributed generation.
2.1.4. Capability of a Network to Meet Demand
P2/5 states that the capacity of a network to meet a group demand should be
assessed as:§ the appropriate cyclic rating of the remaining transmission or distribution
circuits which normally supply the group demand, following outage of the
most critical circuit(s)§ PLUS the transfer capacity which can be made available from alternative
sources§ PLUS for demand groups containing generation, the effective contribution
of the generation to network capacity as specified in Table 2 (of P2/5).
It is evident from this assessment procedure that P2/5 is used with the
following steps, or steps similar to these:§ determine the group demand of the supply point being considered
§ evaluate the effective contribution of the generation, if any, from Table 2
of P2/5
§ summate this effective generation with any transfer capacity and with that
of the remaining circuits
§ compare this with the requirements specified in Table 1 of P2/5 for thegroup demand under consideration to ascertain whether P2/5 is satisfied or
not
§ if not satisfied, consider alternative reinforcements, which could include
circuit reinforcement or adding more generation. The former could bedone by the transmission network operator (TNO) or distribution network operator (DNO) responsible for the network, but the latter would most
likely be done by an independent generator under the present regulatoryregime, and therefore could be outside of the direct control of the
responsible TNO or DNO.
2.2. Types and Parameters of Generation to be Considered
2.2.1. Historical (Pre-privatisation) Generation
Prior to privatisation, all generation was centrally owned and controlled.Furthermore there was a common owner of both the network and the generation.
Consequently it was relatively easy to decide scheduling and dispatch since therewere no conflicting considerations benefiting one owner or operator at the expense of
11“Network Security Standards with Increasing Levels of Embedded Generation”. ETSU Project K/EL/00287.
Final Report by R.N.Allan and G.Strbac, UMIST, 10 August 2002.

7/28/2019 DG Contribution to network security_R2.pdf
http://slidepdf.com/reader/full/dg-contribution-to-network-securityr2pdf 22/79
ETSU/FES Project K/EL/00287 Extension – Final Report
________________________________________
Page 22 of 79
another. Therefore the rules of operation could be relatively simple, and constrainedonly by what was considered to be the most effective and efficient mode of operation
In addition, the types of local generation available in the 1970s were limitedgenerally to conventional steam plant, mainly coal fired but with some oil fired,
together with a limited amount of gas turbines. The steam plant was mainly local
plant that existed prior to nationalisation and the gas turbines were mainly installedfor security or system support purposes. In both cases, the primary source of energy
was essentially unlimited, the units could be run at any time subject to them beingmanned at the time of requirement, and the units were not used for any purposes other
than for outputting into the public supply system.P2/5 was created under these conditions: common ownership, limited types of
generation, and unrestricted operation.
2.2.2. Present (Post-privatisation) Generation
The rules of ownership and operation have changed enormously since 1990
when privatisation came into force. These changes include:-§ local or embedded coal- fired steam plant has ceased to exist§ the use of gas turbines have increased significantly. There has been a major
move from coal and oil fired plant to more efficient gas plant§ generation is mainly owned by private companies which operate them
according to commercial principles
§ the amount of CHP plant has increased. The primary purpose of these is tosupply heat and power to their host, and therefore energy provided to the
public supply system takes secondary consideration
§ greater use is now being made of renewable energy sources, particularlywind. These are intermittent energy sources and cannot be controlled or
scheduled in the normal sense of the word.
It follows from this discussion that, although the network configuration itself is essentially the same as that existing in the 1970s, the type, structure, operation andcontrol of the generation associated with it is very different. Therefore, the system for
which P2/5 was created does not now exist and a review of relevant aspects of P2/5 isevidently needed. This report centres on a review of generation because, since
generation is permitted by P2/5 to be considered as a contribution to security, the basis for this consideration should be transparent and equitable to all players.
2.2.3. Characteristics of Generating Plant
P2/5 assumes that embedded generating plant will be available when requiredsubject only to plant unavailability and shifting regimes. The latter can be neglected
with modern plant and the former is generally construed to mean the relevant plantmay not be available due to plant failures and forced outages. It would be convenient
if this were the current situation, but there are now other considerations that need to be taken into account. To derive energy output from a generator, the followingconditions are required:
• the generator must be in working state, i.e. it must not have failed. This
aspect reflects the technical up and down states of the generating plant andcan be captured using capacity outage probability tables as discussed later

7/28/2019 DG Contribution to network security_R2.pdf
http://slidepdf.com/reader/full/dg-contribution-to-network-securityr2pdf 23/79
ETSU/FES Project K/EL/00287 Extension – Final Report
________________________________________
Page 23 of 79
• there must be a source of primary energy, e.g. gas for GTs, wind for wind
generators, etc. If the primary source of energy to a generator is un-restricted then consideration of this source can be neglected. However if there are restrictions or the source is intermittent, then this may need to be
considered. The most important area of concern is with wind plant and the
intermittency of the wind regime. This would not matter if the wind andload were perfectly correlated because the variation in wind power wouldmirror the variation in load. However this is unlikely to be the case.
• it must be commercially advantageous to the generator owner/operatorto run the plant. Present-day generating plant is privately owned andtherefore its use for network support may be restricted for commercial
reasons. Unless the “stick” approach is used where a generator isinstructed to operate in emergencies, the “carrot” approach must be used,i.e. the generator must be given financial incentives to be available and to
deliver when needed.If all these conditions are satisfied, then the generator can output power.
However if only one condition is not satisfied, the plant will not output power. In the1970s, all plant was under national control and generally primary energy was alwaysavailable because the vast majority of plant was steam driven and relied only on coal.
Consequently, only the first condition, plant reliability, was of real concern. This is nolonger true. All plant is owned and operated by private companies, and much
generating plant rely on intermittent energy sources such as wind and solar. For thesereasons all the above conditions must be recognised. These are best definedrespectively as:-
• technical availability: relates to whether the plant is in a working state
• energy availability: relates to whether primary energy is available
• commercial availability: relates to whether it is commercially available
The DTI and Ofgem have also recognised12 these parameters and have definedthem respectively as reliability, persistence and availability (see Section 1.3.1). This
may be confusing particularly using the terms reliability and availability to refer toentirely different concepts. When used concurrently, it is widely understood thatreliability means the likelihood of a component or system remaining in the
operational state, and that availability means the likelihood of a component or systembeing found in the operational state. To use them otherwise could mislead, although
the important point is to recognise their existence and be less concerned about theterms used to describe them.
These different characteristics need to be considered in developing appropriatetechniques for assessing security contributions if such characteristics are likely toaffect the value of this contribution. The approaches and methodology described in
the following sections reflect these needs.
2.2.4. Parameters of Plant and Systems
The previous section discussed the need to consider the different availability
characteristics of the plant. In addition, it has been shown in the Main Final Report that the parameters associated with both the plant and the system in which they are
12DTI/Ofgem Distributed Generation Coordination Group and WS03 of its Technical Steering Group

7/28/2019 DG Contribution to network security_R2.pdf
http://slidepdf.com/reader/full/dg-contribution-to-network-securityr2pdf 24/79
ETSU/FES Project K/EL/00287 Extension – Final Report
________________________________________
Page 24 of 79
embedded can also affect the security contributions made by the generation. Theseinclude:-
§ number of units§ capacity of units
§ availability of units§
technology of units§ location of units
§ peak load magnitude§ load profile.
These different parameters also need to be considered in developingappropriate techniques for assessing security contributions as such parameters arelikely to affect the value of this contribution. The approaches and methodology
described in the following sections reflect these needs.
2.2.5. Approaches to be Developed
The approaches and methodology described in the following sections reflectthe needs identified in the previous sections. Two main approaches are described. The
first concerns generating plant with non-intermittent energy sources, and the secondconcerns generating plant with intermittent energy sources. The first category will beaffected mainly by technical availability but also possibly by commercial availability.
The second category will be affected by all three types of availability. Differentmodelling techniques are therefore required.
2.3. Generating Plant with Non-Intermittent Energy Sources
2.3.1. Generation Model
The basic model for assessing the reliability of generation systems, the units of which are not constrained by intermittent energy sources and behave independently of
each other, is best represented by a capacity outage probability table. The detailedtheory relating to these is given in various reliability texts13, but can be summarised as
follows.If all units in a given case are identical and behave independently, the capacity
outage probability table can be evaluated using the binomial distribution in which the
probability P{r} of a specific state {r} is given by:-
where n = number of units, r = number of available units, (n-r) = number of unavailable units, p = availability and q = unavailability of each unit.
If all units are not identical but still behave independently, the capacity outage probability table can be evaluated using the principle of state enumeration, i.e. if P i
13R.Billinton and R.N.Allan. “Reliability of Engineering Systems: Concepts and Techniques”. Second edition,
1992, and “Reliability of Power Systems”. Second edition, 1996. Both Plenum Publishing, New York.
)1()!(!
!}{ r nr q p
r nr
nr P −
−=

7/28/2019 DG Contribution to network security_R2.pdf
http://slidepdf.com/reader/full/dg-contribution-to-network-securityr2pdf 25/79
ETSU/FES Project K/EL/00287 Extension – Final Report
________________________________________
Page 25 of 79
and P j are the probabilities of state {i} and state {j} respectively, then the probabilityof the combined state {ij} is given by:-
jiij P P P .= (2)
Consider the case of three identical units each having a capacity C and
availability p. Using Equation 1, the resulting capacity outage probability table isshown in Table 1.
Table 1 – Capacity outage probability table for three identical units
capacity available capacity unavailable state probability
3C2CC
0
0C2C
3C
p
3
3p2(1-p)3p(1-p)2
(1-p)3
total 1.0
In the case of three non-identical units having capacities C1, C2 and C3 with
availabilities of p1, p2 and p3 respectively, the resulting capacity outage probabilitytable is shown in Table 2.
Table 2 – Capacity outage probability table for three non-identical units
capacity available capacity unavailable state probability
C1 + C2 + C3
C1 + C2 C2 + C3
C3 + C1
C1
C2
C3
0
0
C3
C1
C2
C2 + C3
C3 + C1
C1 + C2
C1 + C2 + C3
p1.p2.p3
p1.p2.(1-p3)(1- p1).p2.p3
p1.(1- p2).p3 p1.(1- p2).(1- p3)
(1- p1). p2.(1- p3)
(1- p1).(1- p2). p3 (1- p1).(1- p2).(1- p3)
total 1.0
2.3.2. Load Model
There are a number of alternative load models that can be used. In the case of this security assessment approach, the most appropriate is the load duration curve
(LDC). This represents the variation in load over a specified period of time in terms of the number of time units the demand exceeds a particular load level. A simplified

7/28/2019 DG Contribution to network security_R2.pdf
http://slidepdf.com/reader/full/dg-contribution-to-network-securityr2pdf 26/79
ETSU/FES Project K/EL/00287 Extension – Final Report
________________________________________
Page 26 of 79
LDC is shown schematically in Figure 4. The abscissa can also be construed torepresent the probability by which the demand exceeds a particular load level.
Figure 4 – Simplified schematic shape of a load duration curve
Referring to Figure 4, the following can be determined:§ the demand exceeds load level L for t time units. If these are ½ hourly
values, then load level L is exceeded for a period t/2 hrs
§ the probability of the demand exceeding a load level L is t/T.
The specified period of time T, i.e. total abscissa axis, can be any time periodof concern, e.g. one whole year, one season, one month, etc. The time units along theabscissa axis are usually ½ hourly or hourly values. These should not be greater than
one hour because then the shape of the LDC becomes distorted and the area under thecurve no longer can be assumed to represent the total energy demanded by the system
during the time period being considered. This is essential in these studies because theexpected energy not supplied (EENS) is used as the criterion of comparison. In manyother types of system problems, this may not be critical and the daily variation of peak
loads only may be sufficient.The LDC used in the development of P2/5 approximated to the the-then
national average. If a small number of effective contributions similar to the concept of P2/5 are to be specified, then a similar principle would probably need to be retained.However, if an algorithmic approach is used in which each case is assessed
individually, then the appropriate LDC for that situation could be used. In either case,the following approach remains valid.
2.3.3. Evaluation of EENS of Generation
The principle of evaluating EENS was described in Section 7 of the Main
Final Report and illustrated by a few simple examples. However it was not extendedto the consideration of typically structured LDCs, nor were the numerical studies veryextensive.
t T
L
load
time
7/28/2019 DG Contribution to network security_R2.pdf
http://slidepdf.com/reader/full/dg-contribution-to-network-securityr2pdf 27/79
ETSU/FES Project K/EL/00287 Extension – Final Report
________________________________________
Page 27 of 79
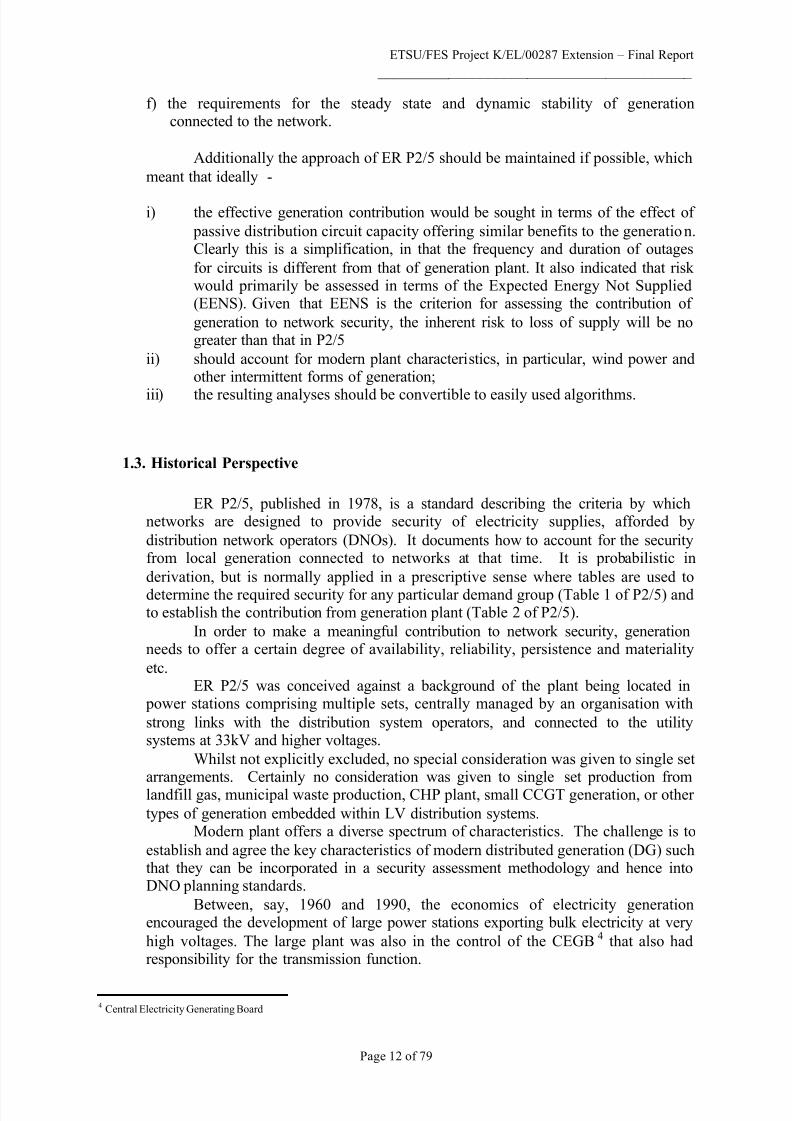
Figure 5 – Evaluating ENS for a generating system
The EENS is evaluated as follows:-
§ each state of the capacity outage probability table is superimposed on the
LDC individually as shown for one state I in Figure 5
§ the energy not supplied Ei whilst in this capacity state is determined as thearea below the LDC and above the capacity available
§ this value of energy is weighted by the probability of being in this capacitystate
§ these weighted values of energy are summated over all capacity states
§ from the concept of expectation, ∑= ii p E EENS . .
2.3.4. Evaluation of EENS due to Effective Circuit Capacity
This is evaluated in a similar manner to that of generation. The process in this
case however is much simpler if it is assumed that the effective circuit does not fail.
Therefore the circuit capacity is constant and exists continuously.In this case, the available circuit capacity is imposed on the LDC and the area
above this capacity and below the LDC is evaluated as shown in Figure 6. This givesthe EENS directly. Conversely, if the EENS is specified, the circuit capacity that
would create this EENS can be found iteratively by moving the capacity up and downthe LDC until the value giving this EENS is determined.
installed generating capacity
energy not supplied, i
capacity on
outage
capacity
available
capacity outage state i
load

7/28/2019 DG Contribution to network security_R2.pdf
http://slidepdf.com/reader/full/dg-contribution-to-network-securityr2pdf 28/79
ETSU/FES Project K/EL/00287 Extension – Final Report
________________________________________
Page 28 of 79
Figure 6 – Evaluating ENS due to circuit capacity
2.3.5. Availability of Effective Circuit – What Should It Be?
The availability of the circuit with which the generation is compared is
assumed to be 100%. This concept may be questioned since in real life the circuits of the network can themselves fail. Consequently it may be felt that the availability of
the circuit against which the generation is being compared should be less that 100%.If this were the case, then the result infer that the apparent contribution of thegeneration would increase as the availability of the circuit is decreased. This can be
easily deduced by considering the effective contribution of a single generating unit. If the availability of this is 86% as in P2/5, and the availability of the circuit is also 86%,
then the effective capacity of the line would be equal to the net declared capability of the unit, i.e. the effective contribution of the unit would also be unity. This makes nosense.
Figure 7 – Comparing circuits and generation with a hypothetical supply source
The point of confusion is to assume that the effective circuit is a real circuit. In
fact it is a hypothetical circuit. It would be less confusing if this circuit is simply
treated, not as a circuit, but as a hypothetical supply component against which all realnetwork sources are compared (see Figure 7). Therefore, if the generating unit is
energy not supplied (= EENS)
circuit
capacity
load
GD
G
GD
same EENSsame EENS
GD
hypothetical supply
sourcereal circuit

7/28/2019 DG Contribution to network security_R2.pdf
http://slidepdf.com/reader/full/dg-contribution-to-network-securityr2pdf 29/79
ETSU/FES Project K/EL/00287 Extension – Final Report
________________________________________
Page 29 of 79
measured against this hypothetical supply component, the effective contribution is,say, 67%. A real circuit should also be compared against this hypothetical supply
component. Therefore the above circuit having an availability of 86% would alsohave an effective contribution of 86%. Thus the ratio between the two real supply
sources is unity, but against the hypothetical source, each is only 86%.
If real circuits and generation are to be put on a level playing field and thecontributions of each are to be compared objectively, then the effect of the availability
of the real circuit must be taken into account. The assessment described in Sections2.3.3 and 2.3.4 can easily be extended to consider a circuit having an availability of
Ac. In this case, the EENS of the circuit is evaluated similarly to that of generation inSection 2.3.3 using the concept of conditional probability14:-
EENS = ENScircuit is available.Ac + ENScircuit is unavailable.(1 – Ac)
In this case, the ENS given the circuit is available is the area shown in Figure6, and the ENS given the circuit is unavailable is the energy demanded, i.e. the total
area under the LDC. An effective or equivalent circuit is then deduced using theiterative approach described in Section 2.3.4.
2.3.6. Evaluating Effective Generation Contribution
The principle of P2/5 is to determine the effective generation contribution bycomparing the generation with a fully reliable circuit which would result in the same
level of reliability, actually estimated by comparing the same unreliabilities. In the present approach this is done by equating EENS. The approach uses the procedures
described in Sections 2.3.3 and 2.3.4 for assessing EENS and has the following steps:§ consider a specific generation system and LDC§ evaluate the EENS of this system using the approach described in Section
2.3.3§ determine the circuit capacity which would give the same EENS using the
approach described in Section 2.3.4§ this circuit capacity is the value of effective generation
§ calculate the ratio between the effective generation and the total generation
capacity
§ this gives the parameter that enables the “effective contribution of
generation to network capacity” to be determined as defined in Table 2 of
P2/5
2.3.7. Evaluating Security
Evaluating security is identical to that currently specified in P2/5. The onlychange is that the generation contribution may not be 67% of declared net capability
as in the present Table 2, but the value in the new Table 2 or assessed from a spread-sheet calculation. Consequently, the modified steps from those given in Section 2.1.4
are:
14R.Billinton and R.N.Allan. “Reliability of Engineering Systems: Concepts and Techniques”. Second edition,
1992, and “Reliability of Power Systems”. Second edition, 1996. Both Plenum Publishing, New York

7/28/2019 DG Contribution to network security_R2.pdf
http://slidepdf.com/reader/full/dg-contribution-to-network-securityr2pdf 30/79
ETSU/FES Project K/EL/00287 Extension – Final Report
________________________________________
Page 30 of 79
§ determine the group demand of the supply point being considered§ evaluate the effective contribution of the generation, if any, from the new
Table 2 of P2/5, or from a spread-sheet calculation§ summate this effective generation with any transfer capacity and with that
of the remaining circuits§
compare this with the requirements specified in the existing Table 1 of P2/5 for the group demand under consideration to ascertain whether P2/5
is satisfied or not§ if not satisfied, consider alternative reinforcements, which could include
circuit reinforcement or adding more generation. The former could bedone by the TNO or DNO responsible for the network, but the latter mayhave to be done by an independent generator under the present regulatory
regime, and therefore may be outside of the direct control of theresponsible TNO or DNO.
2.3.8. Consideration of Materiality
The approach described in the preceding sections can be used to evaluate thecontribution made by a specific generation system. It should be noted that it isapplicable in concept and application to any system with any number of units,
including one or two units. However, there is a school of thought that believessecurity should not rely on a small (less than 3) number of units particularly if these
make up a significant proportion of the system capacity. This concept has beendefined as materiality and discussed in some detail in Sections 1.3.1 and 1.3.2.8. P2/5included special conditions for these cases, including the recommendation that
detailed risk and economic studies should be made if there are only one or two largegenerators. Such risk studies themselves could, and in fact should, be based on the
approach described in this report.Therefore there seems to be no theoretical restrictions to the application of the
approach provided the generating units are not energy limited, behave independently
and are not constrained commercially, i.e. they are constrained only by technicalavailability. There may however be some implementation restrictions imposed to
satisfy materiality, but these would be introduced for subjective rather than objectivereasons.
2.3.9. Concluding Comments
If there are constraints other than technical availability, then the resulting
evaluations may be in error, the magnitude of which is dependent on the significanceof the other constraints. If these errors are too significant, then the relevant units
would need to be treated similarly to intermittent generation units. Neglecting these other constraints, it is evident from the above methodology
that the effective generation contribution is dependent on the number of units, the
technical availability of these units, and the magnitude and shape of the LDC. The
impact of these parameters and typical numerical values are evaluated in Section 3.

7/28/2019 DG Contribution to network security_R2.pdf
http://slidepdf.com/reader/full/dg-contribution-to-network-securityr2pdf 31/79
ETSU/FES Project K/EL/00287 Extension – Final Report
________________________________________
Page 31 of 79
It is possible to structure the security assessment in one of three ways. Allrequire extensive studies of real empirical data. These are:-
§ Look-Up Tables. Do extensive generalised studies in order to ascertain therange of effective generation contributions and create one or a set of look-up
tables similar in concept to the existing Table 2 of P2/5§
Look-Up Graphs. Do extensive sensitivity studies over an agreed range of input data and plot the outcomes as graphical representations. This is
essentially then used as an extended look-up process§ Algorithms. Create a spread-sheet environment into which specific data can
be inserted at the time of assessment so that the pertinent value of effectivegeneration contribution can be determined.
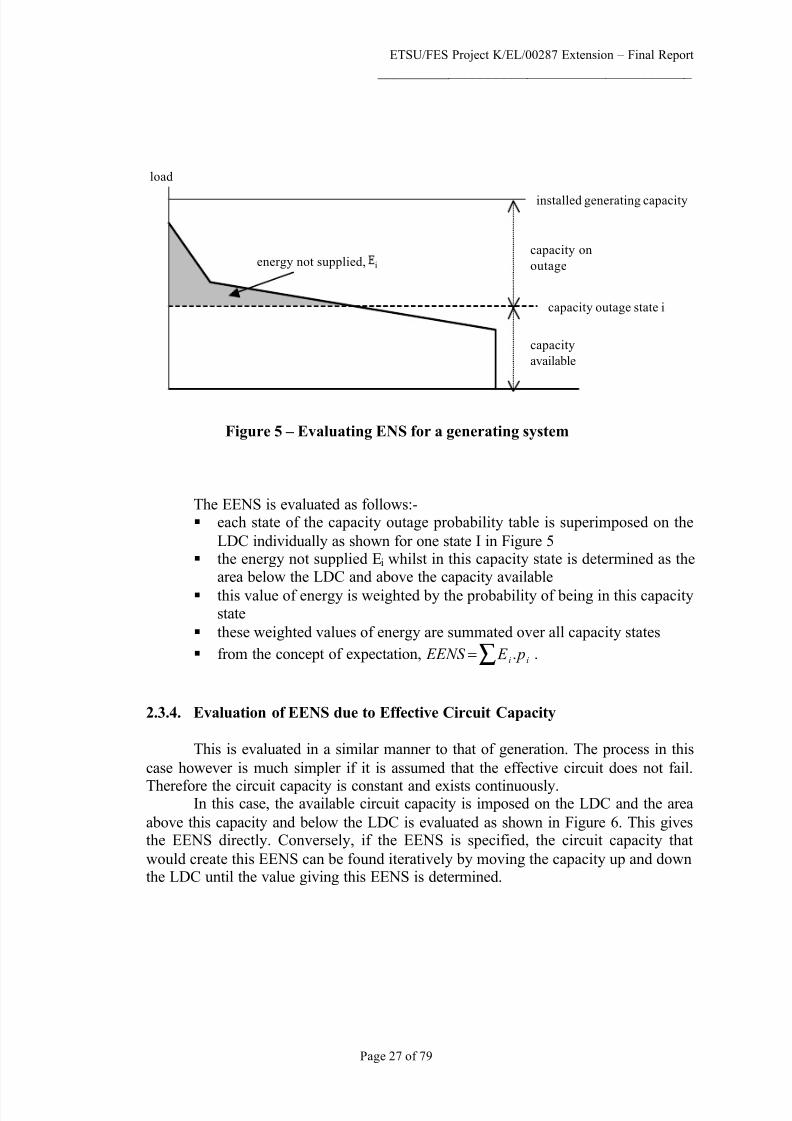
2.4. Generating Plant with Intermittent Energy Sources
2.4.1. Impact of Intermittency
The approach for modelling generation described in Section 2.3 is based on
capacity outage probability tables. This approach uses unit technical availability as theonly unit reliability parameter. This availability however is a measure of the total timethe unit is found in the up state during an annual (or other specified) period. A given
availability may be due to a small number of up states of long duration or a largenumber of up states of short duration. If the up-state durations are very short, then the
state of the unit may change during the time it is required to operate, i.e. possiblyduring the time it is satisfying security demands. If this occurs then the unit may failto provide the level of security expected of it.
Most generating units, although exhibiting up-state durations that are generallyshorter than lines and transformers with which they are compared in security studies,
still have up-state durations longer than that required to contribute to system security.In these cases, technical availability and capacity outage probability tables aresufficient. However, this is not necessarily the case with units such as wind power
units having primary energy sources that can vary very significantly over very short periods. These rapid output variations require extended modelling principles, and
relate to the need to consider energy availability as well as technical availability.Furthermore some units in the system may not be available at certain periods
or on a continuous basis due to commercial reasons and this may also create a form of
intermittency. This may occur with CHP plant that are switched on and off or their outputs increased and decreased due to the demands of the host. In such cases the
unit(s) may become unavailable when required or during the period when they are being used to provide security.
2.4.2. Modelling Intermittency
The only practical approach to deal with these chronological variations,
whether random or certain, is to characterise the variable as a time-varying parameter
with its chronological behaviour fully represented. A schematic illustration of ageneration pattern is shown in Figure 8 in which the load is assumed constant. This

7/28/2019 DG Contribution to network security_R2.pdf
http://slidepdf.com/reader/full/dg-contribution-to-network-securityr2pdf 32/79

7/28/2019 DG Contribution to network security_R2.pdf
http://slidepdf.com/reader/full/dg-contribution-to-network-securityr2pdf 33/79
ETSU/FES Project K/EL/00287 Extension – Final Report
________________________________________
Page 33 of 79
approach is stochastic simulation, generally known as Monte Carlo simulation(MCS), and probably, because of the chronological time dependencies, needing
sequential MCS.c) load and generation are both random. This is an extension of case (b). In
reality it further complicates the issue since by definition the number of possible
scenarios is very much greater. It is possible that the average characteristic of eachmay be sufficient: otherwise all possibilities may need to be studied using MCS.
It is clear that this problem has a solution but one that could require some very
extensive studies, which are outside the scope and objective of this project. In thiscase, average characteristics or a restricted number of scenarios are assumed to be anacceptable approximation, bearing in mind the significant uncertainties in data and
modelling, and therefore a sufficiently accurate solution to the real problem. It should be noted however that no statement of the degree of approximation can be reliably
made unless a rigorous assessment is first made, and this can only be done usingsequential MCS.
2.4.3. Modelling Approaches
In order to decide the appropriate approach for modelling intermittentgeneration and to estimate the security contribution, it is necessary to note the concept
underpinning P2/5. This concept is to compare the generation with a circuit providingthe same level of reliability. In the case of conventional (non-intermittent) generation,
this is achieved by comparing the generation with a line using EENS as the reliabilityindex. In the case of intermittent generation, at least two possible approaches are
possible. These are illustrated in Figure 9, which is an extension of the concept shown
in Figure 3. The first compares the intermittent generation with a circuit using EENSas the index of comparison and the second compares the intermittent generation with
the contribution that would be made by conventional generation using a reliabilityindex defined as reliance probability. These are briefly described below.
(a) comparing IG with circuit (b) comparing IG with G
Figure 9 – Comparing intermittent generation (IG) with circuit or with non-
intermittent generation (G)
GD GD
IG
same
EENS GD GDsame PR
IGGcircuit

7/28/2019 DG Contribution to network security_R2.pdf
http://slidepdf.com/reader/full/dg-contribution-to-network-securityr2pdf 34/79
ETSU/FES Project K/EL/00287 Extension – Final Report
________________________________________
Page 34 of 79
(a) Comparing IG with circuit. This is essentially the same approach as used for non-intermittent generation. The two types of generation are therefore treated
independently and both determine an equivalent circuit capacity giving the same levelof reliability as the generation source with which it is being compared. The index used
remains the value of EENS. The intermittent generation model must reflect energy
and commercial availability as well as technical availability. The benefit of thisapproach is that it is consistent with that of P2/5.
(b) Comparing IG with non-intermittent generation. One problem with generation
systems that have outputs varying significantly with time is how much reliance can be placed on them when they are required. For instance, if a certain output is requiredfrom the generating units in order to satisfy P2/5 and the output fluctuates
(particularly downwards), then the demand at that supply point will not be satisfied.In reality, it is not necessary for the generation systems to provide that output
continuously, only for as long as it takes to restore the trans mission or distributionsystem to its originally intact form before the circuit outage(s) have occurred.
Therefore the essential question is, how confident can one be that the generation willremain at the minimum required level for the required minimum time. This questioncan be quantified by evaluating the probability that the generation will be at or above
a specified threshold level for a time period equal to or greater than a threshold value.The objective of this second approach is to address this problem by treating the twotypes of generation dependently. By choosing a suitable reference index, the
equivalence of the two forms of generation can be ascertained. This approach is basedon the developed concept of “the proportion of time for which the generation capacity
can be relied on” as described in Section 8 of the Main Final Report. All forms of generation (also circuits as well) do not provide a constant level of capacity that can
be relied on continuously, but change capacity states in a random manner. The ability
to rely on a given capacity state or better can be deduced using probability theory (seeMain Final Report), and defined as reliance probability. The benefit of this approach
is that it enables the two distinct types of generation to be compared on the same basis, i.e. the ability to provide a capacity contribution with the same level of reliance.
After discussion with members of the DTI/Ofgem Workstream 3 and their
review of the above two possible approaches, only the first (Comparing IG withCircuit) is considered in the following sections.
2.4.4. Application to Wind and CHP Plant
In the case of wind plant, it is evident that intermittency is of major concern.
The nature of wind is very much a random process and therefore either Case (b) or Case (c) in Section 2.4.2 ought to be considered. The choice is therefore whether theaverage wind behaviour (Case (b)) is sufficient or the full random behaviour (Case
(c)) is required. Significant case studies are needed to resolve this question. Data isavailable to allow both representations to be considered and modelled. In these
studies, it is assumed that Case (b) is sufficient.It may seem to be less evident how CHP plant should be modelled. Generally
such plant does not have random energy input because most are gas driven. This
therefore does not exhibit the randomness associated with wind. However the problem
is not concerned with the energy input but with the commercial operation. CHP plantis primarily installed to supply heat in the form of steam to its host organisation. This
7/28/2019 DG Contribution to network security_R2.pdf
http://slidepdf.com/reader/full/dg-contribution-to-network-securityr2pdf 35/79
ETSU/FES Project K/EL/00287 Extension – Final Report
________________________________________
Page 35 of 79
heat supply generally has total priority over generation of electrical energy for the public supply system. Clearly a commercial framework is required. However records
are available of exported15 CHP power as a function of time and that for new plantscould be predicted on the basis of the operational characteristics of the host
organisation. In both cases therefore, a chronological characteristic of generation
exported output could be determined. This implies that the generation data seen by the public supply system is similar in concept to that of wind, i.e. the contribution to the
public supply varies in a similar manner to that illustrated schematically in Figure 8.It follows therefore that wind plant and CHP plant can both be modelled and
assessed using the same approach. The only difference is that the output of wind plantmay vary more rapidly and with greater fluctuations than CHP plant. However thisdoes not affect the concept, only the actual generation contribution and this will
reflect the actual input data. It also follows that the approach could, in principle, beapplied to any form of generation since all generators are subject to changing output,
if only because of technical unavailability. However, if the average time betweenchanges of state is much larger than the time for which the units are required to satisfy
P2/5 (or its replacement), then these additional modelling techniques are notnecessary
2.4.5. Assessment Comparing Generation with Equivalent Circuit
2.4.5.1.Assessment Approach
This approach is identical in concept to that described for non-intermittent
generation, and can be described using a schematic similar to that shown in Figure 7.This is shown in Figure 10.
Figure 10 – Determining model for intermittent generation using first approach
15Exported power into the public supply system, i.e. net of any generated output utilised internally by the host
ti
T0
generation
level, Gi
generation pattern
= generation < Gi = generation > Gi but lasting less than
required minimum time Tm
assumed Tm

7/28/2019 DG Contribution to network security_R2.pdf
http://slidepdf.com/reader/full/dg-contribution-to-network-securityr2pdf 36/79
ETSU/FES Project K/EL/00287 Extension – Final Report
________________________________________
Page 36 of 79
The main difference between modelling non-intermittent and intermittentgeneration is those periods of intermittent generation that do not persist for a required
minimum period of time must be discarded from the assessment. It is assumed that
this minimum time is Tm.The steps in the assessment process are then:-
§ identify the time dependent generation pattern§ consider a generation level Gi
§ identify the occasions when “the generation is at least equal to Gi andcontinues to remain at least equal to Gi for the minimum time Tm”. Theseare the “good” or “up” states
§ count the number of times, ni, that this occurs and the duration, ti, of eachof these occasions
§ therefore, if T is the total time period of the generation pattern, the probability that the generation is at least equal to Gi is given by:
∑=i
iii T t n P /. (3)
§ this can be repeated for all generation levels between the lowest andhighest generation levels, from which a generation model identical in
concept to the multi-state capacity outage probability tables described andused in Section 2.3.1 (see Table 2) can be determined. Each capacity stateis given by Gi and the state probability by Pi and all states are mutually
exclusive. These states are imposed on the LDC in the same way as donein Section 2.3.3.
2.4.5.2. Evaluating Generation Contribution to Security
The approach for evaluating the generation contribution to security in the caseof intermittency of generation using this approach is virtually identical to thatdescribed for non-intermittent generation once the generation model described in the
previous section has been deduced. For completeness at this point, the method previously described in Section 2.3.5 can be repeated.
The approach uses the procedures described in Sections 2.3.3 and 2.3.4 for assessing EENS and has the following steps:
§ consider a specific generation system and LDC
§ evaluate the EENS of this system using the approach described in Section2.3.3
§ determine the circuit capacity which would give the same EENS using theapproach described in Section 2.3.4
§ this circuit capacity is the value of effective generation
§ calculate the ratio between the effective generation and the total generationcapacity
§ this gives the “effective contribution of generation to network capacity” asdefined in Table 2 of P2/5

7/28/2019 DG Contribution to network security_R2.pdf
http://slidepdf.com/reader/full/dg-contribution-to-network-securityr2pdf 37/79
ETSU/FES Project K/EL/00287 Extension – Final Report
________________________________________
Page 37 of 79
2.4.6. Concluding Comments
The procedure described in the preceding sections describes the approaches
that could be used to evaluate the contribution made by a generation system, theoutput of which cannot be controlled by the TNO or DNO responsible for the security
of the supply point being considered. The approaches can be used for any intermittentenergy source including wind and CHP. The generation data requirement is the time-varying output and this must be known or estimated. This data reflects all the
availability parameters discussed in Section 2.2.3, including technical, energy andcommercial availabilities, since these are all coalesced into the generation output. For
similar reasons, the units are not required to behave independently since this effect isalso coalesced into the output. Care however is needed before using generic data to
represent a specific system because all or some of these parameters will not berelevant to all systems.
Two possible approaches have been considered. There are merits and demerits
for each. The approach that compares intermittent generation with non-intermittentgeneration has the benefit that it directly compares the two alternative forms of generation and in a way that ensures the ability to rely on them is treated and
compared transparently, i.e. the reliance probability is the same for both. Its demerit isthat is does not really conform with the present approach underpinning P2/5, which
deduces an equivalent circuit capacity. The approach that compares the intermittentgeneration with circuit capacity has the merit that this approach does use the P2/5approach. Therefore at this stage of the development of P2/5, it is reasonable to
suggest that this approach is the one that should be adopted, and this has beendescribed in detail.
It is again possible to structure the security assessment in one of three ways.All require extensive studies of real empirical data. These are:-
§ Look-Up Tables. Do extensive generalised studies in order to ascertain the
range of effective generation contributions and create one or a set of look-uptables. These will not be of the same form as the existing Table 2 of P2/5. In
addition, care must be taken before using generic information for specificcases because of the possible problem associated with dependence asdiscussed above
§
Look-Up Graphs. Do extensive sensitivity studies over an agreed range of input data and plot the outcomes as graphical representations. This is
essentially then used as an extended look-up process§ Algorithms. Create a spread-sheet environment into which specific data can
be inserted at the time of assessment so that the pertinent value of effective
generation contribution can be determined. This would be a more accurateapproach to this security assessment.

7/28/2019 DG Contribution to network security_R2.pdf
http://slidepdf.com/reader/full/dg-contribution-to-network-securityr2pdf 38/79
ETSU/FES Project K/EL/00287 Extension – Final Report
________________________________________
Page 38 of 79
2.5. Effect of Remote Generation and Common Coupling
2.5.1. Modelling Concept
It was assumed in the previous sections that the embedded generation wasclosely coupled to the main load centre or the effect of any network between the
generation and the load centre had little or no impact on its ability to contribute to thesecurity. This was discussed in Section 2.1.1 and conforms with the assumptionsunderpinning P2/5. However as also discussed in Section 2.1.1, this assumption may
be less valid in present-day systems because the generation site may be some distancefrom the main load centre, connected to it via a relatively weak distribution network
or coupled to the system with a single protection point. In this case, the network connecting the site to the load centre could affect the ability of the generation to
contribute to security due to the unavailability of the connection.The only completely correct approach to solve this problem is to perform a
reliability evaluation. However this is beyond the short-term solution. An alternative
approach is to combine the unavailability of the circuit(s) connecting the generationwith the load centre with the generation model (G) to create a compositegeneration/network model (G’). This concept is illustrated in Figure 11.
(a) (b)
Figure 11 – Composite generation/network model
(a) remote generation (b) equivalent model
In a generation system having a single protection point, which could be a
windfarm or any other generation source, a single fault could outage the whole site.This operational problem can be assessed in a similar manner to the approachdescribed in this section, i.e. the group of generators are treated as if they were
coupled to the demand centre via a remote connection using the above principles. Thiswould account for the common coupling without any suggestion that it is a single
generator site. For instance, wind farms are generally not single units but multiplegenerating units producing a multiple set of output states. Therefore they should betreated the same as the multiple output states of any other type of generation site with
multiple generating units.
G’
GDGD
G
network, N

7/28/2019 DG Contribution to network security_R2.pdf
http://slidepdf.com/reader/full/dg-contribution-to-network-securityr2pdf 39/79
ETSU/FES Project K/EL/00287 Extension – Final Report
________________________________________
Page 39 of 79
2.5.2. Generating Plant with Non-Intermittent Sources
The model suggested for generation with non-intermittent energy sources is based on capacity outage probability tables as described in Section 2.3.1. These tables
can be combined with the state probability table representing the network connecting
the generation to the load centre using the principle of state enumeration and Equation2. The procedure is illustrated in Tables 3, 4 and 5.
This illustration assumes a generation system with two identical units and asingle circuit connecting the generation to the load centre. The principle can be
extended simply to any number of generating units (all that is required is the overallcapacity outage probability table) and to any number of circuits (all that is required isthe state probability table). Combined states are enumerated, the available capacity
seen by the load centre whilst in each combined state is deduced (given by theminimum of generation state capacity or circuit state capacity), and the combined
state probability evaluated using Equation 2.
Table 3 – Capacity outage probability table for remote generation
capacity available capacity unavailable probability
2CC0
0C
2C
P1 P2 P3
1.0
Table 4 – State probability table for connecting network
state state capacity probability
updown
C N (≥ 2C)0
P N 1-P N
1.0
Table 5 - Capacity outage probability table for composite generation/network
capacity available capacity unavailable probability
2CC
0
0C
2C
P1.P N P2.P N
P3.P N + (1-P N)
1.0
2.5.3. Generating Plant with Intermittent Sources
The model for generation with intermittent energy sources is virtually thesame as that described in Section 2.5.2 for non-intermittent energy sources provided
the approach being used is to compare the intermittent generation with an equivalentcircuit capacity.

7/28/2019 DG Contribution to network security_R2.pdf
http://slidepdf.com/reader/full/dg-contribution-to-network-securityr2pdf 40/79
ETSU/FES Project K/EL/00287 Extension – Final Report
________________________________________
Page 40 of 79
In this case, the output of the generation system is an equivalent capacityoutage probability table, which may differ from that used with non- intermittent
generation only in the number of states needed to represent the generating states withreasonable accuracy. Therefore this table can be weighted by the availability of the
connecting lines in the same way as described in Section 2.5.2. This produces an
equivalent capacity outage probability table similar in concept to that shown in Table5.
2.6. Contribution by Multiple Generation Sites
The preceding sections consider a single generation site within the load group
being assessed. In reality there may be two or more such sites, each of which couldcontribute to security. The question is whether these should be assessed separately or
whether they should be combined into one generation model.If the effective contributions are evaluated for each generation site separately
using the approaches described in previous sections and then summated, this will givea different result than that given by combining all generation sites into one model andevaluating the effective contribution for this combination. The reason is that the
contribution made to security by generation depends on the number and size of theunits.
The primary objective of P2/5 is to determine whether the security
requirements of P2/5 are satisfied by summating the generation contribution with thatof the remaining circuits and transfer capacity. It is not to allocate the contribution to
specific sources at this planning and design stage – this is a subsequent operationaldecision. Having said this however, it may be useful to evaluate the apparent effectivecontributions separately as a means for ranking the individual sources and use this
information as a guide for allocation, e.g. the source that could make the greatestcontribution may be given priority in the allocation process.
It follows from this discussion that the process to deal with multi-generatingsites is:-
§ consider each generation site separately
§ evaluate the capacity outage probability table for each site using theapproaches for non-intermittent generation and intermittent generation as
appropriate§ weight each table by the availability of the connecting link if the site is
remote and weighting is deemed necessary
§
combine the tables together using recursive application
16
of stateenumeration to give a resulting multi-state capacity outage probability table
§ superimpose this final table on the LDC as before to determine the EENS bythis combined generation system
§ the procedure then continues as before.
It is evident that the procedure is virtually identical to that described in
previous sections and the approach remains the same.
16R.Billinton and R.N.Allan. “Reliability of Engineering Systems: Concepts and Techniques”. Second edition,
1992, and “Reliability of Power Systems”. Second edition, 1996. Both Plenum Publishing, New York

7/28/2019 DG Contribution to network security_R2.pdf
http://slidepdf.com/reader/full/dg-contribution-to-network-securityr2pdf 41/79
ETSU/FES Project K/EL/00287 Extension – Final Report
________________________________________
Page 41 of 79
2.7. Contribution by Generation Not Available for 24hr
2.7.1. Introduction
During the development of P2/5, it was recognised that some generation
stations may not be available for 24hr because of operational reasons. Generally thiswas due to some stations being manned only for one shift, say for 6hr, and others for
two shifts, say for 14hr. An approach was created so that some credit could be givento these stations. This was achieved by identifying how much of the daily load curve
could be covered by contribution from these one- and two-shift stations. ACE Report51 describes how this was done. The result is embedded in Table 2 of P2/5 in whichtwo possible contributions could be associated with such stations, i.e. either 67% of
declared net capability or xm%17 of group demand, whichever was the smaller.A similar principle can be used in the present circumstances although the
process must be a little more complex for one fundamental reason. This is that in the1970s when P2/5 was created, the manning pattern of stations could be adjusted to
ensure that contributing stations were manned during the peak demand of the system.With the present commercial structure, this may not necessarily be the case. The mostlikely situation occurs with CHP plant, the operational regime and output of which is
mainly dependent on the host requirements. Although this may span system peak load, it may also not do.
2.7.2. Modelling Approach
2.7.2.1. Approach Used in P2/5
Figure 12 – Contribution of flexible generation operating less than 24h
17This value depends on the shifting pattern and number of circuit outages and varies between 7 and 20%
xm% of peak
demand
T
daily load curve
load
time, h

7/28/2019 DG Contribution to network security_R2.pdf
http://slidepdf.com/reader/full/dg-contribution-to-network-securityr2pdf 42/79
ETSU/FES Project K/EL/00287 Extension – Final Report
________________________________________
Page 42 of 79
The basic principle to consider this source of generation is illustrated in Figure12. In P2/5, it is assumed that the shift period(s) of the generation T can be adjusted
so that it spanned the peak demand and intercepted the load curve at equal load levels(xm%) at start and finish of the shift(s). This ensured that such generation was able to
contribute to security at the most demanding point of time and minimised the demand
that had to be covered by the remaining system, both the network and any other three-shift generation stations. For two-shift stations and a shift-time of 14h, the value of xm
was found to be 80%. Since the other contributors to security had to cover alldemands up this level of 80%, stations that were available only for 14h were given a
credit of only 20% of peak demand.The same principle can be applied to the current situation with the exception
that the time period for which the generation is made available may not be flexible,
may not intercept the load curve at equal load levels at the start and finish of itsavailable time, and may not even span the peak demand. Each of these cases needs to
be considered separately.
2.7.2.2. General Principles
Consider the situation with only one generation site. The 24h period is thendivided into two sub-periods, one in which the generation is available and the other inwhich it is not available. This principle can be extended to deal with more than one
generation site by dividing the 24h period into a number of mutually exclusive sub- periods, each being associated with a specific set of circuits and generation sites.
The assessment of security is then performed for each of these two sub-periods(or more if more exist).
a) Period when restricted generation is unavailable . During this period, the
security is covered by the remaining circuits, transfer capacity and anygeneration available for 24h. In terms of the generation, this is done using the
approaches described previously and no further description is required at this point.
b) Period when restricted generation is available. During this period, two
values of contribution can be evaluated.§ calculating the contribution for this period assuming equal merit
and therefore credit is given to all possible contributors. In this case,the process is identical to the approaches described in previous sections
§ calculating the contribution for this period assuming less merit and
therefore less credit is given to the generation not available for the full24h. In this case, the process is essentially the same as that used in
P2/5
2.7.2.3. Generation is Flexible
In this case, the procedure can be said to be the same as performed in ACEReport 51 and used within P2/5. The generation shift pattern can be flexibly
positioned so that it minimises the cover required from other plant, including circuits
and other available generation, as shown in Figure 12. The two values of contribution
mentioned above can then be evaluated:-

7/28/2019 DG Contribution to network security_R2.pdf
http://slidepdf.com/reader/full/dg-contribution-to-network-securityr2pdf 43/79
ETSU/FES Project K/EL/00287 Extension – Final Report
________________________________________
Page 43 of 79
§ calculating the contribution for this period assuming equal merit. In thiscase the capability provided by the restricted generation is assessed using the
approaches described in previous sections. Let this be SVm.§ calculating the contribution for this period assuming less merit. In this
case, the value of xm% in Figure 12 can be determined.
Therefore the overall capability = min[SVm, (100 – xm)]
2.7.2.4. Generation Not Flexible but Spans Peak Demand
In this case, the procedure is virtually the same as in Section 2.7.2.3 with the
exception that the restricted generation will either become available or becomeunavailable at a load level greater than xm, e.g. as shown in Figure 13 by x1 and x2.
Consequently the remaining circuits and any other generation will have to cover agreater demand level, and the need for the restricted generation will diminish. The
two values of contribution mentioned above can then be evaluated:-§ calculating the contribution for this period assuming equal merit. In this
case the capability provided by the restricted generation is again assessed
using the approaches described in previous sectio ns. Let this value be SV1. If the generation system is the same as in Section 2.7.2.3, then SV1 = SVm.
§ calculating the contribution for this period assuming less merit. In this
case, the value of x1% and x2% in Figure 13 can be determined. Let x2 > x1.
Therefore the overall capability = min[SV1, (100 – x2)]
Figure 13 - Contribution of inflexible generation operating less than 24h
x2% of peak T
daily load curve
load
time, h
x1% of peak xm of peak

7/28/2019 DG Contribution to network security_R2.pdf
http://slidepdf.com/reader/full/dg-contribution-to-network-securityr2pdf 44/79
ETSU/FES Project K/EL/00287 Extension – Final Report
________________________________________
Page 44 of 79
2.7.2.5. Generation Not Flexible but Does Not Span Peak Demand
In this case, sufficient capacity must be provided by the remaining circuits, anytransfer capacity and any other available generation to cover peak demand. Since this
condition is more onerous than at any other time, it can be concluded that P2/5 must
be satisfied irrespective of the availability of the restricted generation. Suchgeneration therefore does not appear in the assessment of whether the system satisfies
P2/5 or not, and its capability can be stated to be zero.There is a subsequent aspect that is outside of the scope of this project. This is
whether any contribution should be credited to such generation for simply being thereand being available if needed. This is a longer term issue since it is beyond thefundamental consideration of the present version of P2/5.

7/28/2019 DG Contribution to network security_R2.pdf
http://slidepdf.com/reader/full/dg-contribution-to-network-securityr2pdf 45/79
ETSU/FES Project K/EL/00287 Extension – Final Report
________________________________________
Page 45 of 79
3. Data Availability and Plant Characteristics
3.1. Introduction
This section considers the sources of data on generating plant that could be
readily accessed to support the assessment of the security contribution of distributedgeneration.
The aim of this part of the analysis is to indicate where, for the purposes of
applying the security assessment methodology, DNOs may need to improve either their access to data, or the scope of collection of such information. The broad picture
is as below, followed by sections related to specific plant classifications.
3.1.1. Group Demand Data
Group demands for demand groups formed by 11kV feeders and at higher
voltage levels can be estimated by DNOs from operational data, now usually collected by tele-control / SCADA systems. Most DNOs hold large databases covering severalyears’ history.
Individual 11kV point demands and low voltage system demands are not soreadily obtained, and may need to be estimated on the basis of any feeder maximum
demand metering that exist, or statistically from profiled distributions associated withthe simple metering data of all the customers normally supplied from a low voltagefeeder.
Thus, except for individual 11kV point demands and for LV systems, profiles
of net demand by half-hour periods are fairly easily extractable. Nevertheless there isan overhead involved in such activity.
Most DNOs have load-duration curves for typical rural and urban circuits.The group demand data so obtained will not identify the effects of embedded
generation output, nor the effects of long periods of abnormal system configurationscaused by sustained failures or other system re-organisations unless further
judgements are made based on operational logs.
3.1.2. Distribution Plant Reliability and Operational Data
3.1.2.1. Reliability Statistics
DNOs utilise the NAFIRS system or equivalent systems. These systems provide broadly sufficient data on equipment and circuit fault rates, and non-damage
fault restoration times for 11kV systems upwards, but will not provide usefulinformation for LV systems. The routine analyses provide fault rates by type of plant,
together with restoration times for each phase of restoration. It is worth noting that NAFIRS does not collect network repair times or planned outage durations. Thesetimes are likely to be materially greater than supply restoration times.

7/28/2019 DG Contribution to network security_R2.pdf
http://slidepdf.com/reader/full/dg-contribution-to-network-securityr2pdf 46/79
ETSU/FES Project K/EL/00287 Extension – Final Report
________________________________________
Page 46 of 79
3.1.2.2. Operational Statistics
DNOs do not routinely identify back-feed capacities and the historic switchingtimes associated with these back-feeds. Thus data bases for such information cannot
be expected to exist. Instead, analyses of operational logs or engineering judgement
may need to be considered.
3.1.3. Generation Export Data
3.1.3.1. Historic Profiles
Historic profiles for generators connected at 11kV busbars and above are
generally available within DNOs from SCADA on a half-hourly export basis.Virtually all small generators who are connected to the UK distribution
systems at 11kV and above are required to install half-hourly metering to assess their exports. This information is available to DNOs for the purposes of system operationand planning. At present, some very small exporters (such as those with photovoltaic
outputs) have special arrangements for separately measuring kWh input and output tolow voltage distribution systems on a monthly basis. In other cases, trials of net
metering arrangements are being tested.Thus for the distributed generation of the scale that is normally treated under
ER P2/5, the exports from the plants concerned should be available however it is
recognised that revised procedures may be required to secure access to the data in practice.
Administrative and protocol issues exist within the supply industry concerningthe governance of this data. Meter data collectors are the immediate owners of thedata collected, and the release of this to DNOs is a formal arrangement, as are the
purposes for which it can be used (as part of the DNO licence).
3.1.3.2. Forecast Profiles
Forecast profiles for modern plant are not generally available within the DNOcommunity. This indicates that studies of plant profiles may be needed during the
implementation phase of this work.
3.2. Specific Plant Types
3.2.1. Conventional Generation
One company was approached for a sample of half-hourly data for larger
generation plant. In principle such data is available but, at the time of writing,confidentiality issues have delayed its provision.

7/28/2019 DG Contribution to network security_R2.pdf
http://slidepdf.com/reader/full/dg-contribution-to-network-securityr2pdf 47/79
ETSU/FES Project K/EL/00287 Extension – Final Report
________________________________________
Page 47 of 79
3.2.2. CHP
One company has offered a sample for half-hourly data for larger CHP plant.This is the export profile for this plant, but the on-site process consumption is not
shown separately. Such information may or may not be held by the site operator, and
is not automatically available to DNOs or NGC. Generating plant operators mayknow this information but it is not collected as a routine associated with the collection
of export data. Operating logs will record this.Similarly the profiles are not generally available, for example the incidence of
planned maintenance, lack of process demand and even gas/electricity tradingdecisions are not available to DNOs and NGC for planning purposes. This means thatthe analysis of plant outputs into various operational phases (for example to provide
planned and forced outage rates) will not be possible unless this information is alsoavailable.
Electricity export data for waste to energy plant also reveals similar data problems: some sites use some of the electricity production to operate on-site waste
processing installations.
Gas-fired CHP for leisure centres also provide some exports. Information onthis form of plant is sparse, and generally related to metering database information. In
most cases there is no material export from this plant, and metering may be on amonthly energy basis.
3.2.3. Land Fill Gas Fuelled Generation
It is normally assumed that such plant aims to maintain full output for virtually
all the year, apart from periods necessary for safety inspections and plant maintenance – there are long periods where the generation plant is technically available, and the
gas supply is sufficient to maintain full, or near full, output. It is noted that the NFFO5 test indicated that availabilities of over 90% were to be expected,
The sample data obtained indicates that this picture may not be asrepresentative as might be expected.
3.2.3.1. Samples Obtained –Data Accessibility
As with other types of generation plant, DNOs are not required to declare
generation over 5MW site capacity to NGC, and planning data for smaller plant, in
the form of export MWh and sometimes MVAr, is normally collected by all DNOsfor planning purposes. Small land-fill gas generating sites need not be declared to
NGC.Sample outputs for land-fill gas generation were obtained from a DNO who
has this information as a basis for system planning. These are daily averages, i.e. theenergy exported in a full day. Dividing by 24 thus gives the average kW exported inthe period. Half-hourly data for these small sets is not readily available to DNOs, but
was obtained in these cases to examine the persistence of the generation output whilstthe plant was operating.
Data from four sites were obtained: Landfill 3 and Landfill 2 were considered
to be mature and well established sites. Landfill 1 and Landfill 4 are established sitesin the same area, but are still undergoing development and there are problems with

7/28/2019 DG Contribution to network security_R2.pdf
http://slidepdf.com/reader/full/dg-contribution-to-network-securityr2pdf 48/79
ETSU/FES Project K/EL/00287 Extension – Final Report
________________________________________
Page 48 of 79
achieving sufficient gas output to maintain the installed output. The following sectionlooks at these profiles in more detail with the aim of determining if such plant could
normally be considered intermittent or otherwise.
3.2.3.2. Review of Sample Profiles
Landfill 3 is a mature and developed site using two 600kW spark ignition sets
connected to an 11kV system.The profile of the average daily production is much as expected for such plant.
An analysis of the profile indicates that these “up” periods occurred for 88% of thewhole year, and no substantial planned outage periods appear. An examination of theup periods by half hour has indicated that output during these periods is substantially
constant for many hours ahead with generation at about 970kW for much of the time).
Landfill 2 is also a mature and developed site using two 600kW sets,
supplying a 33kV system.The profile is still of the form expected, but shows far more frequent switches
to the “up” period. An analysis of the profile indicates that these “up” periodsoccurred for 86% of all the whole year, and no substantial planned outage periods
appear. An examination of the up periods by half hour has indicated that outputduring these periods is substantially constant for many hours ahead.
Landfill 1 is an established site with two 600kW sets, but the site has problemsin achieving a steady and sufficient output. Given the situation, the commercial
opportunity has been taken to undertake some maintenance on the sets withoutreducing the maximum possible conversion of gas to electricity.
The electricity export profile is not that which might normally be expected for
this form of installation.The output varies substantially from day to day, although a closer examination
of the persistence of generation during the “up” times indicates that, when generating,output is maintained for many hours at a time. Near-full output is maintained for onlyabout 50% of the year, but how much of the unavailability is caused by gas shortage
is not known. An output in excess of 50% of the generation capacity level however,will be exceeded for 75% of the full year.
Landfill 4 is part of the same landfill region as Landfill 1, but is a separate
installation in a different sector of the landfill. Again, the output is relatively variableover the days shown, but closer examination of the “up” times indicates a steadyoutput when operational. Generation at or near peak capacity has only occurred for
30% of the operating period (excluding the months when the installation was closedfor commercial and technical reasons). Conversely generation output above 50% of the site capacity occurred for 75% of the operating period.
3.2.3.3. Indications from the Review of Land-Fill Gas Output Profiles
The exercise of obtaining a sample of landfill gas generation has indicated
that:-

7/28/2019 DG Contribution to network security_R2.pdf
http://slidepdf.com/reader/full/dg-contribution-to-network-securityr2pdf 49/79
ETSU/FES Project K/EL/00287 Extension – Final Report
________________________________________
Page 49 of 79
§ such data for half-hourly and for 24hr periods is available and in this exampleit could be extracted from data bases within a few days;
§ during “up” times, the landfill gas electrical output on some sites is relativelysteady for many hours, and thus this “mature” generation need not be
considered to be intermittent;§
there will be some sites for which gas supplies may not be assured or proven,yet there is still a possibility that generation at a reduced level of max demand
can be reasonably assured for a large proportion of an operating period.§ there was no evidence that system disturbances had precipitated the
disconnection of the plant at any time.§ the data is not readily separable into maintenance and non-maintenance
periods, nor can fuel shortage periods be readily identified without additional
information from the plant operators.
3.2.4. Wind Powered Generation
Land-based wind-power plant has long periods where the generating plant is
technically available but the wind supply is insufficient to maintain anything like the plant’s full, or near full, output.
This section considers the ability of DNOs to obtain the output data insufficient detail to allow its application in local security assessments. In this aspect,the issue of persistence could be of importance, and hence the ability to look at the
duration of output is pertinent to the viability of the analysis methodology.
3.2.4.1. Samples Obtained – Data Accessibility
Examples of electrical outputs on a half hourly basis for an individual turbine,
for a small cluster of turbines and for a large site were assembled from a specificcompany’s SCADA system.
This system is able to access instantaneous data as well as the accumulatedenergy figures for any specified period. This data presented here is the energysupplied during a half-hour period, and thus can be taken to represent the average kW
generation during the period.Additionally, a sample of minute by minute outputs were obtained to allow an
examination of the persistence of output in the shorter operational time spans that
might be of relevance to system security considerations that are related to the timesneeded for system re-configuration/switching.
This mechanism for data collection is not always readily available to someDNOs, but in general, their SCADA systems can provide such detailed load flow data
at 33kV and even 11kV levels for wind generation. Low voltage information is notso easily obtained, except by reference to meter data. Instead, it appears that onlyhalf-hourly data for wind-powered output will be available via the operator’s metering
systems.
3.2.4.2. Review of Sample Profiles
Single wind-turbine output has been studied. This shows a highly variable
output over time, with few periods of higher demand lasting more that a few hours.The likelihood of generation output being above a given level at any point in time and

7/28/2019 DG Contribution to network security_R2.pdf
http://slidepdf.com/reader/full/dg-contribution-to-network-securityr2pdf 50/79
ETSU/FES Project K/EL/00287 Extension – Final Report
________________________________________
Page 50 of 79
then being maintained at that level (or above) for a specified period from that time can be derived from these examples if the persistence time is a multiple of half-hours.
The output for a moderate size cluster of wind-turbines has also beenconsidered. This also shows a variable output, but with slightly longer periods of
persistence at various kW output levels.
The persistence of output within each half hour is of interest. Looking at theminute-by-minute profile for a single large wind-generator, there is some broad
stability in the look forward of one half-hour. Taking a starting point randomly intime, and then examining the forward profile for 30 minutes, although the output
varies notably, there appears to be a high probability that throughout the time, theoutput will not vary by an order of magnitude; indeed, a variation of more that +/-50% is most unlikely.
Again, planned outage effects are not automatically identifiable, andinformation from the plant operators is needed to separate out these effects.
3.2.4.3. Indications from the Review
The process of obtaining the sample export/time profiles for clusters of wind
generators connected at 11kV and above indicates that half-hourly data can beobtained via the metering arrangements. Additionally, export data for shorter time
periods can often be obtained, but this needs to be organised as a special analysis of the data collected from DNO’s telecontrol systems.
3.2.5. Micro-Generation
Domestic CHP (DCHP) data is not well established and no authoritative datasamples have been obtained, although many profiles are believed to be held by the
prospective DCHP manufacturers. In addition, these devices will be connected to low
voltage distribution systems.DCHP units are not yet suited to being switched off or modulated, and the
export to the distribution system will reflect not only the “base-load” nature of theoutput, but the magnified volatility of the varying domestic/local demand – the outputis effectively the difference between varying demand and a fairly steady off-setting
local generation. No attempt has yet has been made to simulate this profile.A micro CHP system is the domestic appliance that produces heat and
electricity. The appliance can be envisaged as a domestic floor-standing boiler, whichin addition to heat also produces electricity. The operation of a micro CHP system isheat-led. This means that the system is operated according to the home’s need for
heating. Therefore, the heat is the primary output of the system and the electricity is a by-product. The sizing of a micro CHP system is determined by the heat requirement
of the home. This implies that the heat output is the parameter that is considered for sizing. The electrical output will thus be determined as a function of the heat output,as these two outputs are linked together in a certain relationship by the laws of
physics/thermodynamics. As the operation of the micro CHP system is heat-led, thesystem will virtually not be in operation during summer. The system will primarily
run during winter, and depending on the size of the house (i.e. its heat requirement),
the annual running time may be in the range of some 2000 to 3000 hours. Generallyspeaking it may be said that a heat-led micro CHP system will produce peak time

7/28/2019 DG Contribution to network security_R2.pdf
http://slidepdf.com/reader/full/dg-contribution-to-network-securityr2pdf 51/79
ETSU/FES Project K/EL/00287 Extension – Final Report
________________________________________
Page 51 of 79
electricity. This is due to the fact that electricity peak times normally coincide withthe times at which heating occurs. These are the periods of the day when people are at
home and require both heat and electricity.One should expect a DCHP unit to run something like 12+ hours a day in
winter - and somewhat less in summer (if at all). Thus it may be feasible to construct
a very crude winter-time and summer-time profile; say from 5am to 10am and from2pm to 10pm for winter periods and from 5am to 8am and 4pm to 7pm in the summer.
For the purposes of the assessment of this plants’ contribution to localsecurity, it will be necessary to extrapolate manufactures’ or developers’ best
estimates, and combine these with demand data analyses.
3.2.6. Conclusions on Data Access and Quality
§ DNOs generally hold comprehensive historical data on the net export of
many types of generating plant and feeder demands (at high voltage and
above).§ These systems can be interrogated to provide site-specific and plant- specific
information. However this information will need further analysis if it is to besub-divided into data sectors for maintenance and non-maintenance periods,
and may be further complicated by the effects of embedded generationoutputs (with respect to group demand) and abnormal system demands. Thenecessary operational history may not be readily extractable.
§ To support the analysis of LV system security issues, DNOs may feel a needto improve group demand estimation and generation profiling.
§ DNO network reliability data is generally well provided and readilyaccessible, but statistically robust estimation of switching times may be lessassured.

7/28/2019 DG Contribution to network security_R2.pdf
http://slidepdf.com/reader/full/dg-contribution-to-network-securityr2pdf 52/79
ETSU/FES Project K/EL/00287 Extension – Final Report
________________________________________
Page 52 of 79
4. Numerical Studies and Illustrative Examples
4.1. Contribution of Non-Intermittent Generation
4.1.1. Application of Methodology Algorithm
The flow chart presented in Figure 14 summarises the methodology algorithmfor assessing the contribution to security from non-intermittent generators. Given thenumber of units, their availabilities and capacities, the first step involves forming the
capacity outage probability table (COPT) for this group of generators. An appropriateload duration curve (LDC) is then superimposed onto the COPT and the expected
energy not supplied (EENS) is calculated. Finally, as in ACE Report 51, the effectivegeneration contribution is determined from the transmission circuit capacity which,when substituted for this generating plant, results in the same level of EENS
(assuming a perfect line, 100% reliable).
Figure 14 - Flow chart for non-intermittent generation
4.1.2. Re-establishing Table 2 of P2/5
The developed methodology was first applied to the systems studied in ACE
Report 51 in order to determine whether the values quoted in P2/5 could bereproduced. ACE Report 51 assumes the availability of the generator units to be 86%and the reliability of the circuits with which they are compared to be perfectly
reliable. The outcomes are quoted as the ratio of effective output to maximum outputof generators. Depending on the set size, these ratios varied between 0.4 and 0.9.From these ratios the report concludes that an average ratio of 0.67 could be used, this
being the value quoted in Table 2 of P2/5. Other documents accompanying P2/5suggest that the analysis was performed for one to ten units. In the studies performed,
the generating systems are assumed to have the same total installed capacity.The LDC used in these studies is shown in Figure 15; this being a three-piece
linear version of the winter LDC shown in Figure B7 of ACE Report 51.
Contribution
EENS
COPT
LDC NON-INTERMITTENT
Number of units
Availability
Capacity
Contribution
EENS
COPT
LDC NON-INTERMITTENT
Number of units
Availability
Capacity

7/28/2019 DG Contribution to network security_R2.pdf
http://slidepdf.com/reader/full/dg-contribution-to-network-securityr2pdf 53/79
ETSU/FES Project K/EL/00287 Extension – Final Report
________________________________________
Page 53 of 79
Figure 15 – Three-piece linear version of LDC in Figure B7 of ACE Report 51
The results of these studies are shown in Figure 16. This figure shows therelationship between the number of units and their contribution to network security.As expected, the results show that the contribution increases as the number of units is
increased, although the relationship is not linear. The contribution of a singlegenerating unit is about 50% of its capacity, while for 10 units the contribution isgreater than 75% of the total capacity. It is important to observe that the security
contribution made by a generating system is always less than its availability (in thiscase 86%).
Figure 16 - Application of the developed methodology to systems described in ACE51
100%
25 %
Load
100%
3624 h
Time
45%
50%
55%
60%
65%
70%
75%
80%
85%
1 2 3 4 5 6 7 8 9 10
Number of generators
C o n t r i b u t i o n

7/28/2019 DG Contribution to network security_R2.pdf
http://slidepdf.com/reader/full/dg-contribution-to-network-securityr2pdf 54/79
ETSU/FES Project K/EL/00287 Extension – Final Report
________________________________________
Page 54 of 79
These case studies clearly show that visual average value of the contribution
across one to ten units is indeed very close to the value of 67% quoted in ACE Report51 and in P2/5.
4.1.3. Effect of Materiality
The results shown in Figure 16 also reflect the concern expressed aboutmateriality and discussed previously in Sections 1.3, 2.3.8 and 4.1.3. The contribution
is seen to decrease significantly for numbers of units less than three. In P2/5, only onesingle contributing ratio is given, i.e. 67%. From these results, it is evident that thiswould be very optimistic if used for one or two units. This justifies the stance taken in
P2/5, in which special analyses are suggested for systems containing only one or twounits particularly if they are relatively large compared with the remaining network
capacities.However, it is not logical to extend this stance to an approach in which a range
of contributing ratios are given in a table or graph, or in which the actual contributingratio is evaluated for the specific system being considered. In the approach being
proposed in this report, the methodology is applicable to all systems, even those with
a very small number of relatively very large generating units.The concern seems to centre on whether the contribution of one and two sets
can be relied on. In assessing this aspect, the following points should be noted:
§ the proposed methodology uses a consistent approach for all unit numbersand is applicable to small and large numbers alike
§ the objective of P2/5 is to determine whether a system is P2/5 compliant or not – a binary decision answered simply by yes or no 18
§ for a unit availability of 0.86 (the P2/5 value), the generation contributions
are given in Figure 16. Using these values, the following table can becompiled from information provided by the respective capacity outage
probability tables:-
number
of units
% contribution
from Figure 16
probability of
deliveringcontribution
probability of
not deliveringcontribution
degree of redundancy,
i.e. number of units inexcess of minimum needed
1 50.0 86 14 0
2 60.8 74 26 0
3 65.7 94.7 5.3 14 68.1 90.3 9.7 1
5 69.6 85.3 14.7 1
6 71.3 80.0 20.0 1
7 72.5 74.4 25.6 1
8 73.8 91.1 8.9 2
9 74.7 88.0 12.0 2
10 76.1 84.5 15.4 2
18It may be questioned whether this is sufficient but a different answer to this question would require a
complete and radical change to the philosophy of P2/5

7/28/2019 DG Contribution to network security_R2.pdf
http://slidepdf.com/reader/full/dg-contribution-to-network-securityr2pdf 55/79
ETSU/FES Project K/EL/00287 Extension – Final Report
________________________________________
Page 55 of 79
This table shows that three units are best, two and seven units are worst, andmost significantly six, seven and ten units are worse than a single unit. The reasoning
is that the amount of redundancy does not increase continuously with number of units,only gradual discontinuous increases occur as shown in the above table. It is a fact
that risk increases with increasing number of units if the degree of redundanc y does
not increase. As discussed in Section 4.1.3, the reason why it was wise for P2/5 toconsider one and two units as special cases was the fact that only one single average
value (67%) for the contribution factor was used. Using the proposed methodology,the actual contribution factor is now available. From this discussion, there seems no
objective or logical reason why one and two units should not be treated identically toall other number of units.
4.1.4. Effect of Availability and Number of Units
The methodology was used to determine the contributions that generating
systems having different number of units and hence unit capacity (the total systemcapacity was kept constant), and different unit availabilities make to system security.The LDC shown in Figure 15 was used to carry out these studies. The results are
shown in Figure 17. These confirm the effect already shown in Figure 16 applies at alllevels of unit availability.
Figure 17 – Effect of availability and number of units
4.1.5. Effect of Shape of LDC
In order to establish the impact of the shape of the LDC on the contributionthat a generating system makes to security, the duration of the peak period and the
load level of the mid point (see Figure 18) were varied over a wide range.
0%
10%
20%
30%
40%
50%
60%
70%
80%
90%
100%
0 0.1 0.2 0.3 0.4 0.5 0.6 0.7 0.8 0.9 1
Availability
C o n t r u b u t i o n
1 2 3 4 5 6 7 8 9 10

7/28/2019 DG Contribution to network security_R2.pdf
http://slidepdf.com/reader/full/dg-contribution-to-network-securityr2pdf 56/79
ETSU/FES Project K/EL/00287 Extension – Final Report
________________________________________
Page 56 of 79
Figure 18 – Variations in shape of the LDCs
Figure 19 – Effect of shape of LDC with three units
100%
25%
Load
100% Time
100%
25%
Load
100% Time
100%
25%
Load
100% Time
100%
25%
Load
100% Time
Impact of LDC shape
0%
10%
20%
30%
40%
50%
60%
70%
80%
90%
100%
0% 20% 40% 60% 80% 100%
Availability
C o n t r i b u t i o n
Max Contr ibut ion Min Contr ibut ion Average Contribut ion

7/28/2019 DG Contribution to network security_R2.pdf
http://slidepdf.com/reader/full/dg-contribution-to-network-securityr2pdf 57/79
ETSU/FES Project K/EL/00287 Extension – Final Report
________________________________________
Page 57 of 79
Figure 20 - Effect of shape of LDC with ten units
The results of these case studies are shown in Figures 19 and 20 for a systemof three and ten units respectively for a range of availabilities.
These figures show that the generation contribution is dependent on the shapeof the LDC and that the variation of contribution increases with unit availability. For
units with an availability of less than about 50%, the contribution does not varysignificantly with shape of the LDC. However for units with greater availabilities, itmay be important to consider the LDC of the group demand being assessed. By
comparing Figures 19 and 20, it can be concluded that the impact of the shape of LDCreduces with increasing number of units.
4.1.6. Application Example
An example of the application of the proposed methodology for quantifyingnetwork capability is shown in Figure 21. The local group demand is supplied from a
system composed of two transformers operated by the local DNO, two generatorsoperated by Generating Company A and one generator operated by GeneratingCompany B. The capacities of the transformers together with availabilities and
capacities of the generators are given in Figure 21.
The associated capacity outage probability table for this generation system is:-
Impact of LDC shape
0%
10%
20%
30%40%
50%
60%
70%
80%
90%
100%
0% 20% 40% 60% 80% 100%
Availability
C o n
t r i b u t i o n
Max Contribution Min Contribution Average Contribution

7/28/2019 DG Contribution to network security_R2.pdf
http://slidepdf.com/reader/full/dg-contribution-to-network-securityr2pdf 58/79
ETSU/FES Project K/EL/00287 Extension – Final Report
________________________________________
Page 58 of 79
Capacity
MW
55 45 35 30 25 20 10 0
Probability 0.441 0.189 0.189 0.049 0.081 0.021 0.021 0.009
This capacity outage probability table is then superimposed onto the LDC
given in Figure 15 to compute the contribution that these three generators make tonetwork security of 34.51 MW.
The capability of the system after an outage of one transformer is composedof:-
§ the remaining transformer is capable of carrying 1.3 x 45MW = 58.50MW
§ the overall contribution of the three generators is 34.51MW (62.82%)
§ i.e. a total of 93.01MW, which is the capability of the system.
If the peak demand of the group is less than 93.01MW, the system would be
considered to be P2/5 compliant.
Figure 21 – System studied
DNO
Load
Gen A Gen B
10MW 20MW 25MW2x45MW
Ava 70% Ava 90%
DNO
Load
Gen A Gen B
10MW 20MW 25MW2x45MW
Ava 70% Ava 90%

7/28/2019 DG Contribution to network security_R2.pdf
http://slidepdf.com/reader/full/dg-contribution-to-network-securityr2pdf 59/79
ETSU/FES Project K/EL/00287 Extension – Final Report
________________________________________
Page 59 of 79
4.2. Contribution of Intermittent Generation
4.2.1. Application of Methodology Algorithm
The flow chart shown in Figure 22 summarises the methodology algorithm for
assessing the contribution to security from intermittent generators. Given the output profile (over one or more years) of an intermittent generator system, e.g. wind farm,
and the required persistence level (Tm), the corresponding COPT is first formed.Then, as in the case of non-intermittent generation, the appropriate LDC issuperimposed on the COPT and the EENS calculated. Finally, the effective generation
contribution is deduced as the transmission circuit capacity which, when substitutedfor the generating plant, gives the same level of EENS.
Figure 22 - Flow chart for intermittent generation
4.2.2. Effect of Persistence Level
The methodology was applied to a NFFO wind farm having the normalised
half-hourly profile output shown in Figure 23. The output of the wind farm wasadjusted to achieve a 35% load factor.
For a number of persistence levels from ½ hr to seven days, the corresponding
COPT was created using 20 discrete output states. The contribution of the wind farmto system security was then quantified and the results are shown in Figure 24.
Time
SeriesTm
Contribution
EENS
COPT
INTERMITTENT LDC
Time
SeriesTm
Contribution
EENS
COPT
INTERMITTENT LDC

7/28/2019 DG Contribution to network security_R2.pdf
http://slidepdf.com/reader/full/dg-contribution-to-network-securityr2pdf 60/79
ETSU/FES Project K/EL/00287 Extension – Final Report
________________________________________
Page 60 of 79
Figure 23 - Normalised annual wind farm output profile
Figure 24 – Effect of persistence level
For Tm = ½ hr, the contribution of the wind farm to network security is about
30%. Increasing the level of required persistence reduces the contribution to securityas expected. For Tm = 24 hr, the contribution reduces to about 15%.
4.2.3. Effect of Seasonal Variations
It is expected in general that the system peak demand and the greatest outputlevel of wind generation would both occur in the winter period. In order to investigate
0
0.1
0.2
0.3
0.4
0.5
0.6
0.7
0.8
0.9
1
0 2000 4000 6000 8000Time (h)
P o w e r ( p . u . )
35% load factor
0
0.1
0.2
0.3
0.4
0.5
0.6
0.7
0.8
0.9
1
0 2000 4000 6000 8000Time (h)
P o w e r ( p . u . )
35% load factor
Year
0.0%
5.0%
10.0%
15.0%
20.0%
25.0%
30.0%
35.0%
0 50 10 0 15 0
T m ( h )
C o n t r i b u t i o n

7/28/2019 DG Contribution to network security_R2.pdf
http://slidepdf.com/reader/full/dg-contribution-to-network-securityr2pdf 61/79
ETSU/FES Project K/EL/00287 Extension – Final Report
________________________________________
Page 61 of 79
the impact of this correlation between wind generation and peak demand, the previousanalysis is repeated but covering only winter months. The energy output of the wind
farm in various months of the year is shown in Figure 25. This figure clearlydemonstrates that the output of the wind farm in winter is considerably higher than in
the summer months.
Figure 25 – Average annual energy output of a wind farm
Three sets of results are shown in Figure 26; these being for the periodsconsidering:-
§ the whole year § five months, November to March inclusive§ three months, December to February inclusive.
As expected, the results show that the contribution to security of the wind farmis greater if only winter months are considered. For Tm = 24 hours, the contribution
increases from about 15% when the whole year is considered, to over 21% when onlythree winter months are taken into account.
0 %
1 0 %
2 0 %
3 0 %
4 0 %
5 0 %
6 0 %
J an F e b M a r A p r M a y J u n J ul A ug S ep O c t N o v D e c
M o n t h
A v e r a g e p o w e r ( p . u . )

7/28/2019 DG Contribution to network security_R2.pdf
http://slidepdf.com/reader/full/dg-contribution-to-network-securityr2pdf 62/79
ETSU/FES Project K/EL/00287 Extension – Final Report
________________________________________
Page 62 of 79
Figure 26 – Annual and winter security contributions
4.2.4. Sensitivity Studies
A number of sensitivity studies were performed to investigate the robustnessof the algorithm and of the results. Three factors were considered:
a) the impact of the number of discrete generation states b) the impact of variation in the probabilities of the wind generation statesc) the impact of the time-period resolution of the wind data.
a) The impact of the number of discrete generation states.
Figure 27 shows the security contributions when different number of discretegeneration states were used in representing the COPT. It is clear that the number of
states does not have a very significant impact on the final results. A recommendationof 20 discrete states is a reasonable compromise between accuracy and computing
effort.
b) The impact of variation in the probabilities of the wind generation states
Figure 28 shows the frequency distribution of the level of contribution to
security obtained by varying state probabilities randomly in the range of ±10%. For Tm = ½ hr, the contribution was found to vary between 29.2% and 30.8%. Since this
range of variation is relatively small, it can be concluded that the results are quiterobust.
0.0%
5.0%
10.0%
15.0%
20.0%
25.0%
30.0%
35.0%
40.0%
0 20 40 60 80 100 120 140 160
Tm (h)
C o n t r i b u t i o n
Year Winter 3 m Winter 5 m

7/28/2019 DG Contribution to network security_R2.pdf
http://slidepdf.com/reader/full/dg-contribution-to-network-securityr2pdf 63/79
ETSU/FES Project K/EL/00287 Extension – Final Report
________________________________________
Page 63 of 79
Figure 27 – Effect of number of states representing wind farm output
Figure 28 – Effect of changes in wind-state probabilities for Tm = ½ hr
c) The impact of the time-period resolution of the wind data
Since wind output may vary considerably during each half hour, this variation
in associated levels of generation would need to be absorbed by the remainingcircuits. For a short period of time, the generation output could drop significantly andhence the remaining circuits may become overloaded. Such a situation is illustrated in
Figure 29 in which wind output profiles using 30 min and 1 min resolutions are
shown for a period of one day. In this example, the variation between the tworesolutions can be observed by focusing on the highlighted region.
2 7 . 8 %
2 8 . 0 %
2 8 . 2 %
2 8 . 4 %
2 8 . 6 %
2 8 . 8 %
2 9 . 0 %
2 9 . 2 %
2 9 . 4 %
2 9 . 6 %
2 9 . 8 %
0 2 4 6 8
T m ( h )
C o n t r i b u t i o
1 0 0 20 1 0
0
5
10
15
20
25
30
0 . 2 9
0 . 2 9 2
0 . 2 9
4
0 . 2 9 6
0 . 2 9 8 0 .
3
0 . 3 0 2
0 . 3 0
4
0 . 3 0 6
0 . 3 0 8
0 . 3 1
Contribution
F r e q u
e n c y

7/28/2019 DG Contribution to network security_R2.pdf
http://slidepdf.com/reader/full/dg-contribution-to-network-securityr2pdf 64/79
ETSU/FES Project K/EL/00287 Extension – Final Report
________________________________________
Page 64 of 79
The levels of contribution for 1 min and for 30 min resolutions are shown inFigure 30. As expected, the apparent contribution of wind reduces if the 1 min data is
used.
Figure 29 - Wind output profile using 1 min and 30 min resolutions
Figure 30 – Effect of 1 min and 30 min data resolutions
0 4 8 12 16 20 240
0.1
0.2
0.3
0.4
0.5
0.6
0.7
0.8
0.9
1
Time (h)
P o w e r ( p . u . )
0%
5%
10%
15%
20%
25%
0 24 48 72 96 120 144 168
Time Tm (h)
C o n t r i b u t i o n
Half hour 1 minute

7/28/2019 DG Contribution to network security_R2.pdf
http://slidepdf.com/reader/full/dg-contribution-to-network-securityr2pdf 65/79
ETSU/FES Project K/EL/00287 Extension – Final Report
________________________________________
Page 65 of 79
4.3. Concluding Comments
The proposed methodology was applied in this section to determine thecontribution to network security from both non-intermittent and intermittent
generating sources.
Case studies are carried out on the systems presented in ACE Report 51 andthe values quoted in P2/5 are reproduced. From these studies the relationship between
the number of units and their contribution to network security was established. Theapproach and methodology being proposed in this report and demonstrated by the
case studies performed in this section, is applicable to all systems, even those with avery small number of relatively very large generating units.
A number of sensitivity studies are performed to demonstrate that the
proposed methodology can be applied to determine the contributions from generatingsystems having different number of units and different unit availabilities. This
included a study of the impact of the shape of the LDC indicating that, for generatingsystems with unit availabilities greater that 50%, it may be important to consider the
specific rather than a generic LDC of the group demand being assessed. An exampleof the application of the proposed methodology for quantifying network capability isalso provided.
The developed methodology was applied to determine the contribution of intermittent generation to network security. From a half hourly annual profile of awind farm the contribution was quantified for a number of persistence levels from ½
hr to seven days. The results show that for the wind farm with an annual load factor of 35% and Tm = ½ hr, the contribution of the wind farm to network security is about
30%. As expected, increasing the level of required persistence reduces thecontribution to security. For Tm = 24 hours it was found that the contribution tonetwork security reduced to about 15%.
The impact of the correlation between wind generation and peak demand wasalso studied showing the contribution to security of the wind farm is greater in this
example if only winter months are considered.A number of sensitivity studies were performed to investigate the robustness
of the algorithm and of the results. The factors considered were the impact of the
number of discrete generation states, the impact of variation in the probabilities of thewind generation states and the impact of the time-period resolution of the wind data.
The studies demonstrated that the number of states does not have a very significantimpact on the final results and a recommendation of 20 discrete states is considered to
be a reasonable compromise between accuracy and computing effort. Similarly, for a
10% variation in state probabilities did not affect the contribution quantified and itwas concluded that the results obtained were quite robust. Since wind output may
vary considerably during each half hour the studies are performed to determine thecontribution based on one minute data resolution. As expected, the contribution of wind reduces if the 1 min data is used.

7/28/2019 DG Contribution to network security_R2.pdf
http://slidepdf.com/reader/full/dg-contribution-to-network-securityr2pdf 66/79
ETSU/FES Project K/EL/00287 Extension – Final Report
________________________________________
Page 66 of 79
5. Implementation Issues
5.1. Introduction
The study team has considered the practicality of the methodologies proposedwith respect to the problems that might be encountered in obtaining data and in being
able to implement analyses using the theory described above.The key issues are:-
§ is all the data required by the methodology reasonably accessible by DNOs?§ is it credible to establish from existing data sources a value of Tm for systems
in which intermittent generation exists?
§ how can the methodology be consistently applied, i.e. systemised and codified,to determine the effective capacity of intermittent and non- intermittent
generation, and what caveats can be determined on the issues of size andnumbers of units?
The implementation of the methods described in the previous sections of thisdocument will require several issues to be addressed for the development of either (or
both) a spreadsheet assessment of intermittent and non- intermittent generation, a black-box approach and/or its use for the derivation of a revision to Table 2 of ER P2/5. These matters are considered further in Section 5.5.
5.2. Data Availability
Table 6 indicates the accessibility of the data required for the application of the
proposed methodology. Ostensibly, the data needed is in existence or can be obtained.In reality several practical issues may arise, as discussed below.
5.2.1. Group Demand Estimates
The time/demand profile for a group(s) will be needed, and raw data will be
available.Firstly, this may include the effects of any demand-side management (DSM)
and embedded generation and CHP (net of its site load), as well as the effects of
demand transfers. In this case, DNOs will know the identities and performance of therelated generation and DSM, but the details of any demand transfers that have taken
place may be difficult to track down.Secondly, the information may need to be extracted for several years for
statistical analysis. In this instance, whilst most DNOs will have information storedfor a number of years, there is some evidence that some DNOs may have onlyrecently started to accumulate full histories for most demand groups.
Thus, in relation to the implementation phase, DNOs may need to be requestedto provide information that is additional to the “raw” group demand database.
Group demands for LV systems are not collected, and thus consideration of LV-connected generation may be difficult if the aim is to acquire actual data.

7/28/2019 DG Contribution to network security_R2.pdf
http://slidepdf.com/reader/full/dg-contribution-to-network-securityr2pdf 67/79
ETSU/FES Project K/EL/00287 Extension – Final Report
________________________________________
Page 67 of 79
Table 6 – Accessibility of Data
Data
Requirement
Data in
Existence in
format needed
Readily
accessible in
format
required butwith
administration
Will it need
analysis?
Will it need to
be gathered –
how?
Fault rate
statistics for
transmission and
distribution
circuits
Routinely collected
in most DNOs for
reporting to
OFGEM and for
other applications.
Similar situation
for NGC and
Scottish Systems
Partly – most
DNOs have
customer
performance and
equipment fault
rates etc. but
restoration times
are not normally
analysed
Yes – some
further analysis
may be needed
Not normally,
although
information on
switching times
may need to be
gathered from
operational logs.
Group demanddata on a half-
hourly basis
Comprehensivedata now kept using
DNO’s system
monitoring
facilities at
substations. This
records the flows at
11kV and above. It
is therefore net of
distributed
generation output.
DNOs may know
the output of this
generation (as below).
Data collected will
not be to the same
accuracy as
contract metering.
Yes. Mostinformation has
now been stored
for over 1 year.
Analysis to adjustfor generation
export may be
needed.
No – alreadygathered. Some
system control
systems can be
used to collect
information at
very fine intervals
– 1 minute data
for wind power
has been obtained
in some areas.
Generation output
data
Virtually all
generators who are
connected to and
export into the
distribution or
transmission
system have half-
hourly metering,
and this
information is
collected for
contract purposes .
It is generally to a
high accuracy.
DNOs have access
to the National
Data Transmission
System and can
down load
information.
Historic
information is
controlled by Data
Collectors. Access
to this often
requires formal
approval before its
release.
Yes – depending
on the need to
disaggregate data
Historic data may
not be available
for small
domestic CHP,
wave power, off-
shore wind plants
or other active
devices such as
fuel cells.
Systems will need
to be improved to
increase the
availability of this
data.

7/28/2019 DG Contribution to network security_R2.pdf
http://slidepdf.com/reader/full/dg-contribution-to-network-securityr2pdf 68/79
ETSU/FES Project K/EL/00287 Extension – Final Report
________________________________________
Page 68 of 79
5.2.2. Distribution System Performance and Other Data
DNOs utilise the NAFIRS system or equivalent systems. These systems provide broadly sufficient data on equipment and circuit fault rates, and non-damage
fault restoration times (but not fault repair times) for 11kV systems upwards, but willnot provide useful information for LV systems.
The identification of Tm will still require the determination of the switching
times that are associated with the system being studied. Tm will also be dependent onthe particular fault or planned outage and hence be dependent on the return to service
time. These may be inferred from some NAFIRS data, but it may be found that aseparate analysis from operational records is more appropriate.
If example networks are being studied, some information on the typical back-
feed capacities will also be needed, together with the overload capacities of theequipment being considered. The use of overload capacities will be dependent on the
particular outages and circuit loadings.
5.2.3. Techniques for Profile Analysis
Whilst the study group has taken example profiles of generation output againsttime and has then assessed Tm and other factors, it is apparent that a more streamlined
analysis package may be needed if the methodology is to be applied many times in theimplementation phases and beyond.
In addition, it may be necessary to undertake statistical analysis on several
years’ of data. Given the large volumes of data for analysis, some resource may needto be expended to develop efficient processes for data and file handling.
5.2.4. Generation Profiles – Typicality
If the implementation phase is intended to assess a large number of generation profiles, it is apparent that these could be obtained. However, data for many types of
generation – fuel cells, domestic CHP for example - is sparse, and may not beappropriate for statistical analysis.
The infancy of some generation installations has been found to have a
significant effect on the robustness that could be ascribed to the output profiles found.The output of land-fill gas generation, for example, seems to be very unreliable in the
cases where the landfill itself is still under active development yet, in those instanceswhere the land-fill is finalised and mature, the generation output is highly reliable.
5.3. Derivation of Tm
The concept of Tm is that of the period for which generation will be needed tooperate to secure system security. The period is therefore related to the duration of
the system conditions in which such generation may be required to reduce, or avoid,customer disconnections.
In terms of the application of the methodology described above, it will benecessary to consider the Tm values for each failure mode and to incorporate these in

7/28/2019 DG Contribution to network security_R2.pdf
http://slidepdf.com/reader/full/dg-contribution-to-network-securityr2pdf 69/79
ETSU/FES Project K/EL/00287 Extension – Final Report
________________________________________
Page 69 of 79
the studies carried out. In terms of subsequent applications, it may be necessary toconsider in more detail the use of a matrix of typical values derived from NAFIRS
operational logs etc. These two aspects are discussed separately below; the rationalefor the derivation of Tm being discussed immediately below, and the use of a matrix
of typical values is considered in Section 5.5.
Tm needs to be considered in the context of the systems that are beingassessed, and in terms of each failure mode that is being assessed by the above
methodology. Each failure mode will have a different Tm value attached to it. Themethodology requires Tm to be evaluated for each mode, and then the generation
profile to be filtered accordingly.For example,
1) For situations in which, after a first circuit outage, the maximumdemand may be slightly above the aggregate short-term capacity of
the remaining circuits plus that of any switchable (normally open) back-feeds, then
a) any generation that is connected within the demand group may act torelieve overloads on the main system circuitry (excluding the back-feed
capacity) for the period during which the back-feed relief is beingswitched in.
b) thus generation will have substantially the same effect for both non-
damage events and damage events.c) in this circumstance, Tm is conceived as the period for which generation
should be considered to be able contribute whilst switching takes place. d) thus for 11kV systems for example, manual switching could take say 1.5
hours; for 33kV systems designed to P2/5, this period may be 15 minutes.
Tm is therefore a function of the system design, and if system automationis included, then the contribution of wind power might be counted as
higher than in situations where manual switching of a back-feed isutilised.
e) half-hour data will not indicate if generation can provide reliable support
over 15 minute periods. One minute data, etc. does provide some anecdotalevidence of acceptable stability.
2) For situations in which, after a first circuit outage, the maximumdemand could exceed significantly the system firm capacity plus the back
feed capacity, there is a risk of longer-term capacity shortage (relatively).In these circumstances the determination of the period for which
generation may need to provide 'relief" can be of the order of days andweeks.
a) for non-damage first circuit outages, generation still provides theimmediate non-damage relief as in (1) above, and it is likely that with non-
damage restoration of the order of 15 - 30 minutes in many circumstances,Tm is conceivable as the non-damage restoration time. However in the caseof planned outages involving network development, the duration of the
work, which could be in the order of days or weeks, may need to be
considered.

7/28/2019 DG Contribution to network security_R2.pdf
http://slidepdf.com/reader/full/dg-contribution-to-network-securityr2pdf 70/79
ETSU/FES Project K/EL/00287 Extension – Final Report
________________________________________
Page 70 of 79
b) for damage first circuit outages, generation must provide support for daysor weeks - the duration of repairs, unless some emergency relief work is
carried out - standby mobile generation, urgent alternative lineconstruction, etc. It is hard to imagine Tm being less than 24 to 48 hours
for damage fault situations.
c) the incidence of damage faults cannot be disregarded and thusconsideration of the risks associated with such events in systems with
intermittent generation must be looked at to ensure that acceptablecustomer disconnection frequency is not being risked.
3) For situations in which, after a second circuit outage, the maximumdemand could exceed significantly the system firm capacity plus the back feed
capacity, there is a risk of longer-term capacity shortage (relatively). In thesecircumstances the determination of the period for which generation may need to
provide 'relief" can be related to the time it takes for an urgent return to serviceof the planned outage.
In those conditions where this return time is less than the likely repair time of the failed circuits it is not unreasonable to assume that this time would be a
component of the Tm matrix. In those conditions where the planned outage cannot bereturned to service faster than the likely repair time of the faulted circuit, then theforced circuit repair or restoration times are appropriate.
It has been concluded that Tm can be defined in terms of non-damagerestoration times (measured from NAFIRS data), or from knowledge of switching or
return to service times (estimated from operational logs or experience) for thenetworks concerned. There are usually no routine analyses made by DNO of thesetimes, but operational logs may well be able to provide sufficient information for
these purposes.Examination of the generation output data that is available indicates that only
half-hourly information will be readily available. The value of Tm, being switchingtimes or non-damage restorations times, may in many cases be less that the half-hour interval of the generation output data. This means that further assumptions on the
short term rating of circuits and assumptions on the variability of generation outputduring half-hour periods will need to be made. Preliminary considerations of a small
sample of generation profiles suggest that it may be reasonable to assume thatgeneration levels will not vary materially in may cases over a period of, say 15minutes, and therefore simplifying assumptions may be credible.
The consideration of what Tm values should be used therefore leads to the proposal that these values should be geared to the demand groups being considered.Thus an apparently reasonable assumption is for the repair or urgent switching times
for say 11kV and 33kV systems needs to be considered for Tm derivation.Engineering Recommendation P2/5 proposes times to restore supplies. For
demands less that 1MW this can be the associated repair time of the system. For group demands up to 12MW, most of the demand should be restored within 3 hoursand for group demands between 12MW and 60MW, much of the demand should be
restored within 15 minutes. These times are therefore targets for demand restoration
times. They do not relate to the system response times, and it is suggested that theyshould not be used as a proxy for Tm.

7/28/2019 DG Contribution to network security_R2.pdf
http://slidepdf.com/reader/full/dg-contribution-to-network-securityr2pdf 71/79
ETSU/FES Project K/EL/00287 Extension – Final Report
________________________________________
Page 71 of 79
5.4. Approach to Determine the Effective Generation Capacity
The methodology can be applied to addressing the issue of the effectivecapacity of intermittent generation in the same way that ER P2/5 assesses the circuitcapacity that would result in comparable expected energy lost. ER P2/5 expresses the
effective contribution as a percentage of the rated plant capacity, and then caveats thisin relation to the size and number of units concerned. These reservations reflect the
perception of unacceptable risk related to single sets in particular and to large sizes of sets compared with the average circuit capacities. These issues will still need to beassessed from the results of actual implementation, and no guidance has been offered
within the above methodology as to how these boundaries may be selected. Theapproach recommended is that the characteristics of the unacceptable extremes
outlined in ER P2/5 are studied using the above methodology and the results of this
overlaid on the studies to be made for modern plant, intermittent or otherwise.This will require assumptions to be made on the typical circuit configurations
being studied if a standard-type Table 2 of the same level of simplicity as the existingER P2/5 is required.
In any practical situation, the protection and stability of the generation wouldneed to be taken into account. Even if the generation is tripped following a fault, thedeveloped methodology is still applicable for quantifying the security contribution
made by that distributed generation. However it may not be available instantaneously but could still be a contributing factor after a short period of time, such as 1min,
15min, 3hr etc. The current P2/5 permits generation to be considered in this way.
5.5. Format of Specifying Generation Contribution in Updated P2/5
5.5.1. Introduction
There are three main options for consideration. The following text outlinestheir relative strengths and weaknesses, and how the methodology described
previously could be used to develop each option.The first option is a look-up table in the form of the current Table 2 of P2/5.
This would retain the simplistic and practical merits of this approach, but it is likely to
be slightly more complex and extensive in its application than the present table;situations in which there are small numbers of sets, and different types of generation
would be incorporated.The second option is based on families of graphs and/or figures. This is an
expansion of the Table 2 approach. Here a larger range of system design parameterscan be factored into the graphs to reduce the implicit approximations of the tabular approach. Some specific and relevant aspects, such as load shape and atypical
generation patterns may not be accommodated.The third option is a computerised approach based on a spread-sheet
environment. Each situation is then the subject of an individual assessment, but usinga standardised approach to ensure equity of treatment whilst recognising many local
or site-specific parameters. The system planner nevertheless has more inputs to the planning assumptions. This approach may also provide a back-up option to the

7/28/2019 DG Contribution to network security_R2.pdf
http://slidepdf.com/reader/full/dg-contribution-to-network-securityr2pdf 72/79
ETSU/FES Project K/EL/00287 Extension – Final Report
________________________________________
Page 72 of 79
previous two approaches in those situations in which it is recognised that the centralassumptions are not credible.
5.5.2. Tabular Approach
This option is similar to that adopted by P2/5. Planners would use a revisedTable 2 (or maybe one of several tables) to assess the capabilities of the distributed
generation. It is possible that the tabulation would provide different valuations for different types or classifications of generation. The tabulation would then allow the
assessment of contributions for each group of generation of the same type.The treatment of different types of generation within a demand group is seen
to be the subject of testing and assessment during the next implementation phase (see
Section 5.5.5).It is envisaged that the tabulation would apply nationally and that there would
be no regional variations. There are merits in a standardised approach, mainly in thesimplicity and expediency of the system planning process.
The formulation of the tabulation would draw on the results of many studies of typical arrangements of generation, circuit topology and demand. In these studies,central assumptions on the values of Tm (if necessary) and load shape would be
adopted. The results of the studies would then be codified in as simple a manner as possible.
This “Table 2” approach would be supported by guidance on what to do to
recognise exceptional circumstances (e.g. where the central assumptions are notcredible) and in these cases, then recommend one of the following approaches.
The main strengths of this approach are:-
• familiarity of the approach to system planners;
• simplicity, and its associated economy of effort;
• the advantage of only reverting to more detailed analysis when needed.
There is an implicit degree of approximation in this approach, and itsacceptability can only be assessed quantitatively through further implementation
studies. The approach was acceptable under the situations of the original P2/5environment. The methodology permits assessment and therefore tabulation of
capabilities of single and small number of relatively large sets but this impact onmateriality may be the subject of further consideration at the implementation stage.
5.5.3. Graphs and Figures Approach
This option would assess the contribution from distributed generation using aset or family of graphs and figures. These would take, as basic variables, the set sizes,generation types or classifications, the demand size and number of circuits supplying
the demand group. The graphs could also consider a family of standard load shapesand any other relevant system parameter. It follows therefore that these are similar in
concept and application to the look-up table approach described above. The essentialdifference is that families of graphs contain continuous information and could includemore extensive data.
The information plotted in these graphs would be obtained in exactly the sameway as the above look-up table. Therefore, the ir formulation would draw on the
results of many studies of typical arrangement of generation, circuit topology anddemand, including central assumptions on the values of Tm (if necessary) and relevant

7/28/2019 DG Contribution to network security_R2.pdf
http://slidepdf.com/reader/full/dg-contribution-to-network-securityr2pdf 73/79
ETSU/FES Project K/EL/00287 Extension – Final Report
________________________________________
Page 73 of 79
load shapes. The results of the studies would then be plotted in as simple a manner as possible. Again, it is envisaged that the graphs would assume “central” parameters
and would apply nationally. There would be no regional variations.The treatment of different types of generation within one demand group is
again seen to be the subject of testing and assessment during the next implementation
phase (see Section 5.5.5).The strengths of this approach are:-
§ familiarity of the approach to system planners – whilst there is likely to bean increase in the number of look-up graphs or figures, the approach is
very similar to that of the existing security standard;§ its associated economy of effort, especially in dealing with concerns over
small numbers of larger sets;
§ the advantage of only reverting to a more detailed analysis when needed.
Again, there is an implicit degree of approximation in this approach, and itsacceptability can only be assessed quantitatively though further implementation
studies. However, the development of a range of look-up graphs and figures shouldreduce many of the approximations of a simple look-up table(s). However, some site-specific issues, such as differences in load shape, and perhaps notable variations from
the norms of availability or persistence, may not be readily taken into account.
5.5.4. Spread-Sheet Approach
This option provides a standardised computer program approach but
preferably based on a spread-sheet environment. It is envisaged that the methodologyset out in earlier sections of this document would be embedded in a formally approvedstandard analysis package, with the user able to specify a large range of inputs. The
output would be the capability that the generation provides, i.e. the distribution circuitcapacity that results in the same EENS as the generation capacity.
The treatment of different types of generation within one demand group iseasy to accomplish unlike the previous two approaches (see Section 2.6).
The methodology permits complete assessment of the capabilities of single
and small number of relatively large sets. However this impact on materiality may bethe subject of further consideration at the implementation stage. In this respect, a
specific set of rules is the responsibility of the implementation phase of this activity.The great strengths of this approach are that it is able to authoritatively and
objectively assess most situations, and is the only approach that will permit a mixture
of generation sites supplying a particular demand group to be assessed correctly. Theonly weaknesses are that it would require planners to be familiar with the package and
the required data format, may require more data to be sourced and would absorbresources to execute the studies to be undertaken.
5.5.5. Different Types of Generation in One Demand Group
The underlying methodology permits the contribution from a number of generators that are all connected within one demand group to be assessed. However
the first two approaches described above are insufficiently flexible to allow all
possible combinations to be included in a simple look-up process. The third approach

7/28/2019 DG Contribution to network security_R2.pdf
http://slidepdf.com/reader/full/dg-contribution-to-network-securityr2pdf 74/79
ETSU/FES Project K/EL/00287 Extension – Final Report
________________________________________
Page 74 of 79
is the only one that would allow this to be done because each individual systemarrangement could be modelled and analysed.
ER P2/5 allows the contributions from different sites to be additive, but thisdoes not give the true level of system capability. The theory of how this should be
done is described in Section 2.6 and the application of the approach shown in Section
4.1.6.
5.6 Future Activities
It is anticipated that future activities for an update of Table of P2/5 will becarried out in three phases:
(a) Phase 1It is envisaged that this report will be an input to a formal consultation process
to be conducted by WS3 of the TSG. In their preparation to the consultation it isexpected that the WS will develop additional material that would contain a list of
specific points on which views would be invited.
(b) Phase 2
In this phase, a consultation will be carried out on the proposed methodologyand inputs will be collected on a number of specific issues. These will be used todevelop terms of reference and identify the scope and specific tasks for the remaining
work to be performed to produce an updated security standard.
(c) Phase 3In the final phase the work will be carried out in three areas:
(i) resolving issues arising from the consultation
(ii) data analysis and consensus of data usage(iii) application of the methodology and development of an
updated security standard.
The latter two items are likely to involve the following individual aspects:-
I. Data analysis and consensus of data usage
§ Familiarisation. A sensible amount of time is needed to allow consultantswho are not familiar with the methodology and data needs to become
familiar with the proposed data collection and analysis process.
§ Data requests and preparation. In this phase the consultants would drawup a detailed specification of the data that is needed, such that DNOs andother data suppliers can be informed of the structure and depth of
information needed. This would cover such issues as the degree of subdivision of data for, say, demand profiles, generation output profiles
(including site demand), system reliability data and considerations of theresolution and accuracy of data for intermittent sources, particularly windfarm clusters. Liaison with all suppliers will be an important aspect of this
phase to ensure consistency of data collection practices.

7/28/2019 DG Contribution to network security_R2.pdf
http://slidepdf.com/reader/full/dg-contribution-to-network-securityr2pdf 75/79
ETSU/FES Project K/EL/00287 Extension – Final Report
________________________________________
Page 75 of 79
§ Initial discussions and data acquisition. In this phase, discussions withDNOs on the proposed structure and data sourcing would take place. This
is an important phase since it will condition the quality of informationcollected. The process will also kick-off the data collection exercises and
will include liaison with data suppliers, as well as progress chasing.
§ Review of data. In this phase the consultant will analyze the data obtainedfor quality and scope, and will assess the classification and segregation
into typical data sets by types of generation etc. The process will also testthe efficacy of the analysis packages for assessing the filleting of the data
profiles for various Tm requirements.
§ Presentation of proposals on standard data to be employed. This phaseof the work will include the production of an interim report on the
database to be used for the applications of the methodology.
§
Consultation process. In this part of the work, all stakeholders will beconsulted on the final approach to data assessment and collection, whichwill be presented for their sign-on to the approach proposed.
§ Formatting of data in agreed structure. This phase will see the
finalization of the data sets after taking into account the output from theconsultation process.
§ Final report on data to be employed. This phase will provide thedatabases to be transferred to the application packages.
II. Application of the methodology and development of an updated standard
§ Familiarisation. This task would involve familiarisation with thedeveloped methodology for assessing generators’ contribution to network
security. This should include methods for both non-intermittent andintermittent generation technologies.
§ Selection of sample systems. In consultation with DNOs, representativenetworks and generation systems should be selected. These should cover
typical situations for a number of group demand Categories.
§ Coding and testing of analysis package. This aspect would be concernedwith the development of the algorithms and corresponding codes of theanalysis package to enable system studies to be carried out to quantify the
contribution of various generation systems to network security.Comprehensive testing of the package will need to be undertaken to
demonstrate its exactness.
§ Application of analysis methods. In this stage the developed package
would be employed to perform a number of case studies for variousgeneration technologies together with sensitivity studies to quantify the
impact of all selected critical factors, such as number of units, availability,shape of load duration curve, data resolution, Tm, etc.

7/28/2019 DG Contribution to network security_R2.pdf
http://slidepdf.com/reader/full/dg-contribution-to-network-securityr2pdf 76/79
ETSU/FES Project K/EL/00287 Extension – Final Report
________________________________________
Page 76 of 79
§ Presentation of results. An interim report with adequate analysis of the
results obtained should be compiled in this stage. This would be used as a basis for discussions with DNOs, generators, suppliers and other interested
parties.
§ Conversion of results to P2/6 tables or processes. Results obtained from
the analysis will be converted into a set of Tables, Graphs or Processes, asappropriate.
§ Presentation of proposed treatment. This stage of the work will includethe production of an interim report on the updated security standard to be
used in the final consultation process. It may be appropriate to include aseminar to open a subsequent consultation processes.
§ Consultation process. In this part of the work, all stakeholders should be
consulted on the proposed update of present security standards including anew form of Table 2.
§ Final report on analysis. Final report that presents the results of thestudies performed including examples of the application of the updatedsecurity standard in characteristic situations.

7/28/2019 DG Contribution to network security_R2.pdf
http://slidepdf.com/reader/full/dg-contribution-to-network-securityr2pdf 77/79
ETSU/FES Project K/EL/00287 Extension – Final Report
________________________________________
Page 77 of 79
6. Conclusions and Recommendations
6.1 Objectives
This project was conducted in order to develop a methodology that could beused to assess the contribution of distributed generation to security of supply. The
present standard P2/5 for assessing this security was written in the 1970s and clearly
does not reflect present-day generating units nor their mode of operation. Thereforethe specification was to develop an appropriate methodology that would reflect the
attributes of present-day generation but constrained in two very specific respects.Firstly the approach had to be simple, easy to implement and achievable in the veryshort term. Secondly the approach had to be consistent with that used to develop the
generation contributions specified in the present P2/5.
6.2 Proposed Methodology
The proposed methodology determines the capacity of a perfect circuit which,
when substituted for the distributed generation, gives the same level of expectedenergy not supplied (EENS). This capacity is the effective contribution of the
generation system. This approach is identical in concept with that used in developingthe present P2/5, a conclusion confirmed by the results given in the Report, whichreproduce the 67% value specified in Table 2 of P2/5.
The methodology however permits a more extensive set of plant and systemattributes to be considered and reflects modern types of generating units and
operational modes including conventional, CHP and renewable energy units.Specifically the methodology permits the following attributes to be assessed:-
• unit attributes:
♦ number of units
♦ capacity of units
♦ technology of units
• system attributes:
♦ peak load
♦ load profile
♦ multiple generation sites
♦ remote location of generation sites♦ units not available for 24hr in a day
• availability attributes:
♦ technical availability: this relates to whether the plant is in a working
state, i.e. it must not have failed. This aspect reflects the technical upand down states of the generating plant, and has also been referred to
as reliability
♦ energy availability: this relates to whether energy is available to drive
the units, i.e. there must be a source of primary energy, e.g. wind for wind generators, etc. If the primary source of energy to a generator is
un-restricted then consideration of this source can be neglected.
However if there are restrictions or the source is intermittent, then this
7/28/2019 DG Contribution to network security_R2.pdf
http://slidepdf.com/reader/full/dg-contribution-to-network-securityr2pdf 78/79
ETSU/FES Project K/EL/00287 Extension – Final Report
________________________________________
Page 78 of 79
may need to be considered. This has also been referred to as persistence
♦ commercial availability: this relates to whether it is commerciallyavailable, i.e. present-day generating plant is privately owned and
therefore its use for network support may be restricted for commercial
reasons. This has also been referred to as availability• materiality attributes. The methodology is applicable to all generation
sites irrespective of number of units and their capacity, whereas the presentP2/5 has special considerations for one and two units particularly if these
have relatively large capacities. This point is further discussed below.
6.3 Constraints and Restrictions
As stated above, the project was subject to several specified constraints. The
most significant relating to the input of how to develop the methodology was the needto be consistent with the existing P2/5. This restricted the methodology to comparing
the generation with the effective capacity of a perfect circuit and to use EENS as thereliability criterion.
There are alternative approaches and alternative reliability measures against
which the generation could be compared. These aspects are discussed in a companionReport19 written by two of the present authors.
In addition there are several aspects relating to constraints, restrictions andapplications associated with the output of the methodology. These include thefollowing.
The values given by the methodology are similar in concept to the 67% valuequoted in P2/5. This value is essentially an average value representing the average
behaviour of the generating system. In deciding whether a system complies with P2/5,this value is treated in a deterministic sense, i.e. effective capacities are summated andcompared with the requirements specified in P2/5. There is therefore an implicit
assumption that this level of capacity is available at all times of need. It must berecognised that the actual contribution can be greater or less than this assessed level
and therefore P2/5 itself can not, and does not, ensure that a capability is deliverableat the time of need. It can also be recognised that this variability is generally greater with generating units than circuits, and greater with a small number of units than a
large number of units. For this reason, one school of thought suggests that sites with asmall number of units should be treated differently. However it must be recognised
that the approach underpinning the methodology treats all units irrespective of
number and size in an absolutely objective manner. This is completely consistent withthe concepts of P2/5, and permits the actual effective contribution to be calculated,
unlike the present P2/5 which specifies a single value of 67% contribution for all unitsizes and numbers greater than two. Consequently to vary the values given by the
methodology would be to impose a subjective judgement, which is outside of thescope and specification of this present project.
The methodology does not evaluate directly a level of risk as would be
experienced by customers. Instead it establishes a proxy to this by evaluating acapability level which is perceived to be sufficient to minimise the duration of
interruptions if they occur. Indeed this is the principle and philosophy of the present
19“Network Security Standards with Increasing Levels of Embedded Generation”. ETSU Project K/EL/00287.
Final Report by R.N.Allan and G.Strbac, UMIST, 10 August 2002.

7/28/2019 DG Contribution to network security_R2.pdf
http://slidepdf.com/reader/full/dg-contribution-to-network-securityr2pdf 79/79
ETSU/FES Project K/EL/00287 Extension – Final Report
________________________________________
P2/5. It should be noted that the inherent risk is unaffected by the methodology.Therefore, given that EENS is the criterion for assessing the contribution of
generation to network security, the inherent risk to loss of supply will be no greater than that assessed by the present P2/5. It is probably worth noting however that, if
sections of the system, including generation and/or other transfer capacity, are ignored
in determining whether the system is P2/5 compliant, then the actual capability of thesystem would be greater and in excess of P2/5 requirements, and the inherent risk
would be lower. This is a consequence of the assessment procedure, not themethodology.
In any practical situation, the protection and stability of the generation wouldneed to be taken into account. This is outside the scope and specification of this
project, and is also outside the explicit scope of P2/5. However, even if the generation
is tripped following a fault, the developed methodology is still applicable for quantifying the security contribution made by that distributed generation. This may
not be available instantaneously because of the time to restore the generation butcould still be a contributing factor after a short period of time, such as 1min, 15min,
3hr, etc. This is again consistent with the current P2/5, which permits generation to beconsidered in this way.
6.4 Implementation
There are three main ways of implementing the methodology:-
§ The first option is a look-up table in the form of the current Table 2 of P2/5. This would retain the simplistic and practical merits of this approach,
but it is likely to be slightly more complex and extensive in its applicationthan the present table.
§ The second option is based on families of graphs and/or figures. Here a
larger range of system design parameters can be factored into the graphs toreduce the implicit approximations of the tabular approach.
§ The third option is a computerised approach based on a spread-sheetenvironment. Each situa tion is then the subject of an individualassessment, but using a standardised approach to ensure equity of
treatment whilst recognising many local or site-specific parameters. It isonly this approach that can assess all specific attributes pertaining to
specific situations including the ability to assess different generationtechnologies on the same site and multiple generation sites feeding thesame load group.