Embed Size (px)
Citation preview

DHII Volume 16, April 2018
Journal by the Department of MBA, MCA & M.Com (FA), Jyoti Nivas College Autonomous i
DHII Volume 16, April 2018
Journal by the Department of MBA, MCA & M.Com (FA), Jyoti Nivas College Autonomous i
DHII
Volume XVI April 2018
Jyoti Nivas College AutonomousPost Graduate Centre
Hosur Road, Bangalore - 95www.jyotinivas.org
A Journal by the Department of MBA, MCA and M.Com (FA)

ii Journal by the Department of MBA, MCA & M.Com (FA), Jyoti Nivas College Autonomous
DHII Volume 16, April 2018
ii Journal by the Department of MBA, MCA & M.Com (FA), Jyoti Nivas College Autonomous
DHII Volume 16, April 2018

DHII Volume 16, April 2018
Journal by the Department of MBA, MCA & M.Com (FA), Jyoti Nivas College Autonomous i
DHII Volume 16, April 2018
Journal by the Department of MBA, MCA & M.Com (FA), Jyoti Nivas College Autonomous i
Message
Eff ecti ve people are not problem-minded; they are opportunity-minded. They feed opportuniti es and starve
problems.
-Dr. Stephen Covey
It gives me immense pleasure to present to you the sixteenth issue of the Research journal - ‘Dhii’ April 2018. It is a journal by the students of MBA/MCA/M.COM (FA) that has both internal and external expert reviewer teams. The journal publishes articles on current research in the areas of Finance, Marketing, Human Resource and Information Technology.Thisissuehasfifteenarticles.
The time spent at the Masters Degree must make a difference. In a way it is a stepping-stone to a different life altogether. Since, this is the ideal time for study and teaching learning thrives in an ambience wherein new knowledge is created, the course has been planned carefully to enable the students for further academic pursuits.
Encouraging students at their master’s degree level to develop an interestinresearchisthefirststepincreatingacultureofresearch.To make research a part of their curriculum, to start early to generate the interest in the young academicians is the purpose of this journal.
In theirfinalyear, thestudentshave theopportunity toworkonaresearch project in an area of their choice, under the guidance of one of the faculty members. This is to encourage independent study in the students giving them an opportunity to engage with research
i

ii Journal by the Department of MBA, MCA & M.Com (FA), Jyoti Nivas College Autonomous
DHII Volume 16, April 2018
ii Journal by the Department of MBA, MCA & M.Com (FA), Jyoti Nivas College Autonomous
DHII Volume 16, April 2018
and prepare them for higher levels of academia. The work that they put in towards the compilation and release of these journals, which they incidentally contribute articles to as well as edit, teaches them valuable lessons on research.
While ‘Dhii’ hones the research skills in the students, it challenges the staff to keep abreast with the latest areas of research which in turn helps improve the quality of their teaching.
My sincere appreciation goes to our student contributors, who worked with ease, enthusiasm and joy. I thank my dear staff, who journeyed with our students and worked towards successful release of the sixteenth issue. Congratulations to the staff and students of MBA/MCA/M.COM (FA).
In our constant striving for excellence, we continue to march ahead keeping in mind the college motto‘Let Your Light Shine’.
God Bless You
Dr. Sr. Lalitha ThomasDirector, Post Graduate CentreJyoti Nivas College Autonomous
ii

DHII Volume 16, April 2018
Journal by the Department of MBA, MCA & M.Com (FA), Jyoti Nivas College Autonomous iii
DHII Volume 16, April 2018
Journal by the Department of MBA, MCA & M.Com (FA), Jyoti Nivas College Autonomous iii
Names of the Reviewers
Section I – MCA
External Reviewer
• Ms. Dharani G, Assistant Professor, Department of Computer Science, CMRIT,Bangalore
Internal Reviewer
• Ms. Irene Getzi, Head of the Dept, Department of MCA, Jyoti Nivas College, Bangalore.
• Mr. Rajesh, Assistant Professor, Department of MCA, Jyoti Nivas College, Bangalore.
• Dr. Shilpa Abhang, Assistant Professor, Department of MCA, Jyoti Nivas College, Bangalore.
• Ms. Swarnamugi, Assistant Professor, Department of MCA, Jyoti Nivas College, Bangalore.
• Ms. Senthil Vadivu, Assistant Professor, Department of MCA, Jyoti Nivas College, Bangalore.
Section II – MBA
External Reviewer
• Mr. Fernando Ajay Clyton. Major Account Manager, Canon Ltd., Bangalore
• Mr. Nagarajan KHead- Compensation, Societte General, Bangalore
• Mr. Jagadeesh Chandra,AVP, Societte General, Bangalore
iii

iv Journal by the Department of MBA, MCA & M.Com (FA), Jyoti Nivas College Autonomous
DHII Volume 16, April 2018
iv Journal by the Department of MBA, MCA & M.Com (FA), Jyoti Nivas College Autonomous
DHII Volume 16, April 2018
iv
Internal Reviewer
• Dr. B.Percy Bose, Assistant Professor, Department of MBA, Jyoti Nivas College
• Dr. Neha Shukla, Assistant Professor, Department of MBA, Jyoti Nivas College.
Section III – M.Com (FA)
External Reviewers
• Mr. Chandrashekar S, Project Analyst at Unisys India Pvt. Ltd, Bangalore
• Mr. Peeyush Surana, Senior Financial Analyst, HP Computing and Private Systems India.
Internal Reviewers
• Dr. B.Percy Bose, Head, Department of MBA, Jyoti Nivas College, Bangalore.
• Dr. Jahnavi M, Department of M.Com (FA), Jyoti Nivas College.
DHII Volume 16, April 2018
Journal by the Department of MBA, MCA & M.Com (FA), Jyoti Nivas College Autonomous v
DHII Volume 16, April 2018
Journal by the Department of MBA, MCA & M.Com (FA), Jyoti Nivas College Autonomous v
DHIIJOURNAL OF THE MBA, MCA AND M.COM (FA)
DEPARTMENT, JYOTI NIVAS COLLEGE AUTONOMOUS
Volume XVI April 2018
SECTION I (MCA)
1 IdentificationofDiabeticRetinopathy 3 ~ Asma Farheen, ~Karima S
2 RestorationofDamagedMural 13 ~Shiny Elizabeth, ~Kadkol Sai Jyoti
3 SizeandColorDetectionofSmartphoneImagesof Chronic Wounds for Healthcare Applications 19 ~Angel Christina, Soumya P H
4 Handwriting Recognition 27 ~H Srinavya B, Raksha
5 Quality Analysis and Grading of Rice GrainImages 35~J Megha, Shweta D. G
SECTION II (MBA)
1 Work Life Balance of Female Nurses at Narayana Health Centre 47~Akhila
2 Comprehensive Study on PerformanceAppraisal at Air India 59~ Anusha Vijay
v

vi Journal by the Department of MBA, MCA & M.Com (FA), Jyoti Nivas College Autonomous
DHII Volume 16, April 2018
vi Journal by the Department of MBA, MCA & M.Com (FA), Jyoti Nivas College Autonomous
DHII Volume 16, April 2018
3 AStudyon“EmployeeSatisfactionRelatingto Performance Appraisal System” at Redeem Software Private Limited, Bangalore 71~ Tasmiya Mari
4 A Study on The Engagement Level of EmployeesatGreytipSoftwarePvt.Ltd 83~ Saba Anjum
5 A Study on Portfolio Management 91~ Quazia Badr
SECTION III(M.COM(FA))
1 Working Capital Management at Fourenn Apparels Limited 107~Chettiar Kavya Ravi
2 Analysis of The Indian Stock Market andIt’s Performance 121~Janhavi.S
3 ImpactofMergeronWorkingCapitalManagement 131~ Swetha P
4 Performance Evaluation of Mutual Funds on Selective Bond 145~ Tara
5 Performance Analysis of Pharmaceutical Sector in India with Reference to LKP Securities, Bangalore 157~ Vinaya Kumari
vi

DHII Volume 16, April 2018
Journal by the Department of MBA, MCA & M.Com (FA), Jyoti Nivas College Autonomous vii
DHII Volume 16, April 2018
Journal by the Department of MBA, MCA & M.Com (FA), Jyoti Nivas College Autonomous vii
SECTION I (MCA)

viii Journal by the Department of MBA, MCA & M.Com (FA), Jyoti Nivas College Autonomous
DHII Volume 16, April 2018
viii Journal by the Department of MBA, MCA & M.Com (FA), Jyoti Nivas College Autonomous
DHII Volume 16, April 2018

DHII Volume 16, April 2018
Journal by the Department of MBA, MCA & M.Com (FA), Jyoti Nivas College Autonomous 1
DHII Volume 16, April 2018
Journal by the Department of MBA, MCA & M.Com (FA), Jyoti Nivas College Autonomous 1
Foreword‘Defi niteness of purpose is the starting point of all achievement’
– W. Clement Stone
The purpose of this journal is to foster and reward the scholarly eff orts of our students as well as to provide a valuable learning experience. The fi rst section of April 2018 edition of ‘DHII’ showcases 5 outstanding research papers from the fi eld of computer science focusing the active areas of research namely neural networks, image processing and text recognition.
The fi rst paper of Dhii is based on Identifi cation of Diabetic Retinopathy.
Diabetic Retinopathy is one of the most common diabetic diseases that are caused by changes in the blood vessels of the retina. In some people with diabetic retinopathy, blood vessels may swell and leak fl uid. In some other people, abnormal blood vessels may grow on surface of retina. Diabetic retinopathy is one of the complications caused by diabetes. As indicated by the name, diabetic retinopathy appears in the retina, which is the tissue responsible for vision in the eye. Since diabetic retinopathy causes changes in the eye, the disease may aff ect the vision. Diabetic Retinothearpy in-patient can be identifi ed with the help of one of the Digital Image Processing algorithms-K-Means Clustering algorithm
The second paper of Dhii focuses on restoration of damaged mural. Many Mural paintings, especially old ones, suff er from breaks in the substrate, the paint, or the varnish. These patterns are usually called cracks and be caused by aging, drying and mechanical factors. The appearance of cracks on painting deteriorates the perceived paintings quality. One can use digital image processing techniques to detect and eliminate the cracks on the digitized paintings. The main objective of this study is to present the digital image processing technique that can be applied to the virtual restoration of artistic paintings, which serves many purposes. The methods implemented on this paper are based on studying the digital image processing technique used for cracks identifi cation and removal.

2 Journal by the Department of MBA, MCA & M.Com (FA), Jyoti Nivas College Autonomous
DHII Volume 16, April 2018
2 Journal by the Department of MBA, MCA & M.Com (FA), Jyoti Nivas College Autonomous
DHII Volume 16, April 2018
The third paper is based on MHealth. MHealth (also written as m-health) is an abbreviation for mobile health, a term used for the practice of medicine and public health supported by mobile devices. The mobile app is part of the rapidly growing fi eld of mobile health. The mobile app replaces paper-based documentation in a healthcare facility with an electronic record. The mHealth fi eld operates on the premise that technology integration within the health sector has the great potential to promote a better health communication to achieve healthy lifestyles, improve decision-making by health professionals and enhance healthcare quality by improving access to medical and health information and facilitating instantaneous communication in places where this was not previously possible. It follows that the increased use of technology can help reduce health care costs by improving effi ciencies in the health care system. This paper concerns developing health care apps for detecting size and color of wounds of a pressure ulcer.
The fourth paper is based on “Handwriting Recognition”. Handwriting Recognition is considered as one of the most important techniques in neural network research. Neural Networks are being used for handwriting recognition from last many years. This paper presents creating the Handwriting Recognition System in which Creating a Character Matrix and a corresponding suitable Network Structure is key. We have attempted to recognize handwritten English characters by using a multilayer perception with one hidden layer.
The fi fth paper is based on checking the quality of food grains using image-processing technique. The quality of the food grain we consume is of more importance, as people are becoming educated their demand for quality of grains is increasing. There is possibility of adulteration of food grains by the traders. Generally, the quality assessment is carried by visual inspection, which is manual process. In this work, an image processing technique is used as an attempt to automate the process, which overcomes the drawbacks of manual process. This paper provides the quality assessment of rice grains based on its size. Based on the size the grains are graded as (grade 1, grade 2 and grade3). Here we considered diff erent varieties of rice grains for testing like Basmati, boiled rice, egg rice etc. The system is developed using 105 set of images and are classifi ed using decision tree based classifi cation technique. The results are found to be encouraging.
Dr. Shilpa AbhangAssistant Professor, Department of MCAJyoti Nivas College Autonomous

DHII Volume 16, April 2018
Journal by the Department of MBA, MCA & M.Com (FA), Jyoti Nivas College Autonomous 3
DHII Volume 16, April 2018
Journal by the Department of MBA, MCA & M.Com (FA), Jyoti Nivas College Autonomous 3
IDENTIFICATION OF DIABETIC RETINOPATHY
~Asma Farheen, Karima S
Abstract
Diabetic Retinopathy is one of the most common diabetic diseases that are caused by changes in the blood vessels of the retina. In some people with diabetic retinopathy, blood vessels may swell and leak fl uid. In some other people abnormal blood vessels may grow on surface of retina. Diabetic retinopathy is one of the complications caused by diabetes. As indicated by the name, diabetic retinopathy appears in the retina, which is the tissue responsible for vision in the eye. Since diabetic retinopathy causes changes in the eye, the disease may aff ect the vision. It can be detected with the help of K-Means Algorithm in Digital Image Processing
1. INTRODUCTION
Diabetic retinopathy is an eye disease, which has been caused due to high blood sugar level. In early days many people facing the Diabetic retinopathy problem. Diabetic retinopathy damage to the retina caused by complications of diabetes, which can eventually lead to blindness. There are three main type of retinopathy. First is Background Retinopathy second is Pre-proliferative Retinopathy and third one is Proliferative Retinopathy.
Small red dots will appear on retina due to tiny swellings in the blood vesselwalls.Ifyouhavebeendiabetic30years,evenwiththebest
DHIIVol. XVI, April 2018
Journal, Dept. of MBA, MCA and M.Com (FA) Jyoti Nivas College Autonomous

4 Journal by the Department of MBA, MCA & MFA, Jyoti Nivas College Autonomous
control, these may develop. But most people who have background retinopathy have not been diabetic that long, and need better control as per these targets. BDR consists of:
• Microaneurisms: these are usually the earliest visible change in retinopathy seen on exam with an ophthalmoscope as scattered red spots in the retina where tiny, weakened blood vessels have ballooned out.
• Hemorrhages: bleeding occurs from damaged blood vessels into the retinal layers. This will not affect vision unless the bleeding occurs in or near the Macula.
• Hard Exudates: caused by proteins and lipids from the blood leaking into the retina through damaged blood vessels. They appear on the ophthalmoscope as hard white or yellow areas, sometimes in a ring like structure around leaking capillaries. Again vision is not affected unless the macula is involved.
2. PROPOSED ALGORITHM
The purpose of this design document is to explore the logical view ofarchitecturedesign, sequencediagram,dataflowdiagram,userinterface design of the software for performing the operations such as pre-processing, extracting features and classifying the exudates.
The scope of this design document is to achieve the features of the system such as pre-process the images, feature extraction, segmentation and classifying the exudates.
3. TECHNIQUES:
Pre-processing.
Segmentation.
Feature Extraction.
Classificationofexudates.
Journal by the Department of MBA, MCA & MFA, Jyoti Nivas College Autonomous 5
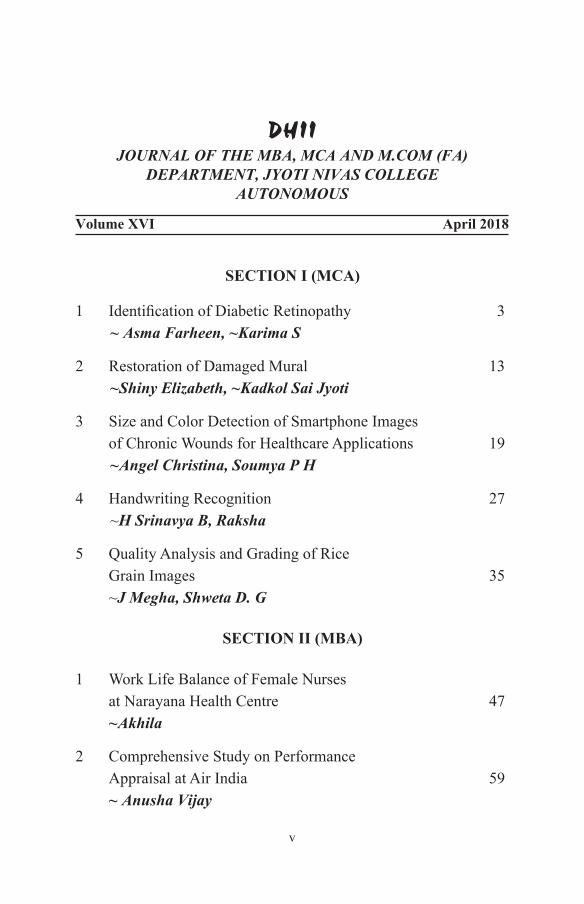
Block Diagram and Algorithm
The proposed methodology uses some techniques to remove the background noise, and features extraction to detect and classify the exudates.
Block Diagram of a proposed system
Pre-processing
The pre-processing is a series of operations performed on scanned input image. It essentially enhances the image rendering it suitable for segmentation. The role of pre- processing is to segment the interesting patternfromthebackground.Generally,noisefiltering,smoothingandnormalizationshouldbedoneinthisstep.Thepre-processingalsodefinesacompactrepresentationofthepattern.Binarizationprocessconverts a gray scale image into a binary image.
6 Journal by the Department of MBA, MCA & M.Com (FA), Jyoti Nivas College Autonomous
DHII Volume 16, April 2018
6 Journal by the Department of MBA, MCA & M.Com (FA), Jyoti Nivas College Autonomous
DHII Volume 16, April 2018
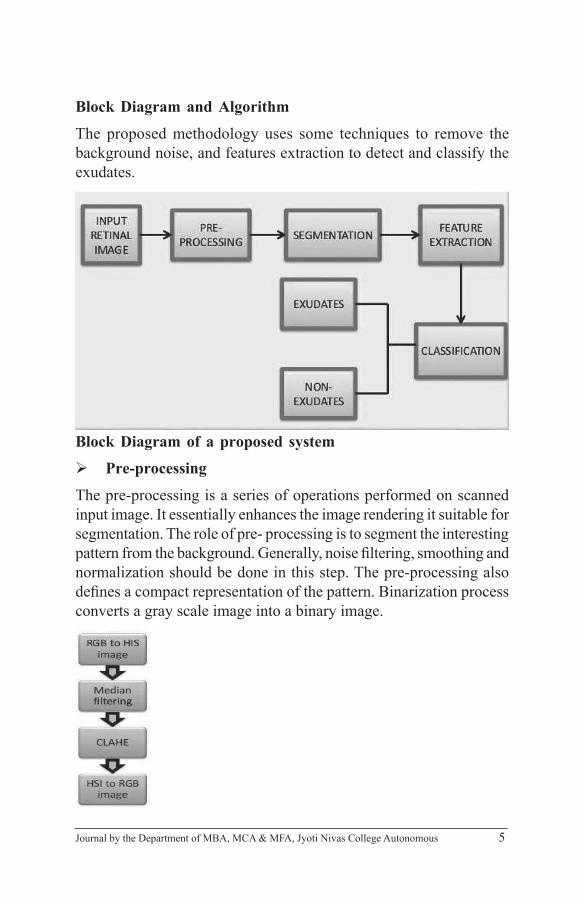
Steps in pre-processing
Image Segmentation
Image segmentation is one of the mostly used methods to classify the pixels of an image correctly in a decision-oriented application. It divides an image into a number of discrete regions such that the pixels have high similarity in each region and high contrast between regions.Itisavaluabletoolinmanyfieldincludinghealthcare,imageprocessing,trafficimage,patternrecognitionetc.Therearedifferenttechniques for image segmentation like threshold based, edge based, cluster based, neural network based.
Fromthedifferent technique,oneof themostefficientmethods isthe clustering method. Again, there are different types of clustering: K-meansclustering,FuzzyC-meansclustering,mountainclusteringmethod and subtractive clustering method
Feature Extraction
On the basis of color and texture orientation, features are extracted using GLCM. The features were extracted using Gabor and GLCM feature extraction methods. These methods give the information about texture of the image based on shapes of the objects in the images. Gaborfilterisadirectfilterusedforedgedetection.Inthisproposedmethod they were extracting 24 features which include mean, variance andstandarddeviationatdifferentorientationbyusinggaborfilter.A gray level co-occurrence matrix (GLCM) contains information about the position of pixels having similar gray level values. They were extracting 12 different statistical features like dissimilarity,

DHII Volume 16, April 2018
Journal by the Department of MBA, MCA & M.Com (FA), Jyoti Nivas College Autonomous 7
DHII Volume 16, April 2018
Journal by the Department of MBA, MCA & M.Com (FA), Jyoti Nivas College Autonomous 7
contrast, correlation, cluster, prominence, cluster shade, energy, entropy, homogeneity, and maximum probability, sum of square, auto correlation, and inverse different moment.
Classifi cation
Thefinal step isclassificationofgiven inputasexudates (or)non-exudatesbynaïvebayesclassifier.
K-means Algorithm:
Step 1: ReadtheRGBImageavailableforclassification.
Step 2: Convert available image from RGB color space to L*a*b* color Space
Step 3: Classify the colors in ‘a*b*’ space using K-means clustering algorithm
Step 4: Label every pixel of the image using the results from K-means algorithm
Step 5: Create images that segment the image by color.
4. RESULTS & DISCUSSIONS.
Applying the above techniques in the sampled lot of input images and the exudates of the eye are extracted. To extract the exudates over the time, this example uses k-means algorithm.
8 Journal by the Department of MBA, MCA & M.Com (FA), Jyoti Nivas College Autonomous
DHII Volume 16, April 2018
8 Journal by the Department of MBA, MCA & M.Com (FA), Jyoti Nivas College Autonomous
DHII Volume 16, April 2018
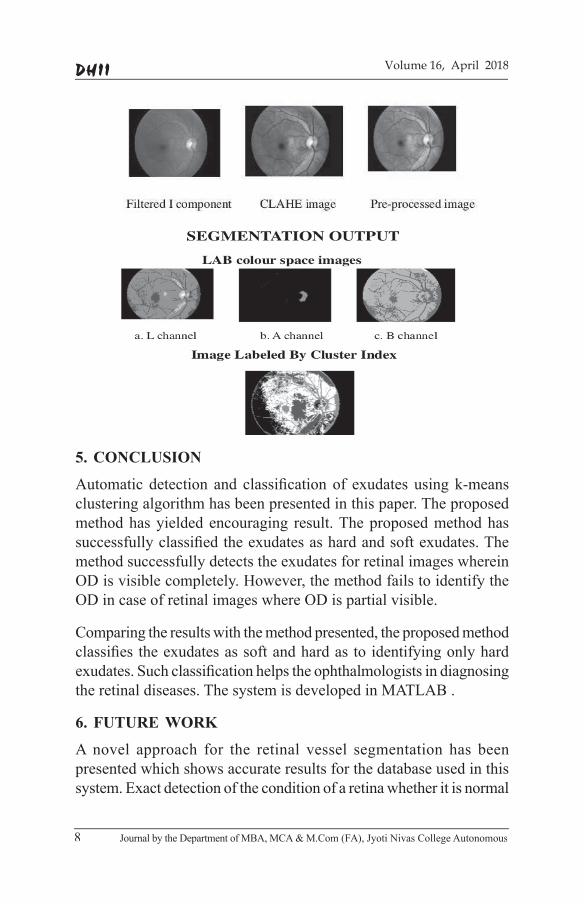
5. CONCLUSION
Automatic detection and classificationof exudates usingk-meansclustering algorithm has been presented in this paper. The proposed method has yielded encouraging result. The proposed method has successfullyclassifiedtheexudatesashardandsoftexudates.Themethod successfully detects the exudates for retinal images wherein OD is visible completely. However, the method fails to identify the OD in case of retinal images where OD is partial visible.
Comparing the results with the method presented, the proposed method classifiestheexudatesassoftandhardastoidentifyingonlyhardexudates.Suchclassificationhelpstheophthalmologistsindiagnosingthe retinal diseases. The system is developed in MATLAB .
6. FUTURE WORK
A novel approach for the retinal vessel segmentation has been presented which shows accurate results for the database used in this system. Exact detection of the condition of a retina whether it is normal

DHII Volume 16, April 2018
Journal by the Department of MBA, MCA & M.Com (FA), Jyoti Nivas College Autonomous 9
DHII Volume 16, April 2018
Journal by the Department of MBA, MCA & M.Com (FA), Jyoti Nivas College Autonomous 9
or abnormal was determined successfully. Regarding the high ability of CLAHE for retinal image contrast improvement and prepared better for segmentation step. Because of the high sensitivity of structure elements to the edges in all directions, blood vessel edges ware detected successfully by using the structure elements morphology.
Our future work is to replace the simple threshold method with a more proper approach in order to increase the accuracy of this method and deal with the problem of the presence of severe lesions in retinal fundus images.
Detection of Micro-aneurysm and maculopathy be predicted and performance can be compared.
REFERENCES
[1] Abdel-Ghafara, R.A.T., Morrisa, T. Ritchingsb, I. and Woods, “DetectionandCharacterisationoftheOpticDiskinGlaucomaand Diabetic Retinopathy”, Proceedings of the International ConferenceonMedicalImage,Vol.32,No.1,pp.19-25,2004.
[2] AbrahamChandyD.andVijayaKumariV.“GeneticAlgorithmBased Location of Optic Disc in Retinal Images”, Academic Open Internet Journal, ISSN1311-4360,Vol. 17,Part 6/P5,2006.
[3] AdamHoover andMichaelGoldbaum, “Locating theOpticNerveinaRetinalImageUsingtheFuzzyConvergenceoftheBlood Vessels” IEEE Transactions on Medical Imaging, Vol. 22,No.8,pp.951-959,2003.
[4] AhmedWasifReza,Eswaran,C.andSubhasHati,“AutomaticTracing of Optic Disc and Exudates from Color Fundus Images Using Fixed and Variable Thresholds”, Journal of Medical System,Vol.33,No.1,pp.73-80,2008.
[5] Akara Sopharak, Bunyarit Uyyanonvara and Sarah Barman, “Automatic ExudatesDetection from non-dilated diabeticretinopathy retinal imageusingFuzzyC-means clustering”,sensors,Vol.9,No.3,pp.2148-2161,2009.
[6] AkaraSopharak,BunyaritUyyanonvara,“AutomaticExudates

10 Journal by the Department of MBA, MCA & M.Com (FA), Jyoti Nivas College Autonomous
DHII Volume 16, April 2018
10 Journal by the Department of MBA, MCA & M.Com (FA), Jyoti Nivas College Autonomous
DHII Volume 16, April 2018
Detection from Diabetic Retinopathy Retinal Image Using FuzzyC-meansandMorphologicalmethods”Proceedingsofthe International Conference on Advances in Computer Science andTechnology,April2-4,2007,Phuket,Thailand,pp.359-364,2007.
[7] Alan D.F., Sam P., Goatman, K., Graeme, J.W., John, A.O. andPeter,F.S.,“Automateddetectionofexudatesfordiabeticretinopathy screening”, Physics in Medicine and Biology, Vol.52,No.24,pp.7385-7396,2007.
[8] Alireza,Osareh,Mirmehdi,M.,Thomas,B. andMarkham,R.“ComparisonofcolourspacesforopticdiscLocalizationin Retinal Images”, Proceedings of the 16th International Conference on Pattern Recognition, IEEE. Computer Society, Vol.1,pp.743-746,2002.
[9] AlirezaOsareh,MajidMirmehdi,BariThomas,andRichardMarkham,“Automatedidentificationofdiabeticretinalexudatesin digital colour images,” British Journal of Ophthalmology, Vol.87,pp.1220-1223,2003.
[10] Clara,I.,Sánchez,R.,Hornero,Maria,I.,Lopez,J.andPoza,“Retinal ImageAnalysis toDetect andQuantify LesionsAssociated with Diabetic Retinopathy”, Proceedings of the 26th Annual International Conference of the IEEE EMBS, pp. 1624-1627, 2004.
[11] Cree, M., Luckie, M., Jelinek, H.F., Cesar, R., Leandro, J., McQueline,C.andMitchell,P.“Identificationandfollowupofdiabetic retinopathy in rural health in Australia: an automated screening model”, In AVRO Frot Lauderdale, Vol. 45, E-abstract 5245, 2004.
[12] Fong, D.S., Aiello, L., Gardner, T.W, King, G.L, Blankenship, G.,Cavallerano, J.D., Ferris, F.L. andKlein,R. “Diabeticretinopathy.DiabetesCare”,Vol.26,pp.226-229,2003.

DHII Volume 16, April 2018
Journal by the Department of MBA, MCA & M.Com (FA), Jyoti Nivas College Autonomous 11
DHII Volume 16, April 2018
Journal by the Department of MBA, MCA & M.Com (FA), Jyoti Nivas College Autonomous 11
DHIIVol. XVI, April 2018
Journal, Dept. of MBA, MCA and M.Com (FA) Jyoti Nivas College Autonomous
RESTORATION OF DAMAGED MURAL
~Shiny Elizabeth, Kadkol Sai Jyoti
Abstract
Many Mural paintings, especially old ones, suff er from breaks in the substrate, the paint, or the varnish. These patterns are usually called cracks and be caused by aging, drying and mechanical factors. The appearance of cracks on painting deteriorates the perceived paintings quality. One can use digital image processing techniques to detect and eliminate the cracks on the digitized paintings. The main objective of this study is to present the digital image processing technique that can be applied to the virtual restoration of artistic paintings which serves many purposes. The methods implemented on this paper are based on studying the digital image processing technique used for cracks identifi cation and removal.
1. INTRODUCTION
Manualrecordinganddetectionofagingseemlessefficient,giventhe increasing number of collections and electronic based approaches seems to be the best choice. Different types of materials are used for paintings and frames. For this use varnish, paint, glue, canvas, wood, metal, gilding and plaster. When both are used then it produces complex structure which can be easily damaged if knocked or dropped. Materials are damaged by different surrounding materials and they are sensitive too. In addition, when there is a change in environmental

12 Journal by the Department of MBA, MCA & M.Com (FA), Jyoti Nivas College Autonomous
DHII Volume 16, April 2018
12 Journal by the Department of MBA, MCA & M.Com (FA), Jyoti Nivas College Autonomous
DHII Volume 16, April 2018
conditions then they also produce changes in the paintings and frames. Light and dirt also produce change in images. Many paintings, especially old ones, suffer from breaks in the substrate, the paint, or the varnish. These patterns are usually called cracks or craquelure. Age cracks can result from non-uniform contraction in the canvas or wood-panel support of the painting, which stresses the layers of the painting. The appearance of cracks on paintings deteriorates the perceived image quality. So solution for this one can use digital image processing technique can be used in this process. Old paintings are cultural assets for country which can be preserved by computer-aided analysis and processing. Digital image processing techniques used to detectandeliminatethecracksondigitizedpaintings.Sothistypeofprocessing images are used in museum, provide clues to art historians, and the general public on how the painting would look like in its initial state, i.e., without the cracks.
2. TECHNOLOGY
The technology currently used for conducting a virtual autopsy comprises of:
• Patch-based techniques:-A patch-based anisotropic diffusion techniques combined with a novel high-frequency generating technique that can enhance line/brush strokes is also proposed.
• Morphological algorithm:-morphological algorithm detects only the cracks and missing area in the wall painting image, contour shape based methods are work only the limited number of fragments, top hat transform technique only detect the cracks which are removed by training the neural network throughMRBFbut it is very difficult and time consumingtask.
• Texture generation scheme:-texture generation scheme and HF enhancing, It would help artist to do the restoration process very quickly and amateur people can also restore efficientlyastheuserneedstoselectonlysomesourceandtarget windows where the texture is to be generated

DHII Volume 16, April 2018
Journal by the Department of MBA, MCA & M.Com (FA), Jyoti Nivas College Autonomous 13
DHII Volume 16, April 2018
Journal by the Department of MBA, MCA & M.Com (FA), Jyoti Nivas College Autonomous 13
• K-means clustering:-The algorithm consists of four major steps as described in the paper. A new line detection and extraction technique using correlation followed by convolution with different templates is implemented.
• Morphological top-hat transform:-The cracks are detected by thresholding the output of the morphological top-hat transform. Afterward, the thin dark brush strokes which have beenmisidentifiedascracksareremovedusingeitheramedianradial basis function neural network on hue and saturation data or a semi-automatic procedure based on region growing. Finally,crackfillingusingorderstatisticsfiltersorcontrolledanisotropic diffusion is performed.
3. IMPLEMENTATION
The methods implemented on this paper are based on studying the digitalimageprocessingtechniqueusedforcracksidentificationandremoval.
Wechoosea3-stepapproach:
1. Crack Detection
2. CrackClassification
3. Crack Filling
Step 1: Crack Detection: Concept:
Cracks usually have low luminance and thus can be considered as local intensity minima with rather elongated structural characteristics. Therefore, a crack detector can be applied on the luminance component of an image and should be able to identify such minima.
Step 2: Crack Classifi cation:
In some paintings, certain areas exist where brush strokes have almost the same thickness and luminance features as cracks. The hair of a person in a portrait could be such an area. Therefore, the top-hat transform might mis-classify these dark brush strokes as cracks. Thus, in order to avoid any undesirable alterations to the original image, it is
14 Journal by the Department of MBA, MCA & M.Com (FA), Jyoti Nivas College Autonomous
DHII Volume 16, April 2018
14 Journal by the Department of MBA, MCA & M.Com (FA), Jyoti Nivas College Autonomous
DHII Volume 16, April 2018
very important to separate these brush strokes from the actual cracks, beforetheimplementationofthecrackfilling.
Step3:Crack-FillingMethods:
a)UsingModifiedMeanfilterandUsingModifiedMedianfilter:
Themeanfilterisasimplesliding-windowspatialfilterthatreplacesthe center value in the window with the average (mean) of all the pixel values in the window.
Themedianfilterisasimplesliding-windowspatialfilterthatreplacesthe center value in the window with the median value of all the pixel values in the window.
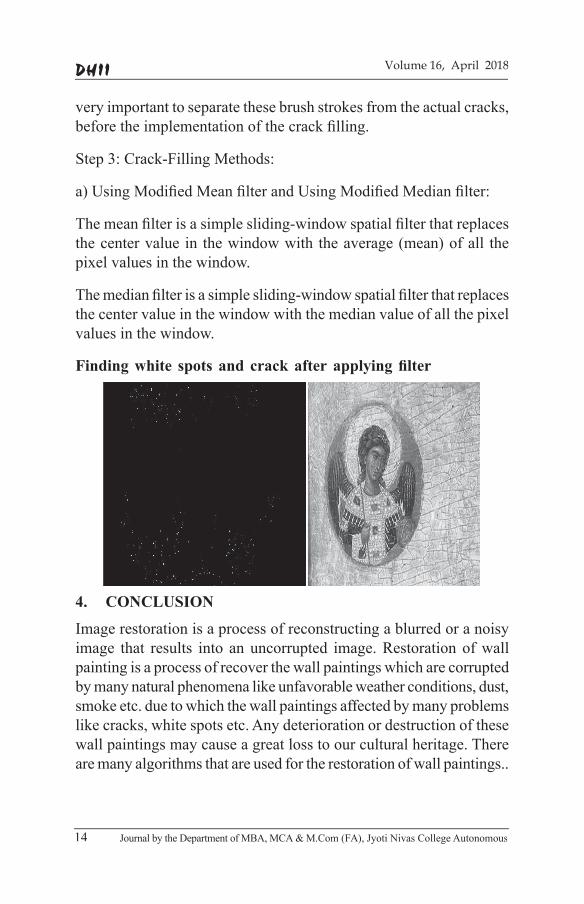
Finding white spots and crack after applying fi lter
4. CONCLUSION
Image restoration is a process of reconstructing a blurred or a noisy image that results into an uncorrupted image. Restoration of wall painting is a process of recover the wall paintings which are corrupted by many natural phenomena like unfavorable weather conditions, dust, smoke etc. due to which the wall paintings affected by many problems like cracks, white spots etc. Any deterioration or destruction of these wall paintings may cause a great loss to our cultural heritage. There are many algorithms that are used for the restoration of wall paintings..

DHII Volume 16, April 2018
Journal by the Department of MBA, MCA & M.Com (FA), Jyoti Nivas College Autonomous 15
DHII Volume 16, April 2018
Journal by the Department of MBA, MCA & M.Com (FA), Jyoti Nivas College Autonomous 15
5. REFERENCES
[1] https://www.isical.ac.in/~vlrg/sites/default/files/Pulak/icvgip2012_template.pdf
[2] http://ieeexplore.ieee.org/document/6754848/?reload=true[3] https://digitalimageprocessingweb.wordpress.com/[4] https://publikationen.unituebingen.de/xmlui/bitstream/
handle/10900/62290/06_Zarifis_CAA_1998.pdf?sequence=2[5] h t t p s : / / w w w. i j e c s . i n / i n d e x . p h p / i j e c s / a r t i c l e /
download/1643/1519/[6] https://dl.acm.org/citation.cfm?id=2425382

16 Journal by the Department of MBA, MCA & M.Com (FA), Jyoti Nivas College Autonomous
DHII Volume 16, April 2018
16 Journal by the Department of MBA, MCA & M.Com (FA), Jyoti Nivas College Autonomous
DHII Volume 16, April 2018

DHII Volume 16, April 2018
Journal by the Department of MBA, MCA & M.Com (FA), Jyoti Nivas College Autonomous 17
DHII Volume 16, April 2018
Journal by the Department of MBA, MCA & M.Com (FA), Jyoti Nivas College Autonomous 17
DHIIVol. XVI, April 2018
Journal, Dept. of MBA, MCA and M.Com (FA) Jyoti Nivas College Autonomous
SIZE AND COLOR DETECTION OF SMARTPHONE IMAGES OF CHRONIC WOUNDS FOR HEALTHCARE APPLICATIONS
~Angel Christina T, Soumya P H
Abstract
MHealth (also written as m-health) is an abbreviation for mobile health, a term used for the practice of medicine and public health supported by mobile devices. The mobile app is part of the rapidly growing fi eld of mobile health. The mobile app replaces paper-based documentation in a healthcare facility with an electronic record. The mHealth fi eld operates on the premise that technology integration within the health sector has the great potential to promote a better health communication to achieve healthy lifestyles, improve decision-making by health professionals and enhance healthcare quality by improving access to medical and health information and facilitating instantaneous communication in places where this was not previously possible. It follows that the increased use of technology can help reduce health care costs by improving effi ciencies in the health care system. This paper concerns developing health care apps for detecting size and color of wounds of a pressure ulcer.

18 Journal by the Department of MBA, MCA & M.Com (FA), Jyoti Nivas College Autonomous
DHII Volume 16, April 2018
18 Journal by the Department of MBA, MCA & M.Com (FA), Jyoti Nivas College Autonomous
DHII Volume 16, April 2018
1. INTRODUCTION
Health Care apps are growing rapidly with latest technologies, which enable users to get access to doctors and medicines easily. This researchpaper“Size and Color Detection of Smartphone Images of Chronic Wounds for Healthcare Applications” is about algorithms usedfordetectingthesizeandcolorofaChronicwoundforhealthcareapps. A wound is an injury that causes a break in the skin. There may also be damage to nearby tissues. Chronic wounds are wounds that do not heal completely in 6 weeks. Examples of wounds that can become chronic are deep ulcers (open sores), large burns, and infected cuts. A chronic wound is a wound that does not heal in an orderly set of stages and does not heal within a predictable amount of time. These wounds occur in places, which cannot be easily seen like foot, back of arm, back of neck etc. Chronic wounds may never heal or may take years to do so. These wounds cause patients severe emotional and physical stressandcreateasignificantfinancialburdenonpatientsand the whole healthcare system. The most common type of chronic wounds are- Arterial ulcers: Venous ulcers: Diabetic ulcers: Pressure ulcer: Measuring of these wounds manually in hospitals causes’ pain as the patient has to travel often to the hospitals and methods used will also cause pain. First the wound will be cleaned with water and tomeasureitssizeforfurtheranalysisliketofindouthowdeepthewound is and in which stage it is methods used are as follows:
Digital Photography
Scanner Capture Approach
Pinch Zoom
Grid Capture
2. BACKGROUND STUDY
Digital Photography in Chronic Wounds
Woundphotographyisrecognizedforitsutilityinthecareofchronicwounds. Wound area calculated from a digital photograph of a wound, either by tracing it with computer software or photographing a manual contact tracing, was demonstrated to be a quicker and more accurate

DHII Volume 16, April 2018
Journal by the Department of MBA, MCA & M.Com (FA), Jyoti Nivas College Autonomous 19
DHII Volume 16, April 2018
Journal by the Department of MBA, MCA & M.Com (FA), Jyoti Nivas College Autonomous 19
method than contact tracing of the wound itself in the cases of venous and diabetic foot ulcers.
Thefirststepindigitalwoundphotographyistoremovealldressingsand cleanse the wound with saline. The entire wound is photographed to include healthy skin, surrounding cellulites, and/or callus. To minimizeerror,thecameralensisorientedparalleltotheplaneofthewound. The photograph is framed by altering the distance between the lensandthewoundorusingthezoomfunctionifpresentandfocusedusingtheauto-focusfeature.Aflashisusedinallsettingstoensureadequate and consistent lighting. Following capture, the photograph canbeviewedonthedigitaldisplayscreen.Onceuploaded,filesareopened in Adobe Photoshop and cropped to remove unwanted footage (e.g., the ruler is beyond the necessary markings, excessive areas of healthy skin, etc), and rotated so that the ruler is along the bottom edgeofthephotograph.Photographsareresizedaccordingtodatabaseand software requirements. Once saved, photographs are opened with Wound Imager 2.0 to determine the area, length, and width. To calibrate these measurements on each individual photograph, the user marks a known length on the ruler and then traces the wound edge around the area of ulceration with the computer mouse. The enclosed areasarefilledautomatically,and theprogramcalculates the totalwound area. Length and width are measured manually on the screen.
Scanner Capture approach
In the existing scanner capture approach, a box with two mirrors inside isplacedat45degreesrelativetothehorizontal,withopeningsforaSmartphoneandanLEDlightsourceandthisconfigurationactsasascannertoscanthewound.Theconfigurationensuresaconstantlight source location and intensity, and a constant known distance is maintained between the camera and the wound, facilitating area calculations. The image capture box will keep a constant distance and willbeknown;hence,theratioofthesizeofthewoundimagewillbe also constant. This method again relies on auxiliary devices (the box and mirror) and will be cumbersome and impractical for wounds on certain parts of the body. As a contact-based design, this method may have less utility when serving as a measurement procedure for a large number of patients.

20 Journal by the Department of MBA, MCA & M.Com (FA), Jyoti Nivas College Autonomous
DHII Volume 16, April 2018
20 Journal by the Department of MBA, MCA & M.Com (FA), Jyoti Nivas College Autonomous
DHII Volume 16, April 2018
Pinch-zoom
This method uses the device itself as a reference and compares it side bysidewiththeobjectingtoachievesizeviaratio.Themethodhashigh mobility; however, accuracy is somewhat user-dependent and notsystematic.Thesamepersondoingthesamesizeestimationwiththe new image may generate variable results.
Grid capture
In the grid capture approach, a transparent double layer lm with a marked grid (1 1cm) is placed on the wound and the wound contour is traced with a black permanent marker, upon which the length and the width can be easily calculated by a Smartphone application. The area of the wound can be calculated by the factor between the grid and thepixel.Theadvantageofthismethodisthatthetransparentfilmisplaced directly on the wound, keeping the traced wound at the near dimensionandorientationastherealwoundunderneath,minimizingdistortion or uncertainty of the wound image area.
3. PROPOSED WORK
GrabCut algorithm was designed by Carsten Rother, Vladimir Kolmogorov & Andrew Blake from Microsoft Research Cambridge, UK in their paper, "GrabCut": interactive foreground extraction using iterated graph cuts .
Startingwithauser-specifiedbounding box around the object to be segmented, the algorithm estimates the color distribution of the target object and that of the background using a Gaussian mixture model. ThisisusedtoconstructaMarkovrandomfieldoverthepixellabels,with an energy function that prefers connected regions having the samelabel,andrunningagraphcutbasedoptimizationtoinfertheirvalues. As this estimate is likely to be more accurate than the original, taken from the bounding box, this two-step procedure is repeated until convergence.
Steps:
1. The user input three things: The foreground, background, and the unknown part of the image that can be either foreground
DHII Volume 16, April 2018
Journal by the Department of MBA, MCA & M.Com (FA), Jyoti Nivas College Autonomous 21
DHII Volume 16, April 2018
Journal by the Department of MBA, MCA & M.Com (FA), Jyoti Nivas College Autonomous 21
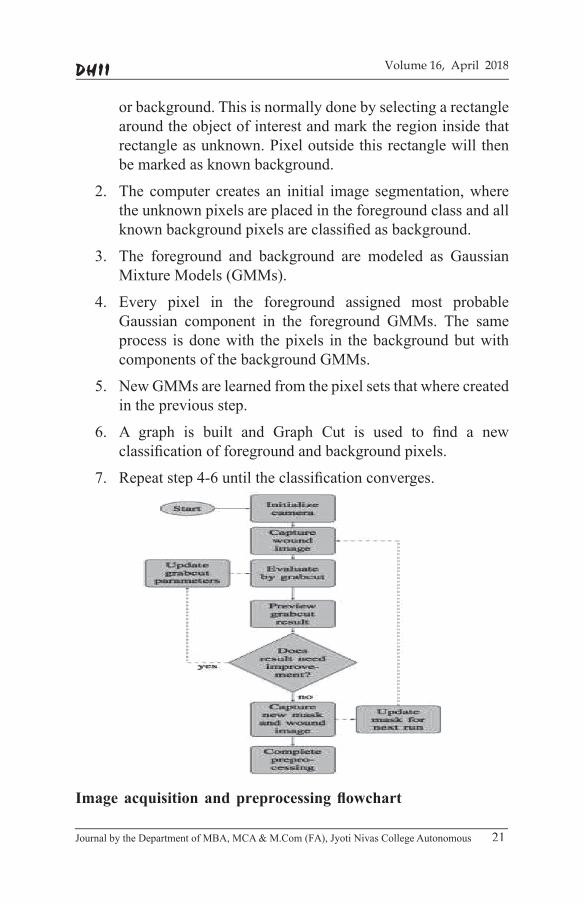
or background. This is normally done by selecting a rectangle around the object of interest and mark the region inside that rectangle as unknown. Pixel outside this rectangle will then be marked as known background.
2. The computer creates an initial image segmentation, where the unknown pixels are placed in the foreground class and all knownbackgroundpixelsareclassifiedasbackground.
3. The foreground and background are modeled as GaussianMixture Models (GMMs).
4. Every pixel in the foreground assigned most probable Gaussian component in the foreground GMMs. The same process is done with the pixels in the background but with components of the background GMMs.
5. New GMMs are learned from the pixel sets that where created in the previous step.
6. A graph is built and Graph Cut is used to find a newclassificationofforegroundandbackgroundpixels.
7. Repeatstep4-6untiltheclassificationconverges.
Image acquisition and preprocessing fl owchart

22 Journal by the Department of MBA, MCA & M.Com (FA), Jyoti Nivas College Autonomous
DHII Volume 16, April 2018
22 Journal by the Department of MBA, MCA & M.Com (FA), Jyoti Nivas College Autonomous
DHII Volume 16, April 2018
4. RESULTS AND DISCUSSIONS
This algorithm is implemented in Python with Open CV. The results produced proved that Grab Cut completely depends on background and foreground pixels. If the pixels are similar the Grab Cut would mistakenly include or deletes those pixels.
Grab cut algorithm segments it iteratively to get the best result. But in somecases,thesegmentationwon’tbefine,like,itmayhavemarkedsome foreground region as background and vice versa. In that case, userneedstodofinetouch-ups.Justgivesomestrokesontheimageswhere some faulty results are there. Then in the next iteration, you get better results.
• User inputs the rectangle.Everythingoutside this rectanglewill be taken as sure background. Everything inside rectangle is unknown.
• Computerdoesaninitiallabelingdependingonthedatawegave. It labels the foreground and background pixels.
• NowaGaussianMixtureModel(GMM)isusedtomodeltheforeground and background.
• Dependingonthedatawegave,GMMlearnsandcreatenewpixel distribution. That is, the unknown pixels are labeled either probable foreground or probable background depending on its relation with the other hard-labeled pixels in terms of color statistics.
• A graph is built from this pixel distribution. Nodes in thegraphs are pixels. Additional two nodes are added, Source node and Sink node. Every foreground pixel is connected to

DHII Volume 16, April 2018
Journal by the Department of MBA, MCA & M.Com (FA), Jyoti Nivas College Autonomous 23
DHII Volume 16, April 2018
Journal by the Department of MBA, MCA & M.Com (FA), Jyoti Nivas College Autonomous 23
Source node and every background pixel is connected to sink node.
• The weights of edges connecting pixels to source node/end node are defined by the probability of a pixel beingforeground/background. The weights between the pixels are definedbytheedgeinformationorpixelsimilarity.Ifthereisa large difference in pixel color, the edge between them will get a low weight.
• Thenamincutalgorithmisusedtosegmentthegraph.Itcutsthe graph into two separating source node and sink node with minimum cost function. The cost function is the sum of all weights of the edges that are cut. After the cut, all the pixels connected to Source node become foreground and those connected to sink node become background.
• Theprocessiscontinueduntiltheclassification.
5. CONCLUSION
Grab Cut works well when the object of interest has another color distribution compared to the background. If that is not the case the segmentation could be problematic, with the statistical models. There are some cases that make GrabCut fail completely. This is because the models for the background and foreground will be similar.
6. REFERENCES
[1] J. Vivanco, J. Haydaman, C. Hamel, R. D. McLeod, and M. R. Friesen, “Developmentofwoundcaresoftwareforsmartphonesandtablets,‘WoundsInt.,vol.3,no.3,pp.13_x0015_14,2012.
[2] Reliability of Electronic Versus Manual Wound Measurement Techniques. Sepideh Haghpanah, Kath Bogie, Xiaofeng Wang, Patricia G. Banks, Chester H. Ho
[3] Validation of a Laser-AssistedWoundMeasurementDevice forMeasuring Wound Volume. Kathryn E. Davis, Fadi C. Constantine, Elaine C. MacAslan, Jessica D. Bills, Debby L. Noble and Lawrence A. Lavery.
[4] “AlgorithmsforSizeandColorDetectionofSmartphoneImagesofChronic Wounds for Healthcare Applications” TIK WAI (KIRAL)
24 Journal by the Department of MBA, MCA & M.Com (FA), Jyoti Nivas College Autonomous
DHII Volume 16, April 2018
24 Journal by the Department of MBA, MCA & M.Com (FA), Jyoti Nivas College Autonomous
DHII Volume 16, April 2018
POON1 AND MARCIA R. FRIESEN2 1Department of Computer Science,UniversityofManitoba,Winnipeg,MBR3T2N2,Canada2Department of Electrical and Computer Engineering, University of Manitoba,Winnipeg,MBR3T2N2,Canada.
[5] A mHealth Application for Chronic Wound Care: Findings of a User Trial.Marcia R. Friesen, Carole Hamel and Robert D. McLeod3.November2013.
[6] Monitoring incidence and outcomes of pressure injuries. Joanne Hardy, Sunita McGowan, Aileen Hulbert. March 2012.
[7] TheevolvingfieldofWoundMeasurementTechniques:ALiteratureReview. Rachel Khoo, MBBS, GradDipAppAnatDiss and Shirley Jansen
[8] A Modeled Analysis of Telehealth Methods for Treating Pressure Ulcers after Spinal Cord Injury. Smith, Michelle, Karen, and Ruth C. Cronkite
[9] Implementing GrabCut. Justin F. Talbot Brigham Young University Xiaoqian Xu Brigham Young University
[10] GrabCut - Iterative image segmentation through minimum graph cuts. Michael Meyer, Ryan Kuck, Kevin Nadro. Vancouver, Canada July 2001.
[11] StandardizationofWoundPhotographyUsingtheWoundElectronicMedical Record.
Robert Rennert, Michael Golinko, Dave Kaplan, Anna Flattau and Harold Brem.2008
[12] Challenges in the Treatment of Chronic Wounds. Robert G.Frykbergand Jaminelli Banks

DHII Volume 16, April 2018
Journal by the Department of MBA, MCA & M.Com (FA), Jyoti Nivas College Autonomous 25
DHII Volume 16, April 2018
Journal by the Department of MBA, MCA & M.Com (FA), Jyoti Nivas College Autonomous 25
DHIIVol. XVI, April 2018
Journal, Dept. of MBA, MCA and M.Com (FA) Jyoti Nivas College Autonomous
HANDWRITING RECOGNITION
~H Srinavya B, Raksha
Abstract
Handwriting Recognition is considered as one of the most important techniques in neural network research. Neural Networks are being used for handwriting recognition from last many years. This paper presents creating the Handwriting Recognition System in which Creating a Character Matrix and a corresponding suitable Network Structure is key. We have made an attempt to recognize handwritten English characters by using a multilayer perceptron with one hidden layer.
1. INTRODUCTION
The purpose of this paper is to take handwritten English characters as input process the character. Train the neural network algorithm. Torecognizethepatternandmodifytherectortoabeautifiedversionof the input. This paper is aimed at developing software, which will behelpfulinrecognizingcharactersofEnglishlanguage.Thispaperis restricted to English characters only. It can be further developed to recognize the characters of different languages. It engulfs theconcept of neural network. One of the primary means by which computers are endowed with human like abilities is through the use of a neural network. Neural networks are particularly useful for solving problems that cannot be expressed as a series of step such as recognizingpatterns.Classifyingthemintogroups.Seriesprediction

26 Journal by the Department of MBA, MCA & M.Com (FA), Jyoti Nivas College Autonomous
DHII Volume 16, April 2018
26 Journal by the Department of MBA, MCA & M.Com (FA), Jyoti Nivas College Autonomous
DHII Volume 16, April 2018
and data mining. Pattern recognition is perhaps the most common use of neural networks. Neural network is presented with a target vector and also a vector which contains the pattern information. this could be an image and hand written data The neural network then attempts to determine if the input data matches a pattern that the new. Network hasmemorized.Aneuralnetworktrainedforclassificationisdesignedto take input samples and classify them into groups.
2. OBJECTIVES:
• Toprovideaneasyuserinterfacetoinputtheobjectimage.• Usershouldbeabletouploadtheimage.• System should be able to pre-process the given input to
suppress the background. • Systemshoulddetecttextregionspresentintheimage.• Systemshouldretrievetextpresentintheimageanddisplay
them to the user.
3. THE BACKGROUND STUDY
Objective of Handwritten Character Recognition using Neural Networkistorecognizethecharactersinagivenscanneddocumentsand study the effects of changing the Models of ANN. Today Neural Networks are mostly used for Pattern Recognition task. The paper describes the behaviors of different Models of Neural Network used in OCR. OCR is widespread use of Neural Network. They have consideredparameterslikenumberofHiddenLayer,sizeofHiddenLayer and epochs. They have used Multilayer Feed Forward network with Back propagation. In Preprocessing, we have applied some basic algorithmsforsegmentationofcharacters,normalizingofcharactersand De-skewing. They have used different Models of Neural Network andappliedthetestsetoneachtofindtheaccuracyoftherespectiveNeural Network.
4. PROPOSED WORK
4.1 Purpose and Scope
The purpose of this design document is to explore the logical view ofarchitecturedesign, sequencediagram,dataflowdiagram,user

DHII Volume 16, April 2018
Journal by the Department of MBA, MCA & M.Com (FA), Jyoti Nivas College Autonomous 27
DHII Volume 16, April 2018
Journal by the Department of MBA, MCA & M.Com (FA), Jyoti Nivas College Autonomous 27
interface design of the software for performing the operations such as pre-processing, extracting features and displaying the text present in the images.
The scope of this design document is to achieve the features of the system such as pre-process the images, feature extraction, segmentation and display the text present in the image.
4.2 Block Diagram and Algorithm
The proposed methodology uses some techniques to remove the background noise, and features extraction to detect and classify the handwritten text.
Pre-processing
The pre-processing is a series of operations performed on scanned input image. The role of pre- processing is to segment the interesting patternfromthebackground.Generally,noisefiltering,smoothingandnormalizationshouldbedoneinthisstep.Binarizationprocessconverts a gray scale image into a binary image. Dilation of edges in thebinarizedimageisdoneusingsobeltechnique.
Segmentation
In the segmentation stage, an image of sequence of characters is decomposed into sub-images of individual character. The pre-processed input image is segmented into isolated characters by assigning a number to each character using a labeling process. This labeling provides information about number of characters in the image.Each individual character is uniformly resized into pixels.

28 Journal by the Department of MBA, MCA & M.Com (FA), Jyoti Nivas College Autonomous
DHII Volume 16, April 2018
28 Journal by the Department of MBA, MCA & M.Com (FA), Jyoti Nivas College Autonomous
DHII Volume 16, April 2018
Normalization:Afterextractingthecharacter,weneedtonormalizethesizeofthecharacters.TherearelargevariationsinthesizesofeachCharacterhence;weneedamethodtonormalizethesize.
Original Image NormalizeImage
Figure5.1.2.1NormalizationofImage
Character Extraction Algorithm
• Create a Traverse List: - List of pixels, which have beenalready traversed. This list is initially empty.
• ScanrowPixel-by-Pixel.
• Wheneverwe get a black pixel checkwhether the pixel isalready in the traverse list, if it is simply ignore and move on else apply Edge-detection Algorithm.
• AddtheListofPixelsreturnedbyEdge-detectionAlgorithmto Traverse List.
• Continuethesteps2-5forallrows.
Edge Detection Algorithm
The Edge Detection Algorithm has a list called traverse list. It is the list of pixel already traversed by the algorithm.
EdgeDetection(x, y, Traverse List);
1. Add the current pixel to TraverseList. The current position of pixel is (x, y).
2. NewTraverseList= TraverseList + current position(x, y).
If pixel at (x-1, y-1) then
Check if it is not in TraverseList.

DHII Volume 16, April 2018
Journal by the Department of MBA, MCA & M.Com (FA), Jyoti Nivas College Autonomous 29
DHII Volume 16, April 2018
Journal by the Department of MBA, MCA & M.Com (FA), Jyoti Nivas College Autonomous 29
Edgedetection(x-1, y-1, NewTraverseList);
end if
If pixel at (x-1, y) then
Check if it is not in TraverseList.
Edgedetection(x-1, y+1, NewTraverseList);
end if
If pixel at (x, y+1) then
Check if it is not in TraverseList.
Edgedetection(x, y+1, NewTraverseList);
Endif
3. return
Feature Extraction
Therearetwotechniquesemployedbasedontheefficienciesobtained,while training the neural network.
Gradient Feature Extraction
The gradient measures the magnitude and direction of the greatest change in intensity in a small neighbourhood of each pixel. (In whatfollows,“gradient”referstoboththegradientmagnitudeanddirection). Gradients are computed by means of the Sobel operator. TheSobeltemplatesusedtocomputethehorizontal(X)&vertical(Y) components of the gradient are shown in Fig.
1 2 10 0 0-1 -2 -1
-1 0 1-2 0 2-1 0 1
HorizontalComponent
Vertical Component
Figure5.1.3.2.1:SobelmasksforGradient

30 Journal by the Department of MBA, MCA & M.Com (FA), Jyoti Nivas College Autonomous
DHII Volume 16, April 2018
30 Journal by the Department of MBA, MCA & M.Com (FA), Jyoti Nivas College Autonomous
DHII Volume 16, April 2018
5. CONCLUSION
The effectiveness of the method that uses gradient technique from scanned images containing handwritten characters is presented. The gradientmethodhaveperformedwellinclassificationwhenfedtothe neural network and preprocessing of image using edge detection andnormalizationaretheidealchoicefordegradednoisyimages.
The method of training neural network with extracted features from sample images of each character has detection accuracy to a greater extent. The proposed methodology has produced good results for images containing handwritten text written in different styles, different sizeandalignmentwithvaryingbackground
The system is developed in MATLAB and evaluated for a set of sample images containing handwritten text on the computer. The method is advantageous as it uses nine features to train the neural network twelve features using gradient technique.
6. FUTURE WORK
As the feature extraction methods such as gradient technique used in the method does not classify characters of different language, themethodcanbeextendedforlanguageindependentclassificationfrom the images of other languageswith littlemodifications.Theperformance of the method has been tested for classifying English text written in upper case, but needs further exploration.
Refinement of the segmented characters can be done in order toachieve higher accuracy rate. The performance of the neural network can be increased by adding some more features other than the existing ones.Theclassificationratecanbeincreasedbytrainingtheneuralnetwork with more number of test images.
7. REFERENCES
[1] ChiragIPatel,RipalPatel,PalakPatel,“HandwrittenCharacterRecognition Using Neural Networks”, International Journal of ScientificandEngineeringResearchVol.2,2011.
DHII Volume 16, April 2018
Journal by the Department of MBA, MCA & M.Com (FA), Jyoti Nivas College Autonomous 31
DHII Volume 16, April 2018
Journal by the Department of MBA, MCA & M.Com (FA), Jyoti Nivas College Autonomous 31
[2] AshutoshAgarwal,RajneeshRani,RenuDhir,“HandwrittenCharacter Recognition Using Gradient Features”, International Journal of Advanced Research in Computer Science and Software Engineering, Vol. 2, 2012.
[3] KauleshwarPrasad,DevvratCNigam,AshmikaLakhotiya,DheerenUmre,“CharacterRecognitionUsingMatlab’sNeuralToolbox”, International Journal of u- and e- Service, Science andTechnologyVol.6,2013.
[4] M.Hanmandlu,K.RMuraliMohan,H.Kumar,“Neuralbasedhandwrittencharacterrecognition”,inProceedingoffifthIEEEInternational Conference, pp 241-244, 1999.
[5] DineshDileep, “AFeatureExtractionTechniqueBased onCharacter Geometry for Character Recognition”, International Journal of Advanced Research in Computer Science and Software Engineering, Vol. 2, 2014

32 Journal by the Department of MBA, MCA & M.Com (FA), Jyoti Nivas College Autonomous
DHII Volume 16, April 2018
32 Journal by the Department of MBA, MCA & M.Com (FA), Jyoti Nivas College Autonomous
DHII Volume 16, April 2018

DHII Volume 16, April 2018
Journal by the Department of MBA, MCA & M.Com (FA), Jyoti Nivas College Autonomous 33
DHII Volume 16, April 2018
Journal by the Department of MBA, MCA & M.Com (FA), Jyoti Nivas College Autonomous 33
DHIIVol. XVI, April 2018
Journal, Dept. of MBA, MCA and M.Com (FA) Jyoti Nivas College Autonomous
QUALITY ANALYSIS AND GRADING OF RICE GRAIN IMAGES
~J Megha, Shweta D. G
Abstract
The quality of the food grain we consume is of more importance, as people are becoming educated their demand for quality of grains is increasing. There is possibility of adulteration of food grains by the traders. Generally, the quality assessment is carried by visual inspection which is manual process. In this work, an image processing technique is used as an attempt to automate the process, which overcomes the drawbacks of manual process. This paper provides the quality assessment of rice grains based on its size. Based on the size the grains are graded as (grade 1, grade 2 and grade3). Here we considered diff erent varieties of rice grains for testing like Basmati, boiled rice, egg rice etc. The system is developed using 105 set of images and are classifi ed using decision tree based classifi cation technique. The results are found to be encouraging.
1. INTRODUCTION
The demand for quality of food products we consume is increasing day by day. As the literacy rate is increasing in India so is the need for quality of food products is increasing. India is the second largest producerofricegrainsfirstbeingChina.Astheproductionofriceis

34 Journal by the Department of MBA, MCA & M.Com (FA), Jyoti Nivas College Autonomous
DHII Volume 16, April 2018
34 Journal by the Department of MBA, MCA & M.Com (FA), Jyoti Nivas College Autonomous
DHII Volume 16, April 2018
increasing so is the demand for its quality. This demand for quality of food grains is increasing because some of the traders cheat the shopkeepers by selling poor quality food grains which contains foreign particles like stones, sand, leaf, broken and damaged seeds etc. This kind of low quality of rice is sold without being noticed even and there isnospecialschemetofindsuchpoor-qualitygrains.Therefore,itisbeing a problem for both consumers and sellers.
As the technology is growing, wider people are adopting the new technologies rather than using the old techniques. The growth in technology is making people more demanding towards the things they use and consume, this is the reason why everything is becoming automated. The use of Image processing techniques for testing the quality of rice grains is inexpensive and is less time consuming. The qualityofgrainistestedbasedonitscolour,size,shapeandtexturefeatures in this method.
Further, biological methods (DNA technique etc) and chemical methods(alkalinetestsetc)canbeusedfortheidentificationofricegrain seed varieties and quality. But these methods are very expensive and time consuming. On the other hand, the machine vision or the digital image processing is a non-destructive method (i.e. after assessment the grains can be used), it is a very fast and inexpensive process compared to the biological methods.
AGMARKisanorganization,whichisusedinratingofthesefoodproducts.There are different organizations,which also involve inratingofqualityoffoodgrainslikeISO,FDAetc.Theseorganizationshelpthefamerstoprovidecertificatesforthequalityofgrainstheyproduce. There is the AGMARK laboratory, which is centrally, located, which acts as the testing and certifying centre for the food products. Various tests are conducted in these laboratories which include biological tests, alkaline tests, test for pesticide content etc onproductslikegroundnuts,maize,wheat,jowaretcII
2. BACKGROUND STUDY
Food grains are the farming product, which requires the supervision to identify the quality. This quality estimation will help in audit system

DHII Volume 16, April 2018
Journal by the Department of MBA, MCA & M.Com (FA), Jyoti Nivas College Autonomous 35
DHII Volume 16, April 2018
Journal by the Department of MBA, MCA & M.Com (FA), Jyoti Nivas College Autonomous 35
as well as to protect it from insect infection. However, a false report or a wrong sampled based observation can completely fail this analysis process. These situations occur because of lack of availability of such quality measure labs in near region. In this paper, different digital image processing steps such as gray scale conversion, segmentation, morphological feature extraction and training and testing through feed forward propagation algorithm and k-mean clustering are used andfindoutthebestalgorithmforqualityanalysisoffoodgrains.
Food is one of the basic requirements of every living being on earth. Rice is grown in many regions across India. For about 65% of the people living in India, rice is a staple food for them. There are more than 40,000 different varieties of rice, which is cultivated in over 100 countries and on every continent except Antarctica. The food grain types and their quality are rapidly assessed through visual inspection by human inspectors. In the present grain-handling system, grain type and quality are rapidly assessed by visual inspection. This evaluation process is, however, tedious and time consuming. The decision-making capabilities of a grain inspector can be seriously affected by his/her physical condition such as fatigue and eyesight, mental state caused by biases and work pressure, and working conditions such as improper lighting,climate,etcandalsotorecognizethegrowinglowqualitydefiningcharacteristics for identification isdesirableas fraudulentmislabeling of rice grain varieties. The farmers are affected by this manualactivity.TherearealsoseveralMachineVisionComputerizedtechniques already developed but they are not so accurate to determine the quality of food grains.
3. PROPOSED WORK
In the proposed method, we have considered three varieties of rice grains namely Basmati, Delhi and Boiled. Each of these grains are furtherclassifiedandgradedintograde1,grade2andgrade3.IntheManual process, an expert inspects the individual grains. Based on the features like major axis length, minor axis length and its area, experts grade the grains. The same features are used in automated method for grading of the grains.
36 Journal by the Department of MBA, MCA & M.Com (FA), Jyoti Nivas College Autonomous
DHII Volume 16, April 2018
36 Journal by the Department of MBA, MCA & M.Com (FA), Jyoti Nivas College Autonomous
DHII Volume 16, April 2018
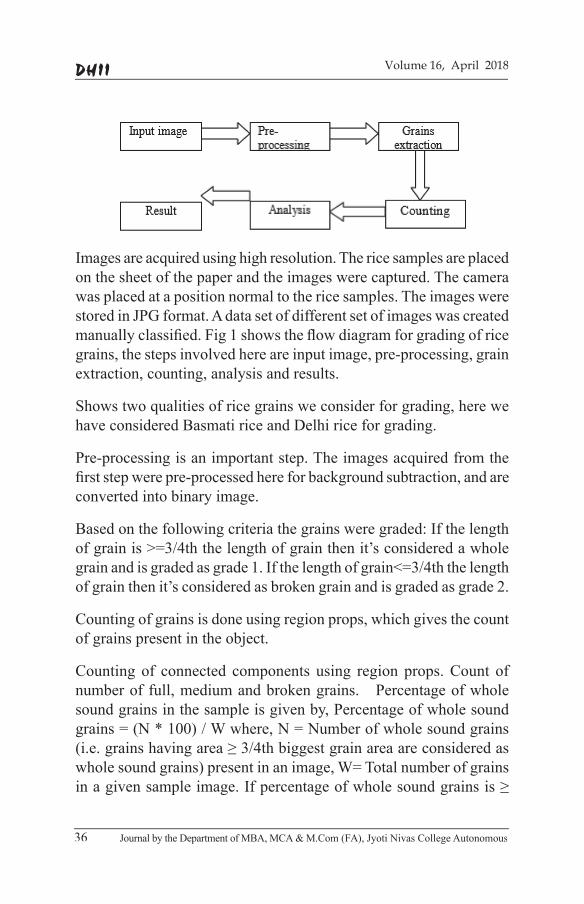
Images are acquired using high resolution. The rice samples are placed on the sheet of the paper and the images were captured. The camera was placed at a position normal to the rice samples. The images were stored in JPG format. A data set of different set of images was created manuallyclassified.Fig1showstheflowdiagramforgradingofricegrains, the steps involved here are input image, pre-processing, grain extraction, counting, analysis and results.
Shows two qualities of rice grains we consider for grading, here we have considered Basmati rice and Delhi rice for grading.
Pre-processing is an important step. The images acquired from the firststepwerepre-processedhereforbackgroundsubtraction,andareconverted into binary image.
Based on the following criteria the grains were graded: If the length ofgrainis>=3/4ththelengthofgrainthenit’sconsideredawholegrainandisgradedasgrade1.Ifthelengthofgrain<=3/4ththelengthof grain then it’s considered as broken grain and is graded as grade 2.
Counting of grains is done using region props, which gives the count of grains present in the object.
Counting of connected components using region props. Count of number of full, medium and broken grains. Percentage of whole sound grains in the sample is given by, Percentage of whole sound grains = (N * 100) / W where, N = Number of whole sound grains (i.e.grainshavingarea≥3/4thbiggestgrainareaareconsideredaswhole sound grains) present in an image, W= Total number of grains inagivensampleimage.Ifpercentageofwholesoundgrainsis≥

DHII Volume 16, April 2018
Journal by the Department of MBA, MCA & M.Com (FA), Jyoti Nivas College Autonomous 37
DHII Volume 16, April 2018
Journal by the Department of MBA, MCA & M.Com (FA), Jyoti Nivas College Autonomous 37
75% then it is graded as ‘A’, between 50-75% means grade ‘B’, below 50% means grade ‘C’.
4. RESULTS AND ANALYSIS
Input: Rice sample input image.
Output:Classifiedgrainqualitygrade.
Steps of algorithm:
Step1: Pre-process the images of rice to remove background noise
Step2: Convert the pre-processed image to binary image using Otsu method.
Step3: Regionlabelthebinaryimage.
Step4: Segment/crop the individual grains present in the image.
Step5: Extract the geometric features major axis, minor axis and area of all the individual grains
Step6: Perform analysis on the quality using the average values of the features extracted
Step7: Classify the sample for the Type and grade based on the analysis
Stop
Original image of the rice Pre-Processing of the rice image
Pre-Processing of image

38 Journal by the Department of MBA, MCA & M.Com (FA), Jyoti Nivas College Autonomous
DHII Volume 16, April 2018
38 Journal by the Department of MBA, MCA & M.Com (FA), Jyoti Nivas College Autonomous
DHII Volume 16, April 2018
Labelling of the rice grain 1
Labelling of therice grain 17
Labelling of therice grain 6
Labelling of the rice grain 47
Labelling of the rice grain 7
Shows the Object Number in the image

DHII Volume 16, April 2018
Journal by the Department of MBA, MCA & M.Com (FA), Jyoti Nivas College Autonomous 39
DHII Volume 16, April 2018
Journal by the Department of MBA, MCA & M.Com (FA), Jyoti Nivas College Autonomous 39
5. CONCLUSION
Today’s consumers are very quality conscious about the food grains they buy and consume as more and more adulteration in the food grains are reported in the media. In this paper an attempt is made to grading of rice grains based on morphological techniques using image processing. The image is initially subjected to pre-processing and the individual grains are segmented. The geometric features of the grain such as area, major axis length and the minor axis length areextractedandaresubjectedtoclassificationtheresultarefoundtobe encouraging. Based on the length of the grain the rice is graded as grade1,grade2andgrade3.Eventhoughtheproblembeingworkedupon is not completely new, the earlier approaches employed very large number of color, textural and morphological features that made the algorithm extremely slow because of the intensive computation. Theaverageaccuracyofclassificationisfoundtobe93%.
The rate of accuracy can reach 100% especially for bigger and very small grains, such as big rice, brown rice, Delhi basmati rice, broken rice and Sona Masuri Jeera rice etc. The future work may include the rice image acquisition in bulk amount and with varying backgrounds.
6. REFERENCES
[1] Gurpreet Kaur & Bhupinder Verma, Measurement standards based grading of rice kernels by separating touching kernels for embedded imaging applications, International Journal of Electronics, Communication & Instrumentation Engineering ResearchandDevelopment(IJECIERD)ISSN2249-684X,Vol.3,Issue1,pp127-134,Mar2013.
[2] Jagdeep Singh Aulakh, Dr. V.K. Banga : grading of rice grains by image processing. International Journal of Engineering Research & Technology (IJERT) Vol. 1 Issue 4, pp 1-4, June – 2012 ISSN: 2278-0181.
[3] ChetnaV.Maheshwari,Q-CURVEAPPROACHFORQUALITYANALYSIS OF INDIAN ORYZA SATIVA SSP INDICA (RICE), International Journal of Advanced Technology in Engineering andScience,VolumeNo.01,IssueNo.03,March2013.

40 Journal by the Department of MBA, MCA & M.Com (FA), Jyoti Nivas College Autonomous
DHII Volume 16, April 2018
40 Journal by the Department of MBA, MCA & M.Com (FA), Jyoti Nivas College Autonomous
DHII Volume 16, April 2018
[4] HarpreetKaur,BaljitSingh,ijsrp,classificationandgradingofricegrainsusingmulti-classSVM.Volume3,Issue4April2013.
[5] MeghaR.SiddagangappaA.H.Kulkarni,ClassificationandQuality Analysis of Food Grains. IOSR-JCE, Volume 16, Issue 4, Ver. III, pp 01-10 jul-aug 2014.
[6] G.Ajay, M.Suneel, QUALITY EVALUTION OF RICE GRAINS USING MORPHOLOGICAL METHODS, International Journal ofSoftComputingandEngineering(IJSCE)ISSN:2231-2307,Volume-2,Issue-6,pp35-37,January2013.
[7] Basavaraj S. Anami, Dayanand G. Savakar, Effect of Foreign BodiesonRecognitionandClassificationofBulkFoodGrainsImage Samples. Journal of Applied Computer Science, no. 6 (3),pp77-832009.

DHII Volume 16, April 2018
Journal by the Department of MBA, MCA & M.Com (FA), Jyoti Nivas College Autonomous 41
DHII Volume 16, April 2018
Journal by the Department of MBA, MCA & M.Com (FA), Jyoti Nivas College Autonomous 41
SECTION II (MBA)

42 Journal by the Department of MBA, MCA & M.Com (FA), Jyoti Nivas College Autonomous
DHII Volume 16, April 2018
42 Journal by the Department of MBA, MCA & M.Com (FA), Jyoti Nivas College Autonomous
DHII Volume 16, April 2018
DHII Volume 16, April 2018
Journal by the Department of MBA, MCA & M.Com (FA), Jyoti Nivas College Autonomous 43
DHII Volume 16, April 2018
Journal by the Department of MBA, MCA & M.Com (FA), Jyoti Nivas College Autonomous 43
Foreword“Research is to see what everybody else has seen and to think what
nobody else has thought”
By Albert SG
The exploration of our MBA students in the fi eld of Marketing, Finance and Human Resource Management fi nds expressions as a garland of research articles, which we are happy to publish in the post graduate journal Dhii 2018.
Ms. Akhila of second MBA, in her article “The Study on Work Life Balance of Female Nurses at Narayana Health Centre” was conducted to learn and understand the stress and pressure that the nurses are facing in order to balance the work and the family life. The study also helped in understanding the motivational and benefi cial factors that is provided by the organization to help nurses to balance their routine life.
Ms. Anusha Vijay of second MBA, in her article “Comprehensive Study on Performance Appraisal at Air India” The study was conducted to understand the gaps and the methods adopted at Air India towards Performance Appraisal and how different are their policies and practices being a Public Sector Undertaking.
Ms.Tasmiya Mariam of second MBA, in her article ‘A Study on Employee Satisfaction Relating to Performance Appraisal System at Redeem Software Private Limited’ reveals the importance of Performance Appraisal and the employee satisfaction in the organization in order to increase employee effi ciency, productivity, knowledge and all such factors that result to retaining employees and achieving organizational goals which comes through the contentment of the human resource.
Ms. Saba Anjum in her article on employee engagement level she focused on the aspects of working life at Greytip Software Private Limited. such as meaningfulness of tasks within the role, aspects of feeling towards the role, individual perceived performance levels, the amount of eff ort given by employees and the level of employee satisfaction with aspects such as working environment, co- workers and management.

44 Journal by the Department of MBA, MCA & M.Com (FA), Jyoti Nivas College Autonomous
DHII Volume 16, April 2018
44 Journal by the Department of MBA, MCA & M.Com (FA), Jyoti Nivas College Autonomous
DHII Volume 16, April 2018
Ms. Quazia Badr in her study she focused on the portfolio construction. Investing in equities requires time, knowledge and constant monitoring of the market. For those who need an expert advice to manage their investment, portfolio management services (PMS) is the option.
In conclusion, I place on record that all our student researchers realize that research is all about search for new knowledge and eff orts to create new knowledge.
Dr. Percy BoseHead, Department of MBA,Jyoti Nivas College Autonomous

DHII Volume 16, April 2018
Journal by the Department of MBA, MCA & M.Com (FA), Jyoti Nivas College Autonomous 45
DHII Volume 16, April 2018
Journal by the Department of MBA, MCA & M.Com (FA), Jyoti Nivas College Autonomous 45
DHIIVol. XVI, April 2018
Journal, Dept. of MBA, MCA and M.Com (FA) Jyoti Nivas College Autonomous
WORK LIFE BALANCE OF FEMALE NURSES AT NARAYANA HEALTH CENTRE
~Akhila
Abstract
The ability to balance work and personal obligation of life, time spent at work places, worry about work when not in work place, feel reluctant or tired mentally due to work pressure at job, family support for the work and time spent with the family, able to get time to attend social functions, get maternity leave/ paternity leave, Motivation from immediate supervisor, fl exibility of time and recognition and reward for better performance. Demand for nurses is ever increasing because of their attitude in taking care of the patients, which cannot be seen so much in other professions. Because they bring back smiles on the faces of patients with their unselfi sh and dedicated service. They work as operation theatre assistants, health advisors, counsellors, supervisors etc. Hence, keeping them happy and content is also utmost important.
INTRODUCTION:
Work-lifebalancereferstothelevelsofprioritizationbetweenpersonaland professional activities in an individual’s life and the level to which activities related to their job are present in the home. Stress is common feature of a poor work life balance. In the information economymentalstresshasbeenidentifiedasasignificanteconomic
46 Journal by the Department of MBA, MCA & M.Com (FA), Jyoti Nivas College Autonomous
DHII Volume 16, April 2018
46 Journal by the Department of MBA, MCA & M.Com (FA), Jyoti Nivas College Autonomous
DHII Volume 16, April 2018
and health problems, causing by a perceived need of employees to do moreinlesstime.Womenintheearlycenturiesweremostlyconfinedto their kitchens and those who were employed worked in factories, farms, or shop works. Very few women had the access to higher education and they were forced to be at the mercy of their fathers or husbands attitude towards women and work. The fast developing knowledge economy has given place for more number of women to be enlightened by higher education.
Education has not only empowered them but also has given them robust careers. With brain power being the requisite skill in this knowledge era rather than endurance or physical strength, the women workerseemtofloodintoeveryindustryonpairwithmen.Butthishas indeed become a tough challenge for women as they have to performlotofdutiesinhomeandofficeaswell.Duetohighworkpressureinprivatesectorjobs,ithasalsobecomedifficultforwomento maintain a healthy family life. Hence, it is assumed that work – life balance can help in bringing a huge transformation in as individual’s life.Thiswillfurtherhelptheindividualsinrealizingtheirdreamsalso. For implementing the work-life balance practices, it is essential for the employers to understand its importance. For supporting work-life balance, the employers may have to incur additional costs in implementing such policies.
Work life balance helps in describing a balance between person’s person and working life. The term work life balance is given preference as it includes the experiences of working mothers and helps in exploding new ways of working and living for them. Managing a balance between the family and the work life is the biggest challenge fortheworkingpeopleandtheorganizations.Particularlyfornurses,ithasbecomemoredifficulttostrikeabalancebetweenthetwo.Theywill be able to give their best only when clinics and hospitals have work-life balance policies for them. Work-life balance policies and programs will help them in balancing the personal and professional schedules. This will ultimately give them the feeling of satisfaction.
Following are some of the strategies that will help nurses in managing her professional and family life:

DHII Volume 16, April 2018
Journal by the Department of MBA, MCA & M.Com (FA), Jyoti Nivas College Autonomous 47
DHII Volume 16, April 2018
Journal by the Department of MBA, MCA & M.Com (FA), Jyoti Nivas College Autonomous 47
Effectively scheduling at time at work.
Exploringtheavailabilityofflexi-timing.
Fruitfully planning for the weekends.
Planning activity with friends and family.
Staying focused at office work without having any type ofdistraction or interruption.
FACTORS AFFECTING WORK LIFE BALANCE:
A. Work Family Confl ict:
From the perspective of most employees, they would see that there paid work & all-important aspects of their life, such as family, community activities, voluntary work, personal development, leisure and recreation, etc.
B. Emotional intelligence & Work Life Balance:
In general, employees who possess emotional intelligence would be able to monitor their own emotions, and thus effectively manage feeling & emotions of others.
C. Job engagement & Work Life Balance:
Job engagement has a positive impact on work performance because engaged employees are fully involved in day-to-day work and able to perform better in their job. However, the relationship between, job engagement and work life balance could be rather tricky.
D. Organizational support & Work Life Balance:
Organizational support is important in maintaining a goodwork life balance.Organizations that did not understand theimportant of work-life balance might abuse their employee’s hardworkandeffort.Ontheotherhand,organizationsthatcare
48 Journal by the Department of MBA, MCA & M.Com (FA), Jyoti Nivas College Autonomous
DHII Volume 16, April 2018
48 Journal by the Department of MBA, MCA & M.Com (FA), Jyoti Nivas College Autonomous
DHII Volume 16, April 2018
about the wellbeing of their employees would show support by implementing program and policies that emphasis on work life balance.
E. Work overload & Work Life Balance:
Workload also describes the perception that one has too much to do. Individual who perceive their workload to be more than they can handle are likely to experience exhaustion and fatigue, whichmaynegativelyinfluenceonesmotivationtorespondtothe demands of other domains.
F. Work time & Work Life Balance:
Working for long hours is a major factor that affects the work life balance. Employees who worked for long hours had higher level of stress. How work hours mesh with other family members’ schedules as well as with when community facilities are open.
G. Relocation & Work Life Balance:
The inflexibility ofmany jobsmakes balancingwork/familydemandsevenmoredifficult,andwomenmayhavenochoicebutto“bend”parentingratherthanjobresponsibility.
LITERATURE REVIEW:
TYMON et al. (2011) suggests that employees can improve their perceived success by balancing the long and short – term goals, improving their competence, and communicating openly with their managers.
MC DONALD et al. (2005) elaborates the five dimensionsthat effect organizational work-life culture - these are lackof managerial support for work-life balance; perception of negative career consequences; organizational timeexpectations; the gendered nature of policy utilization; and

DHII Volume 16, April 2018
Journal by the Department of MBA, MCA & M.Com (FA), Jyoti Nivas College Autonomous 49
DHII Volume 16, April 2018
Journal by the Department of MBA, MCA & M.Com (FA), Jyoti Nivas College Autonomous 49
perceptions of unfairness by employees with limited non – work responsibilities whereas changing the habits of the employees does not necessarily imply a change in “work-life balance”particularly if the culture of the work environment does not change.
HERZBERG et al. (1959) developed two distinct lists of factors: one is task-related which caused happy feelings or a goodattitudewithintheworkerandHerzbergcalledtheseasmotivators.
SPECTOR (1997) emphasized that Job Satisfaction is thedegree with which people like their jobs where some people enjoyworkandfindittobeacentralpartoflifeandothershateto work and do so only because they must.
MURPHY (2003) “Preserving an organization’s capital dueto loss of key employees is a global problem”. However, thereislowerlevelofturnoverintentionwhenorganizationalsocializationisprominentandadequaterangeofopportunitiesthatsatisfycareeraspirationsexistwithintheorganization.
MOHAN AND ASHOK ( 2011) explained that “Stress isoften developed when an individual is assigned the major responsibility without proper authority and delegation of power, inter personal factors such as group cohesiveness, functional dependence, communication frequency, relative authority and organizational difference between role sender and focalpersons.”
GALINSKY et al. (1990) elaborated that some of the leading corporations and universities are aware of the dramatic changes in the family, the work force, and the economy, and have developed supportive human resource policies. At this time, the measures of productivity, the structures of work,

50 Journal by the Department of MBA, MCA & M.Com (FA), Jyoti Nivas College Autonomous
DHII Volume 16, April 2018
50 Journal by the Department of MBA, MCA & M.Com (FA), Jyoti Nivas College Autonomous
DHII Volume 16, April 2018
andthecultureoftheorganizationsareundergoingincreasingscrutiny and change.
K. SANTHANA et al. (2012) addressed the Work Life Balance related issues and to support the female nurses to manage their work life balance which would add to the performance of the staff members. Their need to be a periodical review in terms of their work and personal life satisfaction, otherwise, they would be subjected to severe stress.
OBJECTIVES OF THE STUDY
Primary Objective:
In a challenging healthcare landscape, NH has been able to grow significantly;andreachouttosomanypeopleinsuchashorttimewiththehelpoffollowing:Theintellectualcapitalcomprises2,632doctorsandmorethan13,000employees.Globallyaffordablemodelleadstoeconomiesofscale;benefitingawidecross-sectionofthepopulation.Itconductmoresurgeriesandtransplantswithasignificantsuccess rate. Aggressive use of information technology to reach the remotest corners of the country faster makes quality healthcare available to those in need. Constant effort to reach out to the masses througheducationinitiatives,healthcare,financialsupport,andmanyotherCSRinitiativesfacilitateholisticwell-beingofthenation.2,632fulltimedoctors,consultantsandstudentdoctors.13,557full-timeEmployees, 62% of employees are women.402 daily average surgeries / procedures in 2015-16.
Secondary Objective:
Work-Life Balance is an omnipresent issue concerning all sections of theorganizationsandsocietyincludingresearchscholarsandbusinessleaders for obvious reasons. Maintaining a high quality of work-life isimperativetoachievethegoalsoftheorganizationaswellasforindividual satisfaction. The quality of work-life hinges mainly on supportbothfromsocietyandorganization,work-lifebalancepoliciesand programs, and various other dimensions such as job satisfaction, rewards andbenefits, recognition, individual commitment, propergrievances handling, participative management, welfare facilities,

DHII Volume 16, April 2018
Journal by the Department of MBA, MCA & M.Com (FA), Jyoti Nivas College Autonomous 51
DHII Volume 16, April 2018
Journal by the Department of MBA, MCA & M.Com (FA), Jyoti Nivas College Autonomous 51
work environment, and safety.Maintaining a flexiblework-lifebalance, given its already complex nature, is a more arduous task in case of women employees, especially in the manufacturing sector, where such challenges exist that are beyond one’s imagination. Literature has revealed the extent of tokenism dealt with by the women employees and the words of disapproval they hear from within the organizationandthesociety.However,therehasbeenlittleresearchaimed at conceptualizing, designing, developing, implementingand maintaining feasible work-life balance models, programs and procedures to help deal with these challenges and strike a balance between work and life.
STATEMENT OF THE PROBLEM:
One of the greatest problem that most of the employees are facing is the work pressure and stress
Due to the effect of stress they are unable to complete their respective tasks on scheduled time
Onalltheseimpactsshemayalsofacefinancialproblems
Women may also undergo depression`
Frustration due to work overload
Employees who worked for long hours had higher level of stress.
The inflexibility ofmany jobsmakes balancingwork/familydemandsevenmoredifficult,andwomenmayhavenochoicebutto“bend”parentingratherthanjobresponsibility.
The cumulative effect of increased working hours is having an important effect on the lifestyle of a huge number of people, which life likely to prove damaging to their mental well-being.
When the establishment of boundaries between the work and life will failed, the chances of absenteeism will be in a hike.

52 Journal by the Department of MBA, MCA & M.Com (FA), Jyoti Nivas College Autonomous
DHII Volume 16, April 2018
52 Journal by the Department of MBA, MCA & M.Com (FA), Jyoti Nivas College Autonomous
DHII Volume 16, April 2018
RESEARCH METHODOLOGY:
METHOD: Convenience Method
Convenience sampling technique may prove to be effective during exploration stage of the research area, and when conducting pilot data collection in order to identify and address shortcomings associated with questionnaire design.
Sampling Size: 50
Units for the questionnaire: Women questionnaire
Actual Data Collected:
Thedatacollectedarefromcardiacbuildingwith6floorsofvarieddepartments. The samples i.e., Nurses are available at a varied time as they will have double shifting. A certain time was allotted to collect the data.
Thequestionnairewereissuedonebyoneandaskedtofillandreturnit back. Few questionnaires were distributed to one person asked them to collect it back from the respective sample.
LIMITATIONS OF THE STUDY:
1) The study is limited to Female Nurses who are working in Narayana Health City, Bangalore.
2) The availability of time to circulate the questionnaire and collecting the required response from the female nurses is hardly 2 hours a day.
3) The survey is limited to Naraya Health [NHBlock] Cardiacdepartment in Narayana health centre.
4) Collection of feedback with very less time permit will be a challenge to gather the accurate data.
5) Researchwillbeconfinedtoworkingmotherswhohasatleastone dependent and Family.

DHII Volume 16, April 2018
Journal by the Department of MBA, MCA & M.Com (FA), Jyoti Nivas College Autonomous 53
DHII Volume 16, April 2018
Journal by the Department of MBA, MCA & M.Com (FA), Jyoti Nivas College Autonomous 53
6) Samplesizewillbe70samplesofFemaleNursesfromvariousdepartments.
7) Availability of nurses at the given time is a challenging job.
8) Making the nurses to fill the questionnaire is a challengebecause of lag in time
FINDINGS:
7) On the Analysis, the age between 20 to 25 are unmarried, they claim that they are facing the issue of Time Schedule.
8) Critical analysis showed the increase of Stress due to Work Load.
9) Critical analysis mentioned that most of them are not able to attend important family events due to work.
10) They are not getting enough time to spend with their family member especially with their siblings’ and elderly family members.
11) The longer hours of work are causing different kinds of health issues.
12) The lack of flexibility in job is creating imbalance betweenwork and family.
13) Majorityofthemurgedthattheywouldlookforajob,indicatesthefactthattheorganizationisnotefficientinmaintainingthepersonals.
14) The respective job is making difficult in order to fulfill thefamily responsibility.
15) The research revealed that most of them feel emotionally drained due to hectic workload.

54 Journal by the Department of MBA, MCA & M.Com (FA), Jyoti Nivas College Autonomous
DHII Volume 16, April 2018
54 Journal by the Department of MBA, MCA & M.Com (FA), Jyoti Nivas College Autonomous
DHII Volume 16, April 2018
16) Most of them mentioned the demand for work interferes with the home and family life.
17) Majority of them feel overburdened at the end of their job.
18) Most of them feel fatigued when they get up in the morning.
19) Maximumcandidatesfeelrushedinordertofinishthejob assigned.
SUGGESTIONS:
Most of the candidates strongly agree to the fact that they are getting inspired by the job performance, which is motivational aspectoftheorganization.
Critical analysis also clearly stated that the Nurses have a lot of freedom to decide to set how to carry out the performance of the assigned job.
The nurses also strongly urged that they could schedule their own time for completing the assigned tasks.
Most of them mentioned that they have authority to initiate projects at their own job.
Narayana have introduced various motivational factors such as, Sodexo coupons, Marital holidays, Maternal leaves, Paid holidays, etc
I strongly believe that narayana should introduce some events where the entire staff family will come together.
Work life balance can be improved with the introduction of Yoga,offjobs,flexitime,etc.
The main reason for attrition is that workload, double shifting and low pay system.

DHII Volume 16, April 2018
Journal by the Department of MBA, MCA & M.Com (FA), Jyoti Nivas College Autonomous 55
DHII Volume 16, April 2018
Journal by the Department of MBA, MCA & M.Com (FA), Jyoti Nivas College Autonomous 55
Providing satisfactory provisions at work place would stop the attrition issue.
The issue of physical fatigueness can be addressed by introducing events which entertaining.
The canteen should be maintained in such a way that it should attract all the fellow personnels.
CONCLUSION:
It is essential for every organization to acknowledge the dualresponsibilities of women executives and to develop a system where they can establish a balance and best utilize their potential.Theorganizationshouldbesensitizedatallleveltotheworklifeissuesthatleadtooverallorganizationaleffectiveness.Thecurrentstudyisdesigned for examining the work-life policies and practices of private hospitals that would provide support to nurses in balancing their work and non-work life.
Fromthestudyitwasfoundthattheorganizationinspirestotheverybest in the form of job performance. Most of the nurses working in Narayanaareunderthatageof25andwithmaximumof2–3yearsof experience. More than 60% of them are facing the pressure and stress due to work related commitments. They had strongly agreed to the fact that they would even look for another hospital over Narayana.
Istronglyurgethattheorganizationmustintroducefewactivitiessuchoff job, family get together, Yoga, counceling, etc. in order to sustain them for longer life at the hospitals.
BIBLIOGRAPHY:
1. h t t p : / / w w w . i j e m r . n e t / A u g u s t 2 0 1 4 I s s u e /WorkLifeBalanceOfNursesAndLadyDoctors(244-249).pdf
2. https://www.researchgate.net/profile/Faizuniah_Pangil/publication/283567135_Individual_Organizational_and_Environmental_Factors_Affecting_Work-Life_Balance/links/56a04d6a08aee4d26ad2afbd/Individual-Organizational-

56 Journal by the Department of MBA, MCA & M.Com (FA), Jyoti Nivas College Autonomous
DHII Volume 16, April 2018
56 Journal by the Department of MBA, MCA & M.Com (FA), Jyoti Nivas College Autonomous
DHII Volume 16, April 2018
and-Environmental-Factors-Affecting-Work-Life-Balance.pdf3. https://xa.yimg.com/kq/groups/20542092/396998393/name/
narayan.pdf4. https://recerca.upc.edu/giopact/ca/projects/docs/galinski.pdf5. http://www.ijtef.org/papers/202-CF02015.pdf6. http://www.natefacs.org/Pages/v8no1/8-1-53%20Felstehausen.
pdf7. https://www.ijirset.com/upload/2014/january/23_Comparative.
pdf8. http://apjor.com/downloads/230620156.pdf

DHII Volume 16, April 2018
Journal by the Department of MBA, MCA & M.Com (FA), Jyoti Nivas College Autonomous 57
DHII Volume 16, April 2018
Journal by the Department of MBA, MCA & M.Com (FA), Jyoti Nivas College Autonomous 57
DHIIVol. XVI, April 2018
Journal, Dept. of MBA, MCA and M.Com (FA) Jyoti Nivas College Autonomous
COMPREHENSIVE STUDY ON PERFORMANCE APPRAISAL AT AIR INDIA
~Anusha Vijay
Abstract
In this study, the operative function in the human resource department is analyzed with the contribution of employees and their opinion about the functions performed by the employees and their opinion about the function performed by the HR Department in Air India HAL complex Bangalore. The employees in the organization are given questionnaire where information about performance appraisal is collected. The data’s are analyzed through the percentage analysis. Air India provides a lot of amenities to their employees. Being a Public sector Undertaking they do not have the authority to make any major changes in the organization structure. Though the company is not incurring much profi ts the company is keen in keeping up its standards and value for money. Air India is known for its good conduct and its status.
INTRODUCTION
Performance appraisal is an integral part of HRM and HRM deals with personnelispeople.“People”istheimportantandvaluableresourcethateveryorganizationorinstitutionhasintheformofitsemployees.Dynamicpeoplecanbuilddynamicorganization.Effectiveemployeescan contribute to the effectiveness of the organization.HRMhasmultiple goals, which include employee’s competency development,

58 Journal by the Department of MBA, MCA & M.Com (FA), Jyoti Nivas College Autonomous
DHII Volume 16, April 2018
58 Journal by the Department of MBA, MCA & M.Com (FA), Jyoti Nivas College Autonomous
DHII Volume 16, April 2018
employeemotivationdevelopment andorganizationdevelopment.Employees require a variety of competencies, knowledge, attitude, skills in technical area; Managerial areas, behavioral and human relations areas and conceptual area to perform different tasks or functions required by their jobs.
Human resource management aim at constantly the competency requirements of different individual to perform the job assigned to them, effectively and provides opportunities for developing these competencies. As HRM deals with humans it is necessary to keep a check on their performance after regular interval of time given jobs, it is necessary to have corrective actions term or there is need to have appraisal on their performance. The process of appraising for doing their work effectively is it is very essential to understand and improve the employee’s performance appraisal is the basis for HRD. It was viewed that performance appraisal was useful to decide upon employee promotion, transfer, salary determination and the like. Its roots in the early 20th century can be traced to Taylor’s pioneering Time and motion studies. As a distinct and formal management procedure used in the evaluation of work performance, appraisal really dates from the time of the Second World War - not more than 60 years ago. Yet in a broader sense, the practice of appraisal is a very ancient art. In the scale of things historical, it might well lay claim to being the world's second oldest profession. Performance appraisal measures the qualitative and quantitative aspects of job performance known as performance appraisal system.
Performance appraisal also means an appraisal of the growth potential of an employee, with a view to providing information to the organizationleadingtopositiveactionandenablingfeedbacktotheindividual aimed at his performance improvement, personal growth and job satisfaction. In short, we can say that performance appraisal to result in an assessment.
LITERATURE REVIEW
• EichelandBender(1981)statethatpastperformancewasusedto guide or justify management actions in dealing with the

DHII Volume 16, April 2018
Journal by the Department of MBA, MCA & M.Com (FA), Jyoti Nivas College Autonomous 59
DHII Volume 16, April 2018
Journal by the Department of MBA, MCA & M.Com (FA), Jyoti Nivas College Autonomous 59
employee. At the time, according to these authors performance appraisal provided the basis for salary, retention, discharge, or promotional decisions.
• Maddux (1987) Performance appraisal provides a periodicopportunity for communication between the person who assigns the work and the person who performs it, to discuss what they expect from the other, and how those expectations are being met.
• Cascio (1988) defines Performance appraisal as a process toimproveemployee’sworkperformancebyhelpingthemrealizeanduse their full potential in carryingout theorganization’smissions and to provide information to employees and managers for use in making work related decisions.
• Horton and Farnham (1999) the overall aim of performancemanagement is to establish a high performance culture. In this employees would visualize as part of their function therequirement to continually assist in improving the performance of the organization. They will also perceive that they caninfluenceimportantaspectsofoverallperformance.
• Edwards (2000)definesPerformanceappraisal systemas theformal, systematic assessment of how well employees are performing in their jobs in relation to established standards, including communication of that assessment to the employee and the organization. Edwards notes that the goal of theperformance appraisal process is to improve the quality of work and the individual employees involved in the work.
• Marchington&Wilkinsion(2007)PerformanceManagementis a structured method of review which aims to link together individual goals, departmental purpose and organizationalobjectives. In this, there is a clear strategic link between employeebehaviourandtheperformanceoftheorganization.
60 Journal by the Department of MBA, MCA & M.Com (FA), Jyoti Nivas College Autonomous
DHII Volume 16, April 2018
60 Journal by the Department of MBA, MCA & M.Com (FA), Jyoti Nivas College Autonomous
DHII Volume 16, April 2018
• DonaldL.Caruth(2009)hasdiscussedthatthepurposeofthispaper is to demonstrate the need for and propose a more aligned and integrated standard for performance evaluation to enhance effective strategic control. The paper reviews the various issues creating discontent with the performance appraisal systems within many organizations and demonstrates how theseproblems inhibit successful strategic control.
• Sahoo and Mishra (2012) a performance Appraisal systemconsistsofcleardefinitionofjobdescription,properselectionprocess, performance standards, measurement techniques and results, training & development, mentoring and feedback, performance development
• Barr, (1993) eachemployee shouldbeallowed toparticipatein periodic sessions to review performance and clarify expectations. Both the supervisor and the employee should recognizethesesessionsasconstructiveoccasionsfortwo-waycommunication. Sessions should be scheduled ahead of time in a comfortable setting and should include opportunities for self-assessment as well as supervisor feedback.
• MarionE.Haynes:Performance appraisal systemare “homework“thatprovidestheinformationyouneedinordertomakeappropriate administrative recommendations, hold meaningful feedback discussions with staff members, and determined were performance improvement is required.
• John D.Drake: The effectiveness of an appraisal system isdetermined by the quality of communications between the manger and the staff members, not by multiple raters, complex scoring methods or the form used.
• RobertDacal:OneofthemainreasonPerformanceappraisaland performance management fail is that too much time is

DHII Volume 16, April 2018
Journal by the Department of MBA, MCA & M.Com (FA), Jyoti Nivas College Autonomous 61
DHII Volume 16, April 2018
Journal by the Department of MBA, MCA & M.Com (FA), Jyoti Nivas College Autonomous 61
spent on appraisal performance using vague criteria and not enough time and effort put into helping employee understands what his job is about and his goals and objectives he is expected to achieve to be successful.
• Brumbrach, 1988: Performance can be actions as well asconsequences. Behavior originated from a performer and convert performer performance from a concept to an act. Not just the instruments for results, behaviors are also outcomes in their own right - the product of mental and physical effort applied to tasks - and can be judged apart from results.
• Noeetal(2006)defineperformancemanagementas"theprocessthrough which managers ensure that employees' activities and outputsarecongruentwiththeorganization’sgoals"
• Reznick and Mehrman, (1981): Performance appraisalbehaviors are more positive and functional when the job of the personbeingappraisedhaswellspecifieddutiesandpriorities.
• Dobbins,CandyandPlat-Vieno,(1990):PerformanceAppraisalsatisfaction deals with such issues as employees evaluating timeliness, accuracy, goal setting procedures and feedback mechanisms.
BACKGROUND OF THE STUDY
Performance appraisal is the process of making an assessment of theperformanceandprogressoftheemployeesofanorganization.Onceanemployeehasbeeninductedintotheorganizationandgiventhe necessary training, the next step is to assess his performance periodically.Suchassessmentwouldindicatewhetherheisefficientor not. Performance appraisal is also known as “merit rating” or“efficiencyrating”.Thefollowingfactorsaregiveninevaluatingtheperformance and progress of an employee.

62 Journal by the Department of MBA, MCA & M.Com (FA), Jyoti Nivas College Autonomous
DHII Volume 16, April 2018
62 Journal by the Department of MBA, MCA & M.Com (FA), Jyoti Nivas College Autonomous
DHII Volume 16, April 2018
Knowledge of work
Extent of co-operation with colleagues and superiors.
Initiative
Quality of work.
Target attainment.
Aptitude.
Degree of skill.
Discipline.
Punctuality.
Honesty.
Ambition.
Crisis management, etc.
Performance appraisal to performance development:
In fact, performance appraisal, in recent times, emerged as performance analysis and development. Performance analysis and development is a departure from the traditional and controlling approach. It views from the development aspect of the employee. Therefore, the main purpose of performance analysis and development is to analyse the present performance of the employee from multiple viewpoints, observe the gap/developmental needs and develop the employee.
Performance appraisal is also a technique of HRD. The performance interview and the process of the performance analysis help the subordinate to interact closely with his superior. The interaction helps particularly subordinates learn from his superior the job related and behaviour related aspects. This process becomes a training/development /educational process. Thus, performance appraisal is closely related to HRD. In fact, performance appraisal helps employee development.

DHII Volume 16, April 2018
Journal by the Department of MBA, MCA & M.Com (FA), Jyoti Nivas College Autonomous 63
DHII Volume 16, April 2018
Journal by the Department of MBA, MCA & M.Com (FA), Jyoti Nivas College Autonomous 63
OBJECTIVES OF THE RESEARCH
To study about the current performance appraisal system of the organization and identify gaps between the current state anddesired state.
Tofindouttheperformancedimensionsrelevanttothestrategicplan of the company.
To identify the potential areas for the scope of improvement in the current system and thereby in the organizationalperformance.
To identify the key performance indicators and critical success factorsforachievingorganizationalexcellence.
To clarify job objectives.
To extract suggestions and views of the employees.
To facilitate dialogue between managers and employees, teams regarding progress and performance and development objectives.
Statement of the problem
Tounderstandthefactorsinfluencingperformanceappraisalintheorganization and suggesting the remedialmeasures to address theindifference between the organization and the employees and toselectsmoothfunctioningoftheorganization.Toadaptorimproveperformance appraisal methods.
Methodology Used
Descriptive research method was used in this study, which is also called as statistical research. The main goal of this type of research is to describe the data and characteristics about what is being studied. The idea behind this type of research is to study frequencies averages. It is used to obtain information concerning the status of the phenomena todescribe“whatexists”withrespecttovariablesorconditionsinasituation.

64 Journal by the Department of MBA, MCA & M.Com (FA), Jyoti Nivas College Autonomous
DHII Volume 16, April 2018
64 Journal by the Department of MBA, MCA & M.Com (FA), Jyoti Nivas College Autonomous
DHII Volume 16, April 2018
Sample Technique
Convenience sampling is taken as a sampling technique for the research. It is a statistical method of drawing representative data by selecting people because of the ease of their volunteering or selecting units because of their availability of easy access. The advantages of this type of sampling are the availability and quickness with which data can be gathered. The disadvantage is the risk that the sample might not represent the population as a whole and it might be biased.
Research Instruments
They are the tools for data collection. They include Questionnaire, Interview, Observation and Reading. Essentially the researcher must ensure that the instrument chosen is valid and reliable. The validity and reliability of any research project depends largely on the appropriateness of the instruments. Whatever procedure one uses to collect data, it must be critically examined to check the extent to which it is likely to give you the expected results.
Actual collection of data
The instrument used in this study is questionnaire. Questionnaire is distributed to employees of various departments and the response is collected.
Limitations of the Study
Thestudyrestrictstoonlythisorganization
Employees are hesitant to provide information.
Employees are busy in there day to day work so it’s very difficulttocollectdata.
Thelimitedsizeofthesampleforthestudymaynotprovidearelevant response.
Findings & Suggestions
Fromthedatainterpretation,wecouldanalyzethatthemajorityof the employees belong to the age group above 40.

DHII Volume 16, April 2018
Journal by the Department of MBA, MCA & M.Com (FA), Jyoti Nivas College Autonomous 65
DHII Volume 16, April 2018
Journal by the Department of MBA, MCA & M.Com (FA), Jyoti Nivas College Autonomous 65
Among the respondents majority of the employees are above the grade of 10th standard.
Majority of the employees have experience above 10 years. We canunderstandthattheorganizationhasverylowattritionrateas Air India being a public sector company the employees leave theorganizationonlywhentheyattaintheageofretirement.
The respondents of Air India do not get any pay hike after performance appraisal. This is due to the different policies and procedures the Public sector Company follows in the area of performance appraisal.
The respondents feel that the performance appraisal is not a transparent system to evaluate them. They want a better and transparent way for evaluating their performance.
The respondents feel that the feedback given to them is not honest.
Majority of the employees are not satisfiedwith the criteriaused to evaluate them. They need a mechanism to evaluate their performance on their overall productivity.
The respondents are aware of the areas of improvement post performance appraisal. This makes the employees work on their areas of improvement and makes that as their strength.
The respondents feel that the top level is partial in performance appraisal.
Majority of the respondents say that they are not provided proper training to improve their skills.
The respondents say that the performance appraisal methods keep the employees motivated if it is linked to appropriate reward system.

66 Journal by the Department of MBA, MCA & M.Com (FA), Jyoti Nivas College Autonomous
DHII Volume 16, April 2018
66 Journal by the Department of MBA, MCA & M.Com (FA), Jyoti Nivas College Autonomous
DHII Volume 16, April 2018
Therespondentsaresatisfiedwiththewelfarepoliciesprovidedto them such as the passage tickets for the immediate family members and medical policy for the entire family during the tenure and post retirement.
The respondents do not have any provision to rate themselves the employees do not have a provision to give a feedback on their performance.
ConclusionPerformance appraisal hasmany intended benefits for both theorganization and the employee. If the process is not carefullyimplemented and managed, it can result in employee dispute. Constructive criticism can help improve performance, but there is afine line between providing helpful feedback and upsetting anemployee. Hence the researcher conducts a research study regarding employees opinion on performance appraisal system. The research findings give good findings and valuable suggestions regardingperformance appraisal system and it’s necessity among the employees.
From this study we come to know that the majority of the employees arenotsatisfiedwiththeperformanceappraisalsystemprovidedbythecompany.Managementshouldalwaysmakesuretorecognizeandreward excellent performance to avoid coming off as too negative. Employee who works hard and take pride of their work will have a hard timecorrectlyutilizingthefeedbackifnoneoftheiraccomplishmentsor positive contributions are noticed and appreciated. Hence, performance appraisal system needs to be effective in improving or sustaining employee performance, otherwise they are a tremendous waste of time and money spend on development and implementation.
Air India provides a lot of amenities to their employees. Being a Public sector Undertaking, they do not have the authority to make anymajorchangesintheorganizationstructure.Thoughthecompanyisnotincurringmuchprofitsthecompanyiskeeninkeepingupitsstandards and value for money. Air India is known for its good conduct and its status.
DHII Volume 16, April 2018
Journal by the Department of MBA, MCA & M.Com (FA), Jyoti Nivas College Autonomous 67
DHII Volume 16, April 2018
Journal by the Department of MBA, MCA & M.Com (FA), Jyoti Nivas College Autonomous 67
Bibliography
Website
1. www.google.co.in
2. https://en.wikipedia.org/wiki/Air_India
3. https://scholar.google.co.in/r?q=performance+appraisal+review+of+literature&hl=en&as_=0&as_=1&oi=scholart&sa=X&ved=0ahUKEwiK54iAxKLWAhWHPY8KHfteBOUQgQMIIzAA
4. https://scholar.google.co.in/r?q=performance+appraisal+review+of+literature&hl=en&as_=0&as_=1&oi=scholart&sa=X&ved=0ahUKEwiK54iAxKLWAhWHPY8KHfteBOUQgQMIIzA

68 Journal by the Department of MBA, MCA & M.Com (FA), Jyoti Nivas College Autonomous
DHII Volume 16, April 2018
68 Journal by the Department of MBA, MCA & M.Com (FA), Jyoti Nivas College Autonomous
DHII Volume 16, April 2018

DHII Volume 16, April 2018
Journal by the Department of MBA, MCA & M.Com (FA), Jyoti Nivas College Autonomous 69
DHII Volume 16, April 2018
Journal by the Department of MBA, MCA & M.Com (FA), Jyoti Nivas College Autonomous 69
DHIIVol. XVI, April 2018
Journal, Dept. of MBA, MCA and M.Com (FA) Jyoti Nivas College Autonomous
A STUDY ON “EMPLOYEE SATISFACTION RELATING TO PERFORMANCE APPRAISAL SYSTEM” AT REDEEM SOFTWARE PRIVATE LIMITED, BANGALORE.
~Tasmiya Mari
Abstract
The overall fi ndings and conclusions of Redeem Software revealed many positive aspects about the quality of Human Resource plans and implementations provided to the employees especially the plans and ideas associated to our study topic i.e. Performance Appraisal. First, it is essential to note that focus group participants gave very positive responses to questions regarding the quality of the Performance Appraisal System followed by the company. Secondly, further studies revealed that employees are more satisfi ed with their peer group showing a positive plus friendly working environment. In critical areas such as instructional eff ectiveness, advising, favoring and team work concerned by the individual, service, excellence, recruitment and fi nancial aid. Furthermore, employees are highly satisfi ed with the working and reputation of the company. They gave high satisfactory ratings to the Performance Appraisal System being followed in their company. They also expressed their ability to experience intellectual growth and development in performance at the Company post to the appraisal process. In view of these positive results. The primary purpose of this study was to

70 Journal by the Department of MBA, MCA & M.Com (FA), Jyoti Nivas College Autonomous
DHII Volume 16, April 2018
70 Journal by the Department of MBA, MCA & M.Com (FA), Jyoti Nivas College Autonomous
DHII Volume 16, April 2018
identify the factors aff ecting Employee satisfaction on the quality of Performance Appraisal System adopted by the company and make recommendations for improvements in order to enhance the quality of Appraisal Process adopted by the company and instruction for those employees, it was essential to identify and respond to their concerns (if necessary). The employee satisfaction survey fi ndings are striking in that leads to identify the need for improvements in just a few areas; however, these fi ndings are not surprising and the interpretations and recommendations are quiet general ones provided to cement minor gaps.
1. INTRODUCTION
Performance Appraisal- It is the process of evaluating the performance andqualificationsofemployeesintermsofrequirementofthejobforwhich one is employed, for the purpose of administration including placement,selectionforpromotions,providingfinancialrewardsandother actions which require differential treatment among the members of group as distinguish from actions affecting all members equally.
2. LITERATURE REVIEW
Diane Shaffer (May 11, 2009) has written in his article writer has discussed that motivation and performance appraisal are interrelated. Motivation is dependent on performance management. Employees who are motivated and happy with their jobs want to stay connected with the company for a longtime.Manyorganizationshavenot implementedcorrectperformance appraisal system to evaluate the performance of employees. Author has discussed here that they should implement a successful appraisal method/system and also give reward to employeeswho performgood in the organization.Through this practice employee become motivated towards their jobs and improve their performance and performance of organizationasawholewillalsoimprove.

DHII Volume 16, April 2018
Journal by the Department of MBA, MCA & M.Com (FA), Jyoti Nivas College Autonomous 71
DHII Volume 16, April 2018
Journal by the Department of MBA, MCA & M.Com (FA), Jyoti Nivas College Autonomous 71
· Donald L. Caruth (2009) has discussed that the purpose of this paper is to demonstrate the need for and propose a more aligned and integrated standard for performance evaluation to enhance effective strategic control. The paper reviews the various issues creating discontent with the performance appraisal systems within many organizations and demonstrates how theseproblems inhibit successful strategic control. It attempts to cogently incorporate the performance appraisal characteristics neededfortheexercisetofunctionasacriticalorganizationalcontrol metric and a useful feedback mechanism for strategic managementofthefirm.
H.C. Shiva Prasad (2010) in this research paper, have done work to check the performance of Indian software professionals (SPs) Data were collected from 441 software and senior software engineersfromeightIndiansoftwarefirms.Theteamleadersassessed the performance of software and senior software engineerson16items.Theexploratoryandconfirmatoryfactoranalyses of scores on 16 items of the instrument suggest 6 dimensionsofperformance.Theyarework-efficiency,personalresourcefulness, inter & intra-personal sensitivity, productivity orientation, timeliness, and business intelligence. SPs having more years of experience, higher need for achievement, and higher need for social power are high performers. Human resource managers can evaluate the performance of SPs holistically on 6 dimensions for training, reward administration, job rotation, and promotion decisions.
3. RESEARCH METHODOLOGY
Objectives of the Study-
The study is aimed at projecting the “Employee’s Satisfaction Relating to Performance Appraisal System at Redeem Software” at Koramangala, Bangalore. The main objective of the study is to
72 Journal by the Department of MBA, MCA & M.Com (FA), Jyoti Nivas College Autonomous
DHII Volume 16, April 2018
72 Journal by the Department of MBA, MCA & M.Com (FA), Jyoti Nivas College Autonomous
DHII Volume 16, April 2018
know the satisfaction of employees towards the appraisal done by the company. Tostudytheextenttowhichtheemployeesaresatisfiedwith
performance appraisal system existing in Redeem Software. To study the need for appraisal in the company. To know whether the appraisal done by the company, is
motivating or encouraging the employees to improve their performance.
Limitation of the Study-
It is most widely used method for collecting the information because the researcher gets first hand and direct information from the respondent.
The main limitations of the study are:-
1. The data collected in some cases might be biased.
2. Certain respondents were not co-operative in answering the questionnaire; thus, hampering the results.
3. Thestudyisbasedontheinputscollectedfromalimitedsampleset - the staff members of the personnel department.
4. Someof the informationwasdifficult toobtainas theywereseentosensitiveinformationandbreachofconfidentiality.
5. ItwasdifficulttoobtaininformationonUnionmeetingsetc.astheywerebeyondthereachofanoutsidertothefirm.
Type of Research-
The random survey has been used in the study to research that is, a questionnaire having closed ended questions was prepared by covering various aspects. Primary data as well as secondary data provided the basis of the study. The questionnaire methodology was adopted to collect information & data directly from employees. It also includes

DHII Volume 16, April 2018
Journal by the Department of MBA, MCA & M.Com (FA), Jyoti Nivas College Autonomous 73
DHII Volume 16, April 2018
Journal by the Department of MBA, MCA & M.Com (FA), Jyoti Nivas College Autonomous 73
the company for the collection of various information & data.
Sources of Data-
There are two types of data
a. Primary Data b. Secondary Data
For a researcher, it is almost necessary to collect two types of data as the conclusions are drawn on basis of these data only.
1. Primary Data-
Data collected through interactive and exchange of information with the concerned employees and executives.
Visited different departments and so with the company guide. Thisdatacollectedthroughquestionnairefrom30respondents.
2. Secondary Data-Secondary data has collected from:
Books. Manuals. Company handbooks. Internet.
Instruments used for Research-
Face-to-face interview. Questionnaire. Bar diagram. Pie chart.
4. FINDINGS AND SUGGESTIONS
1) The company’s process of performance appraisal is ideal. The company has given its importance for individual meeting for Manager Appraisal to analyze the individual performance.This makes an employee to feel the sense of belongingness

74 Journal by the Department of MBA, MCA & M.Com (FA), Jyoti Nivas College Autonomous
DHII Volume 16, April 2018
74 Journal by the Department of MBA, MCA & M.Com (FA), Jyoti Nivas College Autonomous
DHII Volume 16, April 2018
with thecompany.Overall,wefind thatemployeesshowthecontentment with the Performance Appraisal System adopted by the company
2) The researcher can also interpret that the company indulges itself in an appropriate judgement of ability and talents of the employees during the appraisal period coming up with accurate results that plays a major role in boosting up the employee satisfaction.
3) The researcher also interprets that the employees agreewiththe Appraisal Process being conducted once a year and not twiceorthriceayearastheemployeescangetsufficienttimeto showcase their performance and enhance it by understanding the needs and demands of the job assigned and then have their performance get documented for evaluation.
4) The researcher also finds that majority of the employeesshow satisfaction with Performance Appraisal Results to be considered for promoting an employee in the company rather than by any other perspective like Seniority, Merit or Examination and since the company is standing according to the expectations of the employees, there is contentment being expressed by the employees.
5) The researcher also interprets that performance must be given the ultimate importance and considered as the ‘Basis of Promotion’ following what will be the Qualification andExperience respectively according to the employees.
6) The appraisal done by Peer and Personnel Manager are more opted by the employees respectively for company’s Performance Appraisal Process indicating the employer-employee relation in the company along with the positive and friendly environment existing in the work place.

DHII Volume 16, April 2018
Journal by the Department of MBA, MCA & M.Com (FA), Jyoti Nivas College Autonomous 75
DHII Volume 16, April 2018
Journal by the Department of MBA, MCA & M.Com (FA), Jyoti Nivas College Autonomous 75
7) The researcher also interprets that according to the employees, the Performance Appraisal Process consumes quiet a normal or a long time but fortunately not a very long or less time.
8) Employeesare satisfiedwith this stepof themanagementofeffectively using the data collected about the employees during the appraisal period to upgrade their skills and knowledge and also an effective training is provided to employees along with necessary suggestions to improve the performance.
9) The researcher also interprets that there is no space for bias or favouritism in the company during appraisal process and the Performance Appraisal Process has an impact on the Performance of the employees. But overall employees are satisfied well enough that they necessarily need not requirerevamps in the Appraisal System adopted by the company.
The following are the recommendation that can be applied for the futurebenefitsoftheorganizations.
In the future personnelmanagement should occupy a significantPositionintheorganizationbecauseofthefollowingreasons.
It has direct connection with manpower planning, recruitment, career development, management development, training, wages and salary structure and many more hosts other personnel issues and jobs.
It concerns the forceful energy of group’s behavior, inter-personnel and inter-group relations.
The management movement, rapid changes the thinking of the management itself and the change in political economic and social climate, call for new roles for personnel executives.
Employees are also to be involved in daily management meetings.

76 Journal by the Department of MBA, MCA & M.Com (FA), Jyoti Nivas College Autonomous
DHII Volume 16, April 2018
76 Journal by the Department of MBA, MCA & M.Com (FA), Jyoti Nivas College Autonomous
DHII Volume 16, April 2018
Conducting more and more development and welfare activities for the growth of the employees.
The company must have its own vehicle, so it is helpful to employer to contact employees in case of emergency.
The company has to concentrate on marketing activities to enter in the global world.
5. RECOMMENDATIONS
1. The researcher recommends to the management to review the existing Performance Appraisal Systemand think of redesigning it, in order to make it more attractive and motivating, so that the employees will derive greater satisfaction.
2. The researcher recommends the management to ensure that the appraisal done in the company must strongly stick to the proper judgement of ability and talents of the employees and also ensure that the employees are well aware of the fact.
3. The researcher appreciates themanagement for coming upwith such a satisfactory Performance Appraisal System in the company. The researcher recommends the company to know and understandtheexpectationsofnon-satisfiedrespondentsandtaketheir feedbacks into consideration in order to come up with a cent percent satisfaction of the respondents for the coming appraisal practices.
4. The researcher recommends to the company that it is indeed beneficialforthecompanytoconducttheperformanceAppraisalones yearly. Therefore, the researcher appreciates the idea of the company of conducting the appraisal ones in a year so that the employeesgetsufficienttimetogivethebestoftheirperformancefor the appraisal and even the company can rate the performance appropriately after examining the year’s performance.
5. The researcher recommends the management to consider all the four areas mentioned above and not just Performance

DHII Volume 16, April 2018
Journal by the Department of MBA, MCA & M.Com (FA), Jyoti Nivas College Autonomous 77
DHII Volume 16, April 2018
Journal by the Department of MBA, MCA & M.Com (FA), Jyoti Nivas College Autonomous 77
Appraisal Results as the basis of promotion especially the Merit and Examination which indicates the talents and abilities of an employee and even Seniority as it indicates the years of work experience the respondent has
6. The researcher recommends to the management to take up measures that canhelp thecompany tofindout the lackings in ‘BasisofPromotion’, get the feedbacks and opinions of the employees who aren’tsatisfiedwiththe‘BasisofPromotion’inthecompanyandconsider those opinions and ideas to redesign the entire promotion strategy to earn the cent percent satisfaction of the employees with the ‘Basis of Promotion’ adopted by the company.
7. The researcher recommends to the company that even though there are 80% of the total respondents who think that Performance of an employee must be the ‘Basis of Promotion’, in addition to this, about10%and6%ofthetotalemployeesthinkthatqualificationand experience must be the ‘Basis of Promotion’ respectively, in the company hence, they must also partly be given some consideration.
8. The researcher recommends to the company that, since the majority of the respondents feel Peer Appraisal to be the ‘Best Possible Assessment’ and then comes Manager Appraisal with 30%ofconsiderationas ‘BestPossibleAssessment’hence thecompany can take up Peer Appraisal along with Manager Appraisal instead of Self-Appraisal which is least preferred by employees assometimesSelf-Appraisalbecomestoodifficulttothinkoverabout one self and many a times not so true.
9. The researcher recommends to the management that the Performance Appraisal process should not take a very long time and that attempts must be made to complete the appraisal process within a period of 15 days so that the management is able to keep thetrackoftheoutcomesandfindingsoftheappraisalsystemandbeabletocompiletheimportantfindingsoftheappraisalquicklyso that the management is able to use the data to improve future performances and growth of the company.

78 Journal by the Department of MBA, MCA & M.Com (FA), Jyoti Nivas College Autonomous
DHII Volume 16, April 2018
78 Journal by the Department of MBA, MCA & M.Com (FA), Jyoti Nivas College Autonomous
DHII Volume 16, April 2018
10. The researcher recommends to the management that the Performance Appraisal data which is being effectively used to upgradeskillsandknowledgeisnotifiedtoeveryrespondentintheorganizationsothateveryemployeebecomesawareofthestrengths andweaknesses andbe able to refine themselves incourse of time.
11. The researcher re commends to the management to come up with the effective training and suggestions with whose help the respondentscanrecognizeandbridgethegapstogivethebestof their performance in a smooth manner for the coming years. The researcher appreciates the management that about 80% of the respondents are of opinion that the management provides effective training and suggestion post to appraisal process to improve their performance.
12. The researcher recommends to the management to have pivotal focus on the quality of employee’s performance, as 77% of the total respondents prefer Quality to be taken as the basis of promotion in thecompany.Quantitymustbegiventhesecondpreferenceas13%of the total employees feel so and also human resources who give the performance in an appreciative quantity also must get the credit hence it is a wise choice to consider Quality and Quantity to be considered simultaneously as the basis of promotion in the company.
13.Theresearcherappreciates themanagementfornotgivinganyspace for bias at the time of appraisal and possessing the quality of impartiality in the judgment of performance of the employees.
14. The researcher recommends to the management that Performance Appraisal being a method which includes documenting and evaluatingtheemployee’sperformance,findingoutthestrengthsand weaknesses of the employees, their capabilities, achievements, skills and lacks. The primary factors that needs to be focused on are the weaknesses and lacks, keeping this in mind, it becomes the responsibility of management to take measures that help their employees to overcome their weaknesses and be able to give their best performances in time to come.

DHII Volume 16, April 2018
Journal by the Department of MBA, MCA & M.Com (FA), Jyoti Nivas College Autonomous 79
DHII Volume 16, April 2018
Journal by the Department of MBA, MCA & M.Com (FA), Jyoti Nivas College Autonomous 79
15. The researcher recommends to the management to hold on to the existing Performance Appraisal System adopted by the managementasabout90%ofthetotalrespondentsaresatisfiedwithitandfindnoreasontobringaboutanykindofrevampbutkeeping in mind that the appraisal must be conducted perfectly onceayearandnotonce in13-14months.Apart fromSalaryincrements, management must also provide the employees with non-financialrewardslikeannualcompany-sponsoredtrips,otherforms of recognition as a reward for appreciative performance.
6. CONCLUSION
RedeemisanorganizationwherePersonneldepartmentplaysaverycritical role in managing and looking after the welfare of large mass ofemployees.TheopportunitytomeettheskilledPersonnelofficialsgaveanideaoftheHRpracticesbeingfollowedattheorganizationespecially the Performance Appraisal Practices. This stint provided an opportunity to measure the Performance of every individual, Quality of Work, Satisfaction of employees, etc. Training & development before and after appraisal for all the employees and improving the Work environment are the two key factors that should be stressed upon by the department.
The company should concentrate on such appraisal techniques which are accepted by majority of the workers. Those appraisal techniques which hurt the personal feelings of the workers should be avoided & techniqueswhich are tobeusedby theorganization shouldbeexplained & convinced to the workers and in addition to this, they should be motivated to accept the appraisal techniques & co-operate withtheirappraiser.Theorganizationshouldensurethattheappraiserinsufficientlytrainedtoappraisetheworkers.Acommonbasisorcriteria should be used to appraise the workers.
After completing the research study, the researcher arrives at the conclusionthatappraisalfacilitiesinfluencetheperformanceoftheemployees and also job satisfaction.
80 Journal by the Department of MBA, MCA & M.Com (FA), Jyoti Nivas College Autonomous
DHII Volume 16, April 2018
80 Journal by the Department of MBA, MCA & M.Com (FA), Jyoti Nivas College Autonomous
DHII Volume 16, April 2018
7. BIBLIOGRAPHY
1. www.redeemsoftware.com2. www.redeemsoftware.com3.https//www.sulekha.com>redeemsoftware4. www.wikipedia.com5. Human Resource Management- by K Ashwathappa (Edition 2)
and P Subbarao6. Human Resource Development- by P Subbarao7.PersonnelManagement-byCBMemoriaandMirza8.OrganizationalBehavior-byNKumarandRMittal9.EssentialsofManagement-byHaroldKoontzHeinzandWeihrich

DHII Volume 16, April 2018
Journal by the Department of MBA, MCA & M.Com (FA), Jyoti Nivas College Autonomous 81
DHII Volume 16, April 2018
Journal by the Department of MBA, MCA & M.Com (FA), Jyoti Nivas College Autonomous 81
DHIIVol. XVI, April 2018
Journal, Dept. of MBA, MCA and M.Com (FA) Jyoti Nivas College Autonomous
A STUDY ON THE ENGAGEMENT LEVEL OF EMPLOYEES AT GREYTIP SOFTWARE PVT. LTD
~Saba Anjum.
Abstract
The study is attempting to delve into the prevailing attitudes and employee engagement within the Greytip Software Private Limited. A lot of importance is given to employee engagement in Greytip Software Private Limited. The researcher seeks to understand the aspects of working life at Greytip Software Private Limited. Aspects such as meaningfulness of tasks within the role, aspects of feeling towards the role, individual perceived performance levels, the amount of eff ort given by employees and the level of employee satisfaction with aspects such as working environment, co- workers and management. The research was carried out by using questionnaire, circulating it to the employees of Greytip. The dissertation aims to measure engagement and look at the areas where management interventions can be implemented to increase the overall level of employee engagement
OBJECTIVES OF THE STUDY
Primary Objectives:-
To determine the level of engagement of the employees at Greytip.
To study employee engagement activities at Greytip.
82 Journal by the Department of MBA, MCA & M.Com (FA), Jyoti Nivas College Autonomous
DHII Volume 16, April 2018
82 Journal by the Department of MBA, MCA & M.Com (FA), Jyoti Nivas College Autonomous
DHII Volume 16, April 2018
Secondary Objectives:-
To evaluate the level of employee satisfaction towards their job.
Tofindout theemployeeengagementactivitiesadoptedbythe company.
To know the working environment of the employees in Greytip.
To understand the role of employee engagement i.e. how it helps to fill the gap between the management and theemployee.
STATEMENT OF PROBLEM
To understand and learn about employee engagement activities practiced in the Greytip Software, to keep their employees motivated and engaged with their work. This will also focuses on various job related problems, increase motivational activities also help to develop theemployeemorale.Thestudyalsofocusesonfivefactorsthatisjobrelated, compensation, growth and development, peers and teamwork relationship, and working relationship with the manager.
RESEARCH METHODOLOGY
Primary Method:
Questionnaires: The questionnaire was designed keeping in mind theemployeesoftheorganization.Itiscriticalpartofprimarydatacollection method. Questionnaire was prepared using 5 point Likert scale,1representingstronglydisagree,2-Disagree,3-Neutral,4-Agree and 5 -strongly agree.
Secondary Method:
The secondary information is collected from websites, articles, textbooks, other records of the company.
SAMPLING SIZE
The total number of sample units taken up for the study is 50.

DHII Volume 16, April 2018
Journal by the Department of MBA, MCA & M.Com (FA), Jyoti Nivas College Autonomous 83
DHII Volume 16, April 2018
Journal by the Department of MBA, MCA & M.Com (FA), Jyoti Nivas College Autonomous 83
SAMPLING TECHINIQUE
Simple Random Sampling-
In a simple random sample, individuals are chosen at random and not more than once to prevent a bias that would negatively affect the validity of the result of the experiment.
Stratifi ed Sampling-
Stratifiedsamplingisamethodofsamplingthatinvolvesthedivisionof a population into smaller groups known as strata. In stratifiedrandom sampling, the strata are formed based on members shared attributes or characteristics.
Sampling Unit-
The basic units of the study are employees of Greytip Software.
Limitations of the Study
The study was purely based on the information given by the employees and there are chances for giving wrong data.
The employees are very busy in their work so they gave answers very much in a questionnaire form.
DATA ANALYSIS:
JOB RELATED CONVENIENCES
TABLE NO 1: Represents the opinions of 50 respondents regarding satisfaction level towards their job in Greytip
Options No of respondents PercentageStrongly Agree 26 52%
Agree 11 22%Neutral 9 18%
Disagree 4 8%Strongly Disagree 0 0%
Total 50 100%
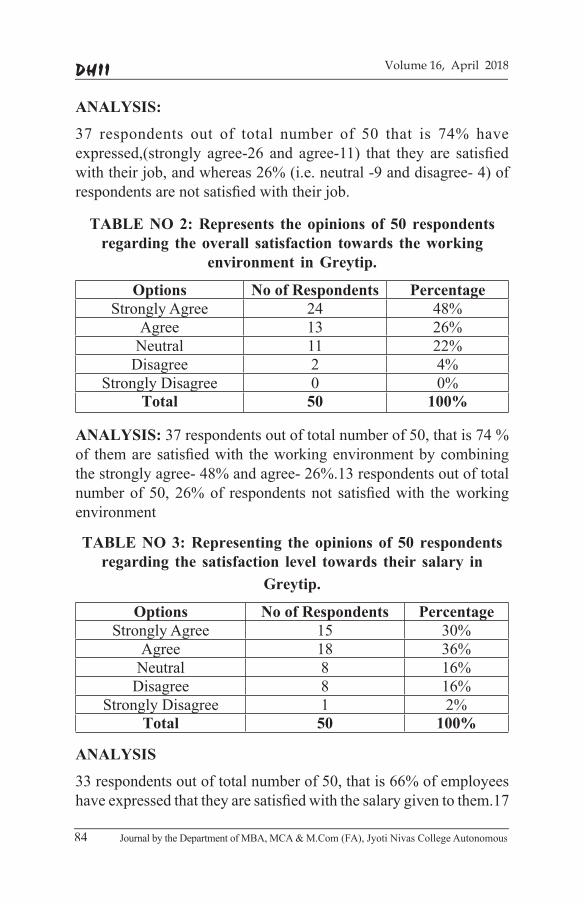
84 Journal by the Department of MBA, MCA & M.Com (FA), Jyoti Nivas College Autonomous
DHII Volume 16, April 2018
84 Journal by the Department of MBA, MCA & M.Com (FA), Jyoti Nivas College Autonomous
DHII Volume 16, April 2018
ANALYSIS:
37 respondents out of total number of 50 that is 74% haveexpressed,(strongly agree-26 and agree-11) that they are satisfiedwith their job, and whereas 26% (i.e. neutral -9 and disagree- 4) of respondentsarenotsatisfiedwiththeirjob.
TABLE NO 2: Represents the opinions of 50 respondents regarding the overall satisfaction towards the working
environment in Greytip.
Options No of Respondents PercentageStrongly Agree 24 48%
Agree 13 26%Neutral 11 22%
Disagree 2 4%Strongly Disagree 0 0%
Total 50 100%
ANALYSIS: 37respondentsoutoftotalnumberof50,thatis74%of themaresatisfiedwith theworkingenvironmentbycombiningthestronglyagree-48%andagree-26%.13respondentsoutoftotalnumberof50,26%of respondentsnot satisfiedwith theworkingenvironment
TABLE NO 3: Representing the opinions of 50 respondents regarding the satisfaction level towards their salary in
Greytip.
Options No of Respondents PercentageStrongly Agree 15 30%
Agree 18 36%Neutral 8 16%
Disagree 8 16%Strongly Disagree 1 2%
Total 50 100%
ANALYSIS
33respondentsoutoftotalnumberof50,thatis66%ofemployeeshaveexpressedthattheyaresatisfiedwiththesalarygiventothem.17
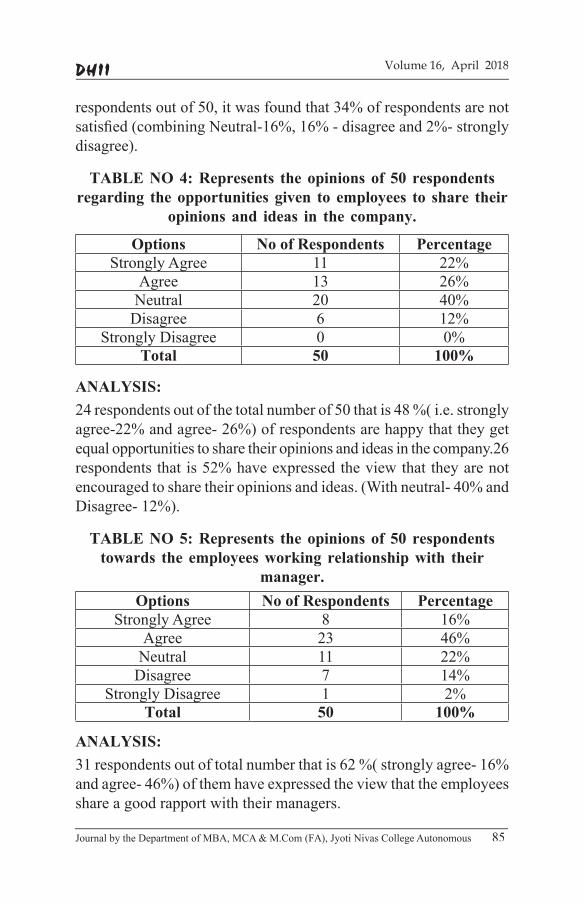
DHII Volume 16, April 2018
Journal by the Department of MBA, MCA & M.Com (FA), Jyoti Nivas College Autonomous 85
DHII Volume 16, April 2018
Journal by the Department of MBA, MCA & M.Com (FA), Jyoti Nivas College Autonomous 85
respondentsoutof50,itwasfoundthat34%ofrespondentsarenotsatisfied(combiningNeutral-16%,16%-disagreeand2%-stronglydisagree).
TABLE NO 4: Represents the opinions of 50 respondents regarding the opportunities given to employees to share their
opinions and ideas in the company.
Options No of Respondents PercentageStrongly Agree 11 22%
Agree 13 26%Neutral 20 40%
Disagree 6 12%Strongly Disagree 0 0%
Total 50 100%
ANALYSIS:24 respondents out of the total number of 50 that is 48 %( i.e. strongly agree-22% and agree- 26%) of respondents are happy that they get equal opportunities to share their opinions and ideas in the company.26 respondents that is 52% have expressed the view that they are not encouraged to share their opinions and ideas. (With neutral- 40% and Disagree- 12%).
TABLE NO 5: Represents the opinions of 50 respondents towards the employees working relationship with their
manager.
Options No of Respondents PercentageStrongly Agree 8 16%
Agree 23 46%Neutral 11 22%
Disagree 7 14%Strongly Disagree 1 2%
Total 50 100%
ANALYSIS:31respondentsoutoftotalnumberthatis62%(stronglyagree-16%and agree- 46%) of them have expressed the view that the employees share a good rapport with their managers.
86 Journal by the Department of MBA, MCA & M.Com (FA), Jyoti Nivas College Autonomous
DHII Volume 16, April 2018
86 Journal by the Department of MBA, MCA & M.Com (FA), Jyoti Nivas College Autonomous
DHII Volume 16, April 2018
19 respondents that is 48% of employees have expressed that they do not share a good rapport with their managers. (With Neutral- 11, Disagree-7, Agree- 1).
FINDINGS:
1. The employees of Greytip Software Pvt. Ltd are very much satisfied with their job with 74%. The remaining 26% areneutralanddissatisfied.
2. Most of the employees are happy with the work environment. Greytip maintains a friendly work environment. This has resulted in retaining the employees for a longer duration.
3. 66% of employees are satisfied with the salary given tothem.Mostoftheemployeesaresatisfiedwiththebenefits/perquisites more than the salary (i.e. 70%) given to the employees.Therearevariousbenefitsgiven:Everyyearthereis an increment in the employee’s salary, with that there are manybenefitsandperquisites likeSuperannuation, medical Insurance,andflexiblebenefitplanincompensationstructure,data card, National Pension Scheme (NPS) etc.
4. 62% of employees said that they share a good rapport with their mangers. Equally they get a constructive feedback from their managers.
5. 78% of employees said that they share a good relationship with their peers. But they don’t get a constructive feedback from their peers.
RECOMMENDATIONS:
1. One thing the researcher would like to suggest is to concentrate on those employees who have given a negative response towards their job satisfaction. In addition, to conduct some fun activities during the work, so that the employees do not get bored and start liking the work environment.
2. The researcher suggests focusing on the respondents who arenot satisfiedwith their job.The researcher suggests thecompanytooffersomelevelofflexibilitytotheiremployees

DHII Volume 16, April 2018
Journal by the Department of MBA, MCA & M.Com (FA), Jyoti Nivas College Autonomous 87
DHII Volume 16, April 2018
Journal by the Department of MBA, MCA & M.Com (FA), Jyoti Nivas College Autonomous 87
typically possess workers with high employee satisfaction. Thecompanymustofferflexibilitybyrearrangingtheworkschedules to better suit employees. By this employee may becomesatisfiedwiththeirwork.
The researcher also suggest the company to offer anonymous online surveys or mobile surveys to effectively track how employees feel about benefits, recognition, supervisor feedback andother aspectsthat contribute to employee satisfaction. This allows you to improve, tweak and monitor satisfaction levels to reduce employee turnover and increase productivity.
The researcher suggest the supervisors to concentrate on those employeeswhoarenotsatisfiedwiththesalaryorbenefitsgiventothem,maybetheemployeesisbeensufferingfromfinancialcrisisand expecting more increments in the salary. The manager must be able to understand their employee problems.
The researcher has suggested the employees to appreciate their coworkers and keep them giving a constructive feedback about their performances.Thishelpstheorganizationinbuildingagoodpeersand team work relationship.
The researcher has suggested the managers to concentrate on the employees who are not outspoken. Give them opportunities to learn and grow in their career. Keep them always engaged with their work. The manager has to understand what are the problems faced by their subordinates, try solving them, so that this helps in building a good relationship between the employer and employee.
The researcher suggests including more fun activities, so that it becomes more interesting and the employees are more engaged. Apart from fun activities done at Greytip, the researcher suggested to include Pictionaryandtreasurehuntinoffice.
CONCLUSION
The employees at Greytip are very dedicated towards their work and verymuchsatisfiedwiththeirjob.Accordingtotheresearcher,thecompany is really doing well by making their employees motivated

88 Journal by the Department of MBA, MCA & M.Com (FA), Jyoti Nivas College Autonomous
DHII Volume 16, April 2018
88 Journal by the Department of MBA, MCA & M.Com (FA), Jyoti Nivas College Autonomous
DHII Volume 16, April 2018
towards their work, creating a friendly environment and giving recognition to the employees. The research resulted in both positive and negative aspects of engagement. It was a positive aspect that so many employees were willing to come forward and be so honest in making suggestions that can be fed back up the business. The researcher hopes that this research adds to the body of knowledge which the HR department and the managers of Greytip have as part of the managerial kit in order to drive engagement levels up and to maintain the excellent customer service which drives the business forward.
BIBLIOGRAPHY
WEBSITES:
1. https://www.greythr.com/in/payroll-software/2. Engageforsuccess.org/what-is-employee-engagement.3. http://googlweblight.com4. www.hni.com

DHII Volume 16, April 2018
Journal by the Department of MBA, MCA & M.Com (FA), Jyoti Nivas College Autonomous 89
DHII Volume 16, April 2018
Journal by the Department of MBA, MCA & M.Com (FA), Jyoti Nivas College Autonomous 89
DHIIVol. XVI, April 2018
Journal, Dept. of MBA, MCA and M.Com (FA) Jyoti Nivas College Autonomous
A STUDY ON PORTFOLIO MANAGEMENT
~Quazia Badr
Abstract
Investing in equities requires time, knowledge and constant monitoring of the market. For those who need an expert advice to manage their investment, portfolio management services (PMS) is the option. The business of portfolio management has never been an easy one. Juggling the limited choice at hand with the twin requirements of adequate safety and sizeable returns is a task with complexities. Given the unpredictable nature of the market it requires solid experience and strong research to make the right decisions. Making an investment on shares, debenture, and bonds are both profi table and exciting, but it involves a high amount of risk and it requires analytical skills. If an investor wants to make a profi t out of securities, he must have considerable fi nancial acumen as well as capable of facing risk. Most of the people have inclination to make an investment on various portfolios such as Shares, Debenture, Bonds. But, they are unable to manage them prudently.
1. INTRODUCTION:
Aportfoliocanbedefinedasdifferentinvestmenttoolsnamelystocks,shares, mutual funds, bonds, cash all combined together depending specially on the investor’s income, budget, risk appetite and the

90 Journal by the Department of MBA, MCA & M.Com (FA), Jyoti Nivas College Autonomous
DHII Volume 16, April 2018
90 Journal by the Department of MBA, MCA & M.Com (FA), Jyoti Nivas College Autonomous
DHII Volume 16, April 2018
holdingperiod.Itisformedinsuchawaythatitstabilizestheriskofnon-performance of different pools of investment. The term portfolio management in common practice refers to selection of securities and their continuous shifting in what that the holder gets maximum returns at minimum possible risks. Portfolio management services are merchantbankingactivitiesrecognizedbySEBI.Aportfoliomanagerby virtue of his knowledge and experience helps his clients to make investmentinprofitableavenues.
In the current scenario where there is quality money in the markets, portfolio management is indeed a preferred method of making investments. With the range of products available across different schemes, there is something to offer every individual as per the different criterion defined.This is one of the highly researched,tracked and appropriate methods of investment giving exposure across different options available.
2. RESEARCH METHODOLOGY
2.1. Statement of the Problem
An investor considering investment in securities is faced with the problem of choosing from among a large number of securities and how to allocate those funds over a group of securities. The hurdle that exists is that the investor has a problem of deciding which security to hold and how much to invest in each of them.
2.2. Need of the Study
Every investor undergoes confusion while selecting securities for his portfolio. He also faces dilemma while deciding about the proportion of investment to be made in security.
Investor can generate highest return at a given level of risk. It helps to identify the non-performing securities in the
investment process and for improving these areas. It helps the investors to choose the optimal portfolio. Effectiveutilizationofresource.

DHII Volume 16, April 2018
Journal by the Department of MBA, MCA & M.Com (FA), Jyoti Nivas College Autonomous 91
DHII Volume 16, April 2018
Journal by the Department of MBA, MCA & M.Com (FA), Jyoti Nivas College Autonomous 91
2.3. Objectives of the Study
To study the concept of portfolio management. To analyze the risk and return of various equity avenues of
Larsen & Toubro Limited, Hindustan Unilever Limited (HUL), Maruti Suzuki India Limited, Bosch Group and Dr.ReddyLaboratories.
To evaluate the performance of portfolio over a period. To construct an optimal portfolio using the Sharpe’s Single
Index Model. To calculate the proportion of investment to be made into each
of the stock that is included in the portfolio.
2.4. Type of Research
A descriptive research is undertaken. Convenient sampling is done for easyanalysis.Inthisresearch,wehaveveryspecificobjectiveanddatarequirements. Information gathered is used for statistical inference on thestocksthroughdataanalysis.Itcanhelpanorganizationdefineandmeasurethesignificanceofportfolio.
2.5. Sampling Techniques
Data is collected from secondary sources like money control, NSE, BSE, Annual Journals and other websites. Primary data from the representatives was collected and assistance from the mentors was taken for better understanding.
2.6. Sample Size, Sample Description
A sample of 5 companies Larsen & Toubro Limited, Hindustan UnileverLimited(HUL),MarutiSuzukiIndiaLimited,BoschGroup,and Dr Reddy’s Laboratories from different sectors is selected from NSENIFTY50,forwhichananalysisoffiveyearswillbedone.
2.7. Limitations of the Study
Thedatacollectedisconfinedtosecondarysources,withverylittle amount of primary data associated with the project.

92 Journal by the Department of MBA, MCA & M.Com (FA), Jyoti Nivas College Autonomous
DHII Volume 16, April 2018
92 Journal by the Department of MBA, MCA & M.Com (FA), Jyoti Nivas College Autonomous
DHII Volume 16, April 2018
There is constraint with regard to time allocated for the research study.
The sample is limited to 5 stocks from 5 different sectors. Portfolio created for the study is of 2 stock combinations, for
making study easier and understandable. While constructing portfolio the stock is given equal weightage,
return and risk will change if weights are different. Thedatawascollectedfor5financialyearsfromApril2012–
March 2017.
3. DATA ANALYSIS AND INTERPRETATION
3.1. Sharpe’s Index – Sharpe’s Performance Index
Table 3.1: Representation of Sharpe’s Index
Port folio
Stocks Combination
Rp T SD Sp Rank
1 LT & HUL 23.73 6.48 12.19 1.42 92 LT & Maruti 40.09 6.48 21.25 1.60 83 LT & Bosch 55.89 6.48 23.62 2.09 54 LT & Dr Reddy 24.62 6.48 10.36 1.75 75 HUL & Maruti 42.02 6.48 15.82 2.25 46 HUL & Bosch 57.82 6.48 21.94 2.34 37 HUL & Dr Reddy 26.58 6.48 14.88 1.35 108 Dr Reddy & Bosch 58.71 6.48 21.66 2.41 29 Bosch & Maruti 74.18 6.48 36.19 1.87 6
10 Maruti & Dr Reddy 42.91 6.48 14.79 2.46 1
Graph 3.1: Portfolio Ranks Based on Sharpe’s Index

DHII Volume 16, April 2018
Journal by the Department of MBA, MCA & M.Com (FA), Jyoti Nivas College Autonomous 93
DHII Volume 16, April 2018
Journal by the Department of MBA, MCA & M.Com (FA), Jyoti Nivas College Autonomous 93
Interpretation and Analysis
Sharpe ratio greater than 1 is acceptable to be good by investors. A ratio higher than two is rated as very good. The basic purpose of Sharpe ratio is to allow an investor to analyse how much greater a return one obtains in relation to the level of additional risk taken to generate that return. A Portfolio with highest Sharpe ratio Sp is best compared to other portfolios. As per Sharpe’s Index Maruti & Dr Reddy, Dr Reddy & Bosch, HUL & Bosch, HUL & Maruti and LT & Dr Reddy are the top5performerswithranks1,2,3,4&5respectively.
3.2. Treynor’s Index – Treynor’s Reward-to-Variability Measure
Table 3.2.: Representation of Treynor’s Index
Port folio Stocks Combination Rp T βp Tp Rank
1 LT & HUL 23.73 6.48 1.03 16.75 9
2 LT & Maruti 40.09 6.48 1.62 20.75 8
3 LT & Bosch 55.89 6.48 1.87 26.42 4
4 LT & Dr Reddy 24.62 6.48 1.11 16.34 10
5 HUL & Maruti 42.02 6.48 1.35 26.33 5
6 HUL & Bosch 57.82 6.48 1.60 32.09 1
7 HUL & Dr Reddy 26.58 6.48 0.84 23.93 7
8 Dr Reddy & Bosch 58.71 6.48 1.68 31.09 2
9 Bosch & Maruti 74.18 6.48 2.19 30.91 3
10 Maruti & Dr Reddy 42.91 6.48 1.43 25.48 6

94 Journal by the Department of MBA, MCA & M.Com (FA), Jyoti Nivas College Autonomous
DHII Volume 16, April 2018
94 Journal by the Department of MBA, MCA & M.Com (FA), Jyoti Nivas College Autonomous
DHII Volume 16, April 2018
Analysis and Interpretation
A Portfolio with highest Treynor’s Index, Tp is best compared to other portfolios. More volatile stocks have a beta greater than one, portfolio comprising of Bosch and Maruti has highest Beta value with 2.19 showing high risk and high volatility, whereas less volatile stocks have a beta lower than one, the portfolio with HUL and Dr Reddy has the Beta value of 0.84 making it less volatile.
3.3. Construction of Portfolio
Table 3.3.: Calculation of Percentage of Investment.
Stocks Zi Percentage of Investment
Bosch 0.553 0.859 64
Maruti 0.197 0.859 23
HUL 0.109 0.859 13
The table represents the proportion of investment to be made in each security.Thethreesecuritiesrankingfrom1to3areselectedfortheoptimum portfolio. The percentage of funds to be invested in each security is represented in the graph.
Graph 3.2.: Portfolio Rank Based on Treynor’s Index
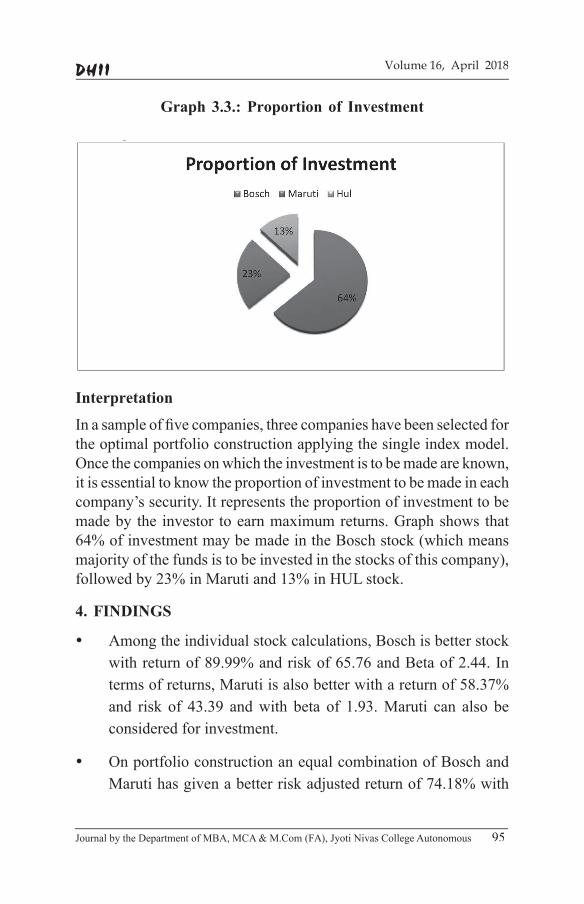
DHII Volume 16, April 2018
Journal by the Department of MBA, MCA & M.Com (FA), Jyoti Nivas College Autonomous 95
DHII Volume 16, April 2018
Journal by the Department of MBA, MCA & M.Com (FA), Jyoti Nivas College Autonomous 95
Interpretation
Inasampleoffivecompanies,threecompanieshavebeenselectedforthe optimal portfolio construction applying the single index model. Once the companies on which the investment is to be made are known, it is essential to know the proportion of investment to be made in each company’s security. It represents the proportion of investment to be made by the investor to earn maximum returns. Graph shows that 64% of investment may be made in the Bosch stock (which means majority of the funds is to be invested in the stocks of this company), followedby23%inMarutiand13%inHULstock.
4. FINDINGS
Among the individual stock calculations, Bosch is better stock with return of 89.99% and risk of 65.76 and Beta of 2.44. In termsofreturns,Marutiisalsobetterwithareturnof58.37%and risk of 43.39 andwith beta of 1.93.Maruti can also beconsidered for investment.
On portfolio construction an equal combination of Bosch and Maruti has given a better risk adjusted return of 74.18% with
Graph 3.3.: Proportion of Investment

96 Journal by the Department of MBA, MCA & M.Com (FA), Jyoti Nivas College Autonomous
DHII Volume 16, April 2018
96 Journal by the Department of MBA, MCA & M.Com (FA), Jyoti Nivas College Autonomous
DHII Volume 16, April 2018
riskof36.19andbetaof2.19.Thecorrelationandcovariancebetween the Bosch and Maruti are 0.88 and 2009.85 respectively.
Dr Reddy & Bosch, HUL & Bosch and LT & Bosch are good enough in risk adjusted return. The return and risk of Dr. Reddy & Bosch 21.66 and 58.7% respectively and with beta 1.68 also the return and risk of HUL & Bosch are 57.82% and 21.94 with beta of 1.6. The return and risk of LT & Bosch are 55.89% and 23.62withbetaof1.87.ItissuggestedtoinvestinDrReddy& Bosch or HUL & Maruti these stocks have considerable risk and return while LT & Bosch has high unsystematic risk compared to other stocks.
A combination of LT & Dr. Reddy has a correlation of 0.26 and covarianceof 155.03, has the least returnsof 24.62 and riskof10.36withbeta1.11.This combination is suitable for theinvestors who avoid taking risks.
On evaluating portfolio performance Maruti & Dr. Reddy ranks 1st in Sharpe’s index and HUL & Bosch ranks 1st in Treynor’s index,boththesecombinationsareefficientinJenson’sindex.On coming to Jenson’s index all portfolios except HUL & Dr. Reddyareefficient, their return ishigher thanmarket return.ThemostefficientcombinationisBosch&Marutiwithreturnof 18.48%.
We can state that a portfolio with Bosch is well performed.
The Bosch Group has the highest return of 89.99% and Larsen & Toubro Limited has the lowest return of 21.80%. If the investor wants to earn a maximum return without considering the risk aspect then investment can be made on those securities which yield high returns. Even though the return is high, the risk involved in the stock return should be considered while taking investment decisions.

DHII Volume 16, April 2018
Journal by the Department of MBA, MCA & M.Com (FA), Jyoti Nivas College Autonomous 97
DHII Volume 16, April 2018
Journal by the Department of MBA, MCA & M.Com (FA), Jyoti Nivas College Autonomous 97
The return from Bosch Group has the highest beta value of 2.44 which means that it is highly volatile; Larsen & Toubro Limited (1.29) andMarutiSuzuki IndiaLimited (1.93)have thebetavalue greater than 1 which means that they are also volatile. But, they are less volatile compared to the Bosch Group stock’s return.
The excess return to beta ratio measures the additional return on a security per unit of systematic risk. The Bosch Group’s stockreturnhasthehighestexcessreturntobetaratioof34.23and that of Larsen & Toubro Limited is the lowest at 11.88. This ratio provides the relationship between potential risk and reward involved in a security’s return.
The Bosch Group’s stock return has the highest unsystematic riskσei2of65.76andthatoftheHindustanUnileverLimitedhastheleastriskof18.07.Itistheuniqueriskaffectingthefirmdue to certain factors affecting only the company issuing such security. It is the avoidable risk.
Thethreesecuritiesrankingfrom1to3basedontheCivalueswereidentifiedalongwiththeproportionofinvestmenttobemade. The proportion of the investment to be made is 64% in BoschGroup’s stock, 23% inMarutiSuzuki IndiaLimited’sstock,13%inHindustanUnileverLimitedCompany’sstock.This implies that the majority of funds may be invested on the Bosch Group’s stock.
5. SUGGESTION
Bosch yields highest returns among the stocks and also carries high risk; the investor looking for high returns can make individual investment in the stocks of Bosch.

98 Journal by the Department of MBA, MCA & M.Com (FA), Jyoti Nivas College Autonomous
DHII Volume 16, April 2018
98 Journal by the Department of MBA, MCA & M.Com (FA), Jyoti Nivas College Autonomous
DHII Volume 16, April 2018
ItisfoundthatalltenPortfoliosareefficientofgivingreturns;best Portfolio that can be suggested is the combination of Bosch and Maruti.
L&T and Dr.Reddy have a correlation of 0.26 which states that this portfolio is conservative and investors who are volatile to risk can invest in this combination.
Sharpe’s Performance Index ranks portfolio, the portfolio with highest Sharpe’s index is best compared to other portfolios. Thus, combination of Maruti and Dr.Reddy can be considered for investment.
Don’tputyourtrustinonlyoneinvestment.Itislike“puttingall the eggs in one basket”. This will help to reduce the risk in long term.
Theriskcanbereducediftheportfolioisdiversified.Thepointof diversity is toachieve a given level of expected return while bearing the least possible risk.
A portfolio with Bosch has performed well, giving high returns. So it is suggested to select a portfolio with Bosch for high returns.
The optimal portfolio which is constructed is best as it has combination of Bosch, Maruti, and HUL.
6. CONCLUSION:
Constructing an optimal portfolio is a challenging task for the individualaswellastheinstitutionalinvestors.Amongthefivesamplecompanies,onlythreewereselectedforoptimalportfolio.Thefinaldecision of investing should be made only after considering all the factors affecting the stocks. These can be general economic factors or any other macroeconomic factors which govern the movement and action of the movement of these securities in the market. Many micro

DHII Volume 16, April 2018
Journal by the Department of MBA, MCA & M.Com (FA), Jyoti Nivas College Autonomous 99
DHII Volume 16, April 2018
Journal by the Department of MBA, MCA & M.Com (FA), Jyoti Nivas College Autonomous 99
studies of this kind need to be conducted considering different types of samples. The results of the present study have more utility value to the fund managers of emerging economies like India where the capital markets are still in their developing stages and many foreign institutional investors are also interested to invest in the leading stocks traded through the stock exchanges of these countries.
BIBLIOGRAPHY
Websites
1. www.moneycontrol.com2. www.economictimes.com3.www.nseindia.com4. www.sebi.gov.in5. www.rbi.com 6.www.edelweissfinancialservices.com Security Analysis and Portfolio Management, by Punithavathy
Pandian.

100 Journal by the Department of MBA, MCA & M.Com (FA), Jyoti Nivas College Autonomous
DHII Volume 16, April 2018
100 Journal by the Department of MBA, MCA & M.Com (FA), Jyoti Nivas College Autonomous
DHII Volume 16, April 2018

DHII Volume 16, April 2018
Journal by the Department of MBA, MCA & M.Com (FA), Jyoti Nivas College Autonomous 101
DHII Volume 16, April 2018
Journal by the Department of MBA, MCA & M.Com (FA), Jyoti Nivas College Autonomous 101
SECTION III M. COM (FA)

102 Journal by the Department of MBA, MCA & M.Com (FA), Jyoti Nivas College Autonomous
DHII Volume 16, April 2018
102 Journal by the Department of MBA, MCA & M.Com (FA), Jyoti Nivas College Autonomous
DHII Volume 16, April 2018

DHII Volume 16, April 2018
Journal by the Department of MBA, MCA & M.Com (FA), Jyoti Nivas College Autonomous 103
DHII Volume 16, April 2018
Journal by the Department of MBA, MCA & M.Com (FA), Jyoti Nivas College Autonomous 103
Foreword
The purpose of this journal is to develop an interest in research and create culture of research. This also intended in encouraging students to incorporate independent Study in an area of their choice and gear them for higher levels of academia.
The third section of DHII comprises of fi ve papers in the fi eld of Finance and Accounting. The fi rst paper talks about analyzing the potency of assets management through the connection between in operation cycle amount and profi tableness of Fourenn Apparels Limited. To measure the Capital Management potency, operative cycle has been calculated and therefore the relationship is formed with margin quantitative relation.
The second paper of Dhii focuses on crucial Investment decisions using risk and return analyses. The investor and analyst are always interested in knowing historical performance of the major indices and therefore this relevant study focuses on learning what the return for each of NIFTY 50 companies during the last three years.
The third article provides insights about impact of M&A on Working Capital. Mergers and acquisitions enable a company to achieve varied objectives and fi nancial strategies. The current study gives a clear view on the impact of merger of “STRIDES ARCOLAB” with “SHASUN PHARMACEUTICALS” on the working capital management. For this purpose various components relating to the working capital were selected from the fi nancial statements of the company and their results were studied in detail.
The fourth paper of Dhii focuses on Mutual Funds. Mutual funds have become the attractive way for the investors to invest their money. The motto of the study is to obtain and analyses the performance of mutual fund using Sharpe’s, Jensen’s and Treynor’s ratio models, and evaluate the relationship of selected mutual funds against the market using correlation, measuring the risk using
“Accounting does not make corporate earnings or balance sheets more volatile. Accounting just increases the transparency of volatility in
earnings”– Diane Garnick

104 Journal by the Department of MBA, MCA & M.Com (FA), Jyoti Nivas College Autonomous
DHII Volume 16, April 2018
104 Journal by the Department of MBA, MCA & M.Com (FA), Jyoti Nivas College Autonomous
DHII Volume 16, April 2018
beta. The study also guides the investors in selecting the type of the scheme based on the investors risk bearing capacity.
The fi fth article in Dhii focuses Performance Analysis of Five Pharmaceutical Companies. The current study carried out to know the share price fl uctuations of the selected companies and gives clarity to the investor to choose the better market to earn profi t within short span of time. The reason behind the selection of the current study is that the values of the stocks keep fl uctuating and it becomes diffi cult task for the investors to make decision regarding the selection of portfolio and investment.
Dr. Jahnavi M
Assistant Professor, Department of M.Com (FA)
Jyoti Nivas College Autonomous

DHII Volume 16, April 2018
Journal by the Department of MBA, MCA & M.Com (FA), Jyoti Nivas College Autonomous 105
DHII Volume 16, April 2018
Journal by the Department of MBA, MCA & M.Com (FA), Jyoti Nivas College Autonomous 105
DHIIVol. XVI, April 2018
Journal, Dept. of MBA, MCA and M.Com (FA) Jyoti Nivas College Autonomous
WORKING CAPITAL MANAGEMENT AT FOURENN APPARELS LIMITED
~Chettiar Kavya Ravi
Abstract
Decisions with reference to capital involve managing relationships between a fi rm’s short assets and liabilities to make sure a fi rm is in a position to continue its operations, and have suffi cient money fl ows to satisfy each maturing short debts and future operational expenses at lowest prices, increasing fi rm’s gain. The capitals noticeably go along with the operative cycle. A poring over of the operative cycle reveals that funds endowed within the operation area unit recycled back in to money. The shorter the amount of operative cycle the larger are going to be the turnover of the funds endowed in varied functions. The shorter amount of operative cycle shows higher potency of a fi rm. The potency of assets management are often determined by the in operation cycle of the fi rm. This paper aims at analyzing the potency of assets management through the connection between in operation cycle amount and profi tableness of Fourenn Apparels Limited. To measure the capital Management potency, operative cycle has been calculated and therefore the relationship is formed with margin quantitative relation.
Key Words: Working Capital, Operating Cycle, Profi tability, Operating Profi t.

106 Journal by the Department of MBA, MCA & M.Com (FA), Jyoti Nivas College Autonomous
DHII Volume 16, April 2018
106 Journal by the Department of MBA, MCA & M.Com (FA), Jyoti Nivas College Autonomous
DHII Volume 16, April 2018
1. INTRODUCTION
Working capital management refers to a company's managerial accounting strategy designed to monitor and utilize the twocomponents of working capital: current assets and current liabilities, toensurethemostfinanciallyefficientoperationofthecompany.Theprimary purpose of working capital management is to make sure the companyalwaysmaintainssufficientcashflowtomeetitsshort-termoperating costs and short-term debt obligations.
There are two interpretations of working capital under the balance sheet concept. It is represented by the excess of current assets over currentliabilitiesandistheamountnormallyavailabletofinancethecurrent operations.
Longer the period of the cycle, bigger will be the working capital requirements. Operating cycle means the cycle of raw materials to workinprogresstofinishedgoodstoaccountspayableandfinallytocash. Operating cycle time is the time taken starting from raw material purchases to its conversion into cash.
The interplay of how and when a company pays for its inventory and monetizesitssalesiscalleditscashcycle.Maximizingthefrequencyofthecycleiscrucial totheefficientuseofacompany’sworkingcapital. Three of these ratios are inventory turnover ratio, accounts receivable days and accounts payable days.
Theprojectfocusesontheindustryprofile,companyprofile,SWOTanalysis,financialstatementsandmainlyaboutworkingcapitalandthe operating cycle. In addition to this concept the project also studies theoverallorganizationroleofdifferentdepartmentfunctionsoftheirrespective departments, procedures and policies.
2. REVIEW OF LITERATURE
Dinesh M. (2008) explicates the concepts of working capital, the differentchallengesbeingfacedbythebusinessfirmsinmanagingworking capital and the strategies to be adopted for its prudent management. The author concludes with the view that most of the

DHII Volume 16, April 2018
Journal by the Department of MBA, MCA & M.Com (FA), Jyoti Nivas College Autonomous 107
DHII Volume 16, April 2018
Journal by the Department of MBA, MCA & M.Com (FA), Jyoti Nivas College Autonomous 107
businessesfailednotforwantofprofitbutforlackofcash.Thefastgrowthinproductionandsalesmaycausethebusinesstoutilizeallofthefinancialresourcesseekinggrowthandmakingassetssuchasinventories, accounts receivable and other assets as more illiquid.
Rahman Mohammad M. (2011) focuses on the co-relation between working capital and profitability.An effectiveworking capitalmanagementhasapositiveimpactonprofitabilityoffirms.Fromthestudyitisseenthatinthetextileindustryprofitabilityandworkingcapital management position are found to be up to the mark.
Dr Panigrahi Ashok Kumar (2012) studies the relationship between working capital management and profitability of ACC Cement Company, the leading cement manufacturer of the country for assessingtheimpactofworkingcapitalmanagementonprofitabilityduring the period 1999-2000 to 2009-10. The study is based on secondarydata.Themainobjectiveofthestudywastofindwhethertheworkingcapitalmanagementaffectstheperformanceofthefirm.Itcan be deduced that there is a moderate relationship between working capitalmanagementandthefirm’sprofitability.
Joseph Jisha (2014) closely examines the study of working capital management in Ashok Leyland and points out that the liquidity and profitabilitypositionofthecompanyisnotsatisfactory,andneededto be strengthened in order to be able to meet its obligations in time.
3. RESEARCH METHODOLOGY
3.1 Background of the Study:
For any diversified company, the key to success is the proper distribution of its resources. So, it is necessary for the management to do a detailed evaluation of the financial statement. Financialstatementcontainalargevolumeoffinancialfiguresfromastudyoftheseabsolutefigures,itisnotpossibletoformapreciseideaaboutthefinancialsignificanceandbusinessposition.To form a precise idea aboutthedatacontainedinvariousfinancialstatement,itisnecessarytoestablishrelationshipbetweenthefinancialfigures.

108 Journal by the Department of MBA, MCA & M.Com (FA), Jyoti Nivas College Autonomous
DHII Volume 16, April 2018
108 Journal by the Department of MBA, MCA & M.Com (FA), Jyoti Nivas College Autonomous
DHII Volume 16, April 2018
ThetopicisefficiencyofworkingcapitalmanagementofFourennApparelsLimited.Thefinancialanalysisofthecompanyisanalyzedand suggestions are given. Balance sheet concept and Operating cycle conceptareusedtoanalyzethefinancialpositionofthecompany.
3.2 Statement of the Problem:
The company needs fund for its day-to-day operations. Adequacy or inadequacyoffundwoulddeterminetheefficiencywithwhichthedaily business may be carried on. An excessive amount of working capital would mean that the company has ideal funds. Since funds have a cost, the company has to pay interest on such ideal funds, resulting inlowprofitoralowrateofreturn.Ontheotherhand,inadequateworking capital may result in the risk of insolvency.
Therefore, the main problem is to estimate and maintain working capitalrequirement,aftertakingintoconsiderationrisk,profitabilityand liquidity factors.
3.3 Need and Importance of the Study:
This project is helpful in knowing the company’s position of funds maintenance and setting the standards for:
working capital management
operating cycle components such as inventory period, average receivable period and account receivable period
It also helps the management to know present availability of funds.
Ithelpstoknowtheoverallfinancialpositionofthecompany.
Toanalyzetheshort-termfinancingpoliciesandpatternswhichaffecttheworkingcapitaloftheorganization.
It also helps to compare the previous year and the present year data.
To study the factors that affects the working capital management at Fourenn Apparels Limited.
DHII Volume 16, April 2018
Journal by the Department of MBA, MCA & M.Com (FA), Jyoti Nivas College Autonomous 109
DHII Volume 16, April 2018
Journal by the Department of MBA, MCA & M.Com (FA), Jyoti Nivas College Autonomous 109
A study of working capital is of major importance to internal and external analysis because of its close relationship with the day-to-day operations of a business.
3.4 Objectives of the Research:
To study the working capital management.
To study the different components of working capital of the company.
To know the sources of working capital.
Tostudytheworkingcapitalofanorganization.
Tostudytheoperatingcycleofanorganization.
3.5 Actual Collection of the Data:
This research is mainly based on the data of 4 years. There are various methods of data collections in that primary and secondary data are essential.
• Primary data: The information collected from personal interaction with manager, executives and other staffs.
• Secondary data: The annual report of the company.
3.6 Research Design:
The research design refers to the overall strategy that you choose to integrate the different components of the study in a coherent and logical way, thereby, ensuring the blueprint for the collection, measurement, and analysis of data.
• Analytical research- it is a specific type of research thatinvolves critical thinking skills and the evaluation of facts and information relative to the research being conducted. A variety of people use analytical research during studies to find themost relevant information. From analytical research, a person findsoutcriticaldetailstoaddnewideastothematerialbeingproduced.

110 Journal by the Department of MBA, MCA & M.Com (FA), Jyoti Nivas College Autonomous
DHII Volume 16, April 2018
110 Journal by the Department of MBA, MCA & M.Com (FA), Jyoti Nivas College Autonomous
DHII Volume 16, April 2018
3.7 Limitations of the Study:
Thestudyislimitedto4yearsofdataforfinancialanalysis.
The study deals only with the impact of working capital without considering the risk involved.
The project is mainly based on secondary data.
4. DATA ANALYSIS AND INTERPRETATION
Graph 4.1: Investments In Current Assets:
The above graph shows the total current assets of 4 years. It has been gradually increased year after year till 2014-2015. In the year 2015-2016 there has been a decrease in the current assets. There is highest growthofcurrentassetsintheyear2014-2015ofRs.23,84,80,720.Hencethecompany’sgrossprofitisincreasingwithadecreaseintheyear 2015-2016.
Graph 4.2: Total Working Capital

DHII Volume 16, April 2018
Journal by the Department of MBA, MCA & M.Com (FA), Jyoti Nivas College Autonomous 111
DHII Volume 16, April 2018
Journal by the Department of MBA, MCA & M.Com (FA), Jyoti Nivas College Autonomous 111
The above graph shows the total working capital of 4 years. It has been gradually increased year after year from 2012 to 2016. The working capitalfortheyear2012-2013isRs4,28,23,776;fortheyear2013-2014isRs4,36,38,542;andfortheyear2014-2015and2015-2016the working capital is Rs 5,21,12,452.
4.2: OPERATING CYCLE CONCEPT: From the financial statement of the firmwe can estimate the inventory period, theaccounts receivable period and accounts payable period.
Inventory period =
Average receivable period =
Accounts payable period =
Table 4.1: Cost of Goods Sold
Year Cost of goods sold
(Rs)
Inventory period(days)
Average receivable
period(days)
Accounts payable period(days)
Opera-ting
cycle(in days)
2012-2013
40,67,98,575 28 111 38 139
2013-2014
47,06,69,330 20 103 48 123
2014-2015
45,01,94,041 42 142 82 184
2015-2016
50,98,46,102 26 100 46 126
Here thefirm’soperatingcycle isfluctuating.Theoperatingcyclehasdecreasedfrom139daysduring2012-2013to126daysduring2015-2016.Theoperatingcycleofthefirmissatisfactorybecauseithascomedownby13days.

112 Journal by the Department of MBA, MCA & M.Com (FA), Jyoti Nivas College Autonomous
DHII Volume 16, April 2018
112 Journal by the Department of MBA, MCA & M.Com (FA), Jyoti Nivas College Autonomous
DHII Volume 16, April 2018
Table 4.2: Cash Cycle
Year Operating cycle Account payable period
Cash cycle (in days)
2012-2013 139 38 1012013-2014 123 48 752014-2015 184 82 1022015-2016 126 46 80
Thefirm’scashcycle isalsosatisfactoryas ithasdecreasedfrom101days to80daysduring2012-2013 to2015-2016respectively.However it is also observed that the debtor’s collection period has decreased from 111 days to 100 days during the same period, whereas thecreditor’scollectionperiodhasincreasedfrom38daysto46daysduringthetimeperiodof2012-2013and2015-2016respectively.
4.3: CALCULATION OF RATIOS:
The gross profi t ratio reflectstheefficiencywithwhichmanagementproduces each unit of product. This ratio indicates the average spread between the cost of goods sold and the sales revenue. The ratio, which expresses the relationship between the working capital and sales, is called working capital turnover ratio. It is calculated as follows:
Net current asset turnover ratio =
Table 4.3: Gross Profi t (In Rs)
Year Net sales Cost of goods sold
Grossprofit Grossprofitratio
2012-2013
41,08,32,628 40,67,98,575 40,34,053 0.98
2013-2014
47,25,26,579 47,06,69,330 18,57,249 0.39
2014-2015
45,32,59,305 45,01,94,041 30,65,264 0.67
2015-2016
50,71,99,613 50,98,46,102 (26,46,489) -0.52
Net current asset turnover ratio =

DHII Volume 16, April 2018
Journal by the Department of MBA, MCA & M.Com (FA), Jyoti Nivas College Autonomous 113
DHII Volume 16, April 2018
Journal by the Department of MBA, MCA & M.Com (FA), Jyoti Nivas College Autonomous 113
Thegrossprofitratioisnotsatisfactorybecausethisratioisnotstable;itisfluctuatingwidelyyearbyyearfrom2012-2013to2015-2016.Thehighestratiois0.98andthelowestratiois-0.52.Herethefirmhashigherthesalesin2012-2013sotheratioishighandduetolowerthe sales or higher the cost of goods sold so in the year 2015-2016 it is in negative. This may be due to weak customer demand, heavy competition and investment made by the company.
Table 4.4: Working Capital Turnover Ratio
Year Net sales(Rs)
Working capital(Rs)
Working capital turnover ratio
2012-2013
41,08,32,628 4,28,83,776 9.58
2013-2014
47,25,26,579 4,36,38,542 10.83
2014-2015
45,32,59,305 5,21,12,452 8.70
2015-2016
50,71,99,613 5,21,12,452 8.70
A working capital turnover ratio indicates that of high working capital turnover and lownetworking capital.Here in thefirm there arefluctuations.Inthelasttwoyears,thereisconstantworkingcapitalturnoverratioof8.7,whichistheleastfrom2012-2013to2015-2016.The highest working capital turnover ratio has been recorded in the year2013-2014of10.83.Thefirmhastomaintaininincreasingtheworking capital turnover ratio.
5. FINDINGS:
1. Thechangesinworkingcapitalfortheyear2012-2013isRs3,73,09,110andRs4,28,83,110respectively.Itshowsworkingcapital increase to Rs 55,74,666 in the year 2012 when compared totheyear2013.Byincreaseinnetworkingcapital,thefirmissatisfactory with its working capital.

114 Journal by the Department of MBA, MCA & M.Com (FA), Jyoti Nivas College Autonomous
DHII Volume 16, April 2018
114 Journal by the Department of MBA, MCA & M.Com (FA), Jyoti Nivas College Autonomous
DHII Volume 16, April 2018
2. Thechangesinworkingcapitalfortheyear2013-2014isRs4,28,83,776andRs4,36,38,542respectively.ItshowsworkingcapitalincreasetoRs7,54,766intheyear2013whencomparedtotheyear2014.Byincreaseinnetworkingcapitalthefirmissatisfactory with its working capital.
3. Thechangesinworkingcapitalfortheyear2014-2015isRs4,36,38,542andRs5,21,12,452respectively.Itshowsworkingcapital increase to Rs 84, 73,910 in the year 2014 whencompared to the year 2015. By increase in net working capital, thefirmissatisfactorywithitsworkingcapital.
4. The changes in working capital for the year 2015-2016 is Rs 5,21,12,452andRs5,13,61,264respectively.Itshowsworkingcapital decrease to Rs 7,51,188 in the year 2016 when compared totheyear2015.Bydecreaseinnetworkingcapitalthefirmisnot satisfactory with its working capital.
5. Here the firm’s operating cycle is fluctuating.The operatingcyclehasdecreased from139daysduring2012-2013 to126days during 2015-2016. The operating cycle of the firm issatisfactorybecauseithascomedownby13days.
6. Thefirm’scashcycle isalsosatisfactory,as ithasdecreasedfrom 101 days to 80 days during 2012-2013 to 2015-2016respectively.
7. However it is also observed that the debtor’s collection period has decreased from 111 days to 100 days during the time period from2012-2013to2015-2016respectively.
8. Thecreditor’scollectionperiodhasincreasedfrom38daysto46daysduring the timeperiodof2012-2013and2015-2016respectively.
9. Thegrossprofitratioisnotsatisfactorybecausethisratioisnotstable.Itisfluctuatingwidelyyear-by-yearfromtheyear2012-
DHII Volume 16, April 2018
Journal by the Department of MBA, MCA & M.Com (FA), Jyoti Nivas College Autonomous 115
DHII Volume 16, April 2018
Journal by the Department of MBA, MCA & M.Com (FA), Jyoti Nivas College Autonomous 115
2013 to 2015-2016.Thehighest ratio is 0.98 and the lowestratiois-0.52.Herethefirmhashigherthesalesin2012-2013so the ratio is high and due to lower the sales or higher the cost of goods sold in the year 2015-2016 it is very low.
10. A working capital turnover ratio indicates that of high working capitalturnoverandlownetworkingcapital.Hereinthefirmthere are fluctuations. In the last two years there is constantworking capital turnover ratio of 8.7, which is the least from 2012-2013to2015-2016.Thehighestworkingcapitalturnoverratiohasbeen recorded in theyear2013-2014of10.83.Thefirmhastomaintaininincreasingtheworkingcapitalturnoverratio.
6. SUGGESTIONS AND RECOMMENDATIONS:
1. Itcanbesaidthattheoverallfinancialpositionofthecompanyis high but it is required to be improved from the point of view ofprofitability.
2. Amongst current assets, the major portion has been occupied by the trade receivables and the inventories. The company should maintain a balance in holding these two current assets, as both are very crucial for the running of any business.
3. The company can increase their net profit by reducing theoperating and other expenses. The company has incurred certainexpenditureonbrandbuildingwhichwillgivebenefitsover a certain period. The company anticipates good growth in terms of increased sales in the coming years.
4. Thegrossprofitratioisnotsatisfactorybecausetherearemorefluctuationsintheratios,sothecompanyneedstoconcentrateinitsprofits.
5. During the year 2015-2016, the company’s working capital is decreased due to less current assets and more liability, so it has
116 Journal by the Department of MBA, MCA & M.Com (FA), Jyoti Nivas College Autonomous
DHII Volume 16, April 2018
116 Journal by the Department of MBA, MCA & M.Com (FA), Jyoti Nivas College Autonomous
DHII Volume 16, April 2018
to make proper use of its current assets to maintain the business transactions and take measures to improve it.
6. The company must adopt proper inventory control techniques like ABC (Activity Better Control) analysis, fixation ofminimum,maximumorder levels toensurefullutilizationofresources, in order to make the inventory management more result oriented.
7. An effective assessment of use of working capital has to be maintainedinordertomaximizeprofits.
8. Effective learning and development programmes must be providedtotheemployeeswithrespecttooptimumutilizationof resources.
9. Close monitoring and inspecting the activities and stocks of the borrowers from time to time can avoid the misuse of working capital.
10. The company should maintain consistency in performance.
7. CONCLUSION:
Working Capital Management is an important aspect of any business. Every business concern should have adequate working capital to run its business operation. Working Capital is the life blood of an organization.
In this study different tools such as schedule showing changes of WorkingCapital,operatingcycle,cashcycle,grossprofitratioandWorkingCapitalinventoryturnoverratiowereusedtoanalyzetheWorking Capital Management at Fourenn Apparels Limited.
From the study of the company’s performance of the past four years andtheoverallanalysisoftheorganization,itisconcludedthatthefirmhassufficientworkingcapitaltomeetitscurrentobligationsandday-to-day operations. The company is doing best with its innovative ideas by introducing new products with high quality and by adopting good channels of distributions.

DHII Volume 16, April 2018
Journal by the Department of MBA, MCA & M.Com (FA), Jyoti Nivas College Autonomous 117
DHII Volume 16, April 2018
Journal by the Department of MBA, MCA & M.Com (FA), Jyoti Nivas College Autonomous 117
Workingcapitalhasemergedasamajorfactorintheprofitabilityofthecompany.ThegoalofWorkingcapitalistominimizethecostofWorkingcapitalwhilemaximizingthefirm’sprofit.Theproductionvalue has increased during the years and the sales and sales volume are retrieving to increase. But at the same time the inventory turnover ratio is decreasing. The company should withdraw its investments from inventory and get rid of excess inventory so as to improve the turnover and reduce its inventory holding costs. This study helps ustoknowthatthecompany’sfinancialpositionisnotappreciablebecause there is loss in the present year due to high expenses, so it has to control the costs.
By the analysis offinancial statement, I conclude that theoverallfinancialperformanceof thecompanyissatisfactoryexcept inthecurrent year’s scenario. The company should adopt some new trend management strategies that will help in greater productivity, inventory optimization and also betterWorking capitalmanagement.Thecompanycanalso try to takesomemeasures to increaseprofitbyproperutilizationofavailableresources.
BIBLIOGRAPHY:
1. Financial Management by Shashi.K.Gupta, Kalyani Publishers.2. Working Capital Management by N.K. Jain, APH Publishers.3. WorkingCapitalManagement:StrategiesandTechniquesby
Hrishikes Battacharya, PHI Learning.4. Fourenn Apparels Limited- Annual Report and financial
statementswww.adityabirla.com - Aditya Birlawww.madurafnl.com – Madura Fashion and Lifestylewww.abfrl.com www.emis.comwww.wikipedia.com

118 Journal by the Department of MBA, MCA & M.Com (FA), Jyoti Nivas College Autonomous
DHII Volume 16, April 2018
118 Journal by the Department of MBA, MCA & M.Com (FA), Jyoti Nivas College Autonomous
DHII Volume 16, April 2018

DHII Volume 16, April 2018
Journal by the Department of MBA, MCA & M.Com (FA), Jyoti Nivas College Autonomous 119
DHII Volume 16, April 2018
Journal by the Department of MBA, MCA & M.Com (FA), Jyoti Nivas College Autonomous 119
ANALYSIS OF THE INDIAN STOCK MARKET AND IT’S PERFORMANCE
~Janhavi.S
Abstract
Avenues for investment are abundant like bank deposits, property, shares etc. But taking an investment decision would be more crucial. Analyzing the risk associated with every investment option and evaluates the return out of investment become very crucial. The topic risk and return analyses relevant in this circumstances. The investor and analyst are always interested in knowing historical performance of the major indices and therefore this relevant study focuses on learning what the return for each of NIFTY 50 companies during the last three years. Before designing the portfolio, it is important for investors to known the relation between the nifty markets with each company return, because the benefi t of diversifi cation from investing diff erent sums of money in diff erent companies should be given some thought as well.
1. INTRODUCTION
Stock Market is a market for long-term funds. Stock market focuses onfinancingoffixedinvestment.Stockmarketchannelizeshouseholdsavingstothecorporatesectorandallocatesfundstofirms.Itenablesthevaluationoffirmsonanalmostcontinuousbasisandplaysanimportantroleinthegovernanceofthecorporatesector.Anefficient
DHIIVol. XVI, April 2018
Journal, Dept. of MBA, MCA and M.Com (FA) Jyoti Nivas College Autonomous

120 Journal by the Department of MBA, MCA & M.Com (FA), Jyoti Nivas College Autonomous
DHII Volume 16, April 2018
120 Journal by the Department of MBA, MCA & M.Com (FA), Jyoti Nivas College Autonomous
DHII Volume 16, April 2018
stockmarketisanimportantconstituentofasoundfinancialsystem.A stock market deals mainly in corporate securities. The securities arechieflyinformofequitysharesanddebentures.Thepurposeofthese securities is to raise long-term funds for companies engaged in production.
Mostindividualinvestorsholdunderdiversifiedportfolios,whichleadto higher risk. The aim of this paper is to examine the relationship between risk and return. This research helps the investors to choose which company and which sector to invest, by taking an amount of risk. But the return which we get is more compared to government bonds,treasurybills,bankdepositsandpostofficesavings.
These are few reasons why should investors invest in stock market
• Keeppacewithinflation.
• Reachyourfinancialgoalswiththerightmixofinvestments.
• Reduceinvestingriskwithasolidassetallocationstrategy.
• Reduce risk with a well-planned strategy for buying andselling stocks.
2. LITERATURE REVIEW
1. According to Dr. S. Krishnaprabha, Mr. Vijayakumar “A STUDY ON RISK RETURN ANALYSISOF SELECTED STOCK”
This study states that risk and return analysis, plays a key role in most individual decision-making process. Every investor wants to avoid risk andmaximizereturn.Ingeneral,riskandreturngohand.Ifaninvestor,wishes to earn higher returns than the investor must appreciate that this will only be achieved by accepting a commensurate increase in risk. Based on risk and return analysis, high risk gives high returns with low risk gives to low return, based on this concept in Banking and Automobile sector high risk gives low return, and in Information Technology, Fast Moving Consumer Goods and in Pharmaceutical sector low risk gives high return. Alpha stock is positive and the companiesare independent tomarket returnandhaveaprofitablereturn

DHII Volume 16, April 2018
Journal by the Department of MBA, MCA & M.Com (FA), Jyoti Nivas College Autonomous 121
DHII Volume 16, April 2018
Journal by the Department of MBA, MCA & M.Com (FA), Jyoti Nivas College Autonomous 121
And concludes by stating Long term investors were able to take advantageofthemarketasitlessvolatile.Asthereislessfluctuationin the shares when compared to market as well as its prices, the long-term investors are able to predict about when the share will raise. Majority of Information technology, Fast Moving Consumer Goods, Pharmaceutical Sectors gives more return while compared to Banking and Automobile sector.
2. According to Dr. R. Narayanasamy “Risk and Return Analysis of Equity Shares with Special Reference it Companies (NSE) Stock Index 1Dr. R. Narayanasamy”
Dr. R. Narayanasamy states that, Stock market research is essential togoodfinancialandinvestmentdecisionmaking.Itwillbeabletodetermine the market price and trading volume for the stock, high and low price for the stock over different periods and the earnings for the company. To ascertain the right choice of a security or portfolio to an investor, it depends on the level of risk that the stock carries. Anestimationoftheriskreturnprofileofasecurityorportfolioisan important aspect in investment management. The stock market research will allow one to assess the possible risk of a stock against the possible rewards the stock may offer. The present study in this context is relevant in explaining the parity between risk and return intheIndianequitymarket.Itwilldefinitelyhelpthestakeholderstotakeappropriatedecisionregardingthetimeofinvestment,horizonof investment, quantum of investment and even portfolio selection.
3. According to, Ms. Anju Bala “INDIAN STOCK MARKET”
Ms. Anju Bala states that, Stock Market is one of the most vibrant sectors in thefinancial system,markingan importantcontributionto economic development. Stock Market is a place where buyers and sellers of securities can enter into transactions to purchase and sell shares, bonds, debentures etc. In other words, Stock Market is a plate form for trading various securities and derivatives. Further, it performs an important role of enabling corporate, entrepreneurs to raise resources for their companies and business ventures through public issues. Today long-term investors are interested to invest in

122 Journal by the Department of MBA, MCA & M.Com (FA), Jyoti Nivas College Autonomous
DHII Volume 16, April 2018
122 Journal by the Department of MBA, MCA & M.Com (FA), Jyoti Nivas College Autonomous
DHII Volume 16, April 2018
the Stock market rather than invest anywhere. The Bombay Stock Exchange (BSE), the National Stock Exchange (NSE) and the Calcutta Stock Exchange (CSE) are the three large stock exchanges of Indian Stock Market. The main objective of present study is to present review of literature related to Indian Stock Market to study the Indian Stock Market in depth. The study would facilitate the reader to know the past, current and future trend or prospects of Indian Stock market. Thisstudywouldprovideguidelinestoinvestortomaximizeprofitwithminimizerisks.Highdegreeofvolatilityintherecenttimesinthe Indian market has led to more development in the future.
3. RESEARCH METHODOLOGY
3.1 Statement of the Problem
The aim of investors is getting investment opportunities with minimum risk and maximum returns. Risk and returns are important variables that investors are looking for, at the time of investment decision making.
3.2 Need and Importance of the Study
ToanalyzeNIFTY50companiesrisk,return,betaperformanceinorder to understand and give the clear idea of stock market, about the making decision regarding the investment in stocks of different companies.
3.3 Limitation of the Study
• Studyiscompletelybasedonhistoricaldata.
• ScopeislimitedonlytoNifty50companies.Duetolackoftime other than Nifty 50 other listed companies shares are not considered for the study.
3.4 Objectives of the Study• ToanalyzetheNifty50companiesmovementsalongwiththe
market.• ToanalyzeriskandreturnoftheNifty50companies.
• Tosuggesttheinvestorswhichcompanytheycaninvest,takeinto consideration risk and return.
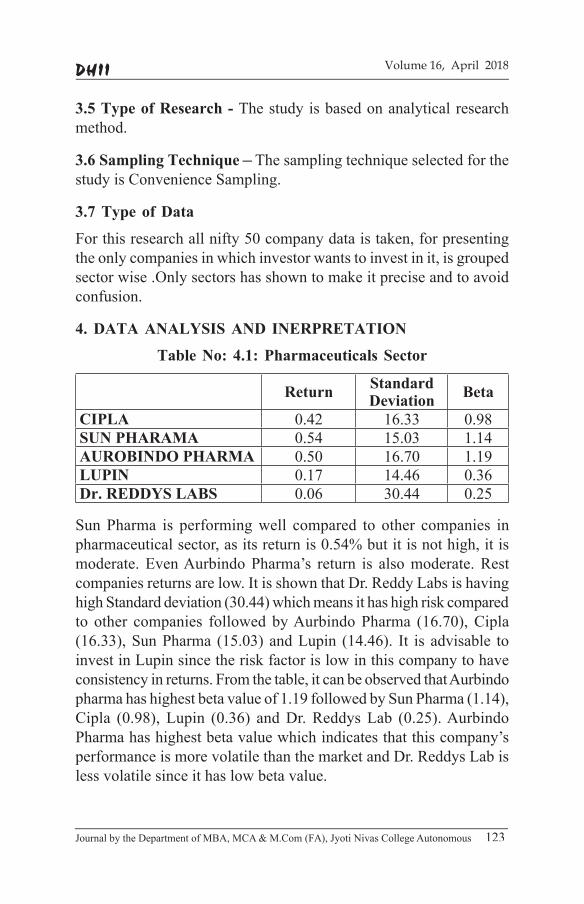
DHII Volume 16, April 2018
Journal by the Department of MBA, MCA & M.Com (FA), Jyoti Nivas College Autonomous 123
DHII Volume 16, April 2018
Journal by the Department of MBA, MCA & M.Com (FA), Jyoti Nivas College Autonomous 123
3.5 Type of Research - The study is based on analytical research method.
3.6 Sampling Technique – The sampling technique selected for the study is Convenience Sampling.
3.7 Type of Data
For this research all nifty 50 company data is taken, for presenting the only companies in which investor wants to invest in it, is grouped sector wise .Only sectors has shown to make it precise and to avoid confusion.
4. DATA ANALYSIS AND INERPRETATION
Table No: 4.1: Pharmaceuticals Sector
Return Standard Deviation Beta
CIPLA 0.42 16.33 0.98SUN PHARAMA 0.54 15.03 1.14AUROBINDO PHARMA 0.50 16.70 1.19LUPIN 0.17 14.46 0.36Dr. REDDYS LABS 0.06 30.44 0.25
Sun Pharma is performing well compared to other companies in pharmaceutical sector, as its return is 0.54% but it is not high, it is moderate. Even Aurbindo Pharma’s return is also moderate. Rest companies returns are low. It is shown that Dr. Reddy Labs is having highStandarddeviation(30.44)whichmeansithashighriskcomparedto other companies followed by Aurbindo Pharma (16.70), Cipla (16.33),SunPharma (15.03)andLupin (14.46). It is advisable toinvest in Lupin since the risk factor is low in this company to have consistency in returns. From the table, it can be observed that Aurbindo pharma has highest beta value of 1.19 followed by Sun Pharma (1.14), Cipla (0.98),Lupin (0.36) andDr.ReddysLab (0.25).AurbindoPharma has highest beta value which indicates that this company’s performance is more volatile than the market and Dr. Reddys Lab is less volatile since it has low beta value.

124 Journal by the Department of MBA, MCA & M.Com (FA), Jyoti Nivas College Autonomous
DHII Volume 16, April 2018
124 Journal by the Department of MBA, MCA & M.Com (FA), Jyoti Nivas College Autonomous
DHII Volume 16, April 2018
Table No: 4.2: Cement Sector
Return Standard Deviation Beta
AMBUJA CEMENT 0.67 11.32 1.08ULTRA TECH CEMENT 0.68 10.23 0.99ACC 0.72 9.26 0.95
All three companies Ambuja Cement, Ultra Tech Cement, ACC have a moderate return - 0.67%, 0.68%, 0.72% respectively. The highest returns are of ACC ie. 0.72%. It is shown that Ambuja Cement have highest Standard deviation (11.32)whichmeans it has high riskcomparedtoothercompaniesfollowedbyUltraTechCement(10.23)and ACC (9.26). It is advisable to invest in Ambuja cement since the risk factor is low in this company to have consistency in returns. From the table, it is observed that Ambuja Cement has highest beta value of 1.08 followed by Ultra Tech Cement (0.99) and ACC (0.95). Ambuja Cement has highest beta value which indicates that this company’s performance is more volatile than the market. ACC is less volatile since it has low beta value.
Table No: 4.3: Banking Sector
Return Standard Deviation Beta
HDFC 0.91 7.12 0.92ICICI BANK 0.77 8.90 0.96INDUSLND BANK 0.71 12.89 1.30HDFC BANK 0.90 7.20 0.92AXIS BANK 0.78 16.29 1.80KOTAK MAHINDRA 0.54 11.37 1.30YES BANK 0.80 18.31 2.07SBI 0.75 18.43 1.95BANK OF BARODA 0.42 15.72 0.93INDIABULLS HSG 0.72 25.10 2.55
There is only one bank, which gives lower return. Bank of Baroda who’s return is 0.42%. India bulls HGS, Indus Ind Bank, Kotak Mahindra returns are moderate. HDFC and HDFC bank returns are
DHII Volume 16, April 2018
Journal by the Department of MBA, MCA & M.Com (FA), Jyoti Nivas College Autonomous 125
DHII Volume 16, April 2018
Journal by the Department of MBA, MCA & M.Com (FA), Jyoti Nivas College Autonomous 125
high, 0.91 and 0.90 respectively. It is shown that Indian Bulls HSG have highest Standard deviation (25.10) which means it has high risk comparedtoothercompaniesfollowedbySBI(19.43),YESbank(18.31),AXISbank(16.29),BankofBaroda(15.72),IndusIndBank(12.89),KotakMahindra (11.37), ICICIbank (8.90),HDFCbank(7.20), and HDFC (7.12). It is advisable to invest in HDFC since the risk factor is low in this company to have consistency in returns. From the table, we can observe that India bulls HGS has highest beta valueof2.55followedbyYESbank(2.07),SBI(1.95),AXISbank(1.80),IndusIndBank(1.30),KotakMahindrabank(1.30),ICICIbank(0.96),BankofBaroda(0.93)andHDFC(0.92).IndiabullsHGShashighest beta value which indicates that this company’s performance is more volatile than the market and HDFC is less volatile since it has low beta value.
5. FINDINGS:
5.1. Pharmaceutical Sector:
• Sunpharmacyhashighestreturn0.54%.Itislessrisky,asitsstandarddeviation is15.03%.Butstock isvolatile than themarket
• Dr.ReddishLabshadlowreturnandalsoishighrisky,butless volatile, as it had low beta value.
5.2. Cement Sector Returns:
• ThehighestreturnsareofACC0.72%.ACC(9.26)haslessrisk. It is moderately affected by market
• Returns are low inAbuja Cement, it is shown thatAbujaCementhavehighestStandarddeviation(11.32)whichmeansit has high risk. Abuja Cement has highest beta value which indicates its going against the market
5.3. Banking and Finance Sector:
• Thereisonlyonebank,whichgiveslowerreturns,BankofBaroda whose return is 0.42%. India bulls, HGS, IndusInd bank, Kotak Mahindra returns are moderated and HDFC bank returns are high, 0.91 and 0.90 respectively.

126 Journal by the Department of MBA, MCA & M.Com (FA), Jyoti Nivas College Autonomous
DHII Volume 16, April 2018
126 Journal by the Department of MBA, MCA & M.Com (FA), Jyoti Nivas College Autonomous
DHII Volume 16, April 2018
• It is shown that Indian Bulls HSG have highest Standarddeviation (25.10) which means it has high risk compared to othercompaniesfollowedbySBI(19.43),YESbank(18.31),AXISbank(16.29),BankofBaroda(15.72),IndusIndBank(12.89),KotakMahindra(11.37),ICICIbank(8.90),HDFCbank (7.20), and HDFC (7.12).
• TheBETAperformanceofselectedcompaniesonthebasisofBanking & Financial sector. From the table, we can observe that India bulls HGS has highest beta value of 2.55 followed by YES bank ,SBI, AXIS bank, IndusInd Bank, KotakMahindra bank, ICICI bank, Bank of Baroda and HDFC .India bulls HGS has highest beta value which indicates that this company’s performance is more volatile than the market and HDFC is less volatile since it has low beta value
The other companies risk is high and returns are low or the return is not correlating with market. The sectors mentioned were doing comparatively better.
6. SUGGESTIONS AND RECOMMENDATIONS:
• Iftheinvestorswanttoinvestbasedonthereturns,theinvestorcan go for banking sector because the banks have given more weightage to Nifty 50.
• Iftheinvestorwantstoinvestbasedonrisktheinvestorcango for Banking and Cement sector because these companies has lower risk as compared to other sectors.
• Iftheinvestorwantstoinvestwithrespecttobetatheinvestorcan go for Finance, Pharmaceuticals and Metal sector because they move along the market.
7. CONCLUSION:
The banking sector gives more weightage to Nifty 50 as compared to other sectors. Clear study was made based on the historical data of theNSEstockmarkettoidentifytheflowandchangeswhichhappensin stock market for each sector in NIFTY 50 COMPANIES. From the three years data, which had commenced from April 2014 and up

DHII Volume 16, April 2018
Journal by the Department of MBA, MCA & M.Com (FA), Jyoti Nivas College Autonomous 127
DHII Volume 16, April 2018
Journal by the Department of MBA, MCA & M.Com (FA), Jyoti Nivas College Autonomous 127
to March 2017.To conclude, from the research done, investing in the BankingSectorinstockmarketwillalwaysgiveprofitablesolutionsto the investors. Risk and return go hand in hand therefore the risk should not be too high or too low as they may give lower returns.
BIBLOGRAPHY AND REFERANCE
www.nseindia.comwww.moneycontrol.com www.motilaloswal.com

128 Journal by the Department of MBA, MCA & M.Com (FA), Jyoti Nivas College Autonomous
DHII Volume 16, April 2018
128 Journal by the Department of MBA, MCA & M.Com (FA), Jyoti Nivas College Autonomous
DHII Volume 16, April 2018
DHII Volume 16, April 2018
Journal by the Department of MBA, MCA & M.Com (FA), Jyoti Nivas College Autonomous 129
DHII Volume 16, April 2018
Journal by the Department of MBA, MCA & M.Com (FA), Jyoti Nivas College Autonomous 129
IMPACT OF MERGER ON WORKING CAPITAL MANAGEMENT
~Swetha P
Abstract
Mergers and acquisitions enable a company to achieve varied objectives and fi nancial strategies, and this in turn contributes negatively or positively towards its working capital management. The study on “Impact of merger on working capital management” gives a clear view on the company’s profi le, their products and services; the motive of the current study is to bring out the impact of merger of “STRIDES ARCOLAB” with “SHASUN PHARMACEUTICALS” on the working capital management. For this purpose various components relating to the working capital were selected from the fi nancial statements of the company and their results were studied in detail. The results so obtained are represented using Graphs, Histogram and Pie charts, further the few suggestions and recommendations are made to improve the working capital position of the company.
1. INTRODUCTION
Corporate restructuring refers to broad array of activities that expand orcontractafirm’soperationsorsubstantiallymodifyitsfinancialstructureorbringaboutasignificantchangeinitsownershipstructure.Interlaid, it includes activities such as mergers, purchases of business
DHIIVol. XVI, April 2018
Journal, Dept. of MBA, MCA and M.Com (FA) Jyoti Nivas College Autonomous

130 Journal by the Department of MBA, MCA & M.Com (FA), Jyoti Nivas College Autonomous
DHII Volume 16, April 2018
130 Journal by the Department of MBA, MCA & M.Com (FA), Jyoti Nivas College Autonomous
DHII Volume 16, April 2018
units, takeovers, slump sales, demergers and equity carve outs. Refer to these activities collectively as mergers, acquisitions and restructuring or just corporate restructuring. A merger refers to the combination of two or more companies into one company. It may involve absorption or consolidation. In an absorption, one or more companies combine to form a new company, on the other hand consolidation refers to, two or more companies combine together to form a new company.
Decisions relating toworkingcapitalandshort-termfinancingarereferred to as Working capital management. These involve managing therelationshipbetweenthefirm’sshort-termassetsandshort-termliabilities. The goal of working capital management is to ensure that thefirmisabletocontinueitsoperationsandthatithassufficientcashflowtosatisfybothmaturingshort-termdebtandupcomingoperationalexpenses. The management of working capital will depends on the criteria like: Cash management - identify the cash balance which allows for the business to meet their day to day expenses, but reduces cash holding costs, Inventory management - Identify the level of inventory which allows for uninterrupted production but reduces the investmentinrawmaterialsandminimizesreorderingcostsandhenceincreasescashflow.Besidesthis,theleadtimesinproductionshouldbeloweredtoreduceworkinprogressandsimilarly,thefinishedgoodsshould be kept on as low level as possible to avoid over production. Debtor’s management - Identify the appropriate credit policy i.e., credit terms which will attract customers, such that any impact on cashflowsand the cashconversioncyclewill offsetby increasedrevenueandhencereturnoncapital.Shorttermfinancing-Identifytheappropriatesourceoffinancing,giventheCashconversioncycle-theinventoryisideallyfinancedbycreditgrantedbythesupplier;however,itmaybenecessarytoutilizeabankloanoroverdraftorto convert debtors to cash.
2. LITERATURE REVIEW
1. Safi , Hijazi, Tahir and Kamal (2005), in their study investigated the relationship between measures of working capital management and the corporate profitability of non-financialfirms.
DHII Volume 16, April 2018
Journal by the Department of MBA, MCA & M.Com (FA), Jyoti Nivas College Autonomous 131
DHII Volume 16, April 2018
Journal by the Department of MBA, MCA & M.Com (FA), Jyoti Nivas College Autonomous 131
2. According to Sagner (2007), one goal of merger is to improve theefficiencyofworkingcapitalmanagementandimprovetheutilization of current assets and liabilities. Many companieshoard cash hoping to discover or develop capital project with superior returns, while those opportunities may never appear. Merger plays an important role in the improvement of the efficiency of working capital management because of newmixture of board members which may include directors from different companies and countries.
3. AccordingtoLau and Block (2012),foundthatfounderfirmshold a significantlyhigher level of cash thanotherfirmsdo.In addition, they found a positive interaction effect between founder management and cash holdings on firm value,suggesting the presence of founders as managers helps to mitigate the agency cost of cash holdings.
4. Lalit Kumar Joshi and Sudipta Ghosh (2012), their study empiricalfindings reveal significant positive trendgrowth inmost of the selected performance indicators. Further the selected ratios show satisfactory performance during the study period. Motaalstestwasalsousedtoindicatesignificantimprovementin liquidity performance during the said period.
3. RESEARCH METHODOLOGY
3.1 Background of the Study
The Indian Pharmaceuticals market is the third largest in terms of volume and thirteen largest in terms of value, as per a report by equity master. India is the largest provider of generic drugs globally with the Indian generics accounting for twenty per cent of global exports in terms of volume. Of late, consolidation has become an important characteristic of the Indian pharmaceutical market as the industry is highly fragmented. India enjoys important position in the global pharmaceuticals sector. As pressures on Drug manufacturing,
132 Journal by the Department of MBA, MCA & M.Com (FA), Jyoti Nivas College Autonomous
DHII Volume 16, April 2018
132 Journal by the Department of MBA, MCA & M.Com (FA), Jyoti Nivas College Autonomous
DHII Volume 16, April 2018
research and development and regulatory aspects have been on the rise because of the competitive business environment in the last decade, the pharmaceutical industry worldwide growth has reached a saturation point. Strides Shasun is one of the leading pharmaceuticals companies in India, by studying the working capital management of thiscompanyithelpstoknowhowefficientlythecompanymanagesthe working capital and whether the merger has impact on it or not. In today’s competition, it becomes mandatory to keep large current assets in the form of inventories so as to ensure smooth production, and also investment into the liquid assets also play crucial role in this scenario. The study of working capital management helps to know the levels of optimum working capital and the relating assets to be maintained. These assets which have an impact on day-to-day operations of the businessnotonlyaffecttheliquiditypositionbuttheprofitabilityandthe position of the company as a whole.
3.2 Statement of the Problem
For this purpose, the analysis is done on the various aspects which relates to the working capital of the company, while studying these aspects one can know the impact of various assets and liabilities on the working capital. In this case the company whose working capitalisanalyzedisanExportorientedunitwhosesalesare100%on credit basis. There are a number of factors that are responsible for theimpropermanagementofafirmthroughthisstudythosefactorswhich are hurdle in the way of working capital can be disclosed and further steps can be taken to correct the same. When the company fails to manage the working capital it affects the fundamental health and operational success of the business. The Working capital not only coversthefinancialobligationsbutalsohelpstoboosttheirearnings.ItalsoinfluencestheReturnoncapital,Creditprofileandsolvency,Profitability, Liquidity, Business value, Financing conditions, Productions, Demand and Competitive advantage.
3.3 Need and Importance of the Study
To provide a clear picture of Working capital management of the company before and after merger, by understand the importance of assets and liabilities management in the company. To bring the various

DHII Volume 16, April 2018
Journal by the Department of MBA, MCA & M.Com (FA), Jyoti Nivas College Autonomous 133
DHII Volume 16, April 2018
Journal by the Department of MBA, MCA & M.Com (FA), Jyoti Nivas College Autonomous 133
problems faced by a company in managing the working capital of the company and recommend remedies in case of any discrepancies. The difficultiesfacedbythecompanytoperformitsday-to-dayoperationscan be revealed at the end of the study.
3.4 Limitations of the study
Thebalancesheetandstatementofprofitandlossfortheyear2011-12 to2015-16 is analyzed to study theworkingcapitalmanagement, which indicates what happened in the past which does not indicate current market valuation. Various sensitive information is regarding the policies of working capital other plans cannot be disclosed by the company, which is a limitation to the study. To know the effect of the merger only the statement of the year 2015-16 was used which will not give a clear picture of the impact of merger.
Analyst has to make interpretation and draw conclusions on his own, but different people interpret the same analysis in different way.Fromtheyear,2012-13thecompanychangeditssystemofmaintaining accounts fromcalendaryear tofinancial yearand prepared another statement according to financial year,hencethefinancialresultsofthisyear2012-13lacksaccuracy.
3.5 Objectives of the Research
To study the impact of merger on working capital management of the company.
To evaluate the liquidity, current assets, current liabilities asset usage,efficiency,assetturnoverandworkingcapitalstructureof the company. To evaluate various components relating to working capital management. To suggest measures for effective management of working capital.
To understand the cash and operating cycle of the company and how well the debtors or creditors are managed. To study the

134 Journal by the Department of MBA, MCA & M.Com (FA), Jyoti Nivas College Autonomous
DHII Volume 16, April 2018
134 Journal by the Department of MBA, MCA & M.Com (FA), Jyoti Nivas College Autonomous
DHII Volume 16, April 2018
proportion of various current assets to total assets and various current liabilities to total liabilities. To understand the impact of inventoryholdingonsalesandprofitofthecompany.
3.6 Hypothesis
• Null Hypothesis: There is no impact on the working capital due to the merger.
• Alternative hypothesis:There isa significant impacton theworking capital management due to merger.
Thefinancialstatementsofthepast5yearsofStridesShasunlimitedis used for this purpose.
3.7 Type of Research
This research is a quantitative research involving calculation of various financial ratios relating to various components ofworking capital are computed to see its effect on the management of current assets and current liabilities.
The aim of the study is to find out the relationship betweentheeventofmergerof“STRIDESARCOLAB”and“SHASUNPHARMACEUTICALS” on the working capital management ofthefirm,thisisacorrelationresearch,andthestudyseekstoknow the relationship between the same.
Besides knowing the relationship, this study also obtained an estimate of possible impact of the independent variable to the dependent variables. The data is collected from the annual reports of the companies.
The dependent variable will be the event when Merger and Acquisition takes place, while the independent variable is the ratios relating to working capital.
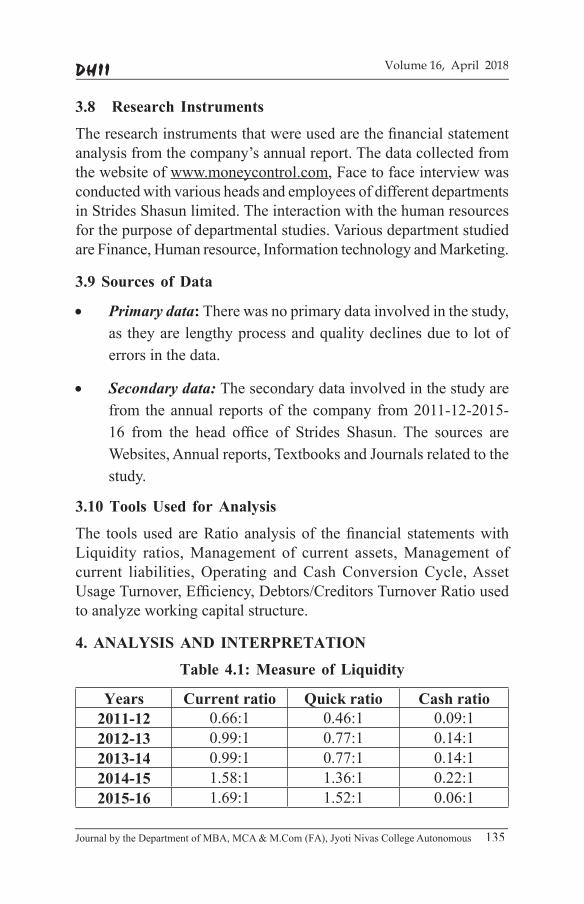
DHII Volume 16, April 2018
Journal by the Department of MBA, MCA & M.Com (FA), Jyoti Nivas College Autonomous 135
DHII Volume 16, April 2018
Journal by the Department of MBA, MCA & M.Com (FA), Jyoti Nivas College Autonomous 135
3.8 Research Instruments
Theresearchinstrumentsthatwereusedarethefinancialstatementanalysis from the company’s annual report. The data collected from the website of www.moneycontrol.com, Face to face interview was conducted with various heads and employees of different departments in Strides Shasun limited. The interaction with the human resources for the purpose of departmental studies. Various department studied are Finance, Human resource, Information technology and Marketing.
3.9 Sources of Data
• Primary data: There was no primary data involved in the study, as they are lengthy process and quality declines due to lot of errors in the data.
• Secondary data: The secondary data involved in the study are from the annual reports of the company from 2011-12-2015-16 from the head office of Strides Shasun. The sources areWebsites, Annual reports, Textbooks and Journals related to the study.
3.10 Tools Used for Analysis
The tools used areRatio analysis of thefinancial statementswithLiquidity ratios, Management of current assets, Management of current liabilities, Operating and Cash Conversion Cycle, Asset UsageTurnover,Efficiency,Debtors/CreditorsTurnoverRatiousedtoanalyzeworkingcapitalstructure.
4. ANALYSIS AND INTERPRETATION
Table 4.1: Measure of Liquidity
Years Current ratio Quick ratio Cash ratio2011-12 0.66:1 0.46:1 0.09:12012-13 0.99:1 0.77:1 0.14:12013-14 0.99:1 0.77:1 0.14:12014-15 1.58:1 1.36:1 0.22:12015-16 1.69:1 1.52:1 0.06:1

136 Journal by the Department of MBA, MCA & M.Com (FA), Jyoti Nivas College Autonomous
DHII Volume 16, April 2018
136 Journal by the Department of MBA, MCA & M.Com (FA), Jyoti Nivas College Autonomous
DHII Volume 16, April 2018
The Current ratio is on an increasing trend from 2011-12 to 2015-16, in the year 2012-13 and 2013-14 the ratiowas approachingtoward optimality and stood at 1.58:1 in 2014-15 to and is 1.69:1 in 2015-16, this indicates that the company is improving in its ability to pay its current obligations in time and the merger in 2015-16 has also positively impacted the company, and the scenario of the quick ratio also remains same which is on an increasing trend, but in comparison with the current ratio it is always below the current ratios which shows that the company, that the company’s current assets are highly dependent on inventory, also the ratio being less than 1:1 is a caution that the company does not have enough liquid assets to pay their current liabilities. The Merger of the company has significantlyaffectedthecashratioofthecompanytheratiowasonan increasing scale from 2011-12 to 2014-15 and fell to 0.06:1 in 2015-16,whichshowscompany’smergerisincreasingtheefficiencyofcashutilization.
Table 4.2: Management of Current Assets & Current Liabilities
Years Payables Turnover Receivables Turnover2011-12 7.31 9.682012-13 5.41 5.662013-14 5.41 5.662014-15 8.39 6.992015-16 7.11 6.07
The decreasing turnover of receivables indicate that the company’s collectionofaccountsreceivableisnotefficientandthecompany.Theoverall management of current assets of the company is satisfactory.
Thepayablesturnoverratioisonafluctuatingscalethehighestpayableturnoverratiois8.39intheyear2014-15thereasonbeingtherewasnodeferredtaxliabilityduringtheyearandthecompanyefficientlyutilizedthiscashtomeetitspayables,howeverwiththemergerin2015-16thedeferredtaxliabilitystoodatRs.361millionwhichagainimpacted the payables turnover.

DHII Volume 16, April 2018
Journal by the Department of MBA, MCA & M.Com (FA), Jyoti Nivas College Autonomous 137
DHII Volume 16, April 2018
Journal by the Department of MBA, MCA & M.Com (FA), Jyoti Nivas College Autonomous 137
Table 4.3: Operating Cycle and Cash Conversion Cycle
Years Operating cycle Net operating cycle2011-12 150 1002012-13 159 922013-14 288 2212014-15 113 702015-16 139 88
Theinventorydaysisalsofluctuatingfrom112daystoin2011-12to95daysin2012-13anditstoodat79daysin2015-16thisshowsthat the inventory sits on the company’s shelf for a longer period and the company is advised to correct the same, and the number of daysofpayablesfluctuatebuttendtoremainhighduetothefundsblocked in debtors, are unable to meet its payables, the operating and netoperatingcycleincreasedfrom2011-12to2013-14butdecreaseand then increase in 2014-15 due to the merger, this suggests that the company is in greater need for liquidity.
Table 4.4: Asset Usage Ratios
Years Fixed assets turnover
Current assets
turnover
Capital employed turnover
Working capital
turnover2011-12 1.55 1.56 1.40 (0.86)2012-13 1.11 0.86 0.62 (113.69)2013-14 1.01 0.79 0.56 (104.20)2014-15 1.86 0.87 0.89 2.362015-16 1.76 0.76 0.52 1.42
Theassetturnoverratiossuggestthatthecompanyhasutilizedthefixed,currentassetsandcapitalemployedveryadvantageously,theworkingcapitalturnoverfacesnegativefrom2011-12to2013-14thereason being current liabilities exceeding the current assets.
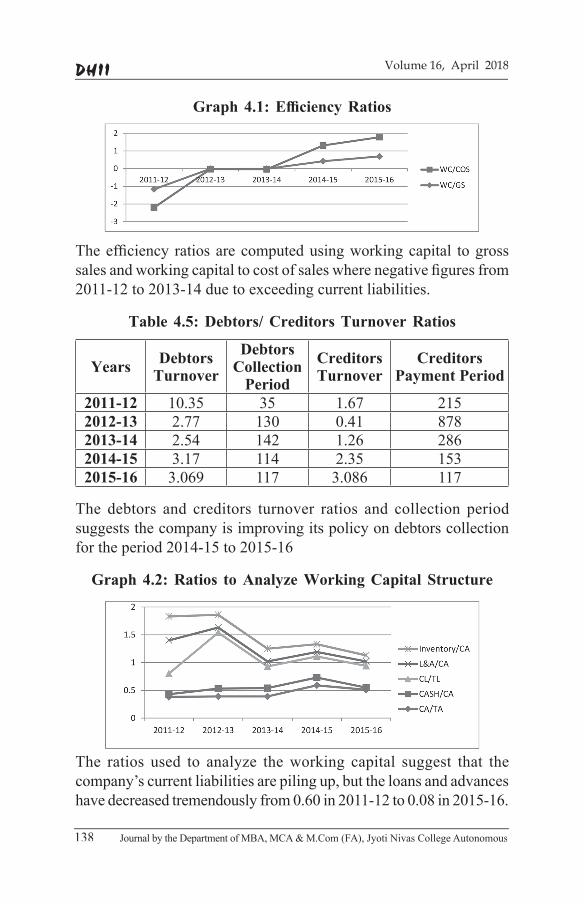
138 Journal by the Department of MBA, MCA & M.Com (FA), Jyoti Nivas College Autonomous
DHII Volume 16, April 2018
138 Journal by the Department of MBA, MCA & M.Com (FA), Jyoti Nivas College Autonomous
DHII Volume 16, April 2018
Graph 4.1: Effi ciency Ratios
Theefficiency ratiosarecomputedusingworkingcapital togrosssalesandworkingcapitaltocostofsaleswherenegativefiguresfrom2011-12to2013-14duetoexceedingcurrentliabilities.
Table 4.5: Debtors/ Creditors Turnover Ratios
Years Debtors Turnover
Debtors Collection
Period
Creditors Turnover
Creditors Payment Period
2011-12 10.35 35 1.67 2152012-13 2.77 130 0.41 8782013-14 2.54 142 1.26 2862014-15 3.17 114 2.35 1532015-16 3.069 117 3.086 117
The debtors and creditors turnover ratios and collection period suggests the company is improving its policy on debtors collection for the period 2014-15 to 2015-16
Graph 4.2: Ratios to Analyze Working Capital Structure
The ratios used to analyze theworking capital suggest that thecompany’s current liabilities are piling up, but the loans and advances have decreased tremendously from 0.60 in 2011-12 to 0.08 in 2015-16.
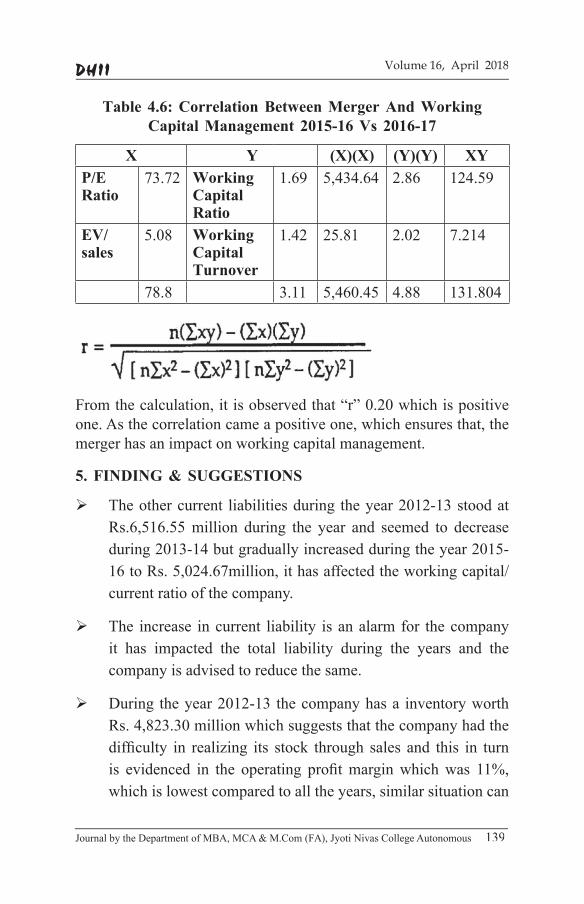
DHII Volume 16, April 2018
Journal by the Department of MBA, MCA & M.Com (FA), Jyoti Nivas College Autonomous 139
DHII Volume 16, April 2018
Journal by the Department of MBA, MCA & M.Com (FA), Jyoti Nivas College Autonomous 139
Table 4.6: Correlation Between Merger And Working Capital Management 2015-16 Vs 2016-17
X Y (X)(X) (Y)(Y) XYP/E Ratio
73.72 Working Capital Ratio
1.69 5,434.64 2.86 124.59
EV/sales
5.08 Working Capital Turnover
1.42 25.81 2.02 7.214
78.8 3.11 5,460.45 4.88 131.804
Fromthecalculation,itisobservedthat“r”0.20whichispositiveone. As the correlation came a positive one, which ensures that, the merger has an impact on working capital management.
5. FINDING & SUGGESTIONS
Theothercurrent liabilitiesduring theyear2012-13stoodatRs.6,516.55 million during the year and seemed to decrease during2013-14butgraduallyincreasedduringtheyear2015-16 to Rs. 5,024.67million, it has affected the working capital/current ratio of the company.
The increase in current liability is an alarm for the company it has impacted the total liability during the years and the company is advised to reduce the same.
During theyear2012-13 thecompanyhasa inventoryworthRs.4,823.30millionwhichsuggeststhatthecompanyhadthedifficulty in realizing its stock through sales and this in turnis evidenced in the operating profitmarginwhichwas 11%,which is lowest compared to all the years, similar situation can

140 Journal by the Department of MBA, MCA & M.Com (FA), Jyoti Nivas College Autonomous
DHII Volume 16, April 2018
140 Journal by the Department of MBA, MCA & M.Com (FA), Jyoti Nivas College Autonomous
DHII Volume 16, April 2018
beseenintheyear2015-16wheretheoperatingprofitmarginis18%.Thecompanyisadvisedtoplanitsinventoryrealizationbetter in order to boost its sales.
The company’s long term loan during the year 2015-16 stands at Rs29,598 million which comprises more than 80% of the total borrowing, this might affect the solvency position of the company in future and the company is advised to reduce the same.
The company is also advised to raise its funds through short-term borrowings.
Since the company makes 100% credit sales, the funds of the company are blocked in its debtors and the company alsoseemsnottohavetakenstepstorealizethemintheyear2012-13debtorsseemtodecreasebutincreasedgraduallyandstandsat10,965.31during2015-16,thecompanyisadvisedtotake proper steps to correct the same. The company’s current liability is exceeding the current assets, which in turn affects the working capital of the company, hence it is suggested that the company should take suitable measures to overcome the same.
Since the company is an Export oriented unit, it is advised to maintain sufficient cash to meet its requirements of cost ofsales. The company is also advised to increase its internal funds by further issue of shares.
6. Conclusion
The overall analysis of the financial statement suggests thatthecompanyhasanefficientmanagementofworkingcapital.The analysis also proved that the merger has impacted on the working capital management of strides shasun.

DHII Volume 16, April 2018
Journal by the Department of MBA, MCA & M.Com (FA), Jyoti Nivas College Autonomous 141
DHII Volume 16, April 2018
Journal by the Department of MBA, MCA & M.Com (FA), Jyoti Nivas College Autonomous 141
Theworkingcapitalwhichshowedanegativefigureduringtheinitial years improved and turned to positive over the years which are a sign that the company is taken action against its working capital management improvement. The ratio analysis has also analyses the overall standing of the company.
BIBLIOGRAPHY:
1. Safi,Hijazi,TahirandKamal,Yasir(2005)“Impactofworkingcapitalmanagement on the profitability of firms –Case oflisted Pakistani Companies”, Social Science Research Network (SSRN), Social Science Electronic Publishing Inc
2. Sagner (2007) “Whyworking capital drivesmerger andacquisitiontoday,”JournalofcorporateaccountingandfinanceVolume 18 No.2 pp 41-45
3. Lau andBlock (2012) “Corporate cash holdings and theirimplications on firm value in family and founder firms”, corporateownershipandcontrol,Vol.9N0.4,pp309-326
4. Lalit kumar Joshi, Sidipta ghosh ( 2012) “Working capitalmanagement of Cipla Limited: An Empirical Study”, International journal on marketing, financial services and management research Vol.1 issue 8

142 Journal by the Department of MBA, MCA & M.Com (FA), Jyoti Nivas College Autonomous
DHII Volume 16, April 2018
142 Journal by the Department of MBA, MCA & M.Com (FA), Jyoti Nivas College Autonomous
DHII Volume 16, April 2018

DHII Volume 16, April 2018
Journal by the Department of MBA, MCA & M.Com (FA), Jyoti Nivas College Autonomous 143
DHII Volume 16, April 2018
Journal by the Department of MBA, MCA & M.Com (FA), Jyoti Nivas College Autonomous 143
PERFORMANCE EVALUATION OF MUTUAL FUNDS ON SELECTIVE BOND
~ Tara
Abstract
Primary Investment objective of any individual or organization is to maximize the return and minimizing the market risk and credit risk through diversifi cation. A mutual fund has become the attractive way for the investors to invest their money. The fi rst priority of every individual is bank investment and the second priority goes to mutual fund and other revenues. The Mutual fund pools resources from a large number of speculators and afterward enhances its investment into a wide range of holding, for example, stock, bonds or government securities with a specifi c end goal to give high relative wellbeing and great returns. The main objective of study is to obtain and analyses the performance of mutual fund using Sharpe’s, Jensen’s and Treynor’s ratio models.
The paper gives a brief idea about the development of mutual fund industry, the broad idea about the organizations and theory of mutual funds.
1. INTRODUCTION
A mutual fund is like a bridge or a financial intermediary that allows a group of investors to pool in their money together with a
DHIIVol. XVI, April 2018
Journal, Dept. of MBA, MCA and M.Com (FA) Jyoti Nivas College Autonomous

144 Journal by the Department of MBA, MCA & M.Com (FA), Jyoti Nivas College Autonomous
DHII Volume 16, April 2018
144 Journal by the Department of MBA, MCA & M.Com (FA), Jyoti Nivas College Autonomous
DHII Volume 16, April 2018
pre-determined investment objective and then this gathered money is investedby the fundmanager into specific securities (stocksorbonds). Investments in securities are spread across a wide cross-section of industries and sectors and thus the risk is reduced. Investors of mutualfundsareknownas“unitholders”.Theprofitsorlossesareshared by the investors in proportion to their investments. The mutual funds normally come out with a number of schemes with different investment objectives which are launched from time to time. A mutual fund is required to be registered with Securities and Exchange Board of India (SEBI) which regulates securities markets before it can collect funds from the public.
Debt schemes are also known as income schemes. Their objective is to provide regular and steady income to investors. Investment is generallymadeinfixedincomesecuritieslikebondsanddebentures.These debt schemes are less sensitive to the market forces. They are less risky as compared to the equity schemes. Investors who want regular returns with less risk prefer to invest in these funds.
1.1 Working of a Mutual Fund
A Mutual Fund trusts that, the store funds of different speculators who share a typical monetary objective. The trade out along these lines accumulated is then placed assets into capital business division instruments, for instance shares, debentures and distinctive securities. The compensation earns during the endeavors and the capital thanks recognizedaresharedbyitsunitholderindegreetoamountofunitsguaranteed through them. Thusly Mutual Fund is mainly appropriate theory for the essential man as it offers an opportunity to place assets intoawidened,efficientlyadministeredmutualfund.
2. REVIEW OF LITERATURE
An attempt was made in this section to review the past research done in the area of performance analysis of selected Mutual funds.
1. Youguo Liang, Sanjay Ramchander and Jandhyala L. Sharma, “The Performance Of Stocks: Professional Versus Dartboard Picks Behaviour Finance”, Vol. 8, No. 1, 1995.

DHII Volume 16, April 2018
Journal by the Department of MBA, MCA & M.Com (FA), Jyoti Nivas College Autonomous 145
DHII Volume 16, April 2018
Journal by the Department of MBA, MCA & M.Com (FA), Jyoti Nivas College Autonomous 145
“This paper evaluates the performance of a portfolio formed onproficient advice (also called pros picks)with another portfoliopicked at random (also called random or dart picks). We study public announcements of professionals’ recommendations and random picks from the Investment Dartboard column in the Wall Street Journal. Results propose that the pros selection statistically outperforms the random collection only in the one-week period. More than a six-month holding period, the random stocks perform better than the pros recommendations.”
2. “Price Earnings Ratio Predict Future Falls Of Stock Price?” University Of Economics in Prague, 31 August 2. Marian Vorek, Does High 2009
“Thispaperexaminestheapproachofvalueinvestinganditsfurtherpossibilities for forecast of stock performance, especially in link with falls in stock prices. The research revealed that the investments into stocks with low price to earnings ratio achieved higher than average returns. Based on the above of mentioned methodology and the outcomes of empirical studies, this paper focuses on the other side of that relation, whether the high price to earnings ratio predicts the future falls in stock prices and whether the price to earnings ratio could act as an indicator of the coming bear market”
3. Marc M. Kramer, “Financial Advice and Individual Investor Portfolio Performance” Volume 41, Issue 2, Pages 395–428, summer 2012
“This paper investigateswhether financial advisers add value toindividual investors’ portfolio decisions by comparing portfolios of advised and self-directed (execution-only) Dutch individual investors. The results indicate important differences in characteristics and portfolios between these investor groups, but no proof of differences inrisk-adjustedperformance.Thefindingsindicatethatportfoliosofadvisedinvestorsareimproveddiversifiedandcarrysignificantlylessidiosyncratic risk. In addition, evidence from an analysis of investors whocontroltoadvicetakingindicatesthatthesefindings(atleastinpart) replicate the effect of advisory interference.”

146 Journal by the Department of MBA, MCA & M.Com (FA), Jyoti Nivas College Autonomous
DHII Volume 16, April 2018
146 Journal by the Department of MBA, MCA & M.Com (FA), Jyoti Nivas College Autonomous
DHII Volume 16, April 2018
4. Jain Pratima, Bangur Peeyush, Sharma Kapil, “Investor View of Stock Performance of Indian Banks: Evidence Using the CANSLIM Approach”, IUP Journal of Bank Management,Volume:10
“Lowriskandhighreturnistheonlyessentialaimofanyinvestor.Through CANSLIM approach, this goal can be achieved easily. CANSLIMapproachwasfirst discussed byO'Neil in theUS forinvestment point and also for investor safety. It is a growth stock investment strategy which involves performance of both technical analysis and fundamental analysis. A performance ranking model was applied to identify the best performing bank among the 10 banks on the foundation of CANSLIM approach and its parameters. For this use, the data pertaining to the quarter ended March 2007 to the quarter ended March 2008 was used.”
3. RESEARCHMETHODOLOGY
Anexploratorystudyisusedtofindtheproblemsinfurtherresearchand its testing with statistical tools. The tools are Performance measure, Treynor’s Index, Sharpe’s Index, Jensen’s Index and the statistical techniques Mean and Standard deviation.
3.1 Ways to Measure the Mutual Fund Risk
The wholesalers have a vast assortment of items to offer to the imminentfinancialspecialists.Inanycase,thereisgiganticnumberoforganizationsofferingcomparativeitemstothespeculators.Inthisway, there ought to be a few variables, which will think about these AMCs. These similar elements are:
3.1.1 Treynor’s ratio
Treynor’s measure is called as ‘Risk to Volatility’ ratio. Treynor’s ratio consider portfolio beta as calculation of risk.
TR= (RP-RF)/ β
Where,RP=Expectedreturn,RF=Riskfreereturn,β=Betaoftheportfolio

DHII Volume 16, April 2018
Journal by the Department of MBA, MCA & M.Com (FA), Jyoti Nivas College Autonomous 147
DHII Volume 16, April 2018
Journal by the Department of MBA, MCA & M.Com (FA), Jyoti Nivas College Autonomous 147
3.1.2 Sharpe ratio
TheSharpeproportionistheprofitsproducedmorethanthedangerfreerate,foreachunitofdanger.Hazardinthisstudyistakentobesupports standard deviation. A higher Sharpe proportion is in this way better as it demonstrates a higher return produced for each unit of danger.
S = R- RF σ
Where,R=Expected return,RF=Risk free return, σ=Standarddeviation
3.1.3 Beta
Ameasureoftheinstabilityorefficientdangerofsecurityoraportfolioin contrast with the business sector list in general. In this study, past informationofbenchmarklistsBSE200,NIFTYCNX-500,SENSEXand NAV execution of every assets have been gathered.
Beta is computed by following formula: Beta= Covariance (Stock, Index)/ Variance (Index). Where, Covariance (Stock, Index) means covariance between scheme and market returns, while Variance (Index) means variance of Index.
3.1.4 Co-eff ective of determination (R-squared)
R-squared calculate the bond between a portfolio and its benchmark. It ought to be thought, as a % from 1 to 100. R-squared is not a measure of the execution of a portfolio. A phenomenal portfolio can have a low R-squared. It is basically a measure of the relationship of the portfolio's benefitstothebenchmark'sbenefits.R-squaredcanbeusedtofindtheimmensity of a particular beta or alpha. Generally, a higher R-squared will demonstrate a more accommodating beta quality.
3.1.5 Standard Deviation
The Standard Deviation (SD) of a normal is the sum by which the numbers that goes to a normal digress from that normal. An elevated requirement Deviation is a measure of instability. SD has been

148 Journal by the Department of MBA, MCA & M.Com (FA), Jyoti Nivas College Autonomous
DHII Volume 16, April 2018
148 Journal by the Department of MBA, MCA & M.Com (FA), Jyoti Nivas College Autonomous
DHII Volume 16, April 2018
calculated with the usage of MS excel 2010 STDEV” function where the cell range caters to the monthly fund returns over the period under study.
3.1.6 Jensen alpha measure: This measure developed by Michael Jensen.
TheformulaforJensenmeasureis:Rp–Rf=α+[ßp*(Rm–Rf)]Where,Rp=Portfolioreturn,Rf=Riskfreereturn,ßp=Portfoliobeta and Rm = Market return.
4. DATA ANALYSIS AND INTERPRETATION
Table 4.1: Return & Risk Analysis of Selected Mutual Funds
SL.No
Name of the Scheme
Return of schemes
Bench-mark index
Standard Deviation (σ)
Beta(β) corre-lation (R)
1 L&T Short term income fund
0.4797 0.6042 0.00338 0.043 0.1718
2 DHFL Pramerica Short term income fund
-1.4658 0.6042 0.00402 0.0394 0.2839
3 BNP Paribas Short term income fund
-0.1723 0.6042 0.00523 -0.0013 0.0784
4 HSBC Short term income fund
0.6716 0.6042 0.00424 0.0319 0.1468
5 Baroda Pioneer Short term income fund
0.5881 0.6042 0.0052 -0.0013 0.0905
6 IDBI Short term income fund
-1.476 0.6042 0.00436 0.0577 0.2958
7 Peerless Short term income fund
0.5856 0.6042 0.00229 0.0291 0.3183
8 Invesco Short term fund
-01.4734 0.6042 0.03291 0.005 0.1382
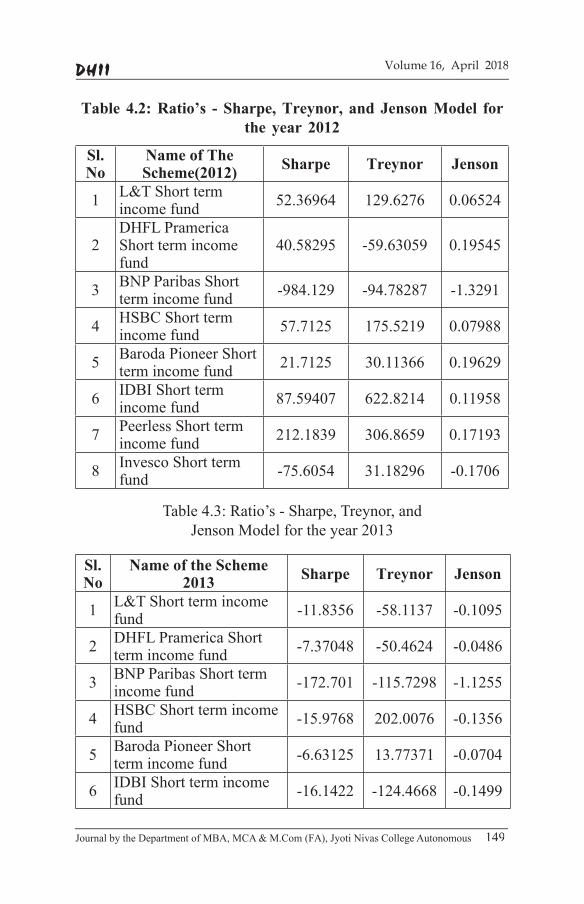
DHII Volume 16, April 2018
Journal by the Department of MBA, MCA & M.Com (FA), Jyoti Nivas College Autonomous 149
DHII Volume 16, April 2018
Journal by the Department of MBA, MCA & M.Com (FA), Jyoti Nivas College Autonomous 149
Table 4.2: Ratio’s - Sharpe, Treynor, and Jenson Model for the year 2012
Sl. No
Name of The Scheme(2012) Sharpe Treynor Jenson
1 L&T Short term income fund 52.36964 129.6276 0.06524
2DHFL Pramerica Short term income fund
40.58295 -59.63059 0.19545
3 BNP Paribas Short term income fund -984.129 -94.78287 -1.3291
4 HSBC Short term income fund 57.7125 175.5219 0.07988
5 Baroda Pioneer Short term income fund 21.7125 30.11366 0.19629
6 IDBI Short term income fund 87.59407 622.8214 0.11958
7 Peerless Short term income fund 212.1839 306.8659 0.17193
8 Invesco Short term fund -75.6054 31.18296 -0.1706
Table4.3:Ratio’s-Sharpe,Treynor,andJensonModelfortheyear2013
Sl. No
Name of the Scheme 2013 Sharpe Treynor Jenson
1 L&T Short term income fund -11.8356 -58.1137 -0.1095
2 DHFL Pramerica Short term income fund -7.37048 -50.4624 -0.0486
3 BNP Paribas Short term income fund -172.701 -115.7298 -1.1255
4 HSBC Short term income fund -15.9768 202.0076 -0.1356
5 Baroda Pioneer Short term income fund -6.63125 13.77371 -0.0704
6 IDBI Short term income fund -16.1422 -124.4668 -0.1499
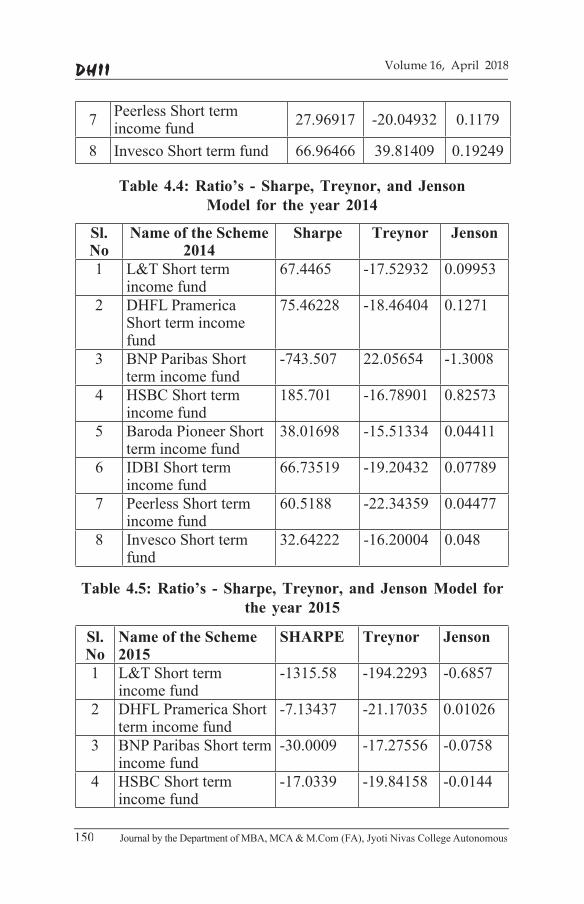
150 Journal by the Department of MBA, MCA & M.Com (FA), Jyoti Nivas College Autonomous
DHII Volume 16, April 2018
150 Journal by the Department of MBA, MCA & M.Com (FA), Jyoti Nivas College Autonomous
DHII Volume 16, April 2018
7 Peerless Short term income fund 27.96917 -20.04932 0.1179
8 Invesco Short term fund 66.96466 39.81409 0.19249
Table 4.4: Ratio’s - Sharpe, Treynor, and Jenson Model for the year 2014
Sl. No
Name of the Scheme 2014
Sharpe Treynor Jenson
1 L&T Short term income fund
67.4465 -17.52932 0.09953
2 DHFL Pramerica Short term income fund
75.46228 -18.46404 0.1271
3 BNP Paribas Short term income fund
-743.507 22.05654 -1.3008
4 HSBC Short term income fund
185.701 -16.78901 0.82573
5 Baroda Pioneer Short term income fund
38.01698 -15.51334 0.04411
6 IDBI Short term income fund
66.73519 -19.20432 0.07789
7 Peerless Short term income fund
60.5188 -22.34359 0.04477
8 Invesco Short term fund
32.64222 -16.20004 0.048
Table 4.5: Ratio’s - Sharpe, Treynor, and Jenson Model for the year 2015
Sl. No
Name of the Scheme 2015
SHARPE Treynor Jenson
1 L&T Short term income fund
-1315.58 -194.2293 -0.6857
2 DHFL Pramerica Short term income fund
-7.13437 -21.17035 0.01026
3 BNP Paribas Short term income fund
-30.0009 -17.27556 -0.0758
4 HSBC Short term income fund
-17.0339 -19.84158 -0.0144

DHII Volume 16, April 2018
Journal by the Department of MBA, MCA & M.Com (FA), Jyoti Nivas College Autonomous 151
DHII Volume 16, April 2018
Journal by the Department of MBA, MCA & M.Com (FA), Jyoti Nivas College Autonomous 151
5 Baroda Pioneer Short term income fund
-18.9571 50.39958 -0.0827
6 IDBI Short term income fund
-18.439 -22.68075 -0.0062
7 Peerless Short term income fund
-15.8812 -37.77865 -0.0067
8 Invesco Short term fund
-23.2171 -10.81413 -0.0484
Table 4.6: Ratio’s - Sharpe, Treynor, and Jenson Model for the year 2016
Sl. No
Name of the Scheme(2016) SHARPE Treynor Jenson
1 L&T Short term income fund 27.38123 -45.63925 0.099582 DHFL Pramerica Short term
income fund27.16645 -34.46098 0.11363
3 BNP Paribas Short term income fund
-33.0666 -11.02512 -0.3883
4 HSBC Short term income fund
6.151275 -38.08299 0.03407
5 Baroda Pioneer Short term income fund
37.27653 -36.24016 0.09346
6 IDBI Short term income fund -3.44602 -40.98738 -0.00927 Peerless Short term income
fund-8.52318 -183.2359 -0.0312
8 Invesco Short term fund 10.31084 -43.99161 0.07727
5. SUMMARY OF FINDINGS
On the basis of average return
According to return analysis all the 8 Debt schemes have less returns than the benchmark and the returns are calculated on the basis of NAV for 5 years and the remaining 4 schemes have the worst returns showing negative value i.e DHFL, BNP , IDBI and Invesco.
On the basis of Standard deviation
According to risk analysis - All the schemes Standard deviation is less than the benchmark, hence all the schemes are at lower risk compared to market.

152 Journal by the Department of MBA, MCA & M.Com (FA), Jyoti Nivas College Autonomous
DHII Volume 16, April 2018
152 Journal by the Department of MBA, MCA & M.Com (FA), Jyoti Nivas College Autonomous
DHII Volume 16, April 2018
On the basis of Beta
The analysis shows that beta value on the basis of NAV in all the schemes is less than 1, which indicates that these are less sensitive to the market forces. BNP and Baroda are the schemes having negative Beta value.
On the basis of Coeffi cient of determination (R-Square)
The value of R2 based on NAV is highest for the following funds - Peerless, IDBI, DHFL, L& T. According to R-square, these funds indicate that systematic risk is high as compared to other schemes.
According to Sharpe’s ratio
All the schemes has performed well in the year 2012, 2014 and 2016. Among the schemes DHFL and HSBC has generated a good outcome.
According to Treynor’s Ratio
In the year 2012 and 2015 all the Schemes has generated negative outcomes, where as in other years there is a good performance shown. Among these scheme Baroda has best result in all years.
According to Jensen Alpha measure
Inalltheyearsonlyin2015and2013theschemeshaveperformedvery low, generating negative value, where as in remaining years all the debt schemes have performance better.
6. SUGGESTIONS:
1. Under mutual fund industry, if the investor is not ready to take much risk. Then in that case he can prefer to go for selecting the public company schemes compared to private company schemes for the investment.
2. Here the reciprocal funds investor should be very careful on their market returns, because of their investing money its fully based or depend on market returns only, here if the market returns are in downtrend it means the reciprocal funds also

DHII Volume 16, April 2018
Journal by the Department of MBA, MCA & M.Com (FA), Jyoti Nivas College Autonomous 153
DHII Volume 16, April 2018
Journal by the Department of MBA, MCA & M.Com (FA), Jyoti Nivas College Autonomous 153
should goes down, for a while, if the market returns uptrend means as the same thing our reciprocal funds also increase in that time and vice versa.
3. Here the investorscanconsidera scheme,which ishavingapositive correlation with the market return for their investment because this leads to positive returns for the investor.
4. Theinvestor’sbeforeinvestinginmutualfund,firsttheyshouldlook at the market return and the risk free return and then based on the company performance. Based on the company performance and the market returns the investors can get the better return than what they expect.
7. CONCLUSION
After analysing these selected Mutual funds under Debt short term schemes using Sharpe ratio model, Treynor ratio model and Jenson’s alphamodelfoundthat3schemesi.eIDBI,DHFLShorttermincomefund and L & T has given consistence performance in all the models. It is also found that on the basis of return, Standard deviation, Beta also these three schemes shown consistence performance. Worst schemes is BNP Paribas short term Income fund.
BIBLIOGRAPHY
1. Dr.Rupeet kaur “Performance Evaluation ofDebtMutualFund Schemes in India” , galaxy international interdisciplinary researchjournalissn2347-6915giirj,vol.2(2),february(2014).
2. Ms. Shilpi Pala, Prof.Arti Chandani “ACriticalAnalysisOf Selected Mutual Funds In India” Symbiosis Institute of Management Studies Annual Research Conference, Procedia Economics and Finance ( 2014 ).
3. Dr.RamaDevi,Mr.NooneyLeninKumar,PerformanceandEvaluation of Debt mutual Funds in India” International Journal of Marketing, Finance Services & Management Research, Vol 1, Jan-Mar 2012.

154 Journal by the Department of MBA, MCA & M.Com (FA), Jyoti Nivas College Autonomous
DHII Volume 16, April 2018
154 Journal by the Department of MBA, MCA & M.Com (FA), Jyoti Nivas College Autonomous
DHII Volume 16, April 2018
4. Youguo Liang, Sanjay Ramchander and Jandhyala L. Sharma, “ThePerformanceOfStocks:ProfessionalVersusDartboardPicks Behaviour Finance”, Vol. 8, No. 1, 1995.
5. Security Analysis and Portfolio Management, Gordon & Natrajan.
Websites
1. www.nse-india.com 2. www.moneycontrol.com3. www.amfiindia.com4. www.bluechip.com

DHII Volume 16, April 2018
Journal by the Department of MBA, MCA & M.Com (FA), Jyoti Nivas College Autonomous 155
DHII Volume 16, April 2018
Journal by the Department of MBA, MCA & M.Com (FA), Jyoti Nivas College Autonomous 155
PERFORMANCE ANALYSIS OF PHARMACEUTICAL SECTOR IN INDIA WITH REFERENCE TO LKP SECURITIES, BANGALORE
~ Vinaya Kumari
Abstract
The company selected for the study is LKP SECURITIES LIMITED, Bangalore the major purpose of this study is to understand the performance of organization and to focus on the pharmaceutical industries. The industries based on pharmaceutical performance has a great exposure in the market in which it benefi ts the investors in investing great capital which helps in gaining knowledge in equity shares. The companies chosen for the study are Sunpharma, Cipla, Lupin limited, Dr. Reddy’s laboratory and Aurobindo limited. The study is based purely on the information and other relevant data and materials obtained from the organization and internet I carried out my research on Performance Analysis of Five Pharmaceutical Companies.
The aim of the study is to know the share price fl uctuations of the selected companies and gives clarity to the investor to choose the better market to earn profi t within short span of time. An attempt is made in the current study to study diff erent techniques in details and to get a suffi cient knowledge about the industry from diff erent aspects
DHIIVol. XVI, April 2018
Journal, Dept. of MBA, MCA and M.Com (FA) Jyoti Nivas College Autonomous

156 Journal by the Department of MBA, MCA & M.Com (FA), Jyoti Nivas College Autonomous
DHII Volume 16, April 2018
156 Journal by the Department of MBA, MCA & M.Com (FA), Jyoti Nivas College Autonomous
DHII Volume 16, April 2018
and their contribution towards the achievement. The reason behind the topic selection is that the values of the stocks keep fl uctuating and it becomes diffi cult task for the investors to make decision regarding the selection of portfolio and investment. For the analysis only fi ve companies were chosen and it becomes diffi cult to give the clear picture about the investment decision to the investors on the overall industry. The computation carried out in the current study using Rate of Change, Relative Strength Index and Moving Average.
1. INTRODUCTION
TheinspectionoffinancialPerformanceindicatorsisdonethroughperformance analysis such as return on equity and return on asset the resultsachievedbythecompetingfirmsbycomparisonareofthesamesize.Performanceanalysiswhichincludescomparisonbetweenthepharmaceutical industries based on their equity investment, return on investment, assets and liabilities, and liquidity.
It is the process of measuring the results of a firm's policies and operations in monetary terms. It is used to measure firm's overall financial health over a givenperiod and can also be usedto compare similarfirms across the same industry or to compareindustries or sectors in aggregation.
Performance analysis includes gathering formal and informal information to clients and sponsors define and accomplish theirobjectives. Performance analysis reveals a few perspectives on a problem or opportunity, deciding any drives towards or barriers to execute performance, and proposing a solution system based on what is discovered. Performance analysis are a part of market research techniques that mainly emphasis on the analysis of customers attitude towards the product and services offered by the company and applied in several markets such as automotive, food, housing, education, health care, hospitality, industry tourism etc.
Indian pharmaceutical market as the industry is highly fragmented. The Indian pharmaceuticals market is the third largest in terms of volume and thirteenth largest in terms of value, as per a report by
DHII Volume 16, April 2018
Journal by the Department of MBA, MCA & M.Com (FA), Jyoti Nivas College Autonomous 157
DHII Volume 16, April 2018
Journal by the Department of MBA, MCA & M.Com (FA), Jyoti Nivas College Autonomous 157
Equity Master. India is the largest provider of generic drugs globally with the Indian generics accounting for 20 per cent of global exports in terms of volume. India enjoys an important position in the global pharmaceuticals sector. India also has a large pool of scientists and engineers who have the potential to steer the industry ahead to an even higher level. Presently over 80 per cent of the antiretroviral drugs used globallytocombatAIDS(AcquiredImmunoDeficiSyndromencye)aresuppliedbyIndianpharmaceuticalfirms.
Performance analysis of pharmaceutical industry helps in determining the health and stability of the industry and also helps the stock holders tounderstandhowfirmismanagingandutilizingtheirmanpower,available resources etc.
2. REVIEW OF LITERATURE
1) Accoding to V.Vijayalakshmia and M.Srividya “A Study On Financial Performance of Pharmaceutical Industry In India”
States that the development of the industry depends upon several factors likefinance , personal technology , quality of the productandmarketing and the researcher ismainly interested analyzingthe financial performance of pharmaceutical industry and the mainobjectivewastoanalyzetheprofitabilitypositionofselectedpharmaceutical companies , factors influencing the profitability ,andtoofferfindingssuggestionsandconclusion.For thispurposehe selected 10 pharmaceutical companies , the period of study was of5yearsand toanalyze theperformance theratioschosengrossprofitratio,netprofitratio,operatingprofitratioreturnonequity,earning per share. Doing all the calculation with the help of ratios, shesuggestedthatthefinancialhealthplaysasignificantroleinthesuccess of the management.
2) According to Amalendu Bhunia, “Financial Performance of Indian Pharmaceutical Industry A Case Study"
This research was conducted to determine the efficiency and performanceoffirmsmanagementwiththehelpofrecordsandreportsandtheresearcherstressesonfindingouttheliquidity,profitabilityand

158 Journal by the Department of MBA, MCA & M.Com (FA), Jyoti Nivas College Autonomous
DHII Volume 16, April 2018
158 Journal by the Department of MBA, MCA & M.Com (FA), Jyoti Nivas College Autonomous
DHII Volume 16, April 2018
other indicators and to assess the short term and long term solvency, liquidityandprofitabilityposition,efficiencyandfinancialoperation,factorsdeterminingbehaviorofliquidityandprofitability.Thestudyhas been taken for 12 years.
3) According to Gopinathan Thachappilly (2009), “Financial Ratio Analysis for Evaluating Performance” in this article he has explained regardingthefinancialratioanalysisforevaluatingtheperformance.It is examined is in a typical form to bring to understanding the vast volume of numbers being offered in companies business statement. This also guides in evaluating the performance of a company which helpstheinvestorintakingdecisionsabouttofinanceinthatcompanyhere we look at diverse category of ratio in discrete articles in various phasesaccordingtotheirperformancebasedonprofitabilityratios,performance ratios liquidity ratios, investment evaluation ratios and debt ratios.
3. RESEARCH METHODOLOGY
3.1 Background Study
Indian pharmaceutical industry diagram amongst India's science based commercial ventures with boundless abilities in the mind-boggling fieldofmedicationproductionandinnovationanamazinglysortedoutdivision the Indian pharmaceutical business sector is normal extend ataCAGRof23.9%tocontactUSdollar55billionby2020.Indiapositions high amongst all the third world nations regarding advances quality and immense scope of drugs that are produces it ranges from straightforward cerebral pain pills to cutting edge anti-infection agents and inconveniences cardiovascular mixes, practically every sort of medication is presently made in the Indian pharmaceutical industry.
The Indians pharmaceutical part is profoundly disengaged with more than 20000 register units. The pharmaceutical has extended has radically in the most recent two decades. The pharmaceutical and substance industry in India is an effectively having been partitioned market with uniform value rivalry and government value control. They are genuinely near 250 extensive units and 8000 little scale units which from the basically piece of pharmaceutical industry in India (counting 5 focal open units).

DHII Volume 16, April 2018
Journal by the Department of MBA, MCA & M.Com (FA), Jyoti Nivas College Autonomous 159
DHII Volume 16, April 2018
Journal by the Department of MBA, MCA & M.Com (FA), Jyoti Nivas College Autonomous 159
3.2. Statement of the Problem
The stock’s value continues changing or wavering making it hard for thefinanciertoinvestinpreferredstocks.Itisverynecessarytostudyinwhatwaysthepriceskeepfluctuatingandwhattheperformanceofstockis.Itsimplifiestheworkoftheinvestorforchoosingorforthe broker to advise the investor to invest in suitable stocks. Hence an analysis is conducted for interpreting the performance of the stock.
3.3. Need and Importance of the Study
Toanalysethefive-pharmaceuticalcompany’sperformanceinorderto give the clear idea about the decision regarding the investment and portfolio selection.
3.4. Scope of the Study
The study binds almost the financial operations covered by theperformance analysis of pharmaceutical industry in India with the special reference with Sun pharma, Cipla, Lupin limited, Dr. Reddy’s laboratories and Aurobindu pharma limited. The study has been conductedwiththedataavailableinjournals,financialreportsandwebsitelinks.Thestudytriestoevaluatethefinancialperformanceofthecompanythatincludessourcesoffinance,solvency,profitability,activity or turnover and return on assets and equity. The 5year period data ranging from 2012 to 2016 of Sun pharma, Cipla, Lupin limited, Dr. Reddy’s laboratories and Aurobindu pharma limited.
3.5. Limitation of the Study
Themainlimitationofthestudyisonlyfivepharmaceuticalindustriesareselectedandfive-yeardataareusedtoanalysetheperformance.
3.6. Objectives of the Research
• Tostudyandanalysetheperformanceoffivepharmaceuticalindustries.
• Toanalysethesharespricefluctuationsoffivepharmaceuticalindustries.
• To give the investors idea about where to invest.

160 Journal by the Department of MBA, MCA & M.Com (FA), Jyoti Nivas College Autonomous
DHII Volume 16, April 2018
160 Journal by the Department of MBA, MCA & M.Com (FA), Jyoti Nivas College Autonomous
DHII Volume 16, April 2018
3.7. Type of Research
Descriptive Research The descriptive study will be a distinct examination that uses the review strategy. According the study will be a discovering examination with effective understanding. It will concentrate on particular viewpoints or measurements of the accepted pros and cons. The study is being suggest for the purpose to set up unobjectionable data. Information will be collected for the purpose of further upcoming meeting plans andtalkingtherespondents.Informationwillbescrutinizedutilizingsuitable methods dependable with the goals of the study.
Sampling Techniques The sampling technique chosen for the study is Convenience/judgemental sampling. The companies are randomly selected from top listed companies under pharmaceutical industries. This technique is applicable for the research because it is easy to conduct, high probability of achieving the representative sample.
Sample size, Sample Description Sample size determination is the act of choosing the number ofobservations or replicates to include in a statistical sample. The sample sizeisanimportantfeatureofanempiricalstudyinwhichthegoalisto make inferences about a population from a sample.
Sample size determination is themathematical estimation of thenumber of subjects / units to be included in the study.
Optimalsamplesizeplaysaveryimportantroleasitallowstohaveappropriate analysis to provide the required level of accuracy to allow thevalidityofsignificancetest
Sample size chosen is top 5 pharmaceuticals companies in India.Companies chosen are Sun pharma, Cipla, Dr. Reddy's labs, Lupin Limited, Aurobindu limited.
These companies are chosen because they are the leading companies in India and analysing their performance can be helpful to understand the growth of pharmaceutical companies.
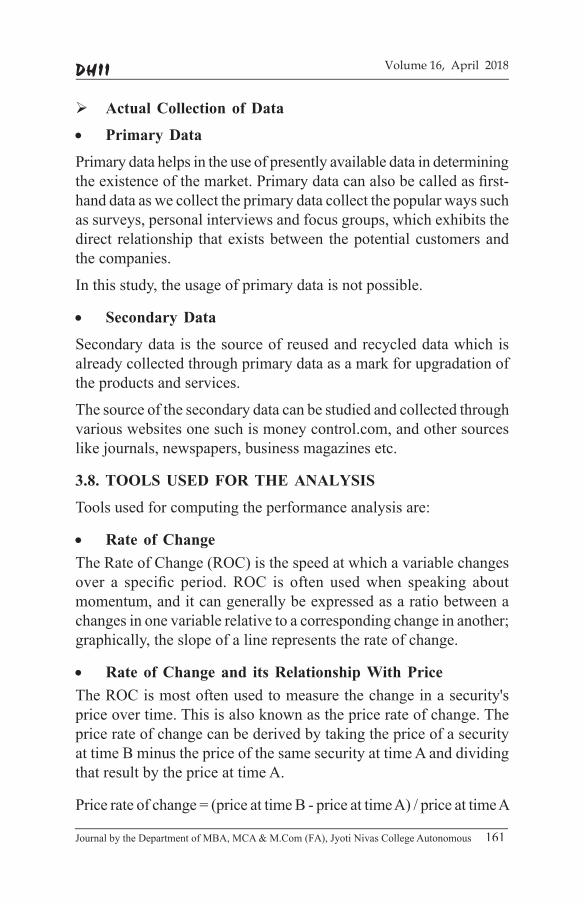
DHII Volume 16, April 2018
Journal by the Department of MBA, MCA & M.Com (FA), Jyoti Nivas College Autonomous 161
DHII Volume 16, April 2018
Journal by the Department of MBA, MCA & M.Com (FA), Jyoti Nivas College Autonomous 161
Actual Collection of Data
• Primary Data
Primary data helps in the use of presently available data in determining theexistenceofthemarket.Primarydatacanalsobecalledasfirst-hand data as we collect the primary data collect the popular ways such as surveys, personal interviews and focus groups, which exhibits the direct relationship that exists between the potential customers and the companies.
In this study, the usage of primary data is not possible.
• Secondary Data
Secondary data is the source of reused and recycled data which is already collected through primary data as a mark for upgradation of the products and services.
The source of the secondary data can be studied and collected through various websites one such is money control.com, and other sources likejournals,newspapers,businessmagazinesetc.
3.8. TOOLS USED FOR THE ANALYSIS
Tools used for computing the performance analysis are:
• Rate of Change
The Rate of Change (ROC) is the speed at which a variable changes over a specific period.ROC is often usedwhen speaking aboutmomentum, and it can generally be expressed as a ratio between a changes in one variable relative to a corresponding change in another; graphically, the slope of a line represents the rate of change.
• Rate of Change and its Relationship With Price
The ROC is most often used to measure the change in a security's price over time. This is also known as the price rate of change. The price rate of change can be derived by taking the price of a security at time B minus the price of the same security at time A and dividing that result by the price at time A.
Price rate of change = (price at time B - price at time A) / price at time A

162 Journal by the Department of MBA, MCA & M.Com (FA), Jyoti Nivas College Autonomous
DHII Volume 16, April 2018
162 Journal by the Department of MBA, MCA & M.Com (FA), Jyoti Nivas College Autonomous
DHII Volume 16, April 2018
• Relative Strength Index
The relative strength index (RSI) is a momentum indicator developed by noted technical analyst Welles Wilder that compares the magnitude ofrecentgainsandlossesoveraspecifiedtimeperiodtomeasurespeedand change of price movements of a security. It is primarily used to attempt to overbought or oversold conditions in the trading of an asset.
The relative strength index is calculated using the following formula:
RSI = 100 - 100 / (1 + RS)
• Moving Average
The Simple Moving Average is arguably the most popular technical analysis tool used by traders. The Simple Moving Average (SMA) is often used to identify trend direction, but can be used to generate potential buy and sell signals.
4. DATA ANALYSIS AND INTERPRETATION
4.1. SUNPHARMA
Table4.1: ROC Table 4.2: RSI
Table 4.3: Moving Average

DHII Volume 16, April 2018
Journal by the Department of MBA, MCA & M.Com (FA), Jyoti Nivas College Autonomous 163
DHII Volume 16, April 2018
Journal by the Department of MBA, MCA & M.Com (FA), Jyoti Nivas College Autonomous 163
ROC - ROC gives us the variances i.e., increments decrements in the stock price and ROC for the various months of the year. During the initialperiod,thereisapositivefluctuationwhereitremainssamefromtheyear2012to2013andfromaugust2013thevalueofROCcomes down leading to negativefluctuation and continues to falldown till April 2014. And then onwards the ROC showed a positive fluctuationandremainedtoincreaseanddrasticallyfelldownintheyear 2016 and continued to fall.
RSI – the RSI level of the company is moving from bearish trend to bullishtrend.TheRSIisabove70intheyear2013whichisdepictingthe bullish trend which indicated to buy the share and in the year 2014 onwardsRSIlevelfallsbetween30to70whichindicatesthatholdthe securities of the company.
Moving Average – from the above chart investor can take buy or sell signal based on, when the closing price is above the moving average it is the signal that indicated to buy and when the closing price touches or comes below the moving average it is the signal to sell.
4.2. CIPLA
Table 4.4: ROC Table 4.5: RSI
Table 4.6: Moving Average

164 Journal by the Department of MBA, MCA & M.Com (FA), Jyoti Nivas College Autonomous
DHII Volume 16, April 2018
164 Journal by the Department of MBA, MCA & M.Com (FA), Jyoti Nivas College Autonomous
DHII Volume 16, April 2018
ROC – firstthereisanegativefluctuationinROCvalueandfurthercontinued to increase till August 2014. Then a drastic and a major increase in the stock prices till August 2015 and became almost a constantwith slightfluctuation till the end and therewas a slightdecrease in the value of ROC in the year 2016 and showed steady increase.
RSI – intheyear2013to2014RSIissignalingthesecuritieshastobe held. In the month of March 2015, which clearly depicts that the securitiesofthecompanyshouldbesoldinordertoearnhighprofitand in 2016, once again signaled to sell.
Moving Average - alternative years the graph is signaling to investors to buy and sell the shares. It indicates more than one year holding the security leads to loss. Alternatively, the investor has to shift from buy to sell or sell to buy.
4.3. LUPIN LIMITED
Table 4.7: ROC
Table 4.9: Moving Average
Table 4.8: RSI
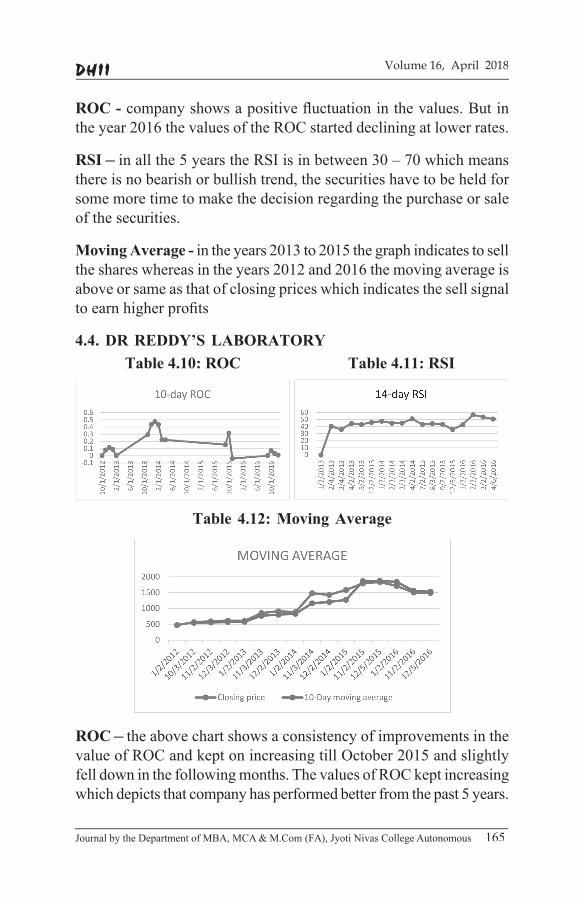
DHII Volume 16, April 2018
Journal by the Department of MBA, MCA & M.Com (FA), Jyoti Nivas College Autonomous 165
DHII Volume 16, April 2018
Journal by the Department of MBA, MCA & M.Com (FA), Jyoti Nivas College Autonomous 165
Table 4.12: Moving Average
ROC - companyshowsapositivefluctuationinthevalues.Butinthe year 2016 the values of the ROC started declining at lower rates.
RSI – inallthe5yearstheRSIisinbetween30–70whichmeansthere is no bearish or bullish trend, the securities have to be held for some more time to make the decision regarding the purchase or sale of the securities.
Moving Average - intheyears2013to2015thegraphindicatestosellthe shares whereas in the years 2012 and 2016 the moving average is above or same as that of closing prices which indicates the sell signal toearnhigherprofits
4.4. DR REDDY’S LABORATORY Table 4.10: ROC Table 4.11: RSI
ROC – the above chart shows a consistency of improvements in the value of ROC and kept on increasing till October 2015 and slightly fell down in the following months. The values of ROC kept increasing which depicts that company has performed better from the past 5 years.

166 Journal by the Department of MBA, MCA & M.Com (FA), Jyoti Nivas College Autonomous
DHII Volume 16, April 2018
166 Journal by the Department of MBA, MCA & M.Com (FA), Jyoti Nivas College Autonomous
DHII Volume 16, April 2018
RSI – 2013signalstoholdthesecuritiesandin2015RSIstandsabove70indicatingtosellthesecuritiesinordertoearnprofits.RSItendsto gradually decreasing which indicates to hold the securities whereas in the month of November indicating to sell the shares
Moving Average – in all the years except 2016, moving average is below the closing prices which are indicating the buy signal to the investors.
4.5. AUROBINDO LIMITED
Table 4.15: Moving Average
Table 4.13: ROC Table 4.14: RSI
ROC- the interpretation from the chart shows that the ROC of the company kept increasing from the year 2012 to 2015. The highest ROC was in the year 2014 and whereas in the year 2016 the ROC values of the company decreased at lower rates.
RSI – RSIinthealltheyearsexcept2013,stoodinbetween30to70 indicating to hold the shares for making the effective decisions.

DHII Volume 16, April 2018
Journal by the Department of MBA, MCA & M.Com (FA), Jyoti Nivas College Autonomous 167
DHII Volume 16, April 2018
Journal by the Department of MBA, MCA & M.Com (FA), Jyoti Nivas College Autonomous 167
Moving Average - out of 5 years, three years i.e., 2014 to 2016 the closing prices are above the moving averages, which indicate the buy signal.
5. SUMMARY OF FINDINGS
5.1. SUNPHARMA
Fromabovedata,wecansummarize that therewasahugeincrease in the prices in begin of the company and then the prices had been consistently increasing without any fluctuations.
At the end, the prices have fallen continuously without increasing.
Ontheotherhand,lookingthroughRSIitcanbesummarizedthat during the initial period there has been some constant fluctuationswithaslightrise.
Further the RSI index represents the overbought price during the end of the period
Looking at the moving averages, it was below the closing prices in most of the years, which highly indicated the buy signal.
5.2. CIPLA
In Cipla notice that there has been a lot of positive increments in the beginning of the year
InCiplatherehadbeenalotoffluctuationsinpricesthatisthe prices has fall down and again it has increased and again the prices have come down
Whereas taking into consideration the RSI values during the initial period there was a constant movement of RSI index with slight rise
After that, the RSI index indicated bought overbought price and at the end, the RSI index remained constant.
With the moving average, it can be found that from the year 2012 to 2015 there is a huge demand for the stock to enter

168 Journal by the Department of MBA, MCA & M.Com (FA), Jyoti Nivas College Autonomous
DHII Volume 16, April 2018
168 Journal by the Department of MBA, MCA & M.Com (FA), Jyoti Nivas College Autonomous
DHII Volume 16, April 2018
the market and in 2016 there were high chances of exiting the market.
5.3. LUPIN LIMITED
We can find that the there are lots of improvement in theperformance from the year 2012 to 2016, the prices of the company started to increasedrastically from theyear 2013and the company performed really well from the year 2015 and continued to grow in 2016 also.
With the tool of ROC, it is identified that the values keptfluctuatingagainandagain.
RSI index showed an upward movement.
Moving average and closing price were on the same range.
5.4. Dr. REDDY’S LABORATORY
From the above information, provided we can conclude that there has been constant increase in prices over a period and again there was a slight fall which got recovered and again we canfindtherewasadrasticfallinprices.
Looking through the RSI index there has been a high fluctuationinthepricesduringtheinitialperiodandfurtherthere was a constant upward and downward movement in RSI index
During the end period, the RSI index showed downward movement.
Moving average of the company highly indicated buy signal.
5.5. AUROBINDO LIMITED
In the beginning of the year 2012 share price was just 57.4 and within the span of 5 years the prices stood around 800.
The share prices kept increasing each year depicting that the company performed very well.
TheROCalsoshowedpositivefluctuationintheprices.
The RSI indicated the downward movement
DHII Volume 16, April 2018
Journal by the Department of MBA, MCA & M.Com (FA), Jyoti Nivas College Autonomous 169
DHII Volume 16, April 2018
Journal by the Department of MBA, MCA & M.Com (FA), Jyoti Nivas College Autonomous 169
Moving average indicated the sell signal where it indicated many chances of exiting the market.
6. SUGGESTIONS
The returns on your investment cannot be judged, as investment activity itself is a risky venture. however, if have better trading operations in your area, you may end up with mediumprofitsoryoureachtosendpercentoftheprofitsonthe condition that the stock is being holder for a longer period of time
With the help of technical indicator an investor can decide where the investment has to be done
And the suggestions suggested by the brokers/ consultants may also be helpful in trading
Investors can choose Dr. Reddy’s laboratory and aurobindo limited for the purpose of investment as they have consistently performed well.
7. CONCLUSION
As we, all know that the activity of investment in securities is a risky venture. Share prices cannot be interrupted or predicted in future. Due tomorefluctuations,thetakesplacethesharepriceswhetheritmaybepositiveandnegativefluctuations,whichwillmaketheinvestorstofinddifficulty inwhere to invest.Onemustbeawareabout thesharemarketandsharepricesbeforetheinvesttoearnprofits.Andadvises of the brokers may be helpful for certain extent. Such tables and charts can help as in knowing about a performance of the stock.
BIBLIOGRAPHY:
BOOKS
[1] Amal, Fakir – “ACase Study : Financial Performance ofPharmaceutical Companies”
[2] MohmadMustaq,SyedKhaja–“LiquidityandProfitabilityPerformance Analysis of Selected Pharmaceutical Companies”
170 Journal by the Department of MBA, MCA & M.Com (FA), Jyoti Nivas College Autonomous
DHII Volume 16, April 2018
170 Journal by the Department of MBA, MCA & M.Com (FA), Jyoti Nivas College Autonomous
DHII Volume 16, April 2018
[3] JyotiNair–“PerformanceAnalysisandSolvencyPredictionofIndian Pharma Companies”.
[4] ShristinasheelaandKarthikeyan–“FinancialPerformanceofPharmaceutical Industry in India Using DuPont Analysis”.
WEBSITES
1. www.moneycontrol.com2. www.nse.com3.www.bse.com4. www.investopedia.com