Embed Size (px)
Citation preview
1
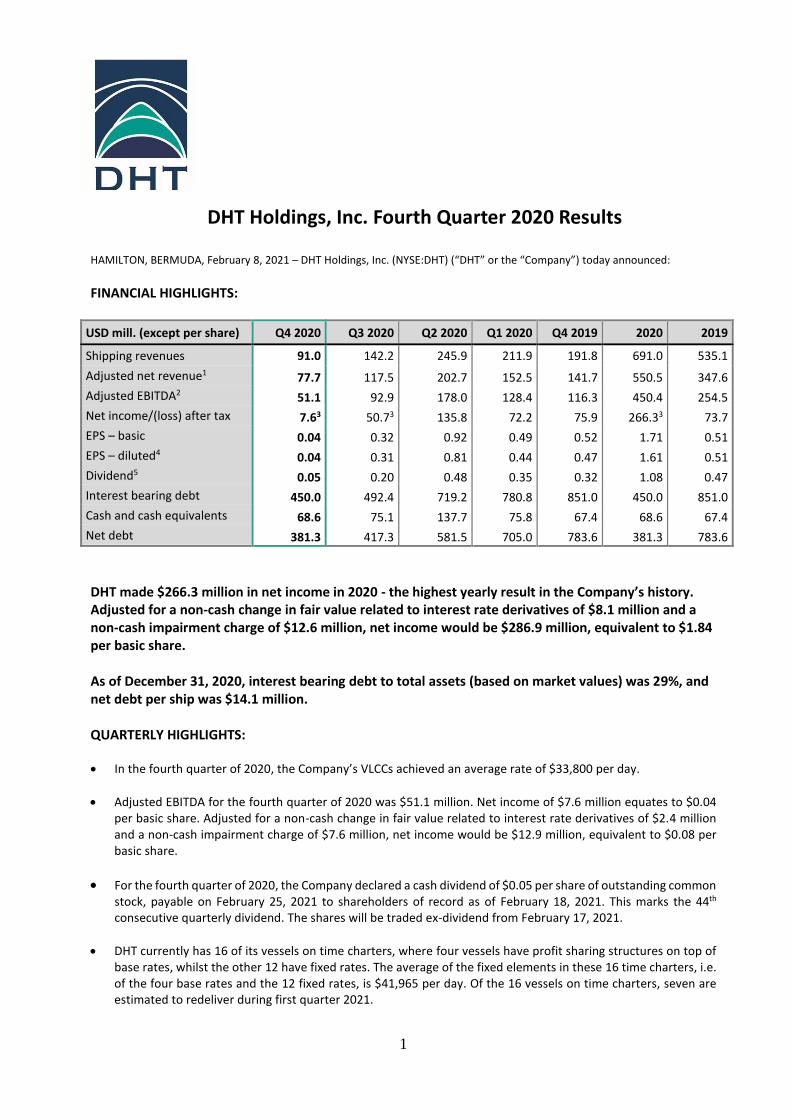
DHT Holdings, Inc. Fourth Quarter 2020 Results HAMILTON, BERMUDA, February 8, 2021 – DHT Holdings, Inc. (NYSE:DHT) (“DHT” or the “Company”) today announced:
FINANCIAL HIGHLIGHTS:
USD mill. (except per share) Q4 2020 Q3 2020 Q2 2020 Q1 2020 Q4 2019 2020 2019
Shipping revenues 91.0 142.2 245.9 211.9 191.8 691.0 535.1
Adjusted net revenue1 77.7 117.5 202.7 152.5 141.7 550.5 347.6
Adjusted EBITDA2 51.1 92.9 178.0 128.4 116.3 450.4 254.5
Net income/(loss) after tax 7.63 50.73 135.8 72.2 75.9 266.33 73.7
EPS – basic 0.04 0.32 0.92 0.49 0.52 1.71 0.51
EPS – diluted4 0.04 0.31 0.81 0.44 0.47 1.61 0.51
Dividend5 0.05 0.20 0.48 0.35 0.32 1.08 0.47
Interest bearing debt 450.0 492.4 719.2 780.8 851.0 450.0 851.0
Cash and cash equivalents 68.6 75.1 137.7 75.8 67.4 68.6 67.4
Net debt 381.3 417.3 581.5 705.0 783.6 381.3 783.6
DHT made $266.3 million in net income in 2020 - the highest yearly result in the Company’s history. Adjusted for a non-cash change in fair value related to interest rate derivatives of $8.1 million and a non-cash impairment charge of $12.6 million, net income would be $286.9 million, equivalent to $1.84 per basic share. As of December 31, 2020, interest bearing debt to total assets (based on market values) was 29%, and net debt per ship was $14.1 million. QUARTERLY HIGHLIGHTS:
• In the fourth quarter of 2020, the Company’s VLCCs achieved an average rate of $33,800 per day.
• Adjusted EBITDA for the fourth quarter of 2020 was $51.1 million. Net income of $7.6 million equates to $0.04 per basic share. Adjusted for a non-cash change in fair value related to interest rate derivatives of $2.4 million and a non-cash impairment charge of $7.6 million, net income would be $12.9 million, equivalent to $0.08 per basic share.
• For the fourth quarter of 2020, the Company declared a cash dividend of $0.05 per share of outstanding common stock, payable on February 25, 2021 to shareholders of record as of February 18, 2021. This marks the 44th consecutive quarterly dividend. The shares will be traded ex-dividend from February 17, 2021.
• DHT currently has 16 of its vessels on time charters, where four vessels have profit sharing structures on top of base rates, whilst the other 12 have fixed rates. The average of the fixed elements in these 16 time charters, i.e. of the four base rates and the 12 fixed rates, is $41,965 per day. Of the 16 vessels on time charters, seven are estimated to redeliver during first quarter 2021.
2
• In the fourth quarter of 2020, the Company prepaid $25.8 million under the Nordea Credit Facility. The voluntary prepayment was made for all regular installments for 2022.
• Mrs. Sophie Rossini, Senior Business Manager at MAN AHL, was appointed to the Board of DHT Holdings, Inc.
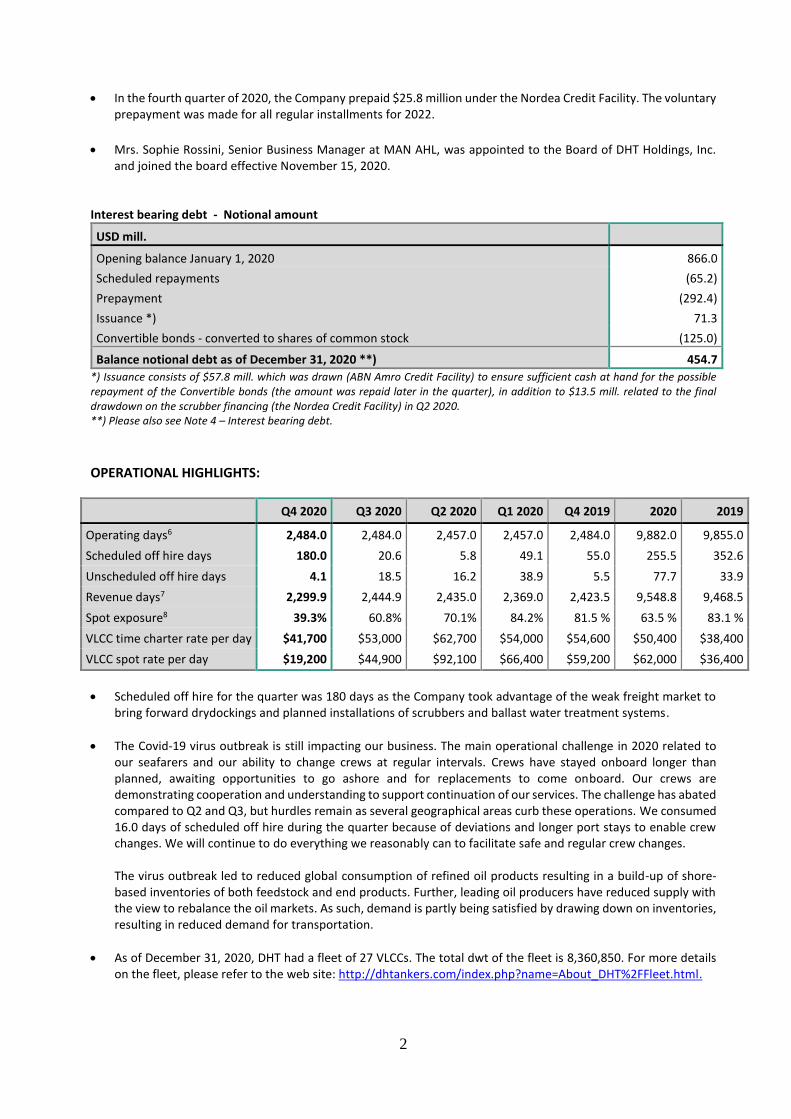
and joined the board effective November 15, 2020. Interest bearing debt - Notional amount
USD mill.
Opening balance January 1, 2020 866.0
Scheduled repayments (65.2)
Prepayment (292.4)
Issuance *) 71.3
Convertible bonds - converted to shares of common stock (125.0)
Balance notional debt as of December 31, 2020 **) 454.7
*) Issuance consists of $57.8 mill. which was drawn (ABN Amro Credit Facility) to ensure sufficient cash at hand for the possible repayment of the Convertible bonds (the amount was repaid later in the quarter), in addition to $13.5 mill. related to the final drawdown on the scrubber financing (the Nordea Credit Facility) in Q2 2020. **) Please also see Note 4 – Interest bearing debt.
OPERATIONAL HIGHLIGHTS:
Q4 2020 Q3 2020 Q2 2020 Q1 2020 Q4 2019 2020 2019
Operating days6 2,484.0 2,484.0 2,457.0 2,457.0 2,484.0 9,882.0 9,855.0
Scheduled off hire days 180.0 20.6 5.8 49.1 55.0 255.5 352.6
Unscheduled off hire days 4.1 18.5 16.2 38.9 5.5 77.7 33.9
Revenue days7 2,299.9 2,444.9 2,435.0 2,369.0 2,423.5 9,548.8 9,468.5
Spot exposure8 39.3% 60.8% 70.1% 84.2% 81.5 % 63.5 % 83.1 %
VLCC time charter rate per day $41,700 $53,000 $62,700 $54,000 $54,600 $50,400 $38,400
VLCC spot rate per day $19,200 $44,900 $92,100 $66,400 $59,200 $62,000 $36,400
• Scheduled off hire for the quarter was 180 days as the Company took advantage of the weak freight market to bring forward drydockings and planned installations of scrubbers and ballast water treatment systems.
• The Covid-19 virus outbreak is still impacting our business. The main operational challenge in 2020 related to our seafarers and our ability to change crews at regular intervals. Crews have stayed onboard longer than planned, awaiting opportunities to go ashore and for replacements to come onboard. Our crews are demonstrating cooperation and understanding to support continuation of our services. The challenge has abated compared to Q2 and Q3, but hurdles remain as several geographical areas curb these operations. We consumed 16.0 days of scheduled off hire during the quarter because of deviations and longer port stays to enable crew changes. We will continue to do everything we reasonably can to facilitate safe and regular crew changes. The virus outbreak led to reduced global consumption of refined oil products resulting in a build-up of shore-based inventories of both feedstock and end products. Further, leading oil producers have reduced supply with the view to rebalance the oil markets. As such, demand is partly being satisfied by drawing down on inventories, resulting in reduced demand for transportation.
• As of December 31, 2020, DHT had a fleet of 27 VLCCs. The total dwt of the fleet is 8,360,850. For more details on the fleet, please refer to the web site: http://dhtankers.com/index.php?name=About_DHT%2FFleet.html.

3
SUBSEQUENT EVENT HIGHLIGHT:
• On January 21, 2021, the Company announced that it has entered into agreement to acquire two VLCCs built 2016 at DSME (Daewoo) for a total of $136 million. The vessels are scheduled to deliver during the first half of 2021. The Company will finance the acquisition with available liquidity and projected mortgage debt hence it is expected to be accretive to DHT’s earnings per share. The vessels were built to high specifications by their current owner and are fuel efficient, scrubber fitted Eco-designs that will further improve the DHT fleet’s efficiencies, amongst other its Annual Efficiency Ratio (AER) and Energy Efficiency Operational Index (EEOI) metrics. The Company has drawn $15 million under one of its revolving credit facilities funding the deposit for the two VLCCs.
OUTLOOK:
• Thus far in the first quarter of 2021, 77% of the available VLCC days have been booked at an average rate of $34,700 per day on a discharge to discharge basis (not including any potential profit splits on four time charters).
• The Company will continue to take advantage of the weak freight market to bring forward drydockings and planned installations of scrubbers and ballast water treatment systems and expect scheduled offhire to be in the range between 200 and 230 days during the first quarter of 2021.
Footnotes: 1Shipping revenues net of voyage expenses. 2 Shipping revenues net of voyage expenses, vessel operating expenses and general and administrative expenses. As showed in the table for reconciliation of non-GAAP measures. 3Q4 2020 includes impairment charge of $7.6 million. Q3 2020 includes impairment charge of $ 4.9 million. 2020 includes impairment charge of $12.6 million. 4Diluted shares include the dilutive effect of the convertible senior notes and restricted shares granted to management and members of the board of directors. 5Per common share. 6Operating days are the aggregate number of calendar days in the period in which the vessels are owned by the Company or chartered by the Company. 7Revenue days are the aggregate number of calendar days in the period in which the vessels are owned by the Company or chartered by the Company less days on which a vessel is off hire. 8 As % of total operating days in period.

4
FOURTH QUARTER 2020 FINANCIALS
The Company reported shipping revenues for the fourth quarter of 2020 of $91.0 million compared to shipping revenues of $191.8 million in the fourth quarter of 2019. The decrease from the 2019 period to the 2020 period includes $91.0 million attributable to lower tanker rates and $9.8 million attributable to change in total revenue days. The decrease in total revenue days was a result of scheduled off hire in connection with special surveys and scrubber installation. Voyage expenses for the fourth quarter of 2020 were $13.3 million, compared to voyage expenses of $50.1 million in the fourth quarter of 2019. The decrease was mainly due to a $32.7 million decrease in bunker expenses and a $4.9 million decrease in port cost due to less vessels in the spot market. Vessel operating expenses for the fourth quarter of 2020 were $22.1 million compared to $21.9 million in the fourth quarter of 2019. The increase was mainly related to higher costs for crew changes due to Covid-19 and up storing of spares and consumables in relation to IMO2020. Depreciation and amortization, including depreciation of capitalized survey expenses, was $32.0 million for the fourth quarter of 2020, compared to $30.7 million in the fourth quarter of 2019. The increase was mainly due to depreciation related to scrubbers of $0.9 million. Due to a decline in values for second-hand tankers, we adjusted the carrying value of our fleet through a non-cash impairment charge of $7.6 million in the fourth quarter of 2020. No impairment charge was recorded in the fourth quarter of 2019. General & administrative expense (“G&A”) for the fourth quarter of 2020 was $4.5 million, consisting of $3.5 million cash and $1.0 million non-cash charges, compared to $3.5 million in the fourth quarter of 2019, consisting of $2.7 million cash and $0.8 million non-cash charges. Non-cash G&A includes accrual for social security tax. Net financial expenses for the fourth quarter of 2020 were $3.6 million compared to $9.8 million in the fourth quarter of 2019. The decrease was due to a $6.7 million decrease in interest expenses due to reduced outstanding debt partially offset by a non-cash gain of $2.4 million related to interest rate derivatives in the fourth quarter of 2020 compared to a non-cash gain of $3.0 million in the fourth quarter of 2019. The Company had net income in the fourth quarter of 2020 of $7.6 million, or income of $0.04 per basic share and $0.04 per diluted share, compared to net income in the fourth quarter of 2019 of $75.9 million, or income of $0.52 per basic share and $0.47 per diluted share. The change from the 2019 period to the 2020 period was mainly due to lower tanker rates. Net cash provided by operating activities for the fourth quarter of 2020 was $81.4 million compared to net cash provided by operating activities of $49.9 million for the fourth quarter of 2019. The change is mainly due to $91.1 million related to changes in operating assets and liabilities and $8.7 million related to items included in net income not affecting cash flows partially offset by net income of $7.6 million in the fourth quarter of 2020 compared to net income of $75.9 million in the fourth quarter of 2019. Net cash used in investing activities was $10.6 million in the fourth quarter of 2020 comprising $11.4 million related to investment in vessels, partially offset by $0.8 million related to a dividend received from associated company. Net cash used in investing activities was $20.0 million in the fourth quarter of 2019 comprising $20.5 million related to investment in vessels, partially offset by $0.5 million related to a dividend received from associated company. Net cash used in financing activities for the fourth quarter of 2020 was $77.3 million comprising $34.2 million related to cash dividend paid, $25.8 million related to prepayment of long-term debt and $16.8 million related to scheduled repayment of long-term debt. Net cash used in financing activities for the fourth quarter of 2019 was $77.8 million comprising $57.3 million related to prepayment of long-term debt, $16.7 million related to scheduled repayment of long-term debt, $7.3 million related to cash dividend paid and $6.4 million related to repayment of convertible bonds partially offset by $10 million related to issuance of long-term debt. As of December 31, 2020, the cash balance was $68.6 million, compared to $67.4 million as of December 31, 2019.

5
The Company monitors its covenant compliance on an ongoing basis. As of the date of the most recent compliance certificates submitted for the fourth quarter of 2020, the Company is in compliance with its financial covenants. As of December 31, 2020, the Company had 170,798,328 shares of common stock outstanding compared to 146,819,401 shares as of December 31, 2019. The Company declared a cash dividend of $0.05 per common share for the fourth quarter of 2020 payable on February 25, 2021 for shareholders of record as of February 18, 2021.
2020 FINANCIALS
The Company reported shipping revenues for 2020 of $691.0 million compared to $535.1 million in 2019. The increase from the 2019 period to the 2020 period includes $151.4 million attributable to higher tanker rates and $4.5 million attributable to increased total revenue days. Voyage expenses for 2020 were $140.6 million compared to voyage expenses of $187.5 million in 2019. The decrease was mainly due to a $50.1 million decrease in bunker expenses and a $4.2 million decrease in port cost due to less vessels in the spot market partially offset by $6.1 million related to voyage expenses which are capitalized and amortized under IFRS 15. Vessel operating expenses for 2020 were $82.2 million, compared to $78.3 million in 2019. The increase was mainly related to up storing of spares and consumables in relation to IMO2020, higher costs for crew changes due to Covid-19 in addition to deductibles on insurance. Depreciation and amortization, including depreciation of capitalized survey expenses, was $124.2 million for 2020, compared to $115.6 million in 2019. The increase was mainly due to depreciation related to scrubbers of $7.4 million. Due to a decline in values for second-hand tankers, we adjusted the carrying value of our fleet through a non-cash impairment charge of $12.6 million in 2020. No impairment charge was recorded in 2019. General & administrative expense (“G&A”) for 2020 was $17.9 million, consisting of $13.1 million cash and $4.8 million non-cash, compared to $14.8 million, consisting of $12.3 million cash and $2.5 million non-cash for 2019. Non-cash G&A includes accrual for social security tax. Net financial expenses for 2020 were $46.4 million, compared to $65.1 million in 2019. The decrease was due to a $16.9 million decrease in interest expenses due to reduced outstanding debt and a reduction in Libor in addition to a non-cash loss of $8.1 million related to interest rate derivatives in 2020 compared to a non-cash loss of $9.9 million in 2019. The Company had net income for 2020 of $266.3 million, or income of $1.71 per basic share and $1.61 per diluted share compared to net income of $73.7 million, or income of $0.51 per basic share and $0.51 per diluted share in 2019. The difference between the two periods mainly reflects higher tanker rates. Net cash provided by operating activities for 2020 was $529.9 million compared to net cash provided by operating activities of $156.0 million for 2019. The increase was mainly due to net income of $266.3 million in 2020 compared to net income of $73.7 million in 2019, $161.9 million related to changes in operating assets and liabilities and $19.4 million related to items included in net income not affecting cash flows. Net cash used in investing activities for 2020 was $26.7 million comprising $27.1 million related to investment in vessels and $0.4 million related to investment in property, plant and equipment, partially offset by $0.8 million related to a dividend received from associated company. Net cash used in investing activities for 2019 was $53.4 million comprising $53.8 million related to investment in vessels, partially offset by $0.5 million related to a dividend received from associated company. Net cash used in financing activities for 2020 was $501.9 million comprising $292.4 million related to prepayment of long-term debt, $214.7 million related to cash dividends paid and $65.2 million related to scheduled repayment of long-term debt, partially offset by $70.9 million related to issuance of long-term debt. Net cash used in financing
6
activities for 2019 was $130.2 million comprising $92.3 million related to prepayment of long-term debt, $64.2 million related to scheduled repayment of long-term debt, $28.7 million related to cash dividends paid, $6.4 million related to repayment of convertible bonds and $3.2 million related to repurchase of shares partially offset by $65.0 million related to issuance of long-term debt. As of December 31, 2020, our cash balance was $68.6 million, compared to $67.4 million as of December 31, 2019. As of December 31, 2020, the Company had 170,798,328 shares of our common stock outstanding compared to 146,819,401 as of December 31, 2019.
RECONCILIATION OF NON-GAAP FINANCIAL MEASURES The Company assesses the financial performance of its business using a variety of measures. Certain of these measures are termed “non-GAAP measures” because they exclude amounts that are included in, or include amounts that are excluded from, the most directly comparable measure calculated and presented in accordance with IFRS, or are calculated using financial measures that are not calculated in accordance with IFRS. These non-GAAP measures include “Adjusted Net Revenue”, “Adjusted EBITDA” and “Adjusted spot time charter equivalent per day”. The Company believes that these non-GAAP measures provide useful supplemental information for its investors and, when considered together with the Company’s IFRS financial measures and the reconciliation to the most directly comparable IFRS financial measure, provide a more complete understanding of the factors and trends affecting the Company’s operations. In addition, the DHT’s management measures the financial performance of the Company, in part, by using these non-GAAP measures, along with other performance metrics. The Company does not regard these non-GAAP measures as a substitute for, or as superior to, the equivalent measures calculated and presented in accordance with IFRS. Additionally, these non-GAAP measures may not be comparable to other similarly titled measures used by other companies and should not be considered in isolation or as a substitute for analysis of the Company’s operating results as reported under IFRS.
USD in thousands except time charter equivalent per day Q4 2020 Q3 2020 Q2 2020 Q1 2020 Q4 2019 2020 2019
Reconciliation of adjusted net revenue
Shipping revenues 90,992 142,196 245,942 211,908 191,835 691,039 535,068
Voyage expenses (13,268) (24,691) (43,220) (59,385) (50,140) (140,564) (187,500)
Adjusted net revenue 77,724 117,506 202,721 152,524 141,695 550,475 347,568
Reconciliation of adjusted EBITDA
Net income/(loss) after tax 7,627 50,672 135,824 72,158 75,862 266,281 73,680
Income tax expense 196 127 152 426 20 900 131
Other financial (income)/expenses 81 181 147 925 350 1,334 1,790
Fair value (gain)/loss on derivative financial liabilities (2,403) (2,611) 444 12,644 (2,990) 8,074 9,863
Interest expense 6,296 8,863 11,022 12,226 13,016 38,408 55,332
Interest income (12) (3) (98) (99) (357) (212) (1,077)
Share of profit from associated companies (344) (340) (303) (206) (267) (1,193) (852)
Impairment charges 7,640 4,920 - - - 12,560 -
Depreciation and amortization 32,028 31,117 30,774 30,326 30,663 124,245 115,584
Adjusted EBITDA 51,108 92,926 177,962 128,401 116,298 450,397 254,452
Reconciliation of adjusted spot time charter equivalent per day*
Spot time charter equivalent per day 19,200 44,900 92,100 66,400 59,200 62,000
IFRS 15 impact on spot time charter equivalent per day 1,300 (4,200) (4,900) (900) 4,700 (2,600)
Adjusted spot time charter equivalent per day 20,500 40,600 87,200 65,500 63,900 59,400 * Per revenue days. Revenue days are the aggregate number of calendar days in the period in which the vessels are owned by the Company or chartered by the Company less days on which a vessel is off hire.

7
EARNINGS CONFERENCE CALL AND WEBCAST INFORMATION The Company will host a conference call and webcast which will include a slide presentation at 8:00 a.m. EST/14:00 CET on Tuesday February 9, 2021 to discuss the results for the quarter. All shareholders and other interested parties are invited to join the conference call, which may be accessed by calling +1 646 741 3167 within the United States, 21 56 30 15 within Norway and +44 (0) 207 192 8338 for international callers. The passcode is “7587887”. The webcast, which will include a slide presentation, will be available on the following link: https://edge.media-server.com/mmc/p/bs5u74qt and can also be accessed in the Investor Relations section on DHT's website at http://www.dhtankers.com. An audio replay of the conference call will be available until February 16, 2021 1:00 p.m. EST/19:00 CET. To access the replay, dial +1 917 677 7532 within the United States, 21 03 42 35 within Norway or +44 (0) 333 300 9785 for international callers and enter “7587887” as the pass code.
ABOUT DHT HOLDINGS, INC. DHT is an independent crude oil tanker company. Our fleet trades internationally and consists of crude oil tankers in the VLCC segment. We operate through our integrated management companies in Monaco, Singapore and Oslo, Norway. You shall recognize us by our business approach with an experienced organization with focus on first rate operations and customer service, quality ships built at quality shipyards, prudent capital structure to accommodate staying power through the business cycles, a combination of market exposure and fixed income contracts for our fleet, a counter cyclical philosophy with respect to investments, employment of our fleet and capital allocation and a transparent corporate structure maintaining a high level of integrity and good governance. For further information: www.dhtankers.com.
FORWARD LOOKING STATEMENTS This press release contains certain forward-looking statements and information relating to the Company that are based on beliefs of the Company's management as well as assumptions, expectations, projections, intentions and beliefs about future events, in particular regarding dividends (including our dividend plans, timing and the amount and growth of any dividends), daily charter rates, vessel utilization, the future number of newbuilding deliveries, oil prices and seasonal fluctuations in vessel supply and demand. When used in this document, words such as "believe," "intend," "anticipate," "estimate," "project," "forecast," "plan," "potential," "will," "may," "should" and "expect" and similar expressions are intended to identify forward-looking statements but are not the exclusive means of identifying such statements. These statements reflect the Company's current views with respect to future events and are based on assumptions and subject to risks and uncertainties. Given these uncertainties, you should not place undue reliance on these forward-looking statements. These forward-looking statements represent the Company's estimates and assumptions only as of the date of this press release and are not intended to give any assurance as to future results. For a detailed discussion of the risk factors that might cause future results to differ, please refer to the Company's Annual Report on Form 20-F, filed with the Securities and Exchange Commission on March 25, 2020. The Company undertakes no obligation to publicly update or revise any forward-looking statements contained in this press release, whether as a result of new information, future events or otherwise, except as required by law. In light of these risks, uncertainties and assumptions, the forward-looking events discussed in this press release might not occur, and the Company's actual results could differ materially from those anticipated in these forward-looking statements.
CONTACT:
Laila C. Halvorsen, CFO
Phone: +1 441 295 1422 and +47 984 39 935
E-mail: [email protected]
Wilhelm Flinder, Manager - Investor Relations & Business Analysis Phone: +1 441 295 1422 and +47 936 11 350 E-mail: [email protected]

8
DHT HOLDINGS, INC.
UNAUDITED INTERIM CONDENSED CONSOLIDATED FINANCIAL STATEMENTS
AS OF DECEMBER 31, 2020
9
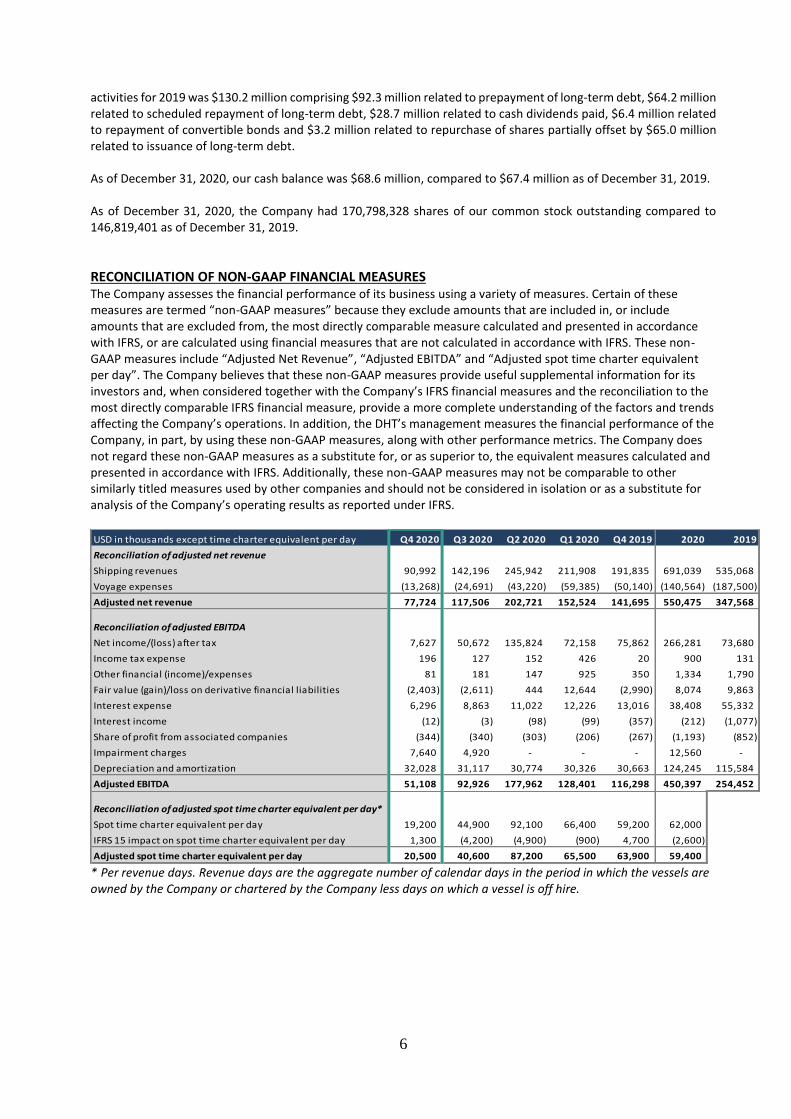
CONDENSED CONSOLIDATED STATEMENT OF FINANCIAL POSITION (UNAUDITED) ($ in thousands)
Note December 31, 2020 December 31, 2019
ASSETS
Current assets
Cash and cash equivalents $ 68,641 67,356
Accounts receivable and accrued revenues 8 30,060 107,848
Capitalized voyage expenses 1,039 4,151
Prepaid expenses 6,685 4,846
Bunkers, lube oils and consumables 11,854 34,085
Total current assets $ 118,279 218,286
Non-current assets
Vessels and time charter contracts 5 $ 1,476,436 1,589,444
Advances for vessel upgrades 5 17,269 11,652
Other property, plant and equipment 4,772 3,065
Investment in associate company 5,233 4,772
Total non-current assets $ 1,503,710 1,608,932
TOTAL ASSETS $ 1,621,989 1,827,218
LIABILITIES AND EQUITY
Current liabilities
Accounts payable and accrued expenses $ 18,503 23,998
Derivative financial liabilities 4 9,073 4,320
Current portion long-term debt 4 3,396 100,385
Other current liabilities 721 605
Deferred shipping revenues 9 16,236 930
Total current liabilities $ 47,929 130,239
Non-current liabilities
Long-term debt 4 $ 446,562 750,586
Derivative financial liabilities 4 14,601 11,279
Other non-current liabilities 3,957 2,664
Total non-current liabilities $ 465,120 764,530
TOTAL LIABILITIES $ 513,049 894,768
Equity
Common stock at par value 6 $ 1,708 1,468
Additional paid-in capital 6 1,291,505 1,169,537
Accumulated deficit (188,709) (240,165)
Translation differences 169 73
Other reserves 4,248 1,531
Total equity attributable to the Company 1,108,921 932,444
Non-controlling interest 19 5
Total equity $ 1,108,940 932,449
TOTAL LIABILITIES AND EQUITY $ 1,621,989 1,827,218
The accompanying notes are an integral part of these unaudited condensed consolidated financial statements

10
CONDENSED CONSOLIDATED INCOME STATEMENT (UNAUDITED) ($ in thousands except per share amounts)
The accompanying notes are an integral part of these unaudited condensed consolidated financial statements
Q4 2020 Q4 2019 12 months 2020 12 months 2019
Note
Oct. 1 - Dec. 31,
2020
Oct. 1 - Dec. 31,
2019
Jan. 1 - Dec. 31,
2020
Jan. 1 - Dec. 31,
2019
Shipping revenues $ 90,992 191,835 691,039 535,068
Operating expenses
Voyage expenses (13,268) (50,140) (140,564) (187,500)
Vessel operating expenses (22,144) (21,874) (82,188) (78,327)
Depreciation and amortization 5 (32,028) (30,663) (124,245) (115,584)
Impairment charges 5 (7,640) - (12,560) -
General and administrative expense (4,472) (3,523) (17,890) (14,789)
Total operating expenses $ (79,553) (106,200) (377,447) (396,201)
Operating income $ 11,440 85,635 313,591 138,867
Share of profit from associated companies 344 267 1,193 852
Interest income 12 357 212 1,077
Interest expense (6,296) (13,016) (38,408) (55,332)
Fair value gain/(loss) on derivative financial liabilities 2,403 2,990 (8,074) (9,863)
Other financial (expense)/income (81) (350) (1,334) (1,790)
Profit/(loss) before tax $ 7,822 75,882 267,181 73,812
Income tax expense (196) (20) (900) (131)
Net income/(loss) after tax $ 7,627 75,862 266,281 73,680
Attributable to owners of non-controlling interest 8 5 14 2
Attributable to the owners of parent $ 7,619 75,856 266,266 73,679
Basic net income/(loss) per share 0.04 0.52 1.71 0.51
Diluted net income/(loss) per share 0.04 0.47 1.61 0.51
-
Weighted average number of shares (basic) 170,798,328 146,669,533 155,712,886 143,437,164
Weighted average number of shares (diluted) 170,842,884 167,766,809 170,053,975 168,159,876
11
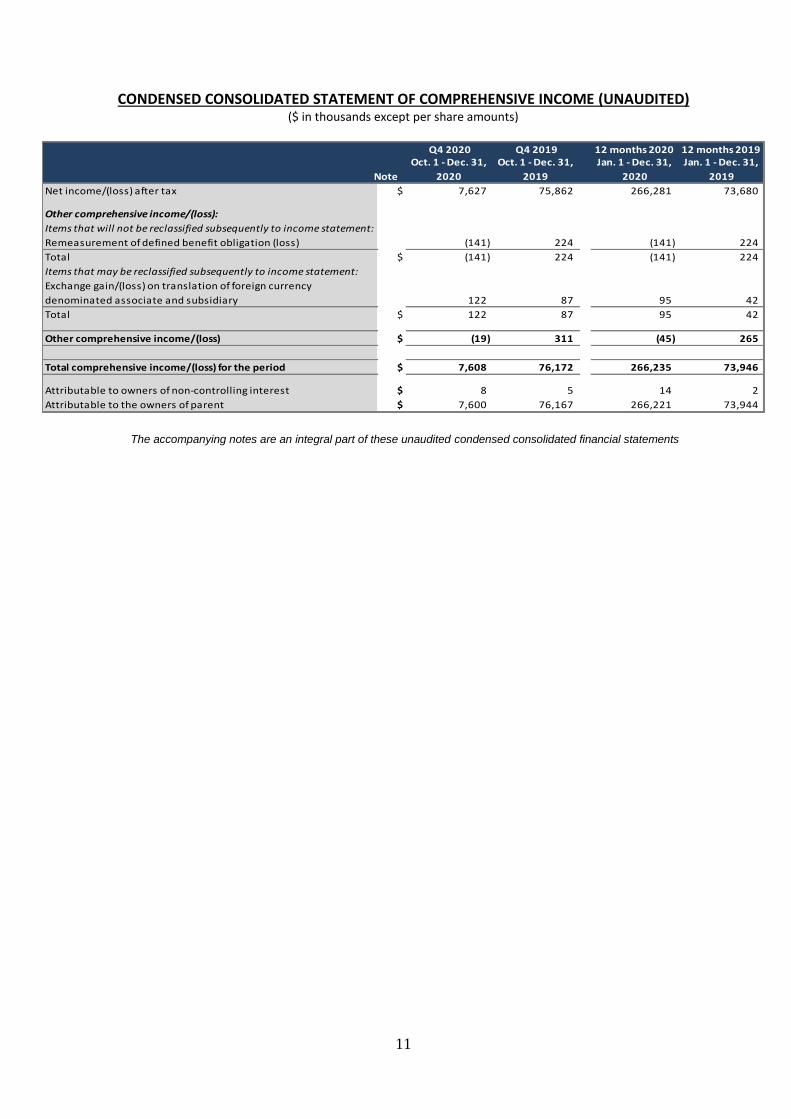
CONDENSED CONSOLIDATED STATEMENT OF COMPREHENSIVE INCOME (UNAUDITED) ($ in thousands except per share amounts)
The accompanying notes are an integral part of these unaudited condensed consolidated financial statements
Q4 2020 Q4 2019 12 months 2020 12 months 2019
Note
Oct. 1 - Dec. 31,
2020
Oct. 1 - Dec. 31,
2019
Jan. 1 - Dec. 31,
2020
Jan. 1 - Dec. 31,
2019
Net income/(loss) after tax $ 7,627 75,862 266,281 73,680
Other comprehensive income/(loss):
Items that will not be reclassified subsequently to income statement:
Remeasurement of defined benefit obligation (loss) (141) 224 (141) 224
Total $ (141) 224 (141) 224
Items that may be reclassified subsequently to income statement:
Exchange gain/(loss) on translation of foreign currency
denominated associate and subsidiary 122 87 95 42
Total $ 122 87 95 42
Other comprehensive income/(loss) $ (19) 311 (45) 265
Total comprehensive income/(loss) for the period $ 7,608 76,172 266,235 73,946
Attributable to owners of non-controlling interest $ 8 5 14 2
Attributable to the owners of parent $ 7,600 76,167 266,221 73,944

12
CONDENSED CONSOLIDATED STATEMENT OF CASH FLOW (UNAUDITED) ($ in thousands)
The accompanying notes are an integral part of these unaudited condensed consolidated financial statements
Q4 2020 Q4 2019 12 months 2020 12 months 2019
Note
Oct. 1 - Dec. 31,
2020
Oct. 1 - Dec. 31,
2019
Jan. 1 - Dec. 31,
2020
Jan. 1 - Dec. 31,
2019
CASH FLOW FROM OPERATING ACTIVITIES
Net income / (loss) after tax $ 7,627 75,862 266,281 73,680
Items included in net income not affecting cash flows 38,464 29,790 154,331 134,929
Depreciation and amortization 5 32,028 30,663 124,245 115,584
Impairment charges 5 7,640 - 12,560 -
Amortization of upfont fees 561 1,930 5,538 8,003
Fair value (gain) / loss on derivative financial liabilities 4 (2,403) (2,990) 8,074 9,863
Compensation related to options and restricted stock 982 454 5,106 2,331
Share of profit in associated companies (344) (267) (1,193) (852)
Income adjusted for non-cash items $ 46,091 105,651 420,611 208,610
Changes in operating assets and liabilities 35,261 (55,792) 109,258 (52,653)
Accounts receivable and accrued revenues 8 31,857 (52,872) 77,788 (47,651)
Capitalized voyage expenses 93 (1,658) 3,111 (2,518)
Prepaid expenses (2,765) (1,470) (2,265) (508)
Accounts payable and accrued expenses 6,771 5,767 (6,967) (1,137)
Deferred shipping revenues 9 (2,066) 930 15,306 930
Bunkers, lube oils and consumables 1,313 (6,489) 22,231 (1,874)
Pension liability 59 (1) 53 105
Net cash provided by operating activities $ 81,352 49,859 529,870 155,956
CASH FLOW FROM INVESTING ACTIVITIES
Investment in vessels (11,352) (20,493) (27,117) (53,803)
Dividend received from associated company 835 513 835 513
Investment in property, plant and equipment (44) (31) (435) (79)
Net cash used in investing activities $ (10,560) (20,011) (26,717) (53,369)
CASH FLOW FROM FINANCING ACTIVITIES
Cash dividends paid 7 (34,160) (7,340) (214,669) (28,685)
Repayment principal element of lease liability (128) (129) (467) (370)
Issuance of long-term debt 4 (400) 10,000 70,862 64,990
Purchase of treasury shares 7 - - - (3,248)
Issuance of convertible bonds 6 - - - (7)
Scheduled repayment of long-term debt 4 (16,770) (16,694) (65,151) (64,175)
Prepayment of long-term debt 4 (25,800) (57,254) (292,443) (92,254)
Repayment of convertible bonds 6 - (6,426) - (6,426)
Net cash used in financing activities $ (77,258) (77,844) (501,868) (130,176)
Net (decrease)/increase in cash and cash equivalents (6,466) (47,995) 1,285 (27,588)
Cash and cash equivalents at beginning of period 75,107 115,352 67,356 94,944
Cash and cash equivalents at end of period $ 68,641 67,356 68,641 67,356
Specification of items included in operating activities:
Interest paid 6,172 11,082 35,404 49,233
Interest received 12 357 212 1,077

13
SUMMARY CONSOLIDATED STATEMENT OF CHANGES IN EQUITY (UNAUDITED) ($ in thousands except shares)
The accompanying notes are an integral part of these unaudited condensed consolidated financial statements
Paid-in Non-
Additional Treasury Accumulated Translation Other Controlling Total
N o te Shares Stock Capital Shares Deficit Differences Reserves Interest Equity
Balance at January 1, 2019 142,700,046 $ 1,427 $ 1,145,107 $ (1,364) $ (285,383) $ 32 $ 1,848 $ - $ 861,668
Net income/(loss) after tax 73,679 2 73,680
Other comprehensive income 224 42 265
Total comprehensive income 73,903 42 2 73,946
Cash dividends declared and paid (28,685) (28,685)
Purchase of treasury shares (3,248) (3,248)
Adjustment related to non-controlling interest 3 3
Retirement of treasury shares (1,061,241) (11) (4,602) 4,612 -
Conversion of convertible bonds 4,390,025 44 26,391 26,435
Compensation related to options and restricted stock 790,571 8 2,640 (317) 2,331
Balance at December 31, 2019 146,819,401 $ 1,468 $ 1,169,537 $ - $ (240,165) $ 73 $ 1,531 $ 5 $ 932,449
Balance at January 1, 2020 146,819,401 $ 1,468 $ 1,169,537 $ - $ (240,165) $ 73 $ 1,531 $ 5 $ 932,449
Net income/(loss) after tax 266,266 14 266,281
Other comprehensive income/(loss) (141) 95 (45)
Total comprehensive income/(loss) 266,125 95 14 266,235
Cash dividends declared and paid (214,669) (214,669)
Conversion of convertible bonds 6 23,377,397 234 119,584 119,818
Compensation related to options and restricted stock 601,530 6 2,383 2,717 5,106
Balance at December 31, 2020 170,798,328 $ 1,708 $ 1,291,505 $ - $ (188,709) $ 169 $ 4,248 $ 19 $ 1,108,940

14
NOTES TO THE CONDENSED CONSOLIDATED FINANCIAL STATEMENTS FOR THE PERIOD ENDED DECEMBER 31, 2020
Note 1 – General information DHT Holdings, Inc. (“DHT” or the “Company”) is a company incorporated under the laws of the Marshall Islands whose shares are listed on the New York Stock Exchange. The Company’s principal executive office is located at Clarendon House, 2 Church Street, Hamilton HM 11, Bermuda. The Company is engaged in the ownership and operation of a fleet of crude oil carriers. The financial statements were approved by the Company’s Board of Directors (the “Board”) on February 5, 2021 and authorized for issue on February 8, 2021.
Note 2 – General accounting principles The condensed consolidated interim financial statements do not include all information and disclosure required in the annual financial statements and should be read in conjunction with DHT’s audited consolidated financial statements included in its Annual Report on Form 20-F for 2019. The interim results are not necessarily indicative of the results for the entire year or for any future periods. The interim condensed financial statements have been prepared in accordance with IAS 34 “Interim Financial Reporting” as issued by the International Accounting Standards Board (“IASB”). The interim condensed financial statements have been prepared on a historical cost basis, except for derivative financial instruments that have been measured at fair value. The accounting policies that have been followed in these interim condensed financial statements are the same as presented in the 2019 audited consolidated financial statements. These interim condensed consolidated financial statements have been prepared on a going concern basis. Application of new and revised International Financial Reporting Standards (“IFRSs”) New and revised IFRSs, and interpretations mandatory for the first time for the financial year beginning January 1, 2020 are listed below. The adoption did not have any effect on the financial statements:
o IFRS 17 Insurance Contracts o Amendments to IFRS 9, IAS 39 and IFRS 7 o Amendments to IFRS 10 and IAS 28 Sale or Contribution of Assets between an Investor and its Associates or Joint
Venture o Amendments to IFRS 3 Definition of a business o Amendments to IAS 1 and IAS 8 Definition of material o Conceptual Framework Amendments to References to the Conceptual Framework in IFRS Standards

15
Note 3 – Segment reporting Since DHT’s business is limited to operating a fleet of crude oil tankers, management has organized the entity as one segment based upon the service provided. Consequently, the Company has one operating segment as defined in IFRS 8, Operating Segments. The below table details the Company’s shipping revenues:
$ in thousands Q4 2020 Q4 2019 2020 2019
Time charter revenues* 63,027 23,919 182,663 57,472
Voyage charter revenues 27,965 167,916 508,375 477,595
Shipping revenues 90,992 191,835 691,039 535,068 *Time charter revenue is presented in accordance with IFRS 16 Leases, while the portion of time charter revenue related to technical management services, equaling $14.0 million in the fourth quarter of 2020, $4.1 million in the fourth quarter of 2019, $33.2 million for 2020 and $14.8 million for 2019 is presented in accordance with IFRS 15 Revenue from Contracts with Customers. As of December 31, 2020, the Company had 27 vessels in operation; 18 vessels were on time charters and 9 vessels operating in the spot market. Information about major customers: For the period from October 1, 2020 to December 31, 2020 five customers represented $19.4 million, $14.0 million, $9.4 million, $7.7 million, and $7.1 million, respectively, of the Company’s revenues. The five customers in aggregate represented $57.6 million, equal to 63 percent of the total revenue of $91.0 million for the period from October 1, 2020 to December 31, 2020. For the period from January 1, 2020 to December 31, 2020 five customers represented $78.5 million, $57.8 million, $55.4 million, $53.7 million, and $37.7 million, respectively, of the Company’s revenues. The five customers in aggregate represented $283.1 million, equal to 41 percent of the total revenue of $691.0 million for the period from January 1, 2020 to December 31, 2020. For the period from October 1, 2019 to December 31, 2019 five customers represented $28.5 million, $28.4 million, $25.8 million, $19.8 million, and $11.8 million, respectively, of the Company’s revenues. The five customers in aggregate represented $114.3 million, equal to 60 percent of the total revenue of $191.8 million for the period from October 1, 2019 to December 31, 2019. For the period from January 1, 2019 to December 31, 2019 five customers represented $84.1 million, $79.2 million, $73.6 million, $39.5 million, and $34.8 million, respectively, of the Company’s revenues. The five customers in aggregate represented $311.2 million, equal to 58 percent of the total revenue of $535.1 million for the period from January 1, 2019 to December 31, 2019.
Note 4 – Interest bearing debt As of December 31, 2020, DHT had interest bearing debt totaling $450.0 million.
Scheduled debt repayments (USD thousands) and margin above Libor
* $100.0 mill. undrawn as of December 31, 2020. ** $70.3 mill. undrawn as of December 31, 2020.
Margin Q1 Q2-Q4
$ in thousands above Libor 2021 2021 2022 2023 Thereafter Total
ABN Amro Credit Facility * 2.40 % - - 33,378 33,378 202,750 269,505
Credit Agricole Credit Facility 2.19 % 676 2,027 2,703 32,433 - 37,839
Danish Ship Finance Credit Facility 2.00 % - 2,427 2,427 2,427 29,120 36,400
Nordea Credit Facility ** 2.40 % - - - 110,933 - 110,933
Total 676 4,454 38,507 179,170 231,870 454,677
Unamortized upfront fees bank loans (4,718)
Total interest bearing debt 449,959

16
ABN Amro Credit Facility
In April 2018 the Company entered into a credit facility with ABN Amro, Nordea, Credit Agricole, DNB, ING, Danish Ship Finance, SEB, DVB and Swedbank as lenders for the financing of eleven VLCCs and two newbuildings. The credit facility is guaranteed by DHT Holdings, Inc. and borrowings bear interest at a rate equal to Libor + 2.40%. In March 2020 and September 2020, the Company prepaid $57.8 million and $42.2 million, respectively, under the revolving credit facility tranche and subsequent to the prepayment, the current outstanding is repayable in quarterly installments of $8.3 million through Q2 2024 with a final payment of $186.1 with the last installment. In June 2020, the Company prepaid $33.4 million under the ABN Amro Credit Facility. The voluntary prepayment was made for all regular installments for 2021.
The credit facility contains a covenant requiring that at all times the charter-free market value of the vessels that secure the credit facility be no less than 135% of borrowings. Also, DHT covenants that, throughout the term of the credit facility, DHT, on a consolidated basis, shall maintain:
• Value adjusted* tangible net worth of $300 million
• Value adjusted* tangible net worth shall be at least 25% of value adjusted total assets
• Unencumbered consolidated cash of at least the higher of (i) $30 million and (ii) 6% of our gross interest-bearing debt
* Value adjusted defined as an adjustment to reflect the difference between the carrying amount and the market valuations of the Company’s vessels (as determined quarterly by an approved broker).
Credit Agricole Credit Facility In June 2015, the Company entered into a credit agreement with Credit Agricole for the financing of the DHT Scandinavia and the newbuilding DHT Tiger that was delivered in January 2017. In June 2016, the Company made a voluntary prepayment of $5.0 million and in September 2020, the Company prepaid the outstanding loan totaling $12.7 million on DHT Scandinavia. The $48.7 million financing of DHT Tiger was drawn in 2016 in advance of the delivery of the DHT Tiger which took place in January 2017 and is repayable in quarterly installments of $0.7 million with a final payment of $29.7 in December 2023. The loan bears interest at Libor plus a margin of 2.1875%. The credit agreement is guaranteed by DHT and contains a covenant requiring that at all times the charter-free market value of the vessels that secure the credit facility be no less than 135% of borrowings. Also, DHT covenants that, throughout the term of the credit facility, DHT, on a consolidated basis, shall maintain:
• Value adjusted* tangible net worth of $200 million
• Value adjusted* tangible net worth shall be at least 25% of value adjusted total assets
• Unencumbered consolidated cash of at least the higher of (i) $20 million and (ii) 6% of our gross interest-bearing debt
* Value adjusted defined as an adjustment to reflect the difference between the carrying amount and the market valuations of the Company’s vessels (as determined quarterly by an approved broker).
Danish Ship Finance Credit Facility In November 2014 the Company entered into a credit facility totaling $49.4 million with Danish Ship Finance (“DSF”) as lender and DHT Holdings, Inc. as guarantor for the financing of the VLCC newbuilding DHT Jaguar delivered in Q4 2015. The full amount of the credit facility was drawn in November 2015. Borrowings bear interest at a rate equal to Libor + 2.25% and are repayable in 10 semiannual installments of $1.3 million each from May 2016 to November 2020. The credit facility contains a covenant requiring that at all times the charter-free market value of the vessel that secure the credit facility be no less than 135% of borrowings. Also, DHT covenants that, throughout the term of the credit facility, DHT, on a consolidated basis, shall maintain:
• Value adjusted* tangible net worth of $300 million
• Value adjusted* tangible net worth shall be at least 25% of value adjusted total assets
• Unencumbered consolidated cash of at least the higher of (i) $30 million and (ii) 6% of our gross interest-bearing debt
* Value adjusted defined as an adjustment to reflect the difference between the carrying amount and the market valuations of the Company’s vessels (as determined quarterly by an approved broker).
17
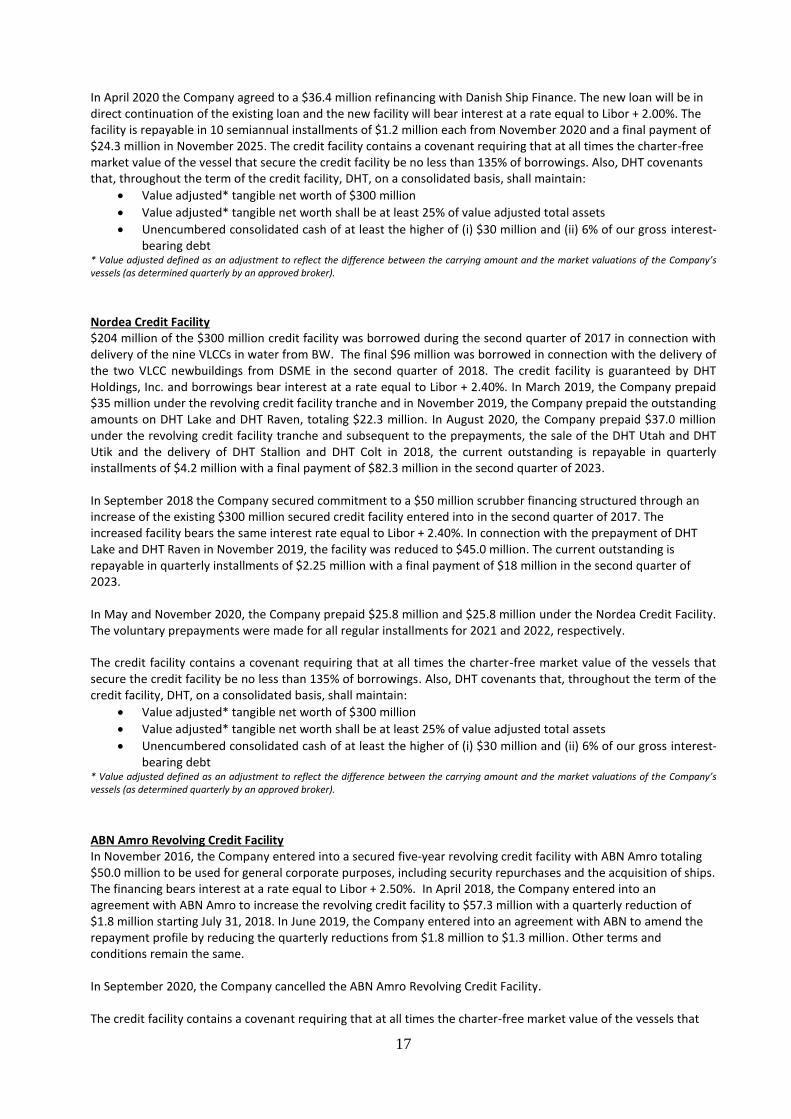
In April 2020 the Company agreed to a $36.4 million refinancing with Danish Ship Finance. The new loan will be in direct continuation of the existing loan and the new facility will bear interest at a rate equal to Libor + 2.00%. The facility is repayable in 10 semiannual installments of $1.2 million each from November 2020 and a final payment of $24.3 million in November 2025. The credit facility contains a covenant requiring that at all times the charter-free market value of the vessel that secure the credit facility be no less than 135% of borrowings. Also, DHT covenants that, throughout the term of the credit facility, DHT, on a consolidated basis, shall maintain:
• Value adjusted* tangible net worth of $300 million
• Value adjusted* tangible net worth shall be at least 25% of value adjusted total assets
• Unencumbered consolidated cash of at least the higher of (i) $30 million and (ii) 6% of our gross interest-bearing debt
* Value adjusted defined as an adjustment to reflect the difference between the carrying amount and the market valuations of the Company’s vessels (as determined quarterly by an approved broker).
Nordea Credit Facility $204 million of the $300 million credit facility was borrowed during the second quarter of 2017 in connection with delivery of the nine VLCCs in water from BW. The final $96 million was borrowed in connection with the delivery of the two VLCC newbuildings from DSME in the second quarter of 2018. The credit facility is guaranteed by DHT Holdings, Inc. and borrowings bear interest at a rate equal to Libor + 2.40%. In March 2019, the Company prepaid $35 million under the revolving credit facility tranche and in November 2019, the Company prepaid the outstanding amounts on DHT Lake and DHT Raven, totaling $22.3 million. In August 2020, the Company prepaid $37.0 million under the revolving credit facility tranche and subsequent to the prepayments, the sale of the DHT Utah and DHT Utik and the delivery of DHT Stallion and DHT Colt in 2018, the current outstanding is repayable in quarterly installments of $4.2 million with a final payment of $82.3 million in the second quarter of 2023. In September 2018 the Company secured commitment to a $50 million scrubber financing structured through an increase of the existing $300 million secured credit facility entered into in the second quarter of 2017. The increased facility bears the same interest rate equal to Libor + 2.40%. In connection with the prepayment of DHT Lake and DHT Raven in November 2019, the facility was reduced to $45.0 million. The current outstanding is repayable in quarterly installments of $2.25 million with a final payment of $18 million in the second quarter of 2023. In May and November 2020, the Company prepaid $25.8 million and $25.8 million under the Nordea Credit Facility. The voluntary prepayments were made for all regular installments for 2021 and 2022, respectively.
The credit facility contains a covenant requiring that at all times the charter-free market value of the vessels that secure the credit facility be no less than 135% of borrowings. Also, DHT covenants that, throughout the term of the credit facility, DHT, on a consolidated basis, shall maintain:
• Value adjusted* tangible net worth of $300 million
• Value adjusted* tangible net worth shall be at least 25% of value adjusted total assets
• Unencumbered consolidated cash of at least the higher of (i) $30 million and (ii) 6% of our gross interest-bearing debt
* Value adjusted defined as an adjustment to reflect the difference between the carrying amount and the market valuations of the Company’s vessels (as determined quarterly by an approved broker).
ABN Amro Revolving Credit Facility In November 2016, the Company entered into a secured five-year revolving credit facility with ABN Amro totaling $50.0 million to be used for general corporate purposes, including security repurchases and the acquisition of ships. The financing bears interest at a rate equal to Libor + 2.50%. In April 2018, the Company entered into an agreement with ABN Amro to increase the revolving credit facility to $57.3 million with a quarterly reduction of $1.8 million starting July 31, 2018. In June 2019, the Company entered into an agreement with ABN to amend the repayment profile by reducing the quarterly reductions from $1.8 million to $1.3 million. Other terms and conditions remain the same. In September 2020, the Company cancelled the ABN Amro Revolving Credit Facility. The credit facility contains a covenant requiring that at all times the charter-free market value of the vessels that
18
secure the credit facility be no less than 135% of borrowings. Also, DHT covenants that, throughout the term of the credit facility, DHT, on a consolidated basis, shall maintain:
• Value adjusted* tangible net worth of $300 million
• Value adjusted* tangible net worth shall be at least 25% of value adjusted total assets
• Unencumbered consolidated cash of at least the higher of (i) $30 million and (ii) 6% of our gross interest-bearing debt
*Value adjusted defined as an adjustment to reflect the difference between the carrying amount and the market valuations of the Company’s vessels (as determined quarterly by an approved broker).
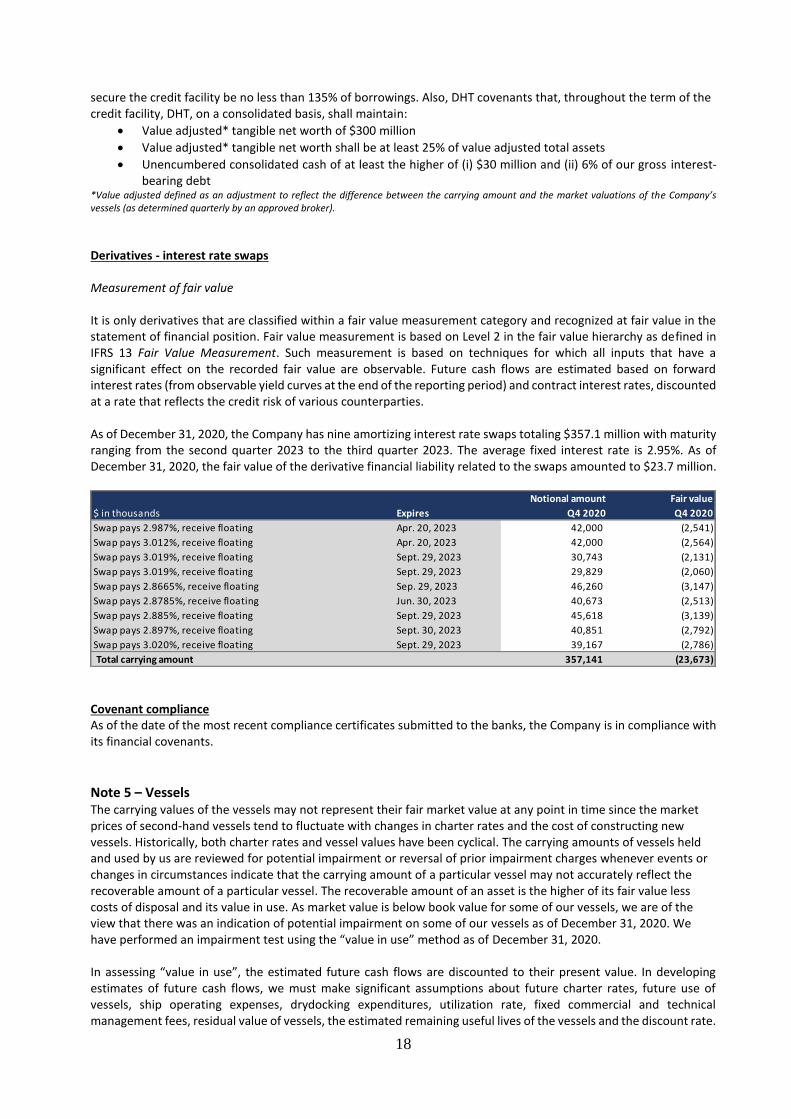
Derivatives - interest rate swaps Measurement of fair value It is only derivatives that are classified within a fair value measurement category and recognized at fair value in the statement of financial position. Fair value measurement is based on Level 2 in the fair value hierarchy as defined in IFRS 13 Fair Value Measurement. Such measurement is based on techniques for which all inputs that have a significant effect on the recorded fair value are observable. Future cash flows are estimated based on forward interest rates (from observable yield curves at the end of the reporting period) and contract interest rates, discounted at a rate that reflects the credit risk of various counterparties. As of December 31, 2020, the Company has nine amortizing interest rate swaps totaling $357.1 million with maturity ranging from the second quarter 2023 to the third quarter 2023. The average fixed interest rate is 2.95%. As of December 31, 2020, the fair value of the derivative financial liability related to the swaps amounted to $23.7 million.
Covenant compliance As of the date of the most recent compliance certificates submitted to the banks, the Company is in compliance with its financial covenants.
Note 5 – Vessels The carrying values of the vessels may not represent their fair market value at any point in time since the market prices of second-hand vessels tend to fluctuate with changes in charter rates and the cost of constructing new vessels. Historically, both charter rates and vessel values have been cyclical. The carrying amounts of vessels held and used by us are reviewed for potential impairment or reversal of prior impairment charges whenever events or changes in circumstances indicate that the carrying amount of a particular vessel may not accurately reflect the recoverable amount of a particular vessel. The recoverable amount of an asset is the higher of its fair value less costs of disposal and its value in use. As market value is below book value for some of our vessels, we are of the view that there was an indication of potential impairment on some of our vessels as of December 31, 2020. We have performed an impairment test using the “value in use” method as of December 31, 2020. In assessing “value in use”, the estimated future cash flows are discounted to their present value. In developing estimates of future cash flows, we must make significant assumptions about future charter rates, future use of vessels, ship operating expenses, drydocking expenditures, utilization rate, fixed commercial and technical management fees, residual value of vessels, the estimated remaining useful lives of the vessels and the discount rate.
Notional amount Fair value
$ in thousands Expires Q4 2020 Q4 2020
Swap pays 2.987%, receive floating Apr. 20, 2023 42,000 (2,541)
Swap pays 3.012%, receive floating Apr. 20, 2023 42,000 (2,564)
Swap pays 3.019%, receive floating Sept. 29, 2023 30,743 (2,131)
Swap pays 3.019%, receive floating Sept. 29, 2023 29,829 (2,060)
Swap pays 2.8665%, receive floating Sep. 29, 2023 46,260 (3,147)
Swap pays 2.8785%, receive floating Jun. 30, 2023 40,673 (2,513)
Swap pays 2.885%, receive floating Sept. 29, 2023 45,618 (3,139)
Swap pays 2.897%, receive floating Sept. 30, 2023 40,851 (2,792)
Swap pays 3.020%, receive floating Sept. 29, 2023 39,167 (2,786)
Total carrying amount 357,141 (23,673)
19
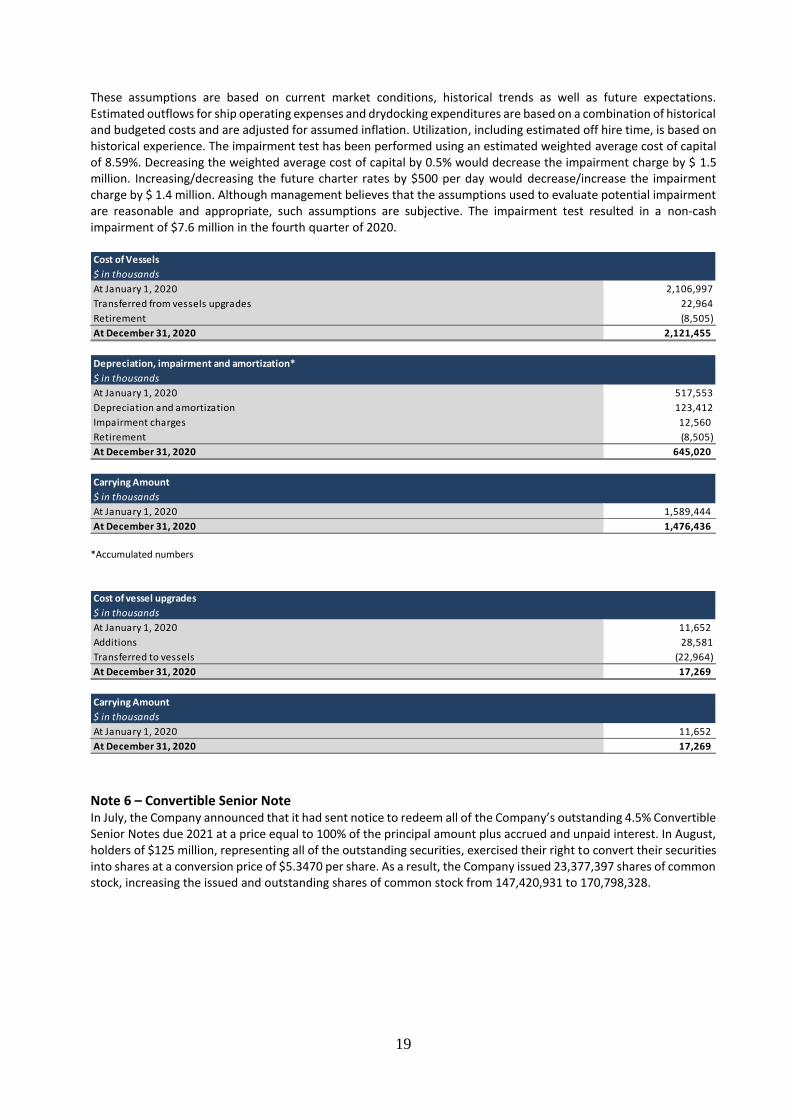
These assumptions are based on current market conditions, historical trends as well as future expectations. Estimated outflows for ship operating expenses and drydocking expenditures are based on a combination of historical and budgeted costs and are adjusted for assumed inflation. Utilization, including estimated off hire time, is based on historical experience. The impairment test has been performed using an estimated weighted average cost of capital of 8.59%. Decreasing the weighted average cost of capital by 0.5% would decrease the impairment charge by $ 1.5 million. Increasing/decreasing the future charter rates by $500 per day would decrease/increase the impairment charge by $ 1.4 million. Although management believes that the assumptions used to evaluate potential impairment are reasonable and appropriate, such assumptions are subjective. The impairment test resulted in a non-cash impairment of $7.6 million in the fourth quarter of 2020.
*Accumulated numbers
Note 6 – Convertible Senior Note In July, the Company announced that it had sent notice to redeem all of the Company’s outstanding 4.5% Convertible Senior Notes due 2021 at a price equal to 100% of the principal amount plus accrued and unpaid interest. In August, holders of $125 million, representing all of the outstanding securities, exercised their right to convert their securities into shares at a conversion price of $5.3470 per share. As a result, the Company issued 23,377,397 shares of common stock, increasing the issued and outstanding shares of common stock from 147,420,931 to 170,798,328.
Cost of Vessels
$ in thousands
At January 1, 2020 2,106,997
Transferred from vessels upgrades 22,964
Retirement (8,505)
At December 31, 2020 2,121,455
Depreciation, impairment and amortization*
$ in thousands
At January 1, 2020 517,553
Depreciation and amortization 123,412
Impairment charges 12,560
Retirement (8,505)
At December 31, 2020 645,020
Carrying Amount
$ in thousands
At January 1, 2020 1,589,444
At December 31, 2020 1,476,436
Cost of vessel upgrades
$ in thousands
At January 1, 2020 11,652
Additions 28,581
Transferred to vessels (22,964)
At December 31, 2020 17,269
Carrying Amount
$ in thousands
At January 1, 2020 11,652
At December 31, 2020 17,269

20
Note 7 – Stockholders equity and dividend payment
Common stock Preferred stock
Issued at December 31, 2020 170,798,328 - Numbers of shares authorized for issue
at December 31, 2020 250,000,000 1,000,000 Par value $ 0.01 $ 0.01
Common stock: Each outstanding share of common stock entitles the holder to one vote on all matters submitted to a vote of stockholders. Preferred stock: In the first quarter 2017, the board established two series of preferred stock: Series C Preferred Stock and Series D Preferred Stock, the terms of which are detailed in Current Reports on Form 6-K dated January 30, 2017 and March 24, 2017, respectively. As of December 31, 2020, no shares of Series C Preferred Stock or Series D Preferred Stock were outstanding. Terms and rights of any other preferred shares will be established by the board when or if such shares would be issued. Stock repurchases The Company did not make any share repurchases during Q4 2020. Dividend payment Dividend payment as of December 31, 2020:
Payment date Total Payment Per common share November 25, 2020 $ 34.2 million $ 0.20 September 2, 2020 $ 82.0 million $ 0.48 May 26, 2020 $ 51.5 million $ 0.35 February 25, 2020 $ 47.0 million $ 0.32
Total payment as of December 31, 2020 $ 214.7 million $ 1.35
Dividend payment as of December 31, 2019:
Payment date Total Payment Per common share
November 14, 2019 $ 7.3 million $ 0.05 August 29, 2019 $ 2.8 million $ 0.02 May 28, 2019 $ 11.4 million $ 0.08 February 26, 2019 $ 7.1 million $ 0.05
Total payment as of December 31, 2019 $ 28.7 million $ 0.20
Note 8 – Accounts receivable and accrued revenues Accounts receivable and accrued revenues totaling $30.1 million as of December 31, 2020 consists of mainly accounts receivable with no material amounts overdue.
Note 9 – Deferred shipping revenues Deferred shipping revenues relates to charter hire payment paid in advance. As of December 31, 2020, $16.2 million was recognized as deferred shipping revenues in the condensed consolidated statement of financial position.
21
Note 10 - Financial risk management, objectives and policies Note 9 in the 2019 annual report on Form 20-F provides for details of financial risk management objectives and policies. The Company’s principal financial liability consists of long-term debt with the main purpose being to partly finance the Company’s assets and operations. The Company’s financial assets mainly comprise cash. The Company is exposed to market risk, credit risk and liquidity risk. The Company’s senior management oversees the management of these risks.
Note 11 – Subsequent events On January 21, 2021, the Company announced that it has entered into agreement to acquire two VLCCs built 2016 at DSME (Daewoo) for a total of $136 million. The vessels are scheduled to deliver during the first half of 2021. The Company will finance the acquisition with available liquidity and projected mortgage debt hence it is expected to be accretive to DHT’s earnings per share. The vessels were built to high specifications by their current owner and are fuel efficient, scrubber fitted Eco-designs that will further improve the DHT fleet’s efficiencies, amongst other its Annual Efficiency Ratio (AER) and Energy Efficiency Operational Index (EEOI) metrics. The Company has drawn $15 million under one of its revolving credit facilities funding the deposit for the two VLCCs. On February 5, 2021, the Board approved a dividend of $0.05 per common share related to the fourth quarter 2020 to be paid on February 25, 2021 for shareholders of record as of February 18, 2021.