Embed Size (px)
Citation preview
Diffractive Properties of Blue Morpho Butterfly Wings
Mary Lalak and Paul BrackmanDepartment of Physics and Astronomy,
University of Georgia, Athens, Georgia 30602
(Dated: October 24, 2014)
Many species of butterflies are known to produce beautiful iridescent colors when exposed tolight from different angles. These affects can be attributed to a few different optical phenomenacombined, the most prominent being reflective diffraction. Using common household items andwith a budget of 50 dollars, we attempt to confirm the theory that the collection of ridges on theindividual scales on the wing act as transmission gratings, as well as reflective. These results arequantified by the calculation of the ridge separation and comparing this distance to those observedby a scanning electron microscope photo.
I. INTRODUCTION
In studying the optical property of iridescence, threedistinct mechanisms must be discussed. Thin film inter-ference, structured coloring, and reflective diffraction allcontribute to the iridescent qualities of a surface. Thinfilm interference occurs when light strikes a film, someof it enters the film, and the rest is reflected off. Thelight transmitted through reflects off the bottom of thefilm and exits the film to interfere with the light thatoriginally reflected off the surface of the film. This inter-ference pattern causes a spectrum of color to be visiblefrom white light. Examples of thin film interference in-clude oil slicks and soap bubbles. Structural coloring oc-curs when the structure of the object itself (with variousreflective surfaces) produces an interference resulting invibrant colors. Examples of structural coloring includethe Marble berry and peacock feathers. Finally, irides-cence can be caused by diffraction gratings. When light isincident on a diffraction grating, it is reflected and trans-mitted into the spectrum. Diffractive iridescence is gen-erally due to the reflective effects. When using a strongenough laser, however, it is easier and more practical totreat the diffraction as transmission. The diffractive grat-ing spacing is the same in either case so for the purposesof this experiment the gratings will serve as transmissivediffraction gratings.
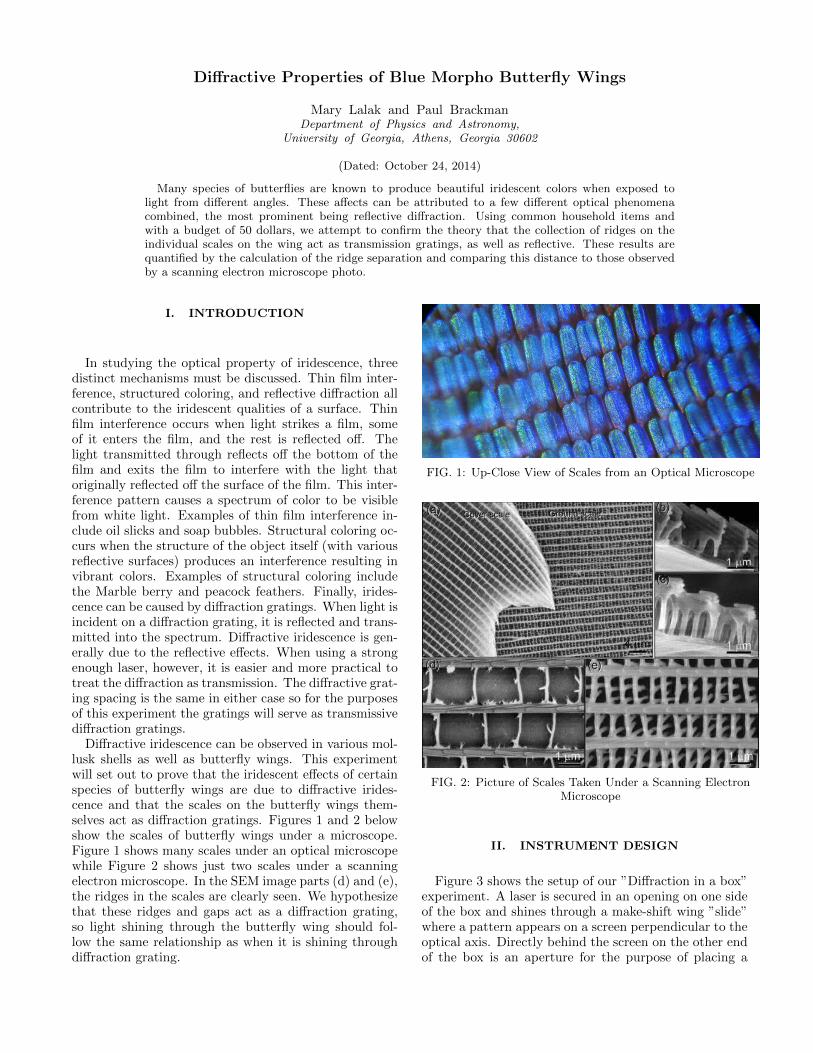
Diffractive iridescence can be observed in various mol-lusk shells as well as butterfly wings. This experimentwill set out to prove that the iridescent effects of certainspecies of butterfly wings are due to diffractive irides-cence and that the scales on the butterfly wings them-selves act as diffraction gratings. Figures 1 and 2 belowshow the scales of butterfly wings under a microscope.Figure 1 shows many scales under an optical microscopewhile Figure 2 shows just two scales under a scanningelectron microscope. In the SEM image parts (d) and (e),the ridges in the scales are clearly seen. We hypothesizethat these ridges and gaps act as a diffraction grating,so light shining through the butterfly wing should fol-low the same relationship as when it is shining throughdiffraction grating.
FIG. 1: Up-Close View of Scales from an Optical Microscope
FIG. 2: Picture of Scales Taken Under a Scanning ElectronMicroscope
II. INSTRUMENT DESIGN
Figure 3 shows the setup of our ”Diffraction in a box”experiment. A laser is secured in an opening on one sideof the box and shines through a make-shift wing ”slide”where a pattern appears on a screen perpendicular to theoptical axis. Directly behind the screen on the other endof the box is an aperture for the purpose of placing a

2
FIG. 3: ”Diffraction in a Box” Setup
smartphone in order to gather pictures of the pattern onthe screen. The box is closed during the process to allowas little light pollution as possible.
III. CALIBRATION
A. Dollar Store Laser
The wavelength of the laser is calibrated using adiffraction grating of known slit distance. The laseris shined through a diffraction grating onto a screen aknown distance away. The grating is made perpendicu-lar to the laser’s path by making sure the back reflectionlines up with the source location. A pattern appears onthe screen, and the distance between the central and firstmaximum is ascertained. The wavelength, λ, is then cal-culated by equation 1:
λ =d sin θ
n(1)
where d is the slit separation, θ is the angle between thecentral maximum and the first maximum on the screen,and n is the integer value assigned to each maximum,
which in our case was 1. θ = arctan(yZ
), where y is
the distance from the central maximum to the first max-imum, and Z is the distance from the grating to thescreen.
The grating used has a slit separation of approximately10−3mm. The calibrated wavelength came out to be632.80 ± .02nm, where the error was simply propagatedfrom the limitations of the measuring tape. The laser ismade to be perpendicular to the plane of the screen bymeasuring the height of the beam at the source end andthen drawing a dot at the same height on the screen sothat each time the experiment is performed, the laser islined up with that dot.
B. Screen Distance
In most diffraction experiments a CCD camera is usedso the light pattern is incident on the camera itself. Forthe purposes of this experiment (using a smartphonecamera) it was necessary to have the light incident ona screen and have the camera capture the image of thebleed through. This presented two challenges: First, thematerial of the screen greatly influenced the success orfailure of the experiment. A screen that is too thickwould not let enough light through to the camera. Ascreen that is too thin will propagate too much light inthe plane of the screen and cause an over-saturation inthe photo. Notebook paper, copy paper and even a nap-kin were used before the proper substance was found:the butterflies shipped in a unique paper that was per-fect for the screen’s needs. Secondly, since the camera istaking an image of the screen, the relationship betweenpixels on the camera and spacing on the screen needs tobe known. By marking sections of the screen in regular 1cm intervals and capturing an image of these markings,the number of pixels per cm was found to be 337.
IV. METHODS AND TROUBLESHOOTING
After the diffraction in a box system has been assem-bled, one member of the team must insert the laser beaminto the socket adaptor and actuate the button. At thispoint the beam should enter and be transmitted throughthe butterfly wing, and there should be a pattern on thescreen. Be sure to align the central maximum of thediffracted beam with the calibration dot on the screen.Remember this ensures that the laser beam is runningparallel to the bottom of the box. The other memberneeds to insert the camera or smartphone into the hol-ster and turn on the camera function. At this point,close the lid on the box (or turn off the lights in theroom if you have that luxury) and capture an image ofthe diffraction pattern. Once a suitable image has beencaptured it is necessary to process the image for satura-tion, exposure and possibly rotation. This can often bedone in the image gallery application; if the camera or
3
smartphone used does not have this capability, there arenumerous image processing programs for personal com-puters (GIMP, photoshop etc). Once the image has beensuitably processed, it is necessary to produce a histogramof this data in python and find the coordinates of the cen-tral maximum and the n=1 maxima.
Intensity of the laser was unsuitable for theBlue Morpho Helenor. The pattern can be observedwith the naked eye, but the camera was unable to captureit. In addition, the laser chosen for this experiment didnot have a toggle switch and as such had to be manuallyactuated and held until the desired image was captured.One method of correcting this issue was to permanentlydepress the actuation button with tape and simply un-screw the battery compartment in order to turn the laseroff. This method had potential, but screwing the batterycompartment back on resulted in a movement of the laserand the loss of many batteries. In order to reduce move-ment of the beam and find a better solution to the entireproblem, a socket adaptor was inserted into the side ofthe box to hold the laser steady through the experiment.
V. RESULTS AND ANALYSIS
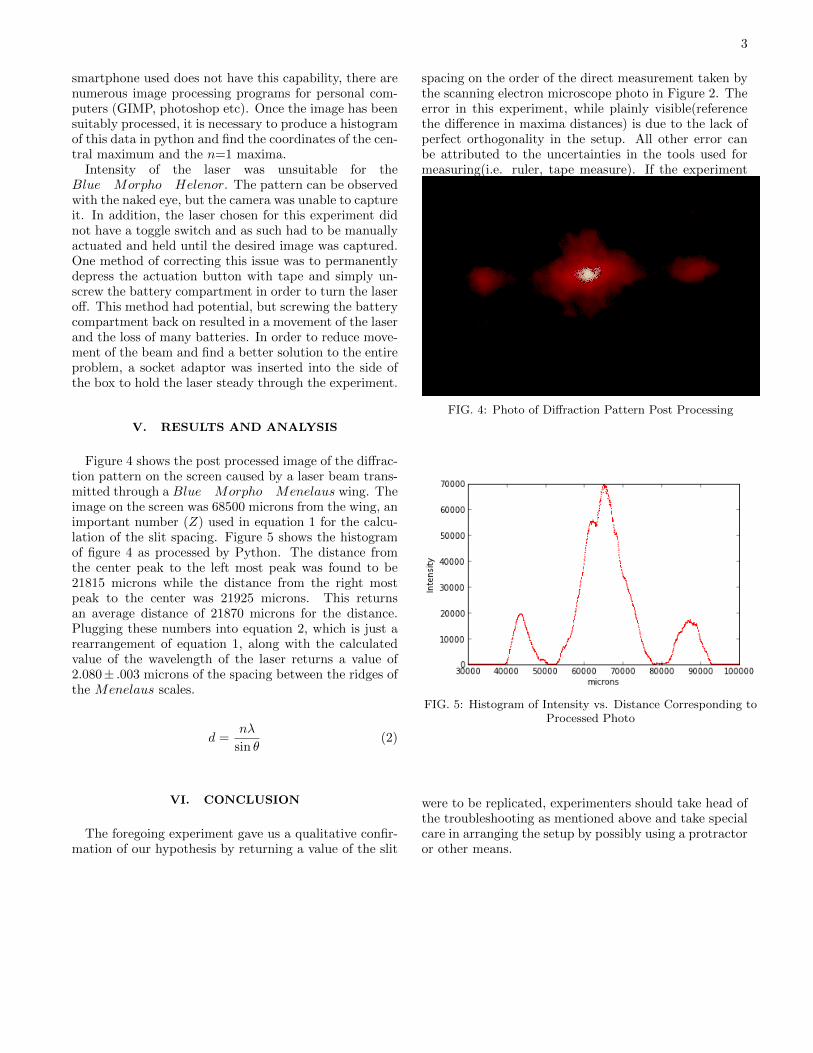
Figure 4 shows the post processed image of the diffrac-tion pattern on the screen caused by a laser beam trans-mitted through a Blue Morpho Menelaus wing. Theimage on the screen was 68500 microns from the wing, animportant number (Z) used in equation 1 for the calcu-lation of the slit spacing. Figure 5 shows the histogramof figure 4 as processed by Python. The distance fromthe center peak to the left most peak was found to be21815 microns while the distance from the right mostpeak to the center was 21925 microns. This returnsan average distance of 21870 microns for the distance.Plugging these numbers into equation 2, which is just arearrangement of equation 1, along with the calculatedvalue of the wavelength of the laser returns a value of2.080± .003 microns of the spacing between the ridges ofthe Menelaus scales.
d =nλ
sin θ(2)
VI. CONCLUSION
The foregoing experiment gave us a qualitative confir-mation of our hypothesis by returning a value of the slit
spacing on the order of the direct measurement taken bythe scanning electron microscope photo in Figure 2. Theerror in this experiment, while plainly visible(referencethe difference in maxima distances) is due to the lack ofperfect orthogonality in the setup. All other error canbe attributed to the uncertainties in the tools used formeasuring(i.e. ruler, tape measure). If the experiment
FIG. 4: Photo of Diffraction Pattern Post Processing
FIG. 5: Histogram of Intensity vs. Distance Corresponding toProcessed Photo
were to be replicated, experimenters should take head ofthe troubleshooting as mentioned above and take specialcare in arranging the setup by possibly using a protractoror other means.