Embed Size (px)
Citation preview
DIABETES IN NUNAVUT1997-2002
Department of Health and Social Services

I
DIABETES IN NUNAVUT 1997-2002
AUTHORS
Sylvia Healey, M.Sc.
Epidemiologist/Manager,
Health Information & Research
Nunavut Department of Health and Social Services
Abdul Qayyum
Health Information Specialist,
Health Information & Research
Nunavut Department of Health and Social Services
ACKNOWLEDGEMENTS
The Nunavut Department of Health would like to thank Health Canada for funding through the National Diabetes Surveillance
Project that made this surveillance initiative possible.
We would also like to acknowledge the training and advisory supports provided by:
Yang Mao, PhD.
Director, Surveillance and Risk Assessment Division
Centre for Chronic Disease Prevention and Control
Glenn Robbins
Manager, Chronic Disease Surveillance Section
Surveillance and Risk Assessment Division
Centre for Chronic Disease Prevention and Control
Cover page: Purple Saxifrage on Amadjuak Lake, Baffin Island (Courtesy Jack Hicks)

II
DIABETES IN NUNAVUT 1997-2002
III
DIABETES IN NUNAVUT 1997-2002

II
DIABETES IN NUNAVUT 1997-2002
III
DIABETES IN NUNAVUT 1997-2002
FOREWORD
Diabetes mellitus (DM) is a common chronic condition that can impose a heavy burden of illness and early mortality
on people who are affected and complications from this disease can drive a substantial portion of medical resource
utilization. In that context it becomes important to have accurate assessments on the prevalence of diabetes in the
population to assist policy-makers and public health professionals who develop strategies for managing this condition.
The most effective way to determine prevalence of DM is still debatable but Blanchard et al, from Manitoba showed
that health care administrative data can be used to estimate rates over time. The National Diabetes Surveillance
System (NDSS) has adopted this methodology and is the method used for determining the Nunavut estimates
reported here.
It appears that the prevalence rates of diabetes will most certainly continue to rise. That a large number of these
new cases are in a relatively younger group than the rest of Canada implies that the health burden will become
increasingly challenging to the Nunavut Health system. “Upstream” population based primary prevention programs
targeted particularly at those under 40, need to be aggressively implemented to ensure that the incidence does not
begin to increase.
W. Alexander (Sandy) Macdonald MA MD CCFP
Director of Medical Affairs
Department of Health and Social Services

IV
DIABETES IN NUNAVUT 1997-2002
V
DIABETES IN NUNAVUT 1997-2002
ACRONYMS
BMI Body Mass Index
CHN Community Health Nurse
CIHI Canadian Institute for Health Information
CTUMS Canadian Tobacco Use Monitoring Survey
DM Diabetes Mellitus
GDM Gestational Diabetes Mellitus
ICD-9 International Classification of Diseases, 9th revision
IDDM Insulin-Dependent Diabetes Mellitus
NDDM Non Insulin-Dependent Diabetes Mellitus
NDSS National Diabetes Surveillance System (Health Canada Program)
NPHS National Population Health Survey

IV
DIABETES IN NUNAVUT 1997-2002
V
DIABETES IN NUNAVUT 1997-2002
REPORT HIGHLIGHTS
• In year 2001-02, it is estimated that 1.72% of Nunavut population had Type 2 diabetes.
• Overall, the prevalence of diabetes in Nunavut was significantly higher in Non-Inuit (4.5%) than in Inuit (0.9%).
Prevalence rate for Non-Inuit was about the same as that for Canada in general (4.8%).
• The annual incidence rate of diabetes (0.29%) remained stable over the period of 1997-2002 and on the
average, 41 new diabetes cases were diagnosed each year in Nunavut.
• Overall, the occurrence of diabetes was relatively higher among males than females and this pattern was
observed for all age categories.
• In Nunavut, the average annual incidence rate of diabetes was significantly higher in Non-Inuit population
(0.78%) than the Inuit (0.14%).
• In 2001-2002, 65% of the Nunavummiut living with diabetes were between the age of 20 and 59 years which is
significantly different than the national level where only 15% of Canadians in those age groups have diabetes.
• Overweight, obesity and physical inactivity are considered risk factors for the development of the diabetes. In
2000, 30.7% of residents of Nunavut were overweight and 23% were obese. Nearly 50% of Nunavut residents
were physically inactive.
• Smoking, hypertension, and abnormal lipid metabolism are risk factors for the complications of diabetes. In
2003, over 65% Nunavummiut (age 15+ years) were smokers compared to 20% of Canadians. The proportion
of Nunavut residents diagnosed with high blood pressure was 4.2% compared to 11% of Canadians in general.
Incidence of diabetes in Nunavut has been relatively stable from 1998 to 2002

VI
DIABETES IN NUNAVUT 1997-2002
VII
DIABETES IN NUNAVUT 1997-2002

VI
DIABETES IN NUNAVUT 1997-2002
VII
DIABETES IN NUNAVUT 1997-2002
TABLE OF CONTENTS
Acknowledgements ................................................................................................................................I
Foreword ............................................................................................................................................ III
Acronyms ............................................................................................................................................IV
Report Highlights ..................................................................................................................................V
Introduction.......................................................................................................................................... 1
Type 1 Diabetes................................................................................................................................ 3
Type 2 Diabetes................................................................................................................................ 3
Gestational Diabetes ......................................................................................................................... 3
Differences between Type 1 and Type 2 Diabetes................................................................................ 3
Diagnosis of Diabetes........................................................................................................................ 4
Diabetes in Nunavut .............................................................................................................................. 5
Data Sources and processing ............................................................................................................. 5
Analysis: .......................................................................................................................................... 5
Case definition.................................................................................................................................. 5
Limitations of the Data:..................................................................................................................... 6
Incidence of Diabetes in Nunavut....................................................................................................... 6
Prevalence of Diabetes in Nunavut ..................................................................................................... 7
Prevalence by age and gender....................................................................................................... 8
Prevalence in Inuit and Non-Inuit .................................................................................................. 8
Prevalence by Community ........................................................................................................... 10
Risks for Acquiring Diabetes................................................................................................................. 11
Overweight .................................................................................................................................... 11
Physical Inactivity ........................................................................................................................... 11
Risks for Complications of Diabetes ...................................................................................................... 12
Smoking......................................................................................................................................... 12
Hypertension .................................................................................................................................. 12
Abnormal lipid metabolism .............................................................................................................. 13
Future Considerations.......................................................................................................................... 14
Notes ................................................................................................................................................. 15
References.......................................................................................................................................... 16

VIII
DIABETES IN NUNAVUT 1997-2002
1
DIABETES IN NUNAVUT 1997-2002
LIST OF FIGURES
Figure 1 Incidence of Diabetes (%) in Nunavut, Males & Females 1997-2002 6
Figure 2 Average Annual Incidence of Diabetes (%) by Age and Gender, in Nunavut, 1997-2002 7
Figure 3 Average Annual Incidence of Diabetes (%) for Inuit and Non-Inuit, Nunavut, 1997-2002 7
Figure 4 Prevalence of Diabetes (%) in Nunavut by Gender, 1997-2002 8
Figure 5 Percent Distribution of Diabetes in Nunavut by Age and Gender, 2001-2002 9
Figure 6 Prevalence of Diabetes (%) for Inuit and Non-Inuit, Nunavut, 2001-2002 9
Figure 7 Prevalence of Diabetes by Community of Residence in Nunavut, 2001-2002 10
Figure 8 Percent Obese in Canada and Nunavut 2000-2002 11
Figure 9 Physical Activity Levels in Nunavut 2000-2002 11
Figure 10 Percent of Smokers Age 15+ in Canada, 2003 12
Figure 11 Percent Distribution of Hypertension in Nunavut, 2001-2002 12
Figure 12 Percent Distribution of Disorders of Lipid Metabolism in Nunavut, 2001-2002 13
APPENDICES
Appendix A. Nunavut Population Statistics, Census 2001 (Population by age and gender) 17
Appendix B. Nunavut Population Statistics, Census 2001 (Population by Community of Residence) 17
Appendix C. International Classification of Diseases (ICD-9) codes for Diabetes Mellitus 17
Appendix D. Validation of Type 2 Diabetes Cases 18
Appendix E. The Flow of Data through various stages of NDSS 19

VIII
DIABETES IN NUNAVUT 1997-2002
1
DIABETES IN NUNAVUT 1997-2002
INTRODUCTION
This report provides an overview of Type 2 Diabetes in Nunavut for the period of 1997- 2002 as well as some
supplementary information on diabetes that may be of assistance to the population health program staff.
In the past various approaches, including sample surveys have been used in order to obtain population-based
estimates of the incidence and prevalence of diabetes. For this report, we have used comprehensive administrative
health data to create a population-based database of cases of clinically diagnosed diabetes. There are limitations to
this approach as these data rely on the diagnostic reporting of many physicians and community health nurses and
clinical precision cannot be assured. It is possible that different diagnostic criteria are being used across the territory.
We are quite confident that the diabetes cases reflected in this database are Type 2 diabetes based on some
validation exercises done on the data for years 1995 to 2000. Very few cases have been reported in those who are
under 20 years old and although those were confirmed as Type 2, all under 20-year olds were excluded to conform to
comparable reporting within the NDSS.
In Nunavut, 70%1 of primary care is provided by Community Health Nurses and they code differently for gestational
and juvenile diabetes, however the practice may not have been consistent. Validation was possible because
information on pregnancy is reported at the same time community health reporting. The validation process is
described in Appendix D. No cases of juvenile diabetes were identified in this database. We have also taken into
consideration the likelihood of our overestimation of incidence in the earlier years of the study and have excluded the
first two years when reporting incidence rates.
1Based on physician and Community submissions over seven years
Nunavut
Iqaluit

2
DIABETES IN NUNAVUT 1997-2002
3
DIABETES IN NUNAVUT 1997-2002
2
DIABETES IN NUNAVUT 1997-2002
3
DIABETES IN NUNAVUT 1997-2002
DIABETES
Diabetes mellitus is a chronic disease that results if the body insufficiently produces and/or improperly uses insulin.
Without enough insulin, the cells of the body cannot absorb sufficient glucose from the blood so blood glucose levels
increase. If the glucose level in the blood remains high over a long period of time, this can result in long-term damage
to organs, such as the kidneys, eyes, nerves, heart and blood vessels. Complications in these organs can lead to
death.Diabetes mellitus occurs as several types: Type 1, Type 2 and gestational diabetes.
TYPE 1 DIABETES
Type 1diabetes, also known as insulin-dependent diabetes mellitus (IDDM), typically occurs in childhood or early
adolescence. In Type 1 diabetes, the immune system attacks the insulin-producing cells in the pancreas and destroys
them. As a result, the pancreas then produces little or no insulin. Type 1diabetes is believed to be caused by a
combination of genetic factors and environmental stressors.1
TYPE 2 DIABETES
Type 2 diabetes, also known as non insulin-dependent diabetes mellitus (NIDDM), is the most common form of
diabetes that accounts for more than 90% of diagnosed diabetes and almost all undiagnosed diabetes.1 Type
2 diabetes typically occurs after the age of 40 years and is found in a higher proportion of individuals who are
considered overweight. Individuals with Type 2 diabetes are usually insulin resistant.
GESTATIONAL DIABETES
Gestational diabetes mellitus (GDM) occurs in some women during pregnancy. These women develop glucose
intolerance that can be treated with diet and/or insulin. In most cases, it ends after birth.
DIFFERENCES BETWEEN TYPE 1 AND TYPE 2 DIABETES
Patient symptoms and Family history are more often used in differentiating the two types.
• Type 1 diabetes is most often diagnosed in children with a peak incidence during the pre-adolescence. Type 2
diabetes is more common in people over age 40, but it can occur at any age. There is an increase in this form of
the disease among overweight youth.
• Untreated Type 1 diabetes is usually accompanied by weight loss, but with Type 2 diabetes there is more likely to
be weight gain.
• Patients with Type 1 diabetes are insulin dependent, i.e. they will die without the hormone replacement, whereas
those with Type 2 diabetes may require insulin to control the blood sugar but will not die in the short term
without it, although they will develop the long-term complications that could ultimately be fatal.

4
DIABETES IN NUNAVUT 1997-2002
5
DIABETES IN NUNAVUT 1997-2002
DIAGNOSIS OF DIABETES
In 1997, the new criteria for diagnosis and classification terminology were developed.3 All diabetes is diagnosed by
one of three criteria:
• symptoms of diabetes (fatigue, excessive thirst, excessive urination and unexplained weight loss) plus a casual
(any time during the day) plasma glucose value of > 11.1 mmol/L, OR
• a fasting (no caloric intake for at least 8 hours) plasma glucose test (FPG) of > 7.0 mmol/L. (In 1998, the
criterion was lowered from 7.8 to 7.0; this likely resulted in an increase in the number of individuals with a
diagnosis of the disease), OR
• A plasma glucose value in the 2-hour sample (2hPG) of the oral glucose tolerance test (OGTT) > 11.1 mmol/L.
These criteria are now included in the 2003 Clinical Practice guidelines.2 Note that these same guidelines preclude the
use of glycosylated haemoglobin (A1C) in the diagnosis of diabetes due to the lack of standardization of the test.

4
DIABETES IN NUNAVUT 1997-2002
5
DIABETES IN NUNAVUT 1997-2002
DIABETES IN NUNAVUT
DATA SOURCES AND PROCESSING
This data primarily reflects Type 2 diabetes in Nunavut. Small samples in the pre-2000 years were reviewed as part of
a validation exercise (Appendix D), to eliminate cases that were not Type 2. However, we cannot absolutely rule out
that some cases of Type 1 or gestational diabetes were coded as Type 2.
Data on diabetes cases was obtained from the following four data sources:
1) Community Health Reporting Database. This is information on all patients seen in Community Health Centres
by a nurse. In 24 out of 25 communities, there are no resident physicians and patients are seen by a Nurse
Practitioner or Community Health Nurse.
2) Hospital database, which identifies all hospital billings for Nunavut residents
3) Physician database, which identifies physician billing for Nunavut residents.
4) Registration database that contains a listing of all insured persons within the territory, thus enabling the
identification of all Nunavummiut.
ANALYSIS:
The analysis was performed as part of the National Diabetes Surveillance System (NDSS) and is primarily descriptive
(see Appendix E for an overview and data processing flow). NDSS is an experimental model that attempts to compile
a complete provincial/territorial profile of selected health indicators (in this case diabetes) using administrative
databases. It aims to provide baseline data on rates of new and prevalent cases of diabetes. ICD-9 codes used for
diabetes are provided in Appendix C.
CASE DEFINITION:
Individuals in the administrative database were defined as having clinically diagnosed diabetes if they had at least
two separate physician or nurse practitioner claims for diabetes within two years of each other or at least one hospital
separation record with a diagnosis of diabetes. NDSS uses the methodology initially developed by Blanchard et al.
1996.15

6
DIABETES IN NUNAVUT 1997-2002
7
DIABETES IN NUNAVUT 1997-2002
LIMITATIONS OF THE DATA:
Data is derived from administrative databases and depends on diabetes cases being recognized and diagnosed. The
primary health care provider reports the actual diagnosis but the criteria for the assignment of a diabetes diagnosis
may not be standard throughout the territo
INCIDENCE OF DIABETES IN NUNAVUT
Information on Diabetes cases has been collected in the
NDSS system since 1995 and the information for the
first two years (1995 and 1996) was excluded because
it was not possible to distinguish between prevalent and
new cases in those starts up years.
Incidence rate of diabetes is the number of newly
diagnosed cases per population at risk for the disease
during a specific period. It is the rate at which new
events occur in a population and is a measure of the
disease propagation. Appendix A and B contain the
census 2001 population used as denominator.
The average annual incidence of Diabetes in Nunavut
(1997 to 2002) was 0.29%.
The incidence of diabetes can be considered to be
relatively stable from 1998 to 2002 (Figure 1) and any
upward trend was not statistically significant (p=0.72).
This is not unexpected in Nunavut since easy local access
to “junk foods” and changes in eating behaviours are a
relatively recent event (within the past ten years).
The average annual incidence of Diabetes in Nunavut (1997 to 2002) was 0.29%.
0.45
0.40
0.35
0.30
0.25
0.20
0.15
0.10
0.45
0.00
Year
* % of gender specific population.
Diabetes cases under 20 years old were excluded.
Figure 1. Incidence of Diabetes (%) in Nunavut, Males & Females 1997-2002
MalesFemalesBoth
1997 1998 1999 2000 2001 2002
Perc
ent*

6
DIABETES IN NUNAVUT 1997-2002
7
DIABETES IN NUNAVUT 1997-2002
Figure 2 shows the average number of new cases in the
six-year period. Most of the new cases of diabetes in
Nunavut are under 60. After age 40 there are
significantly more males than females getting diabetes.
In Nunavut, the average annual incidence rate (Figure
3) differs significantly between Inuit and non-Inuit
with higher rates in the Non-Inuit. Also of note is the
difference by gender in the Non-Inuit population, with
more males getting diabetes than females.
Incidence of diabetes was higher in Non-Inuit population (0.78%) than Inuit (0.14%)
*% of age and gender-specific population.
Diabetes cases under 20 years old were excluded.
Figure 2. Average Annual Incidence of Diabetes (%) by Age and Gender in Nunavut, 1997-2002
0.00
0.20
0.40
0.60
0.80
1.00
1.20
Females 0.06 0.14 0.33 0.46 0.70
Males 0.08 0.12 0.48 0.98 0.81
Age 20-29 Age 30-39 Age 40-49 Age 50-59 Age 60+
Perc
ent*
0.00
0.20
0.40
0.60
0.80
1.00
1.20
1.40
Females 0.16 0.50
Males 0.12 1.17
Inuit Non_Inuit
Figure 3. Average Annual Incidence of Diabetes (%) for Inuit and Non-Inuit, Nunavut, 1997-2002
* % of ethnic and gender-specific population.
Diabetes cases under 20 years old were excluded.
Perc
ent*

8
DIABETES IN NUNAVUT 1997-2002
9
DIABETES IN NUNAVUT 1997-2002
PREVALENCE OF DIABETES IN NUNAVUT
Prevalence of diabetes is the number of individuals
in the population with the disease at a specific point in
time. Prevalence gives an idea of the burden of disease
at a given time and is widely used in public health
monitoring and planning.
The prevalence of diabetes in Nunavut during the fiscal
year 2001-02 was 1.72%.
The annual period prevalence was calculated by adding
all new incident cases occurring in one year to all the
incident cases from previous years, excluding those who
died or moved out of the Territory prior to the beginning
of the year.
The prevalence of diabetes (Figure 4) will increase
every year, as long as the number of incident cases of
diabetes keep increasing with a very few number of
deaths due to diabetes.
Figure 4. Prevalence of Diabetes (%) in Nunavut by Gender, 1997-2002
* % of gender-specific population.
Diabetes cases under 20 years old were excluded.
0.00
0.50
1.00
1.50
2.00
2.50
Year
Perc
ent*
Males
Females
1997 1998 1999 2000 2001 2002
The prevalence of diabetes in Nunavut during the fiscal year 2001-02 was 1.72%.

8
DIABETES IN NUNAVUT 1997-2002
9
DIABETES IN NUNAVUT 1997-2002
PREVALENCE BY AGE AND GENDER
We have examined the prevalent cases of diabetes in
the last fiscal year of the study 2001-2002. Figure 5
shows the prevalence in the 2001-02 fiscal year by age
and gender. The age distribution of the cases in Nunavut
is interesting because a very large proportion, 49%,
of the cases are under 60 whereas NDSS reported the
majority 83% of Diabetes cases in the general Canadian
population to be over 60 years old.1
PREVALENCE IN INUIT AND NON-INUIT
Figure 6 shows that in the Inuit most of the cases are
female. Although different from Canadians in general
(where the majority of the cases are male), this is similar
to that reported for other first nations.4
More Inuit females have diabetes than Inuit males
Figure 5. Percent Distribution of Diabetes in Nunavut by Age and Gender, 2001-2002 (Cases=244)
0.00
2.00
6.00
8.00
10.00
Females
Males
Both
0.23
0.27
0.25
Age 20-29
1.00
0.64
0.83
Age 30-39
1.07
2.03
1.53
Age 40-49
2.96
5.49
4.14
Age 50-59
5.22
9.51
7.09
Age 60+
4.00Perc
ent*
*% of age and gender-specific population.Diabetes cases under 20 years old were excluded.
Females 0.99 2.68
Males 0.78 6.93
Inuit Non_Inuit
Figure 6. Prevalence of Diabetes (%) for Inuit and Non-Inuit, Nunavut, 2001-2002
* % of ethnic and gender-specific population.
Diabetes cases under 20 years old were excluded.
Perc
ent*
0.00
1.00
2.00
3.00
4.00
5.00
6.00
7.00
8.00
83% of Canadians with diabetes are over 60 years old, in Nunavut, 49% are under 60 years old.
More Inuit females have diabetes than Inuit males

10
DIABETES IN NUNAVUT 1997-2002
11
DIABETES IN NUNAVUT 1997-2002
Overall, the prevalence of diabetes in Nunavut is
significantly higher in non-Inuit (4.5%) than in Inuit
(0.9%). Prevalence rates for the non-Inuit in Nunavut
are similar to those reported by the NDSS for Canadians
in general. (4.8%) 1 , but the rates in Inuit are lower.
PREVALENCE BY COMMUNITY
Figure 7 shows the distribution of diabetes cases in
Nunavut by community. The rates are shown as a
percent of the respective community population that is
over 20. The 95% confidence interval (CI) bar shows
the range within which the true value will fall 95% of
the time. When comparing rates between communities,
if the CI bars overlap, then the difference between the
two rates is not considered to be statistically significant.
Prevalence of diabetes in Nunavut is higher in non-Inuit (4.5%) than in Inuit (0.9%)
Figure 7. Prevalence of Diabetes by Community of Residence in Nunavut, 2001-2002
-1.00 0.00 1.00 2.00 3.00 4.00 5.00 6.00
% of Community population over 20
95% confidence interval ( )
39 cases had no identified community of residence
ARVIAT
QIKIQTARJUAQ
POND INLET
IGLOOLIK
CLYDE RIVER
WHALE COVE
HALL BEACH
PANGNIRTUNG
GJOA HAVEN
TALOYOAK
BAKER LAKE
KUGLUKTUK
KUGAARUK
CAPE DORSET
IQALUIT
CAMBRIDGE BAY
SANIKILUAQ
ARCTIC BAY
CORAL HARBOUR
CHESTERFIELD INLET
RESOLUTE BAY
KIMMIRUT
RANKIN INLET
REPULSE BAY
10
DIABETES IN NUNAVUT 1997-2002
11
DIABETES IN NUNAVUT 1997-2002
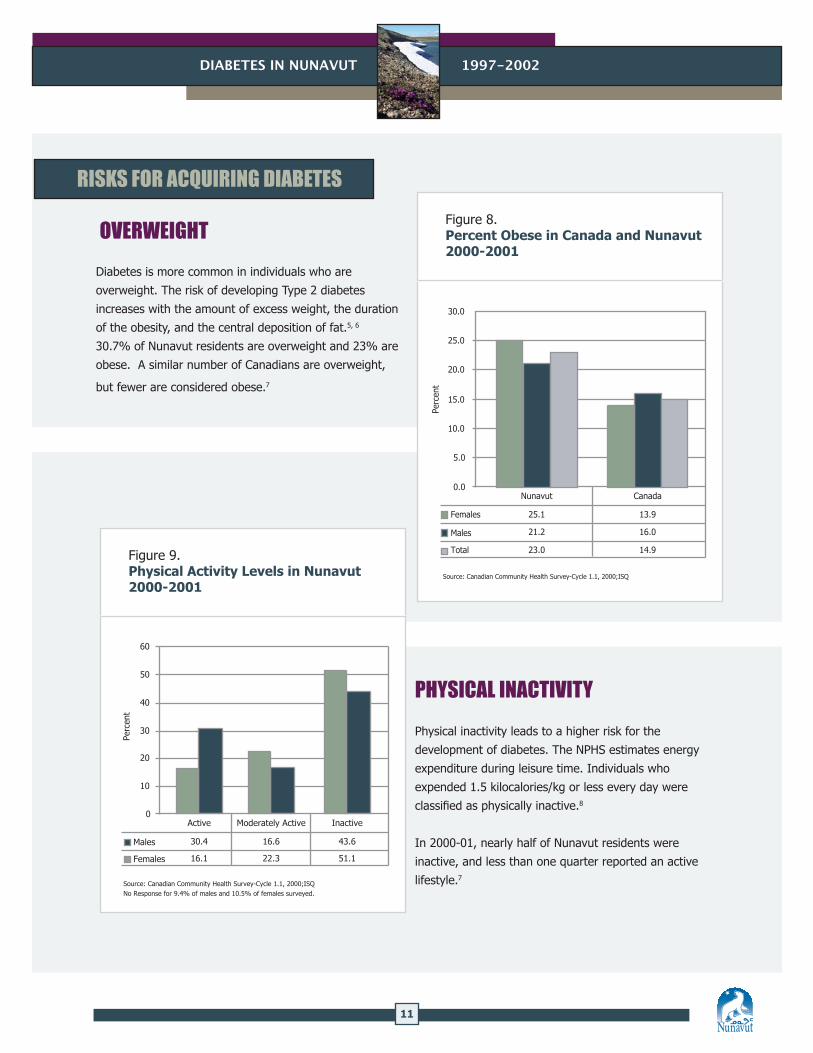
RISKS FOR ACQUIRING DIABETES OVERWEIGHT
Diabetes is more common in individuals who are
overweight. The risk of developing Type 2 diabetes
increases with the amount of excess weight, the duration
of the obesity, and the central deposition of fat.5, 6
30.7% of Nunavut residents are overweight and 23% are
obese. A similar number of Canadians are overweight,
but fewer are considered obese.7
PHYSICAL INACTIVITY
Physical inactivity leads to a higher risk for the
development of diabetes. The NPHS estimates energy
expenditure during leisure time. Individuals who
expended 1.5 kilocalories/kg or less every day were
classified as physically inactive.8
In 2000-01, nearly half of Nunavut residents were
inactive, and less than one quarter reported an active
lifestyle.7
Figure 8. Percent Obese in Canada and Nunavut 2000-2001
0.0
5.0
10.0
15.0
20.0
25.0
30.0
Perc
ent
Males 21.2 16.0
Females 25.1 13.9
Nunavut Canada
Source: Canadian Community Health Survey-Cycle 1.1, 2000;ISQ
Total 23.0 14.9Figure 9. Physical Activity Levels in Nunavut 2000-2001
Source: Canadian Community Health Survey-Cycle 1.1, 2000;ISQNo Response for 9.4% of males and 10.5% of females surveyed.
0
10
20
30
40
50
60
Males
Females
30.4
16.1
Active
16.6
22.3
Moderately Active
43.6
51.1
Inactive
Perc
ent

12
DIABETES IN NUNAVUT 1997-2002
13
DIABETES IN NUNAVUT 1997-2002
RISKS FOR COMPLICATIONS OF DIABETES
Diabetes has many complications for which there are
a number of risk factors, such as cigarette smoking,
abnormal lipid levels, and high blood pressure.9
SMOKING
Cigarette smoking is a risk factor for the complications
of diabetes. Nunavut has the highest rate of smoking in
Canada. According to June 2003 survey conducted by the
Canadian Council for Tobacco Control (Figure 10), 65%
of Nunavut population (age 15+) smoked daily compared
to 20% of Canadians.
HYPERTENSION
Overall, the prevalence of Hypertension (see note 1) in
Nunavut was 4.2% which is lower than the national rate
(11%) reported in 1998/99.10
17
2320
2219
24 2225
23
65
53
22
0
10
20
30
40
50
60
70
Perc
ent*
P.E.
I.
Nun
avut
N.W
.T.
Britis
h Col
umbi
a
Alb
erta
Sask
atch
ewan
Man
itoba
Ont
ario
Que
bec
New
Bru
nsw
ick
New
foun
dlan
d
Nov
a Sc
otia
Figure 10. Percent of Smokers Age 15+ in Canada, 2003
* Data was collected for individuals 18-49 years old in NWT and no data was reported for Yukon.
Source: Canadian Council for Tobacco Control, National Survey on Tobacco Control, June 2003.
* % of ethnic-specific population. 95% confidence interval ( ).
Inuit
Non_Inuit
All
8.0
9.0
7.0
6.0
5.0
4.0
3.0
2.0
1.0
0.0Hypertension
3.5
7.5
4.2
Figure 11. Percent Distribution of Hypertension in Nunavut, 2001-2002
Perc
ent*
Hypertension rates are lower in Nunavut that the rest of Canada

12
DIABETES IN NUNAVUT 1997-2002
13
DIABETES IN NUNAVUT 1997-2002
ABNORMAL LIPID METABOLISM
Disorders of lipid metabolism (see note 2) are less
common in Inuit than non-Inuit in Nunavut. Control
of these risk factors for diabetes complications forms
an essential part of a comprehensive diabetes control
program. Since high blood pressure is associated with
obesity and physical inactivity, maintaining a healthy
weight and remaining physically active will also protect
against the complications of diabetes.11, 12
* % of ethnic-specific population. 95% confidence interval ( ).
Inuit
Non_Inuit
All
Lipid
0.29
1.15
0.42
Figure 12. Percent Distribution of Disorders of Lipid Metabolism in Nunavut, 2001-2002
0.00
0.20
0.40
0.60
0.80
1.00
1.20
1.40
1.60
Perc
ent*
14
DIABETES IN NUNAVUT 1997-2002
15
DIABETES IN NUNAVUT 1997-2002
FUTURE CONSIDERATIONS
This report describes the prevalence of Diabetes in Nunavut. The database is created from recorded visits to a health
facility between 1995 and 2002. The limitation of this method is that the number of cases may be underestimated
because it is dependant on diagnosis. The American Diabetes Association reported that 29%13 of all diabetes cases
tend to be undiagnosed and it would be helpful to assess to what extent DM is undiagnosed in Nunavut.
These results are suggestive of a number of future research priorities. The low prevalence of DM in this remote
northern territory suggests that some protective factor exists. Research is required to determine whether this is due
to greater adherence to traditional lifestyle practices such as hunting, fishing and consumption of raw wild game, or
genetic factors.
There is a need to establish population-specific norms for measures like BMI and health officials could use this
information to identify future screening needs for all age groups, especially with reports of obesity among children.
It is important to establish a process to monitor the quality and delivery of care practices for diabetes patients in
Nunavut. Programs that monitor control of blood sugar and high blood pressure in diabetics can support prevention
of complications in diabetics.

14
DIABETES IN NUNAVUT 1997-2002
15
DIABETES IN NUNAVUT 1997-2002
NOTES:
1. Case definition for hypertension used:
If a record had at least 1 of the ICD-9 codes in the range of 401 and 405.9 during
the fiscal year April 1st 2001 through March 31st 2002.
2. Case definition for disorders of lipid metabolism used:
If a record had at least 1 of the ICD-9 codes in the range of 272 and 272.8 during
the fiscal year April 1st 2001 through March 31st 2002.

16
DIABETES IN NUNAVUT 1997-2002
17
DIABETES IN NUNAVUT 1997-2002
REFERENCES
1. Health Canada, Center for Chronic Disease Prevention and Control, Population and Public Health Branch. Diabetes
in Canada. Second Edition (Page 19-26), 2002.
2. Canadian Diabetes Association, Clinical Practice Guidelines Expert Committee. Definition, Classification and
Diagnosis of Diabetes and Other Dysglycemic Categories. Canadian Journal of Diabetes 2003; 27(2:Suppl): S7-S9.
3. Meltzer S, Leiter L, Daneman D, Gerstein H, Lau D, Ludwig S et al. 1998 clinical practice guideline for the
management of diabetes in Canada. Can Med Assoc J 1998; 39(8:Suppl):S6.
4. Green C, Blanchard JF, Young TK, Griggith J. The Epidemiology of diabetes in the Manitoba-Registered First Nation
Population, Diabetes Care 2003: 26:1993-1998.
5. Ford ES, Williamson DF, Liu S. Weight change and diabetes incidence: findings from a national cohort of US adults.
Am J Epidemiol 1997; 146:214-22.
6. Resnick H, Valsania P, Halter J, Lin X. Relation of weight gain and weight loss on subsequent diabetes risk in
overweight adults. J Epidemiol Community Health
2000 : 54: 596-602.
7. Nunavut Health and Social Services. Report on Comparable Health Indicators for Nunavut and Canada, September
2002.
8. Statistics Canada: National Population Health Survey, 1998/99.
9. Adler AI, Stratton IM, Neil HA, Yudkin JS, Matthews DR, Cull CA et al. Association of systolic blood pressure with
macrovascular and microvascular complications of type 2 diabetes (UKPDS 36): prospective observational study.
British Medical Journal 321(7258):412-9, 2000.
10. Statistics Canada. Health Indicators. Available from URL: www.statcan.ca/english/freepub/82-221-XIE/free.htm.
11. Wei M, Gibbson LW, Kampert JB, et al. Low cardiorespiratory fitness and physical inactivity as predictors of
mortality in men with type 2 diabetes. Ann Intern Med. 2000; 132:605-611.
12. Hu FB, Stampfer MJ, Solomon C, et al. Physical activity an risk for cardiovascular events in diabetic women. Ann
Intern Med. 2001; 134:96-105.
13. Center for Disease Control and Prevention: National Diabetes fact sheet: general information and national
estimates on diabetes in the United States, 2002. Atlanta, GA: U.S. Department of Health and Human Services,
Center for Disease Control and Prevention, 2003.
14. Health Canada. Canadian tobacco use monitoring survey wave 1,
February – June 2003. Available from URL: www.hc-sc.gc.ca.
15. Blanchard JF, Ludwig S, Wajda A, Dean H, Anderson K, Kendall O, et al. Incidence and prevalence of diabetes in
Manitoba, 1986-1991. Diabetes Care 1996: 19:807-11.
16. Health Canada. Responding to the challenge of diabetes in Canada, First report of the National Diabetes
Surveillance System (NDSS), 2003 (Catalogue no. H39-4/21-2003E).
16
DIABETES IN NUNAVUT 1997-2002
17
DIABETES IN NUNAVUT 1997-2002
APPENDIX A APPENDIX B
APPENDIX C
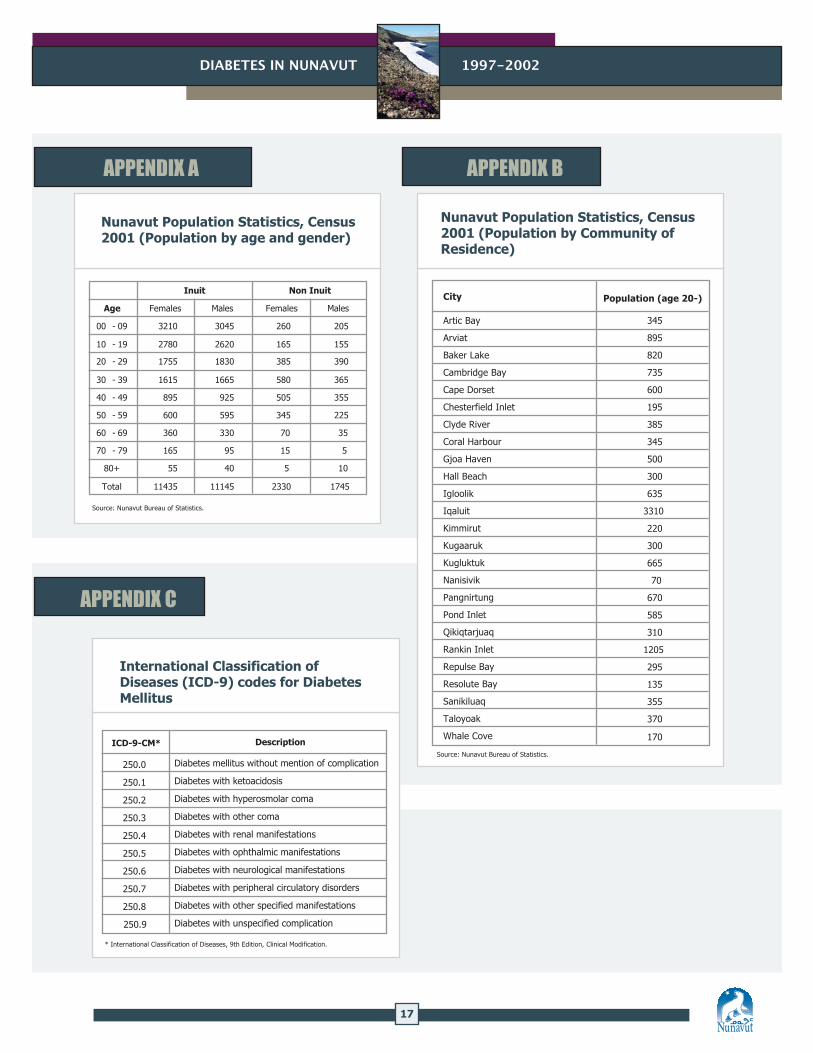
Nunavut Population Statistics, Census 2001 (Population by age and gender)
Inuit
Non Inuit
Age Females Males Females Males
00 - 09 3210 3045 260 205
10 - 19 2780 2620 165 155
20 - 29 1755 1830 385 390
30 - 39 1615 1665 580 365
40 - 49 895 925 505 355
50 - 59 600 595 345 225
60 - 69 360 330 70 35
70 - 79 165 95 15 5
80+ 55 40 5 10
Total 11435 11145 2330 1745
Source: Nunavut Bureau of Statistics.
Nunavut Population Statistics, Census 2001 (Population by Community of Residence)
Source: Nunavut Bureau of Statistics.
345
895
820
735
600
195
385
345
500
300
635
3310
220
300
665
70
670
585
310
1205
295
135
355
370
170
Population (age 20-)City
Artic Bay
Arviat
Baker Lake
Cambridge Bay
Cape Dorset
Chesterfield Inlet
Clyde River
Coral Harbour
Gjoa Haven
Hall Beach
Igloolik
Iqaluit
Kimmirut
Kugaaruk
Kugluktuk
Nanisivik
Pangnirtung
Pond Inlet
Qikiqtarjuaq
Rankin Inlet
Repulse Bay
Resolute Bay
Sanikiluaq
Taloyoak
Whale Cove
International Classification of Diseases (ICD-9) codes for Diabetes Mellitus
DescriptionICD-9-CM*
* International Classification of Diseases, 9th Edition, Clinical Modification.
Diabetes mellitus without mention of complication
Diabetes with ketoacidosis
Diabetes with hyperosmolar coma
Diabetes with other coma
Diabetes with renal manifestations
Diabetes with ophthalmic manifestations
Diabetes with neurological manifestations
Diabetes with peripheral circulatory disorders
Diabetes with other specified manifestations
Diabetes with unspecified complication
250.0
250.1
250.2
250.3
250.4
250.5
250.6
250.7
250.8
250.9
18
DIABETES IN NUNAVUT 1997-2002
19
DIABETES IN NUNAVUT 1997-2002
APPENDIX D
VALIDATION OF TYPE 2 DIABETES CASES
All records with ICD-9 code of 250 (Type 2 diabetes) for fiscal year 1995-96 to 1998-99 were crossed checked against
the community health records for the public health codes (P01.01 to P01.08) for pregnancy. These would represent
the Gestational Diabetes Mellitus (GDM) mistakenly coded as Type 2 diabetes. Note: The community health records
represent 82% of people seen and does not include those who saw a physician as first line of care.
Results:
No cases of Type 2 diabetes in the database were identified as being pregnant at the same time.
A separate analysis of the community health database did show some cases of GMD correctly coded as 648.0.
APPENDIX E
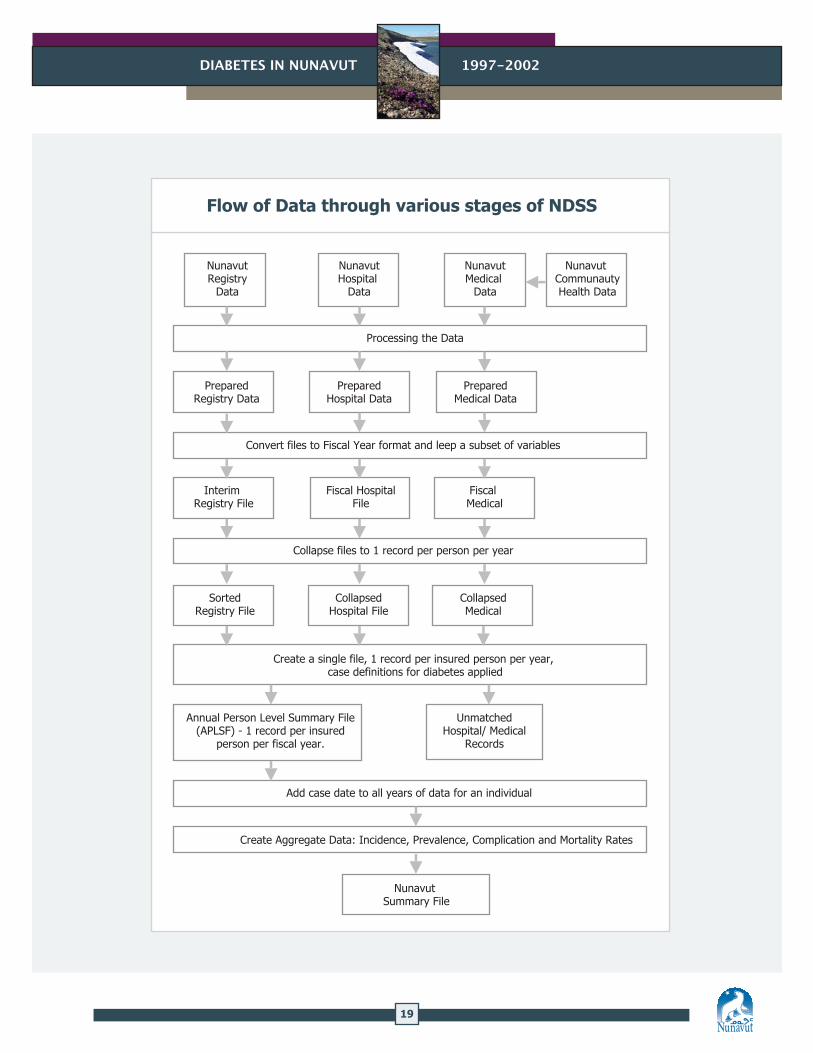
AN OVERVIEW OF THE NATIONAL DIABETES SURVEILLANCE SYSTEM AND DATA PROCESSING AT PROVINCIAL/TERRITORIAL LEVEL
The National Diabetes Surveillance System (NDSS) is an initiative of the Chronic Disease Surveillance Unit of Health
Canada. The major goal of NDSS is to provide a nationally standardized database on diabetes across national/regional
levels in support of public health activities.16 The system derives information relating to diabetes by using existing
provincial/territorial administrative databases. The flow of data processing is illustrated on the following page.
18
DIABETES IN NUNAVUT 1997-2002
19
DIABETES IN NUNAVUT 1997-2002
Flow of Data through various stages of NDSS
Nunavut Registry
Data
PreparedRegistry Data
Interim Registry File
SortedRegistry File
Collapsed Hospital File
Collapsed Medical
Fiscal Hospital File
Fiscal Medical
PreparedHospital Data
PreparedMedical Data
Nunavut Hospital
Data
Nunavut Medical
Data
Nunavut CommunautyHealth Data
Processing the Data
Convert files to Fiscal Year format and leep a subset of variables
Collapse files to 1 record per person per year
Create a single file, 1 record per insured person per year, case definitions for diabetes applied
Annual Person Level Summary File (APLSF) - 1 record per insured
person per fiscal year.
Unmatched Hospital/ Medical
Records
Add case date to all years of data for an individual
Create Aggregate Data: Incidence, Prevalence, Complication and Mortality Rates
Nunavut Summary File