Embed Size (px)
Citation preview

2016 SURVEY REPORT
Diabetes MILES-2

2 Diabetes MILES-2
Suggested citation: Ventura AD, Browne JL, Holmes-Truscott E, Hendrieckx C, Pouwer F, Speight J (2016). Diabetes MILES-2 2016 Survey Report. Diabetes Victoria, Melbourne.
ISBN 978-0-9873835-7-0
© The Australian Centre for Behavioural Research in Diabetes, 2016.
For permission to copy or reproduce any part of the report, contact the ACBRD on (03) 8648 1844
32016 Survey Report
Acknowledgements
The Diabetes MILES (Management and Impact for Long-term Empowerment and Success) Study is an international collaborative established in 2011. It is led jointly by Professor Jane Speight, Foundation Director of The Australian Centre for Behavioural Research in Diabetes (ACBRD; a partnership between Diabetes Victoria and Deakin University), and Professor Frans Pouwer, of the Center of Research on Psychological and Somatic disorders (CoRPS), Tilburg University, The Netherlands.
Information about the Diabetes MILES Study international collaborative is available at www.diabetesMILES.org.
This report details the second Diabetes MILES – Australia survey (MILES-2), conducted in 2015 by the ACBRD. Diabetes MILES-2 was primarily supported and resourced by core funding provided to the ACBRD by Diabetes Victoria and Deakin University. Recruitment and data collection were supported partially by a Diabetes Australia Research Program grant. Additional support (recruitment activities and the development of the study website) was provided by Sanofi ANZ in the form of an unrestricted educational grant. None of the funding organisations were involved in the study design, data collection, or data analysis, and had no input on the preparation of this report.
The authors thank all the study participants for volunteering their time, insights and experiences. They also thank Ms Shaira Baptista for her assistance in the set-up of the online survey and associated website, and Dr Steven Trawley for technical assistance with the online survey platform and website hosting platform. The authors also thank Dr Kylie Mosely, Dr Giesje Nefs, Ms Jennifer Halliday and Dr Steven Trawley for their advice on survey content.
Acknowledgements
4 Diabetes MILES-2
Diabetes is not just a metabolic condition affecting the body’s ability to convert glucose to energy. It is not just a condition that places people at risk of serious long-term physical complications. It is also a condition that places a high self-care and emotional burden on the person living with diabetes and, often, on their family members.
In 2011, the Diabetes MILES – Australia Survey Report summarised Australia’s first large-scale national survey focused on what it is like to live with and manage diabetes. Conducted by The Australian Centre for Behavioural Research in Diabetes, the survey established the unmet psychosocial needs of adults with type 1 or type 2 diabetes that had, until then, gone largely under the radar. The survey also highlighted the need for the National Diabetes Services Scheme to make mental health a priority area. This led to a four-year program of work, funded by the Australian Government, to develop resources (launched in 2016) to support people with diabetes and to enable and upskill health professionals to provide greater psychological care.
In 2015, a second large-scale, national survey of over 2,300 adults with diabetes was conducted to examine whether the same concerns as those identified in 2011 remained, and to explore emerging issues in the psychological, social and behavioural aspects of diabetes. The fact that so much of the emotional burden remains as significant as it was four years ago is a sobering reminder that we all need to do more to understand and support people with diabetes experiencing depressive and anxiety symptoms, and diabetes distress.
An important new area of inquiry highlights the social stigma experienced by many people living with diabetes, and encourages us to take greater care to ensure that our messaging around diabetes is not, in itself, stigmatising.
It is with great pleasure that I commend to you a new report: the Diabetes MILES-2 2016 Survey Report and hope that you will find it to be of great interest.
More importantly, I hope this report will give you a greater appreciation of the daily challenges faced by so many people in their efforts to live well with diabetes ‘24/7’. It is for these people, and for these reasons, that Diabetes Victoria is committed to working to reduce the impact of diabetes in the Victorian community, and to supporting such efforts at a national level. We strive to support, empower and campaign for all Victorians affected by, or at risk of, diabetes.
It is also for these reasons that, in partnership with Deakin University, Diabetes Victoria provides financial support to The Australian Centre for Behavioural Research in Diabetes – so that the Centre can continue its important research in highlighting these challenges, and to inform the work of everyone involved in the care and support of people with diabetes.
Craig Bennett Chief Executive Officer, Diabetes Victoria Adjunct Professor, Deakin University
Foreword

52016 Survey Report
Table of Contents
Acknowledgements __________________________________________________________________________ 3
Foreword ___________________________________________________________________________________ 4
List of Figures _______________________________________________________________________________ 6
List of Tables _______________________________________________________________________________ 6
List of Abbreviations __________________________________________________________________________ 7
Executive Summary __________________________________________________________________________ 8
Introduction ________________________________________________________________________________ 10
Method ____________________________________________________________________________________ 12
Respondent Characteristics __________________________________________________________________ 14
Demographics ___________________________________________________________________________ 14
Clinical Characteristics ___________________________________________________________________ 16
Psychological and Emotional Aspects of Diabetes _______________________________________________ 22
Depressive Symptoms ____________________________________________________________________ 22
Anxiety Symptoms _______________________________________________________________________ 22
Mental Health Comorbidities ______________________________________________________________ 24
Diabetes Distress ________________________________________________________________________ 24
Diabetes-Specific Quality of Life ___________________________________________________________ 26
Social Aspects of Diabetes ___________________________________________________________________ 29
Diabetes Stigma _________________________________________________________________________ 29
Social Support ___________________________________________________________________________ 29
Peer Support ____________________________________________________________________________ 31
Behavioural Aspects of Diabetes ______________________________________________________________ 32
Healthy Eating and Physical Activity ________________________________________________________ 32
Self-Monitoring of Blood Glucose (SMBG) __________________________________________________ 33
Diabetes Healthcare ______________________________________________________________________ 33
Discussion _________________________________________________________________________________ 36
References _________________________________________________________________________________ 42
Appendix I: Variables included in Diabetes MILES-2 Survey ______________________________________ 44
Appendix II: Scales included in Report _________________________________________________________ 46
6 Diabetes MILES-2
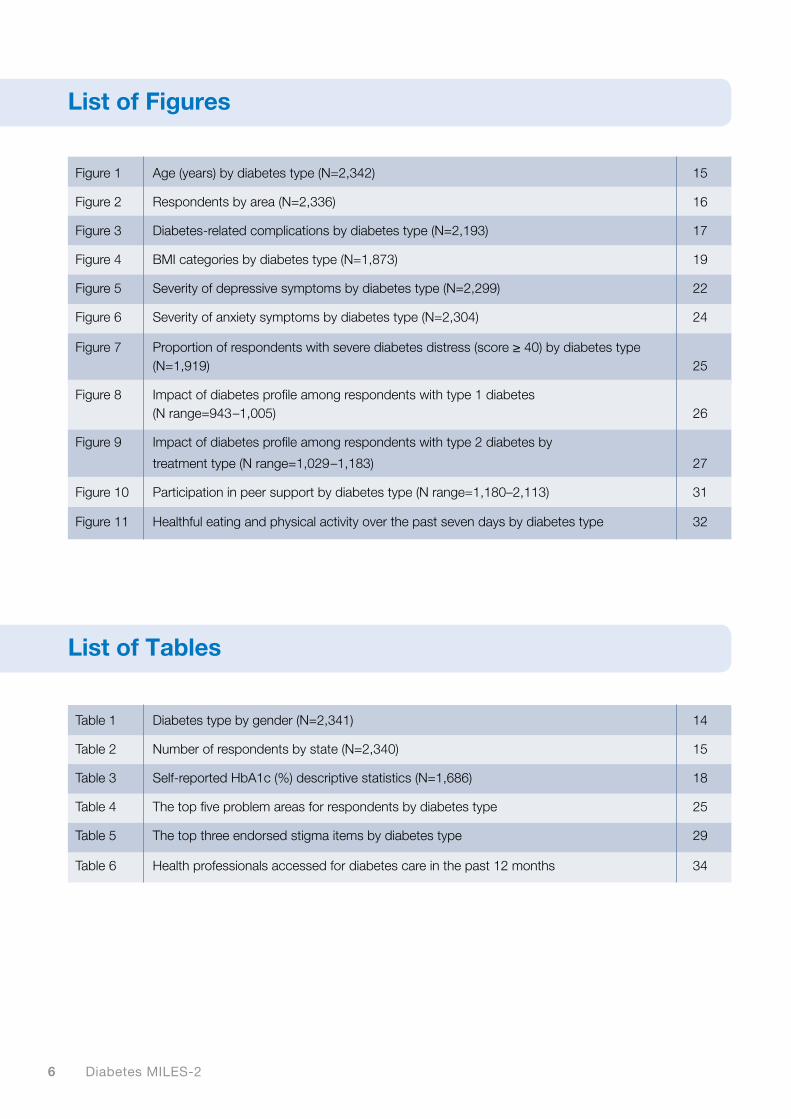
Table 1 Diabetes type by gender (N=2,341) 14
Table 2 Number of respondents by state (N=2,340) 15
Table 3 Self-reported HbA1c (%) descriptive statistics (N=1,686) 18
Table 4 The top five problem areas for respondents by diabetes type 25
Table 5 The top three endorsed stigma items by diabetes type 29
Table 6 Health professionals accessed for diabetes care in the past 12 months 34
List of Figures
List of Tables
Figure 1 Age (years) by diabetes type (N=2,342) 15
Figure 2 Respondents by area (N=2,336) 16
Figure 3 Diabetes-related complications by diabetes type (N=2,193) 17
Figure 4 BMI categories by diabetes type (N=1,873) 19
Figure 5 Severity of depressive symptoms by diabetes type (N=2,299) 22
Figure 6 Severity of anxiety symptoms by diabetes type (N=2,304) 24
Figure 7 Proportion of respondents with severe diabetes distress (score ≥ 40) by diabetes type (N=1,919) 25
Figure 8 Impact of diabetes profile among respondents with type 1 diabetes (N range=943 –1,005) 26
Figure 9 Impact of diabetes profile among respondents with type 2 diabetes by
treatment type (N range=1,029 –1,183) 27
Figure 10 Participation in peer support by diabetes type (N range=1,180–2,113) 31
Figure 11 Healthful eating and physical activity over the past seven days by diabetes type 32

72016 Survey Report
List of Abbreviations
ACBRD The Australian Centre for Behavioural Research in Diabetes
BMI Body Mass Index
DAWN Diabetes Attitudes, Wishes and Needs study
DIDP DAWN Impact of Diabetes Profile
DSAS-1/DSAS-2 Type 1/Type 2 Diabetes Stigma Assessment Scale
DSS Diabetes Support Scale
GAD-7 Generalised Anxiety Disorder (7-item questionnaire)
GP General Practitioner
HbA1c Glycosylated Haemoglobin (a measure of average blood glucose over 10 –12 weeks)
HP Health Professional
MILES Management and Impact for Long-term Empowerment and Success
NDSS National Diabetes Services Scheme
PAID Problem Areas In Diabetes scale
PHQ-8 Patient Health Questionnaire (8-item questionnaire)
SMBG Self-Monitoring of Blood Glucose

8 Diabetes MILES-2
Diabetes is a serious chronic condition, affecting people of all ages, backgrounds and cultures. It requires daily self-care, and can have a significant impact on quality of life and well-being. Approximately 1.7 million Australians are currently living with diabetes, and its prevalence is increasing.1
Diabetes MILES (Management and Impact for Long-term Empowerment and Success) – Australia2,3 was the first national survey of Australians living with type 1 or type 2 diabetes that specifically assessed the impact of diabetes on psychosocial health and well-being. Four years later, the second Diabetes MILES – Australia survey (MILES-2) was undertaken to further understand these aspects of the condition and to explore emerging issues in diabetes research and practice.
MethodThe Diabetes MILES-2 survey was designed for Australians living with type 1 or type 2 diabetes, aged 18–75 years. English proficiency was required in order to take part.
In March 2015, an invitation to complete an online survey was posted to 20,000 National Diabetes Services Scheme (NDSS) registrants. In addition, 2,065 respondents of the 2011 MILES survey received an invitation to take part. Those who consented to take part completed the online survey, which was tailored to their diabetes type and treatment regimen.
In total, 2,342 survey respondents met the eligibility criteria.
Respondent Characteristics 46% of the respondents had type 1 diabetes:
• 59% women, 41% men
• Mean age: 44 ± 15 years
• Diabetes duration: 19 ± 14, range = 0–68 years
• 65% used insulin injections, 35% used an insulin pump
• 35% reported at least one diabetes-related complication
• Mean self-reported HbA1c: 7.4 ± 1.3, range = 4.0–18.1%
• 97% have had at least one hypoglycaemic event in their lifetime
• 36% were classified as overweight and 19% as obese.
54% of the respondents had type 2 diabetes:
• 43% women, 57% men
• Mean age: 61 ± 9 years
• Diabetes duration: 11 ± 7, range = 0–44 years
• 40% used oral medication, 42% used insulin
• 54% reported at least one diabetes-related complication
• Mean self-reported HbA1c: 7.1 ± 1.7, range = 4.0– 20.0%
• 34% and 77% of respondents with non-insulin and insulin-treated type 2 diabetes respectively, have had at least one hypoglycaemic event in their lifetime
• 32% were classified as overweight and 53% as obese.
Respondents included adults with diabetes from all states and territories of Australia.
Most respondents:
• spoke English as their main language (97%)
• were born in Australia (74%)
• were from metropolitan areas (61%)
• were married/in a de facto relationship (69%)
• had at least a high school education (80%)
• were occupied in paid employment (53%)
• were registered with the National Diabetes Services Scheme (98%).
Psychological and Emotional Aspects of Diabetes • 17% of respondents indicated that they had
been diagnosed with a mental health problem, at some point in their life.
• Respondents with insulin-treated type 2 diabetes were more likely to experience moderate-to- severe symptoms of depression and anxiety, compared to other respondents
– Moderate-to-severe depressive symptoms affected 36% of adults with insulin-treated type 2 diabetes, compared to 24% and 21% of those with type 1 and non-insulin-treated type 2 diabetes respectively
– Moderate-to-severe anxiety symptoms affected 21% of adults with insulin-treated type 2 diabetes, compared to 16% and 13% of those with type 1 and non-insulin-treated type 2 diabetes respectively.
Executive Summary

92016 Survey Report
• Respondents with type 1 diabetes were more likely to experience severe diabetes distress, compared to other respondents
– 24% of respondents with type 1 diabetes experienced severe diabetes distress, as compared to 20% and 11% of those with insulin-treated and non-insulin-treated type 2 diabetes respectively
– The most commonly reported problem area for respondents (consistent across diabetes types and treatment regimens) was worrying about the future and the development of diabetes-related complications.
• Respondents with either type 1 or type 2 diabetes reported that diabetes negatively impacted their quality of life, across a number of domains. The aspects of life most commonly reported as negatively impacted by diabetes were:
– ‘emotional well-being’, for those with type 1 diabetes
– ‘dietary freedom’ for those with type 2 diabetes.
Social Aspects of Diabetes • Perceived and experienced diabetes stigma was
common. The most highly endorsed items were:
– ‘Because I have type 1 diabetes, some people judge me if I eat sugary food or drinks (e.g. cakes, lollies, soft drink)’, endorsed by 67% of those with type 1 diabetes
– ‘Because I have type 2 diabetes, some people assume I must be overweight, or have been in the past’, endorsed by 50% of those with type 2 diabetes.
• Those with insulin-treated type 2 diabetes perceived or experienced more diabetes stigma than those not using insulin.
• Respondents with non-insulin-treated type 2 diabetes perceived a higher level of social support than other respondents.
• 11% of respondents indicated that they are currently part of a peer support group or community; the majority (72%) of those had type 1 diabetes.
• 89% are not currently part of a peer support group or community and have never been in the past
– 38% of these respondents indicated that they would like to be part of a peer support community in the future; the most preferred mode of peer support was online, regardless of diabetes type.
Behavioural Aspects of Diabetes• Few respondents reported optimal eating and
physical activity patterns. On the past seven days:
– 25% of adults followed a healthful eating plan on all days
– 17% of adults participated in at least 30 minutes of physical activity on all days.
• As expected, frequency of blood glucose monitoring was higher among respondents with type 1 diabetes compared to those with type 2 diabetes:
– 55% of those with type 1 diabetes checked four to six times per day
– 67% of those with insulin-treated type 2 diabetes checked one to three times per day
– 92% of those with non-insulin-treated type 2 diabetes checked one to three times per day.
• The health professional relied on most was:
– the endocrinologist, for those with type 1 diabetes (49%)
– the general practitioner (GP), for those with type 2 diabetes (70%).
• 37% of respondents had attended a group education program for their diabetes at some point; of those, 74% regarded it as helpful or very helpful.
• Of the respondents who had never attended a group education program for their diabetes, 36% would like to attend in the future.
• 13% of respondents reported using ‘apps’ to help manage their diabetes, and majority of these were adults with type 1 diabetes.
The MILES-2 survey aimed to build on previous Diabetes MILES research, by identifying issues concerning the psychosocial well-being and unmet needs of Australians living with diabetes. The results provide a national ‘snapshot’ of the quality of life, psychosocial well-being and self-care behaviours of Australians living with type 1 or type 2 diabetes. Further analysis of these results is ongoing, and will help to inform policy and health service provision, with the ultimate aim of improving and optimising support and care for people affected by diabetes.
10 Diabetes MILES-2
Diabetes is the fastest growing chronic health condition in Australia, with up to 280 new cases per day. It has been termed ‘the epidemic of the 21st century’, and is regarded as Australia’s biggest health challenge.1
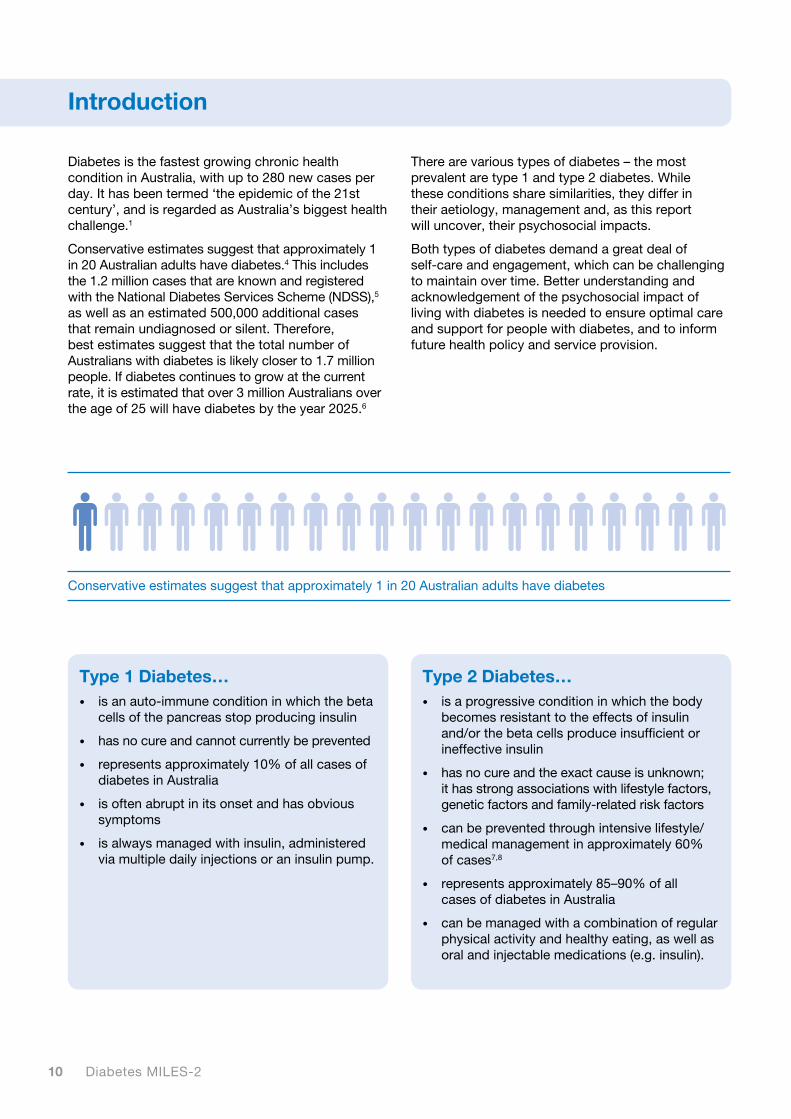
Conservative estimates suggest that approximately 1 in 20 Australian adults have diabetes.4 This includes the 1.2 million cases that are known and registered with the National Diabetes Services Scheme (NDSS),5 as well as an estimated 500,000 additional cases that remain undiagnosed or silent. Therefore, best estimates suggest that the total number of Australians with diabetes is likely closer to 1.7 million people. If diabetes continues to grow at the current rate, it is estimated that over 3 million Australians over the age of 25 will have diabetes by the year 2025.6
There are various types of diabetes – the most prevalent are type 1 and type 2 diabetes. While these conditions share similarities, they differ in their aetiology, management and, as this report will uncover, their psychosocial impacts.
Both types of diabetes demand a great deal of self-care and engagement, which can be challenging to maintain over time. Better understanding and acknowledgement of the psychosocial impact of living with diabetes is needed to ensure optimal care and support for people with diabetes, and to inform future health policy and service provision.
Introduction
Type 1 Diabetes…• is an auto-immune condition in which the beta
cells of the pancreas stop producing insulin
• has no cure and cannot currently be prevented
• represents approximately 10% of all cases of diabetes in Australia
• is often abrupt in its onset and has obvious symptoms
• is always managed with insulin, administered via multiple daily injections or an insulin pump.
Type 2 Diabetes…• is a progressive condition in which the body
becomes resistant to the effects of insulin and/or the beta cells produce insufficient or ineffective insulin
• has no cure and the exact cause is unknown; it has strong associations with lifestyle factors, genetic factors and family-related risk factors
• can be prevented through intensive lifestyle/medical management in approximately 60% of cases7,8
• represents approximately 85–90% of all cases of diabetes in Australia
• can be managed with a combination of regular physical activity and healthy eating, as well as oral and injectable medications (e.g. insulin).
Conservative estimates suggest that approximately 1 in 20 Australian adults have diabetes

11 112016 Survey Report
The Diabetes MILES – Australia 2011 Survey The Diabetes MILES (Management and Impact for Long-term Empowerment and Success) – Australia 2011 Survey was the first initiative of the Diabetes MILES study international collaborative, conducted by The ACBRD. The survey was completed by a large national sample (N=3,338) of Australian adults with type 1 or type 2 diabetes. The survey report provided a valuable ‘snapshot’ of the psychosocial and behavioural aspects impacting those with diabetes, and raised awareness about the unmet needs of people with diabetes.3 In addition to the report, many papers have been published in peer-reviewed journals, providing greater insights into the relationships between various factors influencing self-care and emotional well-being.
The Second Diabetes MILES – Australia (MILES-2) SurveyThe current survey – the second Diabetes MILES, Australia Survey (MILES-2), was conducted in 2015. Four years after the original Diabetes MILES study was completed, the time was right to gain a more up-to-date snapshot of the challenges and unmet needs faced by Australians with diabetes. In addition, the MILES-2 survey enabled assessment of some new issues, e.g. diabetes stigma, memory and cognition, ‘apps’ for diabetes management and self-compassion.
This ReportThis report presents a selection of findings and serves two key purposes:
• To provide an overview of the main themes and topics explored in the survey, split by diabetes type and treatment regimen where appropriate
• To make the initial results of the MILES-2 survey available to a wide audience outside of the traditional academic sphere, including health professionals, policy makers and people affected by diabetes.
Analysis of this large and rich dataset is ongoing. Further reports and publications will become available in due course. For further information, please visit www.diabetesMILES.org.

12 Diabetes MILES-2
• 8,000 with type 1 diabetes (40% of the total sample)
• 12,000 with type 2 diabetes (60% of the total sample); 6,000 of whom were registered as using insulin (50% of type 2 diabetes sample)
Adults with type 1 diabetes or type 2 diabetes using insulin were purposefully over-sampled to ensure adequate representation of these groups. The sample was not stratified by gender. A reminder email/letter was sent to participants three weeks after the first invitation.
2. People who had previously taken part in the 2011 survey and had consented to be contacted about future Diabetes MILES research activities (N=2,065), were emailed or posted a study invitation directly. A reminder email/letter was sent to participants three weeks after the first invitation.
3. The survey was also advertised via social media (e.g. the ACBRD and Diabetes Australia Facebook and Twitter), e-newsletters (e.g. the ACBRD Research Round-Up) and relevant publications (e.g. Diabetes Australia magazines).
Data CollectionThe MILES-2 survey was hosted by QualtricsTM, a secure, online survey platform. The survey was open for participation for seven weeks (23 March– 11 May 2015). As respondents progressed through the survey, their data were saved automatically by QualtricsTM.
On entry to the online survey, respondents were invited to read a plain language description of the study and indicate their consent to take part. They then completed eligibility screening and preliminary demographics questions so that a tailored version of the survey could be presented according to their diabetes type and treatment regimen.
A small sample (n=27) of respondents were unable to access the online version (due to not having access to the internet, or not knowing how to use a computer). These respondents requested a hard-copy version of the study description, consent form and survey booklet, which they completed and returned via post.
Method
Survey Design Consistent with the aims of Diabetes MILES – Australia 2011, survey content focused on three aspects of living with diabetes:
• psychological, e.g. emotional well-being and distress
• social, e.g. diabetes stigma and peer support
• behavioural, e.g. diabetes self-management.
Survey content was grouped into eight themes: 1) Demographics, 2) My General Well-being, 3) My Feelings about Diabetes, 4) My General Health, 5) Support from Health Professionals, Family and Friends, 6) My Diabetes, 7) My Blood Glucose Levels, 8) My Thoughts and Beliefs. The survey was also tailored to diabetes type and treatment (based on information provided in the Demographics section).
A list of all the variables included in the final survey can be found in Appendix I, and information about the validated scales included in this report can be found in Appendix II. Where an appropriate measure did not exist or was not available, the research team developed items unique to the MILES-2 survey.
The MILES-2 survey was conducted primarily online, although a hard copy version was made available to those who requested it. The survey was available in English language only.
Ethics ApprovalThe MILES-2 survey received ethical approval from the Deakin University Human Research Ethics Committee (reference number: 2011-046).
Participant Eligibility and Recruitment Eligible participants were adults (aged 18–75 years) living in Australia who had type 1 or type 2 diabetes, and were proficient in English.
Recruitment Participants were recruited in several ways:
1. An invitation to complete the MILES-2 survey was posted to a random selection of 20,000 NDSS registrants with type 1 or type 2 diabetes. Only those who had previously consented to be contacted for research purposes (approximately 47%), and those who had not been invited to take part in the 2011 MILES survey (see point 2 below), were contacted. The sample was stratified according to population in each Australian state, and as follows:

132016 Survey Report
Study Sample A total of 2,651 survey responses were recorded by QualtricsTM. However, 148 duplicate cases were identified. The main reasons for duplicate cases included participants restarting the survey after being excluded: a) due to ineligibility, b) due to losing internet connection, or c) due to survey answers not saving correctly. In cases where participants were eligible to take part, their most complete entry was retained. If there were no differences in the amount of data in each case, the first entry was retained. After duplicates were removed, 2,503 responses to the MILES-2 survey were retained. Of these, 161 respondents were excluded due to ineligibility.
Interpreting Data, Tables and Figures in this ReportAll data in-text are presented as percentage (number) or mean ± standard deviation, and data in tables and graphs are presented as specified. The mean is the average response. The standard deviation is the variability in scores. A low standard deviation tells you that most people scored quite close to the mean, while a high standard deviation tells you that scores are widely spread. As mentioned, survey versions were tailored to individuals based on demographic variables (e.g. diabetes type and treatment regimen). Therefore, not all survey questions were presented to every participant. Participants could also choose to skip questions. As such, the number of people that responded to each item varies, and is not always consistent with the total number of people who took part in the MILES-2 survey. Each table and figure in this report is accompanied by an indication of the size of the sample (e.g. N=2,336) upon which the calculations are based.
The final eligible sample for the MILES-2 survey was N=2,342 respondents, and this report focuses on the findings for this sample.

14 Diabetes MILES-2
Demographics
Diabetes TypeOf the 2,342 respondents, 46% (n=1,078) had type 1 diabetes and 54% (n=1,264) had type 2 diabetes. Of those who had type 2 diabetes, 42% (n=531) reported managing their diabetes with insulin.
Gender Both men and women were well represented in the survey (Table 1). Women with type 1 diabetes were more likely to participate than men with type 1 diabetes. The reverse was true for respondents with type 2 diabetes, where men were more likely to take part. The gender distribution of those with non-insulin-treated type 2 diabetes (45% women, n=326; 55% men, n=404) and insulin-treated type 2 diabetes (40% women, n=213; 60% men, n=318) were comparable.
AgeRespondents with type 1 diabetes were, on average, younger (mean = 44 ± 15 years) than those with type 2 diabetes (mean = 61 ± 9 years). Those with insulin-treated type 2 diabetes and non-insulin- treated type 2 diabetes were of comparable ages: mean = 61 ± 89 years and 61 ± 10 years respectively (Figure 1).
Locality of Respondents People from all states and territories took part. Approximately half (51%, n=1,181) of respondents were from New South Wales (NSW) or Victoria (VIC) (Table 2), which is representative nationally.a
The majority lived in metropolitan areas of Australia, although people from regional and rural areas were also represented. Respondents with type 1 and type 2 diabetes were relatively evenly split within each area (Figure 2): metropolitan (63%, n=683; 60%, n=750 respectively), regional (25%, n=272; 24%, n=303 respectively), and rural (11%, n=122; 16%, n=206 respectively).
Respondent Characteristics
Gender Type 1 Type 2 Total
Women 639 (59) 539 (43) 1,178 (50)
Men 436 (41) 722 (57) 1,158 (50)
Prefer not to say 3 (<1) 2 (<1) 5 (<1)
Total 1,078 (100) 1,263 (100) 2,341 (100)
Note: Data are presented as n (%).
Table 1. Diabetes type by gender (N=2,341)
a Figures from NDSS diabetes map: www.diabetesmap.com.au

152016 Survey Report
Figure 1. Age (years) by diabetes type (N=2,342)
%
0
5
10
15
20
25
30
35
40
45
50
18 – 24 25 – 34 35 – 44 45 – 54 55 – 64 65+
Type 1 Type 2 Insulin Type 2 Non-insulin
State Type 1 Type 2 Total
Australian Capital Territory 54 132 186 (8)
New South Wales 345 258 603 (26)
Northern Territory 9 41 50 (2)
Queensland 140 143 283 (12)
South Australia 86 120 206 (9)
Tasmania 50 120 170 (7)
Victoria 281 297 578 (25)
Western Australia 113 151 264 (11)
Total 1,078 1,262 2,340 (100)
Table 2. Number of respondents by state (N=2,340)
Note: Data are presented as n or n(%).

16 Diabetes MILES-2
Marital StatusAmong those with type 1 diabetes, 66% (n=706) were married or in a de facto relationship, and among those with type 2 diabetes, 71% (n=891) were married or in a de facto relationship.
Cultural Background Around one in four respondents with type 1 diabetes (23%, n=247) indicated that they were born in a country other than Australia, compared to almost one in three respondents with type 2 diabetes (30%, n=374). Most respondents spoke English as their primary language. However, 2% (n=22) of those with type 1 diabetes and 4% (n=49) of those with type 2 diabetes mainly spoke a language other than English at home.
• 36 different languages were reported.
• Other than English, Chinese dialects were the most common languages spoken at home.
A small minority (2%, n=36) of respondents reported being of Aboriginal and/or Torres Strait Islander descent.
Membership Around half of respondents (type 1: 55%, n=596; type 2: 44%, n=556) were a member of their local state or territory diabetes organisation (e.g. Diabetes NSW, Diabetes Victoria). Nearly all respondents with type 1 diabetes (99%, n=1,053) and type 2 diabetes (98%, n=1,222) were registered with the National Diabetes Services Scheme (NDSS).
Clinical Characteristics
Age at DiagnosisOn average, respondents with type 1 diabetes were diagnosed at 25 ± 15 years of age (range = <1–67 years). Respondents with type 2 diabetes were diagnosed much later in life than those with type 1 diabetes (mean age = 50 ± 10, range = 13–75 years). Of those with type 2 diabetes, respondents currently using insulin were diagnosed with the condition at a younger age (mean = 47 ± 10 years) as compared to those not using insulin (mean = 53 ± 10 years).
Diabetes Duration Respondents with type 1 diabetes reported, on average, a longer diabetes duration (mean = 19 ± 14, range = <1–68 years) than respondents with type 2 diabetes (mean = 11 ± 7, range = <1–44 years).
Metropolitan Regional Rural
Figure 2. Respondents by area (N=2,336)
61%25%
14%
Employment and Qualifications Respondents with type 1 diabetes were more likely to be in paid employment (72%, n=770) than those with type 2 diabetes (38%, n=477), while those with type 2 diabetes were more likely to be retired (46%, n=579) than those with type 1 diabetes (14%, n=146). Other respondents indicated that they were unable to work (type 1: 5%, n=50; type 2: 8%, n=102), or in unpaid household duties (type 1: 4%, n=40; type 2: 4%, n=49).
Respondents were asked about their highest level of education. Of those with type 1 diabetes, 17% (n=181) completed high school, while almost half (47%, n=505) completed a university degree. Of those with type 2 diabetes 11% (n=140) completed high school, while around a third (32%, n=408) completed a university degree.
IncomeRespondents were asked about their gross annual household income:
• 15% (n=355) indicated their income was $20,000 or less
• 32% (n=738) indicated their income was between $20,001 and $60,000
• 18% (n=415) indicated their income was between $60,001 and $100,000
• 20% (n=469) indicated their income was over $100,000
• 14% (n=332) did not know or preferred not to say.

172016 Survey Report
Of those with type 2 diabetes, respondents who used insulin had a longer diabetes duration (mean = 15 ± 8 years) than those who did not use insulin (mean = 9 ± 6 years). Three per cent (n=59) had been diagnosed with diabetes less than one year ago.
Diabetes Treatment Most respondents with type 1 diabetes (65%, n=698) reported managing their condition with insulin injections, on average injecting 4 ± 1 times per day. The remaining 35% (n=380) reported using an insulin pump as their main method of administering insulin.
The majority of respondents with type 2 diabetes reported managing their condition with insulin injections or blood glucose lowering tablets (42%, n=529; 40%, n=510 respectively). Of those using insulin, the average number of injections was 3 ± 1 per day. Fourteen per cent of respondents with type 2 diabetes reported managing their condition with ‘lifestyle only’ (n=176), while very small proportions of those with type 2 diabetes reported using an insulin pump, or injecting Exenatide (Byetta®).
Diabetes-Related Complications A quarter of respondents (23%, n=503) had one diabetes-related complication, while 22% (n=485) reported more than one. The most common diabetes complication reported by the sample was retinopathy (18%, n=393) followed by sexual dysfunction (16%, n=356).
Overall, people with insulin-treated type 2 diabetes were more likely to report diabetes- related complications than those with type 1 or non-insulin-treated type 2 diabetes (Figure 3).
HbA1cTwo-thirds of respondents (66%, n=1,361) reported having had a HbA1c check within the last three months, with the remainder indicating it was more than three months ago or they were unable to recall when it was last checked. This pattern was comparable across diabetes types and treatment groups, although respondents with type 1 and insulin-treated type 2 diabetes were more likely to be up-to-date with their HbA1c checks compared with those with non-insulin-treated type 2 diabetes.
Respondents were also asked to recall their most recent HbA1c valueb (Table 3). Around one third of respondents did not recall their most recent HbA1c. The mean HbA1c (7.3%) of the total sample indicates that, on average, respondents were within or slightly above recommended target levelsc (≤7%, or ≤53 mmol/mol).9 Of those with type 1 diabetes (57%, n=493), and insulin-treated type 2 diabetes (53%, n=197), the majority had HbA1c levels that were above recommended target levels. Around one third of those with non-insulin-treated type 2 diabetes (29%, n=132) had HbA1c levels above target.
Figure 3. Diabetes-related complications by diabetes type (N=2,193)
%
0
5
10
15
20
25
30
35
Type 1 Type 2 Insulin Type 2 Non-insulin
Kidney damage/renal failure
Retinopathy Neuropathy Heart disease/heart attack
Stroke Vascular disease
Sexual dysfunction
b HbA1c is the average blood glucose over the past 10–12 weeks.c While an overall HbA1c target of ≤7.0% has been used here, we acknowledge that guidelines recommend individualisation of targets based on person-specific
factors (e.g. age, type and duration of diabetes, medication, co-morbidities).

18 Diabetes MILES-2
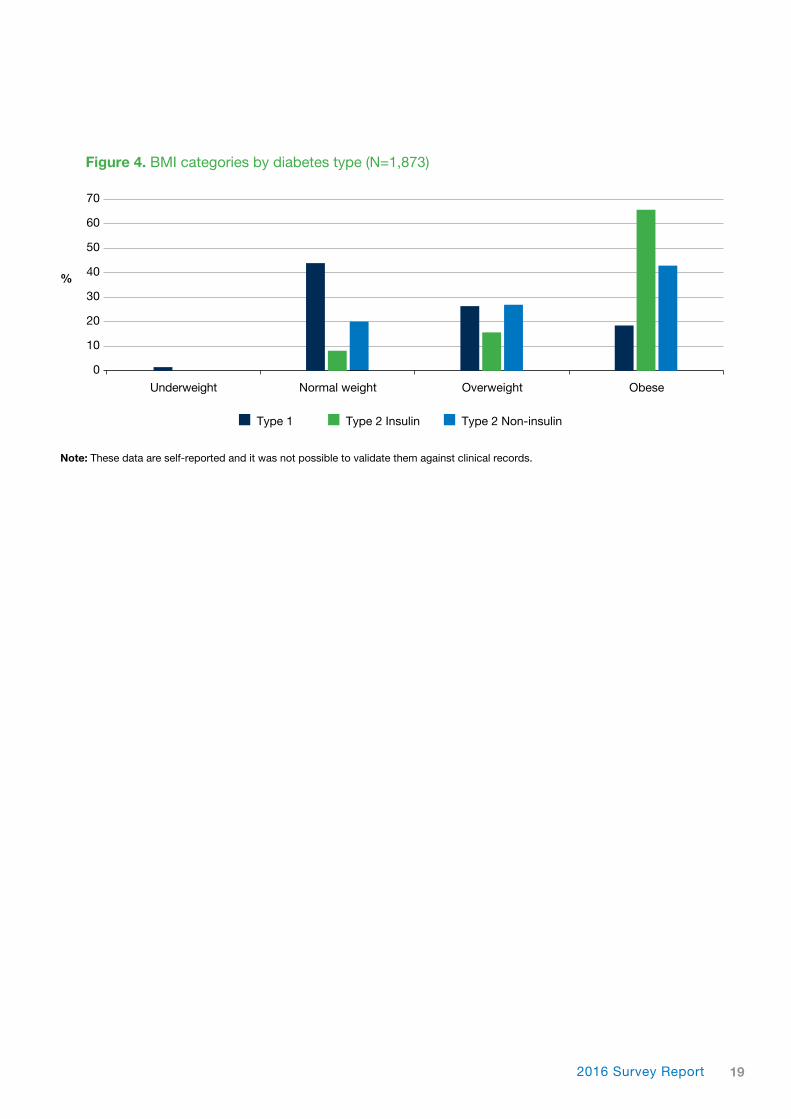
Body Mass IndexBody Mass Index (BMI; see box)11 was calculated based on self-reported height and weight. On average, respondents had a BMI of 29.0 ± 6.6, and around two in three respondents were in either the overweight (34%, n=634) or obese (37%, n=388) weight range. On average, respondents with insulin-treated type 2 diabetes had a slightly higher BMI (32.8 ± 6.4) than respondents with non-insulin-treated type 2 diabetes (30.5 ± 6.6). Both were higher than those with type 1 diabetes, whose mean BMI was in the overweight range (26.5 ± 5.4) (Figure 4).
Hypoglycaemia Respondents were asked about their experience of hypoglycaemia (hypo). As expected, most respondents with type 1 diabetes (97%, n=917) and insulin-treated type 2 diabetes (77%, n=361) have had at least one hypo in their lifetime. Just over a third of those with non-insulin-treated type 2 diabetes (34%, n=215) have had at least one hypo.
Over the past six months, at least one severe hypoglycaemic eventd was experienced by 17% (n=152) of respondents with type 1 diabetes, 8% (n=29) of those with insulin-treated type 2 diabetes and 5% (n=10) of those with non-insulin-treated type 2 diabetes.
Impaired awareness of hypoglycaemia was assessed using the Gold Score.10 A score of 4 or above indicates impaired awareness and often that there were limited or absent hypoglycaemia warning symptoms such as trembling, sweating, hunger and irritability.
Overall, 18% (n=419) of respondents reported impaired awareness of hypoglycaemia. Respondents with type 1 diabetes were the group most likely to have impaired awareness of hypoglycaemia (24%, n=254), followed by those with insulin-treated and non-insulin-treated type 2 diabetes (16%, n=85 and 11%, n=80 respectively).
Diabetes Type Mean ± SD Min Max
Type 1 7.4 ± 1.3 4.0 18.1
Type 2 (insulin) 7.5 ± 1.6 4.0 16.8
Type 2 (non-insulin) 6.8 ± 1.6 4.0 20.0
Total sample 7.3 ± 1.5 4.0 20.0
Note: These data are self-reported and it was not possible to validate them against clinical records.
Table 3. Self-reported HbA1c (%) descriptive statistics (N=1,686)
d A hypo that they were unable to treat themselves.
Body Mass Index (BMI)
Less than 18.5 Underweight
18.5 to less than 25 Normal weight range
25 to less than 30 Overweight
30 or more Obese
192016 Survey Report
Figure 4. BMI categories by diabetes type (N=1,873)
%
0
10
20
30
40
50
60
70
Type 1 Type 2 Insulin Type 2 Non-insulin
Underweight Normal weight Overweight Obese
Note: These data are self-reported and it was not possible to validate them against clinical records.
20 Diabetes MILES-2
21
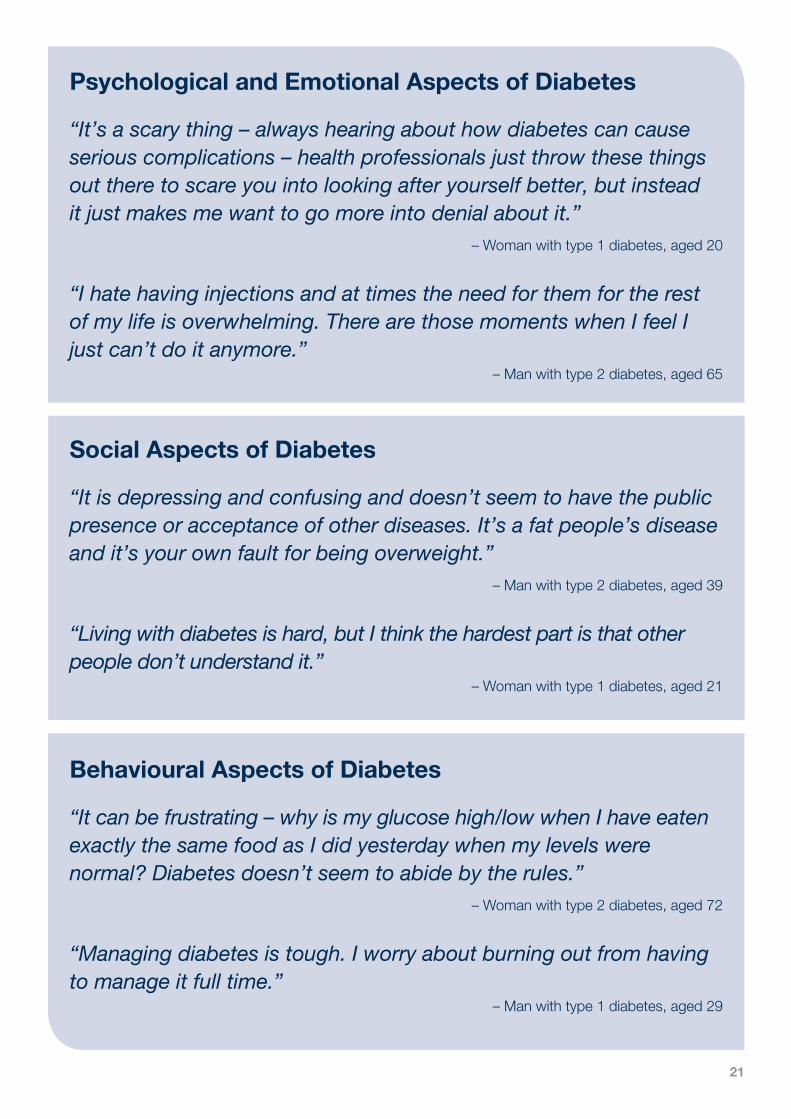
Social Aspects of Diabetes
“It is depressing and confusing and doesn’t seem to have the public presence or acceptance of other diseases. It’s a fat people’s disease and it’s your own fault for being overweight.”
– Man with type 2 diabetes, aged 39
“Living with diabetes is hard, but I think the hardest part is that other people don’t understand it.”
– Woman with type 1 diabetes, aged 21
Psychological and Emotional Aspects of Diabetes
“It’s a scary thing – always hearing about how diabetes can cause serious complications – health professionals just throw these things out there to scare you into looking after yourself better, but instead it just makes me want to go more into denial about it.”
– Woman with type 1 diabetes, aged 20
“I hate having injections and at times the need for them for the rest of my life is overwhelming. There are those moments when I feel I just can’t do it anymore.”
– Man with type 2 diabetes, aged 65
Behavioural Aspects of Diabetes
“It can be frustrating – why is my glucose high/low when I have eaten exactly the same food as I did yesterday when my levels were normal? Diabetes doesn’t seem to abide by the rules.”
– Woman with type 2 diabetes, aged 72
“Managing diabetes is tough. I worry about burning out from having to manage it full time.”
– Man with type 1 diabetes, aged 29

22 Diabetes MILES-2
Respondents were asked about their current symptoms of depression and anxiety and any history of mental health problems. In addition, they were asked about their experience of diabetes-specific distress and about the impact of diabetes on their quality of life.
Depressive Symptoms Depressive symptoms were measured using the eight-item Patient Health Questionnaire (PHQ-8).12,13 Respondents rated the frequency with which they had experienced symptoms of depression over the past two weeks on a scale of 0 (not at all) to 3 (nearly every day). Item scores are summed to form a total score (0 to 24). Severity of depressive symptoms was assessed using the cut-off scores of 5, 10, 15 and 20 representing mild, moderate, moderately severe and severe symptoms respectively.
On average, respondents with insulin-treated type 2 diabetes had the highest scores (7.7 ± 6.1) followed by those with type 1 (6.1 ± 5.4) and type 2 non-insulin-treated diabetes (5.6 ± 5.1).
Moderate-to-severe depressive symptoms were experienced by 36% (n=184) of respondents with insulin-treated type 2 diabetes, 24% (n=249) of those with type 1 diabetes and 21% (n=153) with non-insulin-treated type 2 diabetes (Figure 5).
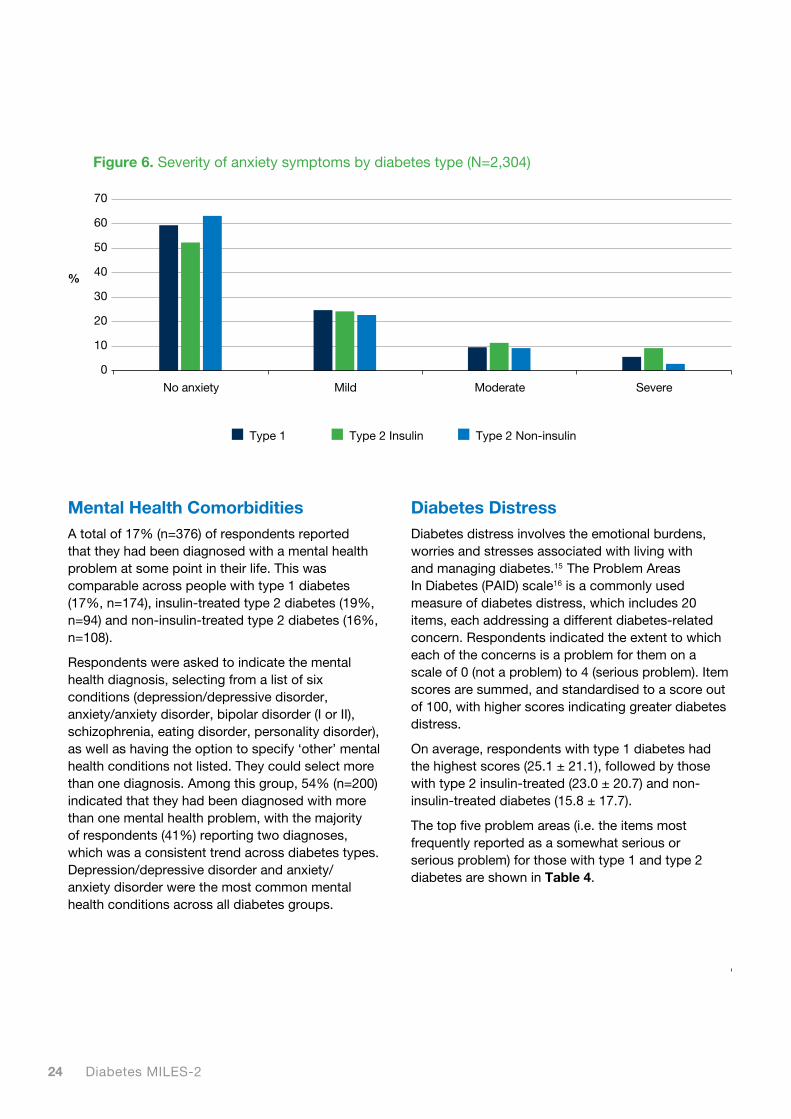
Anxiety Symptoms Anxiety symptoms were measured using the seven-item Generalised Anxiety Disorder scale (GAD-7).14 Respondents rated the frequency with which they had experienced symptoms of anxiety over the past two weeks on a scale of 0 (not at all) to 3 (nearly every day). Item scores are summed to form a total score (0 to 21). Severity of anxiety symptoms was assessed using the cut-off scores of 5, 10 and 15 representing mild, moderate and severe symptoms respectively.
On average, respondents with insulin-treated type 2 diabetes had the highest scores (5.3 ± 5.4) followed by those with type 1 diabetes (4.9 ± 5.0) and type 2 non-insulin-treated diabetes (4.0 ± 4.5).
Moderate-to-severe anxiety symptoms were experienced by 21% (n=111) of respondents with insulin-treated type 2 diabetes, 16% (n=169) of those with type 1 diabetes and 13% (n=93) with non-insulin-treated type 2 diabetes (Figure 6).
Psychological and Emotional Aspects of Diabetes
Figure 5: Severity of depressive symptoms by diabetes type (N=2,299)
%
0
10
20
30
40
50
60
Type 1 Type 2 Insulin Type 2 Non-insulin
No depression Mild Moderate Moderately severe Severe

232016 Survey Report
“Diabetes is a personal journey. One where you can learn a lot about yourself, your strengths, your ability to tolerate (or not) life’s challenges. One thing I’ve learned is that diabetes itself shouldn’t be disabling. With good management one can still live well and enjoy most things other people can.”
– Woman with type 2 diabetes, aged 68
24 Diabetes MILES-2
Diabetes Distress Diabetes distress involves the emotional burdens, worries and stresses associated with living with and managing diabetes.15 The Problem Areas In Diabetes (PAID) scale16 is a commonly used measure of diabetes distress, which includes 20 items, each addressing a different diabetes-related concern. Respondents indicated the extent to which each of the concerns is a problem for them on a scale of 0 (not a problem) to 4 (serious problem). Item scores are summed, and standardised to a score out of 100, with higher scores indicating greater diabetes distress.
On average, respondents with type 1 diabetes had the highest scores (25.1 ± 21.1), followed by those with type 2 insulin-treated (23.0 ± 20.7) and non- insulin-treated diabetes (15.8 ± 17.7).
The top five problem areas (i.e. the items most frequently reported as a somewhat serious or serious problem) for those with type 1 and type 2 diabetes are shown in Table 4.
Mental Health ComorbiditiesA total of 17% (n=376) of respondents reported that they had been diagnosed with a mental health problem at some point in their life. This was comparable across people with type 1 diabetes (17%, n=174), insulin-treated type 2 diabetes (19%, n=94) and non-insulin-treated type 2 diabetes (16%, n=108).
Respondents were asked to indicate the mental health diagnosis, selecting from a list of six conditions (depression/depressive disorder, anxiety/anxiety disorder, bipolar disorder (I or II), schizophrenia, eating disorder, personality disorder), as well as having the option to specify ‘other’ mental health conditions not listed. They could select more than one diagnosis. Among this group, 54% (n=200) indicated that they had been diagnosed with more than one mental health problem, with the majority of respondents (41%) reporting two diagnoses, which was a consistent trend across diabetes types. Depression/depressive disorder and anxiety/ anxiety disorder were the most common mental health conditions across all diabetes groups.
Figure 6. Severity of anxiety symptoms by diabetes type (N=2,304)
%
0
10
20
30
40
50
60
70
Type 1 Type 2 Insulin Type 2 Non-insulin
No anxiety Mild Moderate Severe
252016 Survey Report
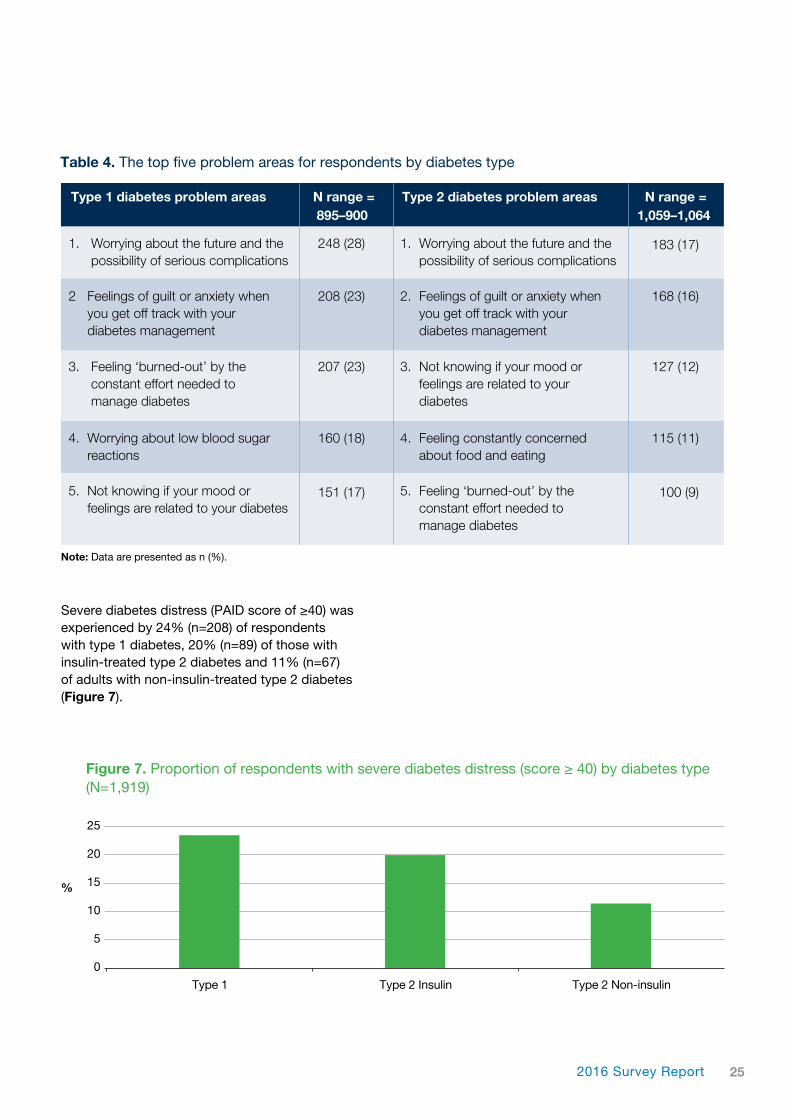
Severe diabetes distress (PAID score of ≥40) was experienced by 24% (n=208) of respondents with type 1 diabetes, 20% (n=89) of those with insulin-treated type 2 diabetes and 11% (n=67) of adults with non-insulin-treated type 2 diabetes (Figure 7).
3. Feeling ‘burned-out’ by the constant effort needed to manage diabetes
3. Not knowing if your mood or feelings are related to your diabetes
127 (12)207 (23)
Type 1 diabetes problem areas N range = Type 2 diabetes problem areas N range = 895–900 1,059–1,064
Table 4. The top five problem areas for respondents by diabetes type
2 Feelings of guilt or anxiety when you get off track with your diabetes management
4. Worrying about low blood sugar reactions
5. Not knowing if your mood or feelings are related to your diabetes
2. Feelings of guilt or anxiety when you get off track with your diabetes management
4. Feeling constantly concerned about food and eating
5. Feeling ‘burned-out’ by the constant effort needed to manage diabetes
168 (16)
115 (11)
100 (9)
1. Worrying about the future and the possibility of serious complications
1. Worrying about the future and the possibility of serious complications
183 (17)248 (28)
208 (23)
160 (18)
151 (17)
Note: Data are presented as n (%).
Figure 7. Proportion of respondents with severe diabetes distress (score ≥ 40) by diabetes type (N=1,919)
%
0
5
10
15
20
25
Type 1 Type 2 Insulin Type 2 Non-insulin

26 Diabetes MILES-2
Sixteen per cent (n=156) of respondents with type 1 diabetes indicated that their ‘physical health’ was, in some way, positively impacted by diabetes. ‘Relationships’ were least likely to be perceived as being negatively impacted by diabetes (Figure 8).
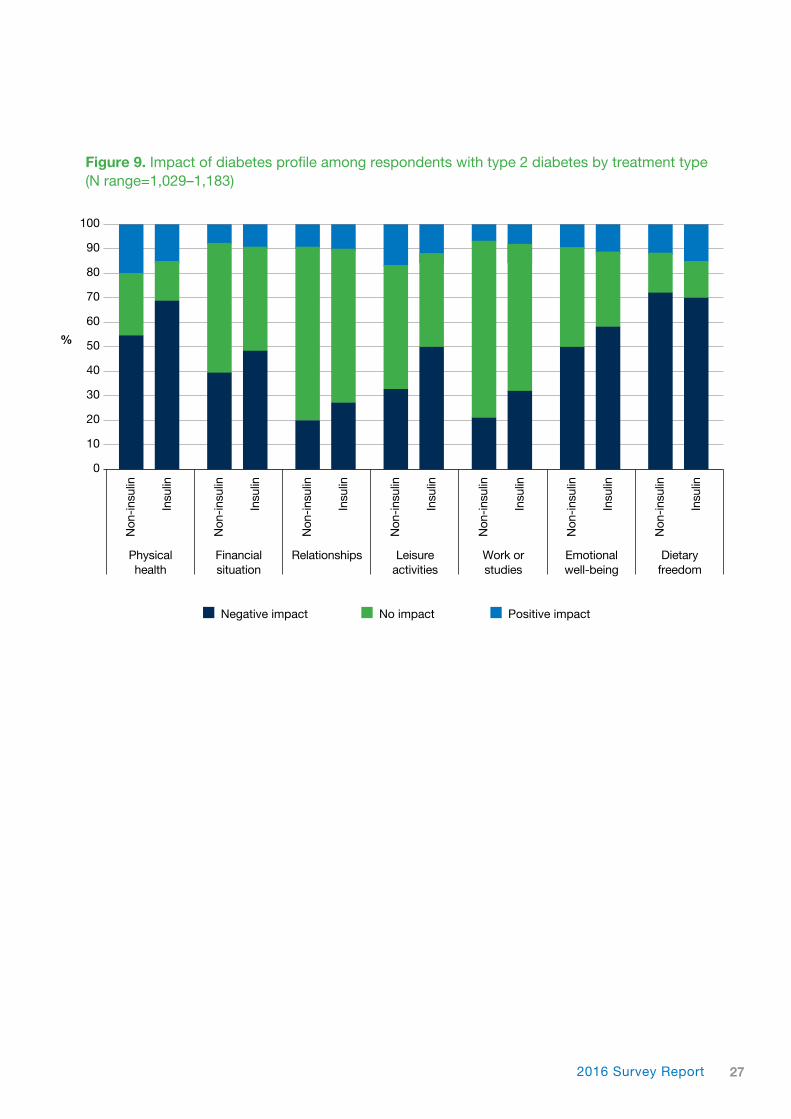
For respondents with non-insulin-treated type 2 diabetes, ‘dietary freedom’ was the aspect of life most negatively impacted by diabetes. This was also true for those with insulin-treated type 2 diabetes, followed closely by ‘physical health’ for both groups. A substantial minority of respondents with non-insulin-treated type 2 diabetes (20%, n=134) and insulin-treated type 2 diabetes (15%, n=76) indicated that their ‘physical health’ was, in some way, positively impacted by their diabetes. ‘Relationships’, ‘work or studies’, and ‘financial situation’ were the life domains that were least likely to be perceived as being negatively impacted by diabetes (Figure 9).
Diabetes-Specific Quality of Life The impact of diabetes on quality of life was assessed using individual items from the DAWN2™ Impact of Diabetes Profile (DIDP).17 The DIDP is a six-item scale, with each item referring to a life domain. An additional item was added to the scale, to assess perceived impact of diabetes on dietary freedom. Respondents indicated whether diabetes has a positive impact (where 1 = very positive impact, 2 = positive impact and 3 = slightly positive impact), no impact = 4, or a negative impact (where 5 = slightly negative impact, 6 = negative impact and 7 = very negative impact) on each life domain. Respondents were also able to indicate ‘not applicable’ if the life domain was not relevant to them.
For respondents with type 1 diabetes, ‘emotional well-being’ was the aspect of life most negatively impacted by diabetes, closely followed by ‘dietary freedom’ and ‘physical health’.
Figure 8. Impact of diabetes profile among respondents with type 1 diabetes (N range = 943–1,005)
%
0
10
20
30
40
50
60
70
80
90
100
Negative impact No impact Positive impact
Physical health
Financial situation
Relationships Leisure activities
Work or studies
Emotional well-being
Dietary freedom
272016 Survey Report
Figure 9. Impact of diabetes profile among respondents with type 2 diabetes by treatment type (N range=1,029–1,183)
%
0
10
20
30
40
50
60
70
80
90
100
Negative impact No impact Positive impact
Physical health
Financial situation
Relationships Leisure activities
Work or studies
Emotional well-being
Dietary freedom
Non
-ins
ulin
Non
-ins
ulin
Non
-ins
ulin
Non
-ins
ulin
Non
-ins
ulin
Non
-ins
ulin
Non
-ins
ulin
Insu
lin
Insu
lin
Insu
lin
Insu
lin
Insu
lin
Insu
lin
Insu
lin
“As if the disease weren’t bad enough, the stigma of type 2 diabetes is worse”
– Man with type 2 diabetes, aged 53
28 Diabetes MILES-2
292016 Survey Report
Respondents were asked about their social experiences of living with diabetes. This included their perceptions and experiences of diabetes-related stigma, social support and peer support.
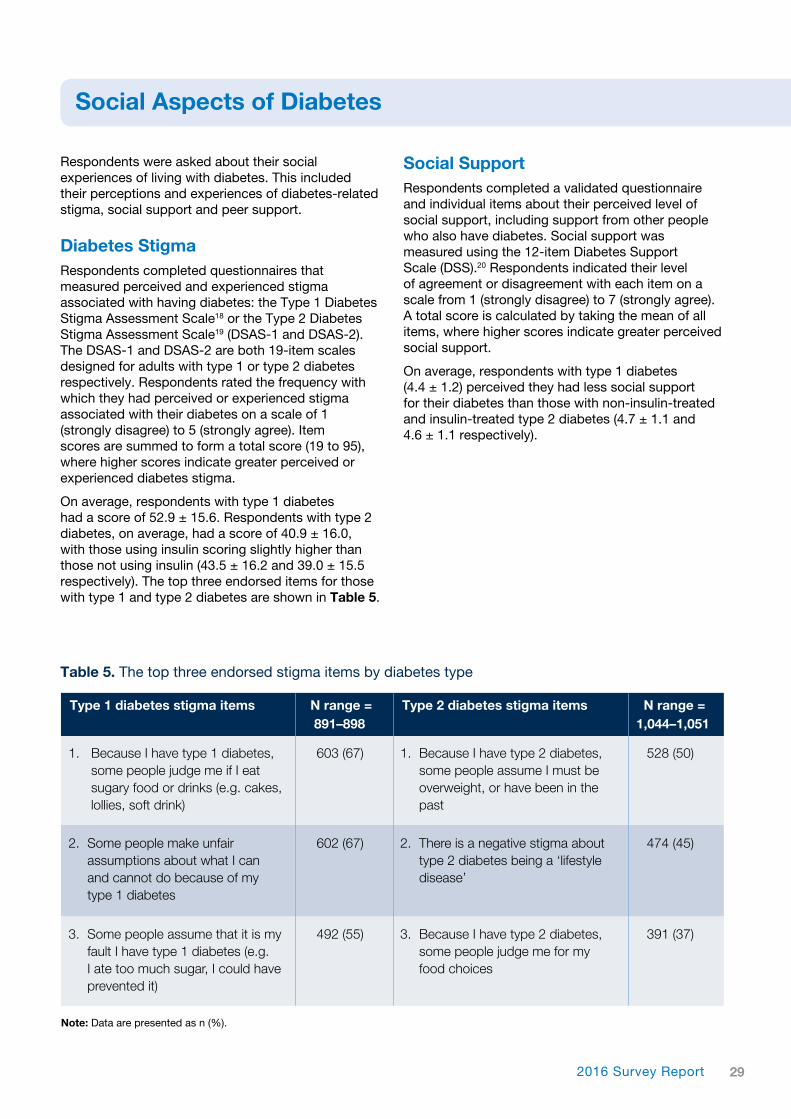
Diabetes Stigma Respondents completed questionnaires that measured perceived and experienced stigma associated with having diabetes: the Type 1 Diabetes Stigma Assessment Scale18 or the Type 2 Diabetes Stigma Assessment Scale19 (DSAS-1 and DSAS-2). The DSAS-1 and DSAS-2 are both 19-item scales designed for adults with type 1 or type 2 diabetes respectively. Respondents rated the frequency with which they had perceived or experienced stigma associated with their diabetes on a scale of 1 (strongly disagree) to 5 (strongly agree). Item scores are summed to form a total score (19 to 95), where higher scores indicate greater perceived or experienced diabetes stigma.
On average, respondents with type 1 diabetes had a score of 52.9 ± 15.6. Respondents with type 2 diabetes, on average, had a score of 40.9 ± 16.0, with those using insulin scoring slightly higher than those not using insulin (43.5 ± 16.2 and 39.0 ± 15.5 respectively). The top three endorsed items for those with type 1 and type 2 diabetes are shown in Table 5.
Social Support Respondents completed a validated questionnaire and individual items about their perceived level of social support, including support from other people who also have diabetes. Social support was measured using the 12-item Diabetes Support Scale (DSS).20 Respondents indicated their level of agreement or disagreement with each item on a scale from 1 (strongly disagree) to 7 (strongly agree). A total score is calculated by taking the mean of all items, where higher scores indicate greater perceived social support.
On average, respondents with type 1 diabetes (4.4 ± 1.2) perceived they had less social support for their diabetes than those with non-insulin-treated and insulin-treated type 2 diabetes (4.7 ± 1.1 and 4.6 ± 1.1 respectively).
Social Aspects of Diabetes
2. Some people make unfair assumptions about what I can and cannot do because of my type 1 diabetes
2. There is a negative stigma about type 2 diabetes being a ‘lifestyle disease’
474 (45)602 (67)
Type 1 diabetes stigma items N range = Type 2 diabetes stigma items N range = 891–898 1,044–1,051
Table 5. The top three endorsed stigma items by diabetes type
1. Because I have type 1 diabetes, some people judge me if I eat sugary food or drinks (e.g. cakes, lollies, soft drink)
1. Because I have type 2 diabetes, some people assume I must be overweight, or have been in the past
528 (50)603 (67)
3. Some people assume that it is my fault I have type 1 diabetes (e.g. I ate too much sugar, I could have prevented it)
3. Because I have type 2 diabetes, some people judge me for my food choices
391 (37)492 (55)
Note: Data are presented as n (%).
30 Diabetes MILES-2
“It is much easier to talk to someone [about diabetes] who has firsthand experience”
– Man with type 1 diabetes, aged 57
312016 Survey Report
Peer Support
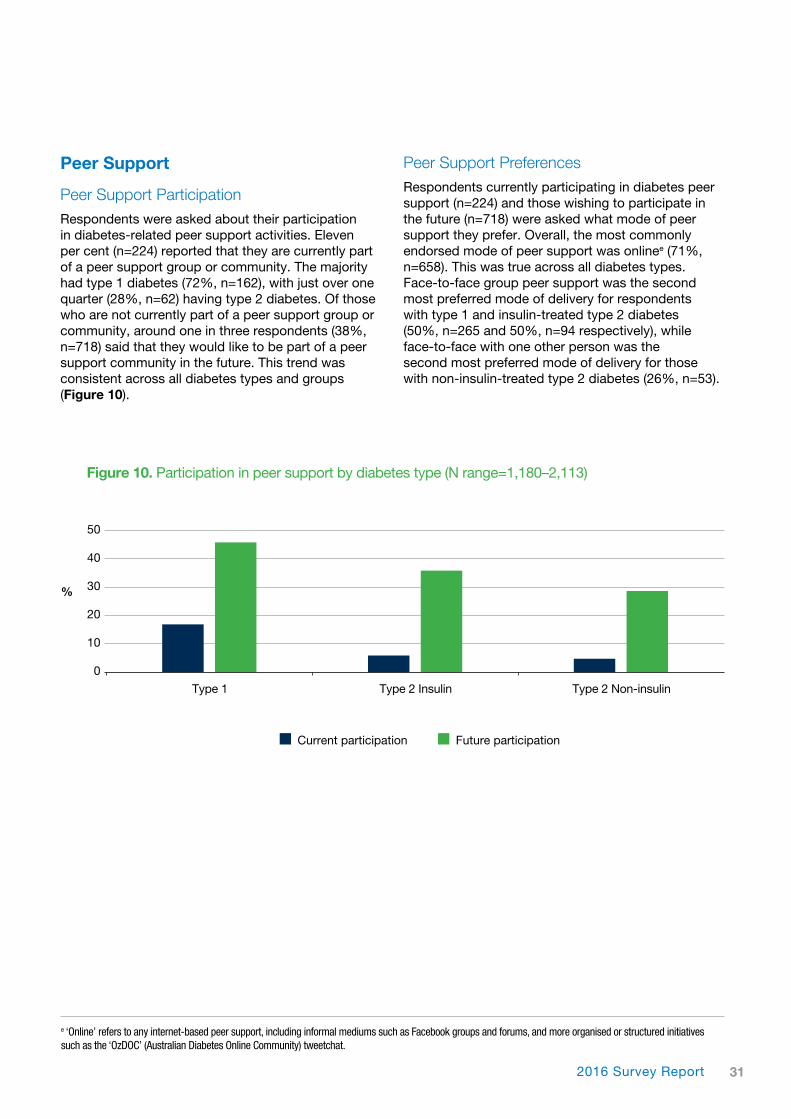
Peer Support ParticipationRespondents were asked about their participation in diabetes-related peer support activities. Eleven per cent (n=224) reported that they are currently part of a peer support group or community. The majority had type 1 diabetes (72%, n=162), with just over one quarter (28%, n=62) having type 2 diabetes. Of those who are not currently part of a peer support group or community, around one in three respondents (38%, n=718) said that they would like to be part of a peer support community in the future. This trend was consistent across all diabetes types and groups (Figure 10).
Peer Support PreferencesRespondents currently participating in diabetes peer support (n=224) and those wishing to participate in the future (n=718) were asked what mode of peer support they prefer. Overall, the most commonly endorsed mode of peer support was onlinee (71%, n=658). This was true across all diabetes types. Face-to-face group peer support was the second most preferred mode of delivery for respondents with type 1 and insulin-treated type 2 diabetes (50%, n=265 and 50%, n=94 respectively), while face-to-face with one other person was the second most preferred mode of delivery for those with non-insulin-treated type 2 diabetes (26%, n=53).
Figure 10. Participation in peer support by diabetes type (N range=1,180–2,113)
%
0
10
20
30
40
50
Type 1 Type 2 Insulin Type 2 Non-insulin
Current participation Future participation
e ‘Online’ refers to any internet-based peer support, including informal mediums such as Facebook groups and forums, and more organised or structured initiatives such as the ‘OzDOC’ (Australian Diabetes Online Community) tweetchat.

32 Diabetes MILES-2
Behavioural Aspects of Diabetes
Respondents answered questions about the behaviours they undertake in order to manage their diabetes, including healthy eating, physical activity, monitoring blood glucose and accessing health professional support. Some of these questions were sourced from the Summary of Diabetes Self-Care Activities measure (SDSCA)21, while others were developed by the research team.
Healthy Eating and Physical Activity On average, respondents reported following a healthful eating plan on 4.8 ± 2.1 of the past seven days. Around one quarter (25%, n=508) indicated that they followed a healthful eating plan on all seven days, while 8% (n=169) said that they did not follow a healthful eating plan on any of the past seven days. The number of days that respondents followed a healthful eating plan was comparable across diabetes type and treatment groups (Figure 11).
On average, respondents reported participating in at least 30 minutes of physical activity on 3.8 ± 2.2 of the past seven days. Seventeen per cent (n=345) indicated that they participated in at least 30 minutes of physical activity on all seven days,
while 12% (n=238) stated that they did not participate in at least 30 minutes of physical activity on any of the past seven days. Those with type 1 diabetes or non-insulin-treated type 2 diabetes participated in physical activity on more days than those with insulin-treated type 2 diabetes (Figure 11).
Respondents were asked to indicate how important they considered following a healthy diet and regular physical activity to be for them, using the response options: not at all, somewhat, considerably and very important.
The majority of respondents (82%, n=1,691) indicated that following a healthy diet was ‘considerably’ or ‘very important’ to them. Those with type 1 diabetes and non-insulin-treated type 2 diabetes were slightly more likely to assign greater importance to diet compared to those with insulin-treated type 2 diabetes.
Likewise, undertaking regular physical activity was regarded as ‘considerably’ or ‘very important’ by most respondents (73%, n=1,509). Those with type 1 diabetes or non-insulin-treated type 2 diabetes considered regular physical activity as more important than those with insulin-treated type 2 diabetes.
Figure 11. Healthful eating and physical activity over the past seven days by diabetes type
Mea
n d
ays
0
1
2
3
4
5
6
Type 1 Type 2 Insulin Type 2 Non-insulin
Followed a healthful eating plan (N=2,067)
Participated in at least 30 minutes of physical activity (N=2,070)
332016 Survey Report
While a substantial proportion of respondents (43%, n=852) did not consider blood glucose monitoring to be a burden to them, 21% (n=421) reported that this self-care activity was ‘considerably’ or ‘a great burden’. A higher proportion of respondents with type 1 diabetes (88%, n=945) regarded blood glucose monitoring as ‘considerably’ or ‘a great burden’ compared to those with insulin-treated type 2 and non-insulin-treated type 2 diabetes (10%, n=71 and 14%, n=73 respectively).
Respondents with type 2 diabetes who monitor their blood glucose were asked if they had ever tried structured blood glucose monitoringf. Around half (52%, n=543) reported that they had tried this method of monitoring, and this was more common amongst those who used insulin compared to those who did not (59%, n=270 and 47%, n=273 respectively).
Diabetes Healthcare Respondents were asked about what services they have accessed for their diabetes and who they consult for their diabetes care.
Main Health Professionals Respondents were asked about the health professionals they had accessed in the past 12 months for their diabetes care and who they rely on most for their diabetes care.
General Practitioners (GPs) were the most commonly accessed health professionals (91%, n=1,947) across all diabetes types (Table 6).
Those with type 2 diabetes most frequently relied upon their GP (70%, n=808) for diabetes care, while those with type 1 diabetes most frequently relied upon their endocrinologist (49%, n=481).
Respondents were also asked to indicate how much of a burden these self-care activities are to them, using the response options: not at all, somewhat, considerable or a great burden. Following a healthy diet was regarded a ‘considerable’ or ‘a great burden’ to 35% (n=715) of respondents. Those with insulin-treated type 2 diabetes regarded it as more of a burden than those with type 1 or non-insulin-treated type 2 diabetes.
Regular physical activity was also regarded as a ‘considerable’ or ‘a great burden’ by 35% (n=714) of respondents. Those with insulin-treated type 2 diabetes considered it as more of a burden than those with type 1 or non-insulin-treated type 2 diabetes.
Self-Monitoring of Blood Glucose (SMBG)As expected, frequency of blood glucose monitoring was higher among those using insulin to manage their diabetes. Of those with type 1 diabetes who check every day, 55% (n=490) reported checking four to six times per day. By contrast, of those with insulin- treated type 2 diabetes who check daily, 11% (n=40) check five to seven times daily, with most checking one to three times per day (67%, n=242). Almost all (92%, n=223) respondents with non-insulin-treated type 2 diabetes who check every day, did so one to three times.
Nearly half of respondents with type 2 diabetes (45%, n=563) do not check their blood glucose levels daily, while this was true for only 5% (n=58) of those with type 1 diabetes. Overall, most respondents (77%, n=1,545) perceived blood glucose monitoring to be ‘considerably’ or ‘very’ important to them.
f A method of monitoring blood glucose at set times over at least three consecutive days. It is useful for generating a pattern, which can be used to inform and monitor changes in self-care (e.g. eating patterns, physical activity, medications) in consultation with a health professional.

34 Diabetes MILES-2
‘App’ UseRespondents were asked about their use of mobile technology in the management of their diabetes, specifically their use of smartphone or tablet applications (‘apps’). Most respondents (87%, n=1,783) indicated that they do not use apps for the management of their diabetes. The main reason for this (35%, n=627) was that they did not think that apps could help them manage their diabetes. This was consistent across all diabetes types.
A higher proportion of respondents with type 1 diabetes (20%, n=193) used apps compared with those with insulin-treated or non-insulin-treated type 2 diabetes (6%, n=27; 7%, n=41 respectively). Those with type 1 diabetes were most likely to use apps for carbohydrate counting (74%, n=143), while respondents with type 2 diabetes were most likely to use apps for recording blood glucose levels (60%, n=43).
Group EducationOver one third of respondents (37%, n=802) had previously attended group education for their diabetes; slightly higher among respondents with type 1 diabetes (40%, n=399) compared to those with insulin-treated or non-insulin-treated type 2 diabetes (35%, n=174; 34%, n=229 respectively). Of those who had never attended group education, over one third (36%, n=482) indicated that they would like to in the future. Again, a slightly higher proportion of these respondents had type 1 diabetes (41%, n=243) than insulin-treated type 2 diabetes (34%, n=105) or non-insulin-treated type 2 diabetes (31%, n=134).
Overall, most respondents (74%, n=587) that had attended group education regarded it to be ‘helpful’ or ‘very helpful’. This was a consistent trend across diabetes types.
Health Professional Type 1 Type 2 Type 2 Total sample n=986 Insulin Non-insulin N=2,152 n=496 n=670
GP 832 (84) 465 (94) 650 (97) 1,947 (91)
Endocrinologist 738 (75) 219 (44) 100 (15) 1,057 (49)
Diabetes educator 531 (54) 211 (43) 190 (28) 932 (43)
Dietitian/nutritionist 284 (29) 130 (26) 160 (24) 574 (27)
Optometrist/ophthalmologist 757 (77) 383 (77) 471 (70) 1,611 (75)
Podiatrist 405 (41) 272 (55) 347 (52) 1,024 (48)
Mental health professional 132 (13) 50 (10) 52 (8) 234 (11)
Table 6. Health professionals accessed for diabetes care in the past 12 months
Note: Data are presented as n (%).
352016 Survey Report
“It would be great to see psychologists/psychiatrists included in type 1 diabetes treatment.”
– Woman with type 1 diabetes, aged 28

36 Diabetes MILES-2
Discussion
Those with type 1 diabetes also reported the lowest levels of perceived social support of all groups, and many respondents perceived and experienced diabetes stigma. Interestingly, those with type 1 diabetes were the most likely to engage in peer support for their diabetes, which may be a reflection of their perceived lack of social resources or a perception that living with type 1 diabetes can only really be understood by others who also live with the condition.
Respondents with Type 2 Diabetes using InsulinRespondents with insulin-treated type 2 diabetes were the oldest group (mean age > 60 years) and made up 23% of the total sample, with more men (60%) taking part than women. The response profile of these respondents appears to be aligned more closely, in many respects, to those with type 1 diabetes than their non-insulin-treated counterparts with type 2 diabetes.
Overall, the self-reported health and psychosocial outcomes of these respondents appeared to be worse than it was among the other groups. This may be reflective of the challenges associated with the older age of this group, and the increased likelihood that they have co-morbid health conditions or concerns unrelated to their diabetes. Coping with the progressive nature of their diabetes, in addition to other health concerns, may contribute to the burden they experience. These respondents experienced increased challenges with their health, reporting the highest number of diabetes-related complications and the highest BMI of all groups. Though the difference was only marginal, they also had a higher HbA1c (mean of 7.5%, or 58.5 mmol/mol) compared to other groups. Furthermore, these respondents engaged in healthy eating and physical activity less frequently, and regarded these self-care activities as less important than other groups. Health professionals must remain aware of the unique needs of this group, who may require additional resources, such as psychosocial support or information, in order to fully engage with their diabetes. This is particularly important as the condition progresses.
On average, adults with insulin-treated type 2 diabetes had the most severe depressive and anxiety symptoms, and were the most likely to self-report current or past diagnosis of a mental health condition. ‘Dietary freedom’ was the aspect of life most negatively impacted by their diabetes. While those with type 1 diabetes had the highest diabetes distress scores, respondents with
The second Diabetes MILES – Australia survey (MILES-2) was completed by more than 2,300 Australian adults with type 1 or type 2 diabetes. The strong emphasis on the experience of the person living with diabetes, as opposed to diabetes itself, means this survey’s findings provide an important snapshot of the psychological, social and behavioural challenges faced by this group nationally, and highlight unmet needs and priority areas for support.
The current study builds on the previous Diabetes MILES study initiatives to deliver Australia’s second large-scale assessment of the psychosocial aspects of type 1 and type 2 diabetes, and to introduce novel topics of investigation at a population level.
Similar to the MILES 2011 survey, the MILES-2 survey found that adults with type 1 and type 2 diabetes have different response profiles across various domains, and that the response profiles of adults with type 2 diabetes also differ according to treatment type (i.e. insulin and non-insulin). This suggests that unique concerns and unmet needs exist for each group. Thus, the MILES-2 findings are discussed here by diabetes type and treatment.
Respondents with Type 1 Diabetes Survey respondents with type 1 diabetes made up 46% of the total sample, with more women (59%) taking part than men. Unsurprisingly, those with type 1 diabetes were, on average, younger compared to those with type 2 diabetes, and had lived with the condition for a longer period of time. Despite having lived with diabetes for longer, respondents with type 1 diabetes had the fewest diabetes-related complications of all groups (i.e. compared to respondents with non-insulin-treated and insulin-treated type 2 diabetes). On average, their self-reported HbA1c (mean of 7.4%, or 57.4 mmol/mol) was only slightly above the recommended target range. From a physical point of view, respondents with type 1 diabetes appeared to be managing their health well, as compared to the other groups: they had the lowest BMI of all diabetes types/treatment groups, and were engaging in healthy eating and regular physical activity more frequently than those with type 2 diabetes.
Respondents with type 1 diabetes had higher diabetes distress than those with type 2 diabetes, and they regarded their ‘emotional well-being’ as the aspect of life most negatively impacted by their condition. This suggests that, for some, the relatively successful management of their physical health may be achieved at the expense of their emotional and social well-being.

372016 Survey Report
“Even though my diagnosis was a shock and upsetting to me, I feel as though it was a wake-up call for me to take stock and look after myself. I am now looking towards a healthier future and a longer life. So, in some ways my diabetes has given me a new lease on life.”
– Woman with type 2 diabetes, aged 45

38 Diabetes MILES-2
Comparison of Findings from the MILES 2011 and 2015 Surveys The first (2011) and second (2015) Diabetes MILES – Australia national survey studies were conducted four years apart, and thus provide two comparable ‘snapshots’ of the psychological, social and behavioural aspects of living with type 1 or type 2 diabetes in Australia. While the first Diabetes MILES – Australia findings were widely disseminated (e.g. through reports and publications, conference presentations, symposia, health professional training and talks at consumer events), many of the psychosocial issues and unmet needs identified in the 2011 survey appear to remain.
The MILES-2 findings are strikingly consistent with the results of the first Diabetes MILES – Australia survey. For example, emotional well-being remains a prominent issue for people with diabetes, and a substantial minority experience clinically relevant psychological problems. Approximately one in five respondents experienced severe diabetes distress, and a quarter experienced moderate-to-severe depressive symptoms; rates that are very similar to those found in 2011. Despite these high rates, only 8% of MILES 2011 respondents and 11% of MILES-2 respondents indicated that they had accessed a mental health professional in the past 12 months to help with their diabetes. Whilst there has been a slight increase in mental health professional access between surveys, these rates are still low. This may be reflective of the healthcare priorities of Australians living with diabetes, or the lack of mental health professionals (especially those with expertise in diabetes) in Australian healthcare settings. Thus, ensuring that people with diabetes have appropriate emotional and mental health support – from their diabetes and general health professionals – remains a national priority. Indeed, this has been recognised as a priority area in the new Australian National Diabetes Strategy 2016–2020.22 Routine monitoring of emotional and mental health issues and ensuring these are addressed appropriately (by diabetes health professionals or referral as needed to mental health specialists) are integral to optimising diabetes care. A new NDSS handbook for health professionals23 provides practical resources to enable health professionals to support the emotional and mental health needs of people with diabetes.
In addition to the psychological unmet needs of people with diabetes, the MILES-2 survey revealed that Australian adults with diabetes face social challenges, again consistent with the 2011 survey results. Many respondents perceived a lack of social support around their diabetes self-management and coping.
insulin-treated type 2 diabetes closely followed, with scores more similar to those with type 1 diabetes than non-insulin-treated type 2 diabetes. This pattern of responses was also evident in regard to levels of perceived social support. Furthermore, those with insulin-treated type 2 diabetes perceived and experienced more diabetes-related stigma than those with non-insulin-treated type 2 diabetes.
Respondents with Type 2 Diabetes not using InsulinSurvey respondents with non-insulin-treated type 2 diabetes made up 31% of the total sample with more men (55%) than women taking part. The response profile of those with non-insulin-treated type 2 diabetes was very different from those with type 1 or insulin-treated type 2 diabetes, possibly because of the way in which their diabetes was managed; 70% used blood glucose lowering tablets as their primary treatment, while 24% used lifestyle modifications.
Though they had a slightly higher level of diabetes- related complications, and, on average, a higher BMI than respondents with type 1 diabetes, their average HbA1c (mean of 6.8%, or 50.8 mmol/mol) was lower than both other groups, and within the recommended target range.9
From a psychosocial perspective, respondents with non-insulin-treated type 2 diabetes were faring better than other groups. They had the lowest levels of depressive and anxiety symptoms, and least diabetes distress of all groups. They also perceived and experienced somewhat less diabetes-related stigma compared to the insulin-treated type 2 group, and reported the highest perceived social support. Like those with insulin-treated type 2 diabetes, when asked which aspect of life was most negatively impaired by their diabetes, they indicated it was their ‘dietary freedom’. While these respondents experienced fewer physical and psychosocial problems than both other groups, many of the respondents with type 2 non-insulin-treated diabetes still exhibited sub-optimal psychological, social and behavioural outcomes. It is important to remain aware that, as their diabetes progresses over time, changes in their diabetes self-management (e.g. more tablets, starting insulin) is likely to impose new challenges for these adults with type 2 diabetes. Therefore, it is necessary to monitor both the physical and psychosocial well-being of this group as their diabetes progresses. Regular screening of emotional health issues is one way to prevent the onset of more serious problems, such as diabetes burnout.

392016 Survey Report
with some being unenthusiastic about this approach or even being discouraging about its usefulness. Health professionals need to fully support structured education as it is an evidence-based approach to improving diabetes management.28 Health professionals and people with diabetes may need greater awareness of the relevance of such programs, where they are available (in metropolitan, regional and rural areas), how such programs can be accessed (e.g. online, face-to-face), and what these programs involve.
Overall, the findings of the Diabetes MILES and MILES-2 surveys are comparable, suggesting that the unmet needs identified in 2011 are still prominent issues today that require further attention and consideration. Some respondents completed both the 2011 and 2015 surveys, though we have not been able to report on this sub-sample here. Using this longitudinal dataset will enable us to explore what changes, if any, have occurred over the past four years, and the reasons for any changes. These results will be important for determining what may have been effective at producing positive changes to people with diabetes.
Self-reported health and psychological outcomes in MILES-2 do not appear to differ much from the findings of the first MILES survey in 2011. However, it is reasonable to expect that effecting change in psychological, social and behavioural aspects of living with diabetes will take both time and the support of health professionals, with prioritisation of the holistic needs of people with diabetes.
Strengths and LimitationsThe survey methods used were successful in generating a diverse sample: gender balance, a wide age range, a variety of ethnicities and socio-economic backgrounds, and a mix of people living in metropolitan, regional and rural areas in all states and territories of Australia. Relative to the stratification method used, those with type 1 diabetes were slightly over-represented in the sample, which may reflect a generally higher level of engagement in diabetes-related research in this group. Those with type 1 diabetes using an insulin pump were over- represented (35%) in the sample, but this was not due to intentional over-sampling. Pump users may be more engaged in research because they perceive themselves to benefit from advances in knowledge, or it may be reflective of the fact that pump users tend to be more highly educated and from higher socio-economic backgrounds (and therefore more likely to engage in research), relative to non-pump users.29
Furthermore, only one in ten were participating in peer support programs/initiatives – the same rate of participation observed in 2011. More efforts are required to promote existing peer support communities, and engage people with these groups, particularly online-based communities, as many people with diabetes have a preference for this mode of delivery. Online peer support may also remove barriers to access for those who, as shown in the current study, perceive or experience stigma associated with their diabetes. Health professionals are encouraged to be mindful of the social impacts of diabetes (e.g. stigma) when making referrals to peer support groups. People who experience diabetes stigma may be more vulnerable in social situations where they may fear being negatively judged or blamed for having diabetes. Therefore it is important to respond appropriately to the unique needs of each person. Health professionals are also encouraged to be aware of the various peer support initiatives that exist in their areas, including those that are online, so that they can readily refer them to people when appropriate.
The self-management behaviours and physical health outcomes of MILES-2 respondents are also comparable to the 2011 survey participants. Across the board, adults with type 1 and type 2 diabetes have difficulties in engaging in healthy eating or physical activity as recommended. It is important to note that this is also true of the general Australian population.24,25 However, people with diabetes have an even greater imperative to engage in these healthy behaviours, as they form part of an optimal self-management regimen for the prevention or delay of diabetes-related complications. Health professionals need to continue helping people with diabetes address the barriers to healthy lifestyle habits. This includes providing information about what constitutes a healthy lifestyle in a non- judgemental and non-threatening way, working collaboratively to set achievable goals, and follow-up on these goals, or making referrals (as needed) to appropriate health care providers, e.g. diabetes educators, dietitians or exercise physiologists.
Structured diabetes education is also an important consideration within the clinical context. In both the MILES and MILES-2 surveys, approximately half the respondents had never been offered structured group education, despite international guidelines recommendations specifying otherwise.26 Evidently, little progress has been made in the time between these surveys to increase healthcare professional referrals to structured/group education. A recent review identified that health professionals do not routinely recommend structured education,27
40 Diabetes MILES-2
“Thank you for the opportunity to take part in this survey. Living with diabetes is a complex journey.”
Man with type 2 diabetes, aged 53
412016 Survey Report
Therefore, the smaller sample size in MILES-2 may simply be a reflection of a broader issue with online research.
Despite these limitations, the MILES-2 survey was an economical approach to surveying a wide range of Australian adults with diabetes within a relatively short time-frame. The qualitative feedback from respondents (see page 21) indicated that the survey was well received, with topics being relevant, and the experience of taking part being helpful for clarifying their thoughts and feelings about their diabetes. Overall, MILES-2 is a success, based on the large sample size, cost-effective survey methods, and the breadth and depth of the findings.
Future Directions Analysis of MILES-2 results is ongoing, and like the 2011 MILES survey, the findings will be widely disseminated through national and international conferences, peer-review publications and consumer forums.
It was beyond the remit of this report to conduct longitudinal analyses using data of those who participated in both the 2011 and 2015 surveys. However, we do plan to explore the predictors and consequences of psychological distress and sub-optimal behavioural diabetes management in a non-clinical, population-based sample across the two time-points. This will be the first study of its kind in Australia that will attempt to track the natural trajectory of psychosocial problems in people with diabetes and to investigate any social, economic and/or demographic factors that may contribute to differences in psychosocial experiences.
It is our intention to conduct further surveys in the future to continue to follow all respondents who have indicated willingness to continue their participation in MILES studies. This will enable us to build on the existing longitudinal dataset using a third wave of data collection, and to increase the sample size and breadth of survey topics available in the longitudinal sample.
Conclusions The MILES-2 study builds on the previous Diabetes MILES initiatives, providing new knowledge and novel insights into the experience of living with type 1 or type 2 diabetes among Australian adults. The depth and breadth of the data available in this large sample raises further awareness of the psychosocial impact of living with diabetes, highlights continuing unmet needs and priority areas for future investigation, and may be used to inform health policy, clinical practice, program and intervention development, and evaluation.
Amongst respondents with type 2 diabetes, 42% were using insulin which is almost double the proportion observed on the NDSS database (24%), but less than intended given the purposeful sampling stratification (50%). Based on our previous research, Australian adults with type 2 diabetes who use insulin (compared with those not using insulin) have a longer diabetes duration,3 are more likely to have at least one diabetes-related complication,30,31 and are more likely to have depressive and anxiety symptoms.3 These factors may make them less likely to engage in research.
All study respondents were asked to self-report their most recent HbA1c level. Whilst this is a common, non-invasive method of obtaining glycaemic outcome data in research, people with diabetes tend to either forget or inaccurately report the data.32 This has implications for research exploring how HbA1c relates to other areas of life (e.g. emotional health), as well as having implications within the clinical context.
The survey was offered only in English, thus limiting participation among those Australians who do not feel confident to complete a survey in English. Compared with the general population in Australia, the current sample was more likely to speak English as their main language, to be married or in a de facto relationship, to be in paid employment, and have qualifications beyond high school level.33 This suggests that those who took part are relatively advantaged, and are likely to have more social resources, better health literacy and greater access to health services than Australians with diabetes generally. A very small proportion of respondents identified as being of Aboriginal and Torres Strait Islander (ATSI) heritage, suggesting that this population was not well represented in the current study and that other means are needed to identify the impact of diabetes on their emotional well-being and related outcomes.
The MILES-2 sample size (N=2,342) was notably smaller than the 2011 sample (N=3,338), and there are a number of possible explanations for this. Firstly, the online format of the survey may have been a barrier for some people who may not be confident in using (or have access to) a computer or tablet device, or the internet. Secondly, NDSS registrants were contacted frequently with invitations to participate in research during late 2014 and early 2015, and therefore may have been experiencing research fatigue (i.e. when the target population feels bombarded and ceases/reduces engagement with research activities). Lastly, online surveys in general are increasingly common, and decreasing response rates have been observed elsewhere.34

42 Diabetes MILES-2
References
14. Spitzer R, Kroenke K, Williams J, Lowe B. A brief measure for assessing generalized anxiety disorder: The GAD-7. Archives of Internal Medicine, 2006;166(10):1092.
15. Fisher L, Gonzalez J, Polonsky W. The confusing tale of depression and distress in patients with diabetes: A call for greater clarity and precision. Diabetic Medicine, 2014;31(7):764-72.
16. Polonsky W, Anderson B, Lohrer P, Welch G, Jacobson A, Aponte J, Schwartz C. Assessment of diabetes-related distress. Diabetes Care, 1995;18(6):754-60.
17. Nicolucci A, Kovac Burns K, Holt R, Comaschi M, Hermanns N, Ishii H, . . . on behalf of the DAWN2 Study Group. Diabetes Attitudes, Wishes and Needs second study (DAWN2™): Cross-national benchmarking of diabetes-related psychosocial outcomes for people with diabetes. Diabetic Medicine, 2013;30(7):767-77.
18. Browne J, Ventura A, Mosely K, Speight J. Development and validation of the Type 1 and Type 2 Diabetes Stigma Assessment Scales (DSAS-1 and DSAS-2). American Diabetes Association. New Orleans, USA, 2016.
19. Browne J, Ventura A, Mosely K, Speight J. Measuring the stigma surrounding type 2 diabetes: Development and validation of the Type 2 Diabetes Stigma Assessment Scale (DSAS-2). Diabetes Care, 2016;39(12):2141-48.
20. Barrera M, Glasgow R, McKay H, Boles S, Feil E. Do internet-based support interventions change perceptions of social support? An experimental trial of approaches for supporting diabetes self-management. American Journal of Community Psychology, 2002;30(5):637-54.
21. Toobert D, Hampson S, Glasgow R. The Summary of Diabetes Self-Care Activities measure. Diabetes Care, 2000;23:943-50.
22. Australian Government Department of Health. Australian National Diabetes Strategy 2016–2020. Canberra, Australia 2015.
23. Hendrieckx C, Halliday JA, Beeney LJ, Speight J. Diabetes and Emotional Health: A Handbook for Health Professionals Supporting Adults with Type 1 or Type 2 Diabetes. Canberra: National Diabetes Services Scheme 2016.
24. Australian Bureau of Statistics. Australian Health Survey: Physical Activity, 2011–12. Canberra, Australia 2013.
25. Australian Bureau of Statistics. Australian Health Survey: Consumption of Food Groups from the Australian Dietary Guidelines, 2011–12. Canberra, Australia 2016.
26. International Diabetes Federation. Global Guidelines for Type 2 Diabetes. Brussels, Belgium, 2012.
1. Diabetes Australia. Diabetes in Australia. 2015. https://www.diabetesaustralia.com.au/diabetes-in-australia.
2. Speight J, Browne J, Holmes-Truscott E, Hendrieckx C, Pouwer F. The Diabetes MILES (Management and Impact for Long-term Empowerment and Success) Study: Methods and sample characteristics of a national survey of the psychological aspects of living with type 1 or type 2 diabetes in Australian adults. BMC Public Health, 2012;12(120).
3. Speight J, Browne J, Holmes-Truscott E, Hendrieckx C, Pouwer F, on behalf of the Diabetes MILES – Australia reference group. Diabetes MILES – Australia 2011 Survey Report. Diabetes Australia: Canberra, 2011.
4. Australian Institute of Health and Welfare (AIHW). How many Australians have diabetes? 2016. http://www.aihw.gov.au/how-common-is-diabetes/.
5. National Diabetes Services Scheme (NDSS). Data snapshots. 2016. https://www.ndss.com.au/data-snapshots.
6. Baker IDI Heart and Diabetes Institute. Diabetes: The silent pandemic and its impact on Australia. Melbourne: Baker IDI in partnership with Diabetes Australia and JDRF, 2012.
7. Lindstrom J, Louheranta A, Mannelin M, Rastas M, Salminen V, Eriksson J, . . . Finnish Diabetes Prevention Study Group. The Finnish Diabetes Prevention Study (DPS). Diabetes Care, 2003;26:3230-36.
8. Albright AL, Gregg EW. Preventing type 2 diabetes in communities across the U.S: The National Diabetes Prevention Program. American Journal of Preventative Medicine, 2013;44(4):S346-S51.
9. Cheung N, Conn J, d’Emden M, Gunton J, Jenkins A, Ross G, . . . Twigg S. Position statement of the Australian Diabetes Society: Individualisation of glycated haemoglobin targets for adults with diabetes mellitus. Medical Journal of Australia, 2009;191(6):339.
10. Gold A, Macleod K, Frier B. Frequency of severe hypoglycaemia in patients with type 1 diabetes with impaired awareness of hypoglycemia. Diabetes Care, 1994;17(7):697-703.
11. Australian Institute of Health and Welfare (AIHW). Body weight. 2016. http://www.aihw.gov.au/body-weight/.
12. Kroenke K, Strine TW, Spitzer RL, Williams JBW, Berry JT, Mokdad AH. The PHQ-8 as a measure of current depression in the general population. Journal of Affective Disorders, 2009;114(1-3):163-73.
13. Browne J, Nefs G, Pouwer F, Speight J. Suicidal ideation or non-suicidal self-harm? A mismatch between the DSM-IV criterion and PHQ-9 item nine. Diabetes Research and Clinical Practice, 2015;108(1):e5-e6.

432016 Survey Report
40. Earnshaw V. Chronic Illness and Anticipated Stigma. University of Connecticut, 2011.
41. Lillis J, Luoma J, Levin M, Hayes S. Measuring weight self-stigma: The Weight Self-Stigma Questionnaire. Obesity, 2010;18(5):971-76.
42. Crawford J, Smith G, Maylor E, Della Sala S, Logie R. The Prospective and Retrospective Memory Questionnaire (PRMQ): Normative data and latent structure in a large non-clinical sample. Memory, 2003;11(3):261-75.
43. Fitzgerald J, Davis W, Connell C, Hess G, Funnell M, Hiss R. Development and validation of the Diabetes Care Profile. Evaluation & Health Professions, 1996;19(2):208-30.
44. van der Ven N, Weinger K, Yi J, Pouwer F, Ader H, van der Ploeg H, Snoek F. The Confidence in Diabetes Self-Care Scale. Diabetes Care, 2003;26(3):713-18.
45. Polonsky W, Fisher L, Snoek F, Weinger K, Jelsovsky Z, Parkin C. Evaluation of the Confidence in Diabetes Scale (CIDS-2) for patients with poorly controlled T2DM. American Diabetes Association’s 69th Scientific Sessions. New Orleans, USA, 2009.
46. Snoek F, Skovlund S, Pouwer F. Development and validation of the Insulin Treatment Appraisal Scale (ITAS) in patients with type 2 diabetes. Health Quality of Life Outcomes, 2007;5(1):69.
47. Polonsky W, Fisher L, Guzman S, Villa-Caballero L, Edelman S. Psychological insulin resistance in patients with type 2 diabetes: The scope of the problem. Diabetes Care, 2005;28(10):2543-45.
48. Singh H, Gonder-Frederick L, Schmidt K, Ford D, Vajda K, Hawley J, Cox D. Assessing hyperglycemia avoidance in people with type 1 diabetes. Diabetes Management, 2014;4(3):263-71.
49. Speight J, Barendse S, Inkster B, Fier B, Shaw J. Psychometric validation of a novel measure of impaired awareness of hypoglycemia: The Hypoglycemia Awareness Questionnaire (HypoA-Q). American Diabetes Association 73rd Scientific Sessions. Chicago, USA, 2013.
50. Deary I, Hepburn D, Macleod K, Frier B. Partitioning the symptoms of hypoglycaemia using multi-sample confirmatory factor analysis. Diabetologia, 1993;36(8):771-77.
51. Rosenberg M. Society and the adolescent child. Princeton, NJ: Princeton University Press, 1965.
52. Raes F, Pommier E, Neff K, Van Gucht D. Construction and factorial validation of a Short Form of the Self- Compassion Scale. Clinical Psychology & Psychotherapy 2011;18(3):250-55.
27. Horigan G, Davies M, Findlay-White F, Chaney D, Coates V. Reasons why patients referred to diabetes education programmes choose not to attend: A systematic review. Diabetic Medicine, 2016. doi:10.1111/dme.13120.
28. Speight J, Deakin T. How can we improve uptake of structured diabetes education? Diabetes Digest, 2016;15(23):76-77.
29. Australian Institute of Health and Welfare (AIHW). Insulin pump use in Australia. Diabetes series no. 18. Canberra: AIHW, 2012.
30. Holmes-Truscott E, Skinner T, Pouwer F, Speight J. Negative appraisals of insulin therapy are common among adults with type 2 diabetes using insulin: Results from Diabetes MILES – Australia cross-sectional survey. Diabetic Medicine, 2015;32(10):1297-303.
31. Holmes-Truscott E, Skinner T, Pouwer F, Speight J. Explaining psychological insulin resistance in adults with non-insulin-treated type 2 diabetes: The roles of diabetes distress and current medication concerns: Results from Diabetes MILES – Australia. Primary Care Diabetes, 2016;10(1):75-82.
32. Heisler M, Piette JD, Spencer M, Kieffer E, Vijan S. The relationship between knowledge of recent HbA1c values and diabetes care understanding and self-management. Diabetes Care, 2005;28:816-22.
33. Australian Bureau of Statistics. 4102.0 - Australian Social Trends 2008. Canberra: ABS, 2008.
34. Sax L, Gillmartin S, Bruyant A. Assessing response rates and non-response bias in web and paper surveys. Research in Higher Education, 2003;44(4):409-32.
35. Bech P. Measuring the dimension of psychological general well-being by the WHO-5. Quality of Life Newsletter, 2004;32:15-16.
36. International Wellbeing Group. Personal Wellbeing Index. Melbourne: Australian Centre on Quality of Life: Deakin University, 2006.
37. Polonsky W, Fisher L, Earles J, Dudi R, Mullan J, Jackson R. Assessing psychosocial distress in diabetes: Development of the Diabetes Distress Scale. Diabetes Care, 2005;28(3):626-31.
38. Fisher L, Polonsky W, Hessler D, Masharani D, Blumer I, Peters A, . . . Bowyer V. Understanding the sources of diabetes distress in adults with type 1 diabetes. Journal of Diabetes Complications, 2015;29(4):572-77.
39. Molina Y, Choi S, Cella D, Rao D. The Stigma Scale for Chronic Illnesses 8-Item Version (SSCI-8): Development, validation and use across neurological conditions. International Journal of Behavioural Medicine, 2013;20(3):450-60.

44 Diabetes MILES-2
Appendix I: Variables included in Diabetes MILES-2 Survey
Physical and mental health comorbidities and complications, height and weight, smoking status, health insurance and pension
Access to providers in last 12 months, main provider, group structured education
Weight Self-Stigma Questionnaire (WSSQ)41
Diabetes Support Scale (DSS)20
Prospective and Retrospective Memory Questionnaire (PRMQ)42
Social Support subscale of Diabetes Care Profile (DCP)43
Study-specific items
Health background
Healthcare
Weight stigma
Social support
Memory
Peer support
Type 2 Diabetes Stigma Assessment Scale (DSAS-2)19
Stigma Scale for Chronic Illnesses – 8 item version39
DAWN Impact of Diabetes Profile (DIDP)17
6 study-specific items about portrayal of diabetes in the media
Centrality Scale40
Gender, state, postcode, country of birth, language, marital status, living situation, income, employment, education
Diabetes duration, diabetes treatment
Diabetes organisation membership, how they heard about survey
World Health Organisation Well-being Index (WHO-5)35
Problem Areas In Diabetes Scale (PAID)16
General life satisfaction (single item)36
Diabetes Distress Scale (DDS)37
Patient Health Questionnaire (PHQ-8)12
Type 1 Diabetes Distress Scale (T1-DDS)38
Generalised Anxiety Disorder scale (GAD-7)14
Type 1 Diabetes Stigma Assessment Scale (DSAS-1)18
Diabetes type, age, live in AustraliaEligibility screen
Demographic and socio-economic details
Diabetes details
Other
General emotional well-being
Diabetes-specific distress
Depressive symptoms
Anxiety symptoms
Diabetes-related and generic stigma
Quality of life
Illness centrality
Concept/topic Measure or variable Diabetes type
Demographics
My General Well-being
My Feelings about Diabetes
My General Health
Support from Health Professionals, Family and Friends
T1 & T2
T1 & T2
T1 & T2
T1 & T2
T1 & T2
T1 & T2
T1 & T2
T1 & T2
T1 & T2
T1 & T2
T1
T1
T2
T1 & T2
T1 & T2
T1 & T2
T1 & T2
T1 & T2
T1 & T2
T1 & T2
T1 & T2
T1 & T2
T1 & T2
T1 & T2

452016 Survey Report
Diet and physical activity subscales of the Summary of Diabetes Self-Care Activities (SDSCA)21
Study-specific items: dietary behaviours
Study-specific items: physical activity behaviours
Edinburgh Hypoglycaemia Survey (EHS)50
Rosenberg Self-Esteem Scale (RSE)51
Free-text box inviting participants to make any other comments
Modified Importance and Burden items (for diet, physical activity, blood glucose monitoring) from the Summary of Diabetes Self-Care Inventory – Revised (unpublished)
Study-specific items assessing frequency/time of day for injections/bolusing, frequency of forgetting and skipping injections/bolus/medication dose, reasons for forgetting/skipping
Study-specific items: blood glucose monitoring
Gold Score10
Self-Compassion Scale Short Form (SCS-SF)52
Study-specific items
Two items adapted from the Hyperglycaemia Avoidance Scale48
Confidence In Diabetes Self-Care (CIDS) (insulin-using)44 and non-insulin using versions45
Study-specific items
Study-specific items (some based on the Hypoglycaemia Awareness Questionnaire)49 to assess frequency, hospitalisation, insulin adjustment in response to hypoglycaemia, impaired awareness of hypoglycaemia
Insulin Treatment Appraisal Scale (ITAS)46
‘Willingness to begin insulin’ single item47
Self-care
Self-esteem
Other
Diabetes treatment
Self-compassion
HbA1c
Hyperglycaemia
Diabetes-specific self-efficacy
App use for self- management support
Hypoglycaemia
Psychological insulin resistance
My Diabetes
T1 & T2
T1 & T2
T1 & T2
T1 & T2
T1 & T2
T1 & T2
T1 & T2
T1 & T2
T1 & T2
T2
T2
T1 & T2
T1 & T2
T1 & T2
T1 & T2
T1 & T2
T1 & T2
T1 & T2
Note: The MILES-2 survey was tailored to diabetes type/treatment. Therefore, not all variables were administered to all respondents.
My Blood Glucose Levels
My Thoughts and Beliefs

46 Diabetes MILES-2
Appendix II: Scales Included in Report
Name Description
The six-item scale measures diabetes-specific quality of life, with each item referring to a life domain associated with diabetes. Respondents are asked to indicate the perceived level of impact of the life domain on a 7-point scale (1 = A very positive impact; 4 = No impact; 7 = A very negative impact). Respondents are also given the option to indicate ‘not applicable’. Items can be examined individually, or by producing a composite score.
The 12-item scale measures perceived social support for diabetes. Respondents are asked to indicate their level of agreement or disagreement with each item on a 7-point scale (1= Strongly disagree; 7 = Strongly agree). A total score is formed by taking a mean of all items, with higher scores indicating greater perceived social support.
The 7-item scale assess the presence and severity of seven key anxiety symptoms. Respondents rate the frequency with which they have experienced symptoms of anxiety over the past two weeks on a 4-point scale (0 = Not at all; 3 = Nearly every day). Item scores are summed to form a total score out of 21. Scores of 5, 10 and 15 represent cut-points for mild, moderate, and severe anxiety symptoms, respectively.
The single item Gold Score measures hypoglycaemia awareness. The Gold Score asks respondents: “Do you know when your hypos are commencing?” Responses are on a 7-point scale (1 = Always aware; 7 = Never aware). A score of ≥ 4 implies impaired awareness of hypoglycaemia.
The 8-item scale assesses the presence and severity of eight key depression symptoms. Respondents rate the frequency with which they have experienced symptoms of depression over the past two weeks on a 4-point scale (0 = Not at all; 3 = Nearly every day). Item scores are summed to form a total score out of 24. Scores of 5, 10, 15 and 20 represent cut-points for mild, moderate, moderately severe and severe depressive symptoms, respectively.
The 20-item scale measures diabetes distress, defined as distress resulting from diabetes and its management. Each item addresses a different concern or issue associated with diabetes. The extent to which each of these potential concerns is a problem is rated on a 5-point scale (0 = Not a problem; 4 = Serious problem). Item scores are summed, and standardised to a score out of 100. Scores ≥ 40 indicate severe diabetes distress.
The 19-item scales measure perceived and experienced stigma associated with living with either type 1 or type 2 diabetes. Both measures contain three subscales. On a 5-point scale (1 = Strongly disagree; 5 = Strongly agree), respondents rate the extent to which they agree with each statement. Item scores are summed to form a total score (19 to 95), where higher scores indicate greater perceived or experienced diabetes stigma. Subscale scores are also obtained by taking the sum of all items within the subscale.
DAWN2TM Impact of Diabetes Profile (DIDP)17
Diabetes Support Scale (DSS)20
Generalized Anxiety Disorder scale (GAD–7)14
Gold Score10
Problem Areas In Diabetes scale (PAID)16
Patient Health Questionnaire – 8 item version (PHQ–8)12
Type 1/Type 2 Diabetes Stigma Assessment Scale18,19 (DSAS-1 and DSAS-2)

472016 Survey Report

2016 SURVEY REPORT