Embed Size (px)
Citation preview


IntroductionIntroduction
Diabetes - group of diseases that deals with high blood glucose levels Type 1 - Usually found in Children & Young Adults
Body does not produce insulin Only 5% of diabetes cases
Type 2 – Hyperglycemia – body has blood glucose levels higher than normal Body does not use insulin properly Most common form
Gestational Diabetes - Diabetes that shows in pregnant women 2 to 10% of pregnancies Usually occurs during the 24th week of pregnancy Disease not necessarily present before or after (35 to 60%
chance of Type 2 in 10 to 20yrs

Diabetes StatisticsDiabetes Statistics
25.8 million Americans have diabetes (8.3% of US Population)
7 million unaware the have disease In 2010 1.9 million people ages 20 or older were
diagnosed with diabetes Estimated that 79 million have “prediabetes” Diabetes By Gender:
13.0 million Men (11.8% of Men 20 or older) 12.6 million Women (10.8% of Women 20 or older)


ObjectiveObjective
Observe how disease behaves over time
Determine key factors in progression of Diabetes
Compare how disease behaves between men and women

DataData
442 Diabetes Patients Ten Baseline Variables:
Age Sex BMI AVG Blood Pressure Six (6) Blood Serum Measurements
Y ~ Quantitative Measure of Disease Progression after One (1) Year
Statistical AnalysisStatistical Analysis
Linear Regression Assumptions Significance Refine Model
P-VALUE Approach Stepwise Model
Models by Gender Results

SAS Code for Full ModelSAS Code for Full Model

SAS OutputSAS Output(Full Model - ANOVA)(Full Model - ANOVA)

Parameter EstimatesParameter Estimates

Graphs for Full ModelGraphs for Full Model
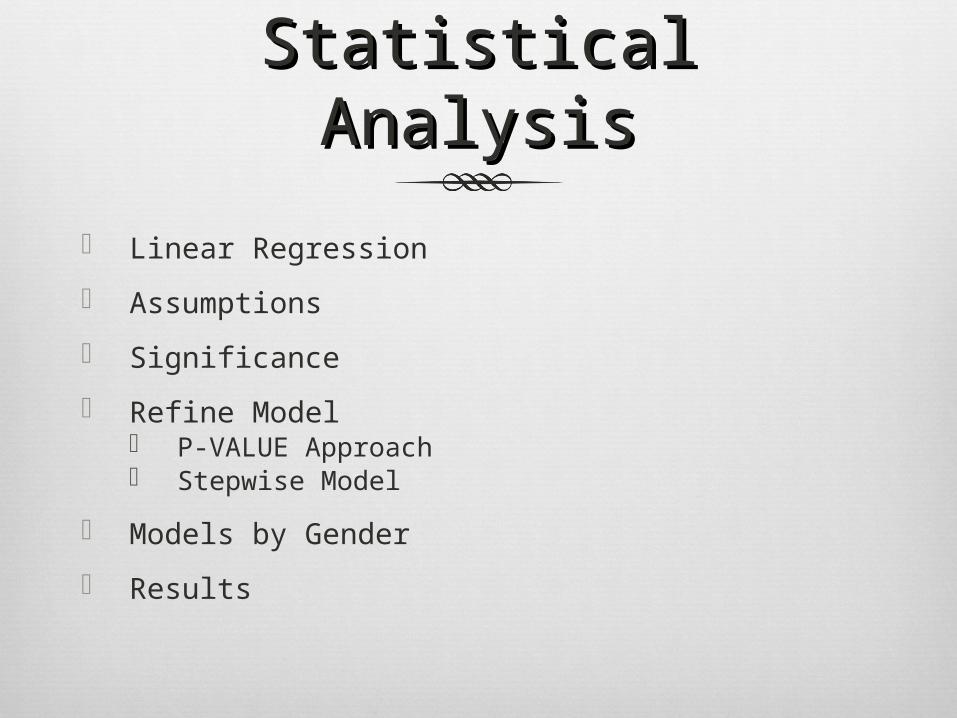
Residual PlotsResidual Plots

Residual Plots Residual Plots (Continued)(Continued)

SAS Code for Reduced Model SAS Code for Reduced Model (P-Value @ alpha =0.05)(P-Value @ alpha =0.05)

SAS OutputSAS OutputReduced Model - ANOVAReduced Model - ANOVA
(P-Value Approach)(P-Value Approach)

P-value ApproachP-value Approach
MODEL: Y= -13.03601SEX +6.44833BMI +1.00866BP
+50.53982S5-328.84936 F-Value = 103.62 -> P-Value <0.0001 R^2 = 0.4868
Residuals do not violate assumptions

Parameter EstimatesParameter Estimates

Graphs for Reduced Graphs for Reduced ModelModel

Residual PlotsResidual Plots(Reduced Model)(Reduced Model)

Reduced Stepwise Reduced Stepwise

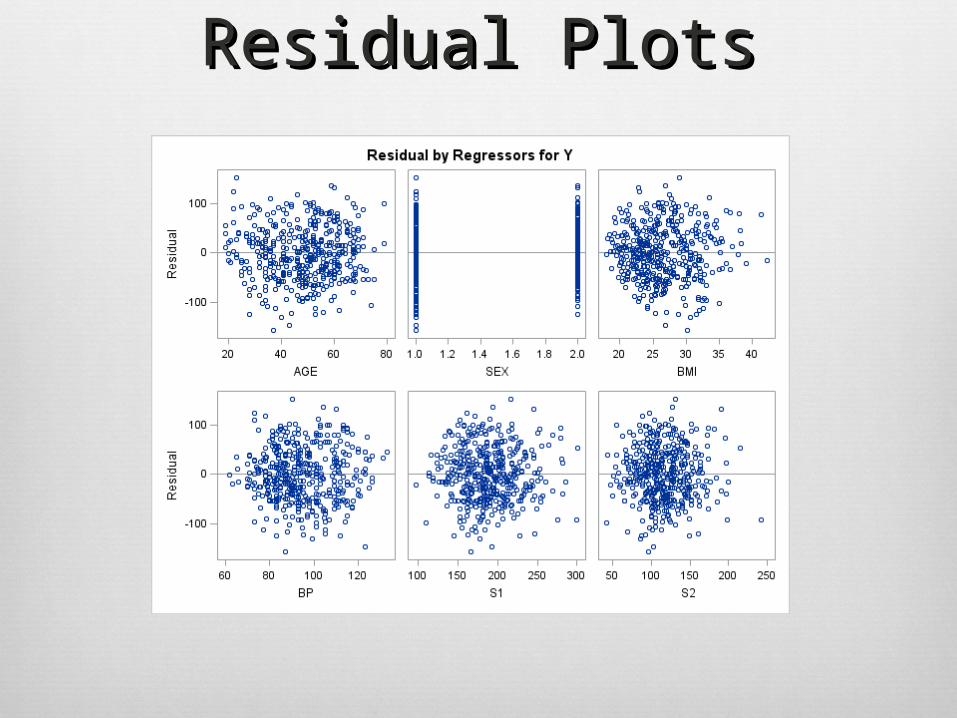
Stepwise FinalStepwise Final

Stepwise Final Stepwise Final (Parameters)(Parameters)

Stepwise ApproachStepwise Approach
MODEL: Y=-21.5910SEX +5.7111BMI + 1.1266BP -
1.0429S1 +0.8433S2 +73.3065S5-313.7666 F-Value = 76.095 -> P-Value <2.2e-16 R^2 =0.5149
Residuals do not violate assumptions

Graphs for Stepwise Graphs for Stepwise ModelModel

Comparison of Reduced Comparison of Reduced & Stepwise Models& Stepwise Models
P-value Approach MODEL:
Y= -13.03601SEX +6.44833BMI +1.00866BP +50.53982S5-328.84936
F-Value = 103.62 -> P-Value <0.0001 R^2 = 0.4868
Stepwise Approach MODEL:
Y=-21.5910SEX +5.7111BMI + 1.1266BP -1.0429S1 +0.8433S2 +73.3065S5-313.7666
F-Value = 76.095 -> P-Value <2.2e-16 R^2 =0.5149

Code for Gender ModelCode for Gender Model
Gender 1 Gender 2
Gender 1 Gender 2

Graphs for Gender 1 Graphs for Gender 2

Residual for FactorsResidual for FactorsGender 1 Gender
2
Comparison of Gender Comparison of Gender ModelsModels
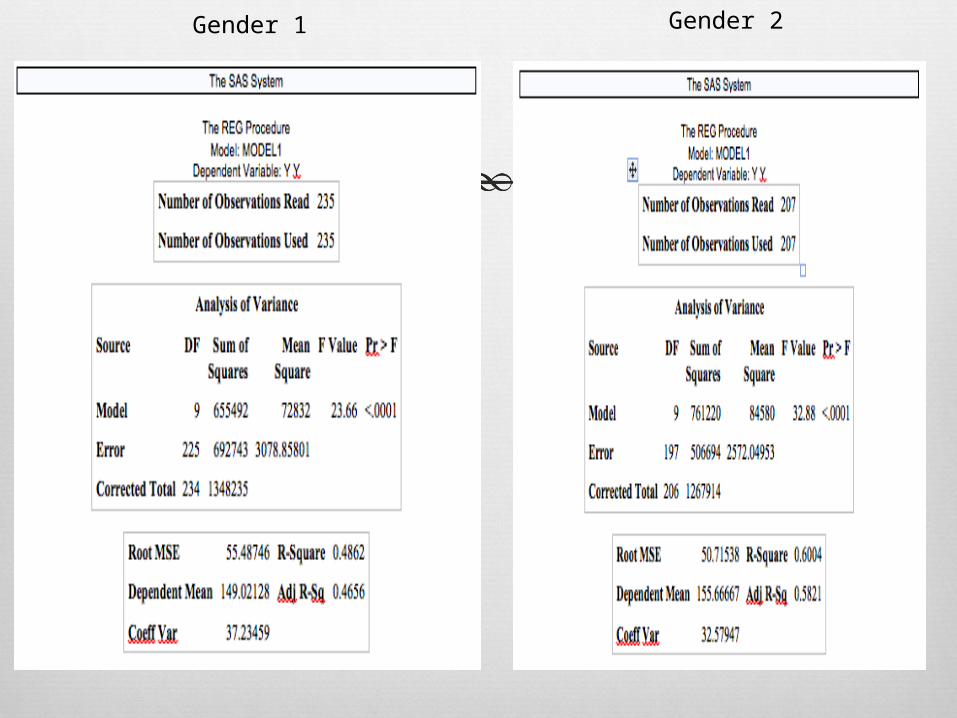
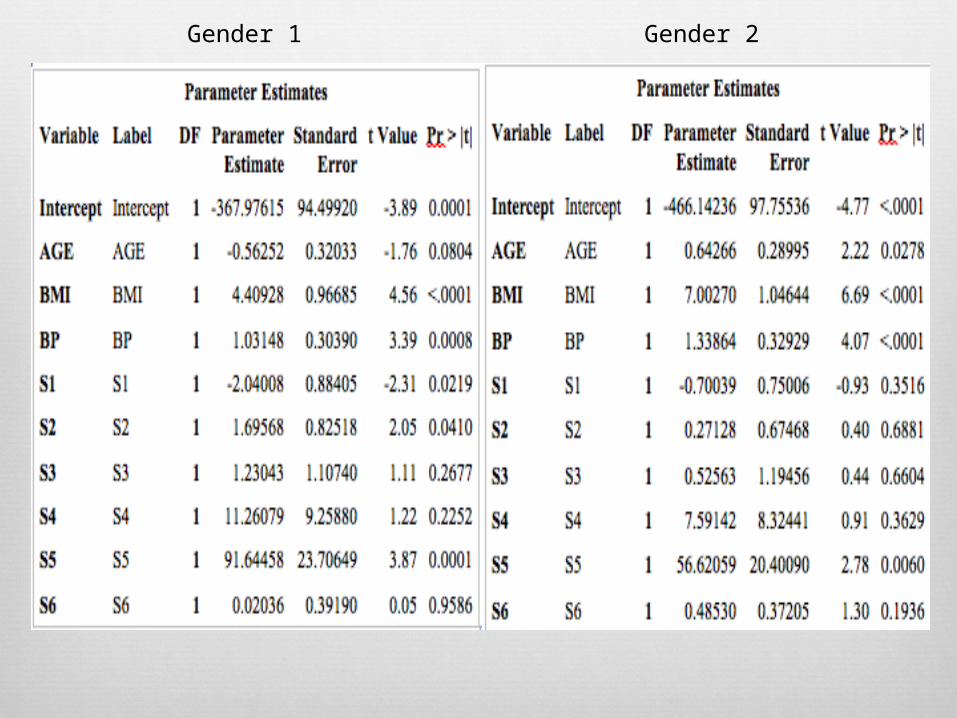
Gender 1 (MALE) Model: F-Value = 23.66 -> P-value <0.0001 R^2 = 0.4862 Influential Parameter: AGE, BMI, BP, S5 Intercept: -367.97615
Gender 2 (FEMALE) Model: F-Value = 32.88 -> P-value <0.0001 R^2 = 0.6004 Influential Parameter: AGE, BMI, BP, S5 Intercept: -466.14236

Analysis ResultsAnalysis Results
Models Full Linear P-Value Reduced Stepwise Model Gender Models
Talk about strength Reduction Methods

ConclusionsConclusions
Findings based on Full VS Reduced Main Influences on Progression of Disease:
GENDER, BMI, BP and S5 Findings Base on Gender Overall Diabetes Results

Recommendations for Recommendations for Future Future
Compare Different Types of Diabetes (Type 1, Type 2, Gestational
Observe over longer period of time Include additional Factors: Ethnicity, Other Health
Factors, Other Behaviors (Smoking, Alcohol Consumption, Exercise Habits, etc.)
Treatments: Diet, Medications, Physical Activities, etc.
Include Comparison of NON-diabetics

Questions? Questions?
ReferencesReferences
Data: http://www4.stat.ncsu.edu/~boos/var.select/
diabetes.tab.txt Description
http://www4.stat.ncsu.edu/~boos/var.select/diabetes.html
LARS Paper http://arxiv.org/pdf/math/0406456.pdf
http://www.diabetes.org Others?