Embed Size (px)
Citation preview
Diagnosis of an Intense Atmospheric River Impacting the Pacific Northwest: StormSummary and Offshore Vertical Structure Observed with COSMIC Satellite Retrievals
PAUL J. NEIMAN, F. MARTIN RALPH, AND GARY A. WICK
NOAA/Earth System Research Laboratory/Physical Sciences Division, Boulder, Colorado
YING-HWA KUO, TAE-KWON WEE, AND ZAIZHONG MA
National Center for Atmospheric Research, Boulder, Colorado
GEORGE H. TAYLOR
Oregon Climate Service, Oregon State University, Corvallis, Oregon
MICHAEL D. DETTINGER
U.S. Geological Survey, Scripps Institution of Oceanography, La Jolla, California
(Manuscript received 1 February 2008, in final form 7 April 2008)
ABSTRACT
This study uses the new satellite-based Constellation Observing System for Meteorology, Ionosphere, andClimate (COSMIC) mission to retrieve tropospheric profiles of temperature and moisture over the data-sparse eastern Pacific Ocean. The COSMIC retrievals, which employ a global positioning system radiooccultation technique combined with “first-guess” information from numerical weather prediction modelanalyses, are evaluated through the diagnosis of an intense atmospheric river (AR; i.e., a narrow plume ofstrong water vapor flux) that devastated the Pacific Northwest with flooding rains in early November 2006.A detailed analysis of this AR is presented first using conventional datasets and highlights the fact that ARsare critical contributors to West Coast extreme precipitation and flooding events. Then, the COSMICevaluation is provided. Offshore composite COSMIC soundings north of, within, and south of this ARexhibited vertical structures that are meteorologically consistent with satellite imagery and global reanalysisfields of this case and with earlier composite dropsonde results from other landfalling ARs. Also, a curtainof 12 offshore COSMIC soundings through the AR yielded cross-sectional thermodynamic and moisturestructures that were similarly consistent, including details comparable to earlier aircraft-based dropsondeanalyses. The results show that the new COSMIC retrievals, which are global (currently yielding �2000soundings per day), provide high-resolution vertical-profile information beyond that found in the numericalmodel first-guess fields and can help monitor key lower-tropospheric mesoscale phenomena in data-sparseregions. Hence, COSMIC will likely support a wide array of applications, from physical process studies todata assimilation, numerical weather prediction, and climate research.
1. Introduction
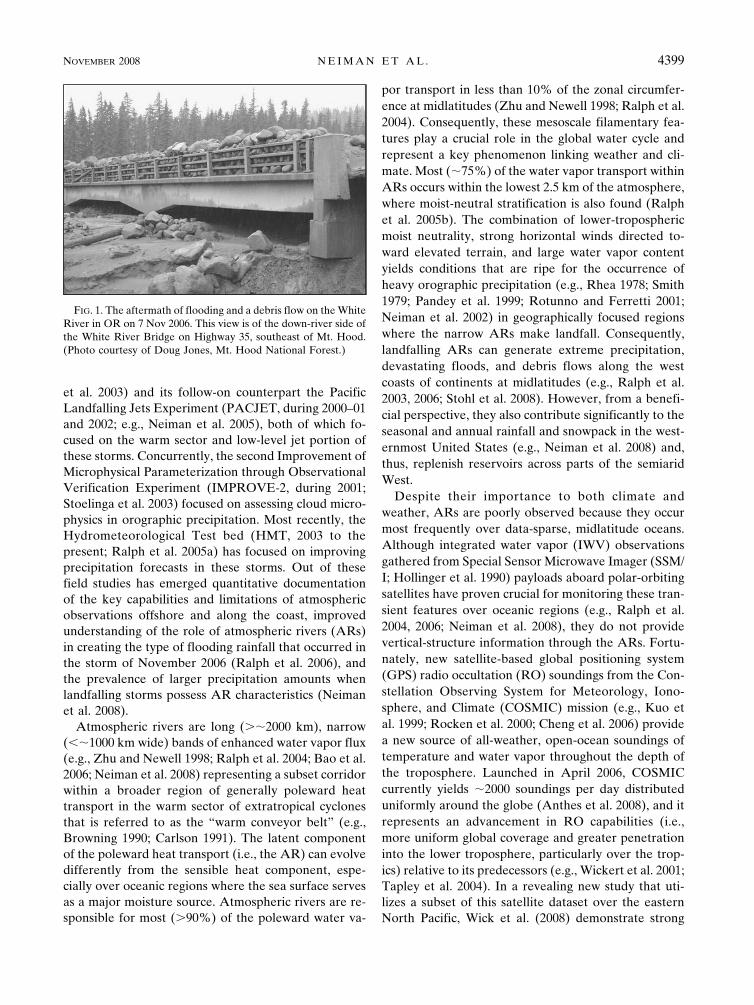
After several days of heavy rainfall in the PacificNorthwest in early November 2006, new rainfallrecords were set, resulting in major flooding and dam-aging debris flows (e.g., Fig. 1). As with past events,
forecasters and numerical models faced the challengeof predicting this storm as it formed and evolved overthe data-sparse Pacific Ocean. Partly in response to thistype of challenge, a number of field studies have takenplace over the eastern Pacific Ocean and along theWest Coast to better understand the key phenomenainvolved, to document the capabilities and limitationsof existing observations and models, and to improve thepredictions of these damaging storms. Over the last 10years, these have included the California Land-FallingJets Experiment (CALJET, during 1997–98; e.g., Ralph
Corresponding author address: Paul J. Neiman, NOAA/EarthSystem Research Laboratory/Physical Sciences Division, MailCode R/PSD2, 325 Broadway, Boulder, CO 80305.E-mail: [email protected]
4398 M O N T H L Y W E A T H E R R E V I E W VOLUME 136
DOI: 10.1175/2008MWR2550.1
© 2008 American Meteorological Society
MWR2550
et al. 2003) and its follow-on counterpart the PacificLandfalling Jets Experiment (PACJET, during 2000–01and 2002; e.g., Neiman et al. 2005), both of which fo-cused on the warm sector and low-level jet portion ofthese storms. Concurrently, the second Improvement ofMicrophysical Parameterization through ObservationalVerification Experiment (IMPROVE-2, during 2001;Stoelinga et al. 2003) focused on assessing cloud micro-physics in orographic precipitation. Most recently, theHydrometeorological Test bed (HMT, 2003 to thepresent; Ralph et al. 2005a) has focused on improvingprecipitation forecasts in these storms. Out of thesefield studies has emerged quantitative documentationof the key capabilities and limitations of atmosphericobservations offshore and along the coast, improvedunderstanding of the role of atmospheric rivers (ARs)in creating the type of flooding rainfall that occurred inthe storm of November 2006 (Ralph et al. 2006), andthe prevalence of larger precipitation amounts whenlandfalling storms possess AR characteristics (Neimanet al. 2008).
Atmospheric rivers are long (��2000 km), narrow(��1000 km wide) bands of enhanced water vapor flux(e.g., Zhu and Newell 1998; Ralph et al. 2004; Bao et al.2006; Neiman et al. 2008) representing a subset corridorwithin a broader region of generally poleward heattransport in the warm sector of extratropical cyclonesthat is referred to as the “warm conveyor belt” (e.g.,Browning 1990; Carlson 1991). The latent componentof the poleward heat transport (i.e., the AR) can evolvedifferently from the sensible heat component, espe-cially over oceanic regions where the sea surface servesas a major moisture source. Atmospheric rivers are re-sponsible for most (�90%) of the poleward water va-
por transport in less than 10% of the zonal circumfer-ence at midlatitudes (Zhu and Newell 1998; Ralph et al.2004). Consequently, these mesoscale filamentary fea-tures play a crucial role in the global water cycle andrepresent a key phenomenon linking weather and cli-mate. Most (�75%) of the water vapor transport withinARs occurs within the lowest 2.5 km of the atmosphere,where moist-neutral stratification is also found (Ralphet al. 2005b). The combination of lower-troposphericmoist neutrality, strong horizontal winds directed to-ward elevated terrain, and large water vapor contentyields conditions that are ripe for the occurrence ofheavy orographic precipitation (e.g., Rhea 1978; Smith1979; Pandey et al. 1999; Rotunno and Ferretti 2001;Neiman et al. 2002) in geographically focused regionswhere the narrow ARs make landfall. Consequently,landfalling ARs can generate extreme precipitation,devastating floods, and debris flows along the westcoasts of continents at midlatitudes (e.g., Ralph et al.2003, 2006; Stohl et al. 2008). However, from a benefi-cial perspective, they also contribute significantly to theseasonal and annual rainfall and snowpack in the west-ernmost United States (e.g., Neiman et al. 2008) and,thus, replenish reservoirs across parts of the semiaridWest.
Despite their importance to both climate andweather, ARs are poorly observed because they occurmost frequently over data-sparse, midlatitude oceans.Although integrated water vapor (IWV) observationsgathered from Special Sensor Microwave Imager (SSM/I; Hollinger et al. 1990) payloads aboard polar-orbitingsatellites have proven crucial for monitoring these tran-sient features over oceanic regions (e.g., Ralph et al.2004, 2006; Neiman et al. 2008), they do not providevertical-structure information through the ARs. Fortu-nately, new satellite-based global positioning system(GPS) radio occultation (RO) soundings from the Con-stellation Observing System for Meteorology, Iono-sphere, and Climate (COSMIC) mission (e.g., Kuo etal. 1999; Rocken et al. 2000; Cheng et al. 2006) providea new source of all-weather, open-ocean soundings oftemperature and water vapor throughout the depth ofthe troposphere. Launched in April 2006, COSMICcurrently yields �2000 soundings per day distributeduniformly around the globe (Anthes et al. 2008), and itrepresents an advancement in RO capabilities (i.e.,more uniform global coverage and greater penetrationinto the lower troposphere, particularly over the trop-ics) relative to its predecessors (e.g., Wickert et al. 2001;Tapley et al. 2004). In a revealing new study that uti-lizes a subset of this satellite dataset over the easternNorth Pacific, Wick et al. (2008) demonstrate strong
FIG. 1. The aftermath of flooding and a debris flow on the WhiteRiver in OR on 7 Nov 2006. This view is of the down-river side ofthe White River Bridge on Highway 35, southeast of Mt. Hood.(Photo courtesy of Doug Jones, Mt. Hood National Forest.)
NOVEMBER 2008 N E I M A N E T A L . 4399
agreement between collocated IWV retrievals fromCOSMIC and SSM/I. However, their study does notexplore the vertical-structure characteristics of theCOSMIC soundings.
The objectives of this paper are to uniquely docu-ment a high-impact AR and to explore and demon-strate the vertical profiling capabilities of the satellite-based COSMIC soundings across the otherwise data-sparse eastern North Pacific Ocean. In addition toadding a new case to the growing evidence of the role ofARs in extreme precipitation events and flooding, theanalysis here explores the potential of a promising newdataset during the landfall of an intense, high-impactAR in the Pacific Northwest of the United States inNovember 2006.
2. Observing systems
The COSMIC soundings represent the key newdataset used and assessed in this study. The COSMICobserving system consists of six satellites, eachequipped with a GPS receiver. By measuring thephase delay of radio waves transmitted by GPS satel-lites as they are occulted by the earth’s atmosphere, theCOSMIC system provides vertical profiles of the radiowaves’ ray bending angles, under the assumption oflocal spherical symmetry of refractivity. From the bend-ing angles, vertical profiles of atmospheric refractivity,which depends on pressure, temperature, and humidity,are derived and assigned to ray tangent points. Detaileddescriptions of the GPS RO technique and data pro-cessing procedures can be found in Kursinski et al.(1997) and Kuo et al. (2004), respectively. It is impor-tant to note that COSMIC refractivity profiles do notprovide point measurements (like a radiosonde).Rather, the inverted refractivity at a given height isrepresented by a horizontally weighted average withthe scale that depends on the vertical gradient of therefractivity. Along a given ray path, this horizontal av-eraging scale ranges from �250 km in the free atmo-sphere to �100 km in the boundary layer. The scaleacross the ray path is �1 km. The impact of the orien-tation of the ray paths was not considered in this study,although the favorable assessment of the COSMICsoundings in documenting the AR of November 2006(see below) would suggest this impact is not large. Thevertical resolution of the retrieved profiles is limited bydiffraction effects and depends on the processing meth-ods. Geometric optical processing applied above thetroposphere results in a Fresnel vertical resolution of0.1–1.0 km. The radio-holographic (RA-HO) process-ing applied in the moist troposphere utilizes the prin-ciple of synthetic aperture and yields a sub-Fresnel
resolution of several tens of meters (Gorbunov et al.2004). In the lower troposphere, the vertical resolutionis �20 to 30 m.
The COSMIC soundings of temperature and watervapor in this study were generated using the COSMICrefractivity profiles in conjunction with a one-dimensionalvariational methodology [see online at the COSMICData Analysis and Archive Center (CDAAC) Website: http://cosmic-io.cosmic.ucar.edu/cdaac/doc/index.html] that requires first-guess profiles such as fromglobal analyses. Separate COSMIC sounding retrievalswere generated using first-guess profiles obtained fromthe analyses of the National Centers for EnvironmentalPrediction (NCEP) Global Forecast System (GFS)model at 1° resolution and the European Centre forMedium-Range Weather Forecasts (ECMWF) modelat 0.5° resolution. Because both first-guess fields yieldsimilar retrieved values of COSMIC IWV (e.g., Wick etal. 2008), the first guess from the GFS is used primarilyhere. Retrievals of temperature in the upper tropo-sphere and stratosphere are relatively accurate becauseof very limited moisture affecting the GPS RO bend-ing-angle measurements. In the lower troposphere,however, retrieving the temperature and water vaporpose challenges because the bending angles are affectedsignificantly by both of these variables. Hence, the one-dimensional variational approach provides one possiblesolution to this ambiguity, although the cost of thismethod is that the retrievals are no longer independentof the numerical model fields that were used as the firstguess. For the purpose of documenting ARs and otherhigh-impact mesoscale phenomena characterized bylarge concentrations of low-level water vapor, the en-hanced vertical resolution of COSMIC soundings in thelower troposphere (atypical of most satellite-derivedsounding products) has great potential to fill a keyover-ocean gap in existing observations.
The SSM/I IWV data used in this study were col-lected from four Defense Meteorological Satellite Pro-gram polar-orbiting satellites that have circled theglobe every �102 min since late 1997. The F13 and F14satellite data were available between 1 October 1997[start of water year (WY) 1998] and the landfalling ARin early November 2006, while the F11 and F15 satel-lites provided additional data from 1 October 1997 to17 May 2000 and from 23 February 2000 to 14 Septem-ber 2006, respectively. IWV data were retrieved fromeach SSM/I sensor in 1400-km-wide swaths over theocean. IWV can be retrieved from the SSM/I sensorusing one of several algorithms, including Schluesseland Emery (1990, hereafter SE) and Wentz (1995).Wick et al. (2008) demonstrated that the Wentz IWVcompared somewhat more favorably with the COSMIC-
4400 M O N T H L Y W E A T H E R R E V I E W VOLUME 136
based IWV than did SE. However, because our paperutilizes and extends the SSM/I IWV results of Neimanet al. (2008) that were based on the SE algorithm, wehave opted to use data processed with this algorithm.The use of Wentz versus SE will not adversely impactthe conclusions drawn in this paper. The SSM/I sam-pling is asynoptic and irregular in time and location.IWV retrievals are available at �40-km native resolu-tion from each SSM/I overpass and, for this study, werecomposited onto a 0.25° (�25 km) latitude–longitudegrid of the ascending and descending satellite passes foreach day. For the Pacific Ocean, the ascending passcomposites correspond to a time interval between 0000and 1159 UTC, and the descending pass compositesrange between 1200 and 2359 UTC. These 12-h ascend-ing and descending composites provide nearly completespatial sampling of the domain. Multiple IWV retriev-als within a grid cell were averaged, and the spatialcoverage of the domain varied slightly from day to daybecause of the precession of the multiple orbits.
For the AR event of early November 2006, we alsopresent �10-km resolution imagery from the Geosta-tionary Operational Environmental Satellite-11 (GOES-11). The 10.7-�m channel (i.e., infrared) provides sur-face and/or cloud-top brightness temperatures, whilethe 6.7-�m channel (i.e., the upper-tropospheric watervapor channel) represents the brightness temperatureof a layer whose mean altitude is modulated by upper-tropospheric (�200–500 hPa) moisture content—thegreater the high-level moisture content, the higher thealtitude and the lower the temperature. These satel-lite images were extracted from subsampled full-diskimagery.
Precipitation datasets were obtained from severalnetworks. The National Weather Service’s CooperativeObserver Program provided observations from a densenetwork of volunteers who report daily precipitationwith storage precipitation gauges located in level, openclearings. Additional daily precipitation data were ac-quired from the Remote Automated Weather Stations(RAWS) array, the Snowpack Telemetry (SNOTEL)network, and the Agri-Met collection of sites. Thesedata were then mapped onto a finescale (�4 km) gridusing the Parameter-elevation Regression on Indepen-dent Slopes Model (PRISM; e.g., Daly et al. 1994;Hunter and Meentemeyer 2005). This climatologicallybased model captures the effect of variable terrain andgeographic features such as coastal proximity and oro-graphic patterns. Daily stream gauge data from U.S.Geological Survey (USGS) stream gauges along un-regulated drainages were analyzed to highlight the ma-jor hydrologic impacts of the landfalling AR.
3. The landfalling atmospheric river of earlyNovember 2006
This section explores key structural and dynamicalcharacteristics of the landfalling AR that devastatedportions of the Pacific Northwest with torrential rainsand severe flooding on 6–7 November 2006 (e.g., seeFig. 1). A quantitative summary analysis of the hydro-logical impacts of the AR is also presented. Con-ventional datasets (i.e., those not associated withCOSMIC) are used in this section.
a. Standard satellite observations
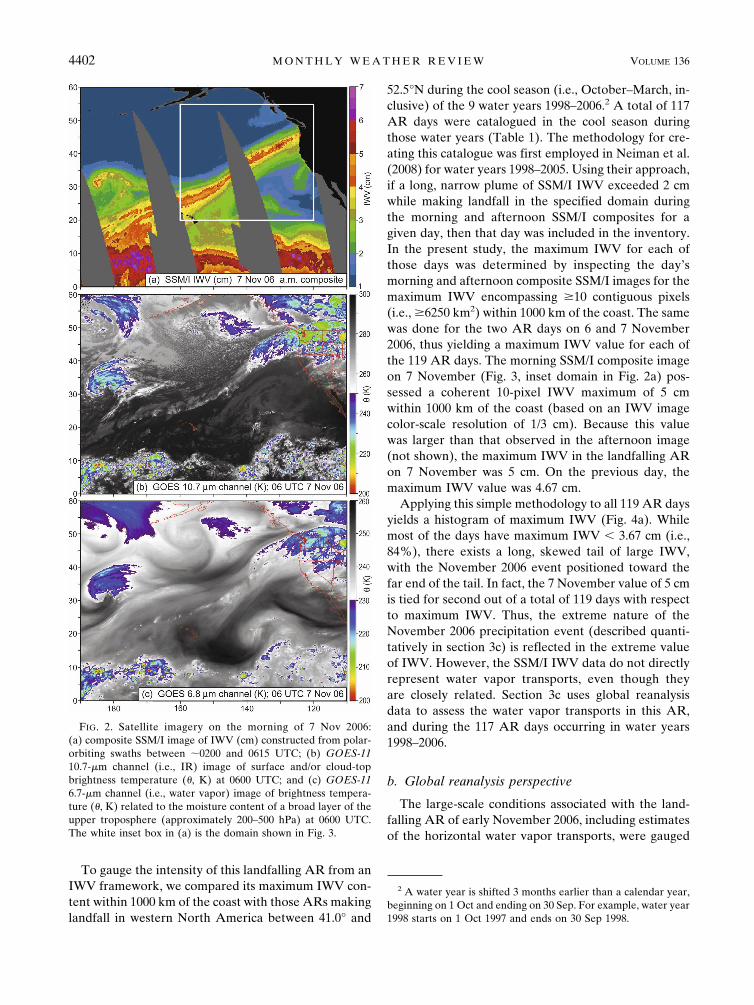
Figure 2 provides a multifaceted satellite depiction ofthe landfalling AR during its most destructive phase on7 November 2006. The SSM/I morning composite im-age (Fig. 2a) shows a well-defined narrow plume ofconcentrated IWV (3 to 5� cm) extending northeast-ward from the tropical moisture reservoir to the PacificNorthwest, and strongly suggests direct tapping oftropical moisture into the AR.1 The companion GOESinfrared (IR) and upper-tropospheric water vapor im-agery at 0600 UTC (Figs. 2b,c) show no clear indicationof the AR south of �40°N, where only a curvilinearrope cloud feature was observed. This rope cloud quitelikely marked the position of shallow forced ascentalong the leading edge of a deep-tropospheric polarcold front (e.g., Seitter and Muench 1985; Bond andShapiro 1991). Although ARs generally occur with po-lar cold fronts (e.g., Ralph et al. 2004, 2005b, 2006;Neiman et al. 2008; Stohl et al. 2008), no comparablelinkage should be expected between ARs and muchshallower rope clouds. The latitudinal variation of theAR in the SSM/I and IR imagery is consistent with afull-winter analysis of ARs over the eastern Pacific pre-sented in Ralph et al. (2004). Namely, in their study,IWV contents did not change appreciably with latitudein ARs, whereas cloud-top temperatures increased sig-nificantly with decreasing latitude, to the point where acloud-top temperature signature in the AR was nolonger evident south of 30°N. This behavior quite likelyreflects a general decrease in intensity of frontal circu-lations and an increase in intensity of Hadley subsi-dence with decreasing latitude.
1 The SSM/I IWV observations alone cannot quantify moisturetransport due to a lack of wind data above the surface. However,Ralph et al. (2004) established the value of using the IWV as aproxy for atmospheric river detection over the eastern Pacificduring a single winter, and Neiman et al. (2008) showed a directrelationship between long, narrow IWV plumes and enhancedwater vapor transport within ARs.
NOVEMBER 2008 N E I M A N E T A L . 4401
To gauge the intensity of this landfalling AR from anIWV framework, we compared its maximum IWV con-tent within 1000 km of the coast with those ARs makinglandfall in western North America between 41.0° and
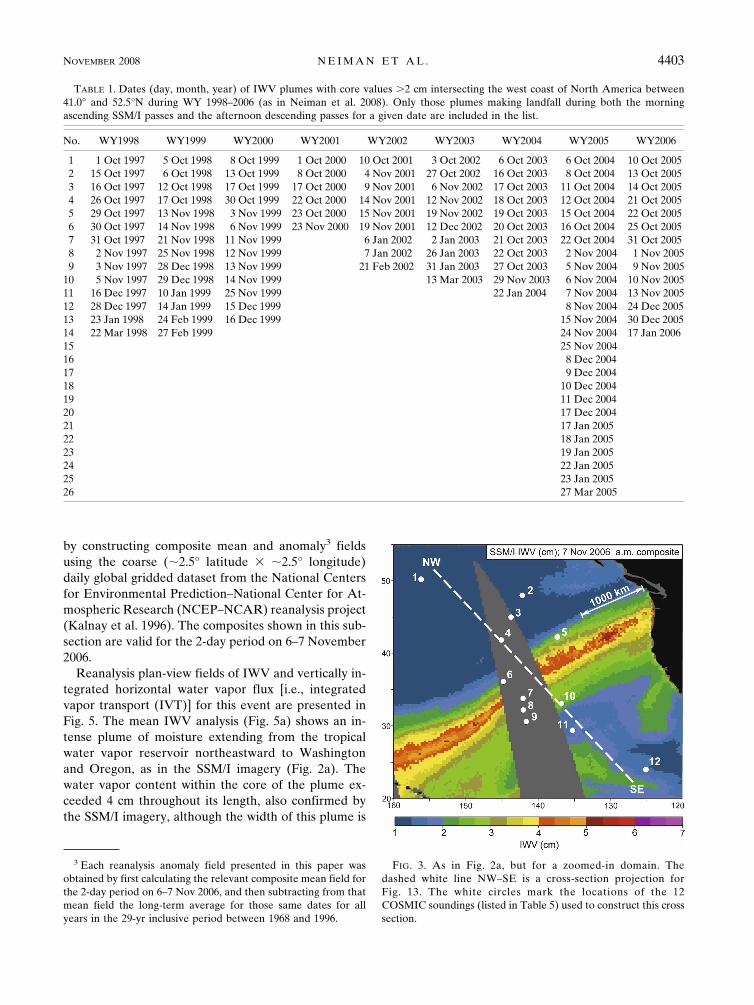
52.5°N during the cool season (i.e., October–March, in-clusive) of the 9 water years 1998–2006.2 A total of 117AR days were catalogued in the cool season duringthose water years (Table 1). The methodology for cre-ating this catalogue was first employed in Neiman et al.(2008) for water years 1998–2005. Using their approach,if a long, narrow plume of SSM/I IWV exceeded 2 cmwhile making landfall in the specified domain duringthe morning and afternoon SSM/I composites for agiven day, then that day was included in the inventory.In the present study, the maximum IWV for each ofthose days was determined by inspecting the day’smorning and afternoon composite SSM/I images for themaximum IWV encompassing �10 contiguous pixels(i.e., �6250 km2) within 1000 km of the coast. The samewas done for the two AR days on 6 and 7 November2006, thus yielding a maximum IWV value for each ofthe 119 AR days. The morning SSM/I composite imageon 7 November (Fig. 3, inset domain in Fig. 2a) pos-sessed a coherent 10-pixel IWV maximum of 5 cmwithin 1000 km of the coast (based on an IWV imagecolor-scale resolution of 1/3 cm). Because this valuewas larger than that observed in the afternoon image(not shown), the maximum IWV in the landfalling ARon 7 November was 5 cm. On the previous day, themaximum IWV value was 4.67 cm.
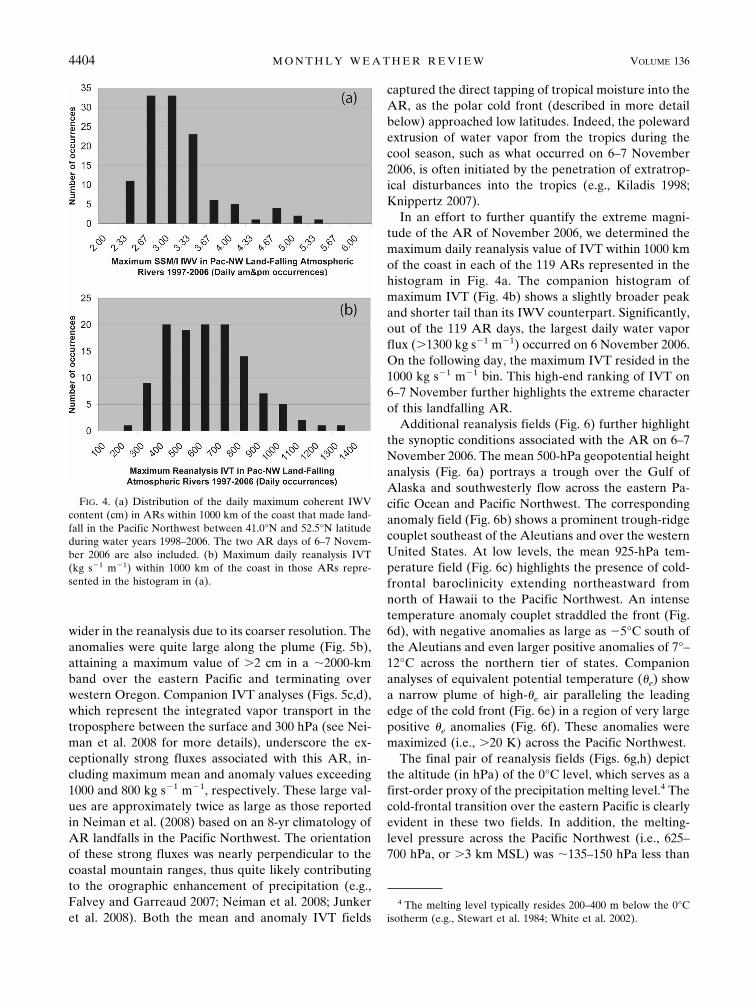
Applying this simple methodology to all 119 AR daysyields a histogram of maximum IWV (Fig. 4a). Whilemost of the days have maximum IWV � 3.67 cm (i.e.,84%), there exists a long, skewed tail of large IWV,with the November 2006 event positioned toward thefar end of the tail. In fact, the 7 November value of 5 cmis tied for second out of a total of 119 days with respectto maximum IWV. Thus, the extreme nature of theNovember 2006 precipitation event (described quanti-tatively in section 3c) is reflected in the extreme valueof IWV. However, the SSM/I IWV data do not directlyrepresent water vapor transports, even though theyare closely related. Section 3c uses global reanalysisdata to assess the water vapor transports in this AR,and during the 117 AR days occurring in water years1998–2006.
b. Global reanalysis perspective
The large-scale conditions associated with the land-falling AR of early November 2006, including estimatesof the horizontal water vapor transports, were gauged
2 A water year is shifted 3 months earlier than a calendar year,beginning on 1 Oct and ending on 30 Sep. For example, water year1998 starts on 1 Oct 1997 and ends on 30 Sep 1998.
FIG. 2. Satellite imagery on the morning of 7 Nov 2006:(a) composite SSM/I image of IWV (cm) constructed from polar-orbiting swaths between �0200 and 0615 UTC; (b) GOES-1110.7-�m channel (i.e., IR) image of surface and/or cloud-topbrightness temperature (�, K) at 0600 UTC; and (c) GOES-116.7-�m channel (i.e., water vapor) image of brightness tempera-ture (�, K) related to the moisture content of a broad layer of theupper troposphere (approximately 200–500 hPa) at 0600 UTC.The white inset box in (a) is the domain shown in Fig. 3.
4402 M O N T H L Y W E A T H E R R E V I E W VOLUME 136
Fig 2 live 4/C
by constructing composite mean and anomaly3 fieldsusing the coarse (�2.5° latitude � �2.5° longitude)daily global gridded dataset from the National Centersfor Environmental Prediction–National Center for At-mospheric Research (NCEP–NCAR) reanalysis project(Kalnay et al. 1996). The composites shown in this sub-section are valid for the 2-day period on 6–7 November2006.
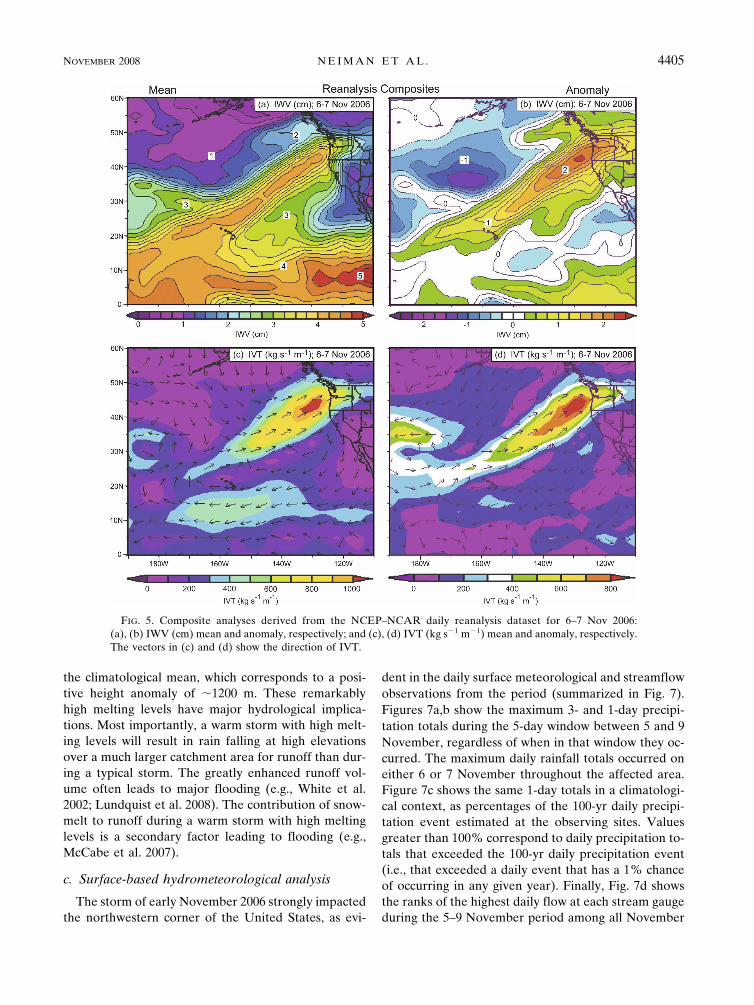
Reanalysis plan-view fields of IWV and vertically in-tegrated horizontal water vapor flux [i.e., integratedvapor transport (IVT)] for this event are presented inFig. 5. The mean IWV analysis (Fig. 5a) shows an in-tense plume of moisture extending from the tropicalwater vapor reservoir northeastward to Washingtonand Oregon, as in the SSM/I imagery (Fig. 2a). Thewater vapor content within the core of the plume ex-ceeded 4 cm throughout its length, also confirmed bythe SSM/I imagery, although the width of this plume is
3 Each reanalysis anomaly field presented in this paper wasobtained by first calculating the relevant composite mean field forthe 2-day period on 6–7 Nov 2006, and then subtracting from thatmean field the long-term average for those same dates for allyears in the 29-yr inclusive period between 1968 and 1996.
FIG. 3. As in Fig. 2a, but for a zoomed-in domain. Thedashed white line NW–SE is a cross-section projection forFig. 13. The white circles mark the locations of the 12COSMIC soundings (listed in Table 5) used to construct this crosssection.
TABLE 1. Dates (day, month, year) of IWV plumes with core values �2 cm intersecting the west coast of North America between41.0° and 52.5°N during WY 1998–2006 (as in Neiman et al. 2008). Only those plumes making landfall during both the morningascending SSM/I passes and the afternoon descending passes for a given date are included in the list.
No. WY1998 WY1999 WY2000 WY2001 WY2002 WY2003 WY2004 WY2005 WY2006
1 1 Oct 1997 5 Oct 1998 8 Oct 1999 1 Oct 2000 10 Oct 2001 3 Oct 2002 6 Oct 2003 6 Oct 2004 10 Oct 20052 15 Oct 1997 6 Oct 1998 13 Oct 1999 8 Oct 2000 4 Nov 2001 27 Oct 2002 16 Oct 2003 8 Oct 2004 13 Oct 20053 16 Oct 1997 12 Oct 1998 17 Oct 1999 17 Oct 2000 9 Nov 2001 6 Nov 2002 17 Oct 2003 11 Oct 2004 14 Oct 20054 26 Oct 1997 17 Oct 1998 30 Oct 1999 22 Oct 2000 14 Nov 2001 12 Nov 2002 18 Oct 2003 12 Oct 2004 21 Oct 20055 29 Oct 1997 13 Nov 1998 3 Nov 1999 23 Oct 2000 15 Nov 2001 19 Nov 2002 19 Oct 2003 15 Oct 2004 22 Oct 20056 30 Oct 1997 14 Nov 1998 6 Nov 1999 23 Nov 2000 19 Nov 2001 12 Dec 2002 20 Oct 2003 16 Oct 2004 25 Oct 20057 31 Oct 1997 21 Nov 1998 11 Nov 1999 6 Jan 2002 2 Jan 2003 21 Oct 2003 22 Oct 2004 31 Oct 20058 2 Nov 1997 25 Nov 1998 12 Nov 1999 7 Jan 2002 26 Jan 2003 22 Oct 2003 2 Nov 2004 1 Nov 20059 3 Nov 1997 28 Dec 1998 13 Nov 1999 21 Feb 2002 31 Jan 2003 27 Oct 2003 5 Nov 2004 9 Nov 2005
10 5 Nov 1997 29 Dec 1998 14 Nov 1999 13 Mar 2003 29 Nov 2003 6 Nov 2004 10 Nov 200511 16 Dec 1997 10 Jan 1999 25 Nov 1999 22 Jan 2004 7 Nov 2004 13 Nov 200512 28 Dec 1997 14 Jan 1999 15 Dec 1999 8 Nov 2004 24 Dec 200513 23 Jan 1998 24 Feb 1999 16 Dec 1999 15 Nov 2004 30 Dec 200514 22 Mar 1998 27 Feb 1999 24 Nov 2004 17 Jan 200615 25 Nov 200416 8 Dec 200417 9 Dec 200418 10 Dec 200419 11 Dec 200420 17 Dec 200421 17 Jan 200522 18 Jan 200523 19 Jan 200524 22 Jan 200525 23 Jan 200526 27 Mar 2005
NOVEMBER 2008 N E I M A N E T A L . 4403
Fig 3 live 4/C
wider in the reanalysis due to its coarser resolution. Theanomalies were quite large along the plume (Fig. 5b),attaining a maximum value of �2 cm in a �2000-kmband over the eastern Pacific and terminating overwestern Oregon. Companion IVT analyses (Figs. 5c,d),which represent the integrated vapor transport in thetroposphere between the surface and 300 hPa (see Nei-man et al. 2008 for more details), underscore the ex-ceptionally strong fluxes associated with this AR, in-cluding maximum mean and anomaly values exceeding1000 and 800 kg s�1 m�1, respectively. These large val-ues are approximately twice as large as those reportedin Neiman et al. (2008) based on an 8-yr climatology ofAR landfalls in the Pacific Northwest. The orientationof these strong fluxes was nearly perpendicular to thecoastal mountain ranges, thus quite likely contributingto the orographic enhancement of precipitation (e.g.,Falvey and Garreaud 2007; Neiman et al. 2008; Junkeret al. 2008). Both the mean and anomaly IVT fields
captured the direct tapping of tropical moisture into theAR, as the polar cold front (described in more detailbelow) approached low latitudes. Indeed, the polewardextrusion of water vapor from the tropics during thecool season, such as what occurred on 6–7 November2006, is often initiated by the penetration of extratrop-ical disturbances into the tropics (e.g., Kiladis 1998;Knippertz 2007).
In an effort to further quantify the extreme magni-tude of the AR of November 2006, we determined themaximum daily reanalysis value of IVT within 1000 kmof the coast in each of the 119 ARs represented in thehistogram in Fig. 4a. The companion histogram ofmaximum IVT (Fig. 4b) shows a slightly broader peakand shorter tail than its IWV counterpart. Significantly,out of the 119 AR days, the largest daily water vaporflux (�1300 kg s�1 m�1) occurred on 6 November 2006.On the following day, the maximum IVT resided in the1000 kg s�1 m�1 bin. This high-end ranking of IVT on6–7 November further highlights the extreme characterof this landfalling AR.
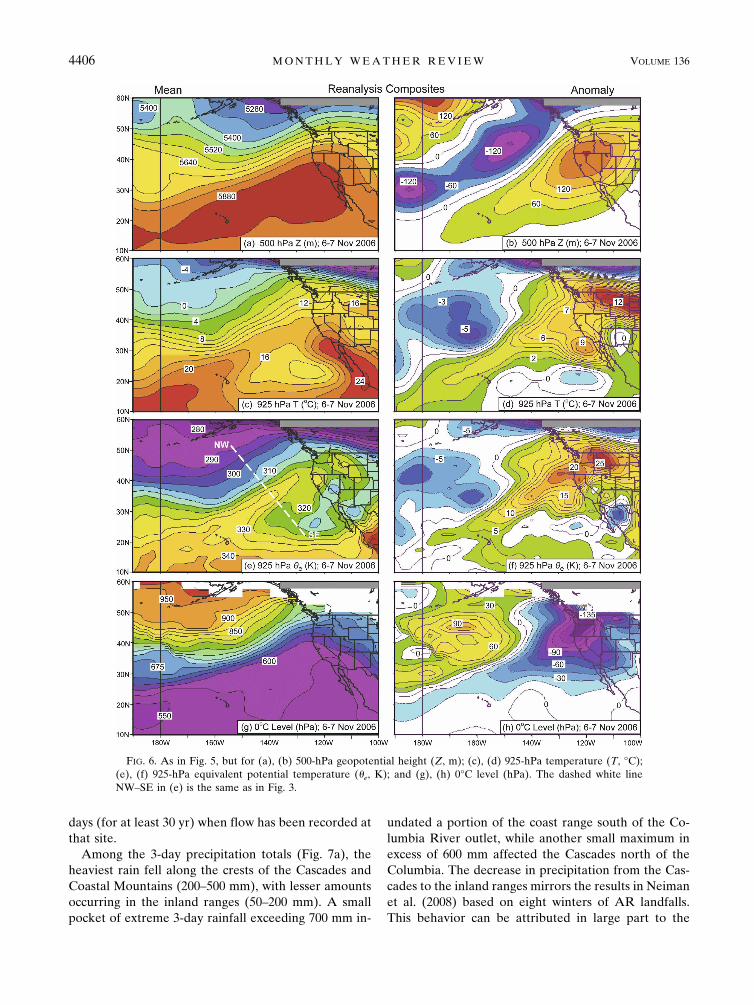
Additional reanalysis fields (Fig. 6) further highlightthe synoptic conditions associated with the AR on 6–7November 2006. The mean 500-hPa geopotential heightanalysis (Fig. 6a) portrays a trough over the Gulf ofAlaska and southwesterly flow across the eastern Pa-cific Ocean and Pacific Northwest. The correspondinganomaly field (Fig. 6b) shows a prominent trough-ridgecouplet southeast of the Aleutians and over the westernUnited States. At low levels, the mean 925-hPa tem-perature field (Fig. 6c) highlights the presence of cold-frontal baroclinicity extending northeastward fromnorth of Hawaii to the Pacific Northwest. An intensetemperature anomaly couplet straddled the front (Fig.6d), with negative anomalies as large as �5°C south ofthe Aleutians and even larger positive anomalies of 7°–12°C across the northern tier of states. Companionanalyses of equivalent potential temperature (�e) showa narrow plume of high-�e air paralleling the leadingedge of the cold front (Fig. 6e) in a region of very largepositive �e anomalies (Fig. 6f). These anomalies weremaximized (i.e., �20 K) across the Pacific Northwest.
The final pair of reanalysis fields (Figs. 6g,h) depictthe altitude (in hPa) of the 0°C level, which serves as afirst-order proxy of the precipitation melting level.4 Thecold-frontal transition over the eastern Pacific is clearlyevident in these two fields. In addition, the melting-level pressure across the Pacific Northwest (i.e., 625–700 hPa, or �3 km MSL) was �135–150 hPa less than
4 The melting level typically resides 200–400 m below the 0°Cisotherm (e.g., Stewart et al. 1984; White et al. 2002).
FIG. 4. (a) Distribution of the daily maximum coherent IWVcontent (cm) in ARs within 1000 km of the coast that made land-fall in the Pacific Northwest between 41.0°N and 52.5°N latitudeduring water years 1998–2006. The two AR days of 6–7 Novem-ber 2006 are also included. (b) Maximum daily reanalysis IVT(kg s�1 m�1) within 1000 km of the coast in those ARs repre-sented in the histogram in (a).
4404 M O N T H L Y W E A T H E R R E V I E W VOLUME 136
the climatological mean, which corresponds to a posi-tive height anomaly of �1200 m. These remarkablyhigh melting levels have major hydrological implica-tions. Most importantly, a warm storm with high melt-ing levels will result in rain falling at high elevationsover a much larger catchment area for runoff than dur-ing a typical storm. The greatly enhanced runoff vol-ume often leads to major flooding (e.g., White et al.2002; Lundquist et al. 2008). The contribution of snow-melt to runoff during a warm storm with high meltinglevels is a secondary factor leading to flooding (e.g.,McCabe et al. 2007).
c. Surface-based hydrometeorological analysis
The storm of early November 2006 strongly impactedthe northwestern corner of the United States, as evi-
dent in the daily surface meteorological and streamflowobservations from the period (summarized in Fig. 7).Figures 7a,b show the maximum 3- and 1-day precipi-tation totals during the 5-day window between 5 and 9November, regardless of when in that window they oc-curred. The maximum daily rainfall totals occurred oneither 6 or 7 November throughout the affected area.Figure 7c shows the same 1-day totals in a climatologi-cal context, as percentages of the 100-yr daily precipi-tation event estimated at the observing sites. Valuesgreater than 100% correspond to daily precipitation to-tals that exceeded the 100-yr daily precipitation event(i.e., that exceeded a daily event that has a 1% chanceof occurring in any given year). Finally, Fig. 7d showsthe ranks of the highest daily flow at each stream gaugeduring the 5–9 November period among all November
FIG. 5. Composite analyses derived from the NCEP–NCAR daily reanalysis dataset for 6–7 Nov 2006:(a), (b) IWV (cm) mean and anomaly, respectively; and (c), (d) IVT (kg s�1 m�1) mean and anomaly, respectively.The vectors in (c) and (d) show the direction of IVT.
NOVEMBER 2008 N E I M A N E T A L . 4405
Fig 5 live 4/C
days (for at least 30 yr) when flow has been recorded atthat site.
Among the 3-day precipitation totals (Fig. 7a), theheaviest rain fell along the crests of the Cascades andCoastal Mountains (200–500 mm), with lesser amountsoccurring in the inland ranges (50–200 mm). A smallpocket of extreme 3-day rainfall exceeding 700 mm in-
undated a portion of the coast range south of the Co-lumbia River outlet, while another small maximum inexcess of 600 mm affected the Cascades north of theColumbia. The decrease in precipitation from the Cas-cades to the inland ranges mirrors the results in Neimanet al. (2008) based on eight winters of AR landfalls.This behavior can be attributed in large part to the
FIG. 6. As in Fig. 5, but for (a), (b) 500-hPa geopotential height (Z, m); (c), (d) 925-hPa temperature (T, °C);(e), (f) 925-hPa equivalent potential temperature (�e, K); and (g), (h) 0°C level (hPa). The dashed white lineNW–SE in (e) is the same as in Fig. 3.
4406 M O N T H L Y W E A T H E R R E V I E W VOLUME 136
Fig 6 live 4/C
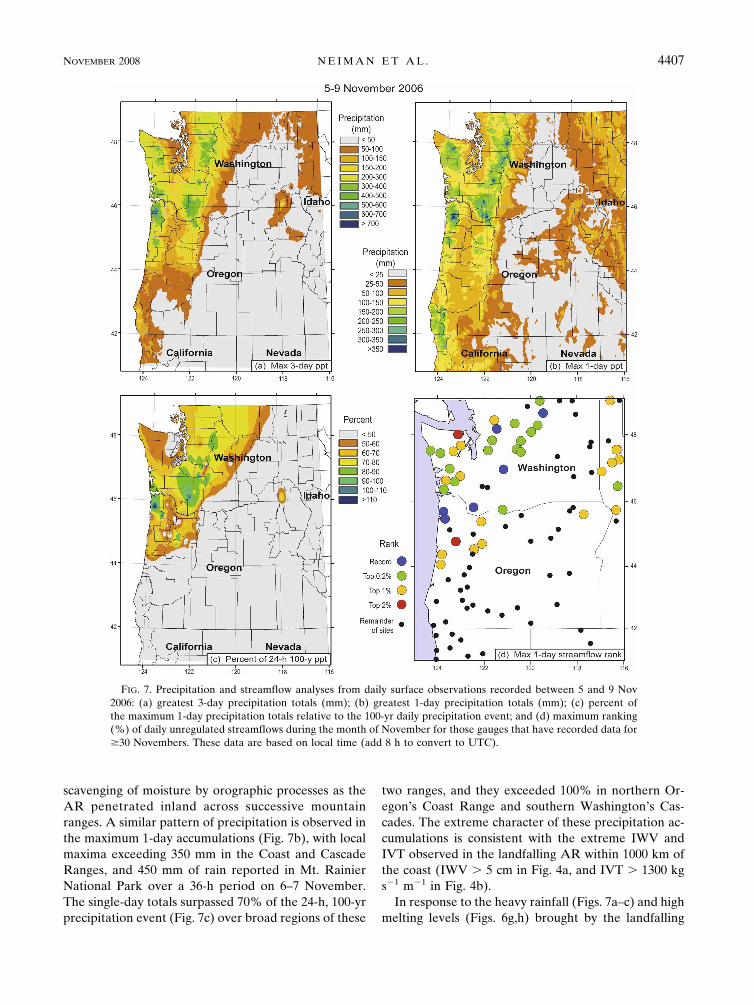
scavenging of moisture by orographic processes as theAR penetrated inland across successive mountainranges. A similar pattern of precipitation is observed inthe maximum 1-day accumulations (Fig. 7b), with localmaxima exceeding 350 mm in the Coast and CascadeRanges, and 450 mm of rain reported in Mt. RainierNational Park over a 36-h period on 6–7 November.The single-day totals surpassed 70% of the 24-h, 100-yrprecipitation event (Fig. 7c) over broad regions of these
two ranges, and they exceeded 100% in northern Or-egon’s Coast Range and southern Washington’s Cas-cades. The extreme character of these precipitation ac-cumulations is consistent with the extreme IWV andIVT observed in the landfalling AR within 1000 km ofthe coast (IWV � 5 cm in Fig. 4a, and IVT � 1300 kgs�1 m�1 in Fig. 4b).
In response to the heavy rainfall (Figs. 7a–c) and highmelting levels (Figs. 6g,h) brought by the landfalling
FIG. 7. Precipitation and streamflow analyses from daily surface observations recorded between 5 and 9 Nov2006: (a) greatest 3-day precipitation totals (mm); (b) greatest 1-day precipitation totals (mm); (c) percent ofthe maximum 1-day precipitation totals relative to the 100-yr daily precipitation event; and (d) maximum ranking(%) of daily unregulated streamflows during the month of November for those gauges that have recorded data for�30 Novembers. These data are based on local time (add 8 h to convert to UTC).
NOVEMBER 2008 N E I M A N E T A L . 4407
Fig 7 live 4/C
AR of 6–7 November, most of the streams draining theCoast and Cascade Ranges in Washington and northernOregon yielded maximum 1-day flows among the top1% of those observed historically for November (Fig.7d). Many of the streams were in the top 0.2%, and sixgauges recorded all-time record flows for November.The widespread flooding and associated debris flows(e.g., Fig. 1) yielded significant regionwide damage onthe order of $50 million (NCDC 2006). Fortunately, nolives were lost. It should be noted that historically large1-day flows topping 1% were also observed in the in-terior ranges.
4. Satellite-based COSMIC sounding analysis
Given the high-impact character of the landfallingAR in early November 2006, coupled with the fact thatsatellite-based COSMIC GPS RO soundings had beenavailable for only a short time previously, we deemedthis AR to be a good test case for assessing the abilityof the COSMIC dataset to capture noteworthy, regu-larly occurring mesoscale weather phenomena over theotherwise data-sparse Pacific Ocean. The COSMICdataset will be evaluated using two complementarymethods: with compositing and via a detailed cross-section analysis.
a. Composite soundings
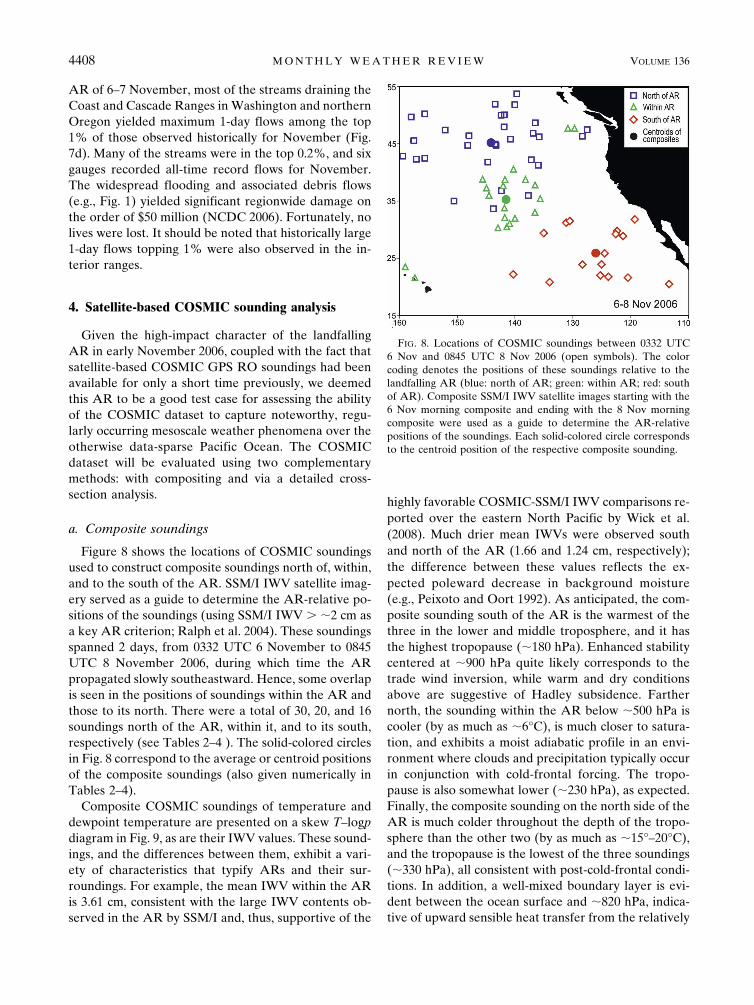
Figure 8 shows the locations of COSMIC soundingsused to construct composite soundings north of, within,and to the south of the AR. SSM/I IWV satellite imag-ery served as a guide to determine the AR-relative po-sitions of the soundings (using SSM/I IWV � �2 cm asa key AR criterion; Ralph et al. 2004). These soundingsspanned 2 days, from 0332 UTC 6 November to 0845UTC 8 November 2006, during which time the ARpropagated slowly southeastward. Hence, some overlapis seen in the positions of soundings within the AR andthose to its north. There were a total of 30, 20, and 16soundings north of the AR, within it, and to its south,respectively (see Tables 2–4 ). The solid-colored circlesin Fig. 8 correspond to the average or centroid positionsof the composite soundings (also given numerically inTables 2–4).
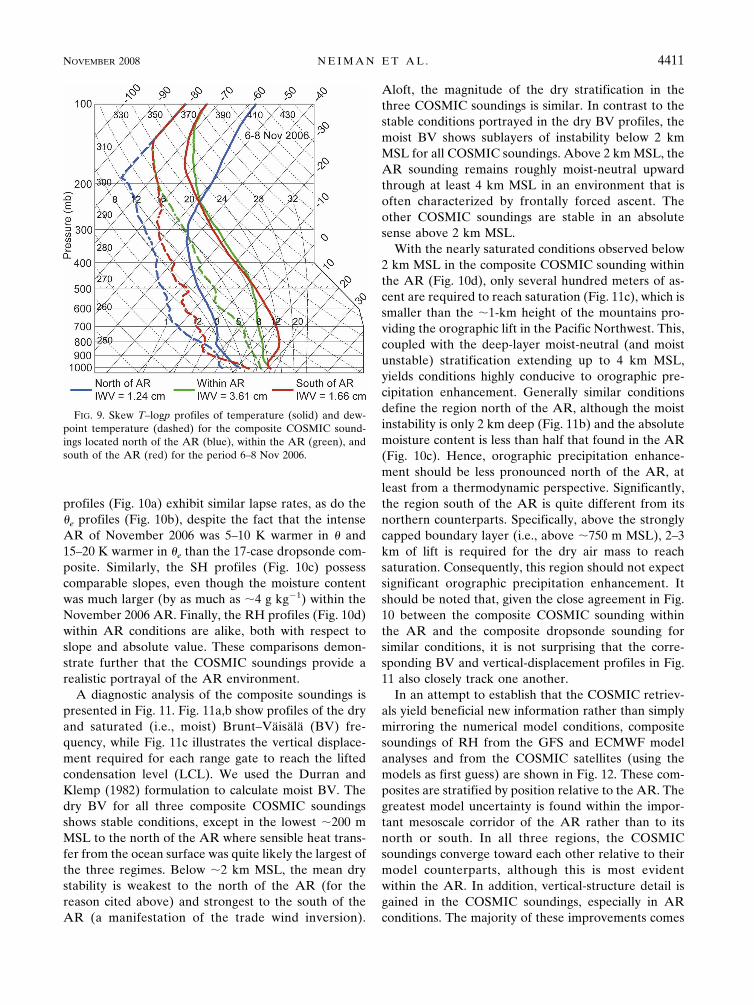
Composite COSMIC soundings of temperature anddewpoint temperature are presented on a skew T–logpdiagram in Fig. 9, as are their IWV values. These sound-ings, and the differences between them, exhibit a vari-ety of characteristics that typify ARs and their sur-roundings. For example, the mean IWV within the ARis 3.61 cm, consistent with the large IWV contents ob-served in the AR by SSM/I and, thus, supportive of the
highly favorable COSMIC-SSM/I IWV comparisons re-ported over the eastern North Pacific by Wick et al.(2008). Much drier mean IWVs were observed southand north of the AR (1.66 and 1.24 cm, respectively);the difference between these values reflects the ex-pected poleward decrease in background moisture(e.g., Peixoto and Oort 1992). As anticipated, the com-posite sounding south of the AR is the warmest of thethree in the lower and middle troposphere, and it hasthe highest tropopause (�180 hPa). Enhanced stabilitycentered at �900 hPa quite likely corresponds to thetrade wind inversion, while warm and dry conditionsabove are suggestive of Hadley subsidence. Farthernorth, the sounding within the AR below �500 hPa iscooler (by as much as �6°C), is much closer to satura-tion, and exhibits a moist adiabatic profile in an envi-ronment where clouds and precipitation typically occurin conjunction with cold-frontal forcing. The tropo-pause is also somewhat lower (�230 hPa), as expected.Finally, the composite sounding on the north side of theAR is much colder throughout the depth of the tropo-sphere than the other two (by as much as �15°–20°C),and the tropopause is the lowest of the three soundings(�330 hPa), all consistent with post-cold-frontal condi-tions. In addition, a well-mixed boundary layer is evi-dent between the ocean surface and �820 hPa, indica-tive of upward sensible heat transfer from the relatively
FIG. 8. Locations of COSMIC soundings between 0332 UTC6 Nov and 0845 UTC 8 Nov 2006 (open symbols). The colorcoding denotes the positions of these soundings relative to thelandfalling AR (blue: north of AR; green: within AR; red: southof AR). Composite SSM/I IWV satellite images starting with the6 Nov morning composite and ending with the 8 Nov morningcomposite were used as a guide to determine the AR-relativepositions of the soundings. Each solid-colored circle correspondsto the centroid position of the respective composite sounding.
4408 M O N T H L Y W E A T H E R R E V I E W VOLUME 136
Fig 8 live 4/C
warm ocean surface to the comparatively cold air massbehind the cold front.
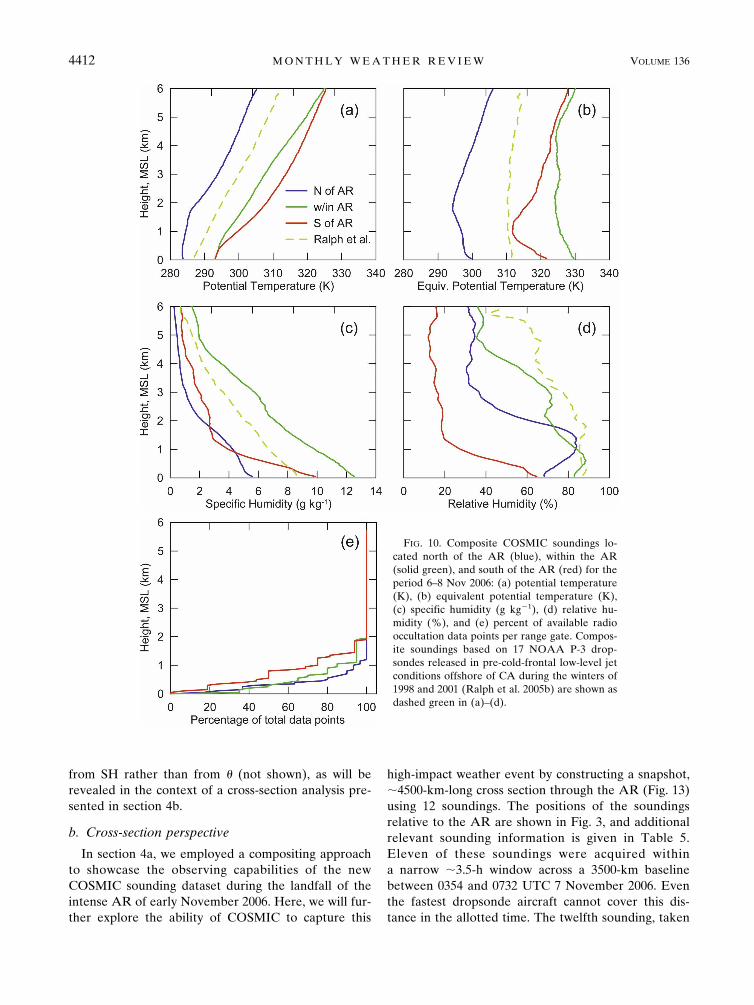
The composite COSMIC soundings are also pre-sented in Fig. 10, where zoomed-in profiles of potentialtemperature (�), equivalent potential temperature (�e),water vapor specific humidity (SH), and relative hu-midity (RH) extend upward to 6 km. These profilesquantify much of what was discussed in the previousparagraph. In addition, they show that the compositeAR profile is considerably moister than those on itsflanks, both from an absolute perspective (Fig. 10c) andwith respect to RH (Fig. 10d). The composite SH andRH profiles also reveal that the absolute moisture con-tent is comparable north and south of the AR above�800 m MSL, even though the RH is much larger northof the AR because of colder conditions there. En-hanced values of SH below 800 m MSL on the southside of the AR point toward boundary layer moisteningfrom the warm underlying sea surface in an otherwisedry air mass. Finally, profiles of the percentage of avail-
able RO data points (Fig. 10e) that were available forthe COSMIC retrievals reveal complete coverage in allthree composite soundings above 2 km MSL and 50%–80% coverage as far down as 500 m MSL. The mostimportant vertical structures all resided above this shal-low 500-m layer. The lowest altitude at which the ROdata were available for each COSMIC sounding5 is pro-vided in Tables 2–4.
5 The lowest altitude is determined based on fading of the am-plitude of the RO signal transformed by the RA-HO method,which is related to either the shadowing of the RO signal by theearth’s surface or loss of signal in the GPS receiver because ofother reasons. Given the fact that the vertical resolution of theGPS RO technique is only �20–30 m near the surface (Gorbunovet al. 2004), altitudes lower than a few tens of meters above thesurface have no physical meaning in the retrieval. However, rela-tive to the information contained in the entire sounding, this erroris not significant, and we choose to neglect it, by using the profiledown to the altitude as determined from the RA-HO transformedamplitude.
TABLE 2. Locations, dates, times, IWV, and minimum radio occultation altitudes of COSMIC soundings used to construct compositethermodynamic soundings on the north side of the atmospheric river of 6–8 Nov 2006. These soundings utilized NCEP’s GFS globalmodel analyses for the first guess.
SoundingNo. Lat (°N) Lon (°W) Date Time (UTC) IWV (cm)
Min occultationaltitude (m)
1 42.358 157.581 6 Nov 2006 0816 1.226 4242 45.603 158.028 6 Nov 2006 0827 1.172 8373 46.250 136.043 6 Nov 2006 0937 2.158 10484 51.880 140.375 6 Nov 2006 1855 1.700 1255 50.264 156.087 7 Nov 2006 0354 0.889 3276 41.888 145.091 7 Nov 2006 0423 1.494 4757 48.744 136.722 7 Nov 2006 0446 1.532 998 48.015 142.250 7 Nov 2006 0455 1.164 269 47.531 127.658 7 Nov 2006 0456 2.470 120
10 49.722 158.446 7 Nov 2006 0548 0.850 67211 50.087 142.073 7 Nov 2006 0550 1.006 42812 45.030 143.769 7 Nov 2006 0631 1.364 213 42.255 137.367 7 Nov 2006 0732 2.199 29514 35.058 150.946 7 Nov 2006 1950 1.103 6815 41.325 136.232 7 Nov 2006 2216 1.423 12016 42.540 156.079 7 Nov 2006 2357 0.970 61317 53.807 139.995 8 Nov 2006 0302 0.836 34118 51.895 143.747 8 Nov 2006 0330 0.819 115019 44.798 143.629 8 Nov 2006 0358 1.051 14220 44.811 148.579 8 Nov 2006 0408 0.989 34621 35.975 137.979 8 Nov 2006 0424 1.518 33622 33.692 144.013 8 Nov 2006 0435 1.464 25723 42.880 159.927 8 Nov 2006 0524 1.068 59824 46.472 148.376 8 Nov 2006 0524 0.800 2025 50.053 142.710 8 Nov 2006 0534 0.860 226 36.882 142.702 8 Nov 2006 0600 0.909 44327 45.857 141.091 8 Nov 2006 0608 1.139 30228 47.433 152.546 8 Nov 2006 0633 0.653 33029 46.366 128.490 8 Nov 2006 0705 1.259 130 46.883 137.112 8 Nov 2006 0845 1.161 446Avg 45.212 144.521 1.242 346
NOVEMBER 2008 N E I M A N E T A L . 4409
Figure 10 also displays composite dropsonde profilesfrom Ralph et al. (2005b), because they serve as a use-ful baseline comparison with the composite COSMICsoundings within the November 2006 AR. The Ralph etal. (2005b) composites are composed of 17 soundingscollected from NOAA P-3 research aircraft within thepre-cold-frontal low-level jet (LLJ) of 17 different win-
tertime extratropical cyclones over the eastern NorthPacific during CALJET and PACJET. The prefrontalLLJ typically coincides with the region in storms whereARs reside. The vertical-structure characteristics of thecomposites from the P-3 and from COSMIC within theAR are quite similar, with the acknowledgment thatsignificant offsets were observed. For example, the �
TABLE 3. Locations, dates, times, IWV, and minimum radio occultation altitudes of COSMIC soundings used to construct compositethermodynamic soundings within the atmospheric river of 6–8 Nov 2006. These soundings utilized NCEP’s GFS global model analysesfor the first guess.
SoundingNo. Lat (°N) Lon (°W) Date Time (UTC) IWV (cm)
Min occultationaltitude (m)
1 47.751 130.989 6 Nov 2006 0332 3.621 3342 37.842 136.787 6 Nov 2006 0428 3.584 3623 38.835 142.029 6 Nov 2006 0438 4.544 274 38.856 145.893 6 Nov-2006 0459 3.085 2145 47.754 129.853 6 Nov 2006 0509 3.564 2016 40.671 140.533 6 Nov 2006 0604 3.620 147 37.774 142.305 6 Nov 2006 0744 4.669 28 38.863 138.437 6 Nov 2006 0745 4.028 10959 37.284 145.261 6 Nov 2006 0800 3.756 2
10 33.819 142.094 7 Nov 2006 0438 4.378 68011 36.117 144.803 7 Nov 2006 0446 2.663 312 30.577 141.684 7 Nov 2006 0450 2.779 113 32.165 142.059 7 Nov 2006 0615 3.392 90114 23.613 159.473 7 Nov 2006 0708 4.380 44715 33.111 136.786 7 Nov 2006 0719 2.468 60016 32.068 140.233 7 Nov 2006 0719 3.591 65617 30.405 143.224 7 Nov 2006 1938 4.686 318 35.487 135.881 7 Nov 2006 2214 3.019 16319 31.115 141.177 8 Nov 2006 0425 3.005 109620 21.591 157.812 8 Nov 2006 0603 3.361 1913Avg 35.285 141.866 3.610 436
TABLE 4. Locations, dates, times, IWV, and minimum radio occultation altitudes of COSMIC soundings used to construct compositethermodynamic soundings on the south side of the atmospheric river of 6–8 Nov 2006. These soundings utilized NCEP’s GFS globalmodel analyses for the first guess.
SoundingNo. Lat (°N) Lon (°W) Date Time (UTC) IWV (cm)
Min occultationaltitude (m)
1 31.590 130.698 6 Nov 2006 0512 1.424 4062 21.805 123.969 6 Nov 2006 1804 1.603 3523 25.960 124.612 6 Nov 2006 1815 1.372 9734 31.800 119.275 7 Nov 2006 0415 1.386 1255 29.417 135.269 7 Nov 2006 0448 1.551 1436 22.015 125.359 7 Nov 2006 1800 1.831 12727 24.004 125.124 7 Nov 2006 1812 1.355 8148 20.873 134.233 7 Nov 2006 1834 1.839 749 29.265 122.674 7 Nov 2006 1837 1.618 531
10 29.808 122.429 7 Nov 2006 2211 1.911 139711 20.479 113.322 8 Nov 2006 0313 1.587 189512 28.922 121.379 8 Nov 2006 0342 1.615 81113 31.305 131.356 8 Nov 2006 0351 1.477 30814 21.653 120.496 8 Nov 2006 0405 1.253 87315 22.232 140.604 8 Nov 2006 0709 2.316 38916 23.922 128.480 8 Nov 2006 0839 2.459 1436Avg 25.941 126.205 1.662 737
4410 M O N T H L Y W E A T H E R R E V I E W VOLUME 136
profiles (Fig. 10a) exhibit similar lapse rates, as do the�e profiles (Fig. 10b), despite the fact that the intenseAR of November 2006 was 5–10 K warmer in � and15–20 K warmer in �e than the 17-case dropsonde com-posite. Similarly, the SH profiles (Fig. 10c) possesscomparable slopes, even though the moisture contentwas much larger (by as much as �4 g kg�1) within theNovember 2006 AR. Finally, the RH profiles (Fig. 10d)within AR conditions are alike, both with respect toslope and absolute value. These comparisons demon-strate further that the COSMIC soundings provide arealistic portrayal of the AR environment.
A diagnostic analysis of the composite soundings ispresented in Fig. 11. Fig. 11a,b show profiles of the dryand saturated (i.e., moist) Brunt–Väisälä (BV) fre-quency, while Fig. 11c illustrates the vertical displace-ment required for each range gate to reach the liftedcondensation level (LCL). We used the Durran andKlemp (1982) formulation to calculate moist BV. Thedry BV for all three composite COSMIC soundingsshows stable conditions, except in the lowest �200 mMSL to the north of the AR where sensible heat trans-fer from the ocean surface was quite likely the largest ofthe three regimes. Below �2 km MSL, the mean drystability is weakest to the north of the AR (for thereason cited above) and strongest to the south of theAR (a manifestation of the trade wind inversion).
Aloft, the magnitude of the dry stratification in thethree COSMIC soundings is similar. In contrast to thestable conditions portrayed in the dry BV profiles, themoist BV shows sublayers of instability below 2 kmMSL for all COSMIC soundings. Above 2 km MSL, theAR sounding remains roughly moist-neutral upwardthrough at least 4 km MSL in an environment that isoften characterized by frontally forced ascent. Theother COSMIC soundings are stable in an absolutesense above 2 km MSL.
With the nearly saturated conditions observed below2 km MSL in the composite COSMIC sounding withinthe AR (Fig. 10d), only several hundred meters of as-cent are required to reach saturation (Fig. 11c), which issmaller than the �1-km height of the mountains pro-viding the orographic lift in the Pacific Northwest. This,coupled with the deep-layer moist-neutral (and moistunstable) stratification extending up to 4 km MSL,yields conditions highly conducive to orographic pre-cipitation enhancement. Generally similar conditionsdefine the region north of the AR, although the moistinstability is only 2 km deep (Fig. 11b) and the absolutemoisture content is less than half that found in the AR(Fig. 10c). Hence, orographic precipitation enhance-ment should be less pronounced north of the AR, atleast from a thermodynamic perspective. Significantly,the region south of the AR is quite different from itsnorthern counterparts. Specifically, above the stronglycapped boundary layer (i.e., above �750 m MSL), 2–3km of lift is required for the dry air mass to reachsaturation. Consequently, this region should not expectsignificant orographic precipitation enhancement. Itshould be noted that, given the close agreement in Fig.10 between the composite COSMIC sounding withinthe AR and the composite dropsonde sounding forsimilar conditions, it is not surprising that the corre-sponding BV and vertical-displacement profiles in Fig.11 also closely track one another.
In an attempt to establish that the COSMIC retriev-als yield beneficial new information rather than simplymirroring the numerical model conditions, compositesoundings of RH from the GFS and ECMWF modelanalyses and from the COSMIC satellites (using themodels as first guess) are shown in Fig. 12. These com-posites are stratified by position relative to the AR. Thegreatest model uncertainty is found within the impor-tant mesoscale corridor of the AR rather than to itsnorth or south. In all three regions, the COSMICsoundings converge toward each other relative to theirmodel counterparts, although this is most evidentwithin the AR. In addition, vertical-structure detail isgained in the COSMIC soundings, especially in ARconditions. The majority of these improvements comes
FIG. 9. Skew T–logp profiles of temperature (solid) and dew-point temperature (dashed) for the composite COSMIC sound-ings located north of the AR (blue), within the AR (green), andsouth of the AR (red) for the period 6–8 Nov 2006.
NOVEMBER 2008 N E I M A N E T A L . 4411
Fig 9 live 4/C
from SH rather than from � (not shown), as will berevealed in the context of a cross-section analysis pre-sented in section 4b.
b. Cross-section perspective
In section 4a, we employed a compositing approachto showcase the observing capabilities of the newCOSMIC sounding dataset during the landfall of theintense AR of early November 2006. Here, we will fur-ther explore the ability of COSMIC to capture this
high-impact weather event by constructing a snapshot,�4500-km-long cross section through the AR (Fig. 13)using 12 soundings. The positions of the soundingsrelative to the AR are shown in Fig. 3, and additionalrelevant sounding information is given in Table 5.Eleven of these soundings were acquired withina narrow �3.5-h window across a 3500-km baselinebetween 0354 and 0732 UTC 7 November 2006. Eventhe fastest dropsonde aircraft cannot cover this dis-tance in the allotted time. The twelfth sounding, taken
FIG. 10. Composite COSMIC soundings lo-cated north of the AR (blue), within the AR(solid green), and south of the AR (red) for theperiod 6–8 Nov 2006: (a) potential temperature(K), (b) equivalent potential temperature (K),(c) specific humidity (g kg�1), (d) relative hu-midity (%), and (e) percent of available radiooccultation data points per range gate. Compos-ite soundings based on 17 NOAA P-3 drop-sondes released in pre-cold-frontal low-level jetconditions offshore of CA during the winters of1998 and 2001 (Ralph et al. 2005b) are shown asdashed green in (a)–(d).
4412 M O N T H L Y W E A T H E R R E V I E W VOLUME 136
Fig 10 live 4/C
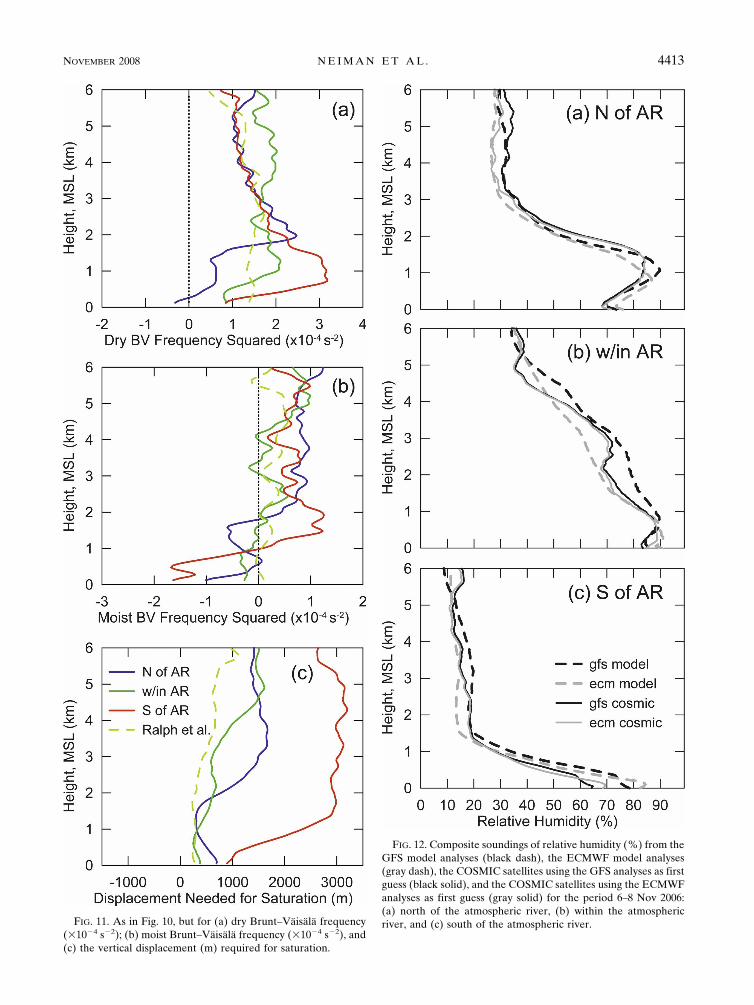
FIG. 11. As in Fig. 10, but for (a) dry Brunt–Väisälä frequency(�10�4 s�2); (b) moist Brunt–Väisälä frequency (�10�4 s�2), and(c) the vertical displacement (m) required for saturation.
FIG. 12. Composite soundings of relative humidity (%) from theGFS model analyses (black dash), the ECMWF model analyses(gray dash), the COSMIC satellites using the GFS analyses as firstguess (black solid), and the COSMIC satellites using the ECMWFanalyses as first guess (gray solid) for the period 6–8 Nov 2006:(a) north of the atmospheric river, (b) within the atmosphericriver, and (c) south of the atmospheric river.
NOVEMBER 2008 N E I M A N E T A L . 4413
Fig 11 live 4/C
at 1812 UTC 7 November, is situated at the southernend of the cross section far from the AR, so its temporalmismatch relative to the others should not adverselyimpact the analysis.
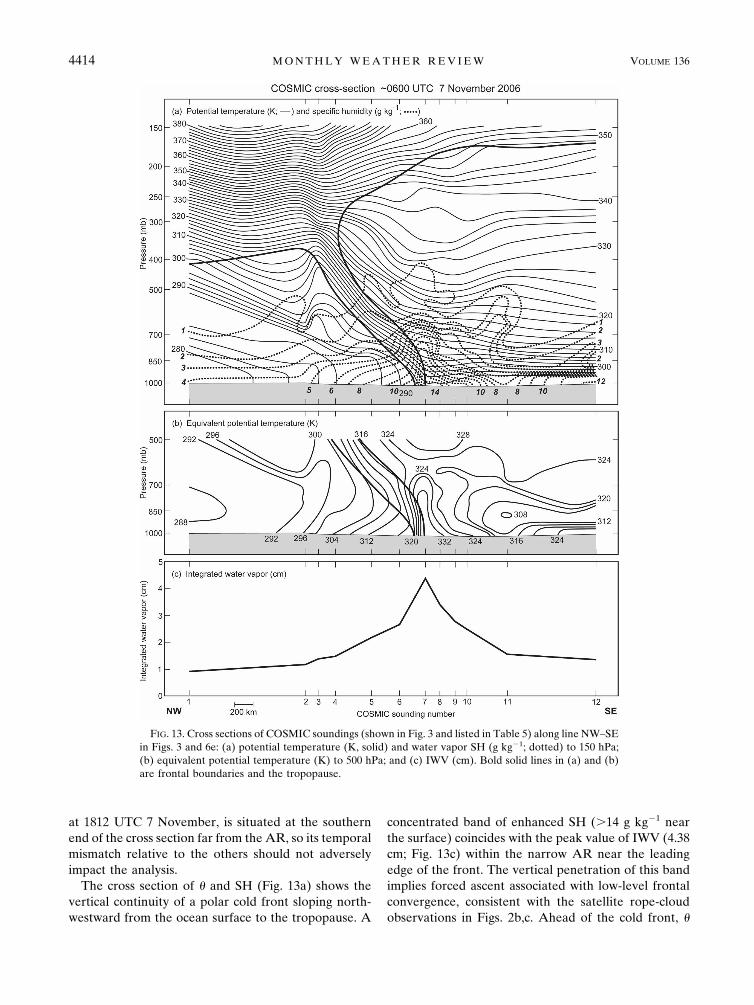
The cross section of � and SH (Fig. 13a) shows thevertical continuity of a polar cold front sloping north-westward from the ocean surface to the tropopause. A
concentrated band of enhanced SH (�14 g kg�1 nearthe surface) coincides with the peak value of IWV (4.38cm; Fig. 13c) within the narrow AR near the leadingedge of the front. The vertical penetration of this bandimplies forced ascent associated with low-level frontalconvergence, consistent with the satellite rope-cloudobservations in Figs. 2b,c. Ahead of the cold front, �
FIG. 13. Cross sections of COSMIC soundings (shown in Fig. 3 and listed in Table 5) along line NW–SEin Figs. 3 and 6e: (a) potential temperature (K, solid) and water vapor SH (g kg�1; dotted) to 150 hPa;(b) equivalent potential temperature (K) to 500 hPa; and (c) IWV (cm). Bold solid lines in (a) and (b)are frontal boundaries and the tropopause.
4414 M O N T H L Y W E A T H E R R E V I E W VOLUME 136
decreases toward the southeast below �750 hPa. Theposition of this reverse thermal gradient relative toboth the front and the band of enhanced SH suggests,from a geostrophic standpoint, the presence of a pre-cold-frontal LLJ residing within the shallow moistplume, as has been observed directly in other ARs (e.g.,Ralph et al. 2004, 2005b). Aloft, � decreases to thenorthwest within the front and on its warm side, thussignifying the presence of an upper-tropospheric jetstream (the global reanalysis documented a 65 m s�1 jetstream over the AR; not shown). In the southeast por-tion of the cross section, coinciding sharp vertical gra-dients of � and SH mark the low-level trade wind in-version.
The companion cross section of �e (Fig. 13b) alsoshows a well-defined cold front and prefrontal band ofenhanced moisture penetrating vertically. Maximum �e
content within this prefrontal plume exceeds 332 K be-low �750 hPa, consistent with the plan-view depictionof this plume in the 925-hPa reanalysis mean field (Fig.6e). Moist-neutral stratification characterizes this high-�e environment, as is also the case in the composite ARsoundings (Figs. 10b and 11b). Low-level potential in-stability on the cold side of the front (Figs. 13a,b) is alsoportrayed in the composite soundings north of the AR(Figs. 10a,b). Finally, a sharp minimum in �e southeastof the AR at �900 hPa marks the dry cap atop the tradewind inversion, comparable to that shown in the com-posite soundings south of the AR.
Importantly, the RO data that were used to retrievethe 12 COSMIC soundings analyzed in Fig. 13 pen-etrated downward to near the ocean surface in all of
those soundings. The lowest altitude of these dataranged between 1 and 901 m MSL, with an average of356 m MSL or �975 hPa (Table 5). Hence, all of thesalient mesoscale structures depicted in Fig. 13 werecontained within the envelope of available RO data.
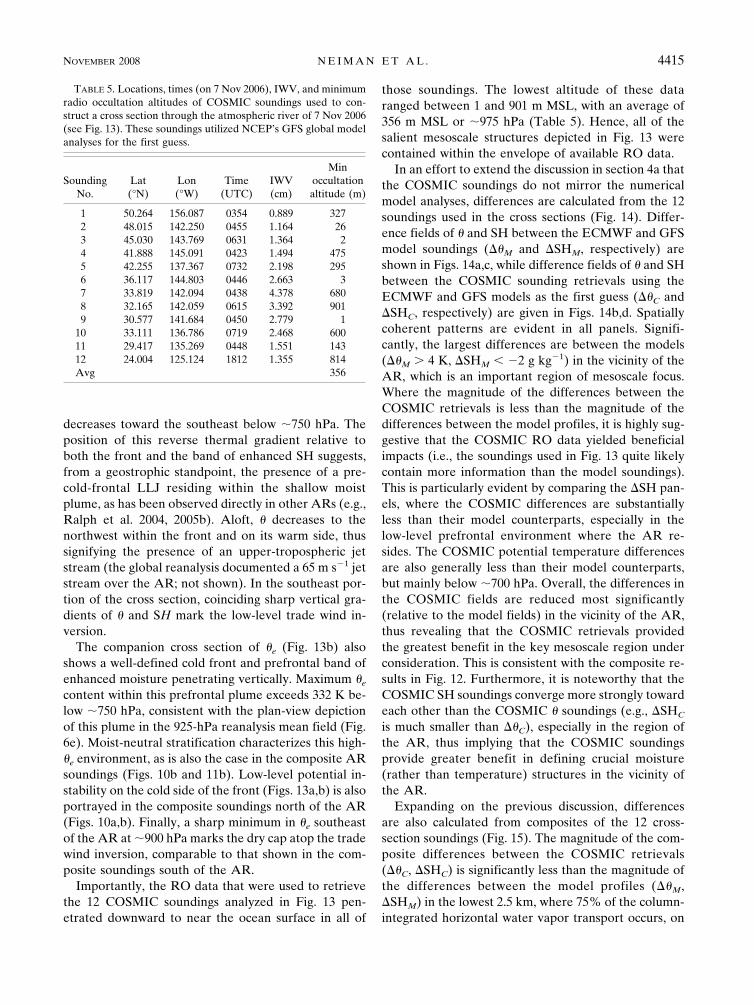
In an effort to extend the discussion in section 4a thatthe COSMIC soundings do not mirror the numericalmodel analyses, differences are calculated from the 12soundings used in the cross sections (Fig. 14). Differ-ence fields of � and SH between the ECMWF and GFSmodel soundings (�M and SHM, respectively) areshown in Figs. 14a,c, while difference fields of � and SHbetween the COSMIC sounding retrievals using theECMWF and GFS models as the first guess (�C andSHC, respectively) are given in Figs. 14b,d. Spatiallycoherent patterns are evident in all panels. Signifi-cantly, the largest differences are between the models(�M � 4 K, SHM � �2 g kg�1) in the vicinity of theAR, which is an important region of mesoscale focus.Where the magnitude of the differences between theCOSMIC retrievals is less than the magnitude of thedifferences between the model profiles, it is highly sug-gestive that the COSMIC RO data yielded beneficialimpacts (i.e., the soundings used in Fig. 13 quite likelycontain more information than the model soundings).This is particularly evident by comparing the SH pan-els, where the COSMIC differences are substantiallyless than their model counterparts, especially in thelow-level prefrontal environment where the AR re-sides. The COSMIC potential temperature differencesare also generally less than their model counterparts,but mainly below �700 hPa. Overall, the differences inthe COSMIC fields are reduced most significantly(relative to the model fields) in the vicinity of the AR,thus revealing that the COSMIC retrievals providedthe greatest benefit in the key mesoscale region underconsideration. This is consistent with the composite re-sults in Fig. 12. Furthermore, it is noteworthy that theCOSMIC SH soundings converge more strongly towardeach other than the COSMIC � soundings (e.g., SHC
is much smaller than �C), especially in the region ofthe AR, thus implying that the COSMIC soundingsprovide greater benefit in defining crucial moisture(rather than temperature) structures in the vicinity ofthe AR.
Expanding on the previous discussion, differencesare also calculated from composites of the 12 cross-section soundings (Fig. 15). The magnitude of the com-posite differences between the COSMIC retrievals(�C, SHC) is significantly less than the magnitude ofthe differences between the model profiles (�M,SHM) in the lowest 2.5 km, where 75% of the column-integrated horizontal water vapor transport occurs, on
TABLE 5. Locations, times (on 7 Nov 2006), IWV, and minimumradio occultation altitudes of COSMIC soundings used to con-struct a cross section through the atmospheric river of 7 Nov 2006(see Fig. 13). These soundings utilized NCEP’s GFS global modelanalyses for the first guess.
SoundingNo.
Lat(°N)
Lon(°W)
Time(UTC)
IWV(cm)
Minoccultationaltitude (m)
1 50.264 156.087 0354 0.889 3272 48.015 142.250 0455 1.164 263 45.030 143.769 0631 1.364 24 41.888 145.091 0423 1.494 4755 42.255 137.367 0732 2.198 2956 36.117 144.803 0446 2.663 37 33.819 142.094 0438 4.378 6808 32.165 142.059 0615 3.392 9019 30.577 141.684 0450 2.779 1
10 33.111 136.786 0719 2.468 60011 29.417 135.269 0448 1.551 14312 24.004 125.124 1812 1.355 814Avg 356
NOVEMBER 2008 N E I M A N E T A L . 4415
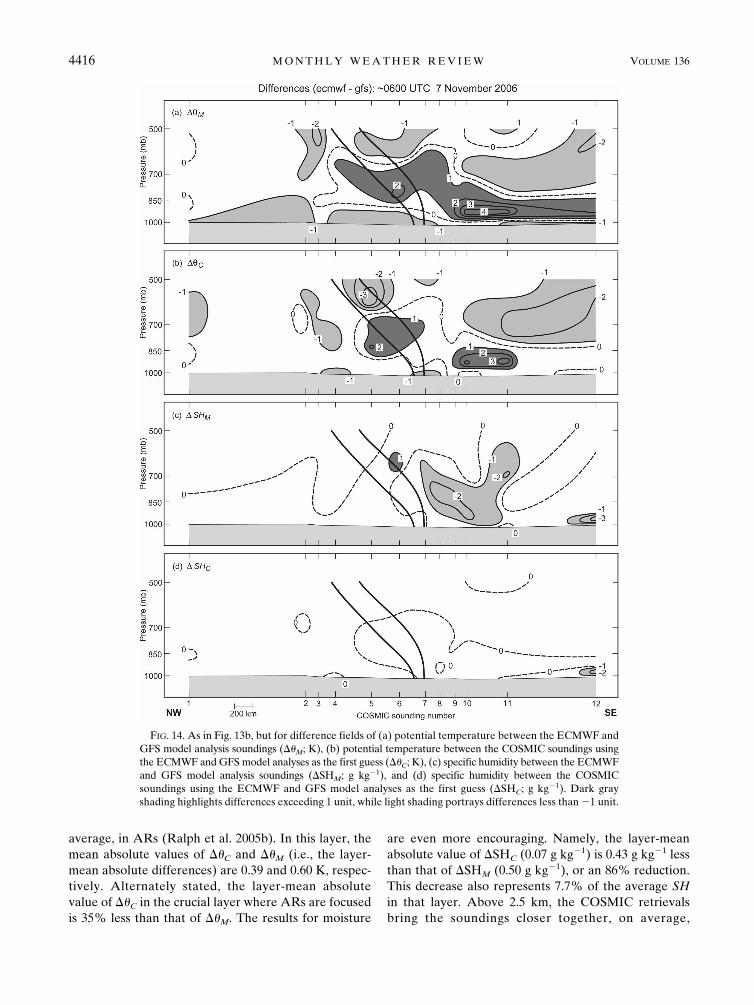
average, in ARs (Ralph et al. 2005b). In this layer, themean absolute values of �C and �M (i.e., the layer-mean absolute differences) are 0.39 and 0.60 K, respec-tively. Alternately stated, the layer-mean absolutevalue of �C in the crucial layer where ARs are focusedis 35% less than that of �M. The results for moisture
are even more encouraging. Namely, the layer-meanabsolute value of SHC (0.07 g kg�1) is 0.43 g kg�1 lessthan that of SHM (0.50 g kg�1), or an 86% reduction.This decrease also represents 7.7% of the average SHin that layer. Above 2.5 km, the COSMIC retrievalsbring the soundings closer together, on average,
FIG. 14. As in Fig. 13b, but for difference fields of (a) potential temperature between the ECMWF andGFS model analysis soundings (�M; K), (b) potential temperature between the COSMIC soundings usingthe ECMWF and GFS model analyses as the first guess (�C; K), (c) specific humidity between the ECMWFand GFS model analysis soundings (SHM; g kg�1), and (d) specific humidity between the COSMICsoundings using the ECMWF and GFS model analyses as the first guess (SHC; g kg�1). Dark grayshading highlights differences exceeding 1 unit, while light shading portrays differences less than �1 unit.
4416 M O N T H L Y W E A T H E R R E V I E W VOLUME 136
through 4.5 km for SH, but that some levels show in-creases in the differences for �. In other words, theCOSMIC profiles show greater agreement with one an-other for SH at all levels below 4.5 km than do themodel soundings, while for �, this is only true up to 2.5km MSL.
Relative to the operational models, the COSMICsoundings offer greater vertical resolution in the lowertroposphere (e.g., Sokolovskiy et al. 2006), where watervapor is concentrated. For this reason, and the reasonsdescribed in the two previous paragraphs, it is evidentthat the mesoscale structures analyzed in the cross sec-tion (Fig. 13) were resolved partly due to the inclusionof COSMIC RO data. While the model analyses con-tained the primary polar front and associated atmo-spheric river without the use of COSMIC soundings,key mesoscale characteristics of the AR (e.g., its posi-tion, water vapor content, amplitude, orientation, etc.)became better defined. It is expected that, through as-similation of the COSMIC measurements (Kuo et al.2000), these mesoscale features will be better repre-sented and will ultimately reduce diagnostic and fore-cast errors associated with ARs over remote oceanicregions. Although the analyses presented here are sup-portive of this conclusion, further work needs to bedone to include many more events and to diagnose spe-cific error reductions, possibly using dropsondes de-ployed in these remote areas using aircraft.
5. Conclusions
a. Diagnosis of atmospheric river conditions
An intense storm was examined over the easternNorth Pacific Ocean that ultimately made landfall
across the Pacific Northwest on 6–8 November 2006.This event was characterized by an extended period ofheavy rainfall that set records and, at some locations,exceeded 100-yr precipitation thresholds for 24-h peri-ods. The warmth of this event was also remarkable andcontributed to anomalously high snow-melting levelsthat contributed to widespread flooding and damagingdebris flows.
Using SSM/I satellite observations of IWV, as well asreanalysis data, it was found that a strong AR waspresent during this case. To quantify the amplitude ofthis AR, a method was developed that concluded thisAR was among the most intense of 119 AR days ob-served over 9 yr in this region. It was the strongest interms of water vapor transport amplitude derived fromreanalysis data, and was tied for second in the directobservations of maximum IWV within 1000 km of thecoast as measured by SSM/I satellite data. This studyadds further evidence [to the seven cases shown inRalph et al. (2006) for flooding on California’s RussianRiver] that ARs are critical contributors to West Coastextreme precipitation and flooding events. In addition,it extends the work of Ralph et al. (2006) by showingthis is true for a more northern latitude, and by devel-oping a method that ranks individual events (using thecatalog developed by Neiman et al. 2008). Discussionswith operational weather forecasters in the region, in-cluding those responsible for quantitative precipitationforecasts (QPF), suggest that this method can be valu-able in operational forecasting.
b. Evaluation of a new satellite dataset: COSMIC
The intense AR of November 2006 was used toevaluate the detailed vertical-profiling capabilities of
FIG. 15. Differences in (a) potential temperature (K), and (b) specific humidity (g kg�1), betweencomposites of the 12 soundings used to construct the cross sections in Figs. 13 and 14. The solid linesshow the differences between the COSMIC sounding composites using the ECMWF and GFS analysesas the first guess, and the dashed lines portray the model differences between the ECMWF and GFSanalyses.
NOVEMBER 2008 N E I M A N E T A L . 4417
the new satellite-based COSMIC GPS radio occultationsounding technique within high-impact, regularly oc-curring mesoscale weather phenomena over otherwisedata-sparse oceanic regions. Because this study de-scribes the first phenomenological-based COSMICevaluation of its kind, this AR was deemed an excellenttest case owing to its large signal-to-noise ratio (i.e., itswell-defined character). The successful evaluation ofthis strong event (as is summarized below) lays thegroundwork for future phenomenological assess-ments of weaker ARs and composites of ARs to deter-mine whether or not COSMIC can adequately capturethe full spectrum of this class of high-impact weatherevents. The COSMIC soundings taken within theAR environment of November 2006 were assessed fortheir realism, based on the meteorological contextprovided by the SSM/I and reanalysis datasets and oncomparisons made between the COSMIC sound-ings and NOAA P-3 dropsondes released within otherARs during earlier research missions. The COSMICdataset was evaluated using two complementary meth-ods: with compositing and via a detailed cross-sectionanalysis.
The retrieval of temperature and moisture soundingsfrom COSMIC observations must be initialized with afirst-guess profile such as from numerical weather pre-diction model analyses. For this study, the first-guesssource was obtained primarily from NCEP’s GFSmodel. Relevant offshore COSMIC soundings on 6–8November 2006 were grouped into three clusters forcompositing: those north of the AR (30 soundings),those within the AR (20 soundings), and those to itssouth (16 soundings). These groupings were made pos-sible by referring to the twice-daily SSM/I IWV imagesfor guidance. The composite soundings for these threeregions exhibited vertical-structure characteristics oftemperature and moisture that were meteorologicallyconsistent with global reanalysis fields of this case andwith earlier case study and composite results based ondropsondes released in ARs during the CALJET andPACJET field programs. In addition, a curtain of 12offshore COSMIC soundings through the AR of No-vember 2006 yielded cross-sectional thermodynamicstructures that were consistent with the compositeCOSMIC soundings of this event. This cross sectionalso provided a thermodynamic description of the ARcomparable in detail to previous aircraft-based drop-sonde surveys of ARs over the eastern North PacificOcean (e.g., Ralph et al. 2004).
Because the COSMIC soundings involve the use of afirst-guess from an operational numerical model, it wasnecessary to evaluate how the COSMIC soundings dif-fered from those of either the GFS or ECMWF model
soundings. In contrast to the model soundings, theCOSMIC soundings converged on a common solutionfor specific humidity, especially below �4.5 km MSL,independent of which first guess was used. This was alsothe case to a lesser extent for potential temperaturebelow �2.5 km MSL, where �75% of the water vaportransport within ARs typically occurs. These com-parisons are distinct from that of vertically inte-grated variables assessed in Wick et al. (2008), whoshowed that the COSMIC-derived IWV was valuable inevaluating the performance of several competing algo-rithms used for processing SSM/I radiance data intoIWV and cloud liquid water.
The satellite-based COSMIC soundings represent anew, global thermodynamic and moisture datasetwith high vertical resolution in the lower and middletroposphere. The enhanced vertical resolution at lowerlevels—atypical of most satellite sounding products—isespecially useful, because it can readily document at-mospheric rivers and other high-impact mesoscaleweather phenomena that are characterized by largeconcentrations of low-level water vapor. Until now,soundings such as these over data-sparse regions weregathered primarily during expensive, episodic airborne-based field programs across very limited domains. Eventhough COSMIC soundings cannot provide wind infor-mation or, by extension, water vapor transports, theycan ultimately prove indispensable in a wide array ofapplications ranging from data assimilation and nu-merical weather prediction to climate studies. Finally,by combining COSMIC retrievals with wind observa-tions from airborne missions (either manned or un-manned), water vapor transports can be ascertained.Future studies will address the impact of these existingand potentially new observing systems on monitoringand prediction of atmospheric rivers and other compa-rable, high-impact mesoscale phenomena over data-sparse regions of the globe.
Acknowledgments. We thank Cathy Smith and col-leagues of NOAA’s Earth System Research Laboratoryfor developing the NCEP–NCAR reanalysis compositetools and making them available (see online at http://www.cdc.noaa.gov/Composites/Day). Darren Jacksonof NOAA/ESRL prepared the GOES satellite imagery.Jim Adams electronically drafted the majority of thefigures presented in this paper, and Allen White ofNOAA/ERSL generously donated time to generatethree additional figures. Sergey Sokolovskiy of UCAR/COSMIC provided valuable assistance for the revisionof the paper. This work was partially funded by theNational Science Foundation under Grant ATM-0410018.
4418 M O N T H L Y W E A T H E R R E V I E W VOLUME 136
REFERENCES
Anthes, R. A., and Coauthors, 2008: The COSMIC/FORMOSAT-3Mission: Early results. Bull. Amer. Meteor. Soc., 89, 313–333.
Bao, J.-W., S. A. Michelson, P. J. Neiman, F. M. Ralph, and J. M.Wilczak, 2006: Interpretation of enhanced integrated watervapor bands associated with extratropical cyclones: Their for-mation and connection to tropical moisture. Mon. Wea. Rev.,134, 1063–1080.
Bond, N. A., and M. A. Shapiro, 1991: Research aircraft observa-tions of the mesoscale and microscale structure of a cold frontover the eastern Pacific Ocean. Mon. Wea. Rev., 119, 3080–3094.
Browning, K. A., 1990: Organization of clouds and precipitationin extratropical cyclones. Extratropical Cyclones: The ErikPalmén Memorial Volume, C.W. Newton and E. Holopainen,Eds., Amer. Meteor. Soc., 129–153.
Carlson, T. N., 1991: Mid-Latitude Weather Systems. Harper-Collins, 507 pp.
Cheng, C.-Z., Y.-H. Kuo, R. A. Anthes, and L. Wu, 2006: Satelliteconstellation monitors global and space weather. Eos, Trans.Amer. Geophys. Union, 87 (17), 166–167.
Daly, C., R. P. Neilson, and D. L. Phillips, 1994: A statistical-topographic model for mapping climatological precipitationover mountainous terrain. J. Appl. Meteor., 33, 140–158.
Durran, D. R., and J. B. Klemp, 1982: On the effects of moistureon the Brunt-Väisälä frequency. J. Atmos. Sci., 39, 2152–2158.
Falvey, M., and R. Garreaud, 2007: Wintertime precipitation epi-sodes in central Chile: Associated meteorological conditionsand orographic influences. J. Hydrometeor., 8, 171–193.
Gorbunov, M. E., H.-H. Benzon, A. S. Jensen, M. S. Lohmann,and A. S. Nielsen, 2004: Comparative analysis of radio occul-tation processing approaches based on Fourier integral op-erators. Radio Sci., 39, RS6004, doi:10.1029/2003RS002916.
Hollinger, J. P., J. L. Peirce, and G. A. Poe, 1990: SSM/I instru-ment evaluation. IEEE Trans. Geosci. Remote Sens., 28, 781–790.
Hunter, R. D., and R. K. Meentemeyer, 2005: Climatologicallyaided mapping of daily precipitation and temperature. J.Appl. Meteor., 44, 1501–1510.
Junker, N. W., R. H. Grumm, R. Hart, L. F. Bosart, K. M. Bell,and F. J. Pereira, 2008: Use of normalized anomaly fields toanticipate extreme rainfall in the mountains of northern Cali-fornia. Wea. Forecasting, 23, 336–356.
Kalnay, E., and Coauthors, 1996: The NCEP/NCAR 40-Year Re-analysis Project. Bull. Amer. Meteor. Soc., 77, 437–471.
Kiladis, G. N., 1998: Observations of Rossby waves linked to con-vection over the eastern tropical Pacific. J. Atmos. Sci., 55,321–339.
Knippertz, P., 2007: Tropical-extratropical interactions related toupper-level troughs at low latitudes. Dyn. Atmos. Oceans, 43,36–62.
Kuo, Y.-H., B. Chao, and L. Lee, 1999: A constellation of micro-satellites promises to help in a range of geoscience research.Eos, Trans. Amer. Geophys. Union, 80 (40), 467–471.
——, S. Sokolovskiy, R. A. Anthes, and F. Vandenberghe, 2000:Assimilation of GPS radio occultation data for numericalweather prediction. Terr. Atmos. Oceanic Sci., 11, 157–186.
——, T.-K. Wee, S. Sokolovskiy, C. Rocken, W. Schreiner, D.Hunt, and R. A. Anthes, 2004: Inversion and error estimationof GPS radio occultation data. J. Meteor. Soc. Japan, 82 (1B),507–531.
Kursinski, E. R., G. A. Hajj, K. R. Hardy, J. T. Schofield, andR. Linfield, 1997: Observing Earth’s atmosphere with radiooccultation measurements. J. Geophys. Res., 102, 23 429–23 465.
Lundquist, J. D., P. J. Neiman, B. E. Martner, A. B. White, D. J.Gottas, and F. M. Ralph, 2008: Rain versus snow in the SierraNevada, California: Comparing Doppler profiling radar andsurface observations of melting level. J. Hydrometeor., 9,194–211.
McCabe, G. J., M. P. Clark, and L. E. Hay, 2007: Rain-on-snowevents in the western United States. Bull. Amer. Meteor. Soc.,88, 319–328.
Neiman, P. J., F. M. Ralph, A. B. White, D. E. Kingsmill, andP. O. G. Persson, 2002: The statistical relationship betweenupslope flow and rainfall in California’s coastal mountains:Observations during CALJET. Mon. Wea. Rev., 130, 1468–1492.
——, B. E. Martner, A. B. White, G. A. Wick, F. M. Ralph, andD. E. Kingsmill, 2005: Wintertime nonbrightband rain inCalifornia and Oregon during CALJET and PACJET: Geo-graphic, interannual, and synoptic variability. Mon. Wea.Rev., 133, 1199–1223.
——, F. M. Ralph, G. A. Wick, J. Lundquist, and M. D. Dettinger,2008: Meteorological characteristics and overland precipita-tion impacts of atmospheric rivers affecting the West Coast ofNorth America based on eight years of SSM/I satellite ob-servations. J. Hydrometeor., 9, 22–47.
NCDC, 2006: Storm Data. Vol. 48, No. 11, 106 pp.Pandey, G. R., D. R. Cayan, and K. P. Georgakakos, 1999: Pre-
cipitation structure in the Sierra Nevada of California duringwinter. J. Geophys. Res., 104, 12 019–12 030.
Peixoto, J. P., and A. H. Oort, 1992: Physics of Climate. AmericanInstitute of Physics, 520 pp.
Ralph, F. M., P. J. Neiman, D. E. Kingsmill, P. O. G. Persson,A. B. White, E. T. Strem, E. D. Andrews, and R. C. Ant-weiler, 2003: The impact of a prominent rain shadow onflooding in California’s Santa Cruz Mountains: A CALJETcase study and sensitivity to the ENSO cycle. J. Hydromete-or., 4, 1243–1264.
——, ——, and G. A. Wick, 2004: Satellite and CALJET aircraftobservations of atmospheric rivers over the eastern NorthPacific Ocean during the winter of 1997/98. Mon. Wea. Rev.,132, 1721–1745.
——, and Coauthors, 2005a: Improving short-term (0–48 h) cool-season quantitative precipitation forecasting: Recommenda-tions from a USWRP workshop. Bull. Amer. Meteor. Soc., 86,1619–1632.
——, P. J. Neiman, and R. Rotunno, 2005b: Dropsonde observa-tions in low-level jets over the northeastern Pacific Oceanfrom CALJET-1998 and PACJET-2001: Mean vertical-profile and atmospheric-river characteristics. Mon. Wea.Rev., 133, 889–910.
——, ——, G. A. Wick, S. I. Gutman, M. D. Dettinger, D. R.Cayan, and A. B. White, 2006: Flooding on California’s Rus-sian River: The role of atmospheric rivers. Geophys. Res.Lett., 33, L13801, doi:10.1029/2006GL026689.
Rhea, J. O., 1978: Orographic precipitation model for hydrome-teorological use. Ph.D. dissertation, Dept. of AtmosphericScience Paper 287, Colorado State University, Fort Collins,CO, 198 pp.
Rocken, C., Y.-H. Kuo, W. S. Schreiner, D. Hunt, S. Sokolovskiy,and C. McCormick, 2000: COSMIC system description. Terr.Atmos. Oceanic Sci., 11, 21–52.
NOVEMBER 2008 N E I M A N E T A L . 4419
Rotunno, R., and R. Ferretti, 2001: Mechanisms of intense alpinerainfall. J. Atmos. Sci., 58, 1732–1749.
Schluessel, P., and W. J. Emery, 1990: Atmospheric water vapourover oceans from SSM/I measurements. Int. J. Remote Sens.,11, 753–766.
Seitter, K. L., and H. S. Muench, 1985: Observation of a cold frontwith rope cloud. Mon. Wea. Rev., 113, 840–848.
Smith, R. B., 1979: The influence of mountains on the atmo-sphere. Advances in Geophysics, Vol. 21, Academic Press,87–230.
Sokolovskiy, S., Y.-H. Kuo, C. Rocken, W. S. Schreiner, D. Hunt,and R. A. Anthes, 2006: Monitoring the atmosphericboundary layer by GPS radio occultation signals recordedin the open-loop mode. Geophys. Res. Lett., 33, L12813,doi:10.1029/2006GL025955.
Stewart, R. E., J. D. Marwitz, J. C. Pace, and R. E. Carbone, 1984:Characteristics through the melting layer of stratiformclouds. J. Atmos. Sci., 41, 3227–3237.
Stoelinga, M. T., and Coauthors, 2003: Improvement of micro-physical parameterization through observational verificationexperiment. Bull. Amer. Meteor. Soc., 84, 1807–1826.
Stohl, A., C. Forster, and H. Sodemann, 2008: Remote sources ofwater vapor forming precipitation on the Norwegian west
coast at 60°N—A tale of hurricanes and an atmospheric river.J. Geophys. Res., 113, D05102, doi:10.1029/2007JD009006.
Tapley, B. D., S. Bettadpur, M. Watkins, and C. Reigber, 2004:The Gravity Recovery And Climate Experiment (GRACE):Mission overview and early results. Geophys. Res. Lett., 31,L09607, doi:10.1029/2004GL019920.
Wentz, F. J., 1995: The intercomparison of 53 SSM/I water vaporalgorithms. Remote Sensing Systems Tech. Rep. on WetNetWater Vapor Intercomparison Project (VIP), Remote Sens-ing Systems, Santa Rosa, CA, 19 pp.
White, A. B., D. J. Gottas, E. Strem, F. M. Ralph, and P. J. Nei-man, 2002: An automated brightband height detection algo-rithm for use with Doppler radar spectral moments. J. Atmos.Oceanic Technol., 19, 687–697.
Wick, G. A., Y.-H. Kuo, F. M. Ralph, T.-K. Wee, P. J. Neiman,and Z. Ma, 2008: Intercomparison of integrated water vaporretrievals from SSM/I and COSMIC. Geophys. Res. Lett., inpress.
Wickert, J., and Coauthors, 2001: Atmosphere sounding by GPSradio occultation: First results from CHAMP. Geophys. Res.Lett., 28, 3263–3266.
Zhu, Y., and R. E. Newell, 1998: A proposed algorithm for mois-ture fluxes from atmospheric rivers. Mon. Wea. Rev., 126,725–735.
4420 M O N T H L Y W E A T H E R R E V I E W VOLUME 136